West Bradenton, FL Map & Demographics
West Bradenton Map
West Bradenton Overview
$46,680
PER CAPITA INCOME
$102,639
AVG FAMILY INCOME
$83,833
AVG HOUSEHOLD INCOME
21.4%
WAGE / INCOME GAP [ % ]
78.6¢/ $1
WAGE / INCOME GAP [ $ ]
$5,646
FAMILY INCOME DEFICIT
0.43
INEQUALITY / GINI INDEX
3,935
TOTAL POPULATION
1,967
MALE POPULATION
1,968
FEMALE POPULATION
99.95
MALES / 100 FEMALES
100.05
FEMALES / 100 MALES
47.9
MEDIAN AGE
3.1
AVG FAMILY SIZE
2.7
AVG HOUSEHOLD SIZE
2,092
LABOR FORCE [ PEOPLE ]
65.9%
PERCENT IN LABOR FORCE
4.0%
UNEMPLOYMENT RATE
Income in West Bradenton
Income Overview in West Bradenton
Per Capita Income in West Bradenton is $46,680, while median incomes of families and households are $102,639 and $83,833 respectively.
| Characteristic | Number | Measure |
| Per Capita Income | 3,935 | $46,680 |
| Median Family Income | 1,040 | $102,639 |
| Mean Family Income | 1,040 | $129,306 |
| Median Household Income | 1,470 | $83,833 |
| Mean Household Income | 1,470 | $116,734 |
| Income Deficit | 1,040 | $5,646 |
| Wage / Income Gap (%) | 3,935 | 21.35% |
| Wage / Income Gap ($) | 3,935 | 78.65¢ per $1 |
| Gini / Inequality Index | 3,935 | 0.43 |
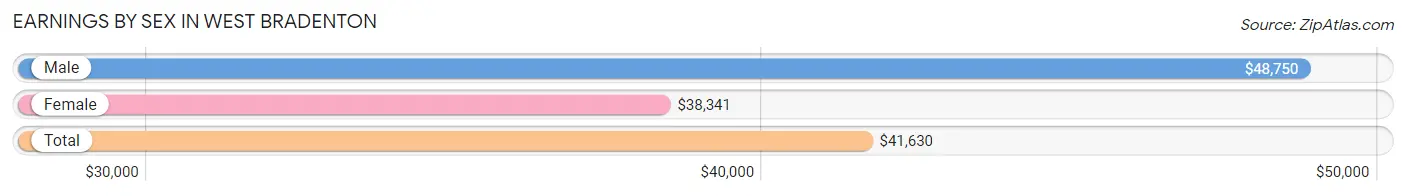
Earnings by Sex in West Bradenton
Average Earnings in West Bradenton are $41,630, $48,750 for men and $38,341 for women, a difference of 21.3%.
| Sex | Number | Average Earnings |
| Male | 1,153 (53.6%) | $48,750 |
| Female | 999 (46.4%) | $38,341 |
| Total | 2,152 (100.0%) | $41,630 |
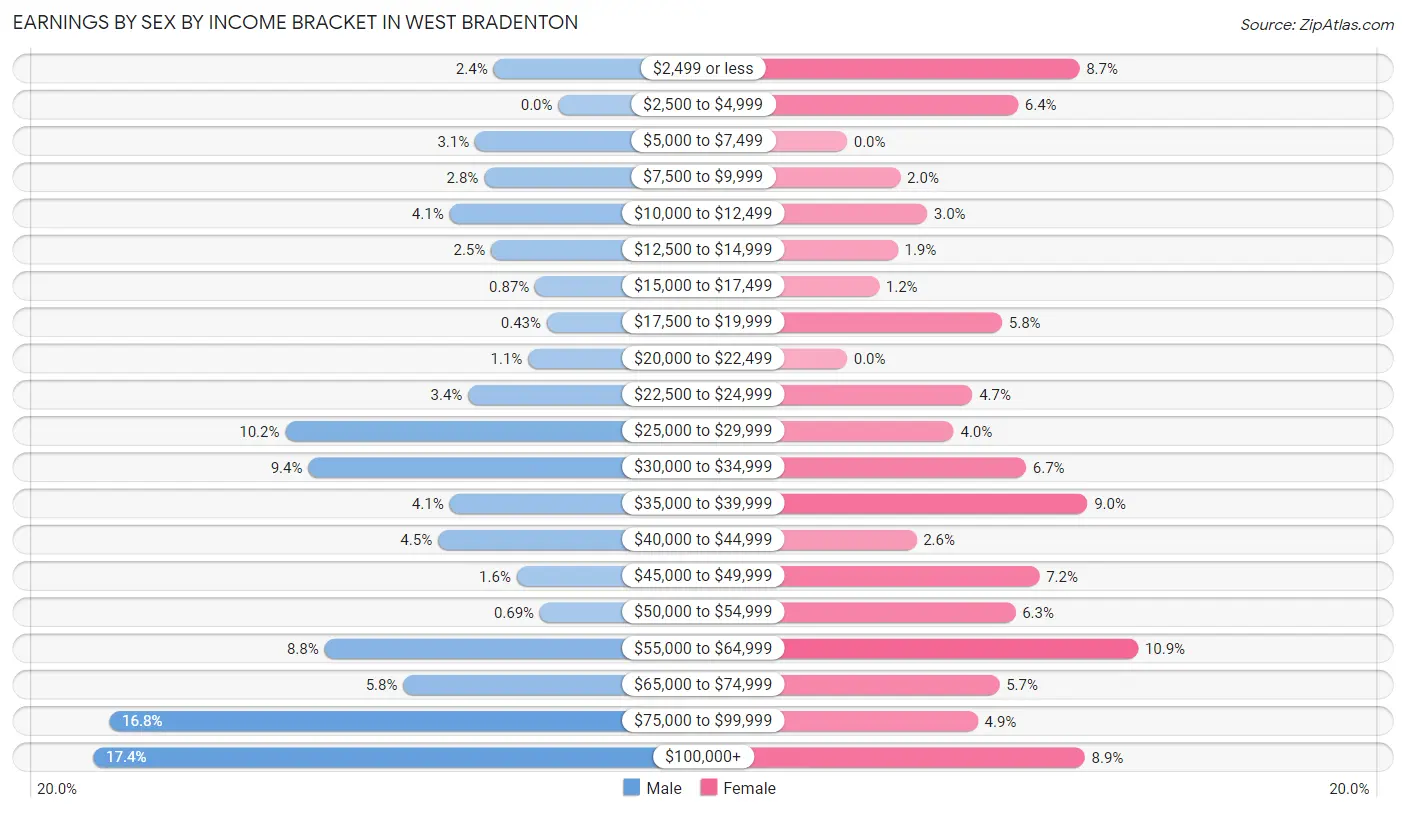
Earnings by Sex by Income Bracket in West Bradenton
The most common earnings brackets in West Bradenton are $100,000+ for men (201 | 17.4%) and $55,000 to $64,999 for women (109 | 10.9%).
| Income | Male | Female |
| $2,499 or less | 28 (2.4%) | 87 (8.7%) |
| $2,500 to $4,999 | 0 (0.0%) | 64 (6.4%) |
| $5,000 to $7,499 | 36 (3.1%) | 0 (0.0%) |
| $7,500 to $9,999 | 32 (2.8%) | 20 (2.0%) |
| $10,000 to $12,499 | 47 (4.1%) | 30 (3.0%) |
| $12,500 to $14,999 | 29 (2.5%) | 19 (1.9%) |
| $15,000 to $17,499 | 10 (0.9%) | 12 (1.2%) |
| $17,500 to $19,999 | 5 (0.4%) | 58 (5.8%) |
| $20,000 to $22,499 | 13 (1.1%) | 0 (0.0%) |
| $22,500 to $24,999 | 39 (3.4%) | 47 (4.7%) |
| $25,000 to $29,999 | 118 (10.2%) | 40 (4.0%) |
| $30,000 to $34,999 | 108 (9.4%) | 67 (6.7%) |
| $35,000 to $39,999 | 47 (4.1%) | 90 (9.0%) |
| $40,000 to $44,999 | 52 (4.5%) | 26 (2.6%) |
| $45,000 to $49,999 | 18 (1.6%) | 72 (7.2%) |
| $50,000 to $54,999 | 8 (0.7%) | 63 (6.3%) |
| $55,000 to $64,999 | 101 (8.8%) | 109 (10.9%) |
| $65,000 to $74,999 | 67 (5.8%) | 57 (5.7%) |
| $75,000 to $99,999 | 194 (16.8%) | 49 (4.9%) |
| $100,000+ | 201 (17.4%) | 89 (8.9%) |
| Total | 1,153 (100.0%) | 999 (100.0%) |
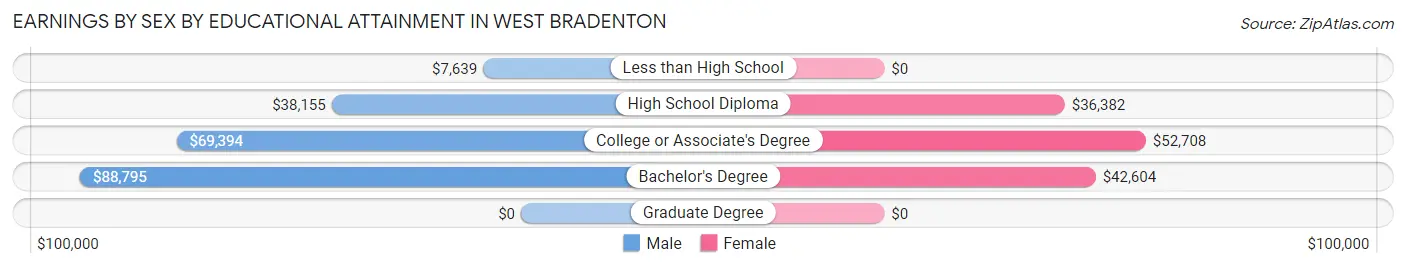
Earnings by Sex by Educational Attainment in West Bradenton
Average earnings in West Bradenton are $57,381 for men and $44,479 for women, a difference of 22.5%. Men with an educational attainment of bachelor's degree enjoy the highest average annual earnings of $88,795, while those with less than high school education earn the least with $7,639. Women with an educational attainment of college or associate's degree earn the most with the average annual earnings of $52,708, while those with high school diploma education have the smallest earnings of $36,382.
| Educational Attainment | Male Income | Female Income |
| Less than High School | $7,639 | $0 |
| High School Diploma | $38,155 | $36,382 |
| College or Associate's Degree | $69,394 | $52,708 |
| Bachelor's Degree | $88,795 | $42,604 |
| Graduate Degree | - | - |
| Total | $57,381 | $44,479 |
Family Income in West Bradenton
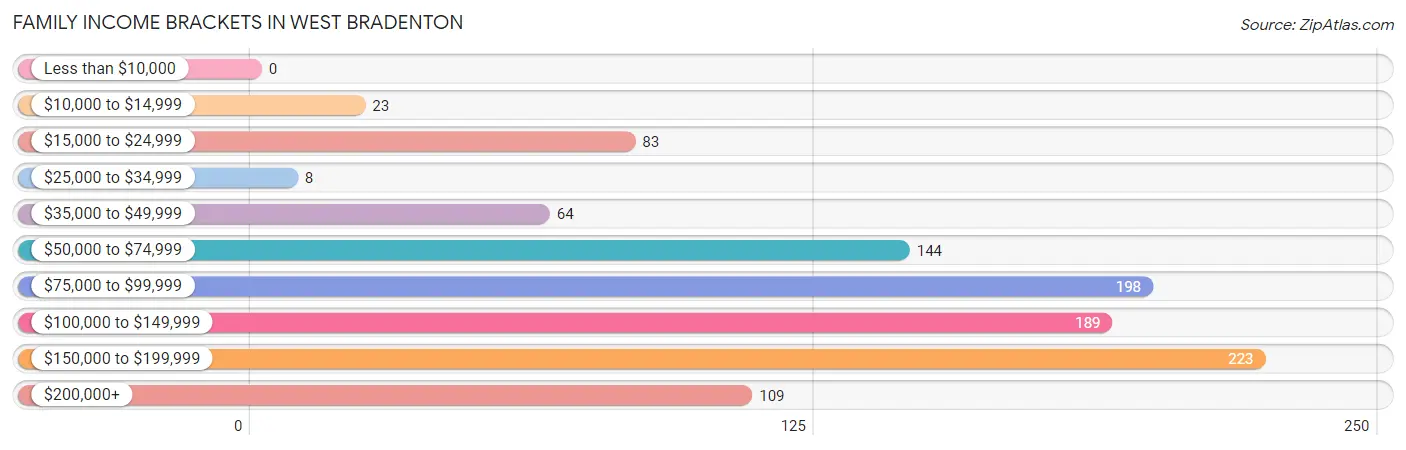
Family Income Brackets in West Bradenton
According to the West Bradenton family income data, there are 223 families falling into the $150,000 to $199,999 income range, which is the most common income bracket and makes up 21.4% of all families.
| Income Bracket | # Families | % Families |
| Less than $10,000 | 0 | 0.0% |
| $10,000 to $14,999 | 23 | 2.2% |
| $15,000 to $24,999 | 83 | 8.0% |
| $25,000 to $34,999 | 8 | 0.8% |
| $35,000 to $49,999 | 64 | 6.2% |
| $50,000 to $74,999 | 144 | 13.8% |
| $75,000 to $99,999 | 198 | 19.0% |
| $100,000 to $149,999 | 189 | 18.2% |
| $150,000 to $199,999 | 223 | 21.4% |
| $200,000+ | 109 | 10.5% |
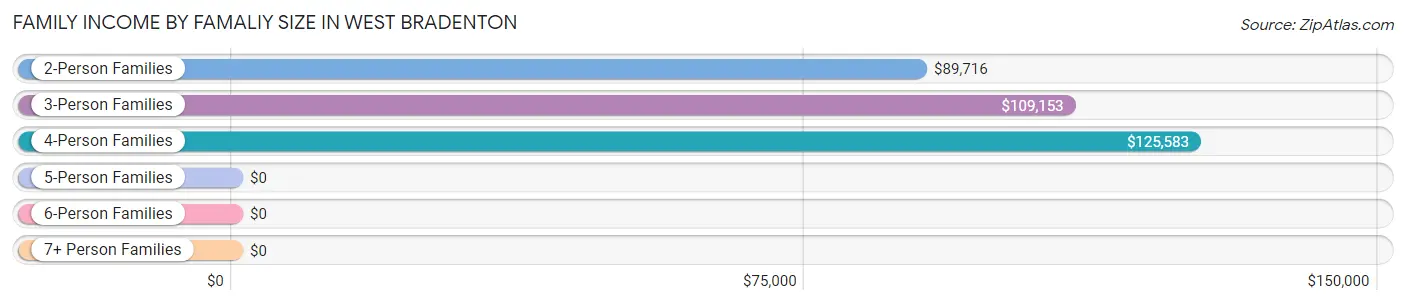
Family Income by Famaliy Size in West Bradenton
4-person families (167 | 16.1%) account for the highest median family income in West Bradenton with $125,583 per family, while 2-person families (619 | 59.5%) have the highest median income of $44,858 per family member.
| Income Bracket | # Families | Median Income |
| 2-Person Families | 619 (59.5%) | $89,716 |
| 3-Person Families | 161 (15.5%) | $109,153 |
| 4-Person Families | 167 (16.1%) | $125,583 |
| 5-Person Families | 75 (7.2%) | $0 |
| 6-Person Families | 18 (1.7%) | $0 |
| 7+ Person Families | 0 (0.0%) | $0 |
| Total | 1,040 (100.0%) | $102,639 |
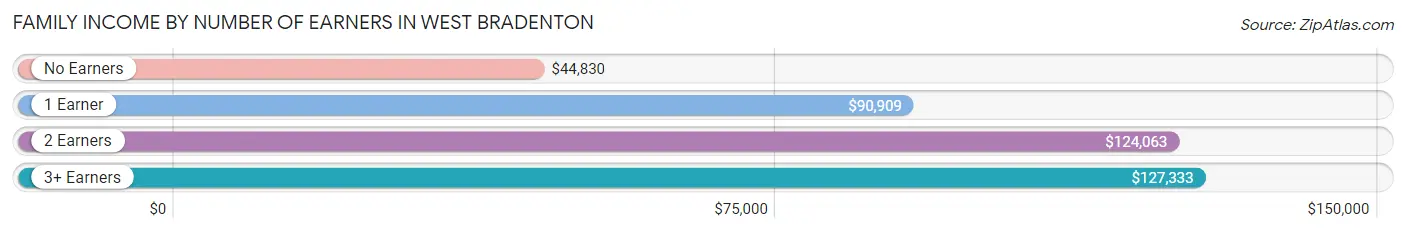
Family Income by Number of Earners in West Bradenton
The median family income in West Bradenton is $102,639, with families comprising 3+ earners (96) having the highest median family income of $127,333, while families with no earners (157) have the lowest median family income of $44,830, accounting for 9.2% and 15.1% of families, respectively.
| Number of Earners | # Families | Median Income |
| No Earners | 157 (15.1%) | $44,830 |
| 1 Earner | 246 (23.6%) | $90,909 |
| 2 Earners | 541 (52.0%) | $124,063 |
| 3+ Earners | 96 (9.2%) | $127,333 |
| Total | 1,040 (100.0%) | $102,639 |
Household Income in West Bradenton
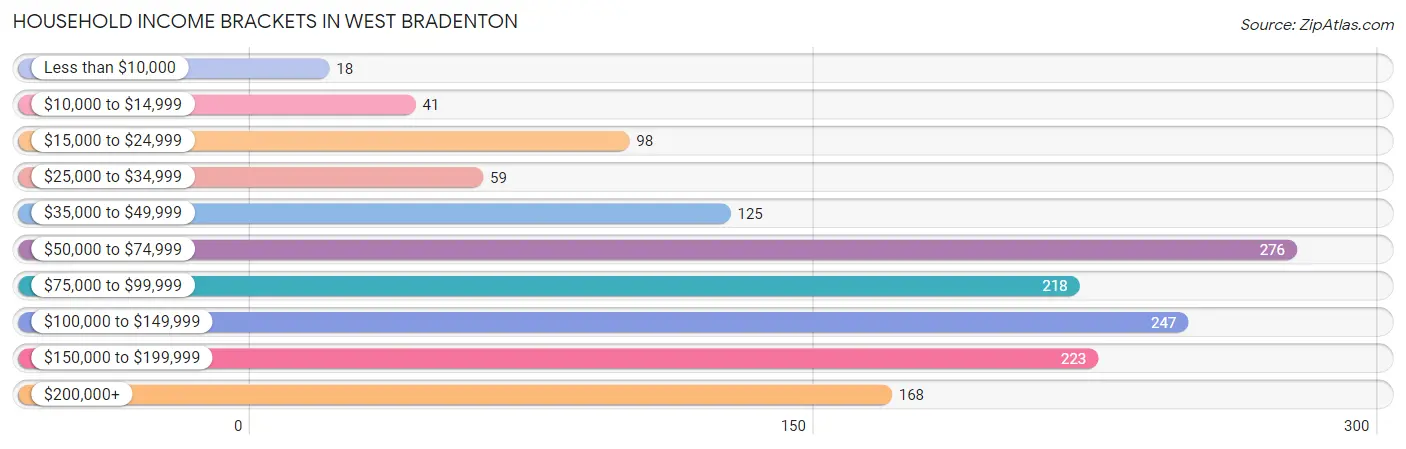
Household Income Brackets in West Bradenton
With 276 households falling in the category, the $50,000 to $74,999 income range is the most frequent in West Bradenton, accounting for 18.8% of all households. In contrast, only 18 households (1.2%) fall into the less than $10,000 income bracket, making it the least populous group.
| Income Bracket | # Households | % Households |
| Less than $10,000 | 18 | 1.2% |
| $10,000 to $14,999 | 41 | 2.8% |
| $15,000 to $24,999 | 98 | 6.7% |
| $25,000 to $34,999 | 59 | 4.0% |
| $35,000 to $49,999 | 125 | 8.5% |
| $50,000 to $74,999 | 276 | 18.8% |
| $75,000 to $99,999 | 218 | 14.8% |
| $100,000 to $149,999 | 247 | 16.8% |
| $150,000 to $199,999 | 223 | 15.2% |
| $200,000+ | 168 | 11.4% |
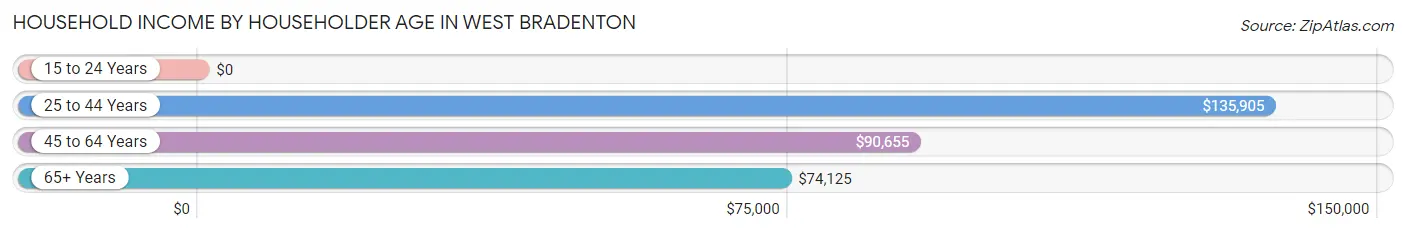
Household Income by Householder Age in West Bradenton
The median household income in West Bradenton is $83,833, with the highest median household income of $135,905 found in the 25 to 44 years age bracket for the primary householder. A total of 283 households (19.3%) fall into this category. Meanwhile, the 15 to 24 years age bracket for the primary householder has the lowest median household income of $0, with 31 households (2.1%) in this group.
| Income Bracket | # Households | Median Income |
| 15 to 24 Years | 31 (2.1%) | $0 |
| 25 to 44 Years | 283 (19.3%) | $135,905 |
| 45 to 64 Years | 625 (42.5%) | $90,655 |
| 65+ Years | 531 (36.1%) | $74,125 |
| Total | 1,470 (100.0%) | $83,833 |
Poverty in West Bradenton
Income Below Poverty by Sex and Age in West Bradenton
With 9.5% poverty level for males and 12.9% for females among the residents of West Bradenton, under 5 year old males and 15 year old females are the most vulnerable to poverty, with 79 males (51.6%) and 13 females (61.9%) in their respective age groups living below the poverty level.
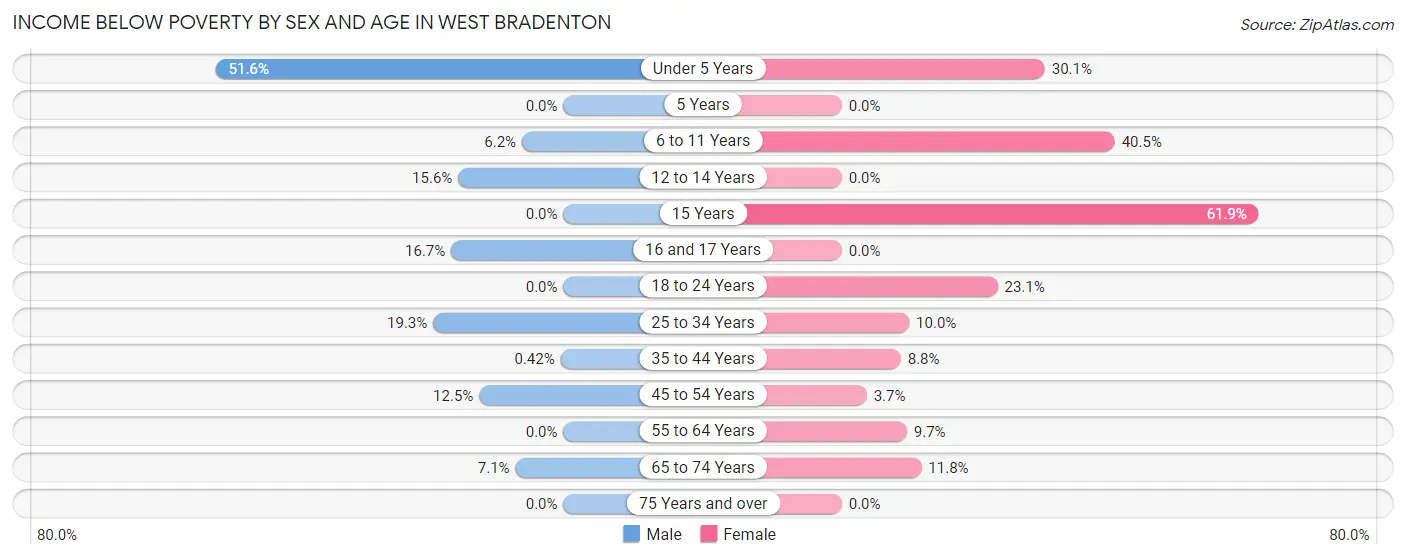
| Age Bracket | Male | Female |
| Under 5 Years | 79 (51.6%) | 22 (30.1%) |
| 5 Years | 0 (0.0%) | 0 (0.0%) |
| 6 to 11 Years | 11 (6.1%) | 77 (40.5%) |
| 12 to 14 Years | 10 (15.6%) | 0 (0.0%) |
| 15 Years | 0 (0.0%) | 13 (61.9%) |
| 16 and 17 Years | 3 (16.7%) | 0 (0.0%) |
| 18 to 24 Years | 0 (0.0%) | 31 (23.1%) |
| 25 to 34 Years | 35 (19.3%) | 16 (10.0%) |
| 35 to 44 Years | 1 (0.4%) | 17 (8.8%) |
| 45 to 54 Years | 26 (12.5%) | 7 (3.7%) |
| 55 to 64 Years | 0 (0.0%) | 43 (9.7%) |
| 65 to 74 Years | 20 (7.1%) | 26 (11.8%) |
| 75 Years and over | 0 (0.0%) | 0 (0.0%) |
| Total | 185 (9.5%) | 252 (12.9%) |
Income Above Poverty by Sex and Age in West Bradenton
According to the poverty statistics in West Bradenton, males aged 15 years and females aged 5 years are the age groups that are most secure financially, with 100.0% of males and 100.0% of females in these age groups living above the poverty line.
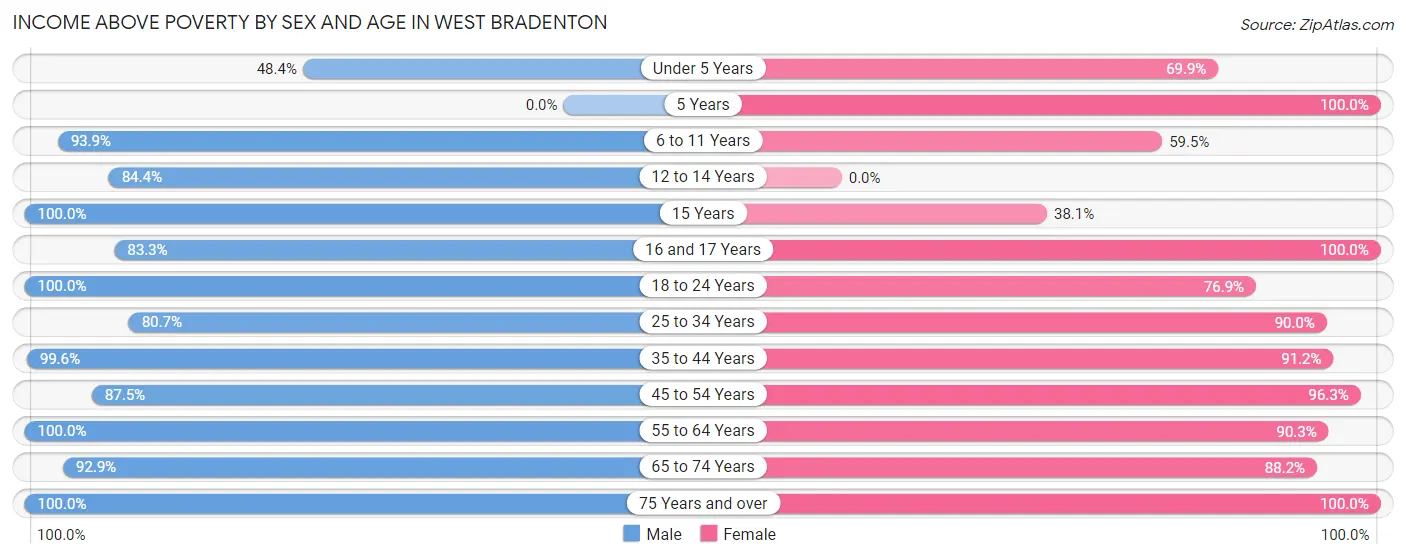
| Age Bracket | Male | Female |
| Under 5 Years | 74 (48.4%) | 51 (69.9%) |
| 5 Years | 0 (0.0%) | 24 (100.0%) |
| 6 to 11 Years | 168 (93.9%) | 113 (59.5%) |
| 12 to 14 Years | 54 (84.4%) | 0 (0.0%) |
| 15 Years | 33 (100.0%) | 8 (38.1%) |
| 16 and 17 Years | 15 (83.3%) | 39 (100.0%) |
| 18 to 24 Years | 101 (100.0%) | 103 (76.9%) |
| 25 to 34 Years | 146 (80.7%) | 144 (90.0%) |
| 35 to 44 Years | 235 (99.6%) | 177 (91.2%) |
| 45 to 54 Years | 182 (87.5%) | 182 (96.3%) |
| 55 to 64 Years | 390 (100.0%) | 402 (90.3%) |
| 65 to 74 Years | 261 (92.9%) | 194 (88.2%) |
| 75 Years and over | 106 (100.0%) | 272 (100.0%) |
| Total | 1,765 (90.5%) | 1,709 (87.2%) |
Income Below Poverty Among Married-Couple Families in West Bradenton
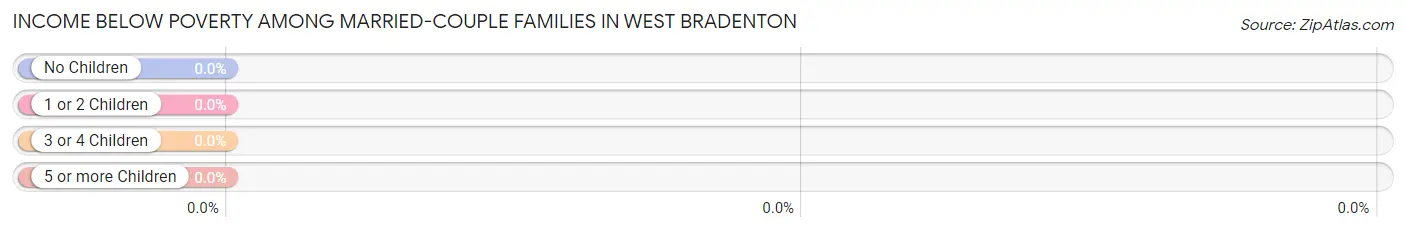
| Children | Above Poverty | Below Poverty |
| No Children | 554 (100.0%) | 0 (0.0%) |
| 1 or 2 Children | 188 (100.0%) | 0 (0.0%) |
| 3 or 4 Children | 64 (100.0%) | 0 (0.0%) |
| 5 or more Children | 0 (0.0%) | 0 (0.0%) |
| Total | 806 (100.0%) | 0 (0.0%) |
Income Below Poverty Among Single-Parent Households in West Bradenton
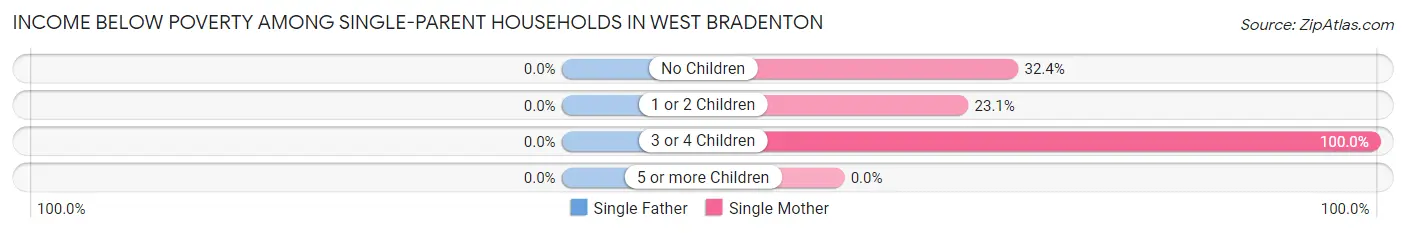
| Children | Single Father | Single Mother |
| No Children | 0 (0.0%) | 23 (32.4%) |
| 1 or 2 Children | 0 (0.0%) | 15 (23.1%) |
| 3 or 4 Children | 0 (0.0%) | 47 (100.0%) |
| 5 or more Children | 0 (0.0%) | 0 (0.0%) |
| Total | 0 (0.0%) | 85 (46.5%) |
Income Below Poverty Among Married-Couple vs Single-Parent Households in West Bradenton
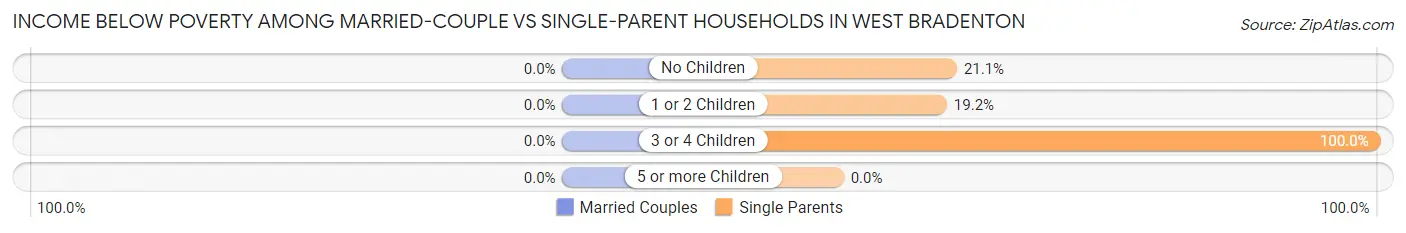
| Children | Married-Couple Families | Single-Parent Households |
| No Children | 0 (0.0%) | 23 (21.1%) |
| 1 or 2 Children | 0 (0.0%) | 15 (19.2%) |
| 3 or 4 Children | 0 (0.0%) | 47 (100.0%) |
| 5 or more Children | 0 (0.0%) | 0 (0.0%) |
| Total | 0 (0.0%) | 85 (36.3%) |
Race in West Bradenton
The most populous races in West Bradenton are White / Caucasian (3,629 | 92.2%), Hispanic or Latino (265 | 6.7%), and Two or more Races (126 | 3.2%).
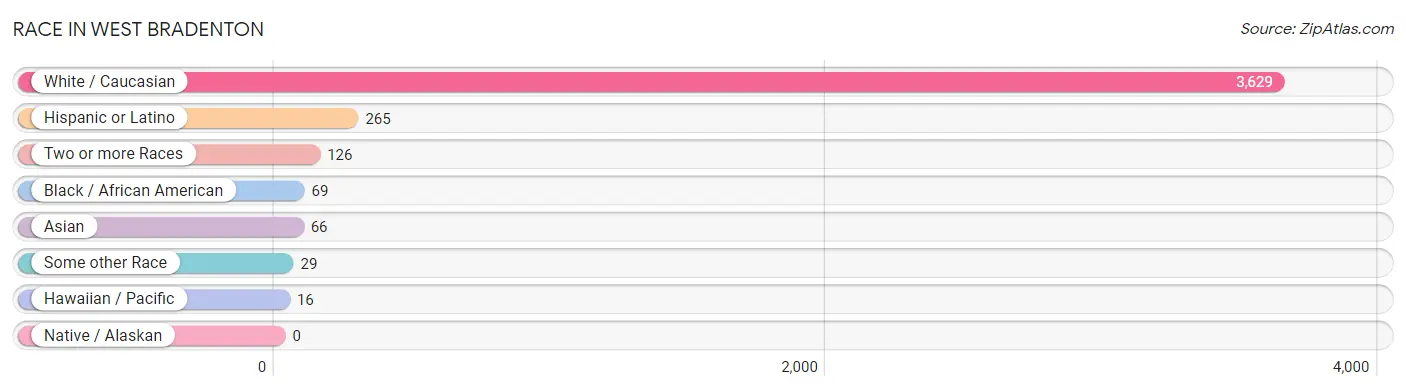
| Race | # Population | % Population |
| Asian | 66 | 1.7% |
| Black / African American | 69 | 1.8% |
| Hawaiian / Pacific | 16 | 0.4% |
| Hispanic or Latino | 265 | 6.7% |
| Native / Alaskan | 0 | 0.0% |
| White / Caucasian | 3,629 | 92.2% |
| Two or more Races | 126 | 3.2% |
| Some other Race | 29 | 0.7% |
| Total | 3,935 | 100.0% |
Ancestry in West Bradenton
The most populous ancestries reported in West Bradenton are English (854 | 21.7%), German (712 | 18.1%), Irish (449 | 11.4%), Scottish (419 | 10.6%), and American (206 | 5.2%), together accounting for 67.1% of all West Bradenton residents.
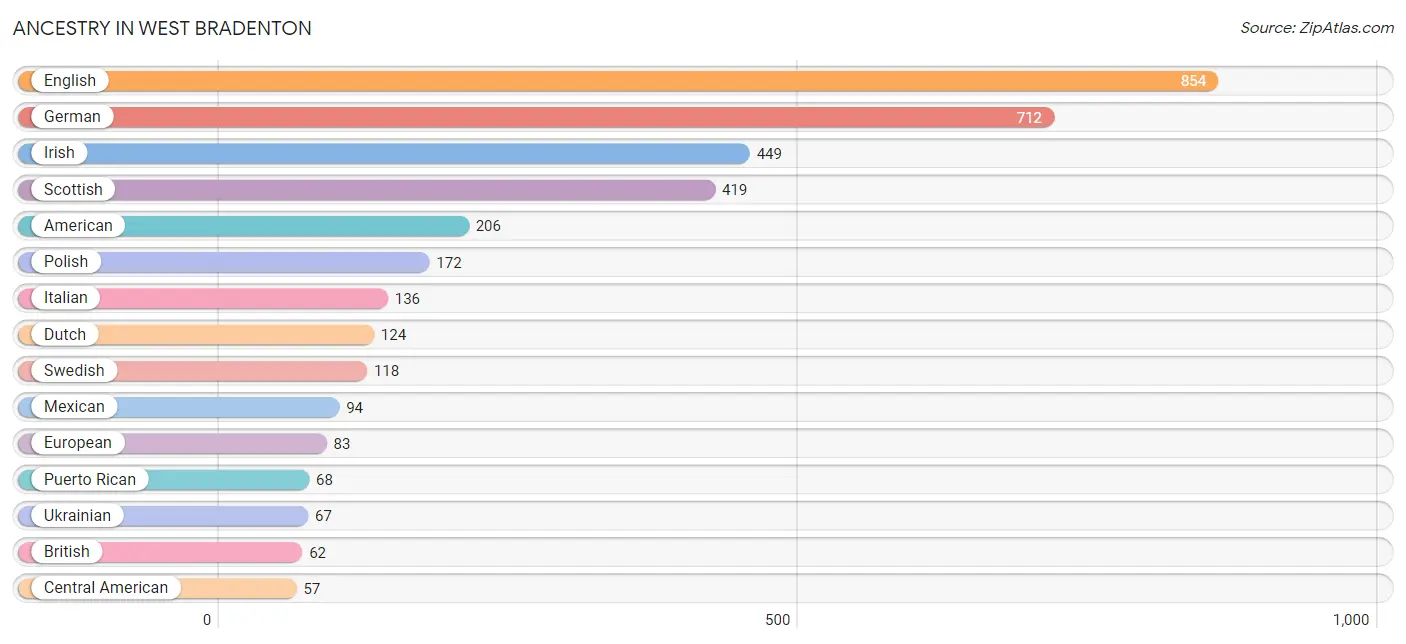
| Ancestry | # Population | % Population |
| African | 18 | 0.5% |
| American | 206 | 5.2% |
| British | 62 | 1.6% |
| Central American | 57 | 1.5% |
| Cherokee | 51 | 1.3% |
| Cuban | 2 | 0.1% |
| Czech | 7 | 0.2% |
| Danish | 21 | 0.5% |
| Dominican | 10 | 0.3% |
| Dutch | 124 | 3.2% |
| Eastern European | 22 | 0.6% |
| Ecuadorian | 16 | 0.4% |
| English | 854 | 21.7% |
| Estonian | 9 | 0.2% |
| European | 83 | 2.1% |
| Finnish | 16 | 0.4% |
| French | 47 | 1.2% |
| German | 712 | 18.1% |
| Greek | 14 | 0.4% |
| Guamanian / Chamorro | 16 | 0.4% |
| Irish | 449 | 11.4% |
| Israeli | 9 | 0.2% |
| Italian | 136 | 3.5% |
| Mexican | 94 | 2.4% |
| Native Hawaiian | 12 | 0.3% |
| Nicaraguan | 57 | 1.5% |
| Norwegian | 8 | 0.2% |
| Pennsylvania German | 12 | 0.3% |
| Polish | 172 | 4.4% |
| Puerto Rican | 68 | 1.7% |
| Scotch-Irish | 37 | 0.9% |
| Scottish | 419 | 10.6% |
| Seminole | 7 | 0.2% |
| South American | 16 | 0.4% |
| Spanish | 18 | 0.5% |
| Sri Lankan | 56 | 1.4% |
| Subsaharan African | 18 | 0.5% |
| Swedish | 118 | 3.0% |
| Thai | 10 | 0.3% |
| Trinidadian and Tobagonian | 38 | 1.0% |
| Ukrainian | 67 | 1.7% |
| Welsh | 11 | 0.3% | View All 42 Rows |
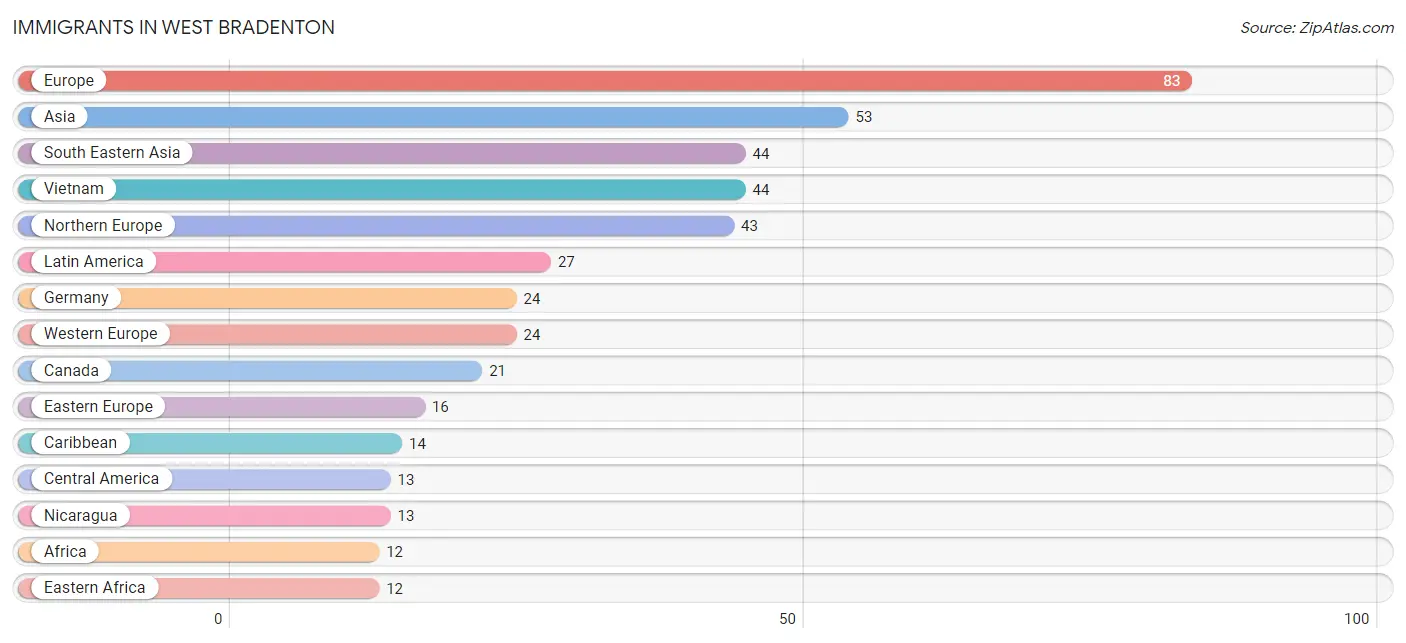
Immigrants in West Bradenton
The most numerous immigrant groups reported in West Bradenton came from Europe (83 | 2.1%), Asia (53 | 1.3%), South Eastern Asia (44 | 1.1%), Vietnam (44 | 1.1%), and Northern Europe (43 | 1.1%), together accounting for 6.8% of all West Bradenton residents.
| Immigration Origin | # Population | % Population |
| Africa | 12 | 0.3% |
| Asia | 53 | 1.3% |
| Canada | 21 | 0.5% |
| Caribbean | 14 | 0.4% |
| Central America | 13 | 0.3% |
| Cuba | 2 | 0.1% |
| Czechoslovakia | 7 | 0.2% |
| Eastern Africa | 12 | 0.3% |
| Eastern Europe | 16 | 0.4% |
| England | 10 | 0.3% |
| Europe | 83 | 2.1% |
| Germany | 24 | 0.6% |
| Israel | 9 | 0.2% |
| Latin America | 27 | 0.7% |
| Nicaragua | 13 | 0.3% |
| Northern Europe | 43 | 1.1% |
| South Eastern Asia | 44 | 1.1% |
| Trinidad and Tobago | 12 | 0.3% |
| Uganda | 12 | 0.3% |
| Vietnam | 44 | 1.1% |
| Western Asia | 9 | 0.2% |
| Western Europe | 24 | 0.6% | View All 22 Rows |
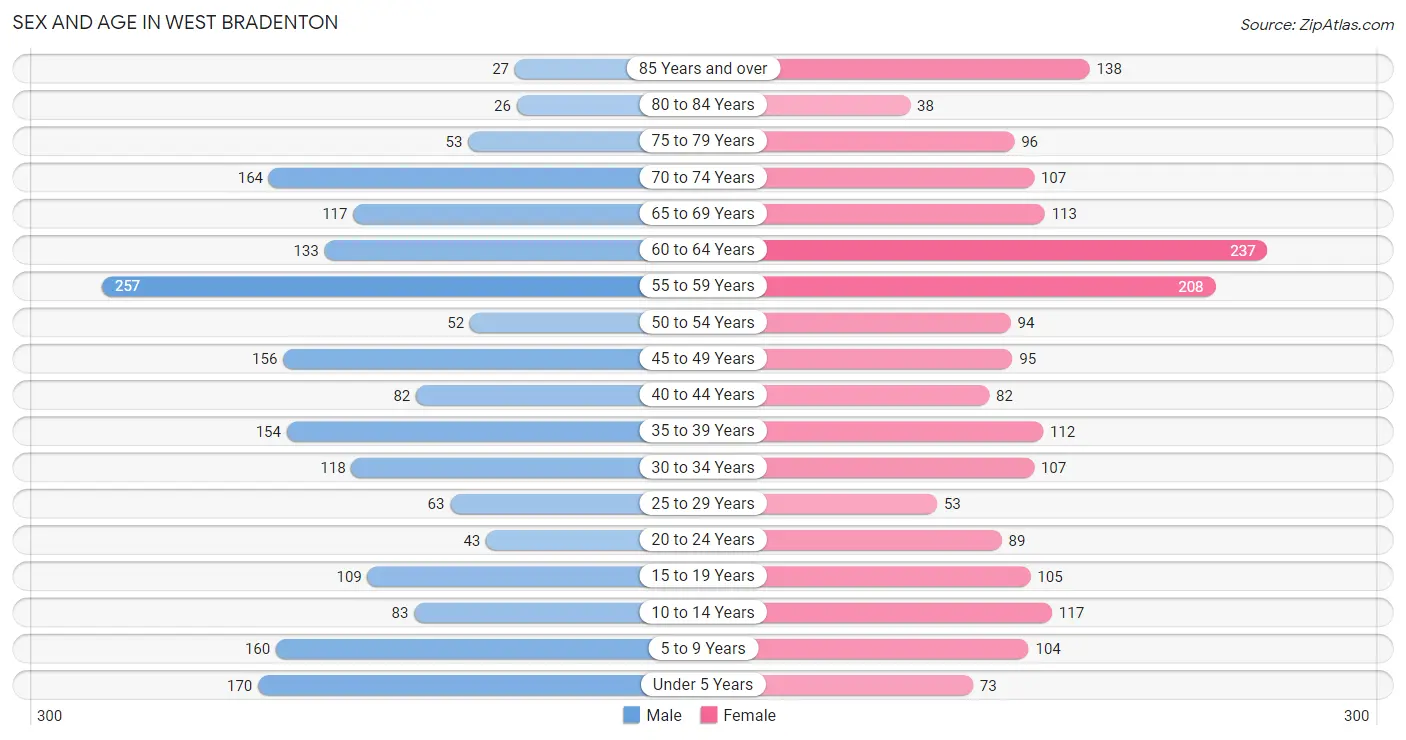
Sex and Age in West Bradenton
Sex and Age in West Bradenton
The most populous age groups in West Bradenton are 55 to 59 Years (257 | 13.1%) for men and 60 to 64 Years (237 | 12.0%) for women.
| Age Bracket | Male | Female |
| Under 5 Years | 170 (8.6%) | 73 (3.7%) |
| 5 to 9 Years | 160 (8.1%) | 104 (5.3%) |
| 10 to 14 Years | 83 (4.2%) | 117 (5.9%) |
| 15 to 19 Years | 109 (5.5%) | 105 (5.3%) |
| 20 to 24 Years | 43 (2.2%) | 89 (4.5%) |
| 25 to 29 Years | 63 (3.2%) | 53 (2.7%) |
| 30 to 34 Years | 118 (6.0%) | 107 (5.4%) |
| 35 to 39 Years | 154 (7.8%) | 112 (5.7%) |
| 40 to 44 Years | 82 (4.2%) | 82 (4.2%) |
| 45 to 49 Years | 156 (7.9%) | 95 (4.8%) |
| 50 to 54 Years | 52 (2.6%) | 94 (4.8%) |
| 55 to 59 Years | 257 (13.1%) | 208 (10.6%) |
| 60 to 64 Years | 133 (6.8%) | 237 (12.0%) |
| 65 to 69 Years | 117 (5.9%) | 113 (5.7%) |
| 70 to 74 Years | 164 (8.3%) | 107 (5.4%) |
| 75 to 79 Years | 53 (2.7%) | 96 (4.9%) |
| 80 to 84 Years | 26 (1.3%) | 38 (1.9%) |
| 85 Years and over | 27 (1.4%) | 138 (7.0%) |
| Total | 1,967 (100.0%) | 1,968 (100.0%) |
Families and Households in West Bradenton
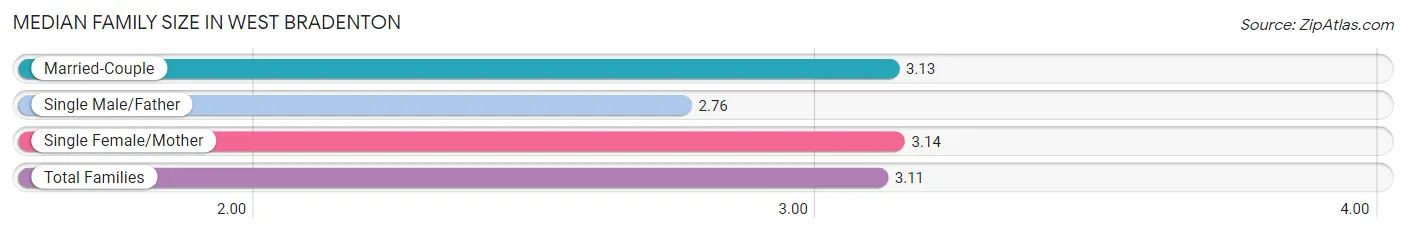
Median Family Size in West Bradenton
The median family size in West Bradenton is 3.11 persons per family, with single female/mother families (183 | 17.6%) accounting for the largest median family size of 3.14 persons per family. On the other hand, single male/father families (51 | 4.9%) represent the smallest median family size with 2.76 persons per family.
| Family Type | # Families | Family Size |
| Married-Couple | 806 (77.5%) | 3.13 |
| Single Male/Father | 51 (4.9%) | 2.76 |
| Single Female/Mother | 183 (17.6%) | 3.14 |
| Total Families | 1,040 (100.0%) | 3.11 |
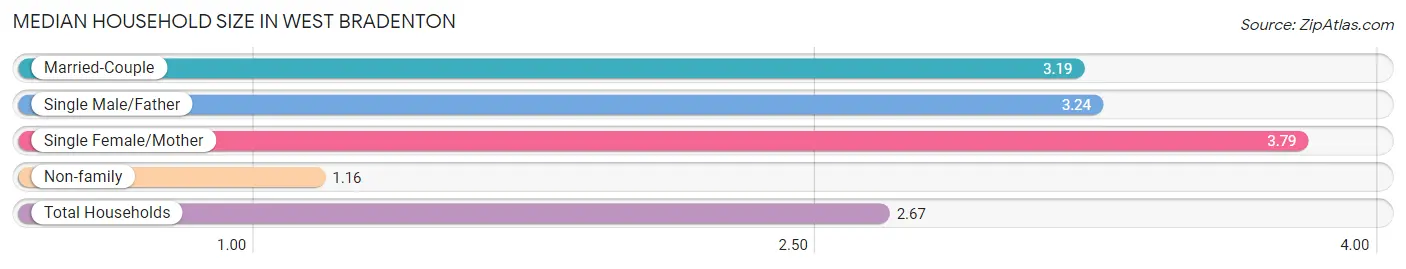
Median Household Size in West Bradenton
The median household size in West Bradenton is 2.67 persons per household, with single female/mother households (183 | 12.4%) accounting for the largest median household size of 3.79 persons per household. non-family households (430 | 29.2%) represent the smallest median household size with 1.16 persons per household.
| Household Type | # Households | Household Size |
| Married-Couple | 806 (54.8%) | 3.19 |
| Single Male/Father | 51 (3.5%) | 3.24 |
| Single Female/Mother | 183 (12.4%) | 3.79 |
| Non-family | 430 (29.2%) | 1.16 |
| Total Households | 1,470 (100.0%) | 2.67 |
Household Size by Marriage Status in West Bradenton
Out of a total of 1,470 households in West Bradenton, 1,040 (70.8%) are family households, while 430 (29.2%) are nonfamily households. The most numerous type of family households are 2-person households, comprising 569, and the most common type of nonfamily households are 1-person households, comprising 367.
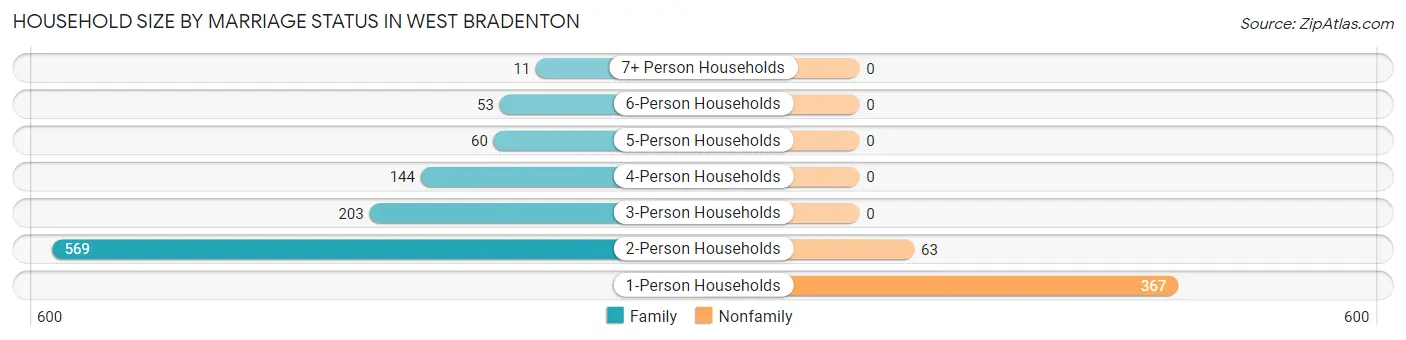
| Household Size | Family Households | Nonfamily Households |
| 1-Person Households | - | 367 (25.0%) |
| 2-Person Households | 569 (38.7%) | 63 (4.3%) |
| 3-Person Households | 203 (13.8%) | 0 (0.0%) |
| 4-Person Households | 144 (9.8%) | 0 (0.0%) |
| 5-Person Households | 60 (4.1%) | 0 (0.0%) |
| 6-Person Households | 53 (3.6%) | 0 (0.0%) |
| 7+ Person Households | 11 (0.7%) | 0 (0.0%) |
| Total | 1,040 (70.8%) | 430 (29.2%) |
Female Fertility in West Bradenton
Fertility by Age in West Bradenton
Average fertility rate in West Bradenton is 132.0 births per 1,000 women. Women in the age bracket of 20 to 34 years have the highest fertility rate with 333.0 births per 1,000 women. Women in the age bracket of 20 to 34 years acount for 92.2% of all women with births.
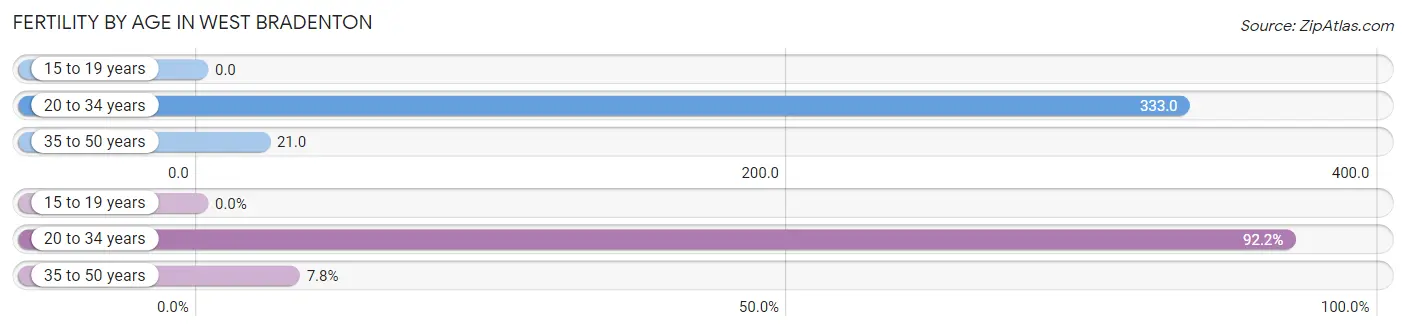
| Age Bracket | Women with Births | Births / 1,000 Women |
| 15 to 19 years | 0 (0.0%) | 0.0 |
| 20 to 34 years | 83 (92.2%) | 333.0 |
| 35 to 50 years | 7 (7.8%) | 21.0 |
| Total | 90 (100.0%) | 132.0 |
Fertility by Age by Marriage Status in West Bradenton
31.1% of women with births (90) in West Bradenton are married. The highest percentage of unmarried women with births falls into 20 to 34 years age bracket with 74.7% of them unmarried at the time of birth, while the lowest percentage of unmarried women with births belong to 35 to 50 years age bracket with 0.0% of them unmarried.
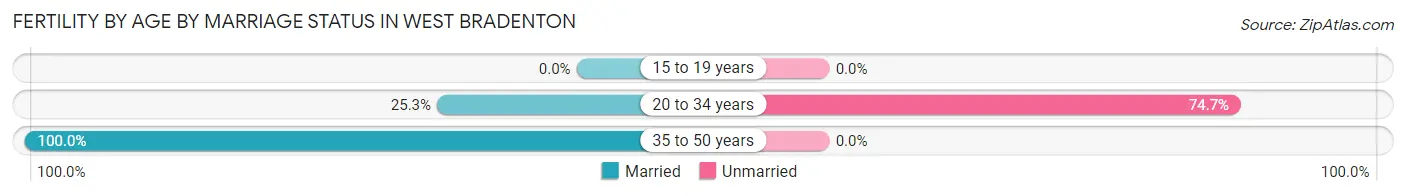
| Age Bracket | Married | Unmarried |
| 15 to 19 years | 0 (0.0%) | 0 (0.0%) |
| 20 to 34 years | 21 (25.3%) | 62 (74.7%) |
| 35 to 50 years | 7 (100.0%) | 0 (0.0%) |
| Total | 28 (31.1%) | 62 (68.9%) |
Fertility by Education in West Bradenton
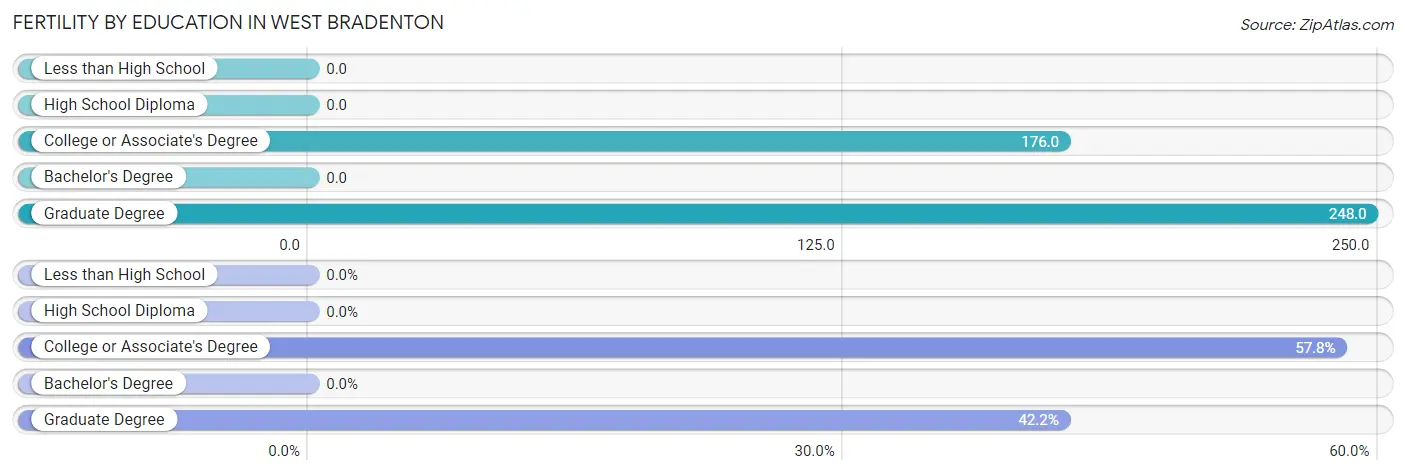
| Educational Attainment | Women with Births | Births / 1,000 Women |
| Less than High School | 0 (0.0%) | 0.0 |
| High School Diploma | 0 (0.0%) | 0.0 |
| College or Associate's Degree | 52 (57.8%) | 176.0 |
| Bachelor's Degree | 0 (0.0%) | 0.0 |
| Graduate Degree | 38 (42.2%) | 248.0 |
| Total | 90 (100.0%) | 132.0 |
Fertility by Education by Marriage Status in West Bradenton
68.9% of women with births in West Bradenton are unmarried. Women with the educational attainment of college or associate's degree are most likely to be married with 40.4% of them married at childbirth, while women with the educational attainment of graduate degree are least likely to be married with 81.6% of them unmarried at childbirth.
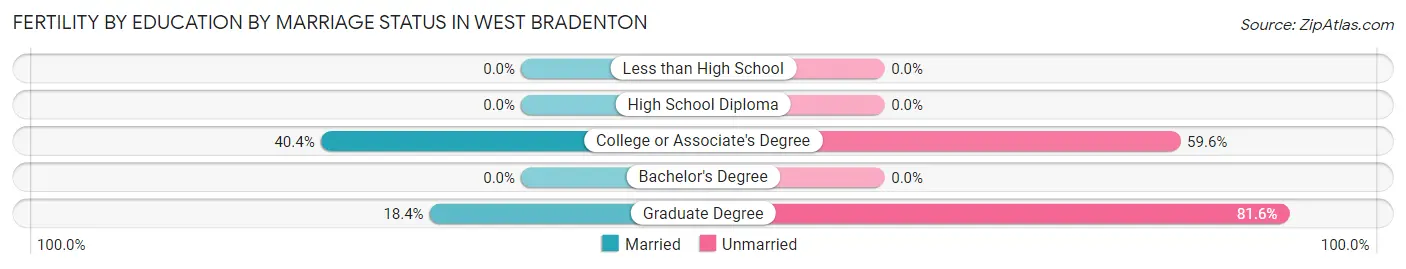
| Educational Attainment | Married | Unmarried |
| Less than High School | 0 (0.0%) | 0 (0.0%) |
| High School Diploma | 0 (0.0%) | 0 (0.0%) |
| College or Associate's Degree | 21 (40.4%) | 31 (59.6%) |
| Bachelor's Degree | 0 (0.0%) | 0 (0.0%) |
| Graduate Degree | 7 (18.4%) | 31 (81.6%) |
| Total | 28 (31.1%) | 62 (68.9%) |
Employment Characteristics in West Bradenton
Employment by Class of Employer in West Bradenton
Among the 1,939 employed individuals in West Bradenton, private company employees (1,225 | 63.2%), local government employees (208 | 10.7%), and self-employed (incorporated) (179 | 9.2%) make up the most common classes of employment.
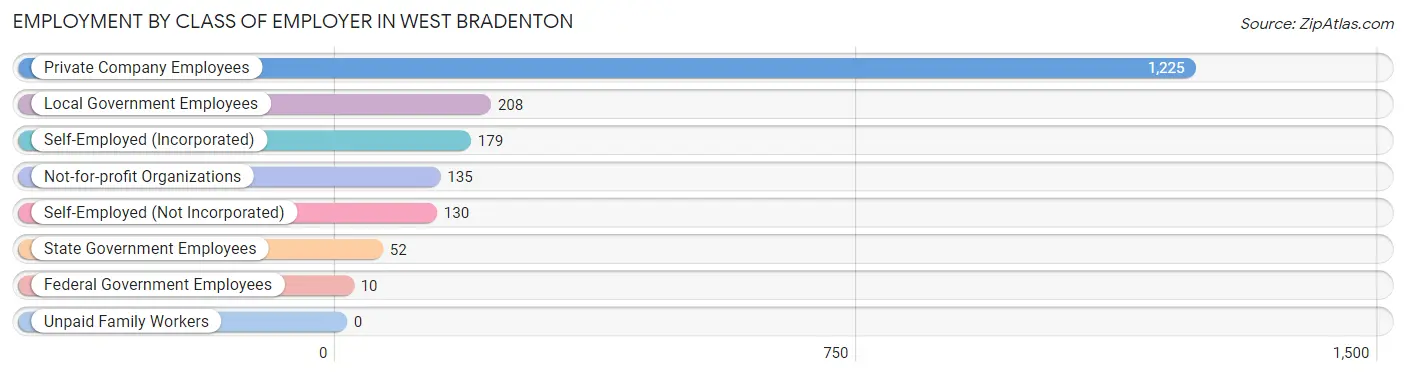
| Employer Class | # Employees | % Employees |
| Private Company Employees | 1,225 | 63.2% |
| Self-Employed (Incorporated) | 179 | 9.2% |
| Self-Employed (Not Incorporated) | 130 | 6.7% |
| Not-for-profit Organizations | 135 | 7.0% |
| Local Government Employees | 208 | 10.7% |
| State Government Employees | 52 | 2.7% |
| Federal Government Employees | 10 | 0.5% |
| Unpaid Family Workers | 0 | 0.0% |
| Total | 1,939 | 100.0% |
Employment Status by Age in West Bradenton
According to the labor force statistics for West Bradenton, out of the total population over 16 years of age (3,174), 65.9% or 2,092 individuals are in the labor force, with 4.0% or 84 of them unemployed. The age group with the highest labor force participation rate is 20 to 24 years, with 100.0% or 132 individuals in the labor force. Within the labor force, the 25 to 29 years age range has the highest percentage of unemployed individuals, with 22.3% or 23 of them being unemployed.
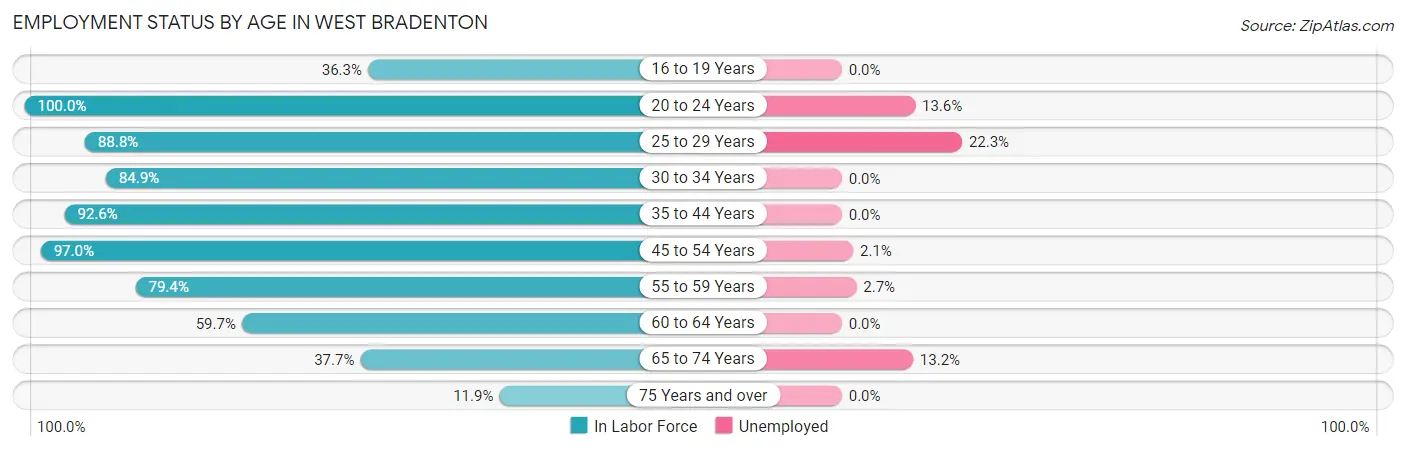
| Age Bracket | In Labor Force | Unemployed |
| 16 to 19 Years | 58 (36.3%) | 0 (0.0%) |
| 20 to 24 Years | 132 (100.0%) | 18 (13.6%) |
| 25 to 29 Years | 103 (88.8%) | 23 (22.3%) |
| 30 to 34 Years | 191 (84.9%) | 0 (0.0%) |
| 35 to 44 Years | 398 (92.6%) | 0 (0.0%) |
| 45 to 54 Years | 385 (97.0%) | 8 (2.1%) |
| 55 to 59 Years | 369 (79.4%) | 10 (2.7%) |
| 60 to 64 Years | 221 (59.7%) | 0 (0.0%) |
| 65 to 74 Years | 189 (37.7%) | 25 (13.2%) |
| 75 Years and over | 45 (11.9%) | 0 (0.0%) |
| Total | 2,092 (65.9%) | 84 (4.0%) |
Employment Status by Educational Attainment in West Bradenton
According to labor force statistics for West Bradenton, 83.2% of individuals (1,666) out of the total population between 25 and 64 years of age (2,003) are in the labor force, with 2.5% or 42 of them being unemployed. The group with the highest labor force participation rate are those with the educational attainment of less than high school, with 100.0% or 80 individuals in the labor force. Within the labor force, individuals with less than high school education have the highest percentage of unemployment, with 10.0% or 8 of them being unemployed.
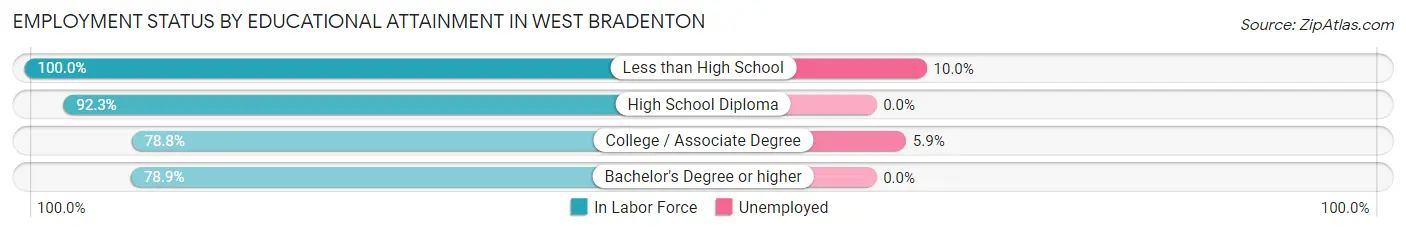
| Educational Attainment | In Labor Force | Unemployed |
| Less than High School | 80 (100.0%) | 8 (10.0%) |
| High School Diploma | 490 (92.3%) | 0 (0.0%) |
| College / Associate Degree | 560 (78.8%) | 42 (5.9%) |
| Bachelor's Degree or higher | 537 (78.9%) | 0 (0.0%) |
| Total | 1,666 (83.2%) | 50 (2.5%) |
Employment Occupations by Sex in West Bradenton
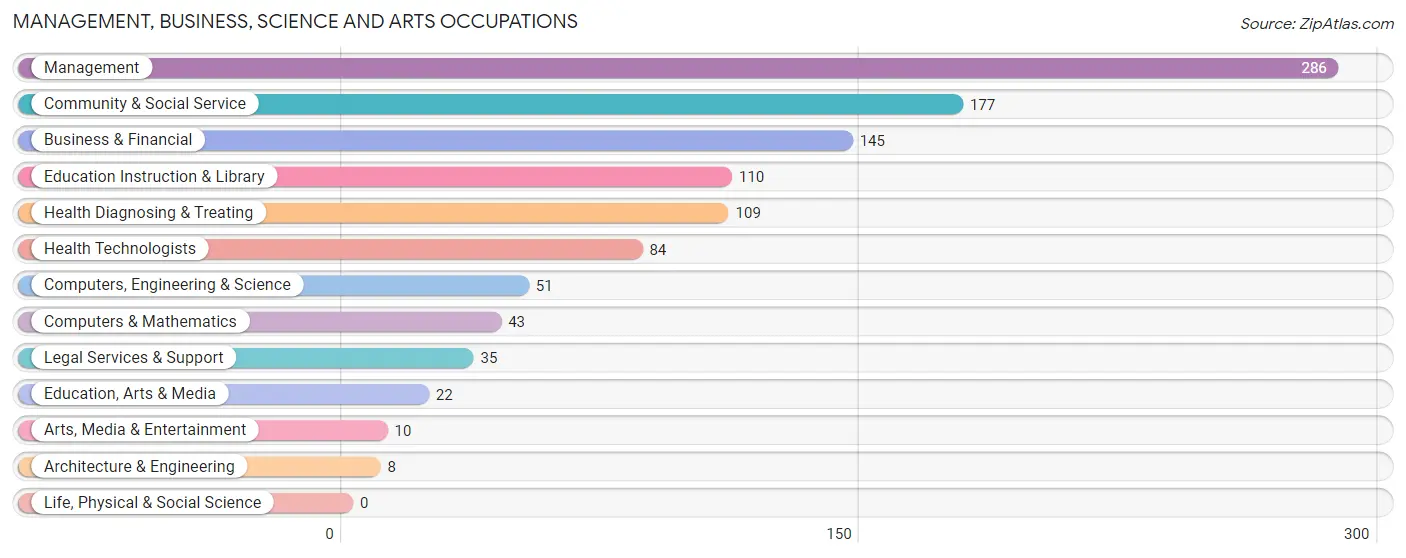
Management, Business, Science and Arts Occupations
The most common Management, Business, Science and Arts occupations in West Bradenton are Management (286 | 14.2%), Community & Social Service (177 | 8.8%), Business & Financial (145 | 7.2%), Education Instruction & Library (110 | 5.5%), and Health Diagnosing & Treating (109 | 5.4%).
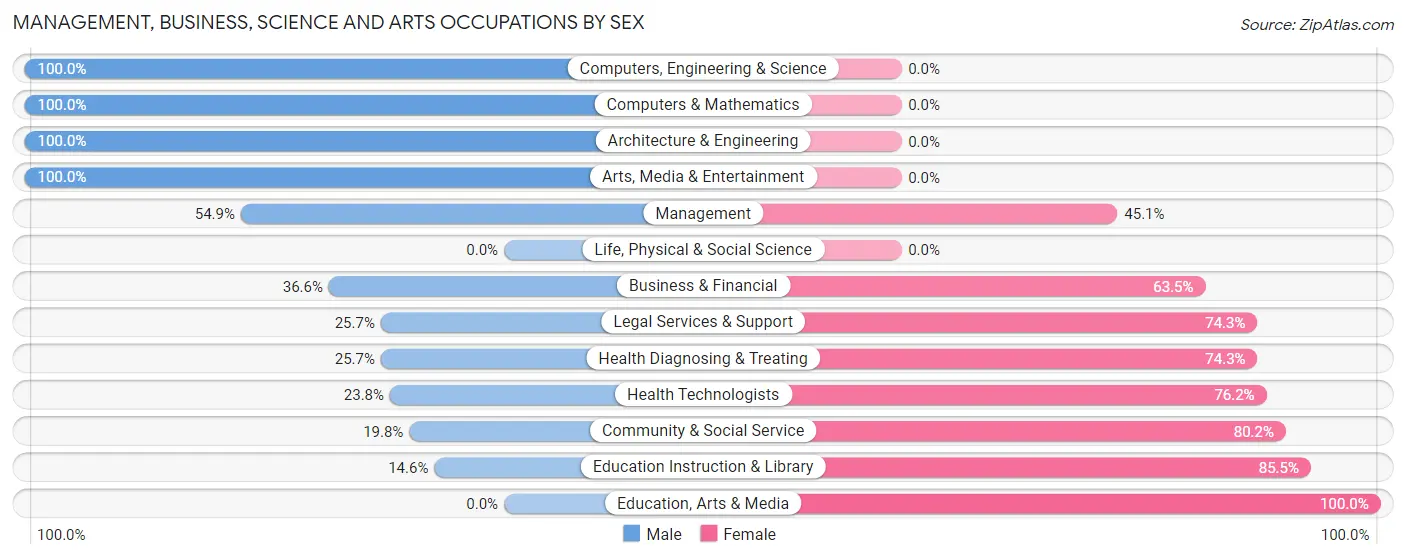
Management, Business, Science and Arts Occupations by Sex
Within the Management, Business, Science and Arts occupations in West Bradenton, the most male-oriented occupations are Computers, Engineering & Science (100.0%), Computers & Mathematics (100.0%), and Architecture & Engineering (100.0%), while the most female-oriented occupations are Education, Arts & Media (100.0%), Education Instruction & Library (85.5%), and Community & Social Service (80.2%).
| Occupation | Male | Female |
| Management | 157 (54.9%) | 129 (45.1%) |
| Business & Financial | 53 (36.5%) | 92 (63.4%) |
| Computers, Engineering & Science | 51 (100.0%) | 0 (0.0%) |
| Computers & Mathematics | 43 (100.0%) | 0 (0.0%) |
| Architecture & Engineering | 8 (100.0%) | 0 (0.0%) |
| Life, Physical & Social Science | 0 (0.0%) | 0 (0.0%) |
| Community & Social Service | 35 (19.8%) | 142 (80.2%) |
| Education, Arts & Media | 0 (0.0%) | 22 (100.0%) |
| Legal Services & Support | 9 (25.7%) | 26 (74.3%) |
| Education Instruction & Library | 16 (14.5%) | 94 (85.5%) |
| Arts, Media & Entertainment | 10 (100.0%) | 0 (0.0%) |
| Health Diagnosing & Treating | 28 (25.7%) | 81 (74.3%) |
| Health Technologists | 20 (23.8%) | 64 (76.2%) |
| Total (Category) | 324 (42.2%) | 444 (57.8%) |
| Total (Overall) | 1,108 (55.2%) | 899 (44.8%) |
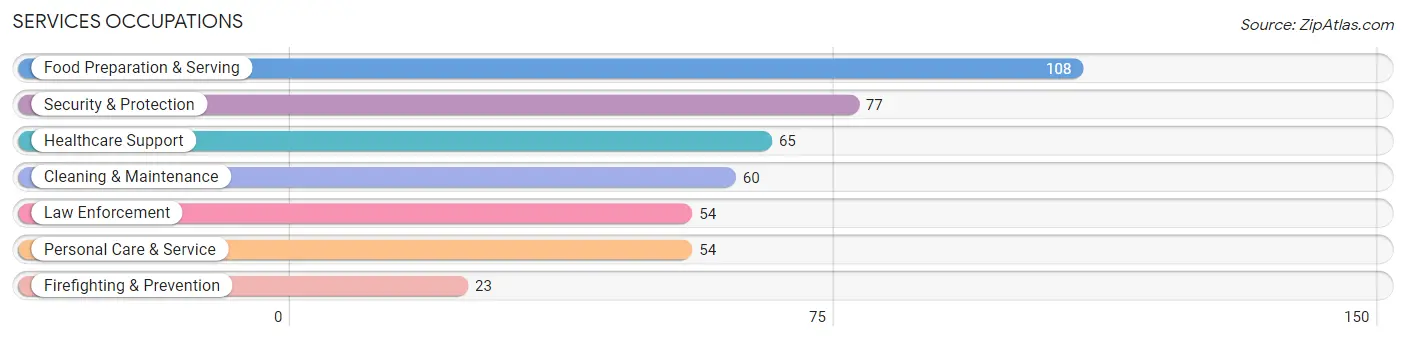
Services Occupations
The most common Services occupations in West Bradenton are Food Preparation & Serving (108 | 5.4%), Security & Protection (77 | 3.8%), Healthcare Support (65 | 3.2%), Cleaning & Maintenance (60 | 3.0%), and Law Enforcement (54 | 2.7%).
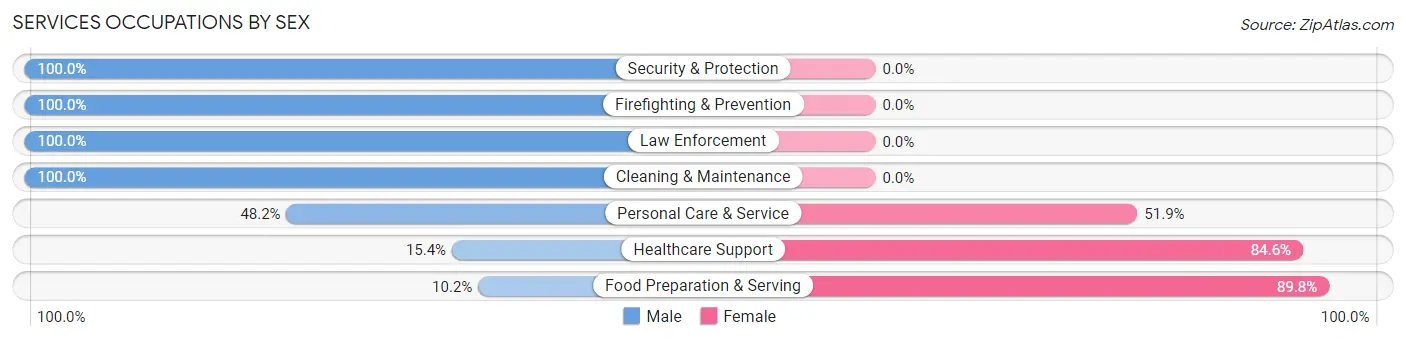
Services Occupations by Sex
Within the Services occupations in West Bradenton, the most male-oriented occupations are Security & Protection (100.0%), Firefighting & Prevention (100.0%), and Law Enforcement (100.0%), while the most female-oriented occupations are Food Preparation & Serving (89.8%), Healthcare Support (84.6%), and Personal Care & Service (51.8%).
| Occupation | Male | Female |
| Healthcare Support | 10 (15.4%) | 55 (84.6%) |
| Security & Protection | 77 (100.0%) | 0 (0.0%) |
| Firefighting & Prevention | 23 (100.0%) | 0 (0.0%) |
| Law Enforcement | 54 (100.0%) | 0 (0.0%) |
| Food Preparation & Serving | 11 (10.2%) | 97 (89.8%) |
| Cleaning & Maintenance | 60 (100.0%) | 0 (0.0%) |
| Personal Care & Service | 26 (48.1%) | 28 (51.8%) |
| Total (Category) | 184 (50.5%) | 180 (49.4%) |
| Total (Overall) | 1,108 (55.2%) | 899 (44.8%) |
Sales and Office Occupations
The most common Sales and Office occupations in West Bradenton are Sales & Related (290 | 14.4%), and Office & Administration (200 | 10.0%).
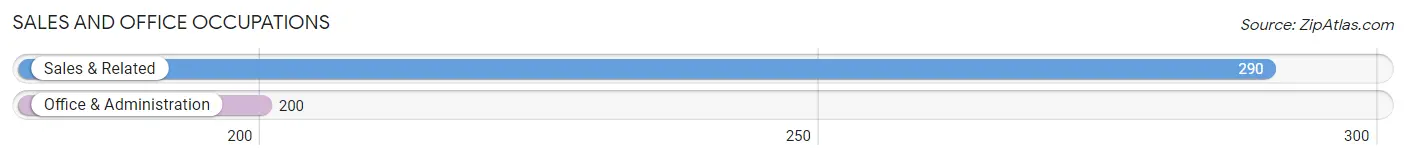
Sales and Office Occupations by Sex
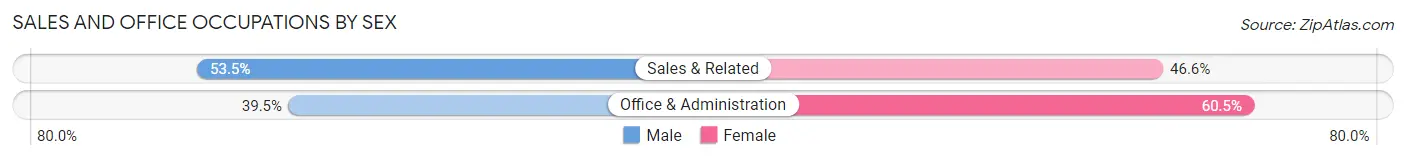
| Occupation | Male | Female |
| Sales & Related | 155 (53.4%) | 135 (46.6%) |
| Office & Administration | 79 (39.5%) | 121 (60.5%) |
| Total (Category) | 234 (47.8%) | 256 (52.2%) |
| Total (Overall) | 1,108 (55.2%) | 899 (44.8%) |
Natural Resources, Construction and Maintenance Occupations
The most common Natural Resources, Construction and Maintenance occupations in West Bradenton are Construction & Extraction (153 | 7.6%), and Installation, Maintenance & Repair (124 | 6.2%).
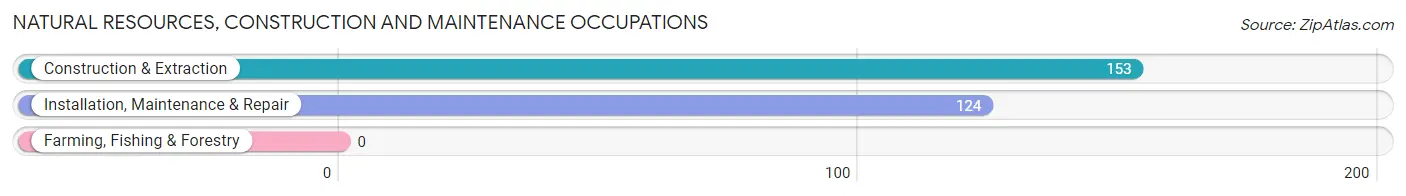
Natural Resources, Construction and Maintenance Occupations by Sex
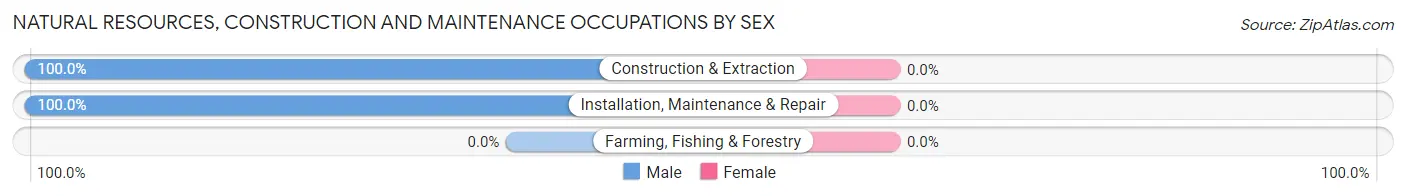
| Occupation | Male | Female |
| Farming, Fishing & Forestry | 0 (0.0%) | 0 (0.0%) |
| Construction & Extraction | 153 (100.0%) | 0 (0.0%) |
| Installation, Maintenance & Repair | 124 (100.0%) | 0 (0.0%) |
| Total (Category) | 277 (100.0%) | 0 (0.0%) |
| Total (Overall) | 1,108 (55.2%) | 899 (44.8%) |
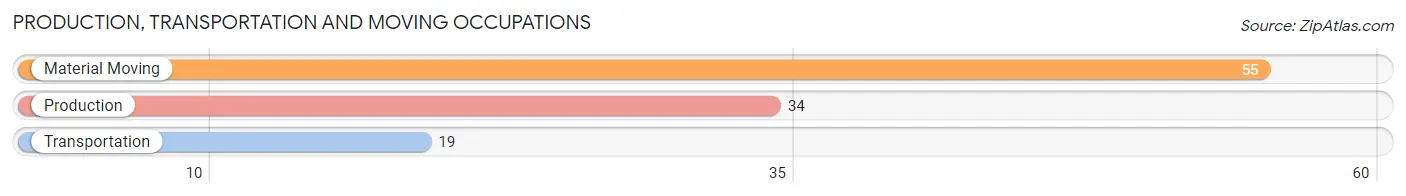
Production, Transportation and Moving Occupations
The most common Production, Transportation and Moving occupations in West Bradenton are Material Moving (55 | 2.7%), Production (34 | 1.7%), and Transportation (19 | 0.9%).
Production, Transportation and Moving Occupations by Sex
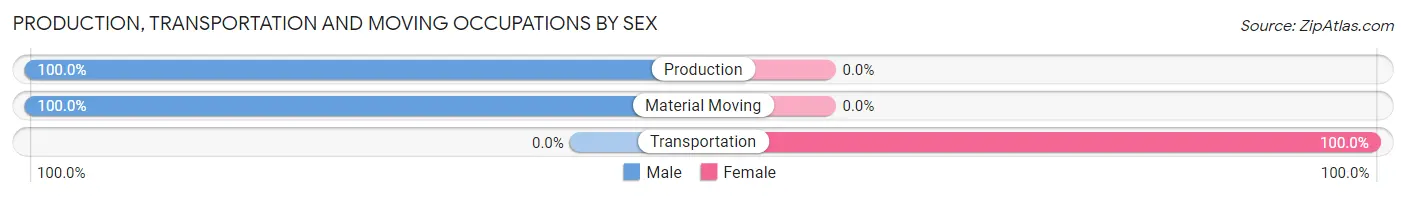
| Occupation | Male | Female |
| Production | 34 (100.0%) | 0 (0.0%) |
| Transportation | 0 (0.0%) | 19 (100.0%) |
| Material Moving | 55 (100.0%) | 0 (0.0%) |
| Total (Category) | 89 (82.4%) | 19 (17.6%) |
| Total (Overall) | 1,108 (55.2%) | 899 (44.8%) |
Employment Industries by Sex in West Bradenton
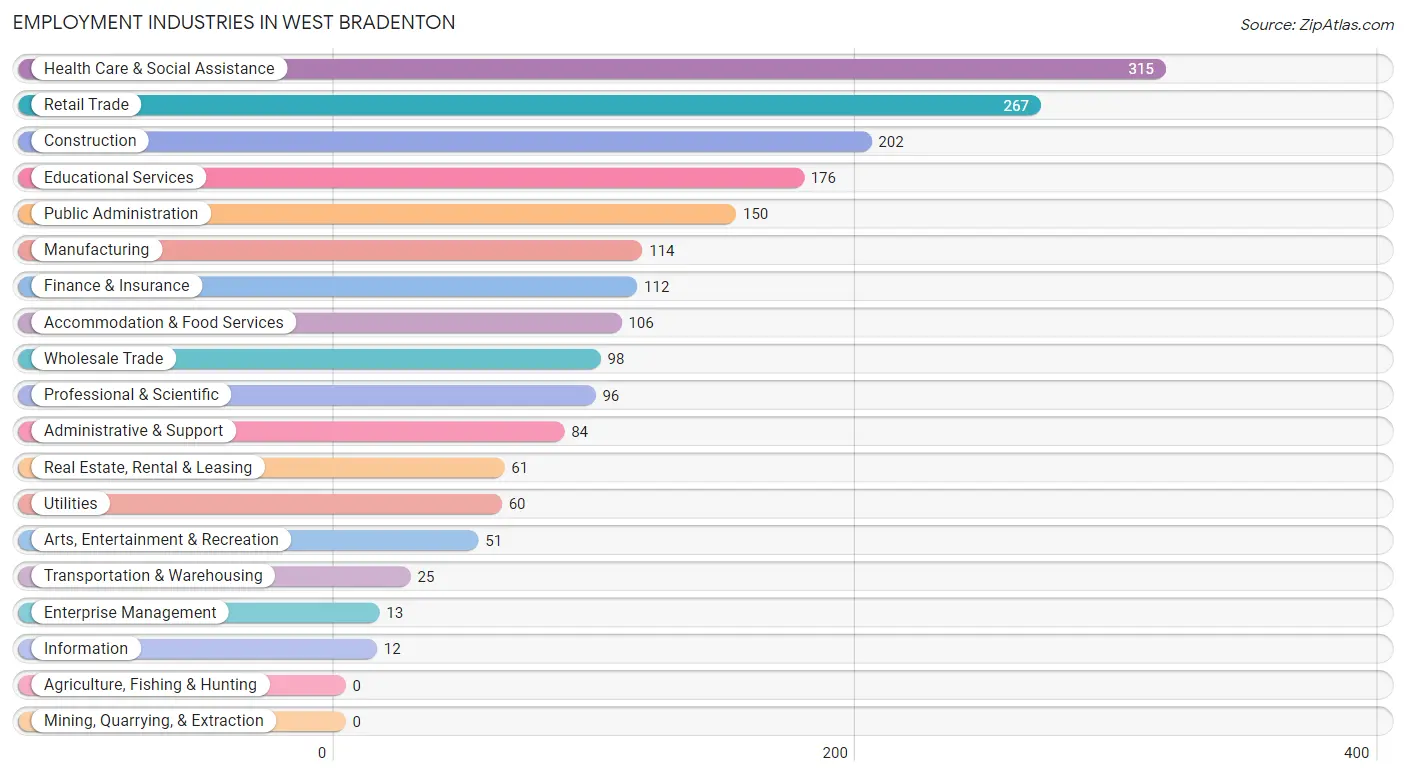
Employment Industries in West Bradenton
The major employment industries in West Bradenton include Health Care & Social Assistance (315 | 15.7%), Retail Trade (267 | 13.3%), Construction (202 | 10.1%), Educational Services (176 | 8.8%), and Public Administration (150 | 7.5%).
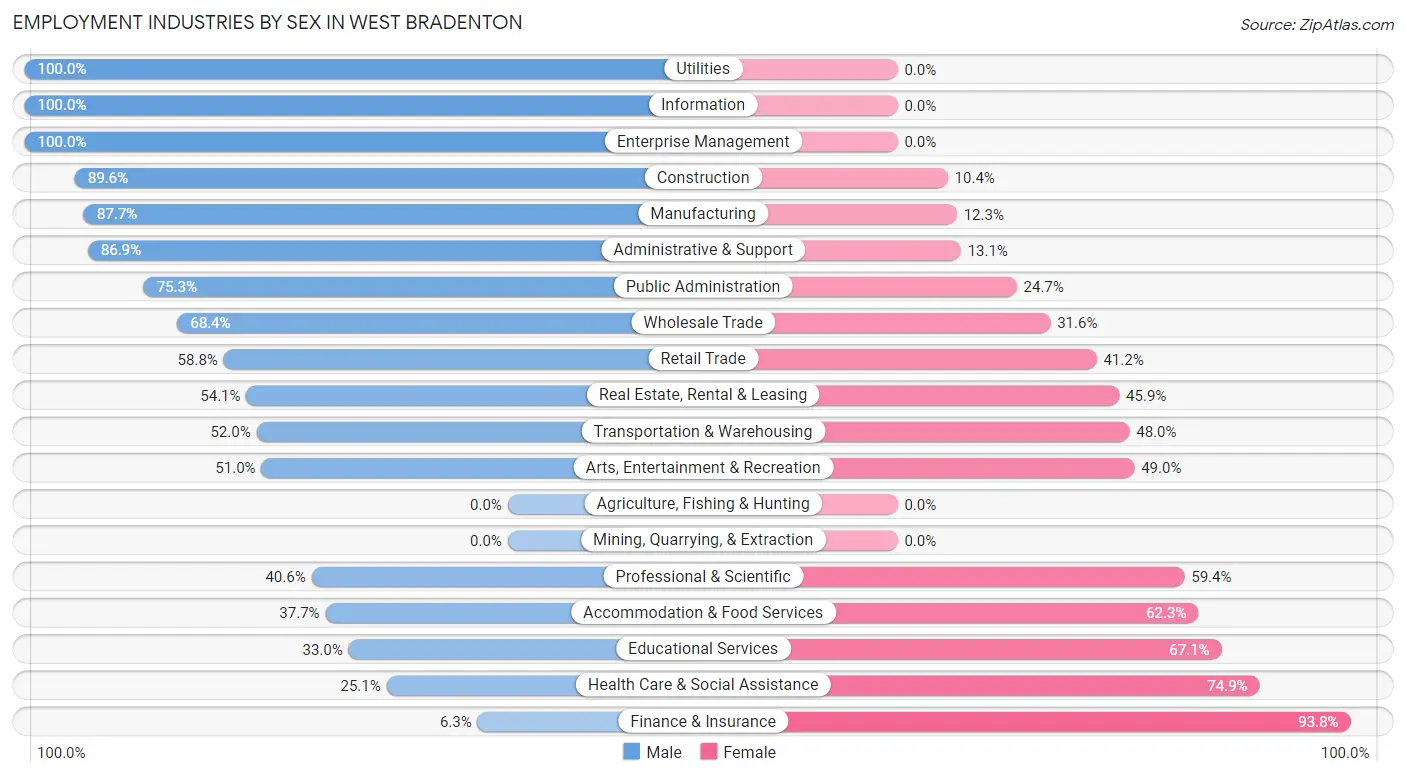
Employment Industries by Sex in West Bradenton
The West Bradenton industries that see more men than women are Utilities (100.0%), Information (100.0%), and Enterprise Management (100.0%), whereas the industries that tend to have a higher number of women are Finance & Insurance (93.8%), Health Care & Social Assistance (74.9%), and Educational Services (67.0%).
| Industry | Male | Female |
| Agriculture, Fishing & Hunting | 0 (0.0%) | 0 (0.0%) |
| Mining, Quarrying, & Extraction | 0 (0.0%) | 0 (0.0%) |
| Construction | 181 (89.6%) | 21 (10.4%) |
| Manufacturing | 100 (87.7%) | 14 (12.3%) |
| Wholesale Trade | 67 (68.4%) | 31 (31.6%) |
| Retail Trade | 157 (58.8%) | 110 (41.2%) |
| Transportation & Warehousing | 13 (52.0%) | 12 (48.0%) |
| Utilities | 60 (100.0%) | 0 (0.0%) |
| Information | 12 (100.0%) | 0 (0.0%) |
| Finance & Insurance | 7 (6.2%) | 105 (93.8%) |
| Real Estate, Rental & Leasing | 33 (54.1%) | 28 (45.9%) |
| Professional & Scientific | 39 (40.6%) | 57 (59.4%) |
| Enterprise Management | 13 (100.0%) | 0 (0.0%) |
| Administrative & Support | 73 (86.9%) | 11 (13.1%) |
| Educational Services | 58 (33.0%) | 118 (67.0%) |
| Health Care & Social Assistance | 79 (25.1%) | 236 (74.9%) |
| Arts, Entertainment & Recreation | 26 (51.0%) | 25 (49.0%) |
| Accommodation & Food Services | 40 (37.7%) | 66 (62.3%) |
| Public Administration | 113 (75.3%) | 37 (24.7%) |
| Total | 1,108 (55.2%) | 899 (44.8%) |
Education in West Bradenton
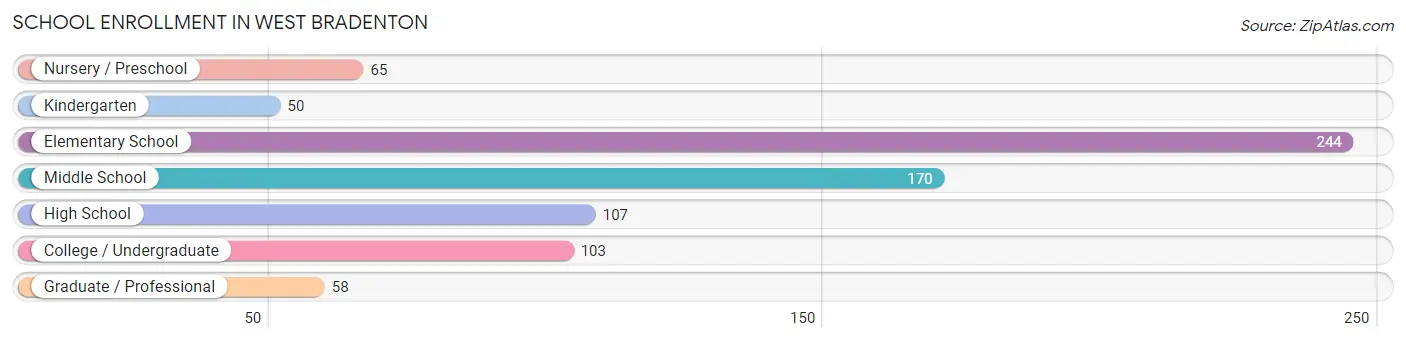
School Enrollment in West Bradenton
The most common levels of schooling among the 797 students in West Bradenton are elementary school (244 | 30.6%), middle school (170 | 21.3%), and high school (107 | 13.4%).
| School Level | # Students | % Students |
| Nursery / Preschool | 65 | 8.2% |
| Kindergarten | 50 | 6.3% |
| Elementary School | 244 | 30.6% |
| Middle School | 170 | 21.3% |
| High School | 107 | 13.4% |
| College / Undergraduate | 103 | 12.9% |
| Graduate / Professional | 58 | 7.3% |
| Total | 797 | 100.0% |
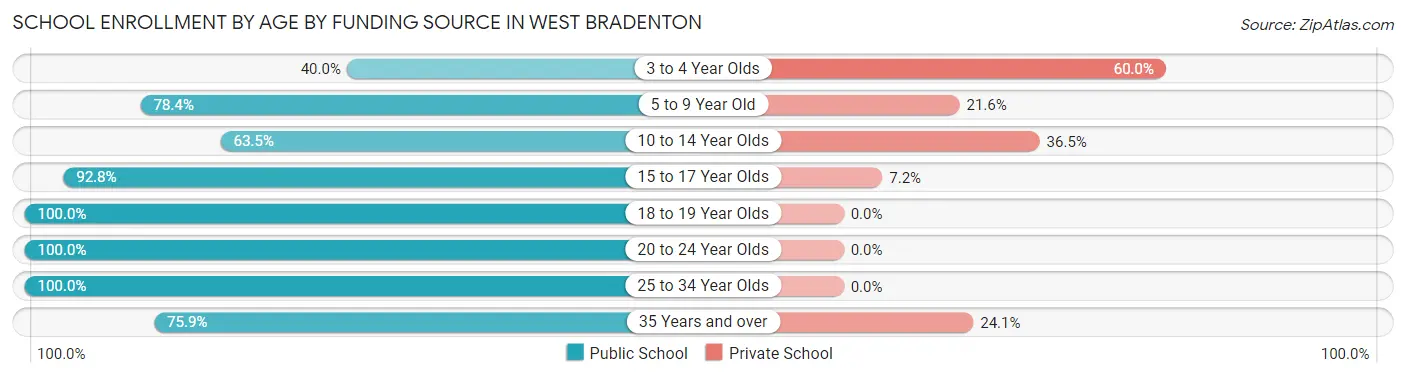
School Enrollment by Age by Funding Source in West Bradenton
Out of a total of 797 students who are enrolled in schools in West Bradenton, 184 (23.1%) attend a private institution, while the remaining 613 (76.9%) are enrolled in public schools. The age group of 3 to 4 year olds has the highest likelihood of being enrolled in private schools, with 39 (60.0% in the age bracket) enrolled. Conversely, the age group of 18 to 19 year olds has the lowest likelihood of being enrolled in a private school, with 52 (100.0% in the age bracket) attending a public institution.
| Age Bracket | Public School | Private School |
| 3 to 4 Year Olds | 26 (40.0%) | 39 (60.0%) |
| 5 to 9 Year Old | 207 (78.4%) | 57 (21.6%) |
| 10 to 14 Year Olds | 127 (63.5%) | 73 (36.5%) |
| 15 to 17 Year Olds | 103 (92.8%) | 8 (7.2%) |
| 18 to 19 Year Olds | 52 (100.0%) | 0 (0.0%) |
| 20 to 24 Year Olds | 18 (100.0%) | 0 (0.0%) |
| 25 to 34 Year Olds | 58 (100.0%) | 0 (0.0%) |
| 35 Years and over | 22 (75.9%) | 7 (24.1%) |
| Total | 613 (76.9%) | 184 (23.1%) |
Educational Attainment by Field of Study in West Bradenton
Business (350 | 36.4%), education (145 | 15.1%), science & technology (127 | 13.2%), social sciences (109 | 11.3%), and arts & humanities (59 | 6.1%) are the most common fields of study among 961 individuals in West Bradenton who have obtained a bachelor's degree or higher.
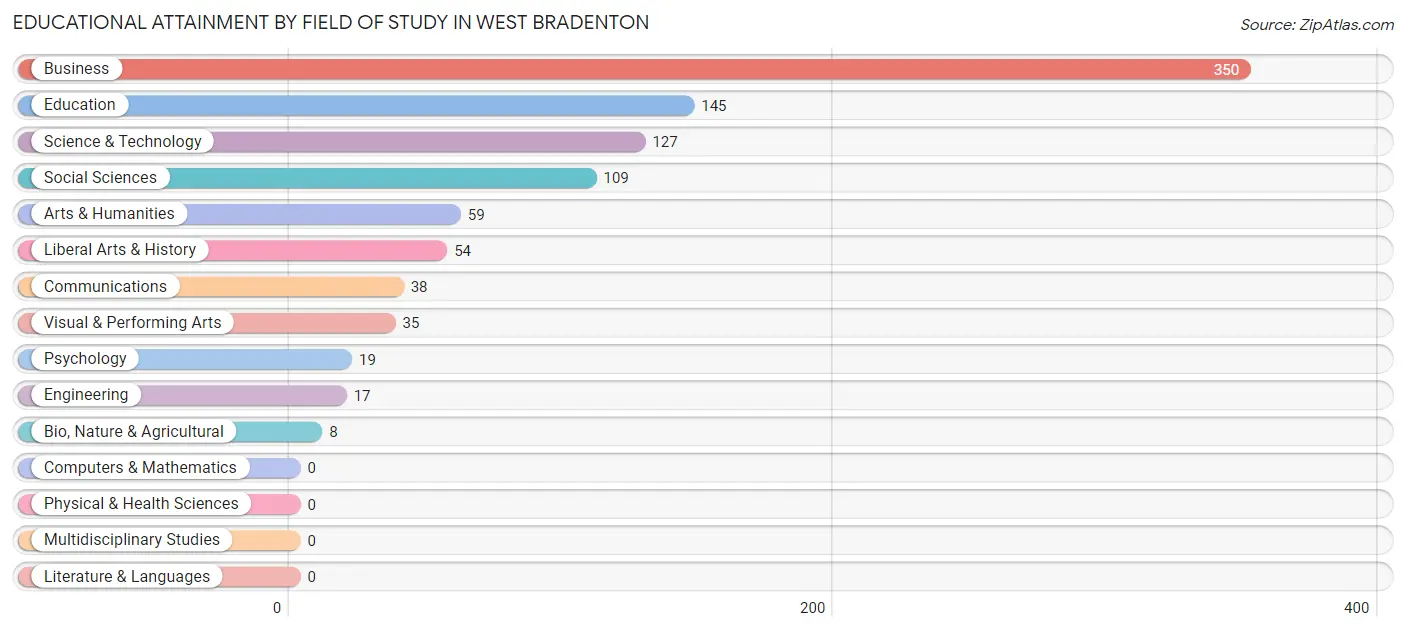
| Field of Study | # Graduates | % Graduates |
| Computers & Mathematics | 0 | 0.0% |
| Bio, Nature & Agricultural | 8 | 0.8% |
| Physical & Health Sciences | 0 | 0.0% |
| Psychology | 19 | 2.0% |
| Social Sciences | 109 | 11.3% |
| Engineering | 17 | 1.8% |
| Multidisciplinary Studies | 0 | 0.0% |
| Science & Technology | 127 | 13.2% |
| Business | 350 | 36.4% |
| Education | 145 | 15.1% |
| Literature & Languages | 0 | 0.0% |
| Liberal Arts & History | 54 | 5.6% |
| Visual & Performing Arts | 35 | 3.6% |
| Communications | 38 | 4.0% |
| Arts & Humanities | 59 | 6.1% |
| Total | 961 | 100.0% |
Transportation & Commute in West Bradenton
Vehicle Availability by Sex in West Bradenton
The most prevalent vehicle ownership categories in West Bradenton are males with 2 vehicles (607, accounting for 56.3%) and females with 2 vehicles (598, making up 70.5%).
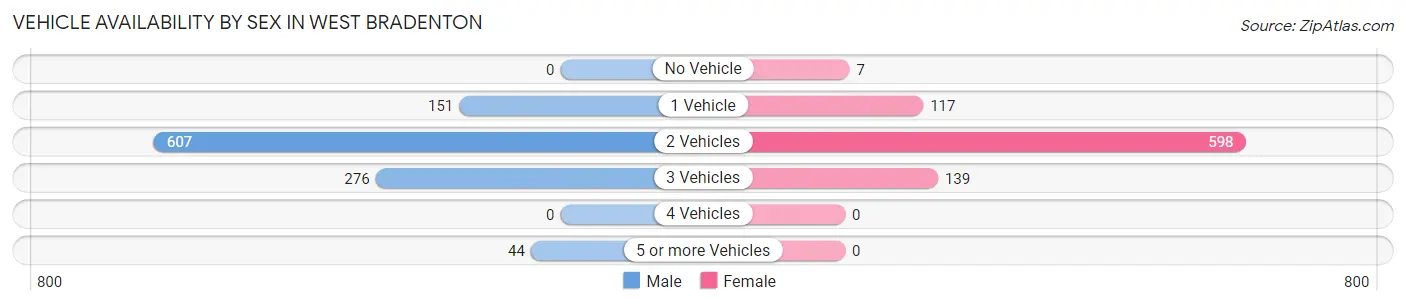
| Vehicles Available | Male | Female |
| No Vehicle | 0 (0.0%) | 7 (0.8%) |
| 1 Vehicle | 151 (14.0%) | 117 (13.6%) |
| 2 Vehicles | 607 (56.3%) | 598 (69.5%) |
| 3 Vehicles | 276 (25.6%) | 139 (16.1%) |
| 4 Vehicles | 0 (0.0%) | 0 (0.0%) |
| 5 or more Vehicles | 44 (4.1%) | 0 (0.0%) |
| Total | 1,078 (100.0%) | 861 (100.0%) |
Commute Time in West Bradenton
The most frequently occuring commute durations in West Bradenton are 15 to 19 minutes (300 commuters, 17.1%), 20 to 24 minutes (300 commuters, 17.1%), and 30 to 34 minutes (235 commuters, 13.4%).
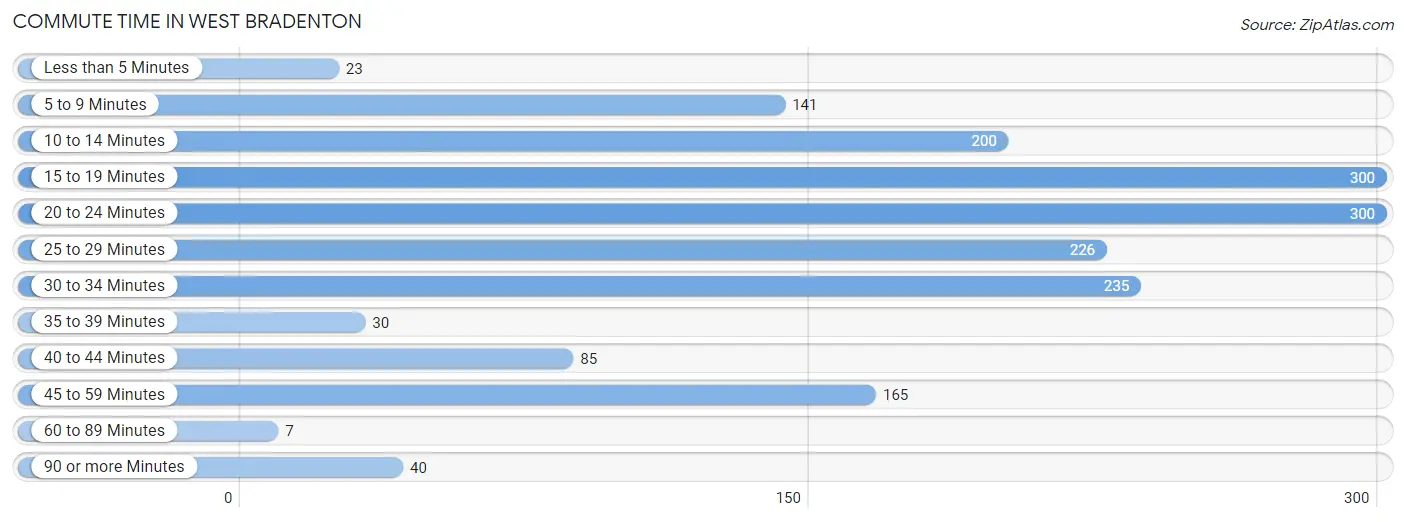
| Commute Time | # Commuters | % Commuters |
| Less than 5 Minutes | 23 | 1.3% |
| 5 to 9 Minutes | 141 | 8.1% |
| 10 to 14 Minutes | 200 | 11.4% |
| 15 to 19 Minutes | 300 | 17.1% |
| 20 to 24 Minutes | 300 | 17.1% |
| 25 to 29 Minutes | 226 | 12.9% |
| 30 to 34 Minutes | 235 | 13.4% |
| 35 to 39 Minutes | 30 | 1.7% |
| 40 to 44 Minutes | 85 | 4.9% |
| 45 to 59 Minutes | 165 | 9.4% |
| 60 to 89 Minutes | 7 | 0.4% |
| 90 or more Minutes | 40 | 2.3% |
Commute Time by Sex in West Bradenton
The most common commute times in West Bradenton are 25 to 29 minutes (226 commuters, 23.2%) for males and 15 to 19 minutes (187 commuters, 24.1%) for females.
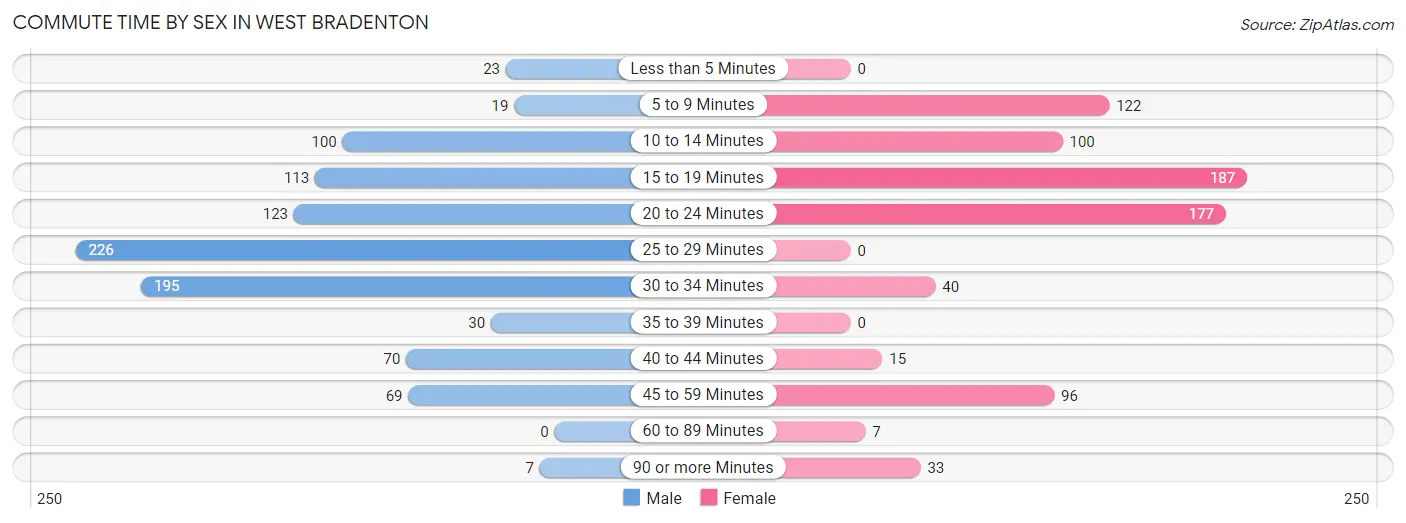
| Commute Time | Male | Female |
| Less than 5 Minutes | 23 (2.4%) | 0 (0.0%) |
| 5 to 9 Minutes | 19 (1.9%) | 122 (15.7%) |
| 10 to 14 Minutes | 100 (10.3%) | 100 (12.9%) |
| 15 to 19 Minutes | 113 (11.6%) | 187 (24.1%) |
| 20 to 24 Minutes | 123 (12.6%) | 177 (22.8%) |
| 25 to 29 Minutes | 226 (23.2%) | 0 (0.0%) |
| 30 to 34 Minutes | 195 (20.0%) | 40 (5.1%) |
| 35 to 39 Minutes | 30 (3.1%) | 0 (0.0%) |
| 40 to 44 Minutes | 70 (7.2%) | 15 (1.9%) |
| 45 to 59 Minutes | 69 (7.1%) | 96 (12.4%) |
| 60 to 89 Minutes | 0 (0.0%) | 7 (0.9%) |
| 90 or more Minutes | 7 (0.7%) | 33 (4.3%) |
Time of Departure to Work by Sex in West Bradenton
The most frequent times of departure to work in West Bradenton are 7:00 AM to 7:29 AM (325, 33.3%) for males and 7:30 AM to 7:59 AM (190, 24.4%) for females.
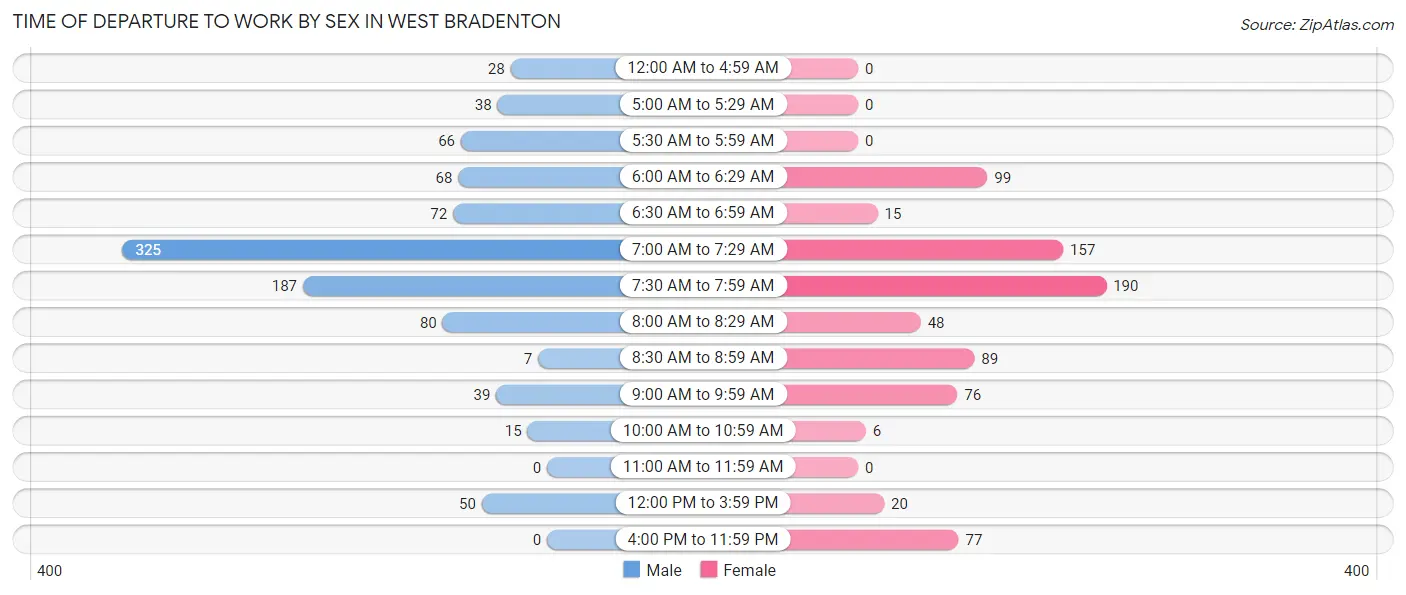
| Time of Departure | Male | Female |
| 12:00 AM to 4:59 AM | 28 (2.9%) | 0 (0.0%) |
| 5:00 AM to 5:29 AM | 38 (3.9%) | 0 (0.0%) |
| 5:30 AM to 5:59 AM | 66 (6.8%) | 0 (0.0%) |
| 6:00 AM to 6:29 AM | 68 (7.0%) | 99 (12.7%) |
| 6:30 AM to 6:59 AM | 72 (7.4%) | 15 (1.9%) |
| 7:00 AM to 7:29 AM | 325 (33.3%) | 157 (20.2%) |
| 7:30 AM to 7:59 AM | 187 (19.2%) | 190 (24.4%) |
| 8:00 AM to 8:29 AM | 80 (8.2%) | 48 (6.2%) |
| 8:30 AM to 8:59 AM | 7 (0.7%) | 89 (11.5%) |
| 9:00 AM to 9:59 AM | 39 (4.0%) | 76 (9.8%) |
| 10:00 AM to 10:59 AM | 15 (1.5%) | 6 (0.8%) |
| 11:00 AM to 11:59 AM | 0 (0.0%) | 0 (0.0%) |
| 12:00 PM to 3:59 PM | 50 (5.1%) | 20 (2.6%) |
| 4:00 PM to 11:59 PM | 0 (0.0%) | 77 (9.9%) |
| Total | 975 (100.0%) | 777 (100.0%) |
Housing Occupancy in West Bradenton
Occupancy by Ownership in West Bradenton
Of the total 1,470 dwellings in West Bradenton, owner-occupied units account for 1,261 (85.8%), while renter-occupied units make up 209 (14.2%).
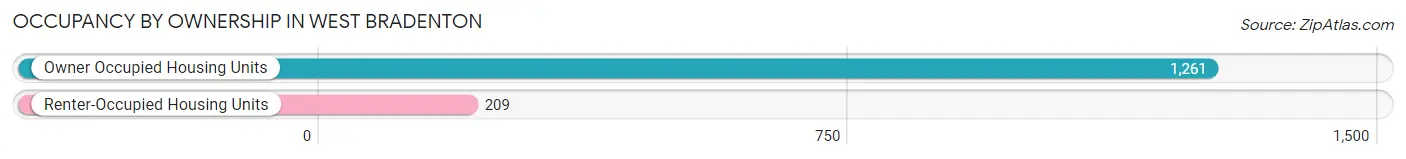
| Occupancy | # Housing Units | % Housing Units |
| Owner Occupied Housing Units | 1,261 | 85.8% |
| Renter-Occupied Housing Units | 209 | 14.2% |
| Total Occupied Housing Units | 1,470 | 100.0% |
Occupancy by Household Size in West Bradenton
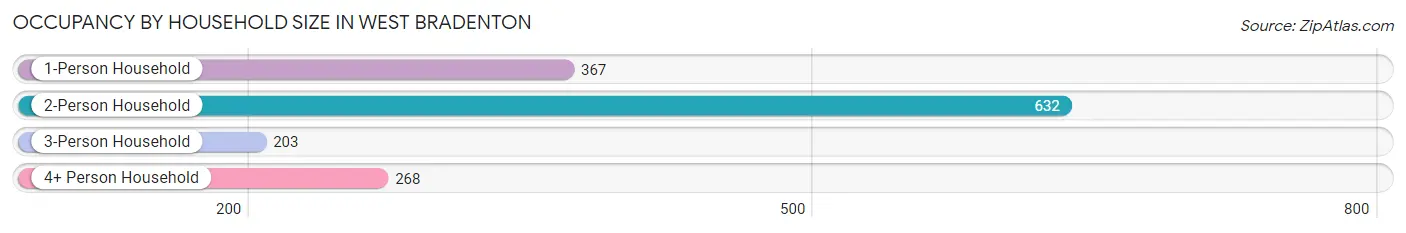
| Household Size | # Housing Units | % Housing Units |
| 1-Person Household | 367 | 25.0% |
| 2-Person Household | 632 | 43.0% |
| 3-Person Household | 203 | 13.8% |
| 4+ Person Household | 268 | 18.2% |
| Total Housing Units | 1,470 | 100.0% |
Occupancy by Ownership by Household Size in West Bradenton
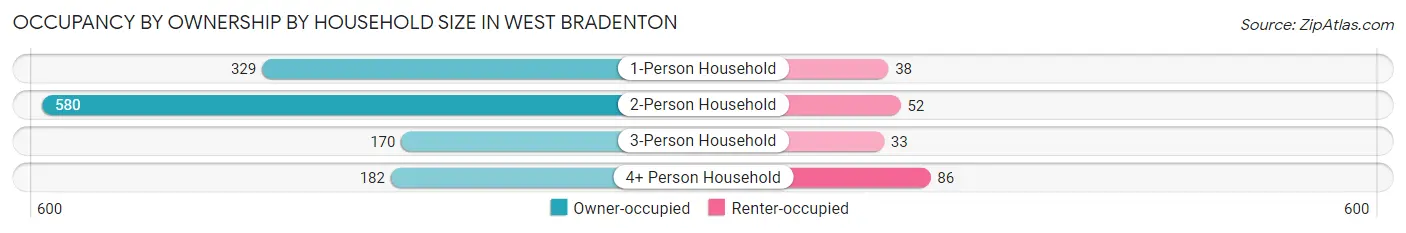
| Household Size | Owner-occupied | Renter-occupied |
| 1-Person Household | 329 (89.6%) | 38 (10.3%) |
| 2-Person Household | 580 (91.8%) | 52 (8.2%) |
| 3-Person Household | 170 (83.7%) | 33 (16.3%) |
| 4+ Person Household | 182 (67.9%) | 86 (32.1%) |
| Total Housing Units | 1,261 (85.8%) | 209 (14.2%) |
Occupancy by Educational Attainment in West Bradenton
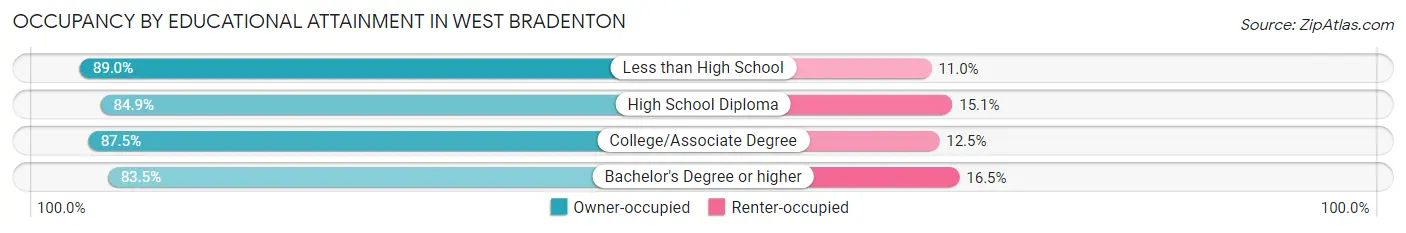
| Household Size | Owner-occupied | Renter-occupied |
| Less than High School | 65 (89.0%) | 8 (11.0%) |
| High School Diploma | 242 (84.9%) | 43 (15.1%) |
| College/Associate Degree | 559 (87.5%) | 80 (12.5%) |
| Bachelor's Degree or higher | 395 (83.5%) | 78 (16.5%) |
Occupancy by Age of Householder in West Bradenton
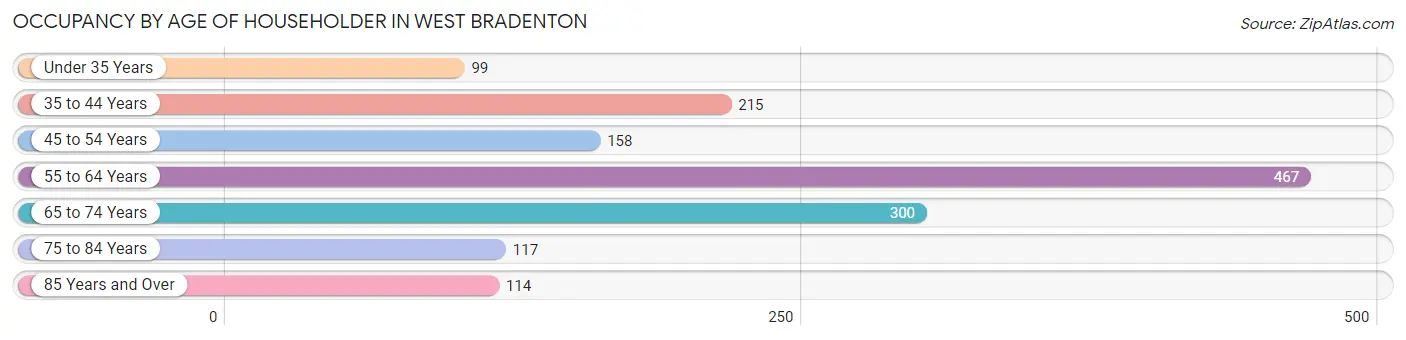
| Age Bracket | # Households | % Households |
| Under 35 Years | 99 | 6.7% |
| 35 to 44 Years | 215 | 14.6% |
| 45 to 54 Years | 158 | 10.7% |
| 55 to 64 Years | 467 | 31.8% |
| 65 to 74 Years | 300 | 20.4% |
| 75 to 84 Years | 117 | 8.0% |
| 85 Years and Over | 114 | 7.8% |
| Total | 1,470 | 100.0% |
Housing Finances in West Bradenton
Median Income by Occupancy in West Bradenton
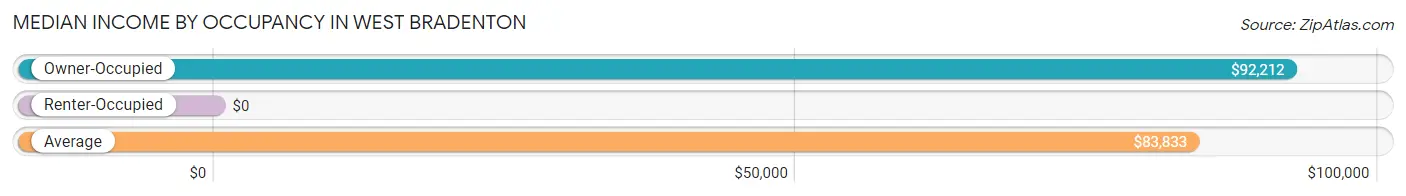
| Occupancy Type | # Households | Median Income |
| Owner-Occupied | 1,261 (85.8%) | $92,212 |
| Renter-Occupied | 209 (14.2%) | $0 |
| Average | 1,470 (100.0%) | $83,833 |
Occupancy by Householder Income Bracket in West Bradenton
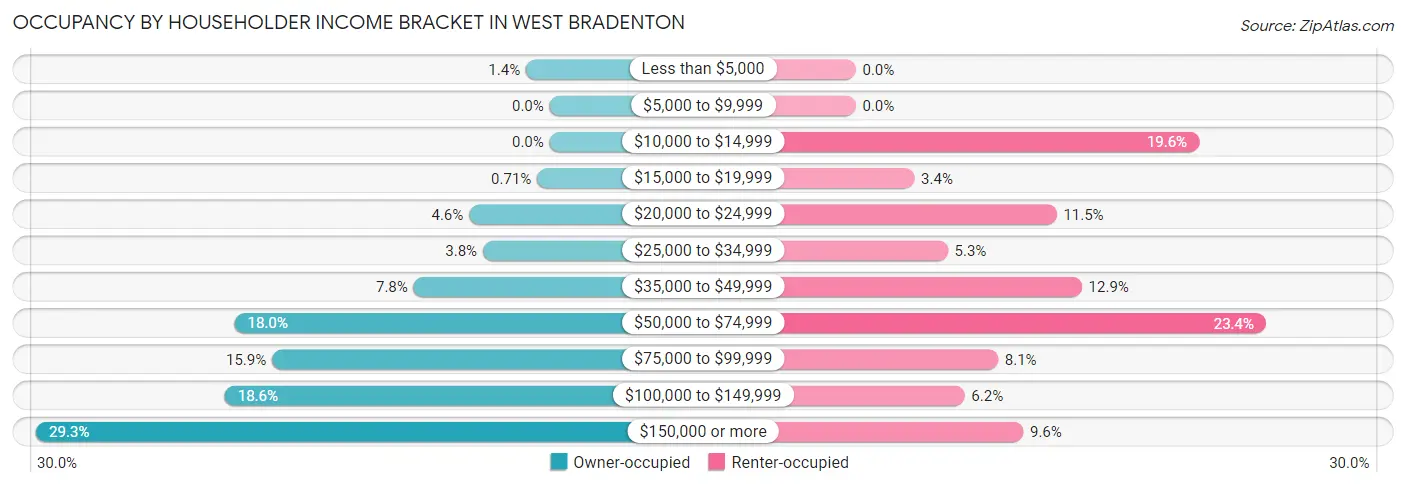
| Income Bracket | Owner-occupied | Renter-occupied |
| Less than $5,000 | 17 (1.3%) | 0 (0.0%) |
| $5,000 to $9,999 | 0 (0.0%) | 0 (0.0%) |
| $10,000 to $14,999 | 0 (0.0%) | 41 (19.6%) |
| $15,000 to $19,999 | 9 (0.7%) | 7 (3.4%) |
| $20,000 to $24,999 | 58 (4.6%) | 24 (11.5%) |
| $25,000 to $34,999 | 48 (3.8%) | 11 (5.3%) |
| $35,000 to $49,999 | 98 (7.8%) | 27 (12.9%) |
| $50,000 to $74,999 | 227 (18.0%) | 49 (23.4%) |
| $75,000 to $99,999 | 200 (15.9%) | 17 (8.1%) |
| $100,000 to $149,999 | 234 (18.6%) | 13 (6.2%) |
| $150,000 or more | 370 (29.3%) | 20 (9.6%) |
| Total | 1,261 (100.0%) | 209 (100.0%) |
Monthly Housing Cost Tiers in West Bradenton
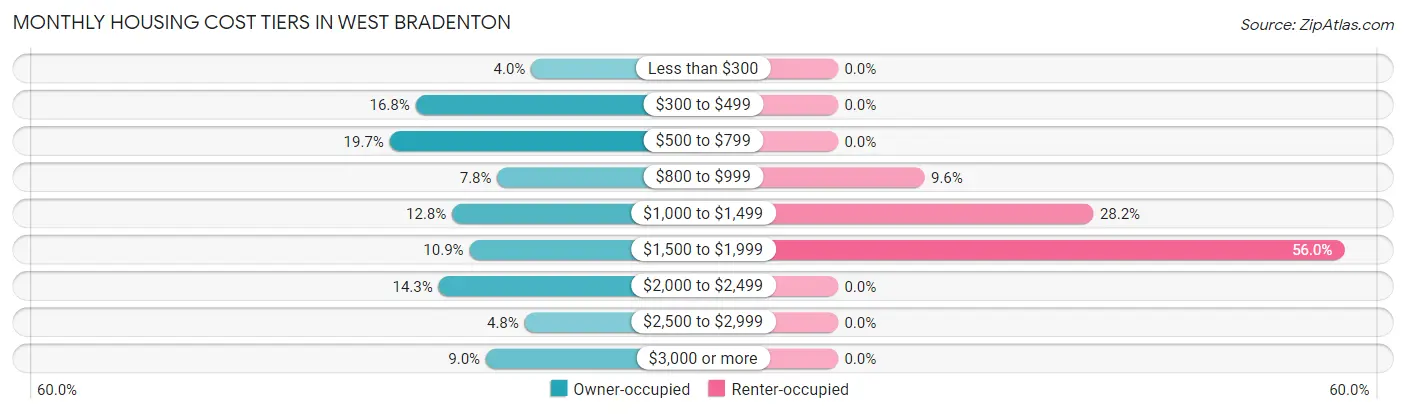
| Monthly Cost | Owner-occupied | Renter-occupied |
| Less than $300 | 51 (4.0%) | 0 (0.0%) |
| $300 to $499 | 212 (16.8%) | 0 (0.0%) |
| $500 to $799 | 248 (19.7%) | 0 (0.0%) |
| $800 to $999 | 98 (7.8%) | 20 (9.6%) |
| $1,000 to $1,499 | 161 (12.8%) | 59 (28.2%) |
| $1,500 to $1,999 | 137 (10.9%) | 117 (56.0%) |
| $2,000 to $2,499 | 180 (14.3%) | 0 (0.0%) |
| $2,500 to $2,999 | 60 (4.8%) | 0 (0.0%) |
| $3,000 or more | 114 (9.0%) | 0 (0.0%) |
| Total | 1,261 (100.0%) | 209 (100.0%) |
Physical Housing Characteristics in West Bradenton
Housing Structures in West Bradenton
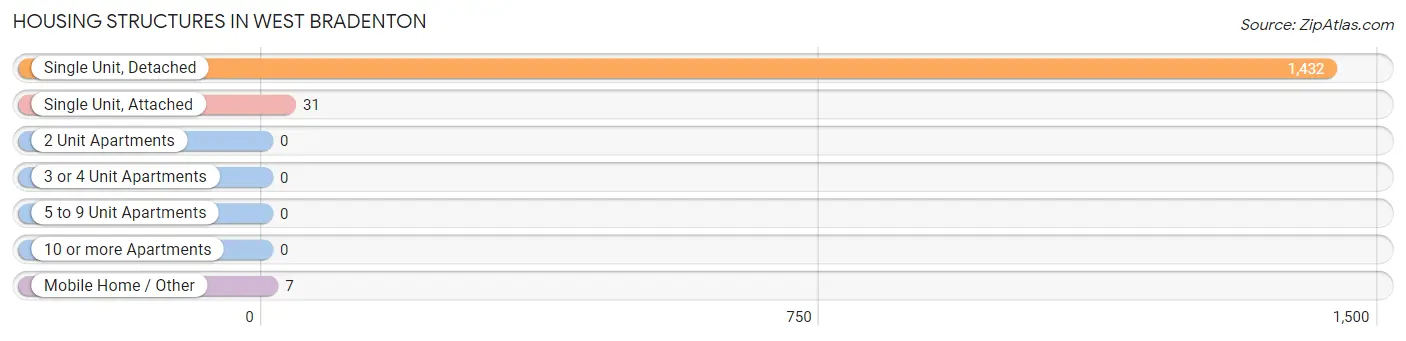
| Structure Type | # Housing Units | % Housing Units |
| Single Unit, Detached | 1,432 | 97.4% |
| Single Unit, Attached | 31 | 2.1% |
| 2 Unit Apartments | 0 | 0.0% |
| 3 or 4 Unit Apartments | 0 | 0.0% |
| 5 to 9 Unit Apartments | 0 | 0.0% |
| 10 or more Apartments | 0 | 0.0% |
| Mobile Home / Other | 7 | 0.5% |
| Total | 1,470 | 100.0% |
Housing Structures by Occupancy in West Bradenton
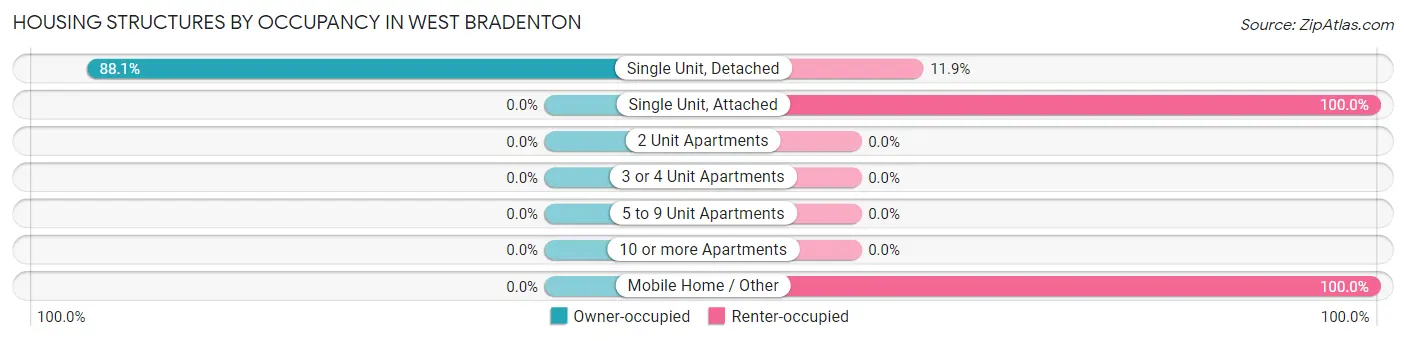
| Structure Type | Owner-occupied | Renter-occupied |
| Single Unit, Detached | 1,261 (88.1%) | 171 (11.9%) |
| Single Unit, Attached | 0 (0.0%) | 31 (100.0%) |
| 2 Unit Apartments | 0 (0.0%) | 0 (0.0%) |
| 3 or 4 Unit Apartments | 0 (0.0%) | 0 (0.0%) |
| 5 to 9 Unit Apartments | 0 (0.0%) | 0 (0.0%) |
| 10 or more Apartments | 0 (0.0%) | 0 (0.0%) |
| Mobile Home / Other | 0 (0.0%) | 7 (100.0%) |
| Total | 1,261 (85.8%) | 209 (14.2%) |
Housing Structures by Number of Rooms in West Bradenton
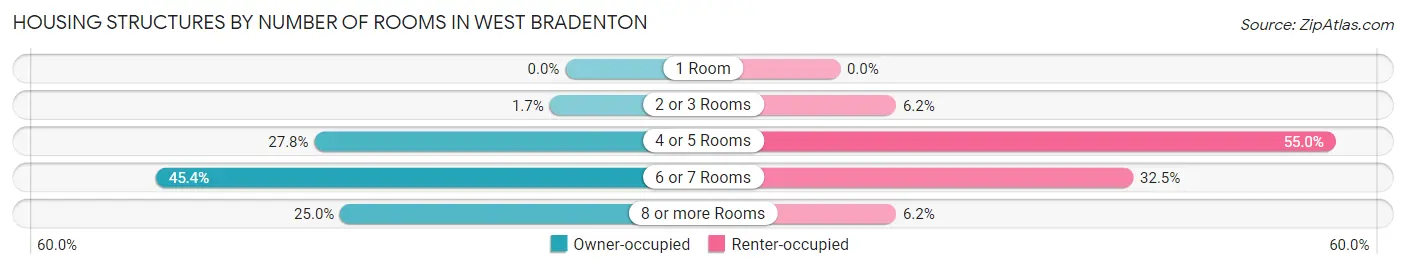
| Number of Rooms | Owner-occupied | Renter-occupied |
| 1 Room | 0 (0.0%) | 0 (0.0%) |
| 2 or 3 Rooms | 22 (1.7%) | 13 (6.2%) |
| 4 or 5 Rooms | 351 (27.8%) | 115 (55.0%) |
| 6 or 7 Rooms | 573 (45.4%) | 68 (32.5%) |
| 8 or more Rooms | 315 (25.0%) | 13 (6.2%) |
| Total | 1,261 (100.0%) | 209 (100.0%) |
Housing Structure by Heating Type in West Bradenton
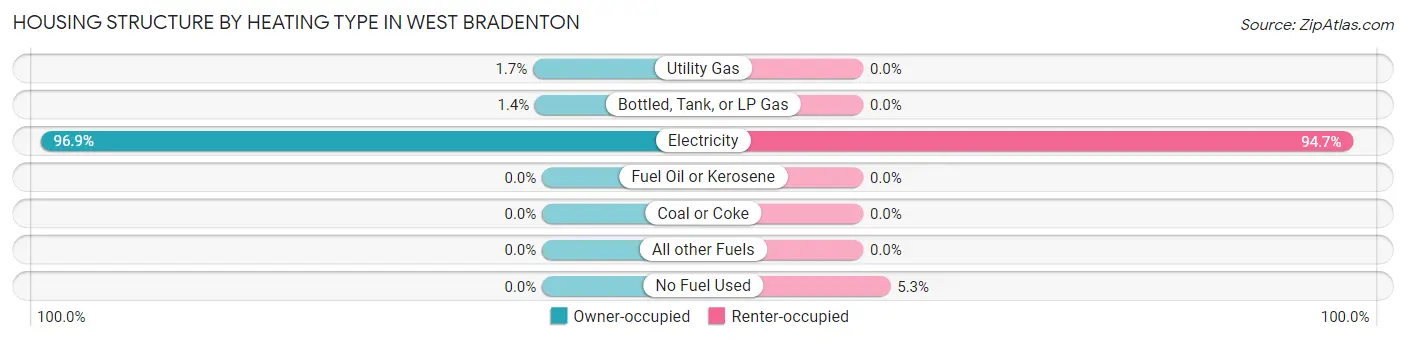
| Heating Type | Owner-occupied | Renter-occupied |
| Utility Gas | 22 (1.7%) | 0 (0.0%) |
| Bottled, Tank, or LP Gas | 17 (1.3%) | 0 (0.0%) |
| Electricity | 1,222 (96.9%) | 198 (94.7%) |
| Fuel Oil or Kerosene | 0 (0.0%) | 0 (0.0%) |
| Coal or Coke | 0 (0.0%) | 0 (0.0%) |
| All other Fuels | 0 (0.0%) | 0 (0.0%) |
| No Fuel Used | 0 (0.0%) | 11 (5.3%) |
| Total | 1,261 (100.0%) | 209 (100.0%) |
Household Vehicle Usage in West Bradenton
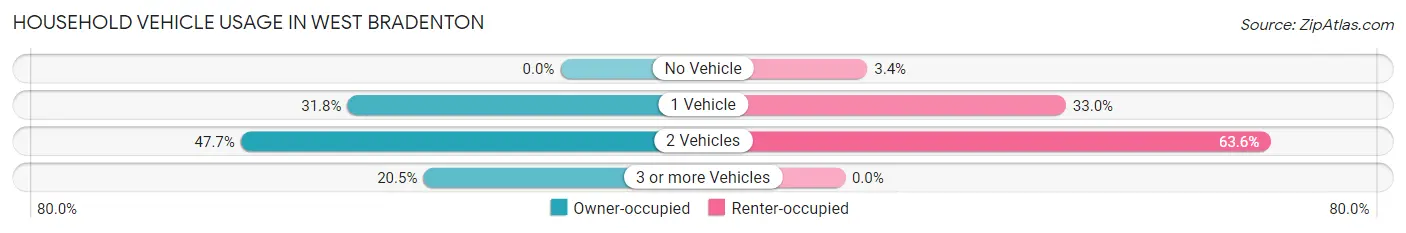
| Vehicles per Household | Owner-occupied | Renter-occupied |
| No Vehicle | 0 (0.0%) | 7 (3.4%) |
| 1 Vehicle | 401 (31.8%) | 69 (33.0%) |
| 2 Vehicles | 602 (47.7%) | 133 (63.6%) |
| 3 or more Vehicles | 258 (20.5%) | 0 (0.0%) |
| Total | 1,261 (100.0%) | 209 (100.0%) |
Real Estate & Mortgages in West Bradenton
Real Estate and Mortgage Overview in West Bradenton
| Characteristic | Without Mortgage | With Mortgage |
| Housing Units | 598 | 663 |
| Median Property Value | $333,800 | $350,800 |
| Median Household Income | $64,519 | $249 |
| Monthly Housing Costs | $547 | $82 |
| Real Estate Taxes | $1,881 | $0 |
Property Value by Mortgage Status in West Bradenton
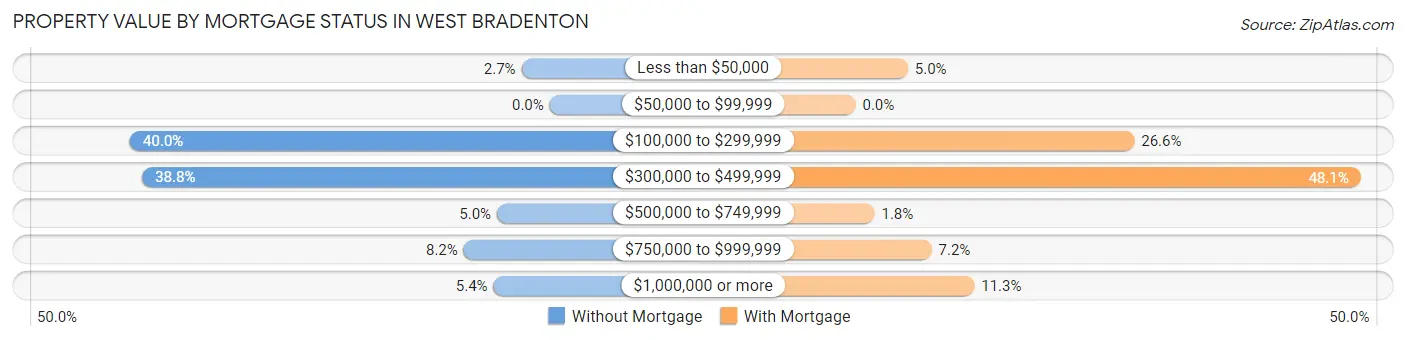
| Property Value | Without Mortgage | With Mortgage |
| Less than $50,000 | 16 (2.7%) | 33 (5.0%) |
| $50,000 to $99,999 | 0 (0.0%) | 0 (0.0%) |
| $100,000 to $299,999 | 239 (40.0%) | 176 (26.6%) |
| $300,000 to $499,999 | 232 (38.8%) | 319 (48.1%) |
| $500,000 to $749,999 | 30 (5.0%) | 12 (1.8%) |
| $750,000 to $999,999 | 49 (8.2%) | 48 (7.2%) |
| $1,000,000 or more | 32 (5.3%) | 75 (11.3%) |
| Total | 598 (100.0%) | 663 (100.0%) |
Household Income by Mortgage Status in West Bradenton
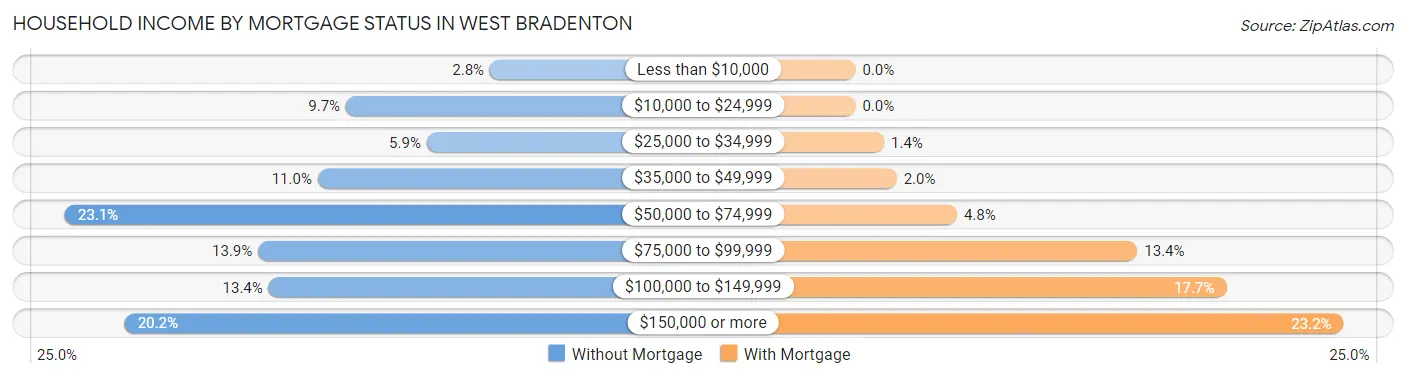
| Household Income | Without Mortgage | With Mortgage |
| Less than $10,000 | 17 (2.8%) | 0 (0.0%) |
| $10,000 to $24,999 | 58 (9.7%) | 0 (0.0%) |
| $25,000 to $34,999 | 35 (5.9%) | 9 (1.4%) |
| $35,000 to $49,999 | 66 (11.0%) | 13 (2.0%) |
| $50,000 to $74,999 | 138 (23.1%) | 32 (4.8%) |
| $75,000 to $99,999 | 83 (13.9%) | 89 (13.4%) |
| $100,000 to $149,999 | 80 (13.4%) | 117 (17.6%) |
| $150,000 or more | 121 (20.2%) | 154 (23.2%) |
| Total | 598 (100.0%) | 663 (100.0%) |
Property Value to Household Income Ratio in West Bradenton
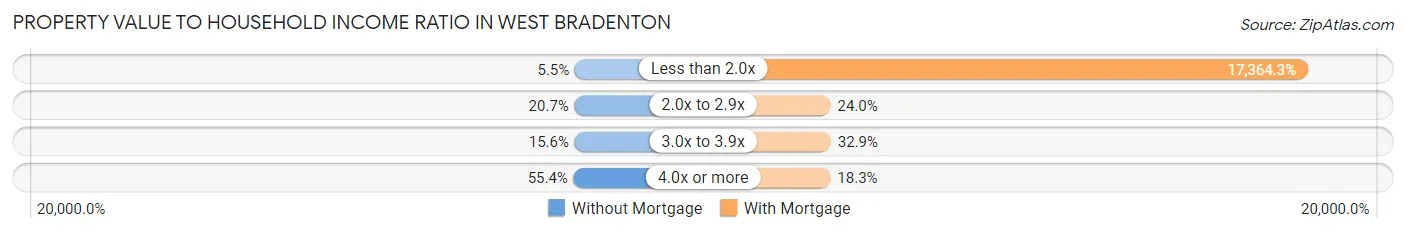
| Value-to-Income Ratio | Without Mortgage | With Mortgage |
| Less than 2.0x | 33 (5.5%) | 115,125 (17,364.3%) |
| 2.0x to 2.9x | 124 (20.7%) | 159 (24.0%) |
| 3.0x to 3.9x | 93 (15.5%) | 218 (32.9%) |
| 4.0x or more | 331 (55.3%) | 121 (18.2%) |
| Total | 598 (100.0%) | 663 (100.0%) |
Real Estate Taxes by Mortgage Status in West Bradenton
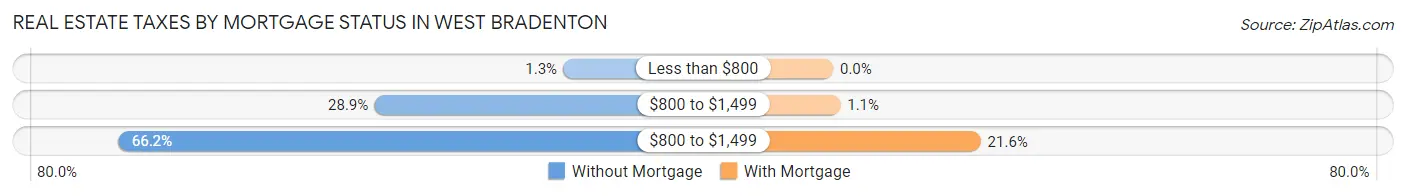
| Property Taxes | Without Mortgage | With Mortgage |
| Less than $800 | 8 (1.3%) | 0 (0.0%) |
| $800 to $1,499 | 173 (28.9%) | 7 (1.1%) |
| $800 to $1,499 | 396 (66.2%) | 143 (21.6%) |
| Total | 598 (100.0%) | 663 (100.0%) |
Health & Disability in West Bradenton
Health Insurance Coverage by Age in West Bradenton
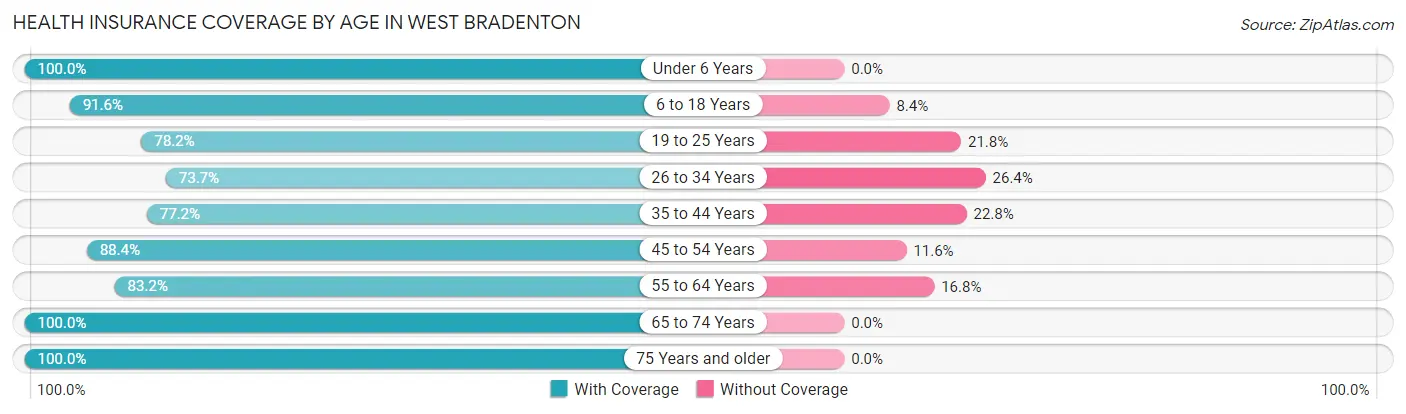
| Age Bracket | With Coverage | Without Coverage |
| Under 6 Years | 267 (100.0%) | 0 (0.0%) |
| 6 to 18 Years | 555 (91.6%) | 51 (8.4%) |
| 19 to 25 Years | 176 (78.2%) | 49 (21.8%) |
| 26 to 34 Years | 218 (73.7%) | 78 (26.4%) |
| 35 to 44 Years | 332 (77.2%) | 98 (22.8%) |
| 45 to 54 Years | 351 (88.4%) | 46 (11.6%) |
| 55 to 64 Years | 695 (83.2%) | 140 (16.8%) |
| 65 to 74 Years | 501 (100.0%) | 0 (0.0%) |
| 75 Years and older | 378 (100.0%) | 0 (0.0%) |
| Total | 3,473 (88.3%) | 462 (11.7%) |
Health Insurance Coverage by Citizenship Status in West Bradenton
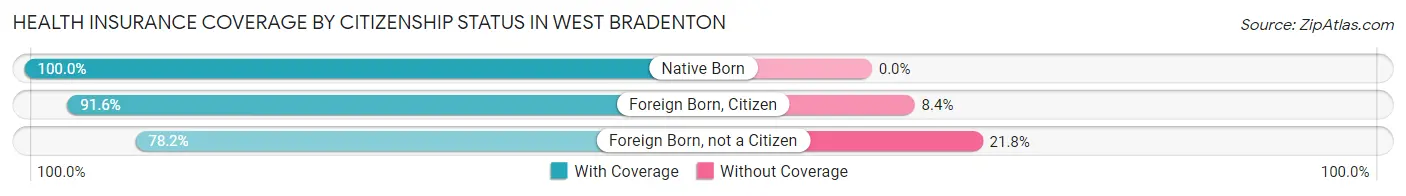
| Citizenship Status | With Coverage | Without Coverage |
| Native Born | 267 (100.0%) | 0 (0.0%) |
| Foreign Born, Citizen | 555 (91.6%) | 51 (8.4%) |
| Foreign Born, not a Citizen | 176 (78.2%) | 49 (21.8%) |
Health Insurance Coverage by Household Income in West Bradenton
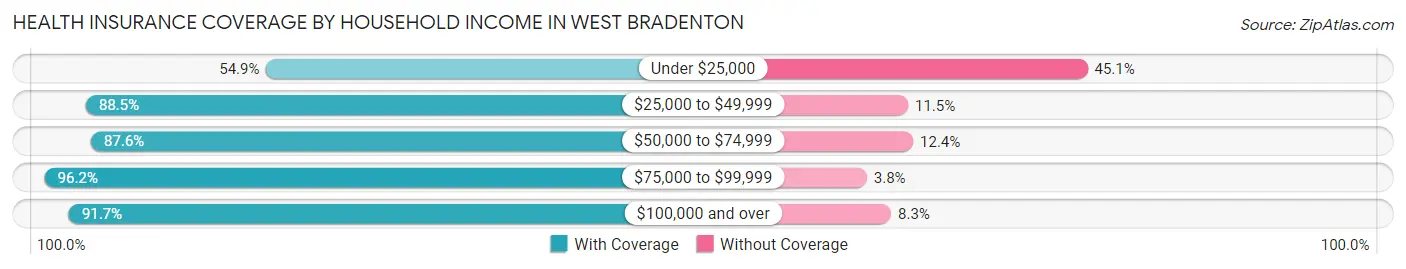
| Household Income | With Coverage | Without Coverage |
| Under $25,000 | 185 (54.9%) | 152 (45.1%) |
| $25,000 to $49,999 | 247 (88.5%) | 32 (11.5%) |
| $50,000 to $74,999 | 634 (87.6%) | 90 (12.4%) |
| $75,000 to $99,999 | 563 (96.2%) | 22 (3.8%) |
| $100,000 and over | 1,833 (91.7%) | 166 (8.3%) |
Public vs Private Health Insurance Coverage by Age in West Bradenton
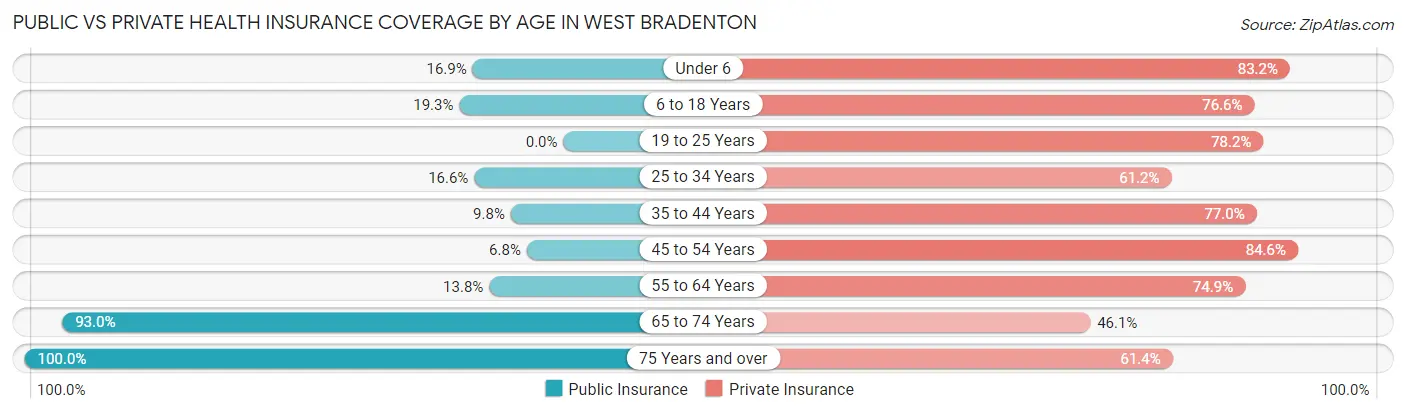
| Age Bracket | Public Insurance | Private Insurance |
| Under 6 | 45 (16.9%) | 222 (83.2%) |
| 6 to 18 Years | 117 (19.3%) | 464 (76.6%) |
| 19 to 25 Years | 0 (0.0%) | 176 (78.2%) |
| 25 to 34 Years | 49 (16.6%) | 181 (61.2%) |
| 35 to 44 Years | 42 (9.8%) | 331 (77.0%) |
| 45 to 54 Years | 27 (6.8%) | 336 (84.6%) |
| 55 to 64 Years | 115 (13.8%) | 625 (74.9%) |
| 65 to 74 Years | 466 (93.0%) | 231 (46.1%) |
| 75 Years and over | 378 (100.0%) | 232 (61.4%) |
| Total | 1,239 (31.5%) | 2,798 (71.1%) |
Disability Status by Sex by Age in West Bradenton
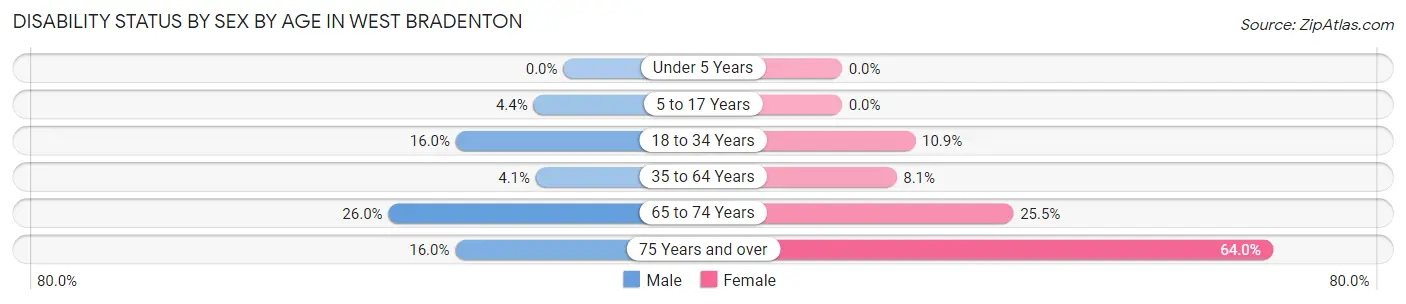
| Age Bracket | Male | Female |
| Under 5 Years | 0 (0.0%) | 0 (0.0%) |
| 5 to 17 Years | 13 (4.4%) | 0 (0.0%) |
| 18 to 34 Years | 45 (16.0%) | 32 (10.9%) |
| 35 to 64 Years | 34 (4.1%) | 67 (8.1%) |
| 65 to 74 Years | 73 (26.0%) | 56 (25.5%) |
| 75 Years and over | 17 (16.0%) | 174 (64.0%) |
Disability Class by Sex by Age in West Bradenton
Disability Class: Hearing Difficulty
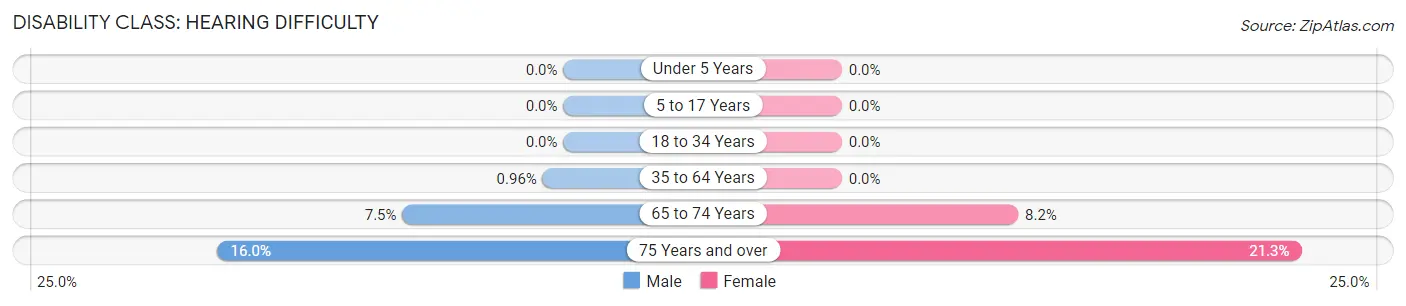
| Age Bracket | Male | Female |
| Under 5 Years | 0 (0.0%) | 0 (0.0%) |
| 5 to 17 Years | 0 (0.0%) | 0 (0.0%) |
| 18 to 34 Years | 0 (0.0%) | 0 (0.0%) |
| 35 to 64 Years | 8 (1.0%) | 0 (0.0%) |
| 65 to 74 Years | 21 (7.5%) | 18 (8.2%) |
| 75 Years and over | 17 (16.0%) | 58 (21.3%) |
Disability Class: Vision Difficulty
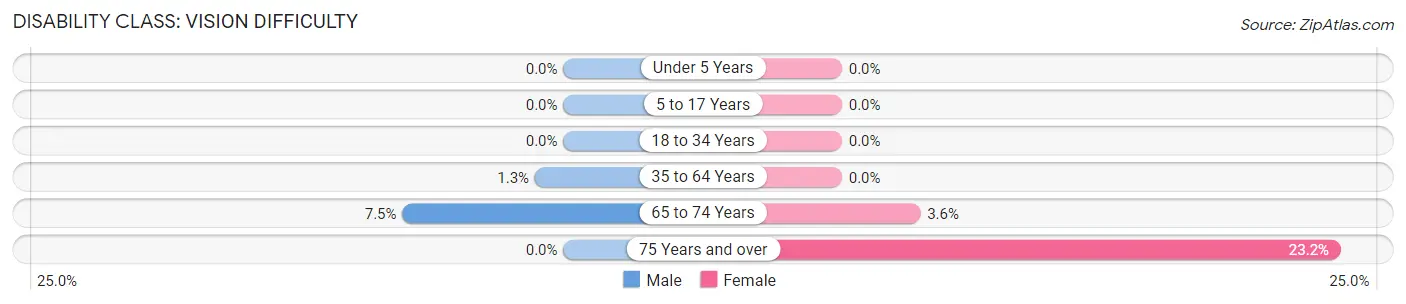
| Age Bracket | Male | Female |
| Under 5 Years | 0 (0.0%) | 0 (0.0%) |
| 5 to 17 Years | 0 (0.0%) | 0 (0.0%) |
| 18 to 34 Years | 0 (0.0%) | 0 (0.0%) |
| 35 to 64 Years | 11 (1.3%) | 0 (0.0%) |
| 65 to 74 Years | 21 (7.5%) | 8 (3.6%) |
| 75 Years and over | 0 (0.0%) | 63 (23.2%) |
Disability Class: Cognitive Difficulty
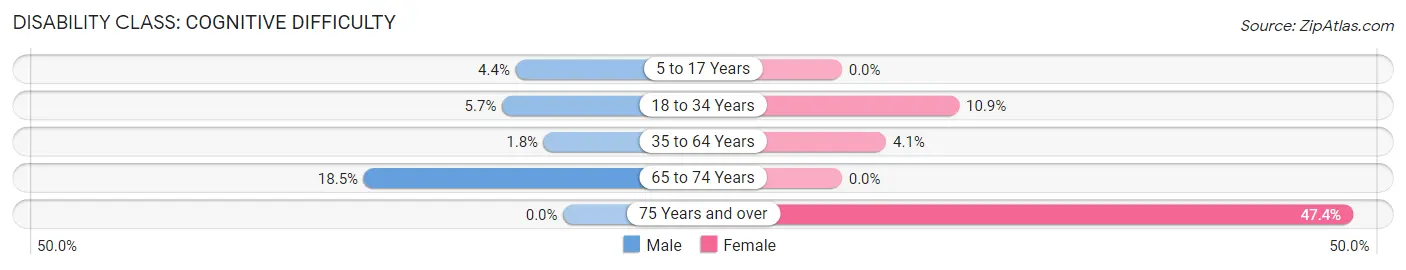
| Age Bracket | Male | Female |
| 5 to 17 Years | 13 (4.4%) | 0 (0.0%) |
| 18 to 34 Years | 16 (5.7%) | 32 (10.9%) |
| 35 to 64 Years | 15 (1.8%) | 34 (4.1%) |
| 65 to 74 Years | 52 (18.5%) | 0 (0.0%) |
| 75 Years and over | 0 (0.0%) | 129 (47.4%) |
Disability Class: Ambulatory Difficulty
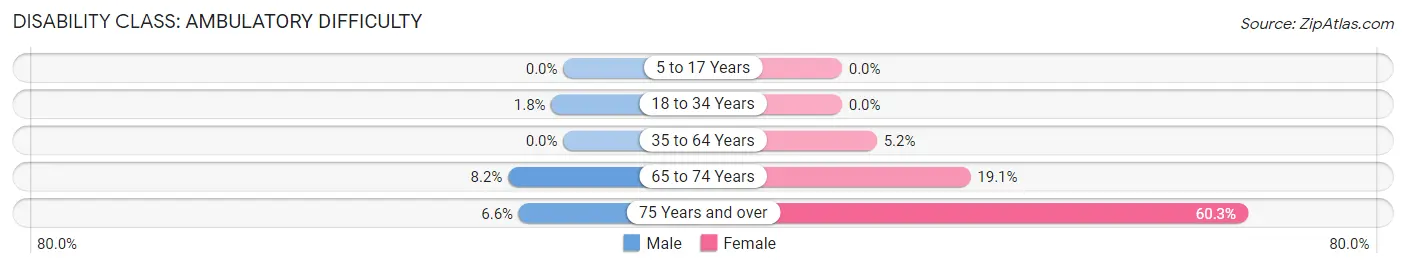
| Age Bracket | Male | Female |
| 5 to 17 Years | 0 (0.0%) | 0 (0.0%) |
| 18 to 34 Years | 5 (1.8%) | 0 (0.0%) |
| 35 to 64 Years | 0 (0.0%) | 43 (5.2%) |
| 65 to 74 Years | 23 (8.2%) | 42 (19.1%) |
| 75 Years and over | 7 (6.6%) | 164 (60.3%) |
Disability Class: Self-Care Difficulty
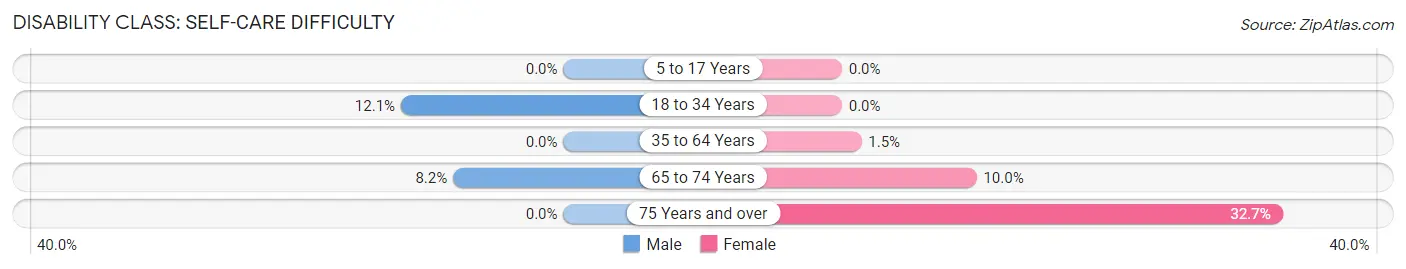
| Age Bracket | Male | Female |
| 5 to 17 Years | 0 (0.0%) | 0 (0.0%) |
| 18 to 34 Years | 34 (12.1%) | 0 (0.0%) |
| 35 to 64 Years | 0 (0.0%) | 12 (1.5%) |
| 65 to 74 Years | 23 (8.2%) | 22 (10.0%) |
| 75 Years and over | 0 (0.0%) | 89 (32.7%) |
Technology Access in West Bradenton
Computing Device Access in West Bradenton
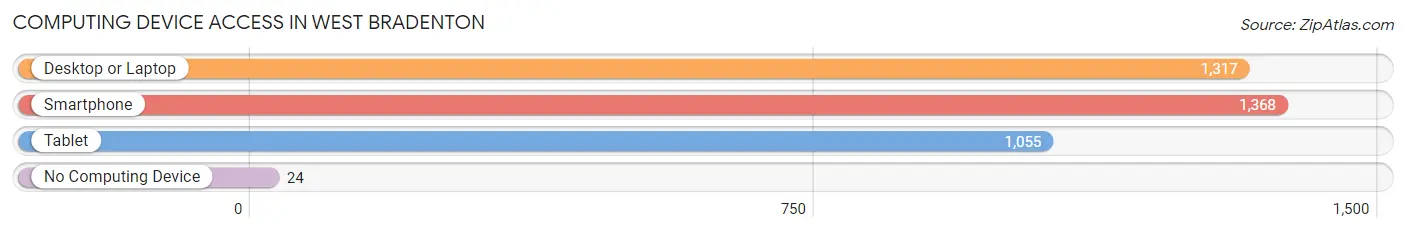
| Device Type | # Households | % Households |
| Desktop or Laptop | 1,317 | 89.6% |
| Smartphone | 1,368 | 93.1% |
| Tablet | 1,055 | 71.8% |
| No Computing Device | 24 | 1.6% |
| Total | 1,470 | 100.0% |
Internet Access in West Bradenton
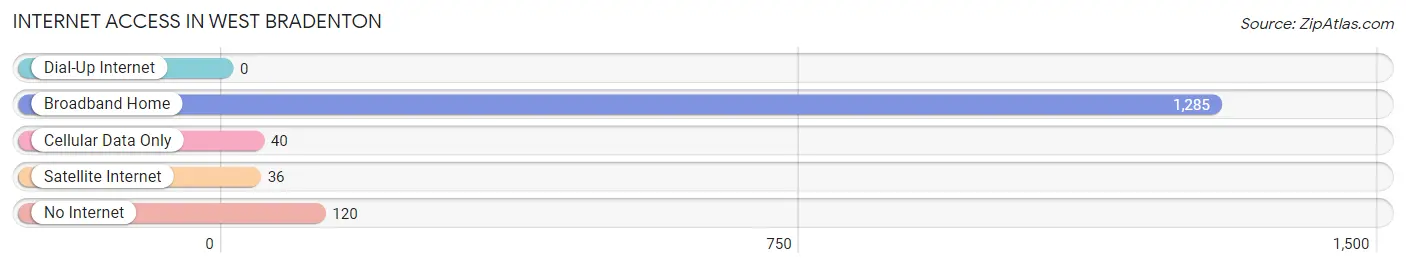
| Internet Type | # Households | % Households |
| Dial-Up Internet | 0 | 0.0% |
| Broadband Home | 1,285 | 87.4% |
| Cellular Data Only | 40 | 2.7% |
| Satellite Internet | 36 | 2.5% |
| No Internet | 120 | 8.2% |
| Total | 1,470 | 100.0% |
West Bradenton Summary
Bradenton, Florida is a city located in Manatee County, Florida, United States. It is the county seat of Manatee County and is located on the Gulf Coast of Florida, about 30 miles south of Tampa. The population of Bradenton was 51,741 at the 2010 census, making it the largest city in Manatee County.
History
Bradenton was founded in 1842 by Joseph Braden, a settler from Georgia. Braden named the city after himself and it quickly became a popular destination for settlers from the north. The city was incorporated in 1903 and has since grown to become the largest city in Manatee County.
In the early 1900s, Bradenton was a popular tourist destination for wealthy northerners. The city was home to several large resorts, including the Palmetto Hotel, which was built in 1910 and was one of the largest hotels in the state.
In the 1920s, the city experienced a period of growth and development. The city was home to several large industries, including a cigar factory, a canning factory, and a shipbuilding company. The city also became a popular destination for winter visitors, who came to enjoy the warm climate and the city's many attractions.
In the 1950s, Bradenton experienced a period of decline as the city's industries began to move away. The city's population decreased and the city's economy suffered. However, in the late 1970s, the city began to experience a period of revitalization. The city's downtown area was revitalized and new businesses began to move into the area.
Geography
Bradenton is located in Manatee County, Florida, on the Gulf Coast of Florida. The city is located on the Manatee River, which flows into the Gulf of Mexico. The city is located about 30 miles south of Tampa and about 50 miles north of Sarasota.
The city has a total area of 24.2 square miles, of which 22.2 square miles is land and 2.0 square miles is water. The city is located at an elevation of 17 feet above sea level.
Economy
Bradenton's economy is largely based on tourism and services. The city is home to several large resorts, including the Palmetto Hotel, which is one of the largest hotels in the state. The city is also home to several large industries, including a cigar factory, a canning factory, and a shipbuilding company.
The city is also home to several large retail stores, including Walmart, Target, and Publix. The city is also home to several large medical centers, including Manatee Memorial Hospital and Blake Medical Center.
Demographics
As of the 2010 census, Bradenton had a population of 51,741. The racial makeup of the city was 75.3% White, 15.2% African American, 0.4% Native American, 1.7% Asian, 0.1% Pacific Islander, 4.7% from other races, and 2.6% from two or more races. Hispanic or Latino of any race were 16.2% of the population.
The median income for a household in the city was $37,837, and the median income for a family was $45,837. The per capita income for the city was $21,837. About 14.2% of families and 17.7% of the population were below the poverty line, including 25.2% of those under age 18 and 8.7% of those age 65 or over.
Common Questions
What is Per Capita Income in West Bradenton?
Per Capita income in West Bradenton is $46,680.
What is the Median Family Income in West Bradenton?
Median Family Income in West Bradenton is $102,639.
What is the Median Household income in West Bradenton?
Median Household Income in West Bradenton is $83,833.
What is Income or Wage Gap in West Bradenton?
Income or Wage Gap in West Bradenton is 21.4%.
Women in West Bradenton earn 78.6 cents for every dollar earned by a man.
What is Family Income Deficit in West Bradenton?
Family Income Deficit in West Bradenton is $5,646.
Families that are below poverty line in West Bradenton earn $5,646 less on average than the poverty threshold level.
What is Inequality or Gini Index in West Bradenton?
Inequality or Gini Index in West Bradenton is 0.43.
What is the Total Population of West Bradenton?
Total Population of West Bradenton is 3,935.
What is the Total Male Population of West Bradenton?
Total Male Population of West Bradenton is 1,967.
What is the Total Female Population of West Bradenton?
Total Female Population of West Bradenton is 1,968.
What is the Ratio of Males per 100 Females in West Bradenton?
There are 99.95 Males per 100 Females in West Bradenton.
What is the Ratio of Females per 100 Males in West Bradenton?
There are 100.05 Females per 100 Males in West Bradenton.
What is the Median Population Age in West Bradenton?
Median Population Age in West Bradenton is 47.9 Years.
What is the Average Family Size in West Bradenton
Average Family Size in West Bradenton is 3.1 People.
What is the Average Household Size in West Bradenton
Average Household Size in West Bradenton is 2.7 People.
How Large is the Labor Force in West Bradenton?
There are 2,092 People in the Labor Forcein in West Bradenton.
What is the Percentage of People in the Labor Force in West Bradenton?
65.9% of People are in the Labor Force in West Bradenton.
What is the Unemployment Rate in West Bradenton?
Unemployment Rate in West Bradenton is 4.0%.