Bunnell, FL Map & Demographics
Bunnell Map
Bunnell Overview
$25,278
PER CAPITA INCOME
$57,159
AVG FAMILY INCOME
$42,831
AVG HOUSEHOLD INCOME
25.0%
WAGE / INCOME GAP [ % ]
75.0¢/ $1
WAGE / INCOME GAP [ $ ]
0.44
INEQUALITY / GINI INDEX
3,355
TOTAL POPULATION
1,494
MALE POPULATION
1,861
FEMALE POPULATION
80.28
MALES / 100 FEMALES
124.56
FEMALES / 100 MALES
51.4
MEDIAN AGE
3.1
AVG FAMILY SIZE
2.2
AVG HOUSEHOLD SIZE
1,222
LABOR FORCE [ PEOPLE ]
43.2%
PERCENT IN LABOR FORCE
3.8%
UNEMPLOYMENT RATE
Bunnell Zip Codes
Bunnell Area Codes
Income in Bunnell
Income Overview in Bunnell
Per Capita Income in Bunnell is $25,278, while median incomes of families and households are $57,159 and $42,831 respectively.
| Characteristic | Number | Measure |
| Per Capita Income | 3,355 | $25,278 |
| Median Family Income | 675 | $57,159 |
| Mean Family Income | 675 | $67,689 |
| Median Household Income | 1,468 | $42,831 |
| Mean Household Income | 1,468 | $53,218 |
| Income Deficit | 675 | $0 |
| Wage / Income Gap (%) | 3,355 | 25.04% |
| Wage / Income Gap ($) | 3,355 | 74.96¢ per $1 |
| Gini / Inequality Index | 3,355 | 0.44 |
Earnings by Sex in Bunnell
Average Earnings in Bunnell are $27,370, $35,769 for men and $26,812 for women, a difference of 25.0%.
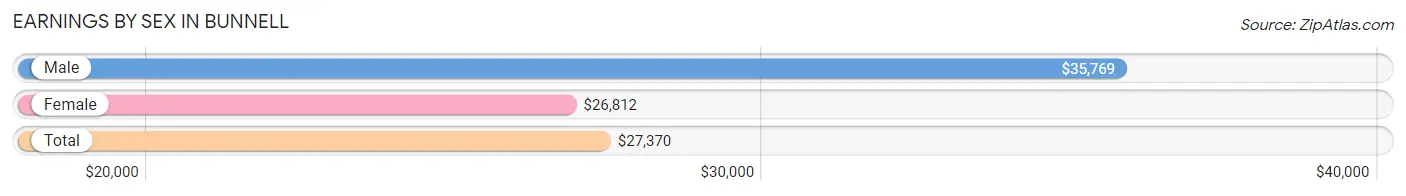
| Sex | Number | Average Earnings |
| Male | 668 (52.0%) | $35,769 |
| Female | 617 (48.0%) | $26,812 |
| Total | 1,285 (100.0%) | $27,370 |
Earnings by Sex by Income Bracket in Bunnell
The most common earnings brackets in Bunnell are $75,000 to $99,999 for men (100 | 15.0%) and $25,000 to $29,999 for women (111 | 18.0%).
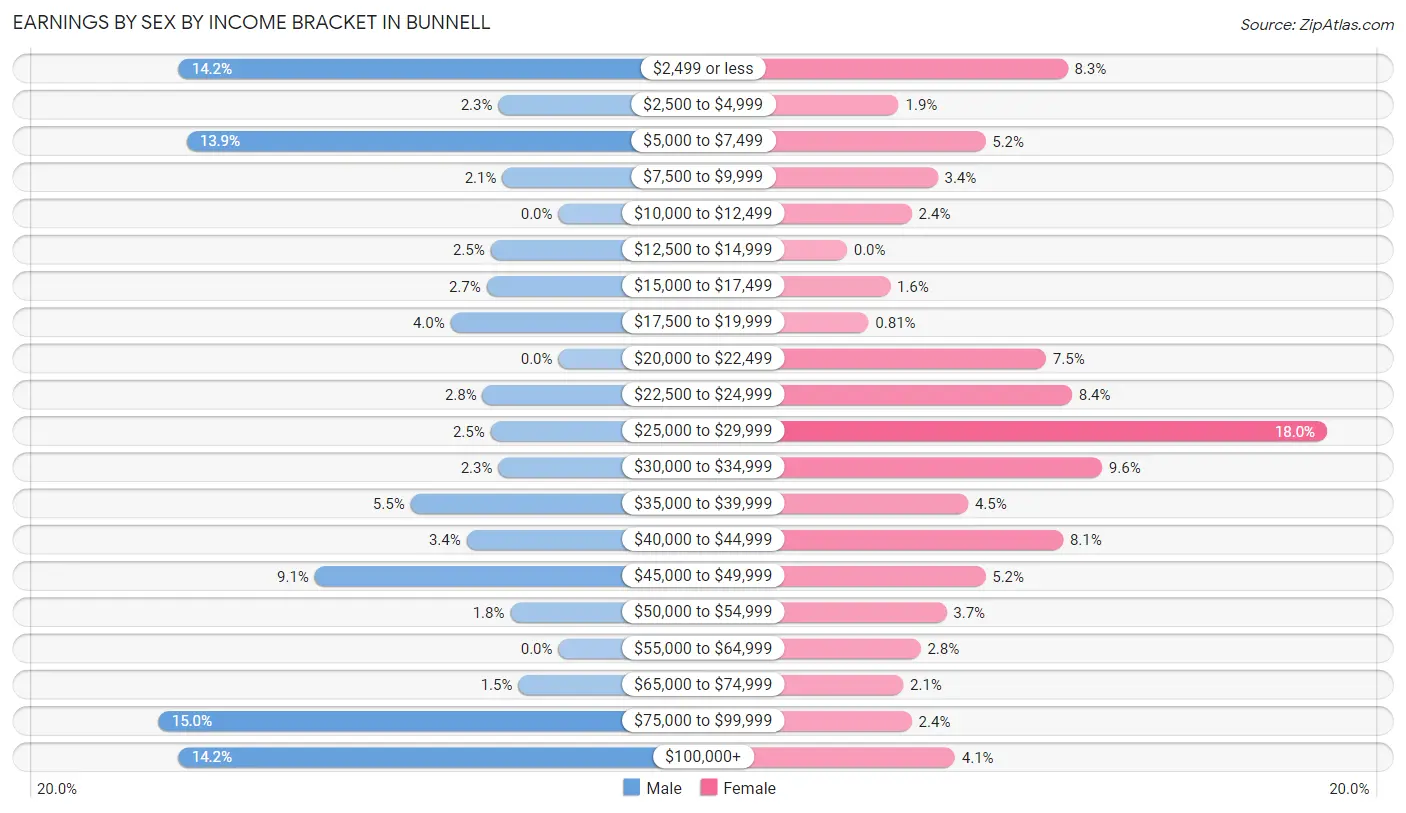
| Income | Male | Female |
| $2,499 or less | 95 (14.2%) | 51 (8.3%) |
| $2,500 to $4,999 | 15 (2.2%) | 12 (1.9%) |
| $5,000 to $7,499 | 93 (13.9%) | 32 (5.2%) |
| $7,500 to $9,999 | 14 (2.1%) | 21 (3.4%) |
| $10,000 to $12,499 | 0 (0.0%) | 15 (2.4%) |
| $12,500 to $14,999 | 17 (2.5%) | 0 (0.0%) |
| $15,000 to $17,499 | 18 (2.7%) | 10 (1.6%) |
| $17,500 to $19,999 | 27 (4.0%) | 5 (0.8%) |
| $20,000 to $22,499 | 0 (0.0%) | 46 (7.5%) |
| $22,500 to $24,999 | 19 (2.8%) | 52 (8.4%) |
| $25,000 to $29,999 | 17 (2.5%) | 111 (18.0%) |
| $30,000 to $34,999 | 15 (2.2%) | 59 (9.6%) |
| $35,000 to $39,999 | 37 (5.5%) | 28 (4.5%) |
| $40,000 to $44,999 | 23 (3.4%) | 50 (8.1%) |
| $45,000 to $49,999 | 61 (9.1%) | 32 (5.2%) |
| $50,000 to $54,999 | 12 (1.8%) | 23 (3.7%) |
| $55,000 to $64,999 | 0 (0.0%) | 17 (2.8%) |
| $65,000 to $74,999 | 10 (1.5%) | 13 (2.1%) |
| $75,000 to $99,999 | 100 (15.0%) | 15 (2.4%) |
| $100,000+ | 95 (14.2%) | 25 (4.1%) |
| Total | 668 (100.0%) | 617 (100.0%) |
Earnings by Sex by Educational Attainment in Bunnell
Average earnings in Bunnell are $37,083 for men and $29,091 for women, a difference of 21.5%. Men with an educational attainment of graduate degree enjoy the highest average annual earnings of $67,031, while those with graduate degree education earn the least with $67,031. Women with an educational attainment of bachelor's degree earn the most with the average annual earnings of $45,469, while those with high school diploma education have the smallest earnings of $27,206.
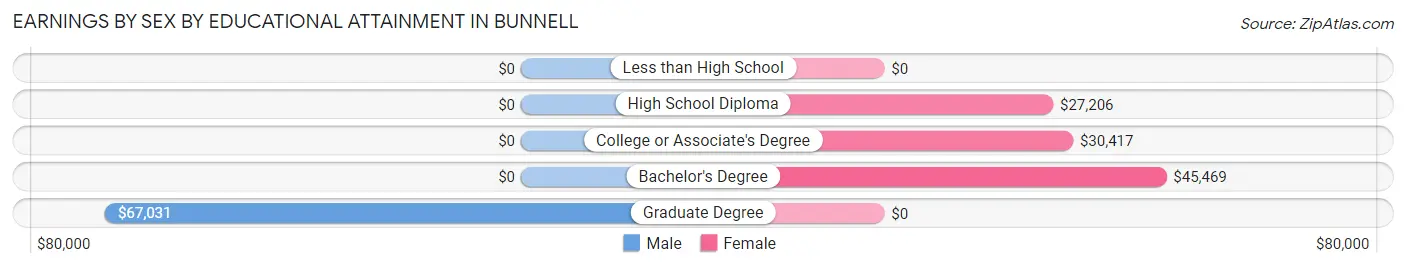
| Educational Attainment | Male Income | Female Income |
| Less than High School | - | - |
| High School Diploma | - | - |
| College or Associate's Degree | - | - |
| Bachelor's Degree | - | - |
| Graduate Degree | $67,031 | $0 |
| Total | $37,083 | $29,091 |
Family Income in Bunnell
Family Income Brackets in Bunnell
According to the Bunnell family income data, there are 158 families falling into the $100,000 to $149,999 income range, which is the most common income bracket and makes up 23.4% of all families. Conversely, the $200,000+ income bracket is the least frequent group with only 5 families (0.7%) belonging to this category.
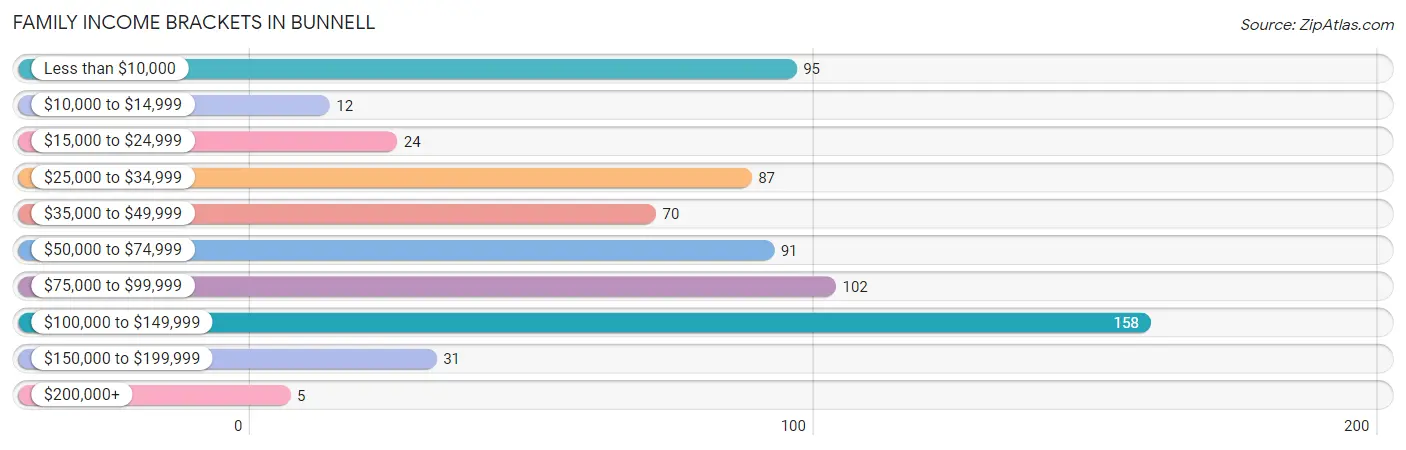
| Income Bracket | # Families | % Families |
| Less than $10,000 | 95 | 14.1% |
| $10,000 to $14,999 | 12 | 1.8% |
| $15,000 to $24,999 | 24 | 3.6% |
| $25,000 to $34,999 | 87 | 12.9% |
| $35,000 to $49,999 | 70 | 10.4% |
| $50,000 to $74,999 | 91 | 13.5% |
| $75,000 to $99,999 | 102 | 15.1% |
| $100,000 to $149,999 | 158 | 23.4% |
| $150,000 to $199,999 | 31 | 4.6% |
| $200,000+ | 5 | 0.7% |
Family Income by Famaliy Size in Bunnell
4-person families (57 | 8.4%) account for the highest median family income in Bunnell with $145,703 per family, while 4-person families (57 | 8.4%) have the highest median income of $36,426 per family member.
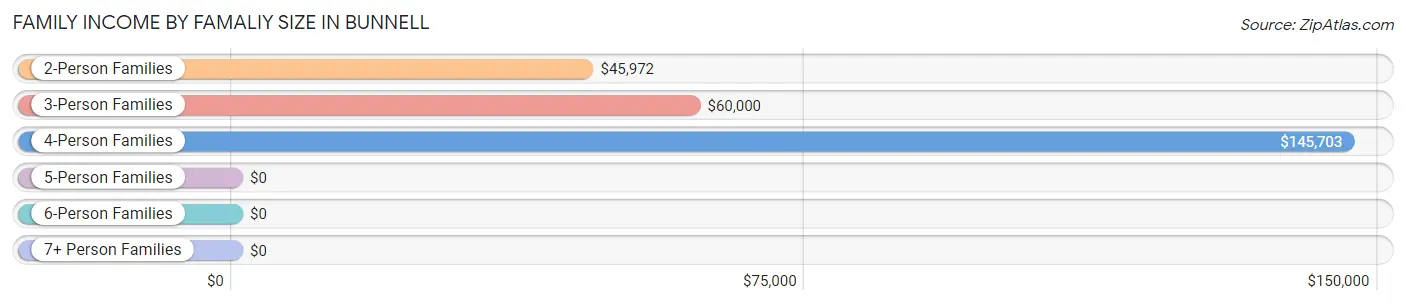
| Income Bracket | # Families | Median Income |
| 2-Person Families | 353 (52.3%) | $45,972 |
| 3-Person Families | 168 (24.9%) | $60,000 |
| 4-Person Families | 57 (8.4%) | $145,703 |
| 5-Person Families | 85 (12.6%) | $0 |
| 6-Person Families | 12 (1.8%) | $0 |
| 7+ Person Families | 0 (0.0%) | $0 |
| Total | 675 (100.0%) | $57,159 |
Family Income by Number of Earners in Bunnell
The median family income in Bunnell is $57,159, with families comprising 2 earners (166) having the highest median family income of $118,500, while families with 1 earner (301) have the lowest median family income of $38,250, accounting for 24.6% and 44.6% of families, respectively.
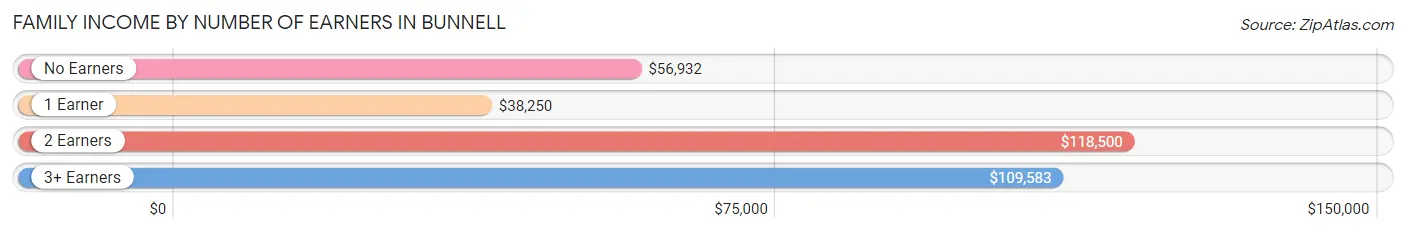
| Number of Earners | # Families | Median Income |
| No Earners | 175 (25.9%) | $56,932 |
| 1 Earner | 301 (44.6%) | $38,250 |
| 2 Earners | 166 (24.6%) | $118,500 |
| 3+ Earners | 33 (4.9%) | $109,583 |
| Total | 675 (100.0%) | $57,159 |
Household Income in Bunnell
Household Income Brackets in Bunnell
With 255 households falling in the category, the $50,000 to $74,999 income range is the most frequent in Bunnell, accounting for 17.4% of all households. In contrast, only 4 households (0.3%) fall into the $200,000+ income bracket, making it the least populous group.
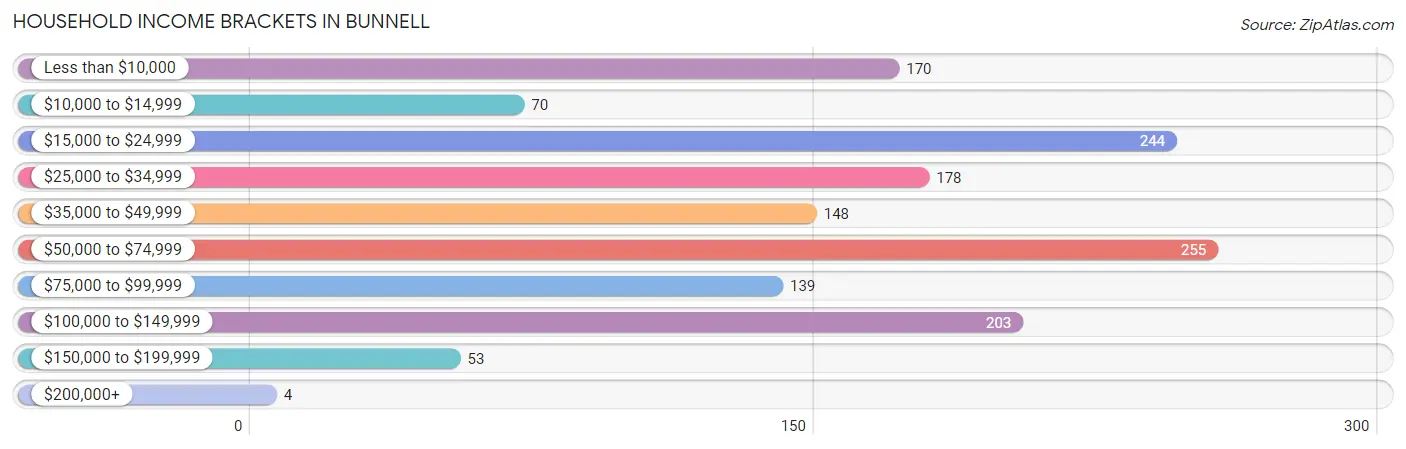
| Income Bracket | # Households | % Households |
| Less than $10,000 | 170 | 11.6% |
| $10,000 to $14,999 | 70 | 4.8% |
| $15,000 to $24,999 | 244 | 16.6% |
| $25,000 to $34,999 | 178 | 12.1% |
| $35,000 to $49,999 | 148 | 10.1% |
| $50,000 to $74,999 | 255 | 17.4% |
| $75,000 to $99,999 | 139 | 9.5% |
| $100,000 to $149,999 | 203 | 13.8% |
| $150,000 to $199,999 | 53 | 3.6% |
| $200,000+ | 4 | 0.3% |
Household Income by Householder Age in Bunnell
The median household income in Bunnell is $42,831, with the highest median household income of $50,335 found in the 65+ years age bracket for the primary householder. A total of 694 households (47.3%) fall into this category. Meanwhile, the 15 to 24 years age bracket for the primary householder has the lowest median household income of $0, with 7 households (0.5%) in this group.
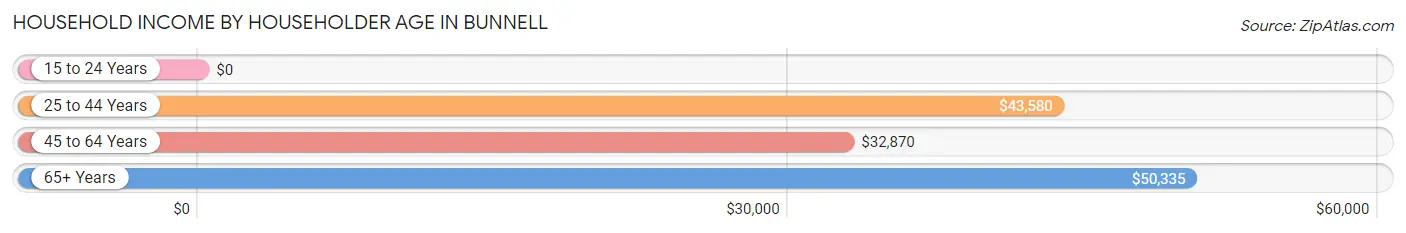
| Income Bracket | # Households | Median Income |
| 15 to 24 Years | 7 (0.5%) | $0 |
| 25 to 44 Years | 361 (24.6%) | $43,580 |
| 45 to 64 Years | 406 (27.7%) | $32,870 |
| 65+ Years | 694 (47.3%) | $50,335 |
| Total | 1,468 (100.0%) | $42,831 |
Poverty in Bunnell
Income Below Poverty by Sex and Age in Bunnell
With 20.9% poverty level for males and 13.6% for females among the residents of Bunnell, 6 to 11 year old males and 15 year old females are the most vulnerable to poverty, with 45 males (72.6%) and 11 females (68.8%) in their respective age groups living below the poverty level.
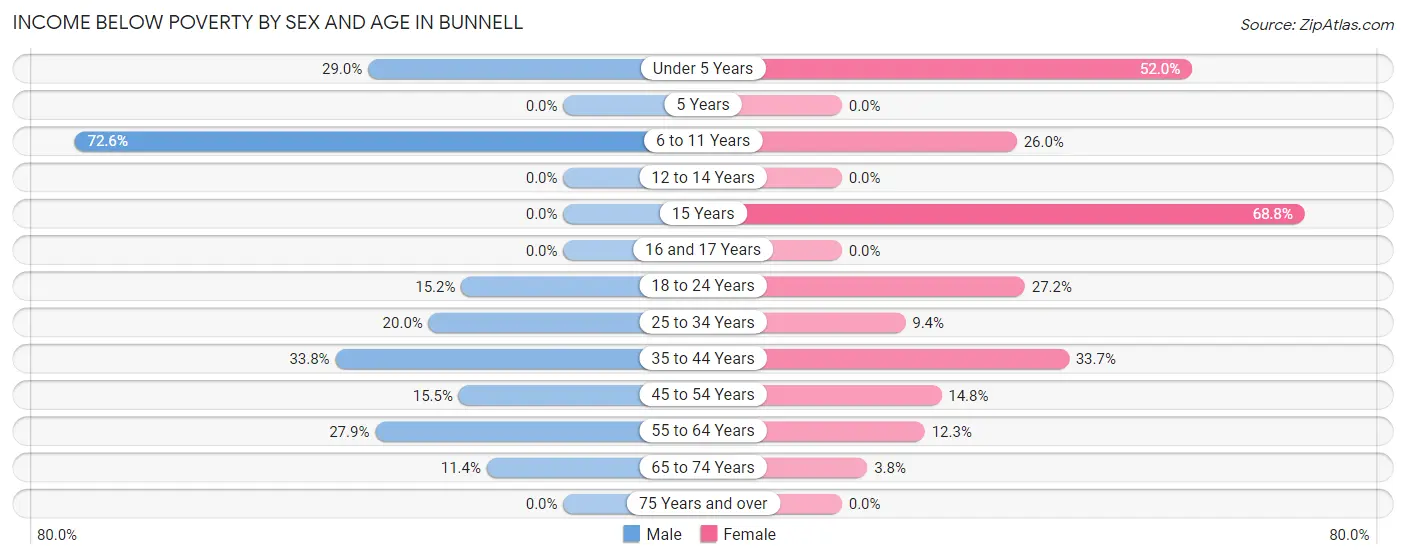
| Age Bracket | Male | Female |
| Under 5 Years | 29 (29.0%) | 13 (52.0%) |
| 5 Years | 0 (0.0%) | 0 (0.0%) |
| 6 to 11 Years | 45 (72.6%) | 40 (26.0%) |
| 12 to 14 Years | 0 (0.0%) | 0 (0.0%) |
| 15 Years | 0 (0.0%) | 11 (68.8%) |
| 16 and 17 Years | 0 (0.0%) | 0 (0.0%) |
| 18 to 24 Years | 10 (15.1%) | 28 (27.2%) |
| 25 to 34 Years | 7 (20.0%) | 20 (9.4%) |
| 35 to 44 Years | 89 (33.8%) | 61 (33.7%) |
| 45 to 54 Years | 32 (15.5%) | 22 (14.8%) |
| 55 to 64 Years | 62 (27.9%) | 26 (12.3%) |
| 65 to 74 Years | 24 (11.4%) | 18 (3.8%) |
| 75 Years and over | 0 (0.0%) | 0 (0.0%) |
| Total | 298 (20.9%) | 239 (13.6%) |
Income Above Poverty by Sex and Age in Bunnell
According to the poverty statistics in Bunnell, males aged 5 years and females aged 5 years are the age groups that are most secure financially, with 100.0% of males and 100.0% of females in these age groups living above the poverty line.
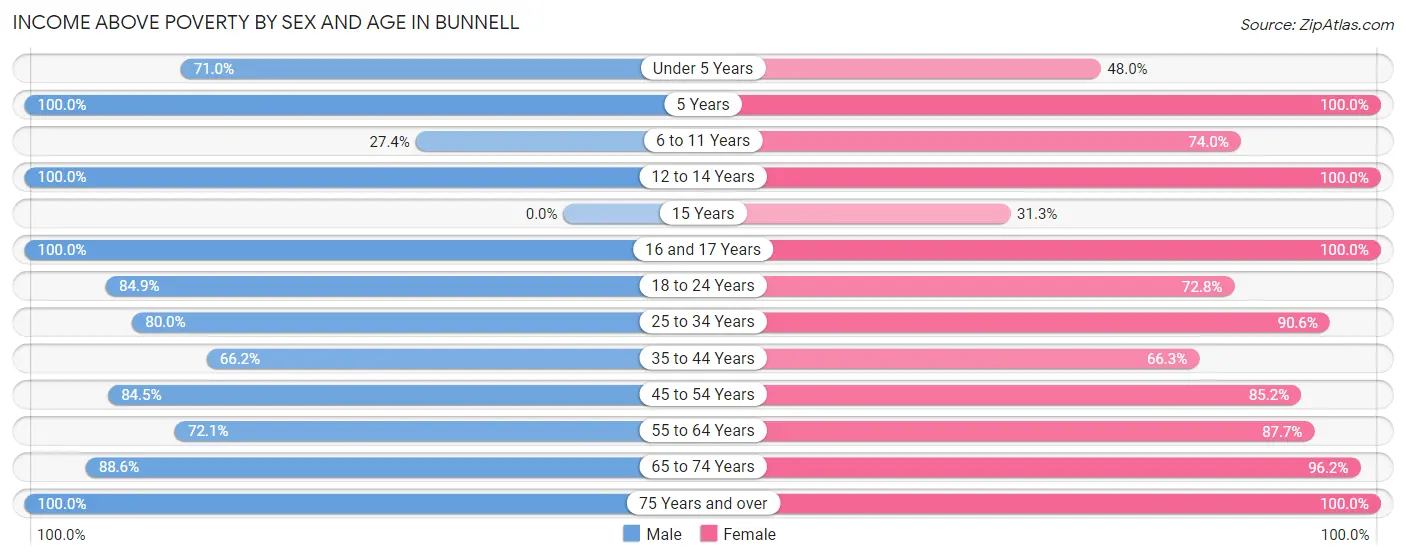
| Age Bracket | Male | Female |
| Under 5 Years | 71 (71.0%) | 12 (48.0%) |
| 5 Years | 56 (100.0%) | 38 (100.0%) |
| 6 to 11 Years | 17 (27.4%) | 114 (74.0%) |
| 12 to 14 Years | 26 (100.0%) | 29 (100.0%) |
| 15 Years | 0 (0.0%) | 5 (31.2%) |
| 16 and 17 Years | 14 (100.0%) | 33 (100.0%) |
| 18 to 24 Years | 56 (84.9%) | 75 (72.8%) |
| 25 to 34 Years | 28 (80.0%) | 192 (90.6%) |
| 35 to 44 Years | 174 (66.2%) | 120 (66.3%) |
| 45 to 54 Years | 174 (84.5%) | 127 (85.2%) |
| 55 to 64 Years | 160 (72.1%) | 185 (87.7%) |
| 65 to 74 Years | 187 (88.6%) | 458 (96.2%) |
| 75 Years and over | 167 (100.0%) | 127 (100.0%) |
| Total | 1,130 (79.1%) | 1,515 (86.4%) |
Income Below Poverty Among Married-Couple Families in Bunnell
The poverty statistics for married-couple families in Bunnell show that 8.0% or 29 of the total 365 families live below the poverty line. Families with no children have the highest poverty rate of 10.8%, comprising of 29 families. On the other hand, families with 1 or 2 children have the lowest poverty rate of 0.0%, which includes 0 families.
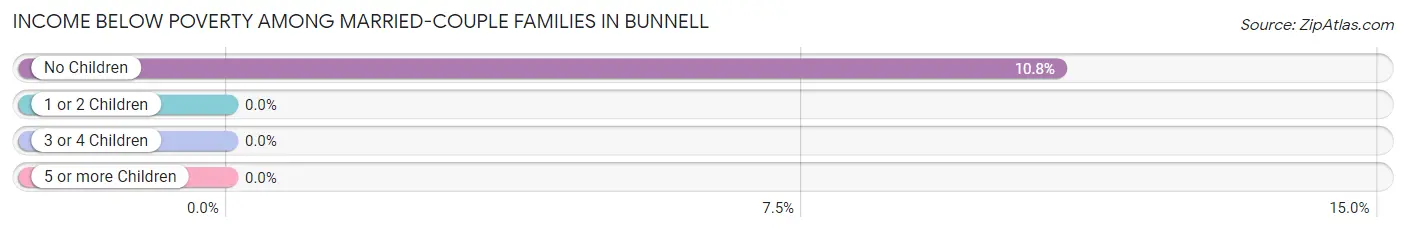
| Children | Above Poverty | Below Poverty |
| No Children | 239 (89.2%) | 29 (10.8%) |
| 1 or 2 Children | 67 (100.0%) | 0 (0.0%) |
| 3 or 4 Children | 30 (100.0%) | 0 (0.0%) |
| 5 or more Children | 0 (0.0%) | 0 (0.0%) |
| Total | 336 (92.0%) | 29 (8.0%) |
Income Below Poverty Among Single-Parent Households in Bunnell
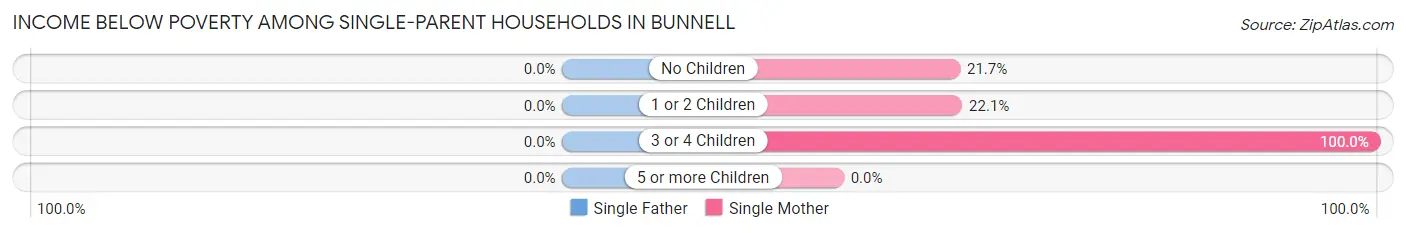
| Children | Single Father | Single Mother |
| No Children | 0 (0.0%) | 26 (21.7%) |
| 1 or 2 Children | 0 (0.0%) | 32 (22.1%) |
| 3 or 4 Children | 0 (0.0%) | 20 (100.0%) |
| 5 or more Children | 0 (0.0%) | 0 (0.0%) |
| Total | 0 (0.0%) | 78 (27.4%) |
Income Below Poverty Among Married-Couple vs Single-Parent Households in Bunnell
The poverty data for Bunnell shows that 29 of the married-couple family households (8.0%) and 78 of the single-parent households (25.2%) are living below the poverty level. Within the married-couple family households, those with no children have the highest poverty rate, with 29 households (10.8%) falling below the poverty line. Among the single-parent households, those with 3 or 4 children have the highest poverty rate, with 20 household (100.0%) living below poverty.
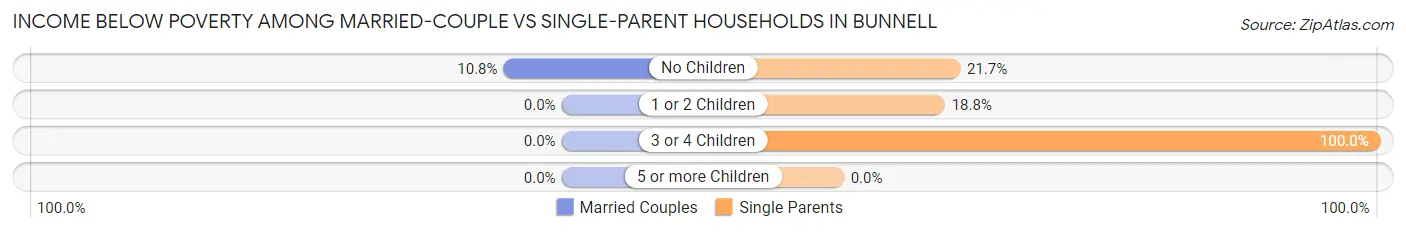
| Children | Married-Couple Families | Single-Parent Households |
| No Children | 29 (10.8%) | 26 (21.7%) |
| 1 or 2 Children | 0 (0.0%) | 32 (18.8%) |
| 3 or 4 Children | 0 (0.0%) | 20 (100.0%) |
| 5 or more Children | 0 (0.0%) | 0 (0.0%) |
| Total | 29 (8.0%) | 78 (25.2%) |
Race in Bunnell
The most populous races in Bunnell are White / Caucasian (2,270 | 67.7%), Black / African American (703 | 20.9%), and Two or more Races (278 | 8.3%).
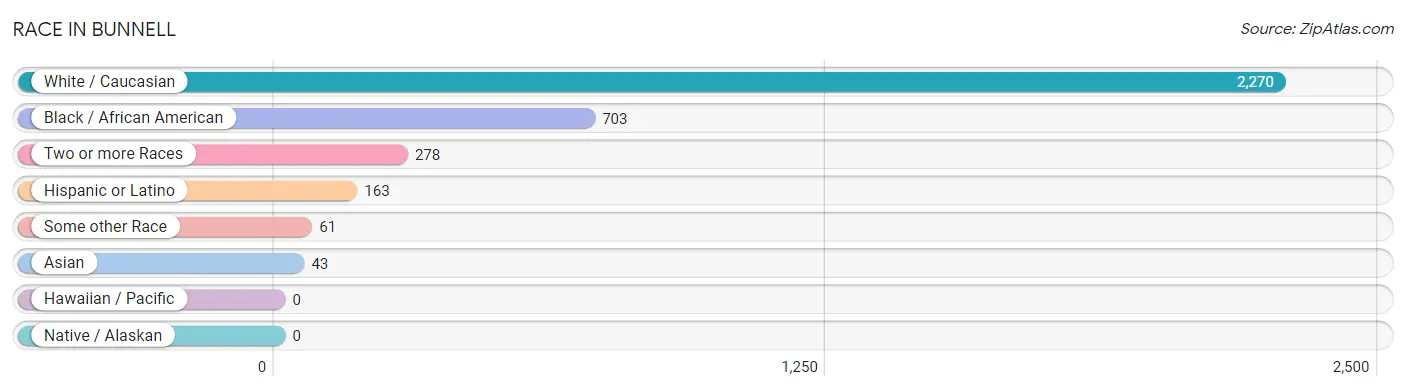
| Race | # Population | % Population |
| Asian | 43 | 1.3% |
| Black / African American | 703 | 20.9% |
| Hawaiian / Pacific | 0 | 0.0% |
| Hispanic or Latino | 163 | 4.9% |
| Native / Alaskan | 0 | 0.0% |
| White / Caucasian | 2,270 | 67.7% |
| Two or more Races | 278 | 8.3% |
| Some other Race | 61 | 1.8% |
| Total | 3,355 | 100.0% |
Ancestry in Bunnell
The most populous ancestries reported in Bunnell are American (613 | 18.3%), German (371 | 11.1%), English (265 | 7.9%), Irish (188 | 5.6%), and Italian (180 | 5.4%), together accounting for 48.2% of all Bunnell residents.
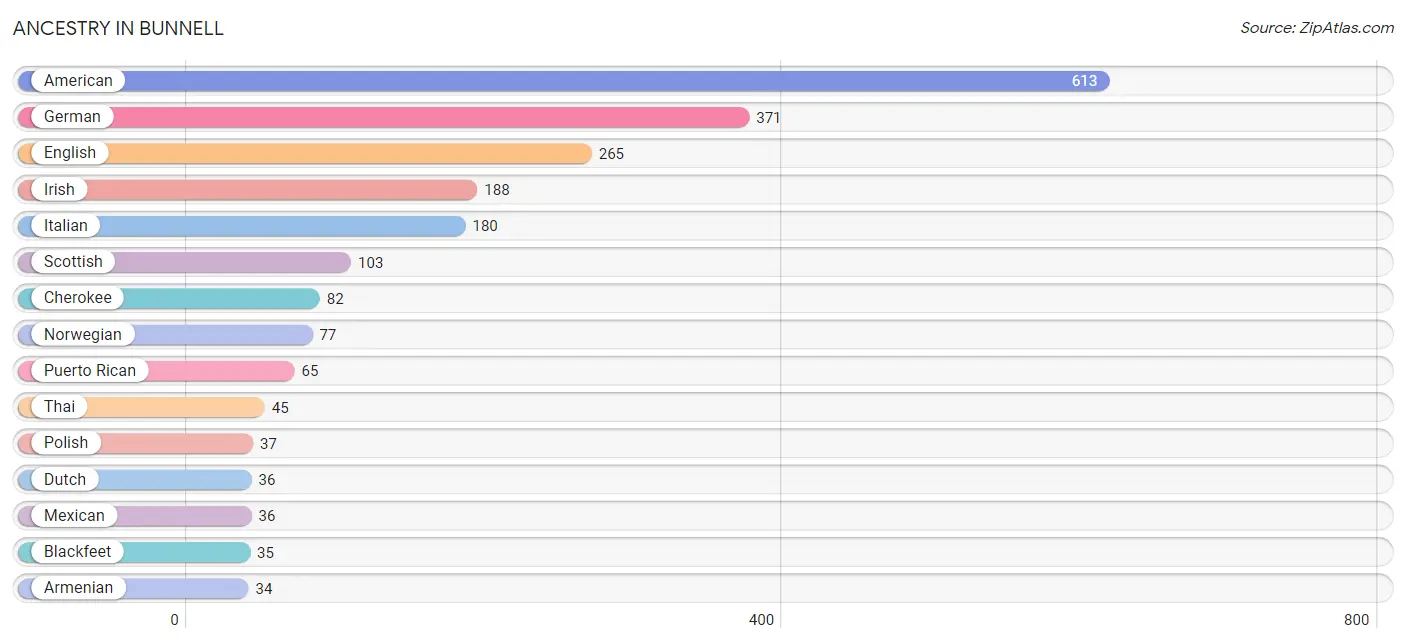
| Ancestry | # Population | % Population |
| African | 14 | 0.4% |
| American | 613 | 18.3% |
| Armenian | 34 | 1.0% |
| Austrian | 8 | 0.2% |
| Barbadian | 8 | 0.2% |
| Blackfeet | 35 | 1.0% |
| British | 6 | 0.2% |
| Canadian | 5 | 0.2% |
| Central American | 20 | 0.6% |
| Cherokee | 82 | 2.4% |
| Cuban | 15 | 0.4% |
| Dominican | 16 | 0.5% |
| Dutch | 36 | 1.1% |
| Ecuadorian | 9 | 0.3% |
| English | 265 | 7.9% |
| European | 12 | 0.4% |
| French | 22 | 0.7% |
| French Canadian | 13 | 0.4% |
| German | 371 | 11.1% |
| Greek | 15 | 0.4% |
| Haitian | 4 | 0.1% |
| Honduran | 12 | 0.4% |
| Irish | 188 | 5.6% |
| Italian | 180 | 5.4% |
| Latvian | 6 | 0.2% |
| Mexican | 36 | 1.1% |
| Nicaraguan | 8 | 0.2% |
| Northern European | 6 | 0.2% |
| Norwegian | 77 | 2.3% |
| Pennsylvania German | 6 | 0.2% |
| Polish | 37 | 1.1% |
| Portuguese | 7 | 0.2% |
| Puerto Rican | 65 | 1.9% |
| Russian | 15 | 0.4% |
| Scotch-Irish | 25 | 0.7% |
| Scottish | 103 | 3.1% |
| Seminole | 9 | 0.3% |
| South American | 9 | 0.3% |
| Spaniard | 2 | 0.1% |
| Subsaharan African | 14 | 0.4% |
| Swedish | 19 | 0.6% |
| Thai | 45 | 1.3% |
| Ukrainian | 16 | 0.5% | View All 43 Rows |
Immigrants in Bunnell
The most numerous immigrant groups reported in Bunnell came from Latin America (71 | 2.1%), Central America (38 | 1.1%), Caribbean (33 | 1.0%), Europe (33 | 1.0%), and Eastern Europe (26 | 0.8%), together accounting for 6.0% of all Bunnell residents.
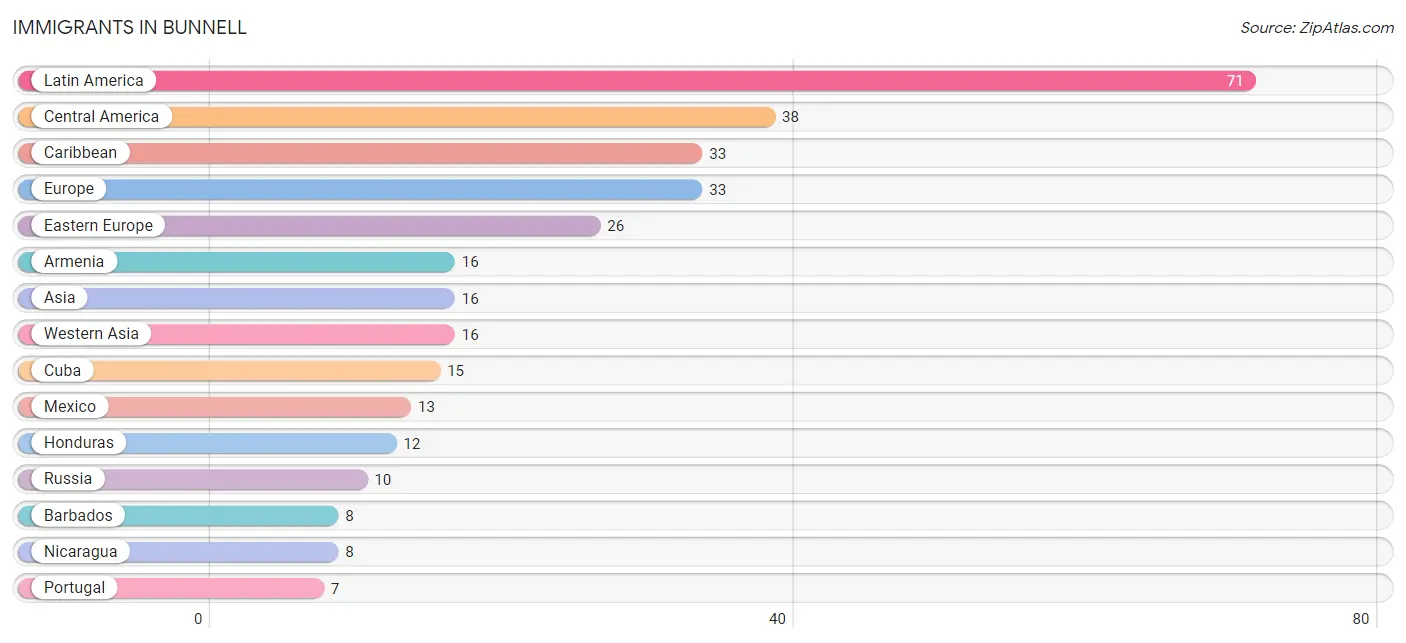
| Immigration Origin | # Population | % Population |
| Armenia | 16 | 0.5% |
| Asia | 16 | 0.5% |
| Barbados | 8 | 0.2% |
| Canada | 5 | 0.2% |
| Caribbean | 33 | 1.0% |
| Central America | 38 | 1.1% |
| Cuba | 15 | 0.4% |
| Eastern Europe | 26 | 0.8% |
| Europe | 33 | 1.0% |
| Haiti | 4 | 0.1% |
| Honduras | 12 | 0.4% |
| Latin America | 71 | 2.1% |
| Mexico | 13 | 0.4% |
| Nicaragua | 8 | 0.2% |
| Panama | 5 | 0.2% |
| Portugal | 7 | 0.2% |
| Russia | 10 | 0.3% |
| Southern Europe | 7 | 0.2% |
| Western Asia | 16 | 0.5% | View All 19 Rows |
Sex and Age in Bunnell
Sex and Age in Bunnell
The most populous age groups in Bunnell are 35 to 39 Years (190 | 12.7%) for men and 70 to 74 Years (276 | 14.8%) for women.
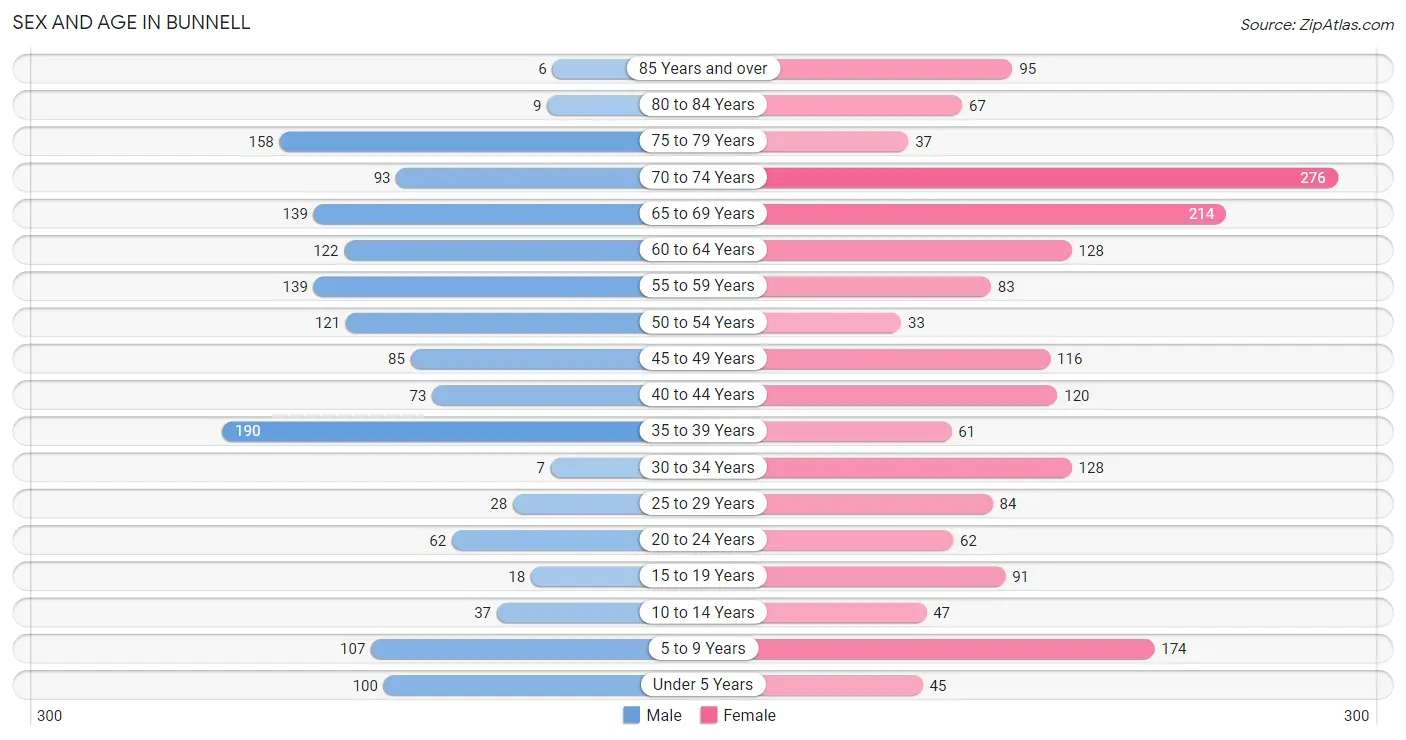
| Age Bracket | Male | Female |
| Under 5 Years | 100 (6.7%) | 45 (2.4%) |
| 5 to 9 Years | 107 (7.2%) | 174 (9.3%) |
| 10 to 14 Years | 37 (2.5%) | 47 (2.5%) |
| 15 to 19 Years | 18 (1.2%) | 91 (4.9%) |
| 20 to 24 Years | 62 (4.2%) | 62 (3.3%) |
| 25 to 29 Years | 28 (1.9%) | 84 (4.5%) |
| 30 to 34 Years | 7 (0.5%) | 128 (6.9%) |
| 35 to 39 Years | 190 (12.7%) | 61 (3.3%) |
| 40 to 44 Years | 73 (4.9%) | 120 (6.5%) |
| 45 to 49 Years | 85 (5.7%) | 116 (6.2%) |
| 50 to 54 Years | 121 (8.1%) | 33 (1.8%) |
| 55 to 59 Years | 139 (9.3%) | 83 (4.5%) |
| 60 to 64 Years | 122 (8.2%) | 128 (6.9%) |
| 65 to 69 Years | 139 (9.3%) | 214 (11.5%) |
| 70 to 74 Years | 93 (6.2%) | 276 (14.8%) |
| 75 to 79 Years | 158 (10.6%) | 37 (2.0%) |
| 80 to 84 Years | 9 (0.6%) | 67 (3.6%) |
| 85 Years and over | 6 (0.4%) | 95 (5.1%) |
| Total | 1,494 (100.0%) | 1,861 (100.0%) |
Families and Households in Bunnell
Median Family Size in Bunnell
The median family size in Bunnell is 3.11 persons per family, with single female/mother families (285 | 42.2%) accounting for the largest median family size of 3.31 persons per family. On the other hand, married-couple families (365 | 54.1%) represent the smallest median family size with 2.95 persons per family.
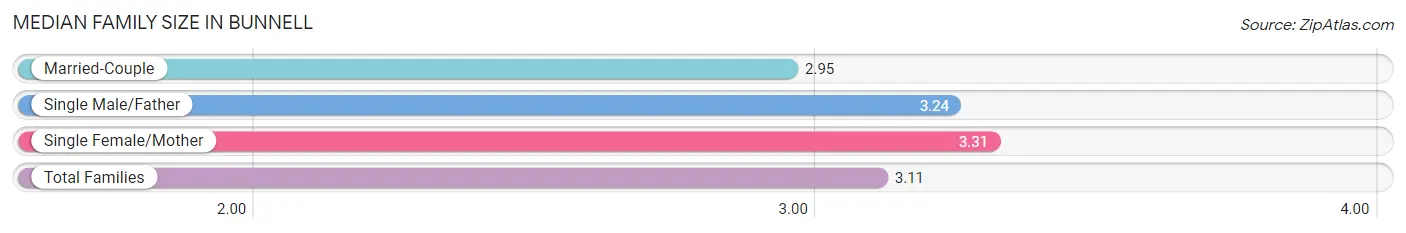
| Family Type | # Families | Family Size |
| Married-Couple | 365 (54.1%) | 2.95 |
| Single Male/Father | 25 (3.7%) | 3.24 |
| Single Female/Mother | 285 (42.2%) | 3.31 |
| Total Families | 675 (100.0%) | 3.11 |
Median Household Size in Bunnell
The median household size in Bunnell is 2.16 persons per household, with single female/mother households (285 | 19.4%) accounting for the largest median household size of 3.45 persons per household. non-family households (793 | 54.0%) represent the smallest median household size with 1.30 persons per household.
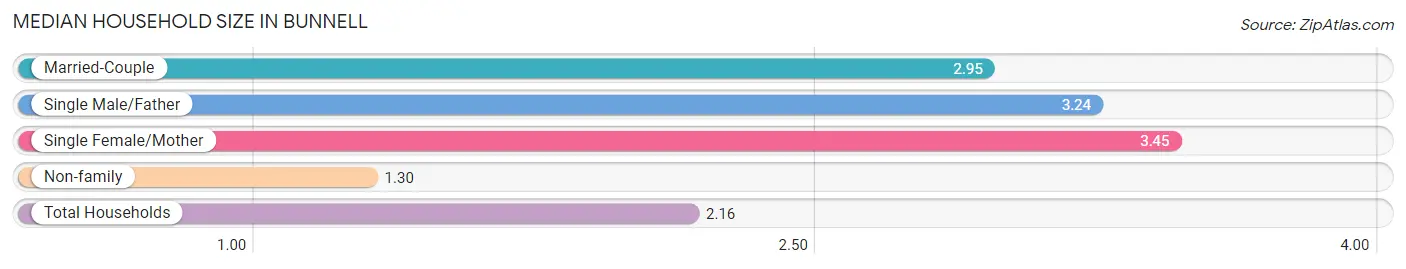
| Household Type | # Households | Household Size |
| Married-Couple | 365 (24.9%) | 2.95 |
| Single Male/Father | 25 (1.7%) | 3.24 |
| Single Female/Mother | 285 (19.4%) | 3.45 |
| Non-family | 793 (54.0%) | 1.30 |
| Total Households | 1,468 (100.0%) | 2.16 |
Household Size by Marriage Status in Bunnell
Out of a total of 1,468 households in Bunnell, 675 (46.0%) are family households, while 793 (54.0%) are nonfamily households. The most numerous type of family households are 2-person households, comprising 317, and the most common type of nonfamily households are 1-person households, comprising 571.
| Household Size | Family Households | Nonfamily Households |
| 1-Person Households | - | 571 (38.9%) |
| 2-Person Households | 317 (21.6%) | 222 (15.1%) |
| 3-Person Households | 204 (13.9%) | 0 (0.0%) |
| 4-Person Households | 57 (3.9%) | 0 (0.0%) |
| 5-Person Households | 85 (5.8%) | 0 (0.0%) |
| 6-Person Households | 12 (0.8%) | 0 (0.0%) |
| 7+ Person Households | 0 (0.0%) | 0 (0.0%) |
| Total | 675 (46.0%) | 793 (54.0%) |
Female Fertility in Bunnell
Fertility by Age in Bunnell
| Age Bracket | Women with Births | Births / 1,000 Women |
| 15 to 19 years | 0 (0.0%) | 0.0 |
| 20 to 34 years | 0 (0.0%) | 0.0 |
| 35 to 50 years | 0 (0.0%) | 0.0 |
| Total | 0 (0.0%) | 0.0 |
Fertility by Age by Marriage Status in Bunnell
| Age Bracket | Married | Unmarried |
| 15 to 19 years | 0 (0.0%) | 0 (0.0%) |
| 20 to 34 years | 0 (0.0%) | 0 (0.0%) |
| 35 to 50 years | 0 (0.0%) | 0 (0.0%) |
| Total | 0 (0.0%) | 0 (0.0%) |
Fertility by Education in Bunnell
| Educational Attainment | Women with Births | Births / 1,000 Women |
| Less than High School | 0 (0.0%) | 0.0 |
| High School Diploma | 0 (0.0%) | 0.0 |
| College or Associate's Degree | 0 (0.0%) | 0.0 |
| Bachelor's Degree | 0 (0.0%) | 0.0 |
| Graduate Degree | 0 (0.0%) | 0.0 |
| Total | 0 (0.0%) | 0.0 |
Fertility by Education by Marriage Status in Bunnell
| Educational Attainment | Married | Unmarried |
| Less than High School | 0 (0.0%) | 0 (0.0%) |
| High School Diploma | 0 (0.0%) | 0 (0.0%) |
| College or Associate's Degree | 0 (0.0%) | 0 (0.0%) |
| Bachelor's Degree | 0 (0.0%) | 0 (0.0%) |
| Graduate Degree | 0 (0.0%) | 0 (0.0%) |
| Total | 0 (0.0%) | 0 (0.0%) |
Employment Characteristics in Bunnell
Employment by Class of Employer in Bunnell
Among the 1,163 employed individuals in Bunnell, private company employees (752 | 64.7%), local government employees (170 | 14.6%), and not-for-profit organizations (109 | 9.4%) make up the most common classes of employment.
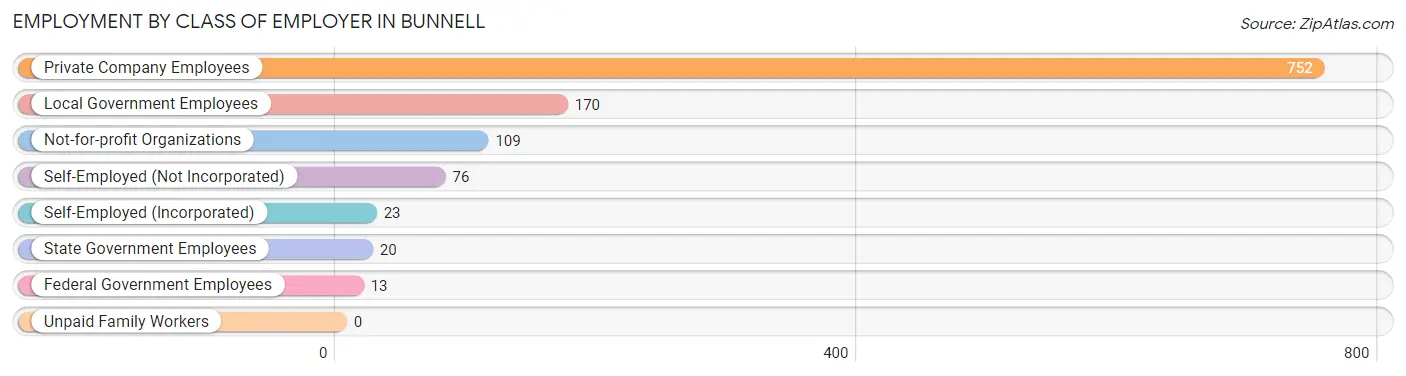
| Employer Class | # Employees | % Employees |
| Private Company Employees | 752 | 64.7% |
| Self-Employed (Incorporated) | 23 | 2.0% |
| Self-Employed (Not Incorporated) | 76 | 6.5% |
| Not-for-profit Organizations | 109 | 9.4% |
| Local Government Employees | 170 | 14.6% |
| State Government Employees | 20 | 1.7% |
| Federal Government Employees | 13 | 1.1% |
| Unpaid Family Workers | 0 | 0.0% |
| Total | 1,163 | 100.0% |
Employment Status by Age in Bunnell
According to the labor force statistics for Bunnell, out of the total population over 16 years of age (2,829), 43.2% or 1,222 individuals are in the labor force, with 3.8% or 46 of them unemployed. The age group with the highest labor force participation rate is 45 to 54 years, with 90.4% or 321 individuals in the labor force. Within the labor force, the 45 to 54 years age range has the highest percentage of unemployed individuals, with 12.8% or 41 of them being unemployed.
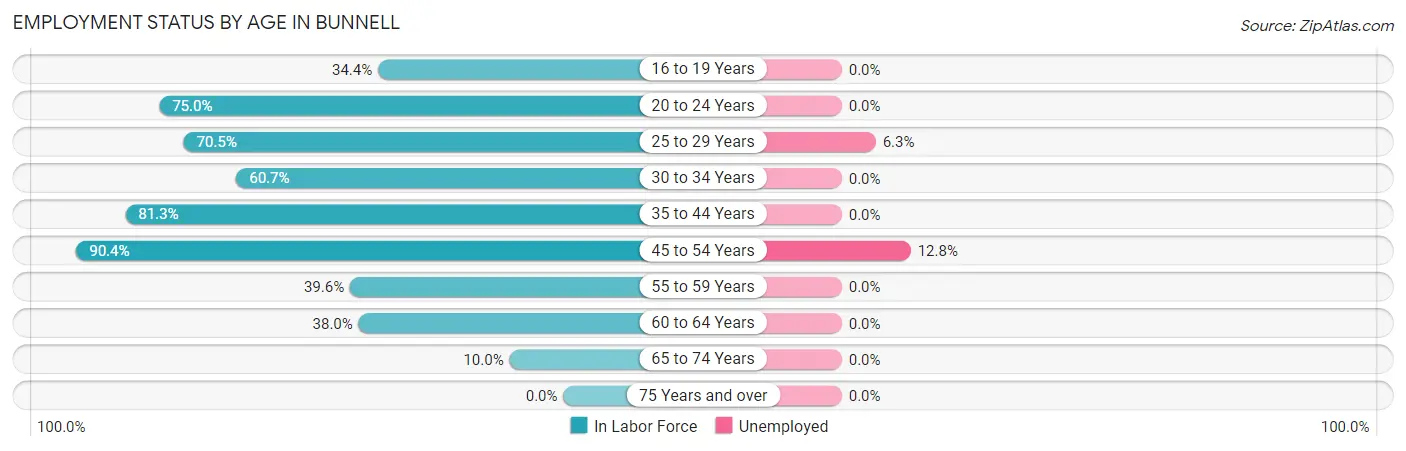
| Age Bracket | In Labor Force | Unemployed |
| 16 to 19 Years | 32 (34.4%) | 0 (0.0%) |
| 20 to 24 Years | 93 (75.0%) | 0 (0.0%) |
| 25 to 29 Years | 79 (70.5%) | 5 (6.3%) |
| 30 to 34 Years | 82 (60.7%) | 0 (0.0%) |
| 35 to 44 Years | 361 (81.3%) | 0 (0.0%) |
| 45 to 54 Years | 321 (90.4%) | 41 (12.8%) |
| 55 to 59 Years | 88 (39.6%) | 0 (0.0%) |
| 60 to 64 Years | 95 (38.0%) | 0 (0.0%) |
| 65 to 74 Years | 72 (10.0%) | 0 (0.0%) |
| 75 Years and over | 0 (0.0%) | 0 (0.0%) |
| Total | 1,222 (43.2%) | 46 (3.8%) |
Employment Status by Educational Attainment in Bunnell
According to labor force statistics for Bunnell, 67.6% of individuals (1,026) out of the total population between 25 and 64 years of age (1,518) are in the labor force, with 4.5% or 46 of them being unemployed. The group with the highest labor force participation rate are those with the educational attainment of bachelor's degree or higher, with 88.8% or 183 individuals in the labor force. Within the labor force, individuals with bachelor's degree or higher education have the highest percentage of unemployment, with 21.9% or 40 of them being unemployed.
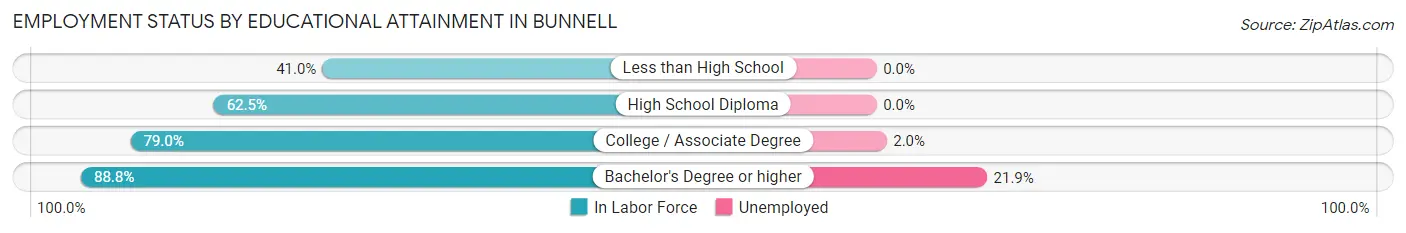
| Educational Attainment | In Labor Force | Unemployed |
| Less than High School | 73 (41.0%) | 0 (0.0%) |
| High School Diploma | 477 (62.5%) | 0 (0.0%) |
| College / Associate Degree | 293 (79.0%) | 7 (2.0%) |
| Bachelor's Degree or higher | 183 (88.8%) | 45 (21.9%) |
| Total | 1,026 (67.6%) | 68 (4.5%) |
Employment Occupations by Sex in Bunnell
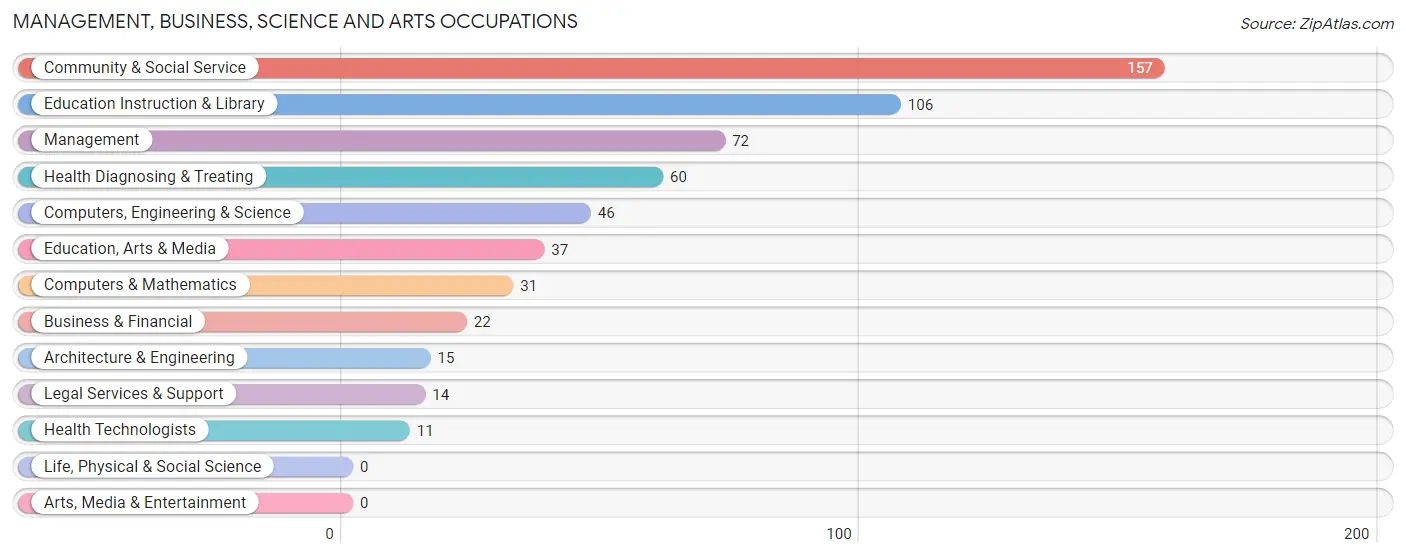
Management, Business, Science and Arts Occupations
The most common Management, Business, Science and Arts occupations in Bunnell are Community & Social Service (157 | 13.3%), Education Instruction & Library (106 | 9.0%), Management (72 | 6.1%), Health Diagnosing & Treating (60 | 5.1%), and Computers, Engineering & Science (46 | 3.9%).
Management, Business, Science and Arts Occupations by Sex
Within the Management, Business, Science and Arts occupations in Bunnell, the most male-oriented occupations are Computers & Mathematics (100.0%), Management (77.8%), and Computers, Engineering & Science (67.4%), while the most female-oriented occupations are Architecture & Engineering (100.0%), Health Technologists (100.0%), and Business & Financial (90.9%).
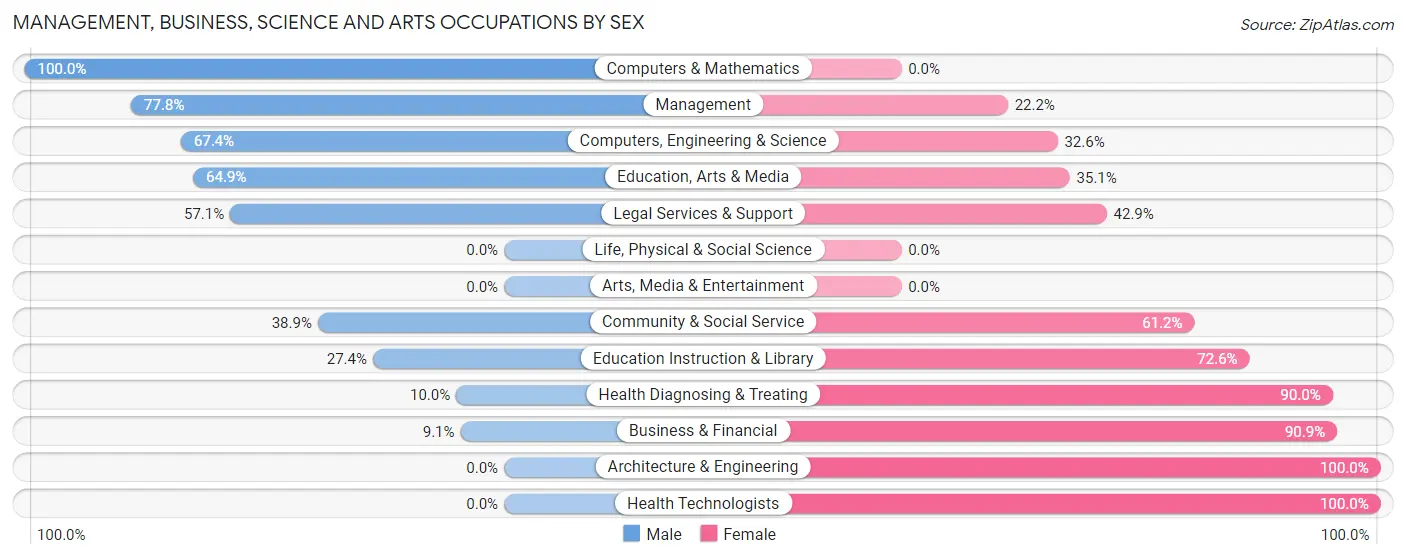
| Occupation | Male | Female |
| Management | 56 (77.8%) | 16 (22.2%) |
| Business & Financial | 2 (9.1%) | 20 (90.9%) |
| Computers, Engineering & Science | 31 (67.4%) | 15 (32.6%) |
| Computers & Mathematics | 31 (100.0%) | 0 (0.0%) |
| Architecture & Engineering | 0 (0.0%) | 15 (100.0%) |
| Life, Physical & Social Science | 0 (0.0%) | 0 (0.0%) |
| Community & Social Service | 61 (38.9%) | 96 (61.2%) |
| Education, Arts & Media | 24 (64.9%) | 13 (35.1%) |
| Legal Services & Support | 8 (57.1%) | 6 (42.9%) |
| Education Instruction & Library | 29 (27.4%) | 77 (72.6%) |
| Arts, Media & Entertainment | 0 (0.0%) | 0 (0.0%) |
| Health Diagnosing & Treating | 6 (10.0%) | 54 (90.0%) |
| Health Technologists | 0 (0.0%) | 11 (100.0%) |
| Total (Category) | 156 (43.7%) | 201 (56.3%) |
| Total (Overall) | 596 (50.6%) | 581 (49.4%) |
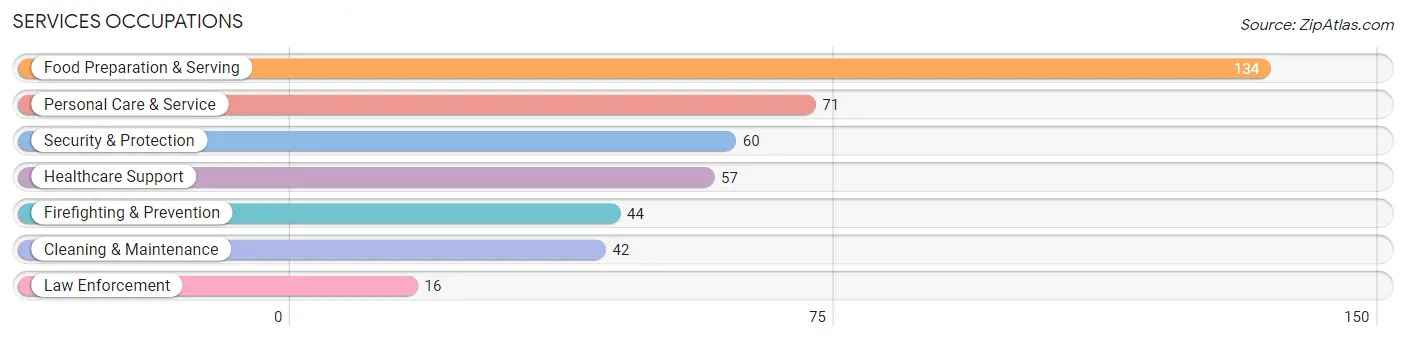
Services Occupations
The most common Services occupations in Bunnell are Food Preparation & Serving (134 | 11.4%), Personal Care & Service (71 | 6.0%), Security & Protection (60 | 5.1%), Healthcare Support (57 | 4.8%), and Firefighting & Prevention (44 | 3.7%).
Services Occupations by Sex
Within the Services occupations in Bunnell, the most male-oriented occupations are Firefighting & Prevention (100.0%), Security & Protection (85.0%), and Food Preparation & Serving (80.6%), while the most female-oriented occupations are Healthcare Support (100.0%), Personal Care & Service (91.5%), and Cleaning & Maintenance (76.2%).
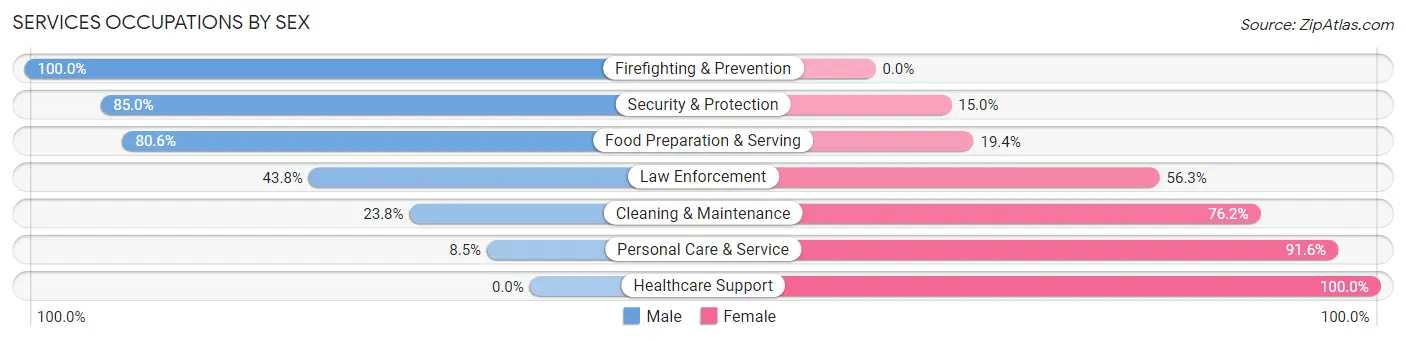
| Occupation | Male | Female |
| Healthcare Support | 0 (0.0%) | 57 (100.0%) |
| Security & Protection | 51 (85.0%) | 9 (15.0%) |
| Firefighting & Prevention | 44 (100.0%) | 0 (0.0%) |
| Law Enforcement | 7 (43.8%) | 9 (56.2%) |
| Food Preparation & Serving | 108 (80.6%) | 26 (19.4%) |
| Cleaning & Maintenance | 10 (23.8%) | 32 (76.2%) |
| Personal Care & Service | 6 (8.5%) | 65 (91.5%) |
| Total (Category) | 175 (48.1%) | 189 (51.9%) |
| Total (Overall) | 596 (50.6%) | 581 (49.4%) |
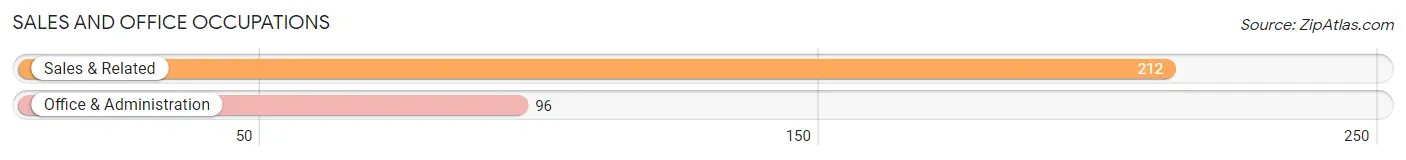
Sales and Office Occupations
The most common Sales and Office occupations in Bunnell are Sales & Related (212 | 18.0%), and Office & Administration (96 | 8.2%).
Sales and Office Occupations by Sex
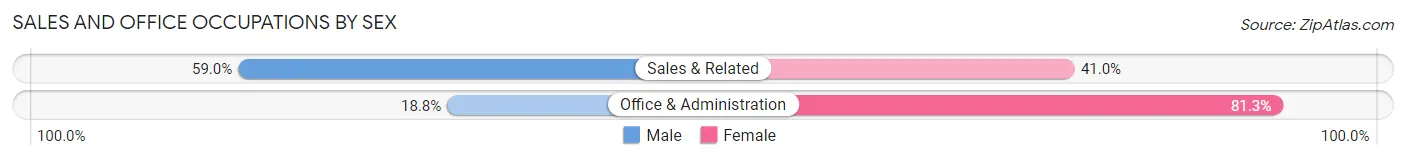
| Occupation | Male | Female |
| Sales & Related | 125 (59.0%) | 87 (41.0%) |
| Office & Administration | 18 (18.8%) | 78 (81.2%) |
| Total (Category) | 143 (46.4%) | 165 (53.6%) |
| Total (Overall) | 596 (50.6%) | 581 (49.4%) |
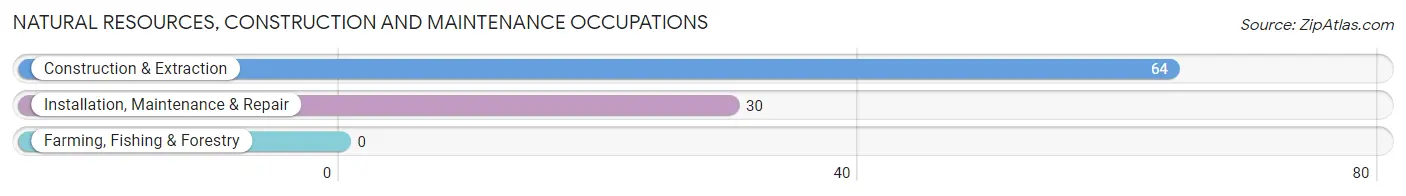
Natural Resources, Construction and Maintenance Occupations
The most common Natural Resources, Construction and Maintenance occupations in Bunnell are Construction & Extraction (64 | 5.4%), and Installation, Maintenance & Repair (30 | 2.5%).
Natural Resources, Construction and Maintenance Occupations by Sex
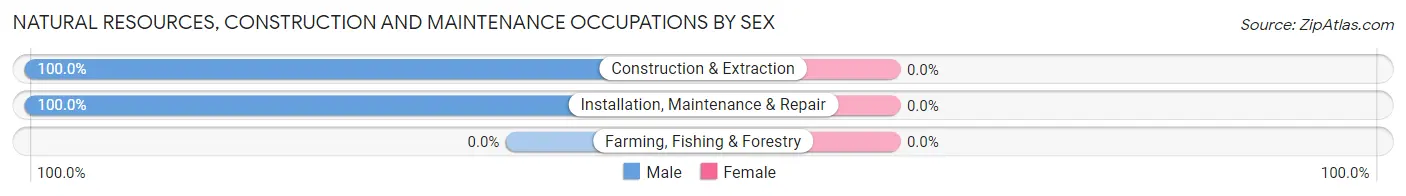
| Occupation | Male | Female |
| Farming, Fishing & Forestry | 0 (0.0%) | 0 (0.0%) |
| Construction & Extraction | 64 (100.0%) | 0 (0.0%) |
| Installation, Maintenance & Repair | 30 (100.0%) | 0 (0.0%) |
| Total (Category) | 94 (100.0%) | 0 (0.0%) |
| Total (Overall) | 596 (50.6%) | 581 (49.4%) |
Production, Transportation and Moving Occupations
The most common Production, Transportation and Moving occupations in Bunnell are Production (29 | 2.5%), Transportation (14 | 1.2%), and Material Moving (11 | 0.9%).
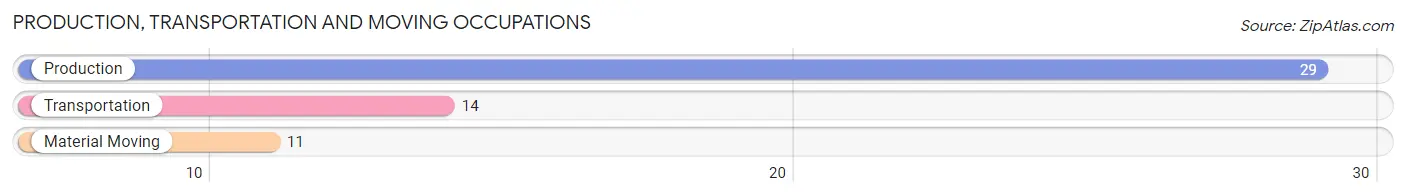
Production, Transportation and Moving Occupations by Sex
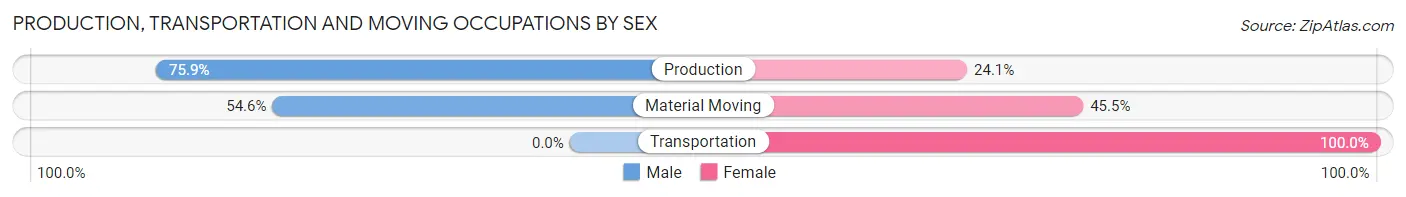
| Occupation | Male | Female |
| Production | 22 (75.9%) | 7 (24.1%) |
| Transportation | 0 (0.0%) | 14 (100.0%) |
| Material Moving | 6 (54.5%) | 5 (45.5%) |
| Total (Category) | 28 (51.8%) | 26 (48.1%) |
| Total (Overall) | 596 (50.6%) | 581 (49.4%) |
Employment Industries by Sex in Bunnell
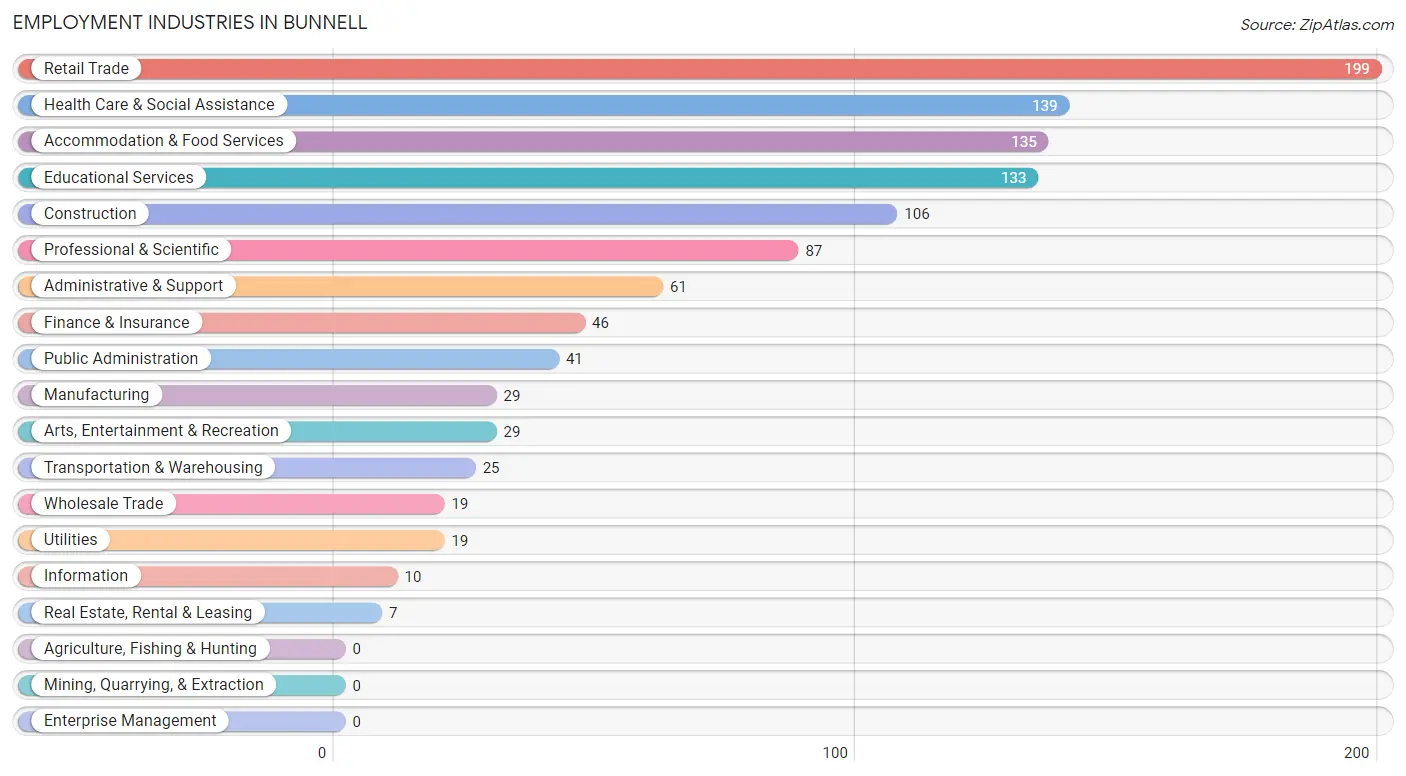
Employment Industries in Bunnell
The major employment industries in Bunnell include Retail Trade (199 | 16.9%), Health Care & Social Assistance (139 | 11.8%), Accommodation & Food Services (135 | 11.5%), Educational Services (133 | 11.3%), and Construction (106 | 9.0%).
Employment Industries by Sex in Bunnell
The Bunnell industries that see more men than women are Construction (100.0%), Wholesale Trade (100.0%), and Utilities (100.0%), whereas the industries that tend to have a higher number of women are Information (100.0%), Real Estate, Rental & Leasing (100.0%), and Health Care & Social Assistance (93.5%).
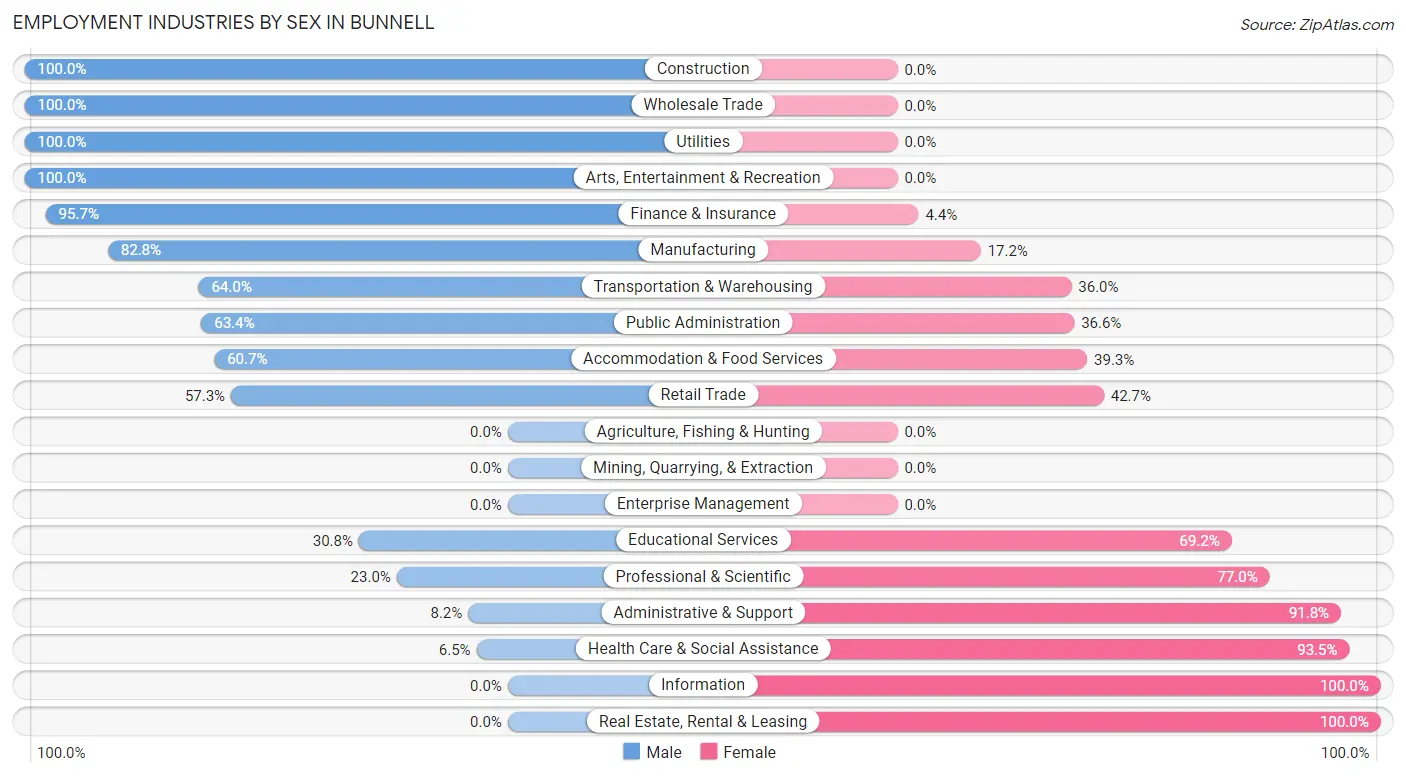
| Industry | Male | Female |
| Agriculture, Fishing & Hunting | 0 (0.0%) | 0 (0.0%) |
| Mining, Quarrying, & Extraction | 0 (0.0%) | 0 (0.0%) |
| Construction | 106 (100.0%) | 0 (0.0%) |
| Manufacturing | 24 (82.8%) | 5 (17.2%) |
| Wholesale Trade | 19 (100.0%) | 0 (0.0%) |
| Retail Trade | 114 (57.3%) | 85 (42.7%) |
| Transportation & Warehousing | 16 (64.0%) | 9 (36.0%) |
| Utilities | 19 (100.0%) | 0 (0.0%) |
| Information | 0 (0.0%) | 10 (100.0%) |
| Finance & Insurance | 44 (95.7%) | 2 (4.3%) |
| Real Estate, Rental & Leasing | 0 (0.0%) | 7 (100.0%) |
| Professional & Scientific | 20 (23.0%) | 67 (77.0%) |
| Enterprise Management | 0 (0.0%) | 0 (0.0%) |
| Administrative & Support | 5 (8.2%) | 56 (91.8%) |
| Educational Services | 41 (30.8%) | 92 (69.2%) |
| Health Care & Social Assistance | 9 (6.5%) | 130 (93.5%) |
| Arts, Entertainment & Recreation | 29 (100.0%) | 0 (0.0%) |
| Accommodation & Food Services | 82 (60.7%) | 53 (39.3%) |
| Public Administration | 26 (63.4%) | 15 (36.6%) |
| Total | 596 (50.6%) | 581 (49.4%) |
Education in Bunnell
School Enrollment in Bunnell
The most common levels of schooling among the 582 students in Bunnell are elementary school (274 | 47.1%), high school (129 | 22.2%), and nursery / preschool (70 | 12.0%).
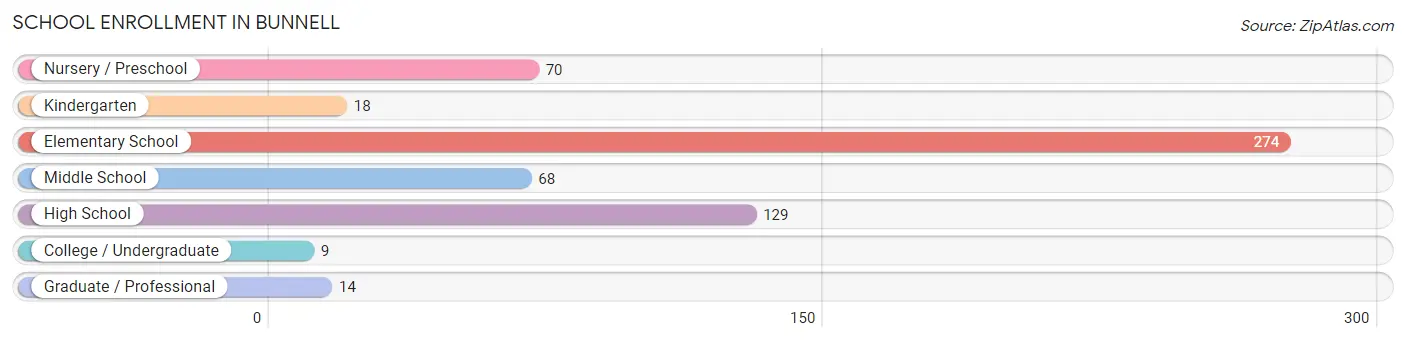
| School Level | # Students | % Students |
| Nursery / Preschool | 70 | 12.0% |
| Kindergarten | 18 | 3.1% |
| Elementary School | 274 | 47.1% |
| Middle School | 68 | 11.7% |
| High School | 129 | 22.2% |
| College / Undergraduate | 9 | 1.5% |
| Graduate / Professional | 14 | 2.4% |
| Total | 582 | 100.0% |
School Enrollment by Age by Funding Source in Bunnell
Out of a total of 582 students who are enrolled in schools in Bunnell, 64 (11.0%) attend a private institution, while the remaining 518 (89.0%) are enrolled in public schools. The age group of 10 to 14 year olds has the highest likelihood of being enrolled in private schools, with 38 (48.7% in the age bracket) enrolled. Conversely, the age group of 5 to 9 year old has the lowest likelihood of being enrolled in a private school, with 281 (100.0% in the age bracket) attending a public institution.
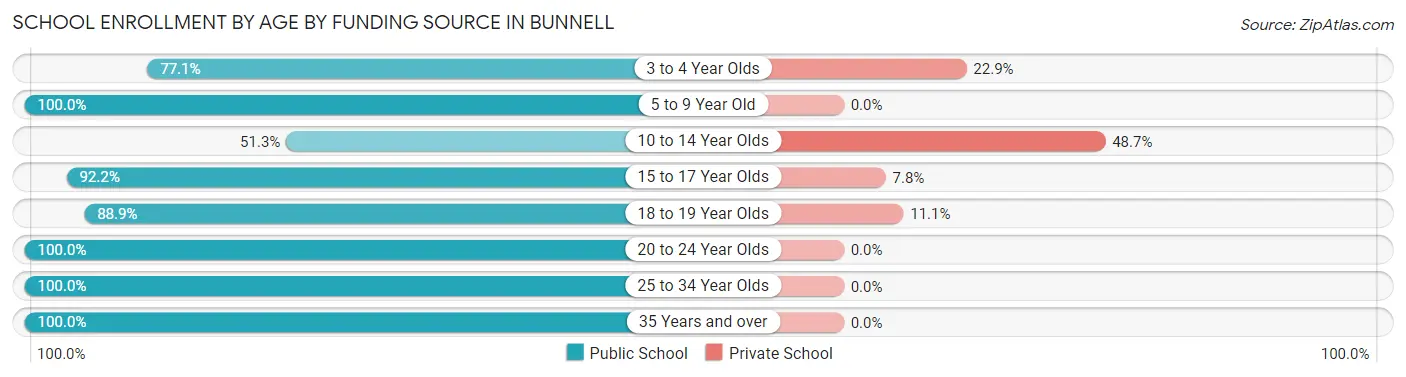
| Age Bracket | Public School | Private School |
| 3 to 4 Year Olds | 54 (77.1%) | 16 (22.9%) |
| 5 to 9 Year Old | 281 (100.0%) | 0 (0.0%) |
| 10 to 14 Year Olds | 40 (51.3%) | 38 (48.7%) |
| 15 to 17 Year Olds | 59 (92.2%) | 5 (7.8%) |
| 18 to 19 Year Olds | 40 (88.9%) | 5 (11.1%) |
| 20 to 24 Year Olds | 4 (100.0%) | 0 (0.0%) |
| 25 to 34 Year Olds | 34 (100.0%) | 0 (0.0%) |
| 35 Years and over | 6 (100.0%) | 0 (0.0%) |
| Total | 518 (89.0%) | 64 (11.0%) |
Educational Attainment by Field of Study in Bunnell
Education (156 | 34.5%), business (99 | 21.9%), science & technology (54 | 11.9%), social sciences (30 | 6.6%), and literature & languages (21 | 4.6%) are the most common fields of study among 452 individuals in Bunnell who have obtained a bachelor's degree or higher.
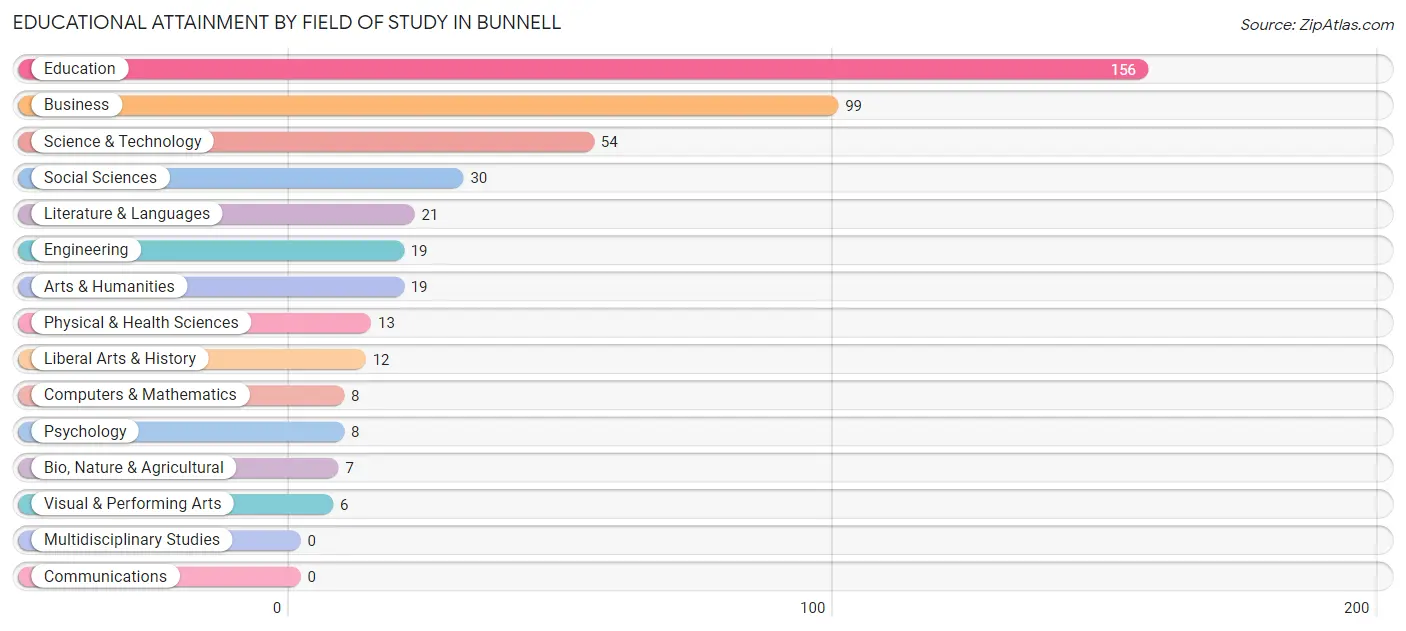
| Field of Study | # Graduates | % Graduates |
| Computers & Mathematics | 8 | 1.8% |
| Bio, Nature & Agricultural | 7 | 1.5% |
| Physical & Health Sciences | 13 | 2.9% |
| Psychology | 8 | 1.8% |
| Social Sciences | 30 | 6.6% |
| Engineering | 19 | 4.2% |
| Multidisciplinary Studies | 0 | 0.0% |
| Science & Technology | 54 | 11.9% |
| Business | 99 | 21.9% |
| Education | 156 | 34.5% |
| Literature & Languages | 21 | 4.6% |
| Liberal Arts & History | 12 | 2.6% |
| Visual & Performing Arts | 6 | 1.3% |
| Communications | 0 | 0.0% |
| Arts & Humanities | 19 | 4.2% |
| Total | 452 | 100.0% |
Transportation & Commute in Bunnell
Vehicle Availability by Sex in Bunnell
The most prevalent vehicle ownership categories in Bunnell are males with 2 vehicles (252, accounting for 43.3%) and females with 2 vehicles (236, making up 43.8%).
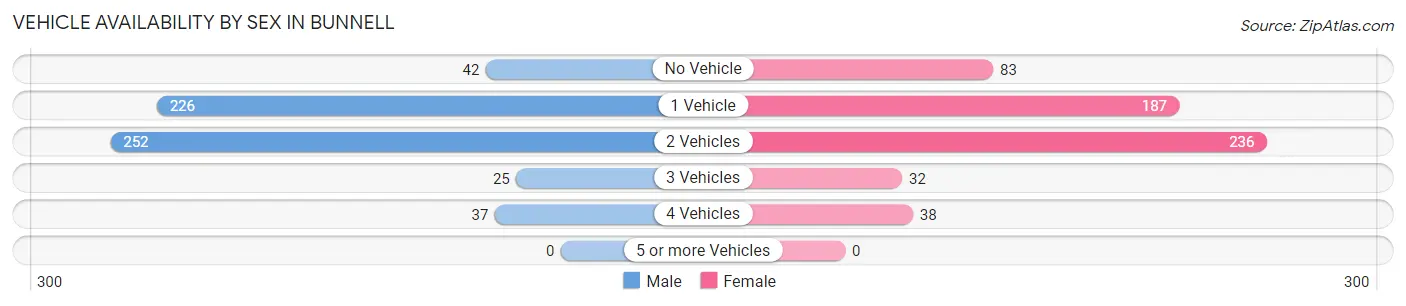
| Vehicles Available | Male | Female |
| No Vehicle | 42 (7.2%) | 83 (14.4%) |
| 1 Vehicle | 226 (38.8%) | 187 (32.5%) |
| 2 Vehicles | 252 (43.3%) | 236 (41.0%) |
| 3 Vehicles | 25 (4.3%) | 32 (5.6%) |
| 4 Vehicles | 37 (6.4%) | 38 (6.6%) |
| 5 or more Vehicles | 0 (0.0%) | 0 (0.0%) |
| Total | 582 (100.0%) | 576 (100.0%) |
Commute Time in Bunnell
The most frequently occuring commute durations in Bunnell are 15 to 19 minutes (237 commuters, 22.3%), 10 to 14 minutes (199 commuters, 18.7%), and 30 to 34 minutes (188 commuters, 17.7%).
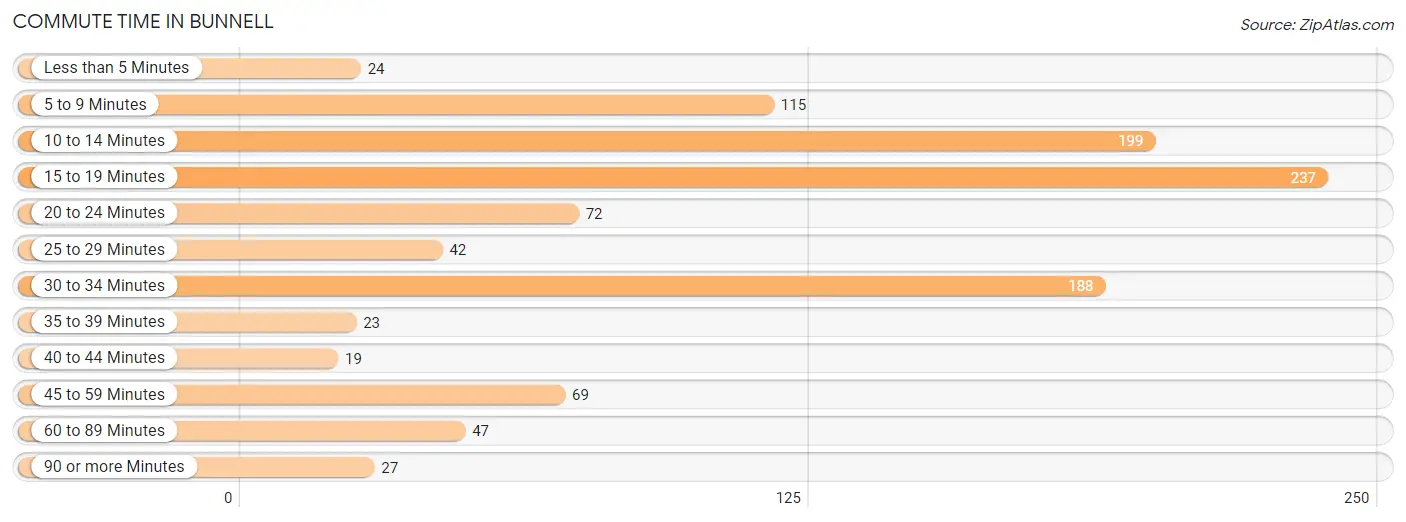
| Commute Time | # Commuters | % Commuters |
| Less than 5 Minutes | 24 | 2.3% |
| 5 to 9 Minutes | 115 | 10.8% |
| 10 to 14 Minutes | 199 | 18.7% |
| 15 to 19 Minutes | 237 | 22.3% |
| 20 to 24 Minutes | 72 | 6.8% |
| 25 to 29 Minutes | 42 | 4.0% |
| 30 to 34 Minutes | 188 | 17.7% |
| 35 to 39 Minutes | 23 | 2.2% |
| 40 to 44 Minutes | 19 | 1.8% |
| 45 to 59 Minutes | 69 | 6.5% |
| 60 to 89 Minutes | 47 | 4.4% |
| 90 or more Minutes | 27 | 2.5% |
Commute Time by Sex in Bunnell
The most common commute times in Bunnell are 15 to 19 minutes (165 commuters, 30.8%) for males and 10 to 14 minutes (139 commuters, 26.4%) for females.
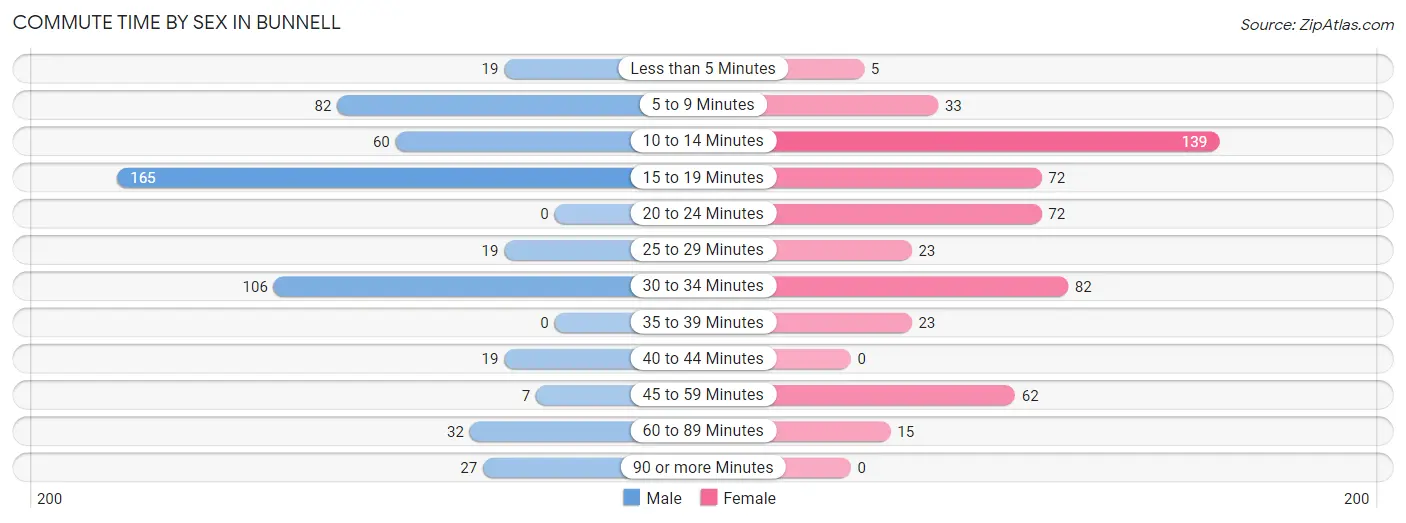
| Commute Time | Male | Female |
| Less than 5 Minutes | 19 (3.5%) | 5 (0.9%) |
| 5 to 9 Minutes | 82 (15.3%) | 33 (6.3%) |
| 10 to 14 Minutes | 60 (11.2%) | 139 (26.4%) |
| 15 to 19 Minutes | 165 (30.8%) | 72 (13.7%) |
| 20 to 24 Minutes | 0 (0.0%) | 72 (13.7%) |
| 25 to 29 Minutes | 19 (3.5%) | 23 (4.4%) |
| 30 to 34 Minutes | 106 (19.8%) | 82 (15.6%) |
| 35 to 39 Minutes | 0 (0.0%) | 23 (4.4%) |
| 40 to 44 Minutes | 19 (3.5%) | 0 (0.0%) |
| 45 to 59 Minutes | 7 (1.3%) | 62 (11.8%) |
| 60 to 89 Minutes | 32 (6.0%) | 15 (2.9%) |
| 90 or more Minutes | 27 (5.0%) | 0 (0.0%) |
Time of Departure to Work by Sex in Bunnell
The most frequent times of departure to work in Bunnell are 8:00 AM to 8:29 AM (200, 37.3%) for males and 7:00 AM to 7:29 AM (114, 21.7%) for females.
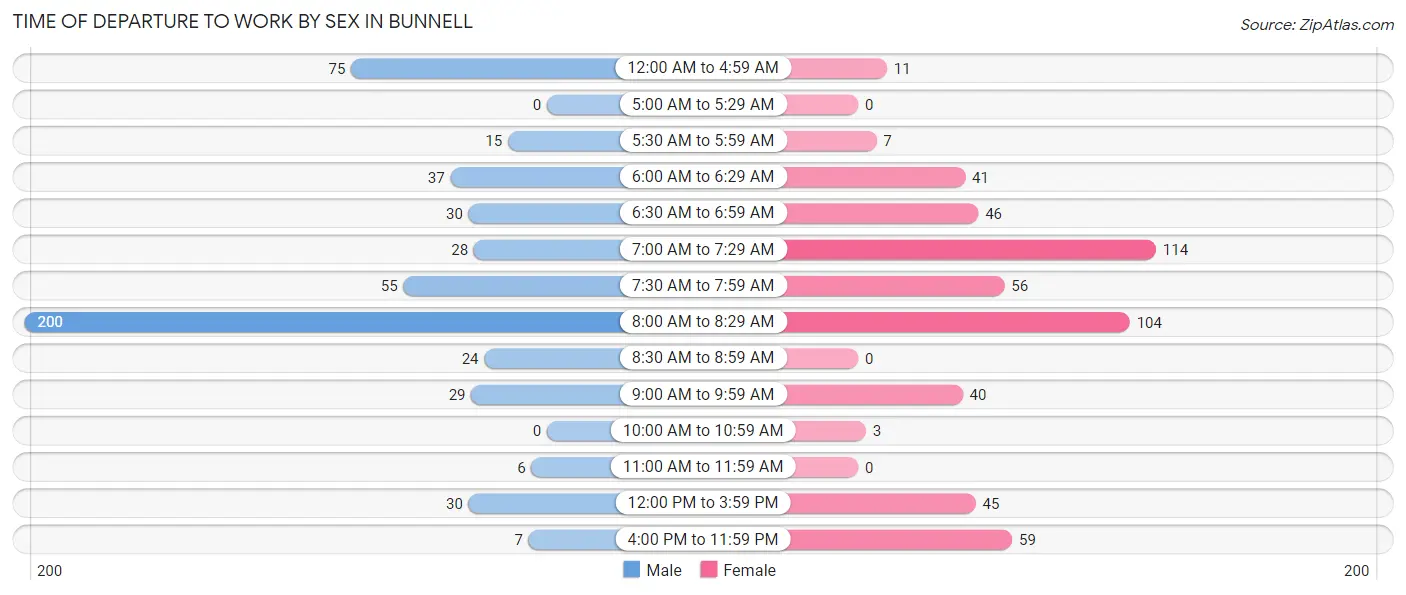
| Time of Departure | Male | Female |
| 12:00 AM to 4:59 AM | 75 (14.0%) | 11 (2.1%) |
| 5:00 AM to 5:29 AM | 0 (0.0%) | 0 (0.0%) |
| 5:30 AM to 5:59 AM | 15 (2.8%) | 7 (1.3%) |
| 6:00 AM to 6:29 AM | 37 (6.9%) | 41 (7.8%) |
| 6:30 AM to 6:59 AM | 30 (5.6%) | 46 (8.7%) |
| 7:00 AM to 7:29 AM | 28 (5.2%) | 114 (21.7%) |
| 7:30 AM to 7:59 AM | 55 (10.3%) | 56 (10.6%) |
| 8:00 AM to 8:29 AM | 200 (37.3%) | 104 (19.8%) |
| 8:30 AM to 8:59 AM | 24 (4.5%) | 0 (0.0%) |
| 9:00 AM to 9:59 AM | 29 (5.4%) | 40 (7.6%) |
| 10:00 AM to 10:59 AM | 0 (0.0%) | 3 (0.6%) |
| 11:00 AM to 11:59 AM | 6 (1.1%) | 0 (0.0%) |
| 12:00 PM to 3:59 PM | 30 (5.6%) | 45 (8.6%) |
| 4:00 PM to 11:59 PM | 7 (1.3%) | 59 (11.2%) |
| Total | 536 (100.0%) | 526 (100.0%) |
Housing Occupancy in Bunnell
Occupancy by Ownership in Bunnell
Of the total 1,468 dwellings in Bunnell, owner-occupied units account for 743 (50.6%), while renter-occupied units make up 725 (49.4%).
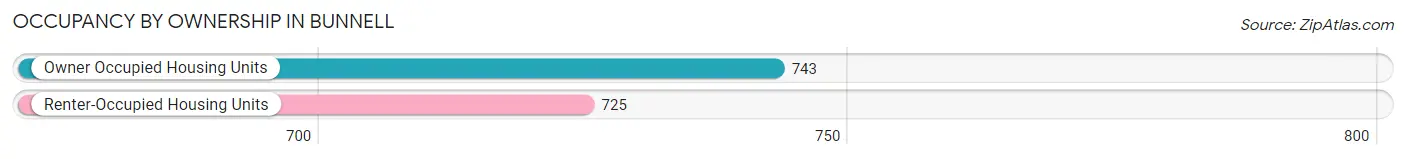
| Occupancy | # Housing Units | % Housing Units |
| Owner Occupied Housing Units | 743 | 50.6% |
| Renter-Occupied Housing Units | 725 | 49.4% |
| Total Occupied Housing Units | 1,468 | 100.0% |
Occupancy by Household Size in Bunnell
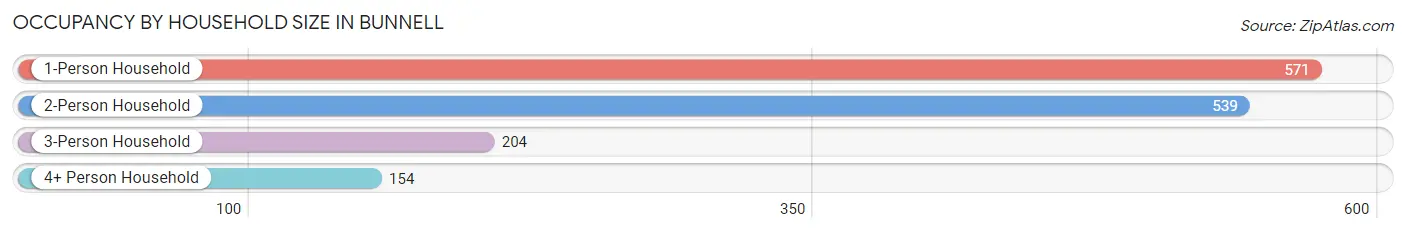
| Household Size | # Housing Units | % Housing Units |
| 1-Person Household | 571 | 38.9% |
| 2-Person Household | 539 | 36.7% |
| 3-Person Household | 204 | 13.9% |
| 4+ Person Household | 154 | 10.5% |
| Total Housing Units | 1,468 | 100.0% |
Occupancy by Ownership by Household Size in Bunnell
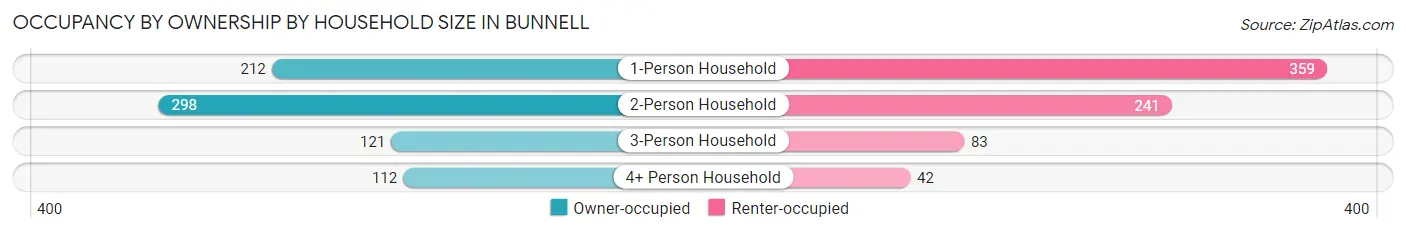
| Household Size | Owner-occupied | Renter-occupied |
| 1-Person Household | 212 (37.1%) | 359 (62.9%) |
| 2-Person Household | 298 (55.3%) | 241 (44.7%) |
| 3-Person Household | 121 (59.3%) | 83 (40.7%) |
| 4+ Person Household | 112 (72.7%) | 42 (27.3%) |
| Total Housing Units | 743 (50.6%) | 725 (49.4%) |
Occupancy by Educational Attainment in Bunnell
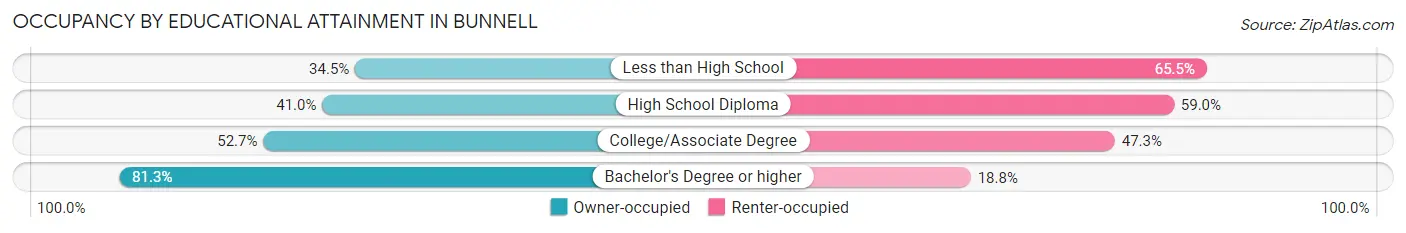
| Household Size | Owner-occupied | Renter-occupied |
| Less than High School | 51 (34.5%) | 97 (65.5%) |
| High School Diploma | 268 (41.0%) | 386 (59.0%) |
| College/Associate Degree | 216 (52.7%) | 194 (47.3%) |
| Bachelor's Degree or higher | 208 (81.2%) | 48 (18.8%) |
Occupancy by Age of Householder in Bunnell
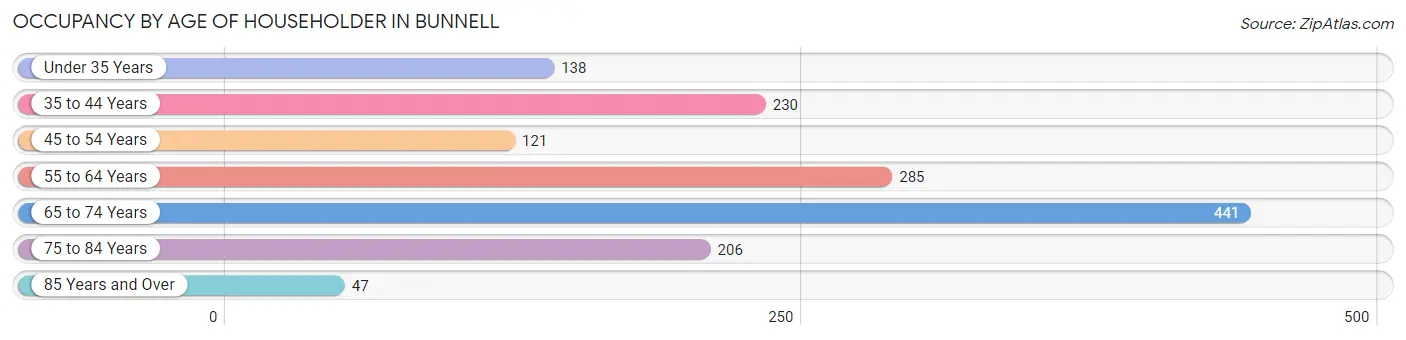
| Age Bracket | # Households | % Households |
| Under 35 Years | 138 | 9.4% |
| 35 to 44 Years | 230 | 15.7% |
| 45 to 54 Years | 121 | 8.2% |
| 55 to 64 Years | 285 | 19.4% |
| 65 to 74 Years | 441 | 30.0% |
| 75 to 84 Years | 206 | 14.0% |
| 85 Years and Over | 47 | 3.2% |
| Total | 1,468 | 100.0% |
Housing Finances in Bunnell
Median Income by Occupancy in Bunnell
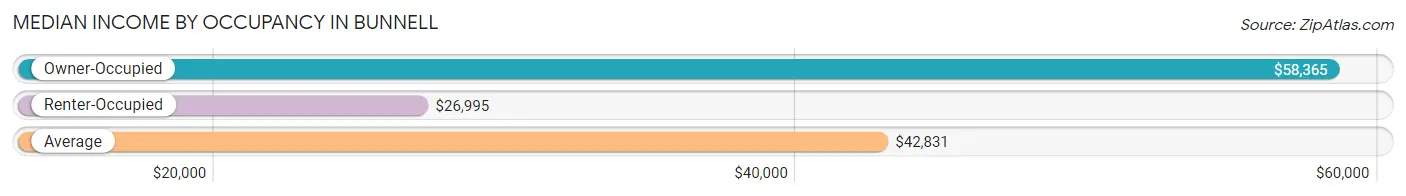
| Occupancy Type | # Households | Median Income |
| Owner-Occupied | 743 (50.6%) | $58,365 |
| Renter-Occupied | 725 (49.4%) | $26,995 |
| Average | 1,468 (100.0%) | $42,831 |
Occupancy by Householder Income Bracket in Bunnell
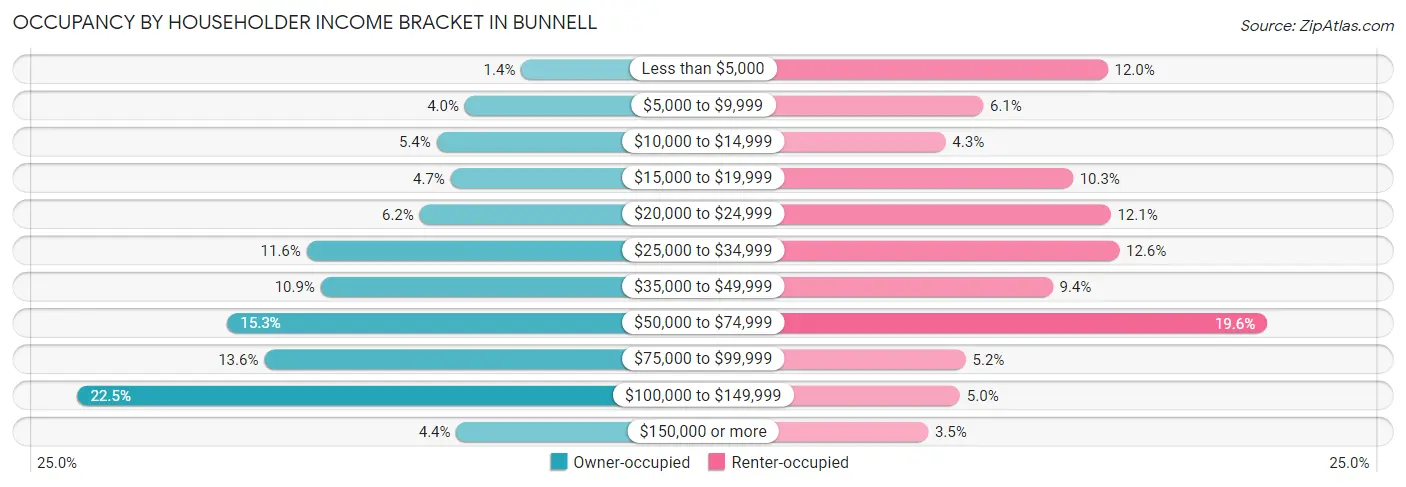
| Income Bracket | Owner-occupied | Renter-occupied |
| Less than $5,000 | 10 (1.3%) | 87 (12.0%) |
| $5,000 to $9,999 | 30 (4.0%) | 44 (6.1%) |
| $10,000 to $14,999 | 40 (5.4%) | 31 (4.3%) |
| $15,000 to $19,999 | 35 (4.7%) | 75 (10.3%) |
| $20,000 to $24,999 | 46 (6.2%) | 88 (12.1%) |
| $25,000 to $34,999 | 86 (11.6%) | 91 (12.6%) |
| $35,000 to $49,999 | 81 (10.9%) | 68 (9.4%) |
| $50,000 to $74,999 | 114 (15.3%) | 142 (19.6%) |
| $75,000 to $99,999 | 101 (13.6%) | 38 (5.2%) |
| $100,000 to $149,999 | 167 (22.5%) | 36 (5.0%) |
| $150,000 or more | 33 (4.4%) | 25 (3.5%) |
| Total | 743 (100.0%) | 725 (100.0%) |
Monthly Housing Cost Tiers in Bunnell
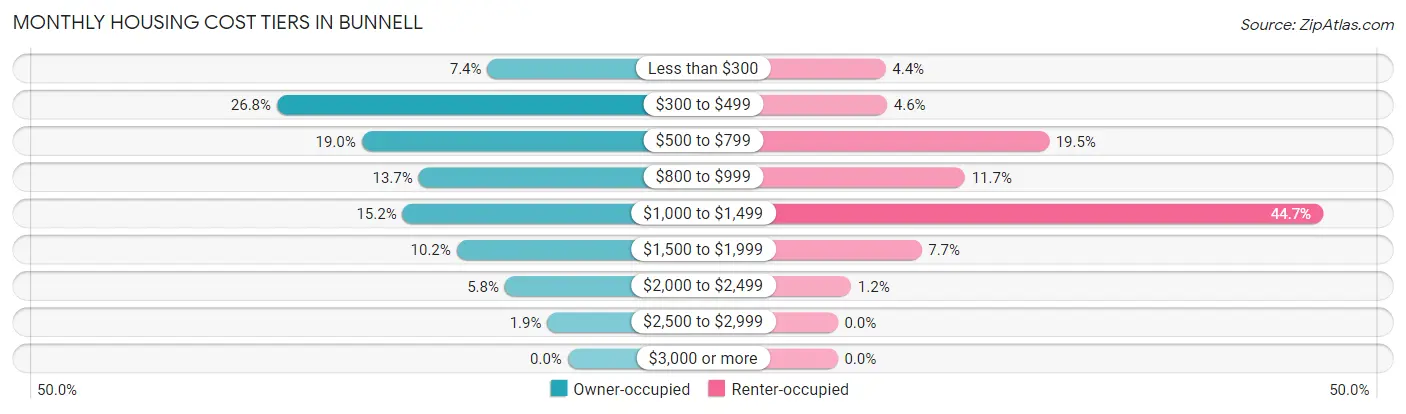
| Monthly Cost | Owner-occupied | Renter-occupied |
| Less than $300 | 55 (7.4%) | 32 (4.4%) |
| $300 to $499 | 199 (26.8%) | 33 (4.5%) |
| $500 to $799 | 141 (19.0%) | 141 (19.5%) |
| $800 to $999 | 102 (13.7%) | 85 (11.7%) |
| $1,000 to $1,499 | 113 (15.2%) | 324 (44.7%) |
| $1,500 to $1,999 | 76 (10.2%) | 56 (7.7%) |
| $2,000 to $2,499 | 43 (5.8%) | 9 (1.2%) |
| $2,500 to $2,999 | 14 (1.9%) | 0 (0.0%) |
| $3,000 or more | 0 (0.0%) | 0 (0.0%) |
| Total | 743 (100.0%) | 725 (100.0%) |
Physical Housing Characteristics in Bunnell
Housing Structures in Bunnell
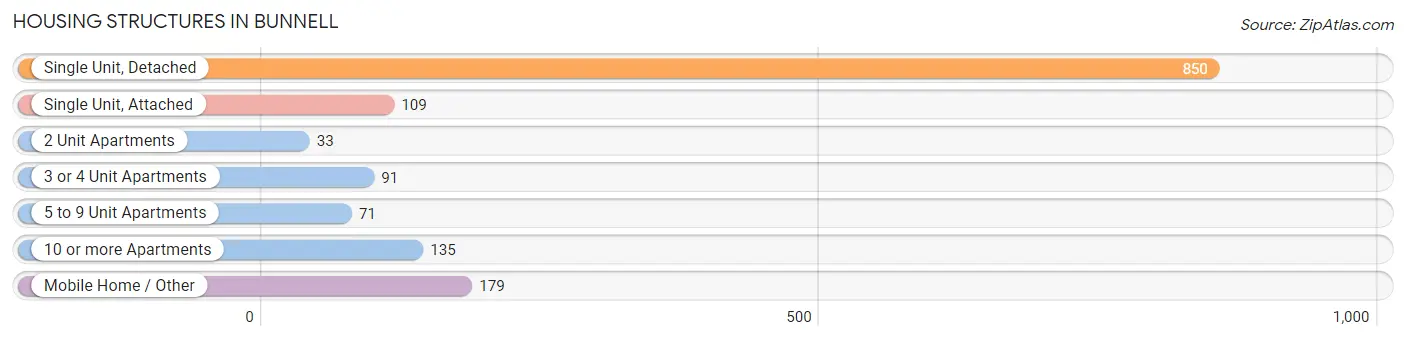
| Structure Type | # Housing Units | % Housing Units |
| Single Unit, Detached | 850 | 57.9% |
| Single Unit, Attached | 109 | 7.4% |
| 2 Unit Apartments | 33 | 2.2% |
| 3 or 4 Unit Apartments | 91 | 6.2% |
| 5 to 9 Unit Apartments | 71 | 4.8% |
| 10 or more Apartments | 135 | 9.2% |
| Mobile Home / Other | 179 | 12.2% |
| Total | 1,468 | 100.0% |
Housing Structures by Occupancy in Bunnell
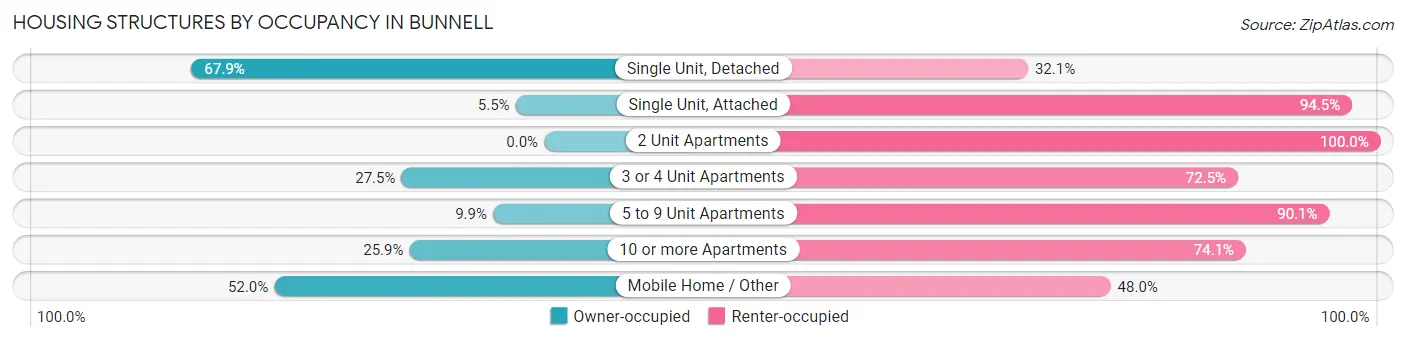
| Structure Type | Owner-occupied | Renter-occupied |
| Single Unit, Detached | 577 (67.9%) | 273 (32.1%) |
| Single Unit, Attached | 6 (5.5%) | 103 (94.5%) |
| 2 Unit Apartments | 0 (0.0%) | 33 (100.0%) |
| 3 or 4 Unit Apartments | 25 (27.5%) | 66 (72.5%) |
| 5 to 9 Unit Apartments | 7 (9.9%) | 64 (90.1%) |
| 10 or more Apartments | 35 (25.9%) | 100 (74.1%) |
| Mobile Home / Other | 93 (52.0%) | 86 (48.0%) |
| Total | 743 (50.6%) | 725 (49.4%) |
Housing Structures by Number of Rooms in Bunnell
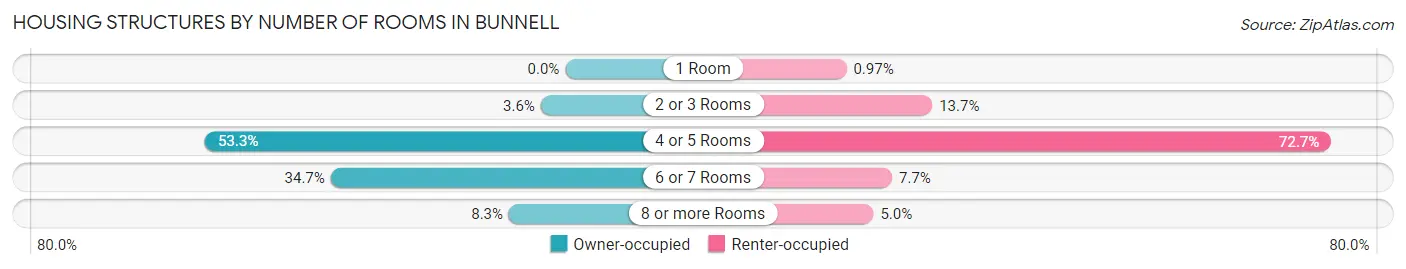
| Number of Rooms | Owner-occupied | Renter-occupied |
| 1 Room | 0 (0.0%) | 7 (1.0%) |
| 2 or 3 Rooms | 27 (3.6%) | 99 (13.7%) |
| 4 or 5 Rooms | 396 (53.3%) | 527 (72.7%) |
| 6 or 7 Rooms | 258 (34.7%) | 56 (7.7%) |
| 8 or more Rooms | 62 (8.3%) | 36 (5.0%) |
| Total | 743 (100.0%) | 725 (100.0%) |
Housing Structure by Heating Type in Bunnell
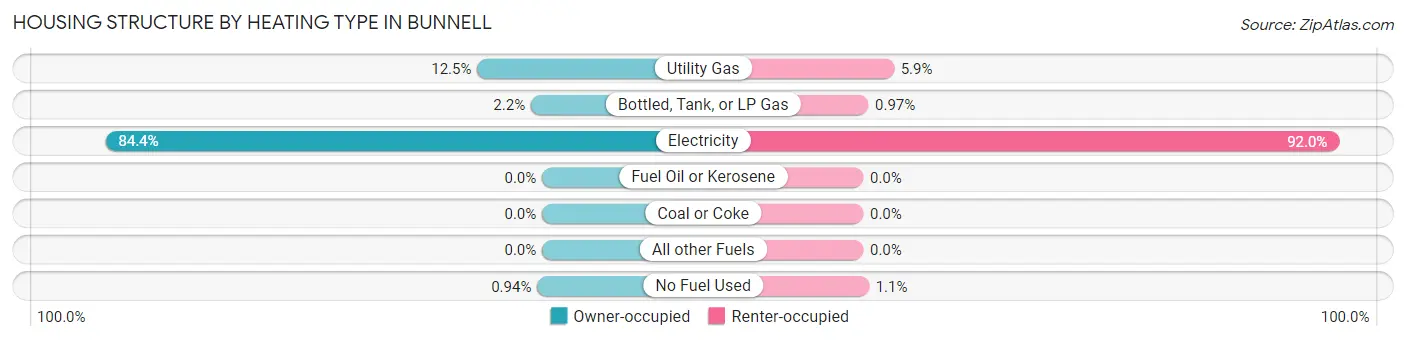
| Heating Type | Owner-occupied | Renter-occupied |
| Utility Gas | 93 (12.5%) | 43 (5.9%) |
| Bottled, Tank, or LP Gas | 16 (2.1%) | 7 (1.0%) |
| Electricity | 627 (84.4%) | 667 (92.0%) |
| Fuel Oil or Kerosene | 0 (0.0%) | 0 (0.0%) |
| Coal or Coke | 0 (0.0%) | 0 (0.0%) |
| All other Fuels | 0 (0.0%) | 0 (0.0%) |
| No Fuel Used | 7 (0.9%) | 8 (1.1%) |
| Total | 743 (100.0%) | 725 (100.0%) |
Household Vehicle Usage in Bunnell
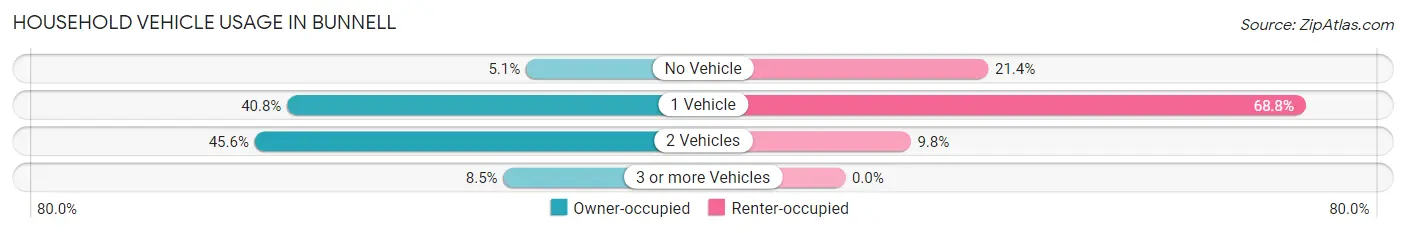
| Vehicles per Household | Owner-occupied | Renter-occupied |
| No Vehicle | 38 (5.1%) | 155 (21.4%) |
| 1 Vehicle | 303 (40.8%) | 499 (68.8%) |
| 2 Vehicles | 339 (45.6%) | 71 (9.8%) |
| 3 or more Vehicles | 63 (8.5%) | 0 (0.0%) |
| Total | 743 (100.0%) | 725 (100.0%) |
Real Estate & Mortgages in Bunnell
Real Estate and Mortgage Overview in Bunnell
| Characteristic | Without Mortgage | With Mortgage |
| Housing Units | 390 | 353 |
| Median Property Value | $123,200 | $286,000 |
| Median Household Income | $55,455 | $28 |
| Monthly Housing Costs | $456 | $0 |
| Real Estate Taxes | $1,254 | $66 |
Property Value by Mortgage Status in Bunnell
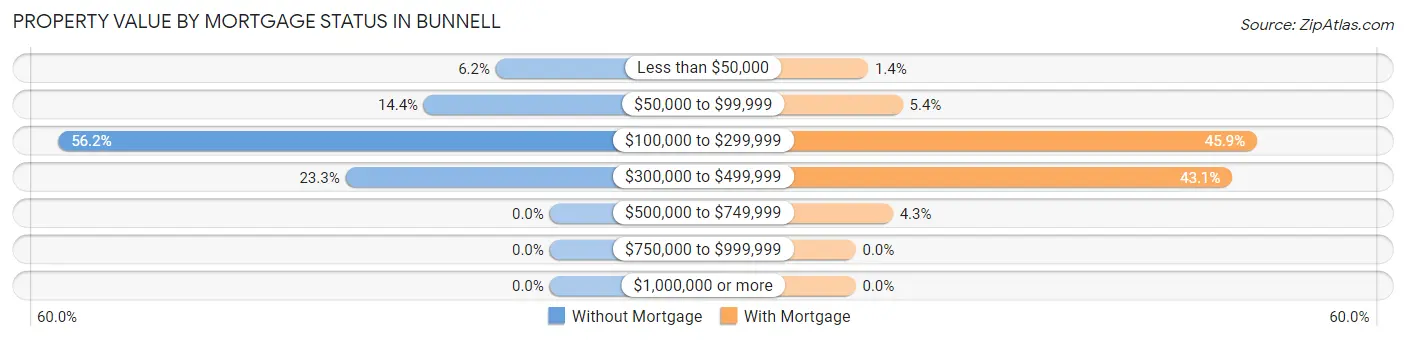
| Property Value | Without Mortgage | With Mortgage |
| Less than $50,000 | 24 (6.1%) | 5 (1.4%) |
| $50,000 to $99,999 | 56 (14.4%) | 19 (5.4%) |
| $100,000 to $299,999 | 219 (56.1%) | 162 (45.9%) |
| $300,000 to $499,999 | 91 (23.3%) | 152 (43.1%) |
| $500,000 to $749,999 | 0 (0.0%) | 15 (4.3%) |
| $750,000 to $999,999 | 0 (0.0%) | 0 (0.0%) |
| $1,000,000 or more | 0 (0.0%) | 0 (0.0%) |
| Total | 390 (100.0%) | 353 (100.0%) |
Household Income by Mortgage Status in Bunnell
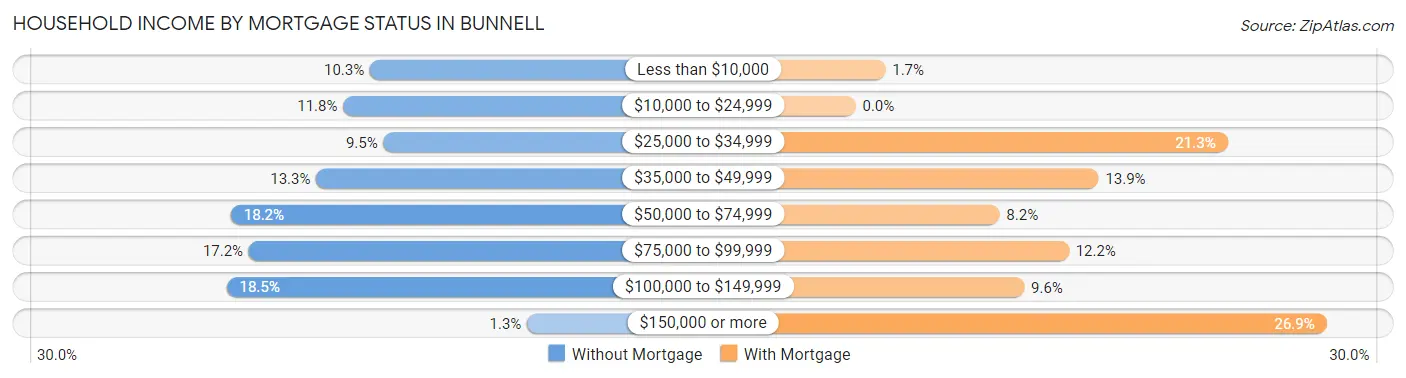
| Household Income | Without Mortgage | With Mortgage |
| Less than $10,000 | 40 (10.3%) | 6 (1.7%) |
| $10,000 to $24,999 | 46 (11.8%) | 0 (0.0%) |
| $25,000 to $34,999 | 37 (9.5%) | 75 (21.2%) |
| $35,000 to $49,999 | 52 (13.3%) | 49 (13.9%) |
| $50,000 to $74,999 | 71 (18.2%) | 29 (8.2%) |
| $75,000 to $99,999 | 67 (17.2%) | 43 (12.2%) |
| $100,000 to $149,999 | 72 (18.5%) | 34 (9.6%) |
| $150,000 or more | 5 (1.3%) | 95 (26.9%) |
| Total | 390 (100.0%) | 353 (100.0%) |
Property Value to Household Income Ratio in Bunnell
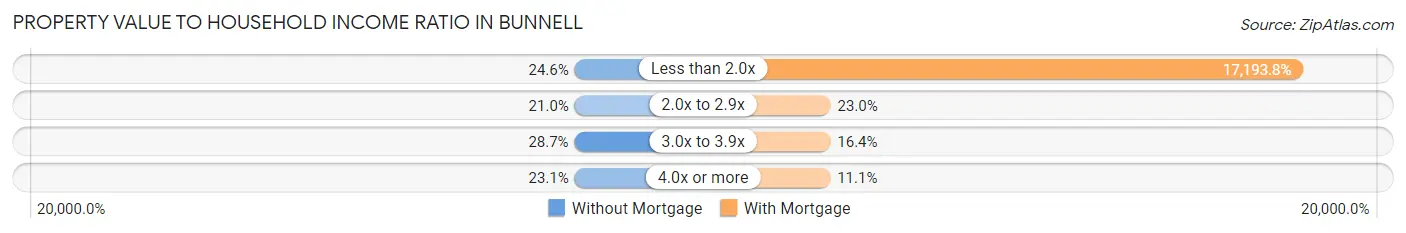
| Value-to-Income Ratio | Without Mortgage | With Mortgage |
| Less than 2.0x | 96 (24.6%) | 60,694 (17,193.8%) |
| 2.0x to 2.9x | 82 (21.0%) | 81 (23.0%) |
| 3.0x to 3.9x | 112 (28.7%) | 58 (16.4%) |
| 4.0x or more | 90 (23.1%) | 39 (11.1%) |
| Total | 390 (100.0%) | 353 (100.0%) |
Real Estate Taxes by Mortgage Status in Bunnell
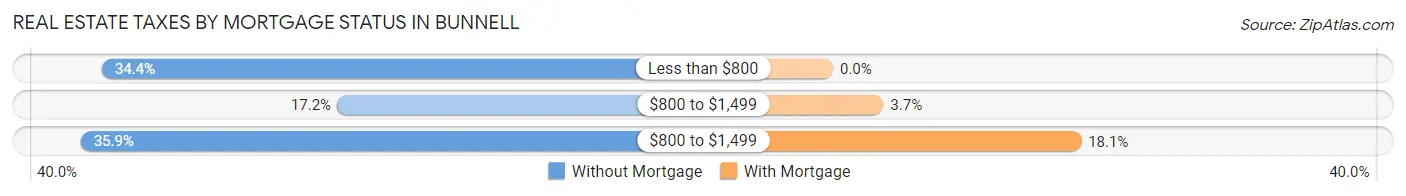
| Property Taxes | Without Mortgage | With Mortgage |
| Less than $800 | 134 (34.4%) | 0 (0.0%) |
| $800 to $1,499 | 67 (17.2%) | 13 (3.7%) |
| $800 to $1,499 | 140 (35.9%) | 64 (18.1%) |
| Total | 390 (100.0%) | 353 (100.0%) |
Health & Disability in Bunnell
Health Insurance Coverage by Age in Bunnell
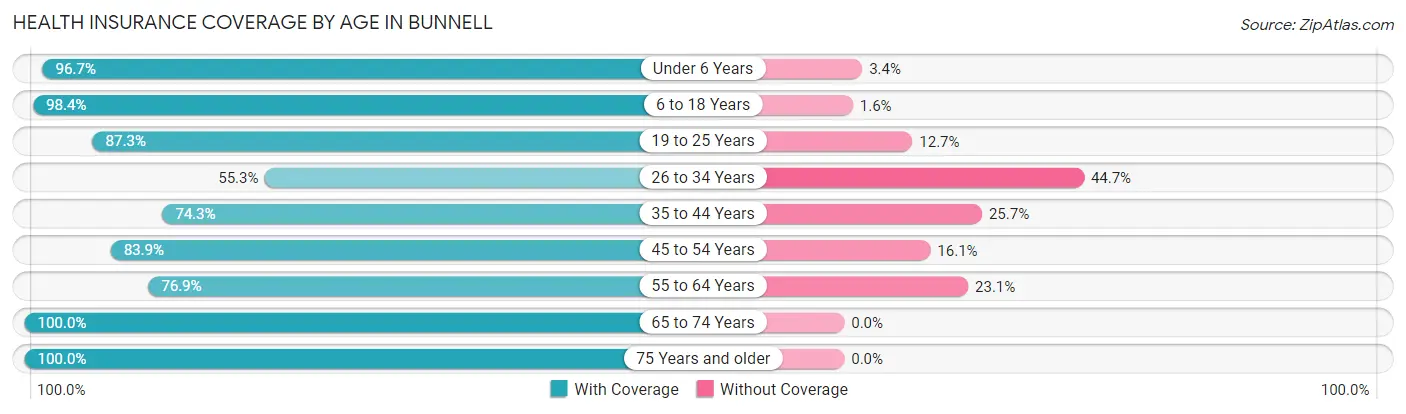
| Age Bracket | With Coverage | Without Coverage |
| Under 6 Years | 231 (96.7%) | 8 (3.4%) |
| 6 to 18 Years | 368 (98.4%) | 6 (1.6%) |
| 19 to 25 Years | 172 (87.3%) | 25 (12.7%) |
| 26 to 34 Years | 99 (55.3%) | 80 (44.7%) |
| 35 to 44 Years | 330 (74.3%) | 114 (25.7%) |
| 45 to 54 Years | 298 (83.9%) | 57 (16.1%) |
| 55 to 64 Years | 333 (76.9%) | 100 (23.1%) |
| 65 to 74 Years | 687 (100.0%) | 0 (0.0%) |
| 75 Years and older | 294 (100.0%) | 0 (0.0%) |
| Total | 2,812 (87.8%) | 390 (12.2%) |
Health Insurance Coverage by Citizenship Status in Bunnell
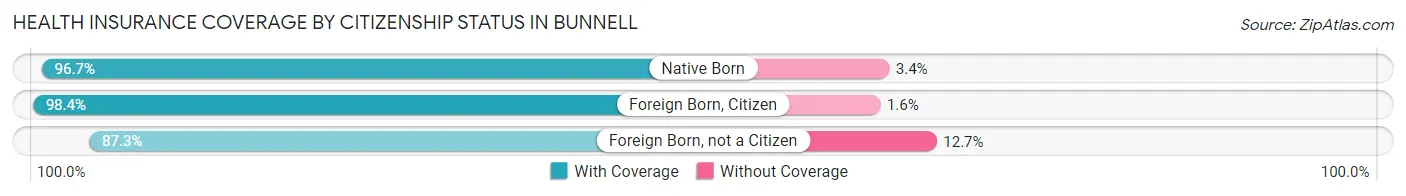
| Citizenship Status | With Coverage | Without Coverage |
| Native Born | 231 (96.7%) | 8 (3.4%) |
| Foreign Born, Citizen | 368 (98.4%) | 6 (1.6%) |
| Foreign Born, not a Citizen | 172 (87.3%) | 25 (12.7%) |
Health Insurance Coverage by Household Income in Bunnell
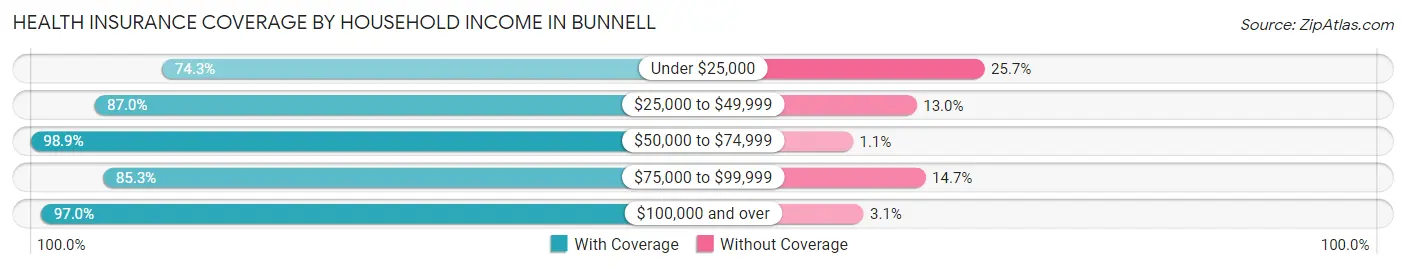
| Household Income | With Coverage | Without Coverage |
| Under $25,000 | 560 (74.3%) | 194 (25.7%) |
| $25,000 to $49,999 | 581 (87.0%) | 87 (13.0%) |
| $50,000 to $74,999 | 557 (98.9%) | 6 (1.1%) |
| $75,000 to $99,999 | 308 (85.3%) | 53 (14.7%) |
| $100,000 and over | 796 (97.0%) | 25 (3.0%) |
Public vs Private Health Insurance Coverage by Age in Bunnell
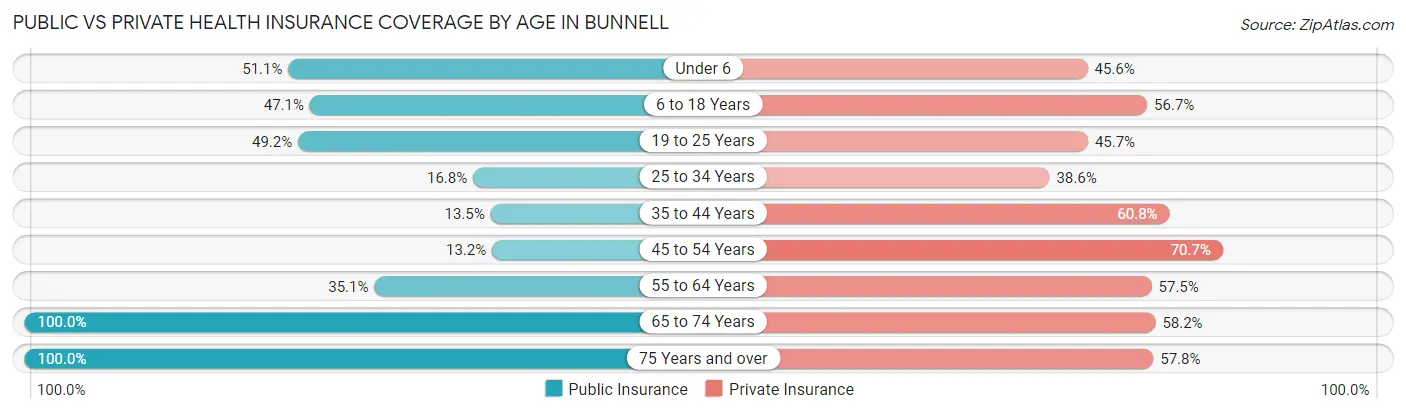
| Age Bracket | Public Insurance | Private Insurance |
| Under 6 | 122 (51.0%) | 109 (45.6%) |
| 6 to 18 Years | 176 (47.1%) | 212 (56.7%) |
| 19 to 25 Years | 97 (49.2%) | 90 (45.7%) |
| 25 to 34 Years | 30 (16.8%) | 69 (38.6%) |
| 35 to 44 Years | 60 (13.5%) | 270 (60.8%) |
| 45 to 54 Years | 47 (13.2%) | 251 (70.7%) |
| 55 to 64 Years | 152 (35.1%) | 249 (57.5%) |
| 65 to 74 Years | 687 (100.0%) | 400 (58.2%) |
| 75 Years and over | 294 (100.0%) | 170 (57.8%) |
| Total | 1,665 (52.0%) | 1,820 (56.8%) |
Disability Status by Sex by Age in Bunnell
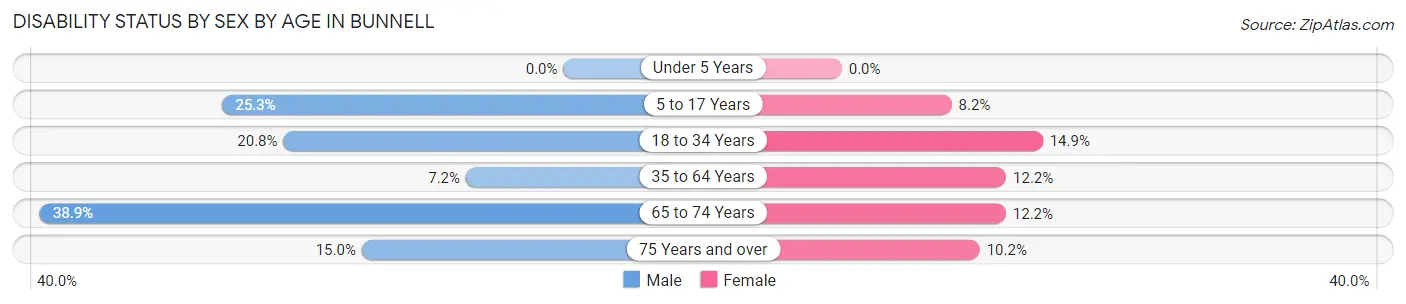
| Age Bracket | Male | Female |
| Under 5 Years | 0 (0.0%) | 0 (0.0%) |
| 5 to 17 Years | 40 (25.3%) | 22 (8.2%) |
| 18 to 34 Years | 21 (20.8%) | 47 (14.9%) |
| 35 to 64 Years | 50 (7.2%) | 66 (12.2%) |
| 65 to 74 Years | 82 (38.9%) | 58 (12.2%) |
| 75 Years and over | 25 (15.0%) | 13 (10.2%) |
Disability Class by Sex by Age in Bunnell
Disability Class: Hearing Difficulty
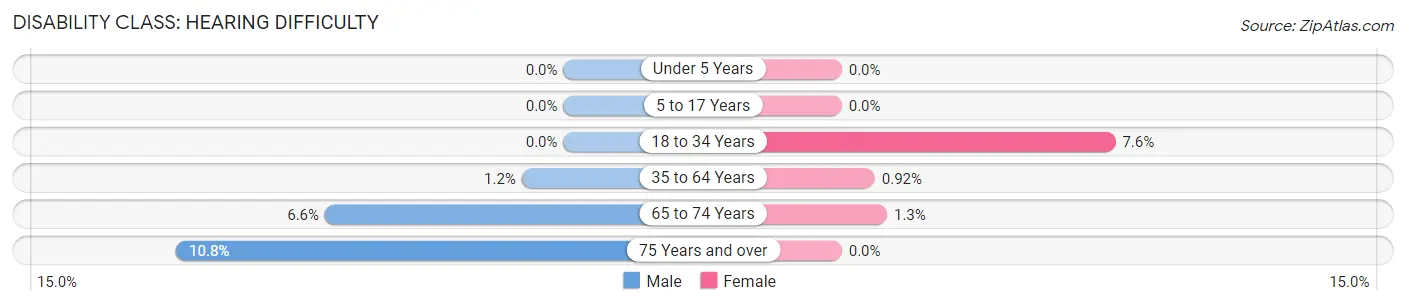
| Age Bracket | Male | Female |
| Under 5 Years | 0 (0.0%) | 0 (0.0%) |
| 5 to 17 Years | 0 (0.0%) | 0 (0.0%) |
| 18 to 34 Years | 0 (0.0%) | 24 (7.6%) |
| 35 to 64 Years | 8 (1.2%) | 5 (0.9%) |
| 65 to 74 Years | 14 (6.6%) | 6 (1.3%) |
| 75 Years and over | 18 (10.8%) | 0 (0.0%) |
Disability Class: Vision Difficulty
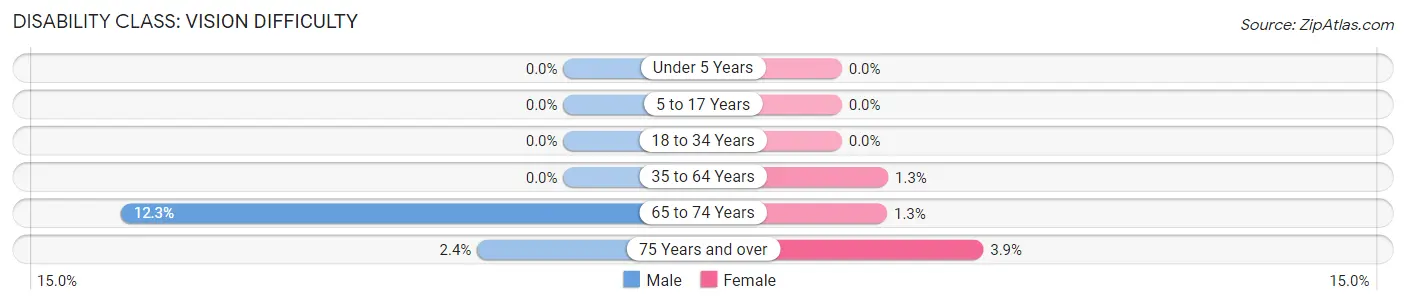
| Age Bracket | Male | Female |
| Under 5 Years | 0 (0.0%) | 0 (0.0%) |
| 5 to 17 Years | 0 (0.0%) | 0 (0.0%) |
| 18 to 34 Years | 0 (0.0%) | 0 (0.0%) |
| 35 to 64 Years | 0 (0.0%) | 7 (1.3%) |
| 65 to 74 Years | 26 (12.3%) | 6 (1.3%) |
| 75 Years and over | 4 (2.4%) | 5 (3.9%) |
Disability Class: Cognitive Difficulty
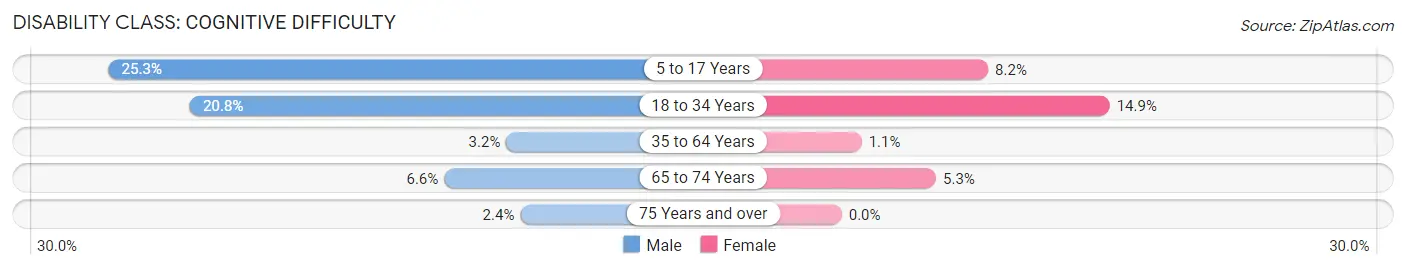
| Age Bracket | Male | Female |
| 5 to 17 Years | 40 (25.3%) | 22 (8.2%) |
| 18 to 34 Years | 21 (20.8%) | 47 (14.9%) |
| 35 to 64 Years | 22 (3.2%) | 6 (1.1%) |
| 65 to 74 Years | 14 (6.6%) | 25 (5.2%) |
| 75 Years and over | 4 (2.4%) | 0 (0.0%) |
Disability Class: Ambulatory Difficulty
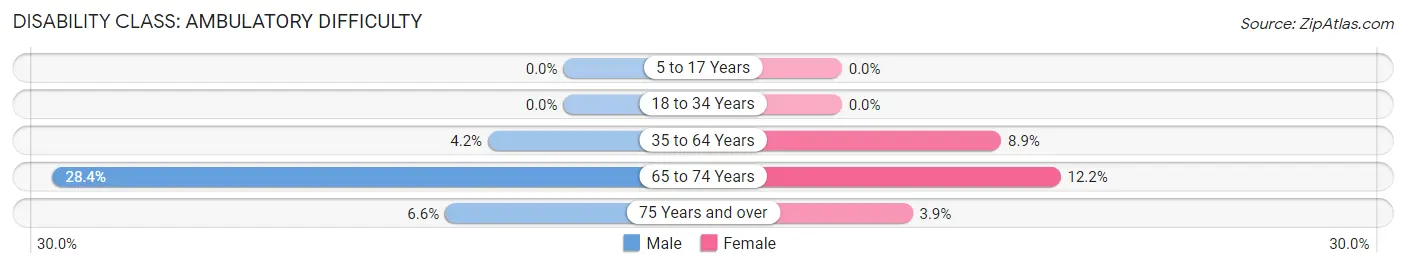
| Age Bracket | Male | Female |
| 5 to 17 Years | 0 (0.0%) | 0 (0.0%) |
| 18 to 34 Years | 0 (0.0%) | 0 (0.0%) |
| 35 to 64 Years | 29 (4.2%) | 48 (8.9%) |
| 65 to 74 Years | 60 (28.4%) | 58 (12.2%) |
| 75 Years and over | 11 (6.6%) | 5 (3.9%) |
Disability Class: Self-Care Difficulty
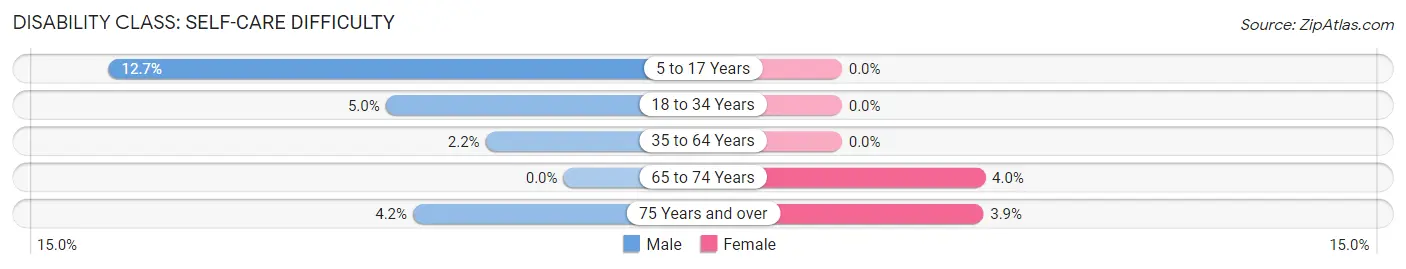
| Age Bracket | Male | Female |
| 5 to 17 Years | 20 (12.7%) | 0 (0.0%) |
| 18 to 34 Years | 5 (5.0%) | 0 (0.0%) |
| 35 to 64 Years | 15 (2.2%) | 0 (0.0%) |
| 65 to 74 Years | 0 (0.0%) | 19 (4.0%) |
| 75 Years and over | 7 (4.2%) | 5 (3.9%) |
Technology Access in Bunnell
Computing Device Access in Bunnell
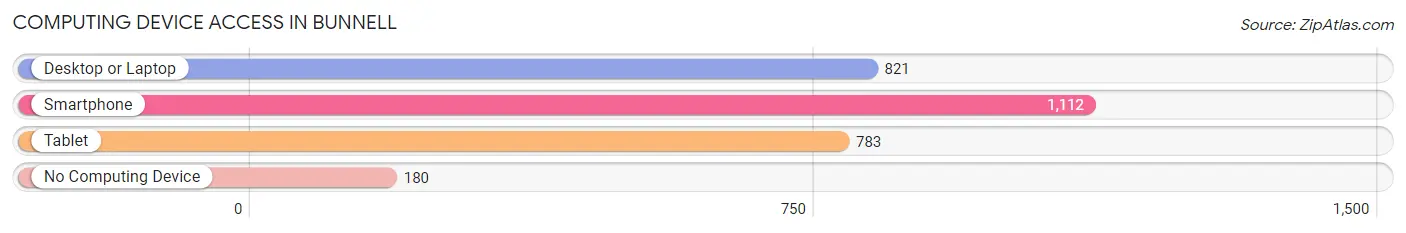
| Device Type | # Households | % Households |
| Desktop or Laptop | 821 | 55.9% |
| Smartphone | 1,112 | 75.7% |
| Tablet | 783 | 53.3% |
| No Computing Device | 180 | 12.3% |
| Total | 1,468 | 100.0% |
Internet Access in Bunnell
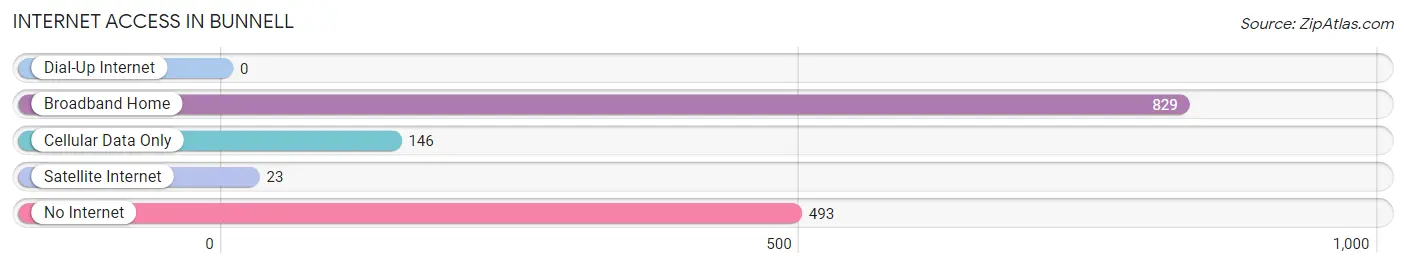
| Internet Type | # Households | % Households |
| Dial-Up Internet | 0 | 0.0% |
| Broadband Home | 829 | 56.5% |
| Cellular Data Only | 146 | 10.0% |
| Satellite Internet | 23 | 1.6% |
| No Internet | 493 | 33.6% |
| Total | 1,468 | 100.0% |
Bunnell Summary
Bunnell is a city located in Flagler County, Florida, United States. The population was 2,676 at the 2010 census. It is the county seat of Flagler County. Bunnell is located in the heart of the Florida peninsula, approximately 50 miles northeast of Daytona Beach and 50 miles southwest of Jacksonville.
History
Bunnell was founded in 1882 by George Moody and named after Alvah A. Bunnell, a railroad official. The town was incorporated in 1925. Bunnell was the first county seat of Flagler County, which was created in 1917. The county seat was moved to nearby Palm Coast in 1999.
Geography
Bunnell is located at 29°31'N 81°25'W (29.5179, -81.4133). According to the United States Census Bureau, the city has a total area of 2.3 square miles (6.0 km2), all land.
Economy
The economy of Bunnell is largely based on agriculture and tourism. The city is home to several farms, including the Flagler County Farm Bureau, which produces a variety of fruits and vegetables. Bunnell is also home to several tourist attractions, including the Flagler County Historical Museum, the Flagler County Art League, and the Flagler County Fairgrounds.
Demographics
As of the census of 2000, there were 2,890 people, 1,093 households, and 745 families residing in the city. The population density was 1,250.3 people per square mile (482.2/km2). There were 1,223 housing units at an average density of 527.2 per square mile (203.5/km2). The racial makeup of the city was 79.17% White, 15.90% African American, 0.17% Native American, 0.17% Asian, 0.03% Pacific Islander, 3.45% from other races, and 1.11% from two or more races. Hispanic or Latino of any race were 8.45% of the population.
There were 1,093 households, out of which 28.2% had children under the age of 18 living with them, 48.2% were married couples living together, 15.2% had a female householder with no husband present, and 32.2% were non-families. 27.2% of all households were made up of individuals, and 14.2% had someone living alone who was 65 years of age or older. The average household size was 2.53 and the average family size was 3.06.
In the city, the population was spread out, with 24.2% under the age of 18, 8.2% from 18 to 24, 24.2% from 25 to 44, 22.2% from 45 to 64, and 21.2% who were 65 years of age or older. The median age was 40 years. For every 100 females, there were 91.2 males. For every 100 females age 18 and over, there were 87.2 males.
The median income for a household in the city was $30,938, and the median income for a family was $36,250. Males had a median income of $27,500 versus $20,938 for females. The per capita income for the city was $14,945. About 11.2% of families and 14.2% of the population were below the poverty line, including 19.2% of those under age 18 and 11.2% of those age 65 or over.
Common Questions
What is Per Capita Income in Bunnell?
Per Capita income in Bunnell is $25,278.
What is the Median Family Income in Bunnell?
Median Family Income in Bunnell is $57,159.
What is the Median Household income in Bunnell?
Median Household Income in Bunnell is $42,831.
What is Income or Wage Gap in Bunnell?
Income or Wage Gap in Bunnell is 25.0%.
Women in Bunnell earn 75.0 cents for every dollar earned by a man.
What is Inequality or Gini Index in Bunnell?
Inequality or Gini Index in Bunnell is 0.44.
What is the Total Population of Bunnell?
Total Population of Bunnell is 3,355.
What is the Total Male Population of Bunnell?
Total Male Population of Bunnell is 1,494.
What is the Total Female Population of Bunnell?
Total Female Population of Bunnell is 1,861.
What is the Ratio of Males per 100 Females in Bunnell?
There are 80.28 Males per 100 Females in Bunnell.
What is the Ratio of Females per 100 Males in Bunnell?
There are 124.56 Females per 100 Males in Bunnell.
What is the Median Population Age in Bunnell?
Median Population Age in Bunnell is 51.4 Years.
What is the Average Family Size in Bunnell
Average Family Size in Bunnell is 3.1 People.
What is the Average Household Size in Bunnell
Average Household Size in Bunnell is 2.2 People.
How Large is the Labor Force in Bunnell?
There are 1,222 People in the Labor Forcein in Bunnell.
What is the Percentage of People in the Labor Force in Bunnell?
43.2% of People are in the Labor Force in Bunnell.
What is the Unemployment Rate in Bunnell?
Unemployment Rate in Bunnell is 3.8%.