Fort White, FL Map & Demographics
Fort White Map
Fort White Overview
$22,114
PER CAPITA INCOME
$49,815
AVG FAMILY INCOME
$48,935
AVG HOUSEHOLD INCOME
10.5%
WAGE / INCOME GAP [ % ]
89.5¢/ $1
WAGE / INCOME GAP [ $ ]
0.39
INEQUALITY / GINI INDEX
576
TOTAL POPULATION
273
MALE POPULATION
303
FEMALE POPULATION
90.10
MALES / 100 FEMALES
110.99
FEMALES / 100 MALES
34.5
MEDIAN AGE
3.1
AVG FAMILY SIZE
2.7
AVG HOUSEHOLD SIZE
292
LABOR FORCE [ PEOPLE ]
67.1%
PERCENT IN LABOR FORCE
4.8%
UNEMPLOYMENT RATE
Fort White Zip Codes
Fort White Area Codes
Income in Fort White
Income Overview in Fort White
Per Capita Income in Fort White is $22,114, while median incomes of families and households are $49,815 and $48,935 respectively.
| Characteristic | Number | Measure |
| Per Capita Income | 576 | $22,114 |
| Median Family Income | 164 | $49,815 |
| Mean Family Income | 164 | $64,788 |
| Median Household Income | 213 | $48,935 |
| Mean Household Income | 213 | $58,537 |
| Income Deficit | 164 | $0 |
| Wage / Income Gap (%) | 576 | 10.48% |
| Wage / Income Gap ($) | 576 | 89.52¢ per $1 |
| Gini / Inequality Index | 576 | 0.39 |
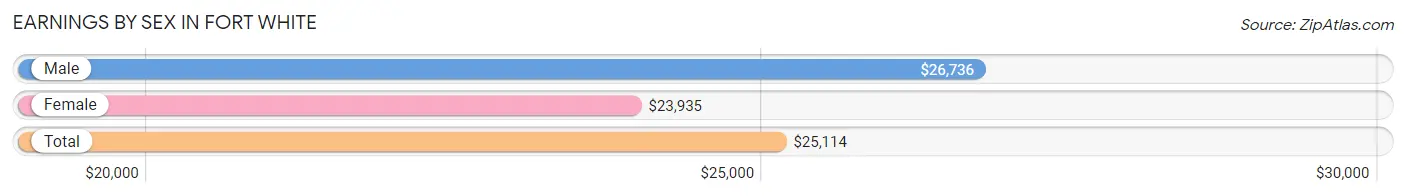
Earnings by Sex in Fort White
Average Earnings in Fort White are $25,114, $26,736 for men and $23,935 for women, a difference of 10.5%.
| Sex | Number | Average Earnings |
| Male | 167 (57.2%) | $26,736 |
| Female | 125 (42.8%) | $23,935 |
| Total | 292 (100.0%) | $25,114 |
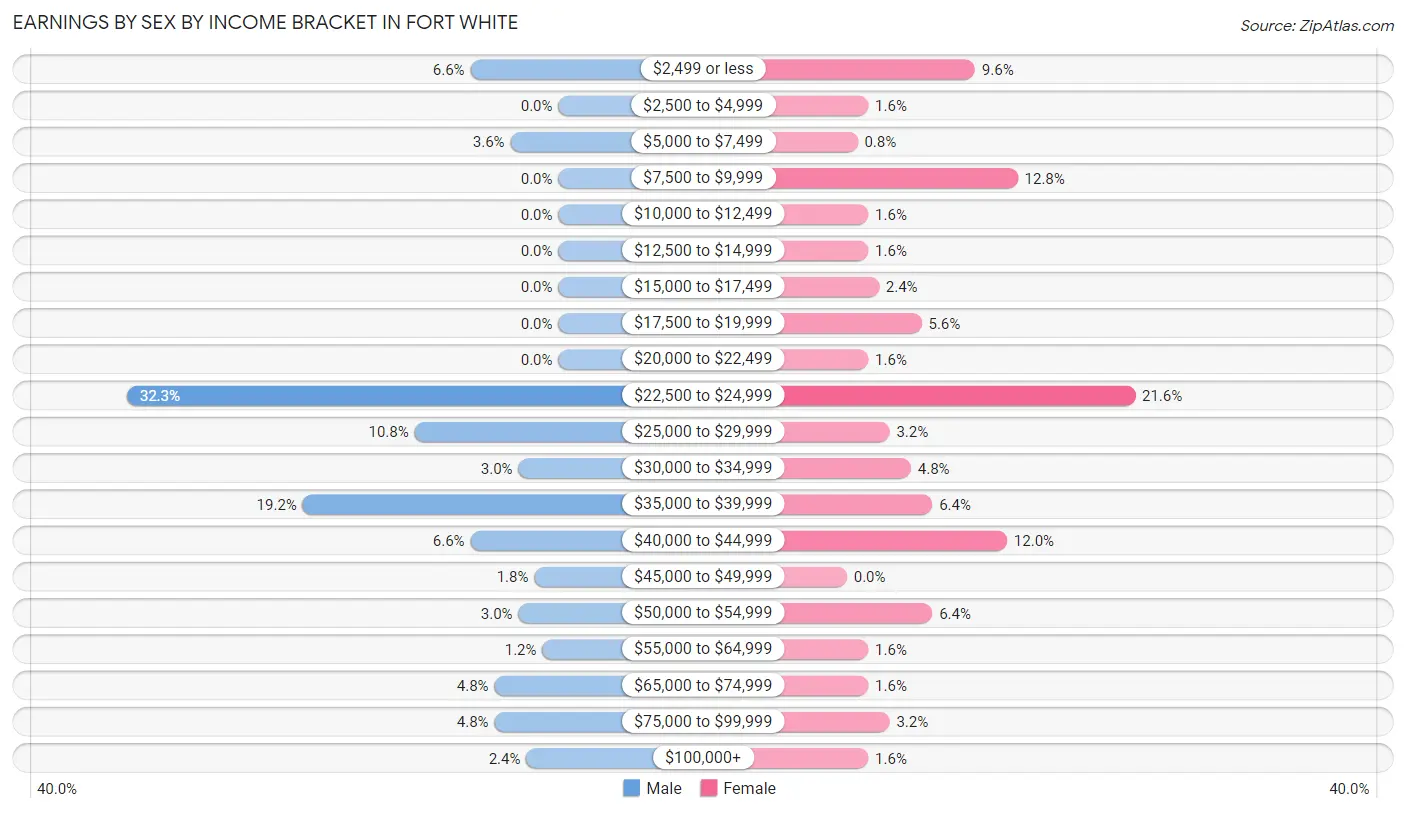
Earnings by Sex by Income Bracket in Fort White
The most common earnings brackets in Fort White are $22,500 to $24,999 for men (54 | 32.3%) and $22,500 to $24,999 for women (27 | 21.6%).
| Income | Male | Female |
| $2,499 or less | 11 (6.6%) | 12 (9.6%) |
| $2,500 to $4,999 | 0 (0.0%) | 2 (1.6%) |
| $5,000 to $7,499 | 6 (3.6%) | 1 (0.8%) |
| $7,500 to $9,999 | 0 (0.0%) | 16 (12.8%) |
| $10,000 to $12,499 | 0 (0.0%) | 2 (1.6%) |
| $12,500 to $14,999 | 0 (0.0%) | 2 (1.6%) |
| $15,000 to $17,499 | 0 (0.0%) | 3 (2.4%) |
| $17,500 to $19,999 | 0 (0.0%) | 7 (5.6%) |
| $20,000 to $22,499 | 0 (0.0%) | 2 (1.6%) |
| $22,500 to $24,999 | 54 (32.3%) | 27 (21.6%) |
| $25,000 to $29,999 | 18 (10.8%) | 4 (3.2%) |
| $30,000 to $34,999 | 5 (3.0%) | 6 (4.8%) |
| $35,000 to $39,999 | 32 (19.2%) | 8 (6.4%) |
| $40,000 to $44,999 | 11 (6.6%) | 15 (12.0%) |
| $45,000 to $49,999 | 3 (1.8%) | 0 (0.0%) |
| $50,000 to $54,999 | 5 (3.0%) | 8 (6.4%) |
| $55,000 to $64,999 | 2 (1.2%) | 2 (1.6%) |
| $65,000 to $74,999 | 8 (4.8%) | 2 (1.6%) |
| $75,000 to $99,999 | 8 (4.8%) | 4 (3.2%) |
| $100,000+ | 4 (2.4%) | 2 (1.6%) |
| Total | 167 (100.0%) | 125 (100.0%) |
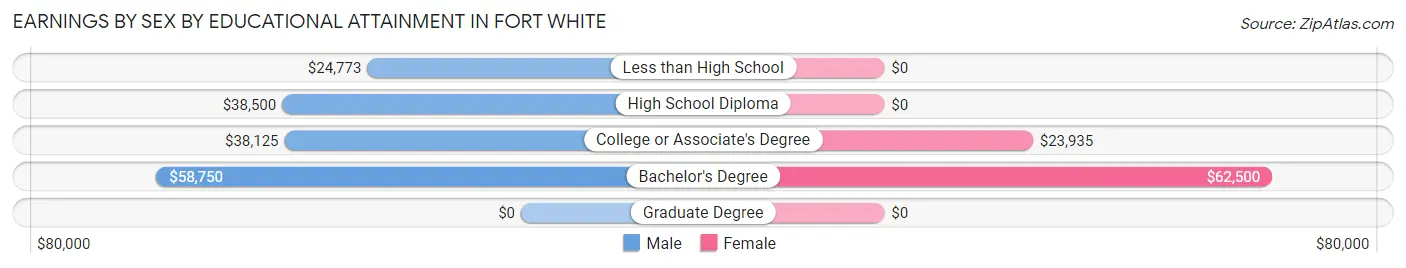
Earnings by Sex by Educational Attainment in Fort White
Average earnings in Fort White are $26,875 for men and $24,444 for women, a difference of 9.0%. Men with an educational attainment of bachelor's degree enjoy the highest average annual earnings of $58,750, while those with less than high school education earn the least with $24,773. Women with an educational attainment of bachelor's degree earn the most with the average annual earnings of $62,500, while those with college or associate's degree education have the smallest earnings of $23,935.
| Educational Attainment | Male Income | Female Income |
| Less than High School | $24,773 | $0 |
| High School Diploma | $38,500 | $0 |
| College or Associate's Degree | $38,125 | $23,935 |
| Bachelor's Degree | $58,750 | $62,500 |
| Graduate Degree | - | - |
| Total | $26,875 | $24,444 |
Family Income in Fort White
Family Income Brackets in Fort White
According to the Fort White family income data, there are 38 families falling into the $35,000 to $49,999 income range, which is the most common income bracket and makes up 23.2% of all families. Conversely, the $15,000 to $24,999 income bracket is the least frequent group with only 2 families (1.2%) belonging to this category.
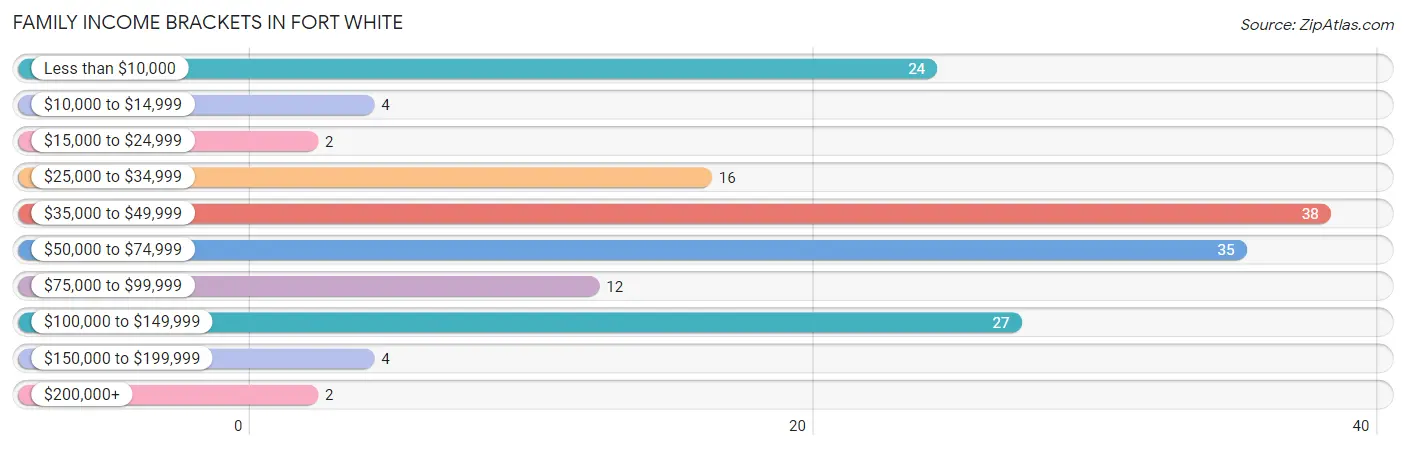
| Income Bracket | # Families | % Families |
| Less than $10,000 | 24 | 14.6% |
| $10,000 to $14,999 | 4 | 2.4% |
| $15,000 to $24,999 | 2 | 1.2% |
| $25,000 to $34,999 | 16 | 9.8% |
| $35,000 to $49,999 | 38 | 23.2% |
| $50,000 to $74,999 | 35 | 21.3% |
| $75,000 to $99,999 | 12 | 7.3% |
| $100,000 to $149,999 | 27 | 16.5% |
| $150,000 to $199,999 | 4 | 2.4% |
| $200,000+ | 2 | 1.2% |
Family Income by Famaliy Size in Fort White
5-person families (8 | 4.9%) account for the highest median family income in Fort White with $68,750 per family, while 2-person families (58 | 35.4%) have the highest median income of $25,000 per family member.
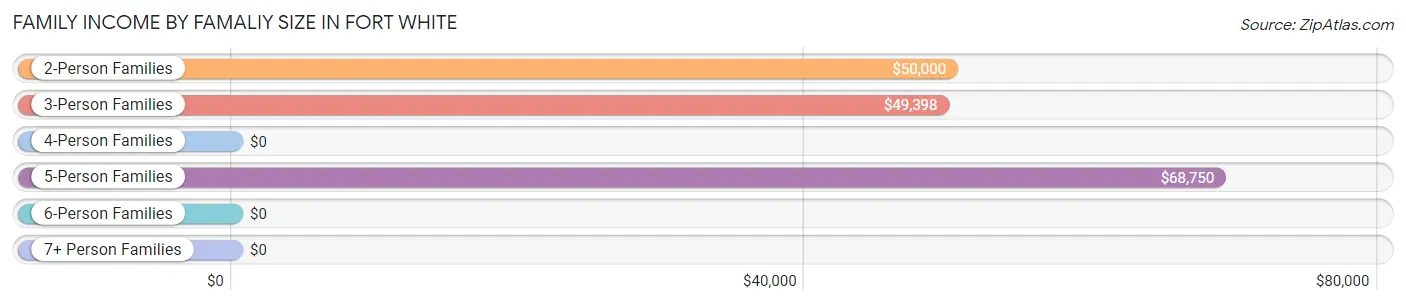
| Income Bracket | # Families | Median Income |
| 2-Person Families | 58 (35.4%) | $50,000 |
| 3-Person Families | 63 (38.4%) | $49,398 |
| 4-Person Families | 35 (21.3%) | $0 |
| 5-Person Families | 8 (4.9%) | $68,750 |
| 6-Person Families | 0 (0.0%) | $0 |
| 7+ Person Families | 0 (0.0%) | $0 |
| Total | 164 (100.0%) | $49,815 |
Family Income by Number of Earners in Fort White
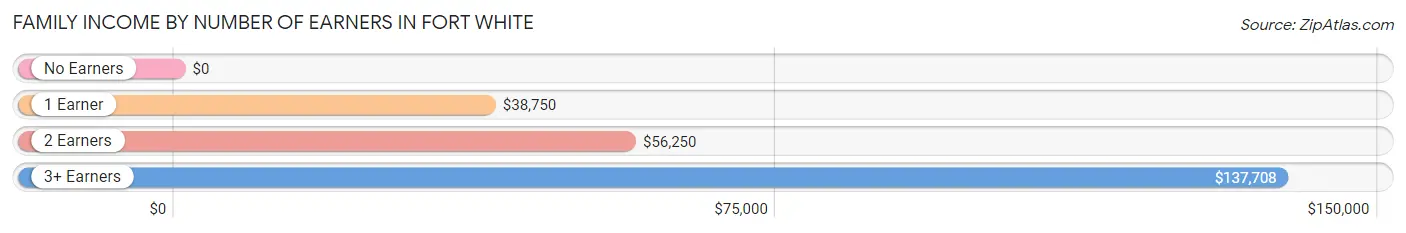
| Number of Earners | # Families | Median Income |
| No Earners | 25 (15.2%) | $0 |
| 1 Earner | 46 (28.1%) | $38,750 |
| 2 Earners | 82 (50.0%) | $56,250 |
| 3+ Earners | 11 (6.7%) | $137,708 |
| Total | 164 (100.0%) | $49,815 |
Household Income in Fort White
Household Income Brackets in Fort White
With 50 households falling in the category, the $50,000 to $74,999 income range is the most frequent in Fort White, accounting for 23.5% of all households. In contrast, only 2 households (0.9%) fall into the $200,000+ income bracket, making it the least populous group.
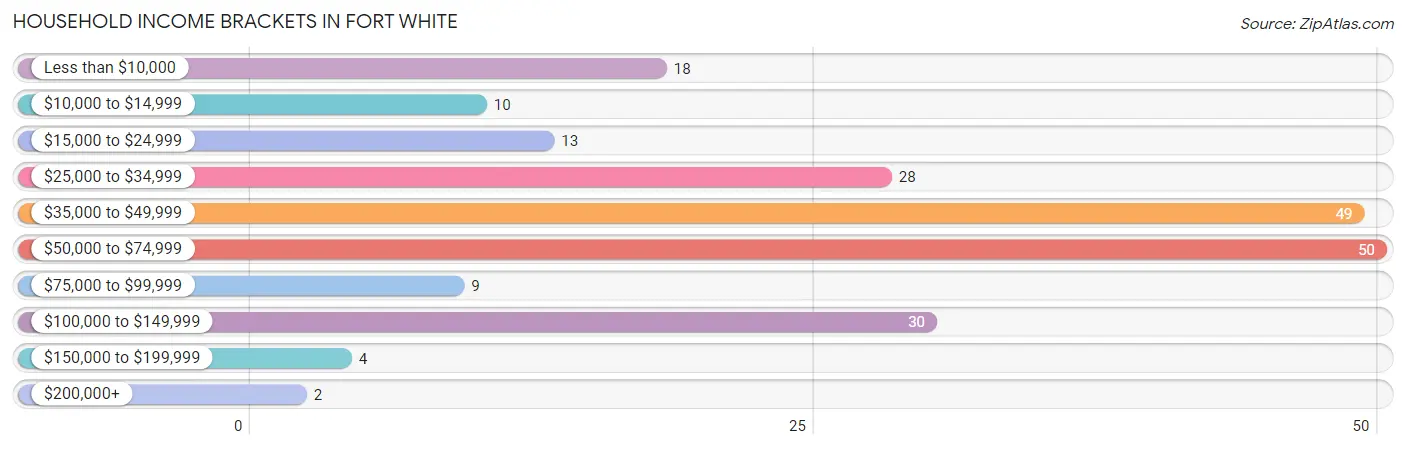
| Income Bracket | # Households | % Households |
| Less than $10,000 | 18 | 8.5% |
| $10,000 to $14,999 | 10 | 4.7% |
| $15,000 to $24,999 | 13 | 6.1% |
| $25,000 to $34,999 | 28 | 13.1% |
| $35,000 to $49,999 | 49 | 23.0% |
| $50,000 to $74,999 | 50 | 23.5% |
| $75,000 to $99,999 | 9 | 4.2% |
| $100,000 to $149,999 | 30 | 14.1% |
| $150,000 to $199,999 | 4 | 1.9% |
| $200,000+ | 2 | 0.9% |
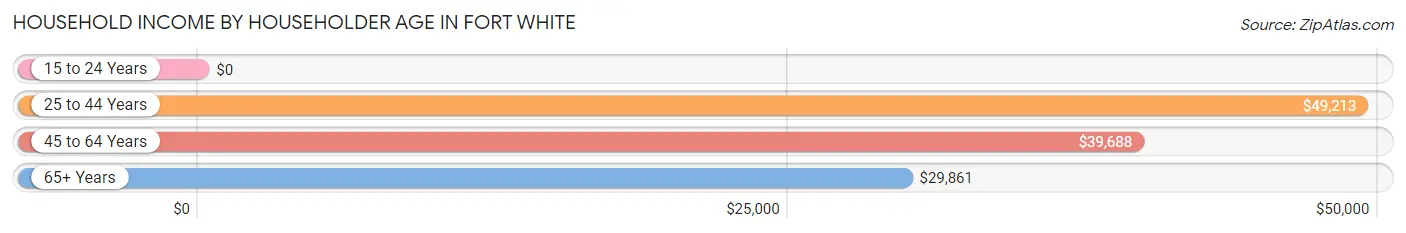
Household Income by Householder Age in Fort White
The median household income in Fort White is $48,935, with the highest median household income of $49,213 found in the 25 to 44 years age bracket for the primary householder. A total of 93 households (43.7%) fall into this category. Meanwhile, the 15 to 24 years age bracket for the primary householder has the lowest median household income of $0, with 15 households (7.0%) in this group.
| Income Bracket | # Households | Median Income |
| 15 to 24 Years | 15 (7.0%) | $0 |
| 25 to 44 Years | 93 (43.7%) | $49,213 |
| 45 to 64 Years | 44 (20.7%) | $39,688 |
| 65+ Years | 61 (28.6%) | $29,861 |
| Total | 213 (100.0%) | $48,935 |
Poverty in Fort White
Income Below Poverty by Sex and Age in Fort White
With 17.9% poverty level for males and 23.4% for females among the residents of Fort White, 5 year old males and 18 to 24 year old females are the most vulnerable to poverty, with 9 males (90.0%) and 17 females (77.3%) in their respective age groups living below the poverty level.
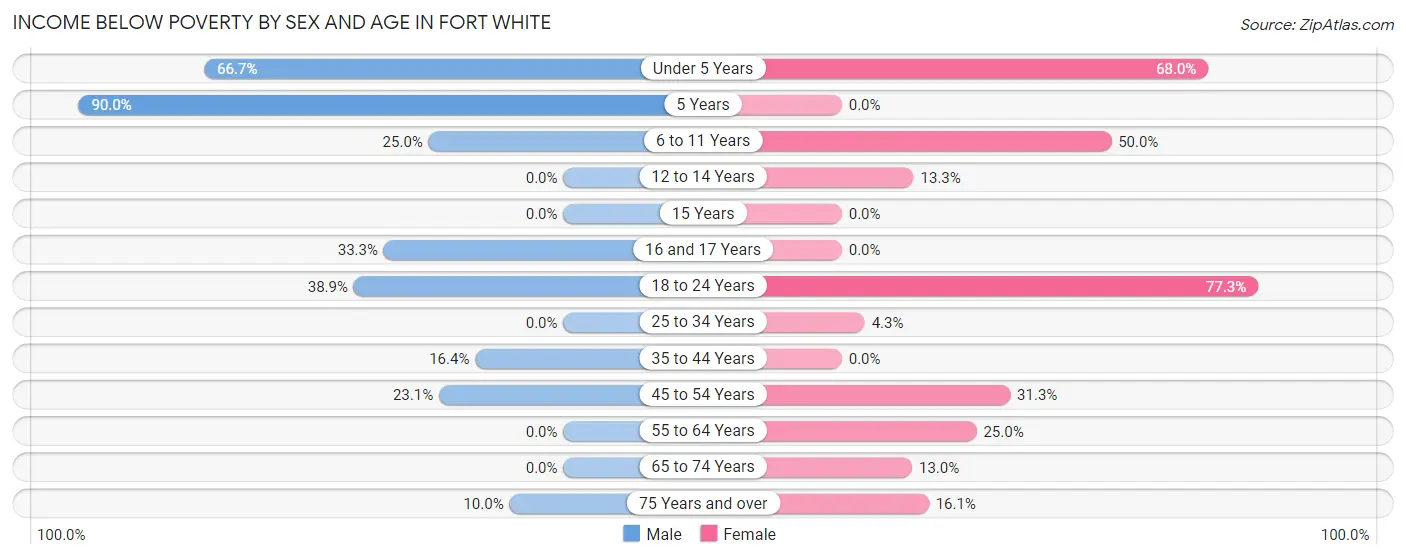
| Age Bracket | Male | Female |
| Under 5 Years | 14 (66.7%) | 17 (68.0%) |
| 5 Years | 9 (90.0%) | 0 (0.0%) |
| 6 to 11 Years | 2 (25.0%) | 10 (50.0%) |
| 12 to 14 Years | 0 (0.0%) | 2 (13.3%) |
| 15 Years | 0 (0.0%) | 0 (0.0%) |
| 16 and 17 Years | 3 (33.3%) | 0 (0.0%) |
| 18 to 24 Years | 7 (38.9%) | 17 (77.3%) |
| 25 to 34 Years | 0 (0.0%) | 2 (4.3%) |
| 35 to 44 Years | 9 (16.4%) | 0 (0.0%) |
| 45 to 54 Years | 3 (23.1%) | 5 (31.2%) |
| 55 to 64 Years | 0 (0.0%) | 10 (25.0%) |
| 65 to 74 Years | 0 (0.0%) | 3 (13.0%) |
| 75 Years and over | 2 (10.0%) | 5 (16.1%) |
| Total | 49 (17.9%) | 71 (23.4%) |
Income Above Poverty by Sex and Age in Fort White
According to the poverty statistics in Fort White, males aged 12 to 14 years and females aged 5 years are the age groups that are most secure financially, with 100.0% of males and 100.0% of females in these age groups living above the poverty line.
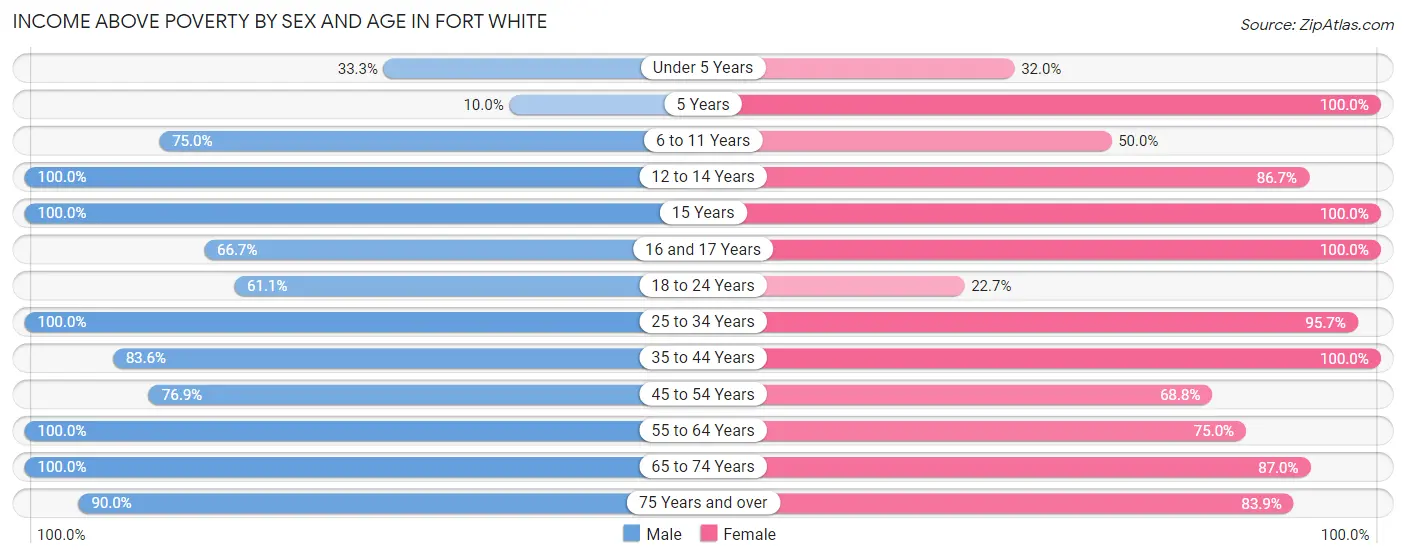
| Age Bracket | Male | Female |
| Under 5 Years | 7 (33.3%) | 8 (32.0%) |
| 5 Years | 1 (10.0%) | 3 (100.0%) |
| 6 to 11 Years | 6 (75.0%) | 10 (50.0%) |
| 12 to 14 Years | 7 (100.0%) | 13 (86.7%) |
| 15 Years | 3 (100.0%) | 29 (100.0%) |
| 16 and 17 Years | 6 (66.7%) | 3 (100.0%) |
| 18 to 24 Years | 11 (61.1%) | 5 (22.7%) |
| 25 to 34 Years | 63 (100.0%) | 45 (95.7%) |
| 35 to 44 Years | 46 (83.6%) | 29 (100.0%) |
| 45 to 54 Years | 10 (76.9%) | 11 (68.8%) |
| 55 to 64 Years | 25 (100.0%) | 30 (75.0%) |
| 65 to 74 Years | 21 (100.0%) | 20 (87.0%) |
| 75 Years and over | 18 (90.0%) | 26 (83.9%) |
| Total | 224 (82.1%) | 232 (76.6%) |
Income Below Poverty Among Married-Couple Families in Fort White
The poverty statistics for married-couple families in Fort White show that 4.8% or 5 of the total 105 families live below the poverty line. Families with no children have the highest poverty rate of 5.4%, comprising of 2 families. On the other hand, families with 1 or 2 children have the lowest poverty rate of 4.4%, which includes 3 families.
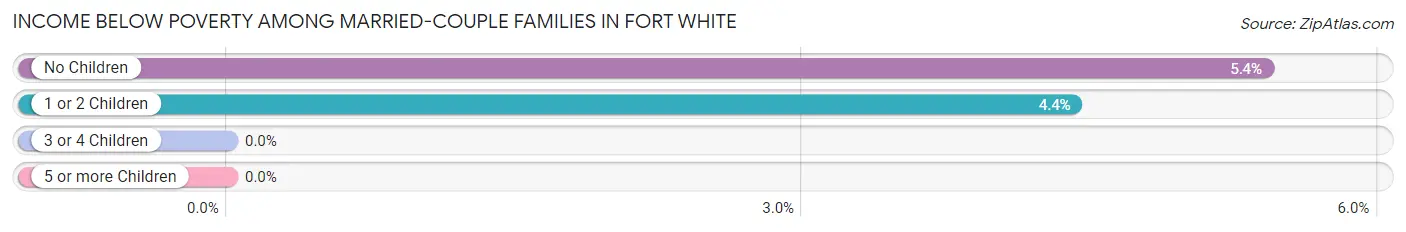
| Children | Above Poverty | Below Poverty |
| No Children | 35 (94.6%) | 2 (5.4%) |
| 1 or 2 Children | 65 (95.6%) | 3 (4.4%) |
| 3 or 4 Children | 0 (0.0%) | 0 (0.0%) |
| 5 or more Children | 0 (0.0%) | 0 (0.0%) |
| Total | 100 (95.2%) | 5 (4.8%) |
Income Below Poverty Among Single-Parent Households in Fort White
According to the poverty data in Fort White, 42.9% or 9 single-father households and 47.4% or 18 single-mother households are living below the poverty line. Among single-father households, those with 1 or 2 children have the highest poverty rate, with 9 households (75.0%) experiencing poverty. Likewise, among single-mother households, those with 3 or 4 children have the highest poverty rate, with 12 households (92.3%) falling below the poverty line.
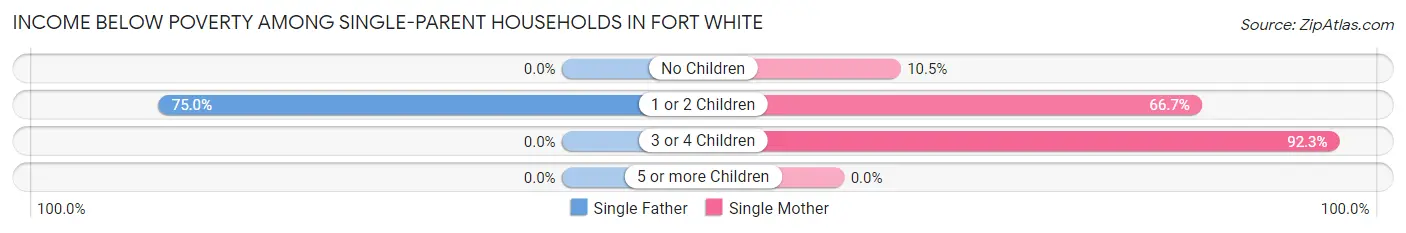
| Children | Single Father | Single Mother |
| No Children | 0 (0.0%) | 2 (10.5%) |
| 1 or 2 Children | 9 (75.0%) | 4 (66.7%) |
| 3 or 4 Children | 0 (0.0%) | 12 (92.3%) |
| 5 or more Children | 0 (0.0%) | 0 (0.0%) |
| Total | 9 (42.9%) | 18 (47.4%) |
Income Below Poverty Among Married-Couple vs Single-Parent Households in Fort White
The poverty data for Fort White shows that 5 of the married-couple family households (4.8%) and 27 of the single-parent households (45.8%) are living below the poverty level. Within the married-couple family households, those with no children have the highest poverty rate, with 2 households (5.4%) falling below the poverty line. Among the single-parent households, those with 3 or 4 children have the highest poverty rate, with 12 household (92.3%) living below poverty.
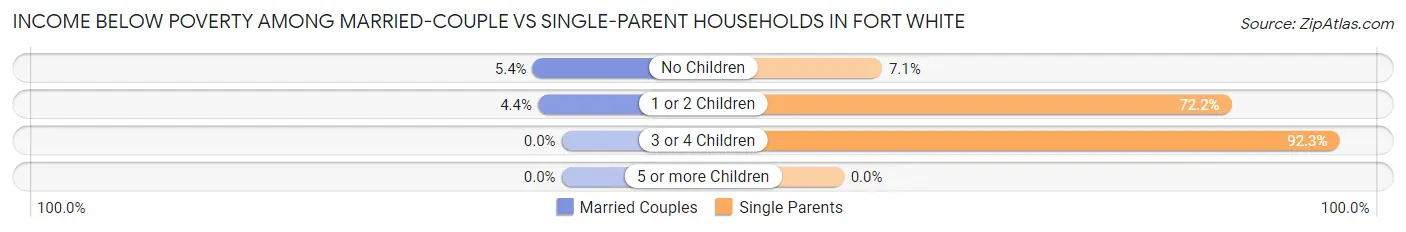
| Children | Married-Couple Families | Single-Parent Households |
| No Children | 2 (5.4%) | 2 (7.1%) |
| 1 or 2 Children | 3 (4.4%) | 13 (72.2%) |
| 3 or 4 Children | 0 (0.0%) | 12 (92.3%) |
| 5 or more Children | 0 (0.0%) | 0 (0.0%) |
| Total | 5 (4.8%) | 27 (45.8%) |
Race in Fort White
The most populous races in Fort White are White / Caucasian (391 | 67.9%), Black / African American (140 | 24.3%), and Hispanic or Latino (41 | 7.1%).
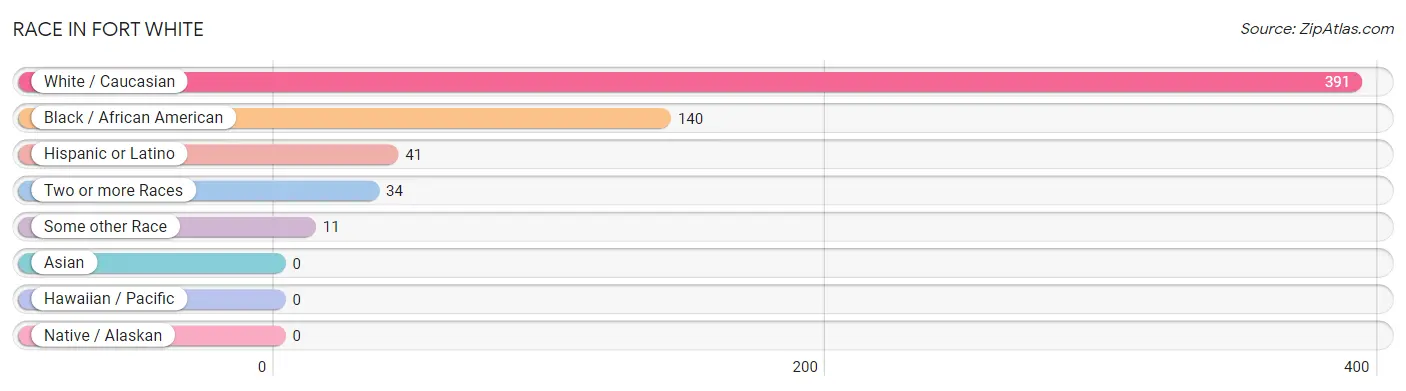
| Race | # Population | % Population |
| Asian | 0 | 0.0% |
| Black / African American | 140 | 24.3% |
| Hawaiian / Pacific | 0 | 0.0% |
| Hispanic or Latino | 41 | 7.1% |
| Native / Alaskan | 0 | 0.0% |
| White / Caucasian | 391 | 67.9% |
| Two or more Races | 34 | 5.9% |
| Some other Race | 11 | 1.9% |
| Total | 576 | 100.0% |
Ancestry in Fort White
The most populous ancestries reported in Fort White are American (78 | 13.5%), Irish (76 | 13.2%), German (71 | 12.3%), Italian (64 | 11.1%), and Jamaican (39 | 6.8%), together accounting for 56.9% of all Fort White residents.
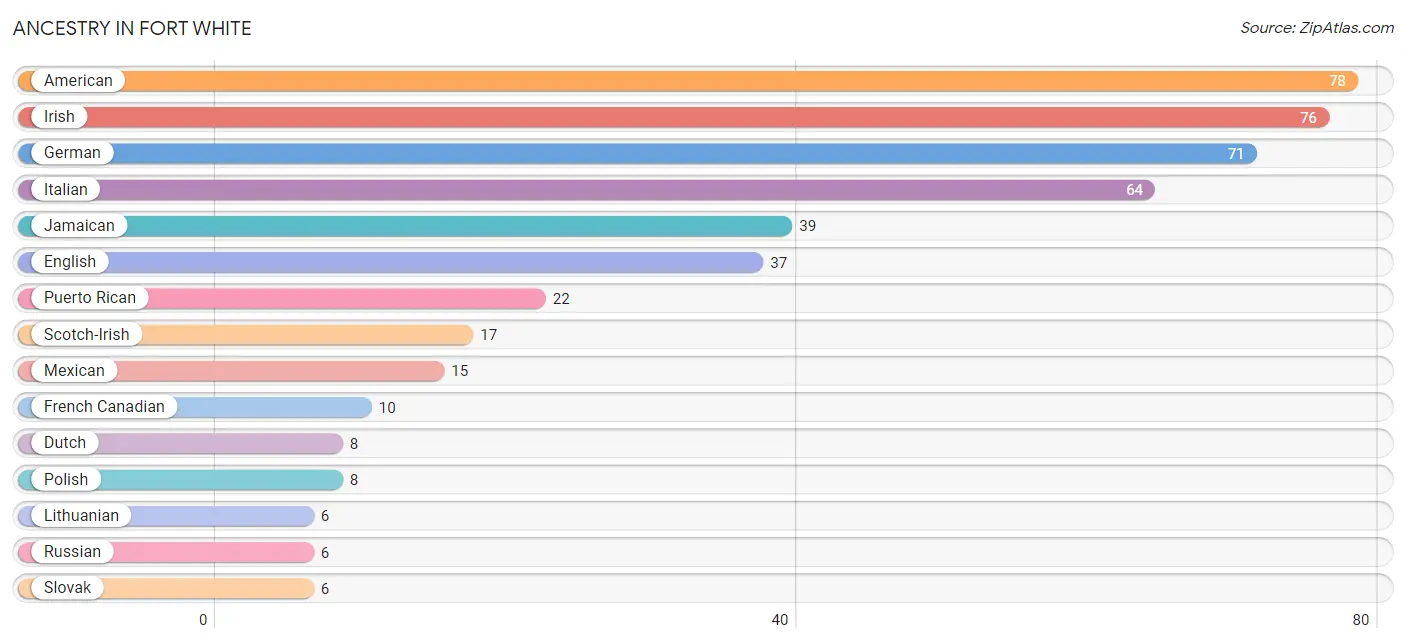
| Ancestry | # Population | % Population |
| American | 78 | 13.5% |
| Austrian | 2 | 0.4% |
| Cuban | 4 | 0.7% |
| Dutch | 8 | 1.4% |
| English | 37 | 6.4% |
| French | 5 | 0.9% |
| French Canadian | 10 | 1.7% |
| German | 71 | 12.3% |
| Irish | 76 | 13.2% |
| Italian | 64 | 11.1% |
| Jamaican | 39 | 6.8% |
| Lithuanian | 6 | 1.0% |
| Mexican | 15 | 2.6% |
| Polish | 8 | 1.4% |
| Puerto Rican | 22 | 3.8% |
| Russian | 6 | 1.0% |
| Scotch-Irish | 17 | 2.9% |
| Scottish | 2 | 0.4% |
| Slavic | 2 | 0.4% |
| Slovak | 6 | 1.0% |
| Swedish | 5 | 0.9% |
| Swiss | 2 | 0.4% |
| Welsh | 3 | 0.5% | View All 23 Rows |
Immigrants in Fort White
The most numerous immigrant groups reported in Fort White came from Latin America (22 | 3.8%), Central America (15 | 2.6%), Mexico (15 | 2.6%), Caribbean (7 | 1.2%), and Jamaica (3 | 0.5%), together accounting for 10.8% of all Fort White residents.
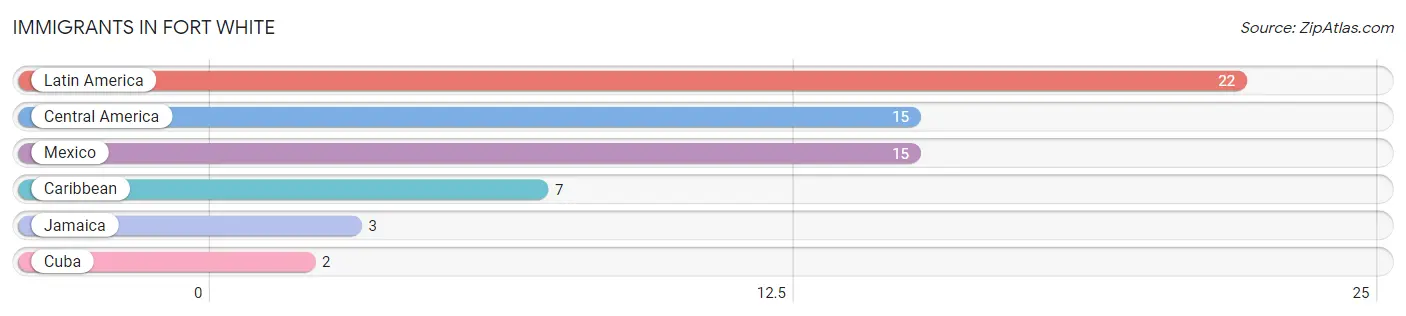
| Immigration Origin | # Population | % Population |
| Caribbean | 7 | 1.2% |
| Central America | 15 | 2.6% |
| Cuba | 2 | 0.4% |
| Jamaica | 3 | 0.5% |
| Latin America | 22 | 3.8% |
| Mexico | 15 | 2.6% | View All 6 Rows |
Sex and Age in Fort White
Sex and Age in Fort White
The most populous age groups in Fort White are 30 to 34 Years (55 | 20.2%) for men and 15 to 19 Years (36 | 11.9%) for women.
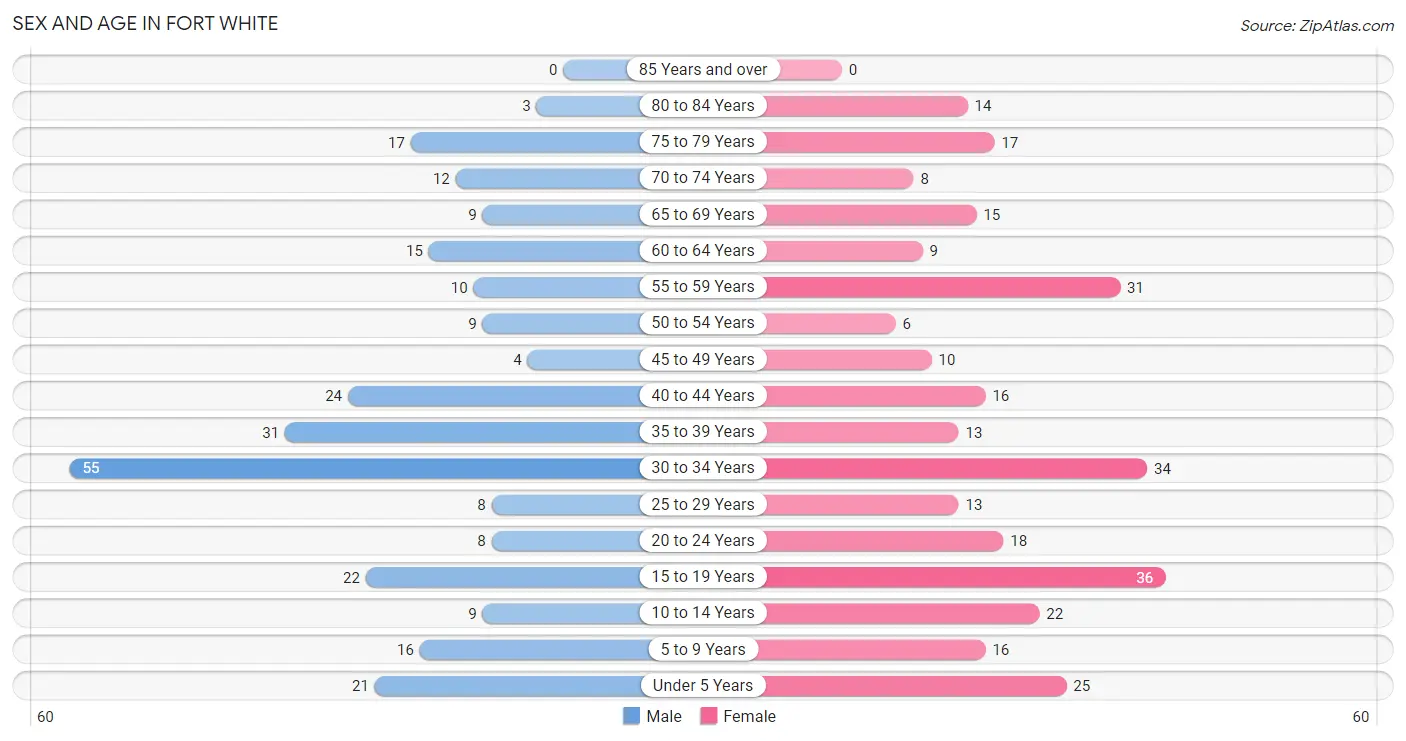
| Age Bracket | Male | Female |
| Under 5 Years | 21 (7.7%) | 25 (8.3%) |
| 5 to 9 Years | 16 (5.9%) | 16 (5.3%) |
| 10 to 14 Years | 9 (3.3%) | 22 (7.3%) |
| 15 to 19 Years | 22 (8.1%) | 36 (11.9%) |
| 20 to 24 Years | 8 (2.9%) | 18 (5.9%) |
| 25 to 29 Years | 8 (2.9%) | 13 (4.3%) |
| 30 to 34 Years | 55 (20.2%) | 34 (11.2%) |
| 35 to 39 Years | 31 (11.4%) | 13 (4.3%) |
| 40 to 44 Years | 24 (8.8%) | 16 (5.3%) |
| 45 to 49 Years | 4 (1.5%) | 10 (3.3%) |
| 50 to 54 Years | 9 (3.3%) | 6 (2.0%) |
| 55 to 59 Years | 10 (3.7%) | 31 (10.2%) |
| 60 to 64 Years | 15 (5.5%) | 9 (3.0%) |
| 65 to 69 Years | 9 (3.3%) | 15 (5.0%) |
| 70 to 74 Years | 12 (4.4%) | 8 (2.6%) |
| 75 to 79 Years | 17 (6.2%) | 17 (5.6%) |
| 80 to 84 Years | 3 (1.1%) | 14 (4.6%) |
| 85 Years and over | 0 (0.0%) | 0 (0.0%) |
| Total | 273 (100.0%) | 303 (100.0%) |
Families and Households in Fort White
Median Family Size in Fort White
The median family size in Fort White is 3.11 persons per family, with married-couple families (105 | 64.0%) accounting for the largest median family size of 3.26 persons per family. On the other hand, single male/father families (21 | 12.8%) represent the smallest median family size with 2.48 persons per family.
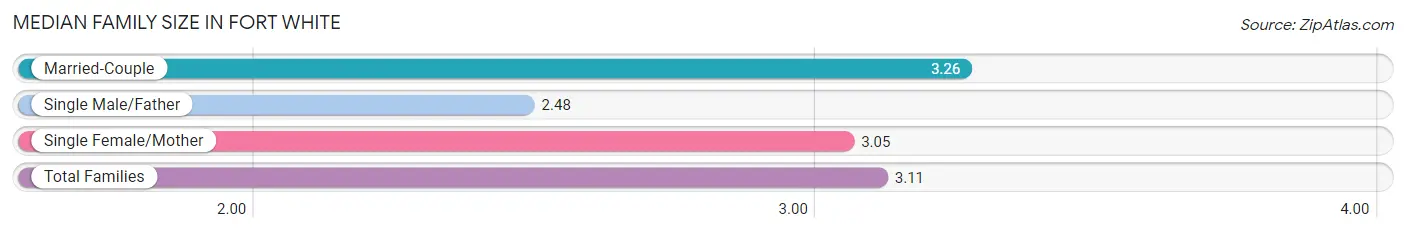
| Family Type | # Families | Family Size |
| Married-Couple | 105 (64.0%) | 3.26 |
| Single Male/Father | 21 (12.8%) | 2.48 |
| Single Female/Mother | 38 (23.2%) | 3.05 |
| Total Families | 164 (100.0%) | 3.11 |
Median Household Size in Fort White
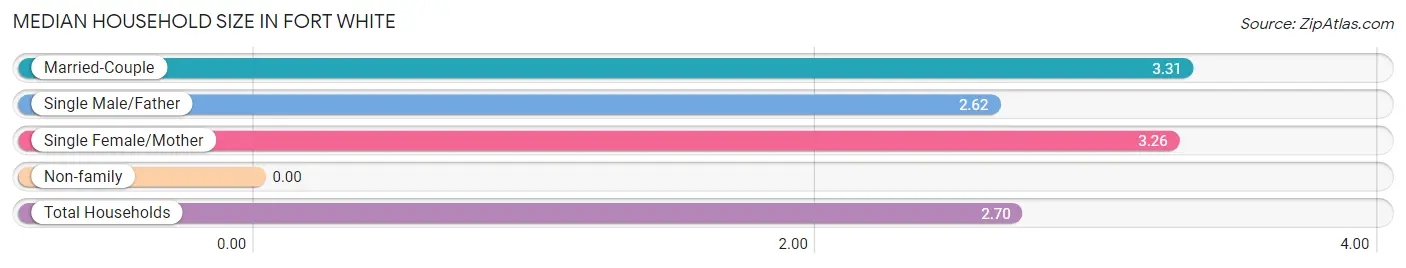
| Household Type | # Households | Household Size |
| Married-Couple | 105 (49.3%) | 3.31 |
| Single Male/Father | 21 (9.9%) | 2.62 |
| Single Female/Mother | 38 (17.8%) | 3.26 |
| Non-family | 49 (23.0%) | - |
| Total Households | 213 (100.0%) | 2.70 |
Household Size by Marriage Status in Fort White
Out of a total of 213 households in Fort White, 164 (77.0%) are family households, while 49 (23.0%) are nonfamily households. The most numerous type of family households are 3-person households, comprising 66, and the most common type of nonfamily households are 1-person households, comprising 49.
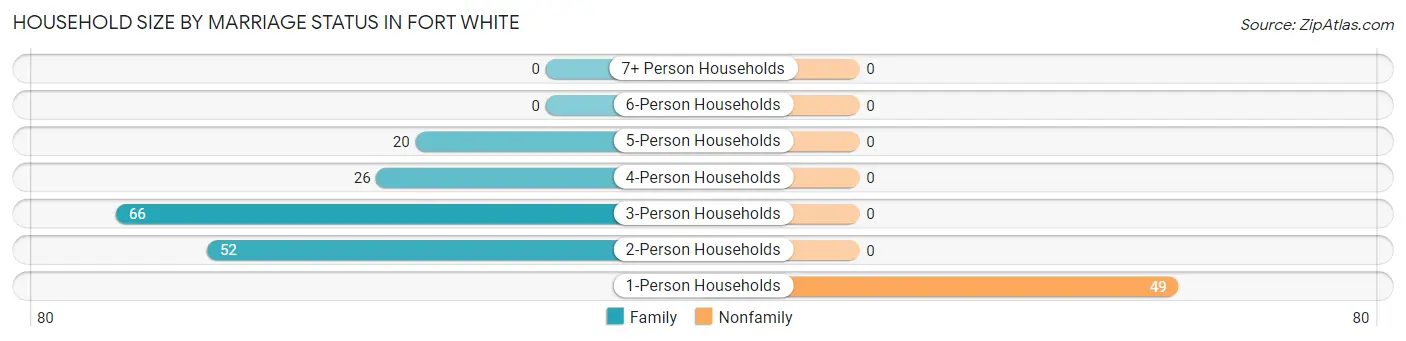
| Household Size | Family Households | Nonfamily Households |
| 1-Person Households | - | 49 (23.0%) |
| 2-Person Households | 52 (24.4%) | 0 (0.0%) |
| 3-Person Households | 66 (31.0%) | 0 (0.0%) |
| 4-Person Households | 26 (12.2%) | 0 (0.0%) |
| 5-Person Households | 20 (9.4%) | 0 (0.0%) |
| 6-Person Households | 0 (0.0%) | 0 (0.0%) |
| 7+ Person Households | 0 (0.0%) | 0 (0.0%) |
| Total | 164 (77.0%) | 49 (23.0%) |
Female Fertility in Fort White
Fertility by Age in Fort White
| Age Bracket | Women with Births | Births / 1,000 Women |
| 15 to 19 years | 0 (0.0%) | 0.0 |
| 20 to 34 years | 0 (0.0%) | 0.0 |
| 35 to 50 years | 0 (0.0%) | 0.0 |
| Total | 0 (0.0%) | 0.0 |
Fertility by Age by Marriage Status in Fort White
| Age Bracket | Married | Unmarried |
| 15 to 19 years | 0 (0.0%) | 0 (0.0%) |
| 20 to 34 years | 0 (0.0%) | 0 (0.0%) |
| 35 to 50 years | 0 (0.0%) | 0 (0.0%) |
| Total | 0 (0.0%) | 0 (0.0%) |
Fertility by Education in Fort White
| Educational Attainment | Women with Births | Births / 1,000 Women |
| Less than High School | 0 (0.0%) | 0.0 |
| High School Diploma | 0 (0.0%) | 0.0 |
| College or Associate's Degree | 0 (0.0%) | 0.0 |
| Bachelor's Degree | 0 (0.0%) | 0.0 |
| Graduate Degree | 0 (0.0%) | 0.0 |
| Total | 0 (0.0%) | 0.0 |
Fertility by Education by Marriage Status in Fort White
| Educational Attainment | Married | Unmarried |
| Less than High School | 0 (0.0%) | 0 (0.0%) |
| High School Diploma | 0 (0.0%) | 0 (0.0%) |
| College or Associate's Degree | 0 (0.0%) | 0 (0.0%) |
| Bachelor's Degree | 0 (0.0%) | 0 (0.0%) |
| Graduate Degree | 0 (0.0%) | 0 (0.0%) |
| Total | 0 (0.0%) | 0 (0.0%) |
Employment Characteristics in Fort White
Employment by Class of Employer in Fort White
Among the 278 employed individuals in Fort White, private company employees (211 | 75.9%), self-employed (not incorporated) (19 | 6.8%), and not-for-profit organizations (13 | 4.7%) make up the most common classes of employment.
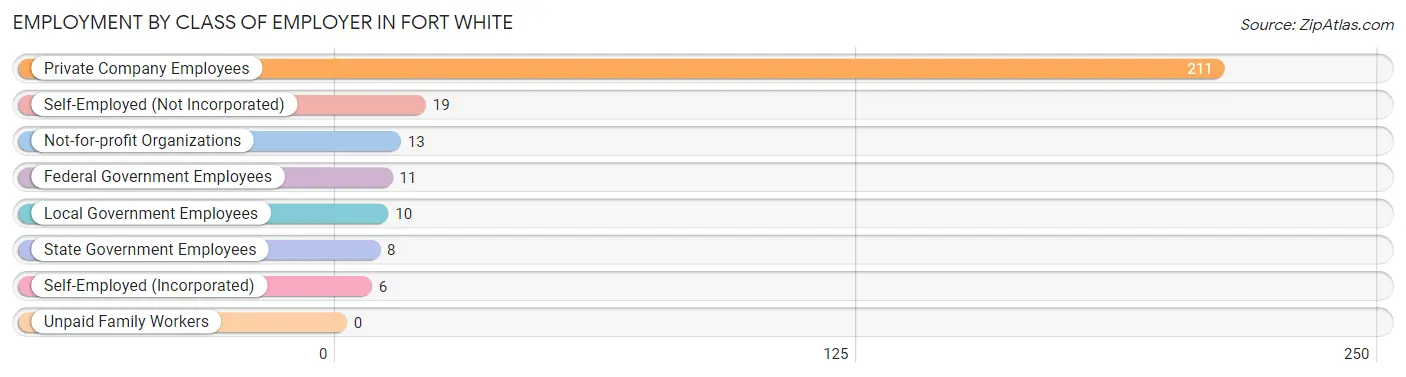
| Employer Class | # Employees | % Employees |
| Private Company Employees | 211 | 75.9% |
| Self-Employed (Incorporated) | 6 | 2.2% |
| Self-Employed (Not Incorporated) | 19 | 6.8% |
| Not-for-profit Organizations | 13 | 4.7% |
| Local Government Employees | 10 | 3.6% |
| State Government Employees | 8 | 2.9% |
| Federal Government Employees | 11 | 4.0% |
| Unpaid Family Workers | 0 | 0.0% |
| Total | 278 | 100.0% |
Employment Status by Age in Fort White
According to the labor force statistics for Fort White, out of the total population over 16 years of age (435), 67.1% or 292 individuals are in the labor force, with 4.8% or 14 of them unemployed. The age group with the highest labor force participation rate is 25 to 29 years, with 100.0% or 21 individuals in the labor force. Within the labor force, the 55 to 59 years age range has the highest percentage of unemployed individuals, with 35.7% or 10 of them being unemployed.
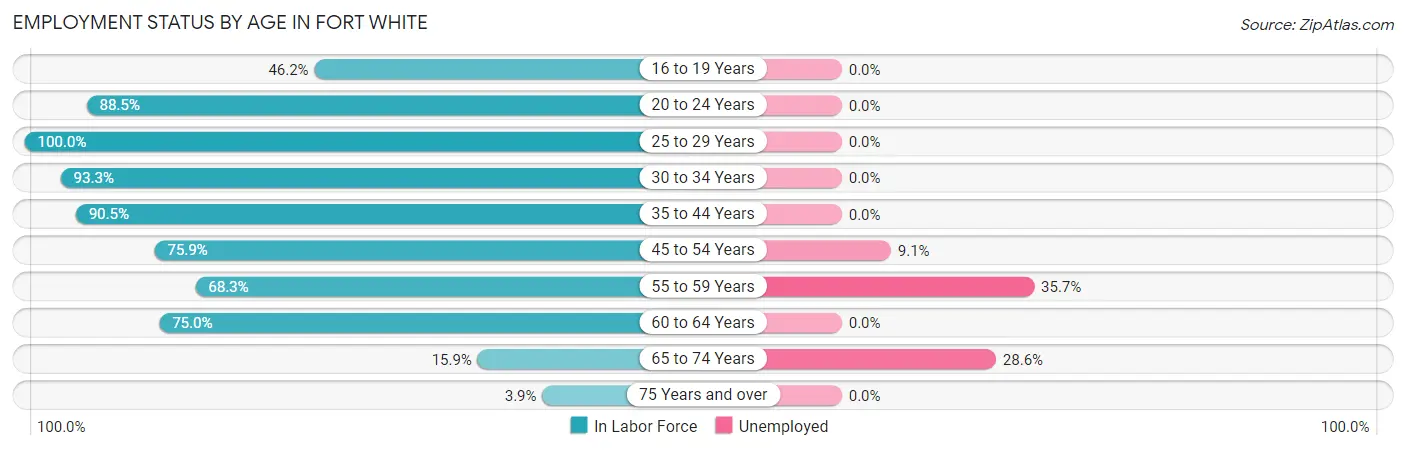
| Age Bracket | In Labor Force | Unemployed |
| 16 to 19 Years | 12 (46.2%) | 0 (0.0%) |
| 20 to 24 Years | 23 (88.5%) | 0 (0.0%) |
| 25 to 29 Years | 21 (100.0%) | 0 (0.0%) |
| 30 to 34 Years | 83 (93.3%) | 0 (0.0%) |
| 35 to 44 Years | 76 (90.5%) | 0 (0.0%) |
| 45 to 54 Years | 22 (75.9%) | 2 (9.1%) |
| 55 to 59 Years | 28 (68.3%) | 10 (35.7%) |
| 60 to 64 Years | 18 (75.0%) | 0 (0.0%) |
| 65 to 74 Years | 7 (15.9%) | 2 (28.6%) |
| 75 Years and over | 2 (3.9%) | 0 (0.0%) |
| Total | 292 (67.1%) | 14 (4.8%) |
Employment Status by Educational Attainment in Fort White
According to labor force statistics for Fort White, 86.1% of individuals (248) out of the total population between 25 and 64 years of age (288) are in the labor force, with 4.8% or 12 of them being unemployed. The group with the highest labor force participation rate are those with the educational attainment of college / associate degree, with 93.3% or 83 individuals in the labor force. Within the labor force, individuals with college / associate degree education have the highest percentage of unemployment, with 14.5% or 12 of them being unemployed.
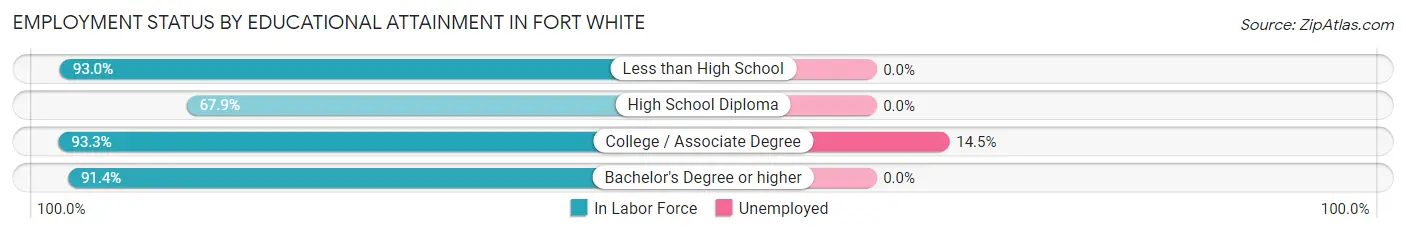
| Educational Attainment | In Labor Force | Unemployed |
| Less than High School | 80 (93.0%) | 0 (0.0%) |
| High School Diploma | 53 (67.9%) | 0 (0.0%) |
| College / Associate Degree | 83 (93.3%) | 13 (14.5%) |
| Bachelor's Degree or higher | 32 (91.4%) | 0 (0.0%) |
| Total | 248 (86.1%) | 14 (4.8%) |
Employment Occupations by Sex in Fort White
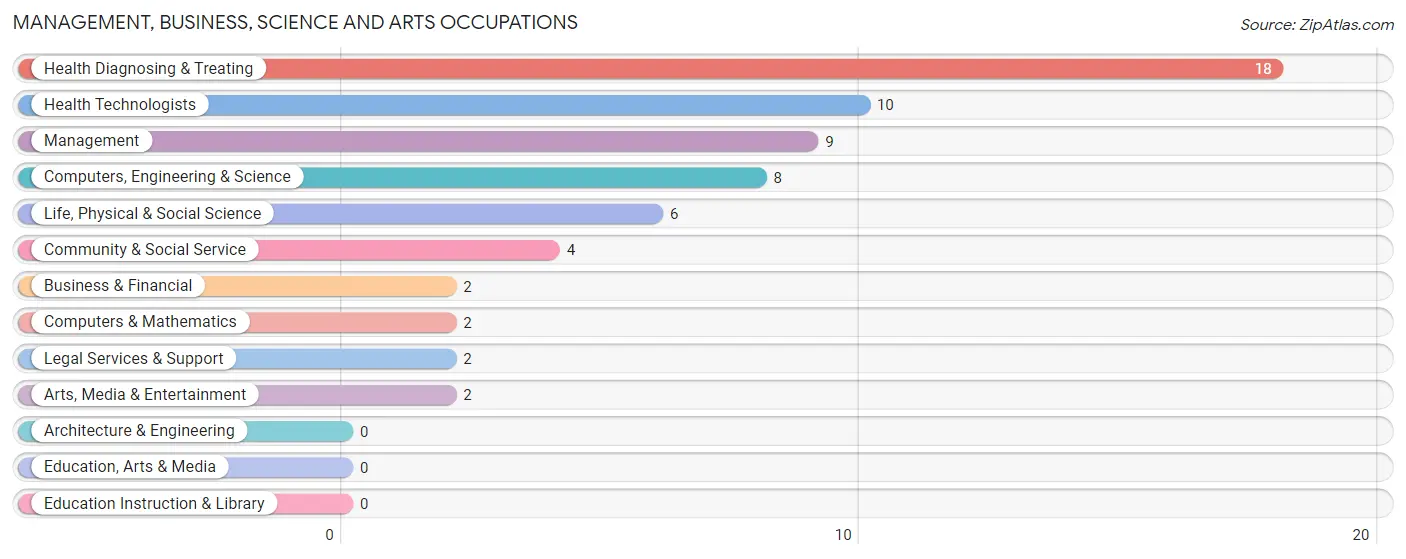
Management, Business, Science and Arts Occupations
The most common Management, Business, Science and Arts occupations in Fort White are Health Diagnosing & Treating (18 | 6.5%), Health Technologists (10 | 3.6%), Management (9 | 3.2%), Computers, Engineering & Science (8 | 2.9%), and Life, Physical & Social Science (6 | 2.2%).
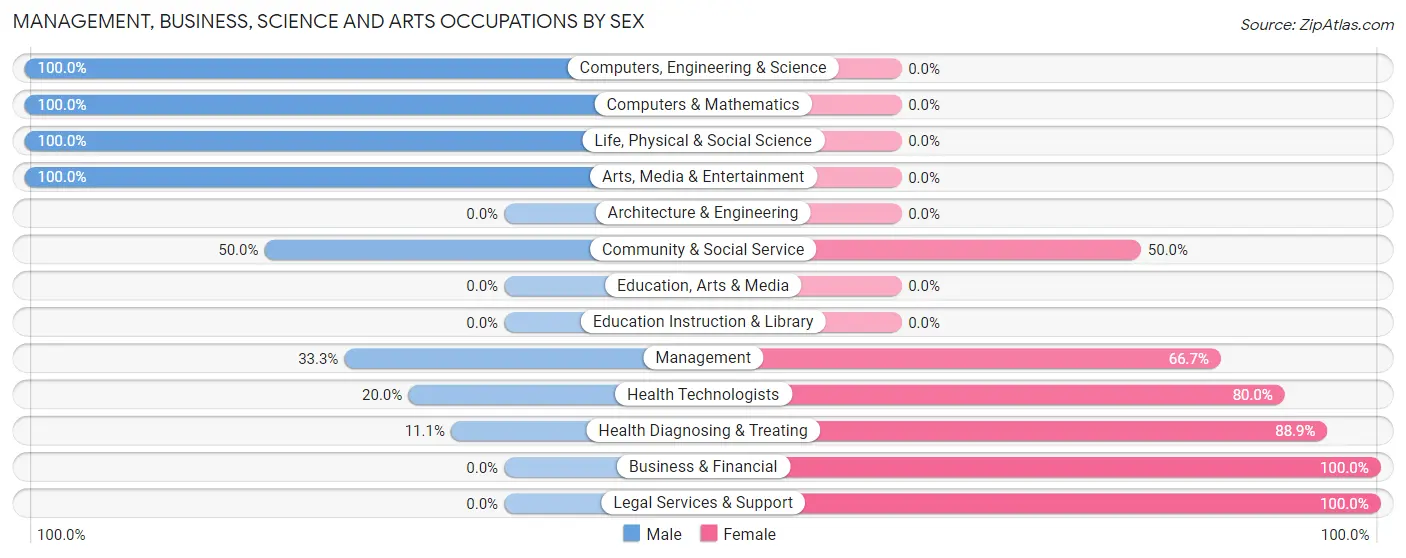
Management, Business, Science and Arts Occupations by Sex
Within the Management, Business, Science and Arts occupations in Fort White, the most male-oriented occupations are Computers, Engineering & Science (100.0%), Computers & Mathematics (100.0%), and Life, Physical & Social Science (100.0%), while the most female-oriented occupations are Business & Financial (100.0%), Legal Services & Support (100.0%), and Health Diagnosing & Treating (88.9%).
| Occupation | Male | Female |
| Management | 3 (33.3%) | 6 (66.7%) |
| Business & Financial | 0 (0.0%) | 2 (100.0%) |
| Computers, Engineering & Science | 8 (100.0%) | 0 (0.0%) |
| Computers & Mathematics | 2 (100.0%) | 0 (0.0%) |
| Architecture & Engineering | 0 (0.0%) | 0 (0.0%) |
| Life, Physical & Social Science | 6 (100.0%) | 0 (0.0%) |
| Community & Social Service | 2 (50.0%) | 2 (50.0%) |
| Education, Arts & Media | 0 (0.0%) | 0 (0.0%) |
| Legal Services & Support | 0 (0.0%) | 2 (100.0%) |
| Education Instruction & Library | 0 (0.0%) | 0 (0.0%) |
| Arts, Media & Entertainment | 2 (100.0%) | 0 (0.0%) |
| Health Diagnosing & Treating | 2 (11.1%) | 16 (88.9%) |
| Health Technologists | 2 (20.0%) | 8 (80.0%) |
| Total (Category) | 15 (36.6%) | 26 (63.4%) |
| Total (Overall) | 165 (59.4%) | 113 (40.6%) |
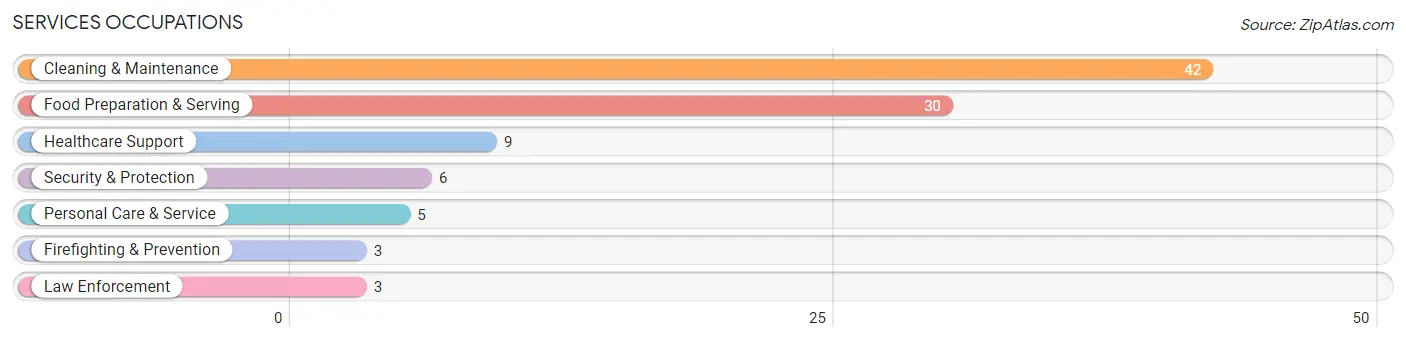
Services Occupations
The most common Services occupations in Fort White are Cleaning & Maintenance (42 | 15.1%), Food Preparation & Serving (30 | 10.8%), Healthcare Support (9 | 3.2%), Security & Protection (6 | 2.2%), and Personal Care & Service (5 | 1.8%).
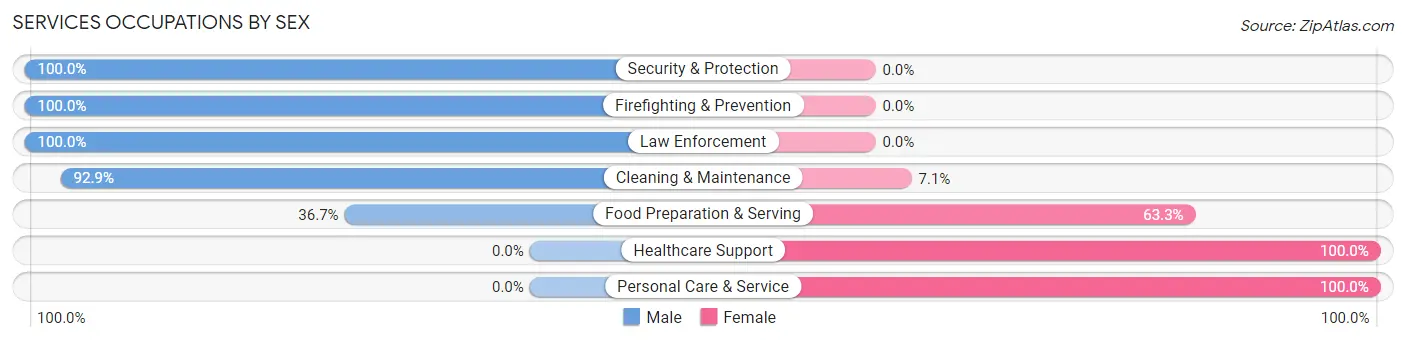
Services Occupations by Sex
Within the Services occupations in Fort White, the most male-oriented occupations are Security & Protection (100.0%), Firefighting & Prevention (100.0%), and Law Enforcement (100.0%), while the most female-oriented occupations are Healthcare Support (100.0%), Personal Care & Service (100.0%), and Food Preparation & Serving (63.3%).
| Occupation | Male | Female |
| Healthcare Support | 0 (0.0%) | 9 (100.0%) |
| Security & Protection | 6 (100.0%) | 0 (0.0%) |
| Firefighting & Prevention | 3 (100.0%) | 0 (0.0%) |
| Law Enforcement | 3 (100.0%) | 0 (0.0%) |
| Food Preparation & Serving | 11 (36.7%) | 19 (63.3%) |
| Cleaning & Maintenance | 39 (92.9%) | 3 (7.1%) |
| Personal Care & Service | 0 (0.0%) | 5 (100.0%) |
| Total (Category) | 56 (60.9%) | 36 (39.1%) |
| Total (Overall) | 165 (59.4%) | 113 (40.6%) |
Sales and Office Occupations
The most common Sales and Office occupations in Fort White are Sales & Related (80 | 28.8%), and Office & Administration (23 | 8.3%).
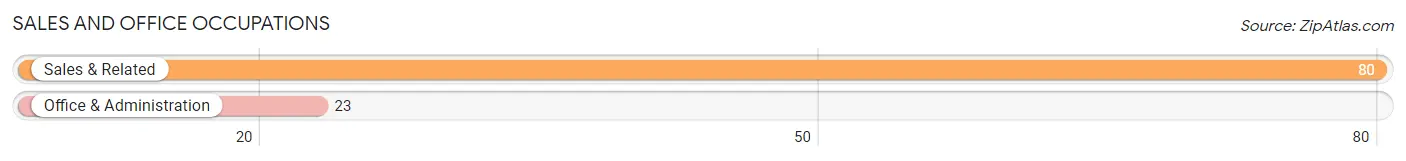
Sales and Office Occupations by Sex
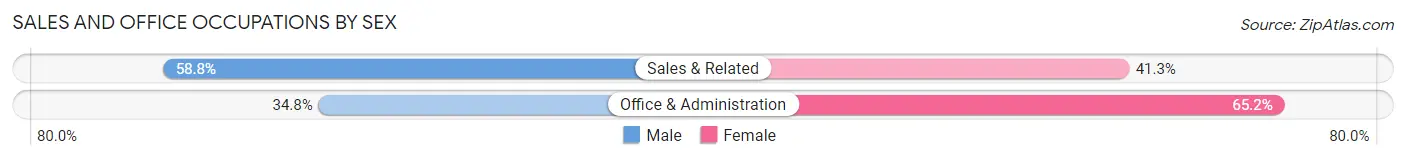
| Occupation | Male | Female |
| Sales & Related | 47 (58.8%) | 33 (41.2%) |
| Office & Administration | 8 (34.8%) | 15 (65.2%) |
| Total (Category) | 55 (53.4%) | 48 (46.6%) |
| Total (Overall) | 165 (59.4%) | 113 (40.6%) |
Natural Resources, Construction and Maintenance Occupations
The most common Natural Resources, Construction and Maintenance occupations in Fort White are Construction & Extraction (17 | 6.1%), and Installation, Maintenance & Repair (3 | 1.1%).
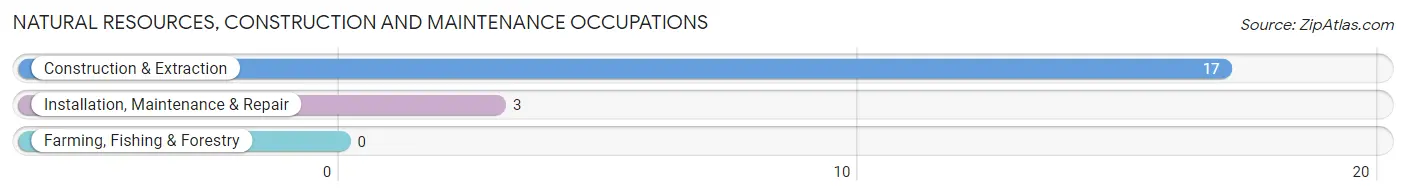
Natural Resources, Construction and Maintenance Occupations by Sex
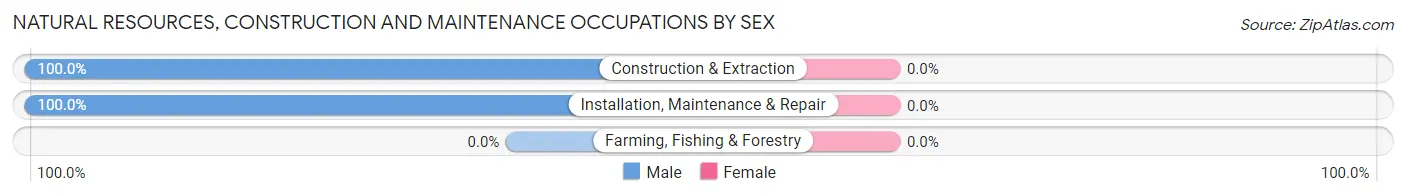
| Occupation | Male | Female |
| Farming, Fishing & Forestry | 0 (0.0%) | 0 (0.0%) |
| Construction & Extraction | 17 (100.0%) | 0 (0.0%) |
| Installation, Maintenance & Repair | 3 (100.0%) | 0 (0.0%) |
| Total (Category) | 20 (100.0%) | 0 (0.0%) |
| Total (Overall) | 165 (59.4%) | 113 (40.6%) |
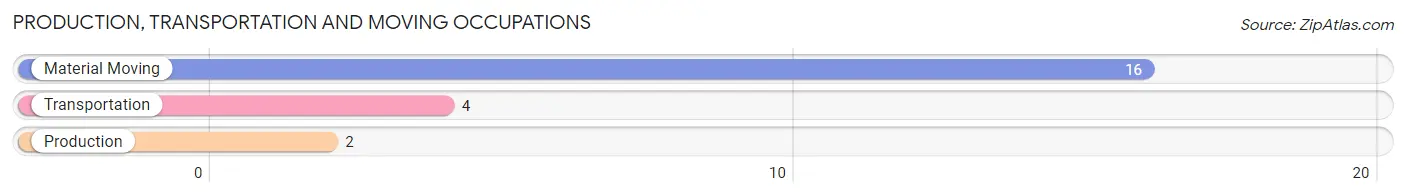
Production, Transportation and Moving Occupations
The most common Production, Transportation and Moving occupations in Fort White are Material Moving (16 | 5.8%), Transportation (4 | 1.4%), and Production (2 | 0.7%).
Production, Transportation and Moving Occupations by Sex
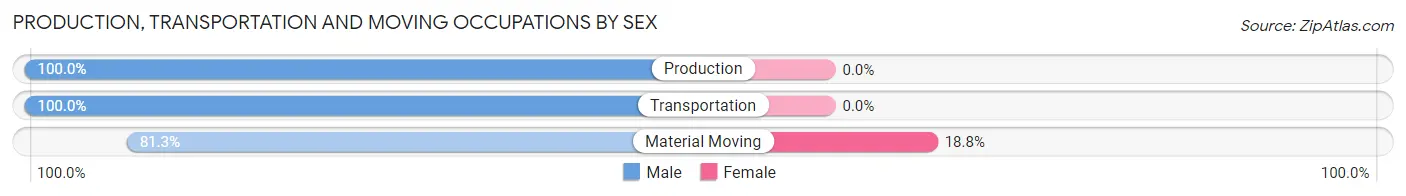
| Occupation | Male | Female |
| Production | 2 (100.0%) | 0 (0.0%) |
| Transportation | 4 (100.0%) | 0 (0.0%) |
| Material Moving | 13 (81.2%) | 3 (18.8%) |
| Total (Category) | 19 (86.4%) | 3 (13.6%) |
| Total (Overall) | 165 (59.4%) | 113 (40.6%) |
Employment Industries by Sex in Fort White
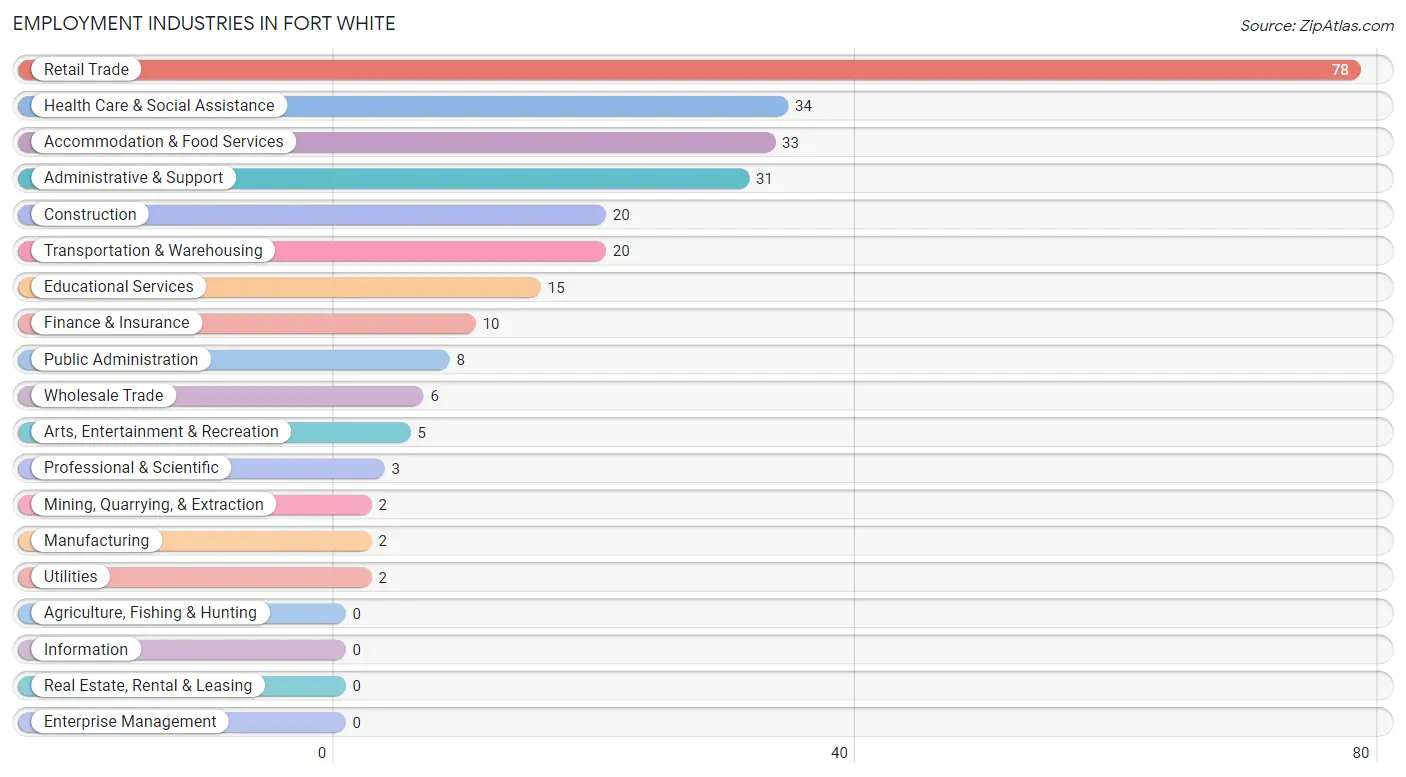
Employment Industries in Fort White
The major employment industries in Fort White include Retail Trade (78 | 28.1%), Health Care & Social Assistance (34 | 12.2%), Accommodation & Food Services (33 | 11.9%), Administrative & Support (31 | 11.2%), and Construction (20 | 7.2%).
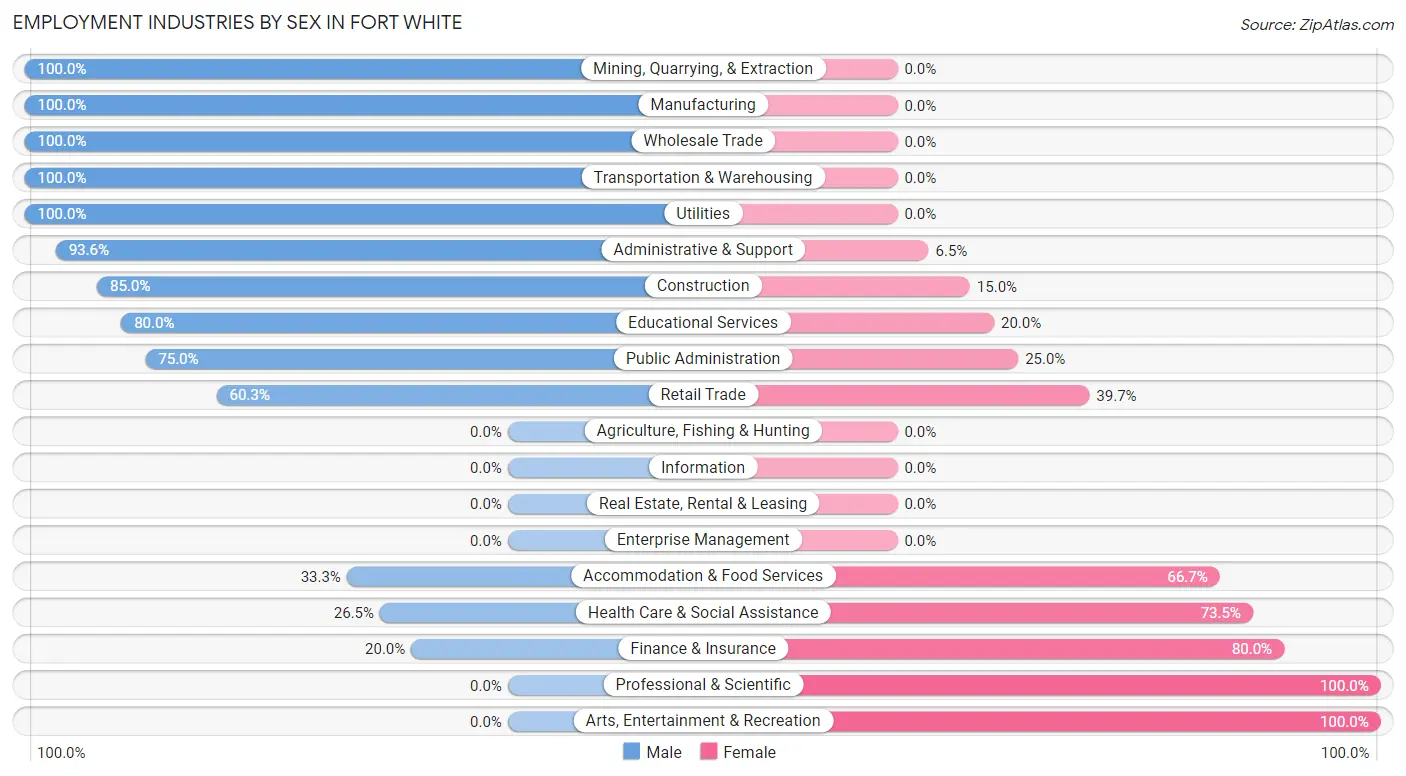
Employment Industries by Sex in Fort White
The Fort White industries that see more men than women are Mining, Quarrying, & Extraction (100.0%), Manufacturing (100.0%), and Wholesale Trade (100.0%), whereas the industries that tend to have a higher number of women are Professional & Scientific (100.0%), Arts, Entertainment & Recreation (100.0%), and Finance & Insurance (80.0%).
| Industry | Male | Female |
| Agriculture, Fishing & Hunting | 0 (0.0%) | 0 (0.0%) |
| Mining, Quarrying, & Extraction | 2 (100.0%) | 0 (0.0%) |
| Construction | 17 (85.0%) | 3 (15.0%) |
| Manufacturing | 2 (100.0%) | 0 (0.0%) |
| Wholesale Trade | 6 (100.0%) | 0 (0.0%) |
| Retail Trade | 47 (60.3%) | 31 (39.7%) |
| Transportation & Warehousing | 20 (100.0%) | 0 (0.0%) |
| Utilities | 2 (100.0%) | 0 (0.0%) |
| Information | 0 (0.0%) | 0 (0.0%) |
| Finance & Insurance | 2 (20.0%) | 8 (80.0%) |
| Real Estate, Rental & Leasing | 0 (0.0%) | 0 (0.0%) |
| Professional & Scientific | 0 (0.0%) | 3 (100.0%) |
| Enterprise Management | 0 (0.0%) | 0 (0.0%) |
| Administrative & Support | 29 (93.5%) | 2 (6.5%) |
| Educational Services | 12 (80.0%) | 3 (20.0%) |
| Health Care & Social Assistance | 9 (26.5%) | 25 (73.5%) |
| Arts, Entertainment & Recreation | 0 (0.0%) | 5 (100.0%) |
| Accommodation & Food Services | 11 (33.3%) | 22 (66.7%) |
| Public Administration | 6 (75.0%) | 2 (25.0%) |
| Total | 165 (59.4%) | 113 (40.6%) |
Education in Fort White
School Enrollment in Fort White
The most common levels of schooling among the 124 students in Fort White are high school (51 | 41.1%), middle school (24 | 19.4%), and elementary school (19 | 15.3%).
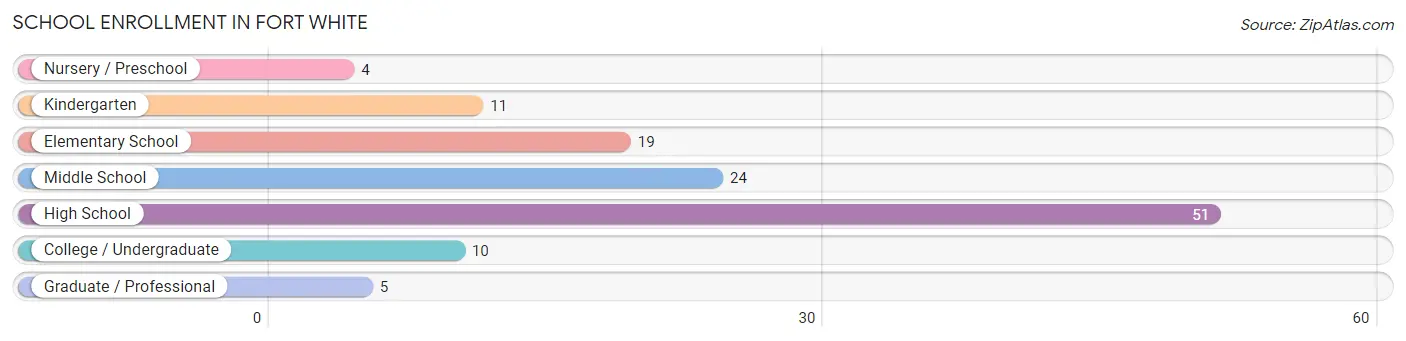
| School Level | # Students | % Students |
| Nursery / Preschool | 4 | 3.2% |
| Kindergarten | 11 | 8.9% |
| Elementary School | 19 | 15.3% |
| Middle School | 24 | 19.4% |
| High School | 51 | 41.1% |
| College / Undergraduate | 10 | 8.1% |
| Graduate / Professional | 5 | 4.0% |
| Total | 124 | 100.0% |
School Enrollment by Age by Funding Source in Fort White
Out of a total of 124 students who are enrolled in schools in Fort White, 14 (11.3%) attend a private institution, while the remaining 110 (88.7%) are enrolled in public schools. The age group of 10 to 14 year olds has the highest likelihood of being enrolled in private schools, with 9 (29.0% in the age bracket) enrolled. Conversely, the age group of 5 to 9 year old has the lowest likelihood of being enrolled in a private school, with 32 (100.0% in the age bracket) attending a public institution.
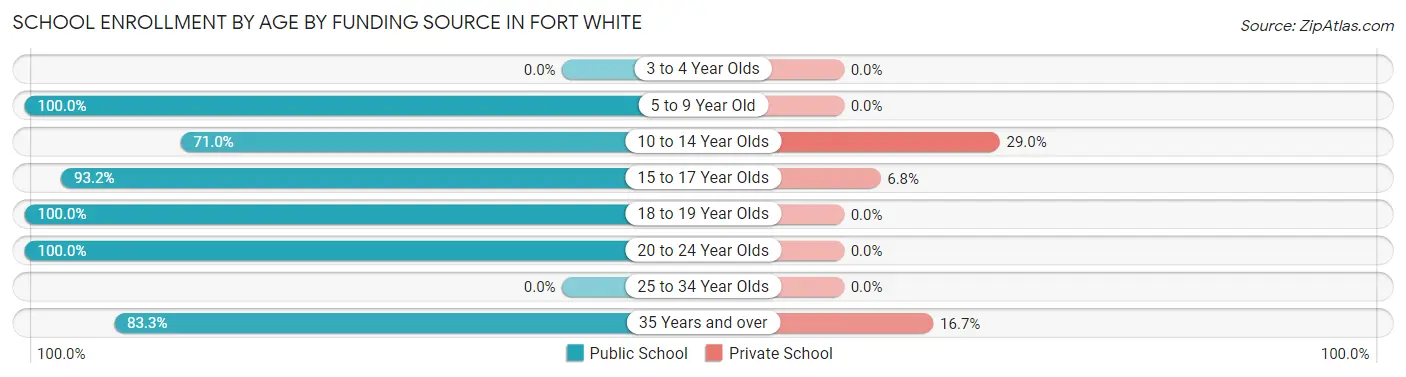
| Age Bracket | Public School | Private School |
| 3 to 4 Year Olds | 0 (0.0%) | 0 (0.0%) |
| 5 to 9 Year Old | 32 (100.0%) | 0 (0.0%) |
| 10 to 14 Year Olds | 22 (71.0%) | 9 (29.0%) |
| 15 to 17 Year Olds | 41 (93.2%) | 3 (6.8%) |
| 18 to 19 Year Olds | 2 (100.0%) | 0 (0.0%) |
| 20 to 24 Year Olds | 3 (100.0%) | 0 (0.0%) |
| 25 to 34 Year Olds | 0 (0.0%) | 0 (0.0%) |
| 35 Years and over | 10 (83.3%) | 2 (16.7%) |
| Total | 110 (88.7%) | 14 (11.3%) |
Educational Attainment by Field of Study in Fort White
Education (13 | 21.7%), psychology (10 | 16.7%), science & technology (10 | 16.7%), business (10 | 16.7%), and social sciences (6 | 10.0%) are the most common fields of study among 60 individuals in Fort White who have obtained a bachelor's degree or higher.
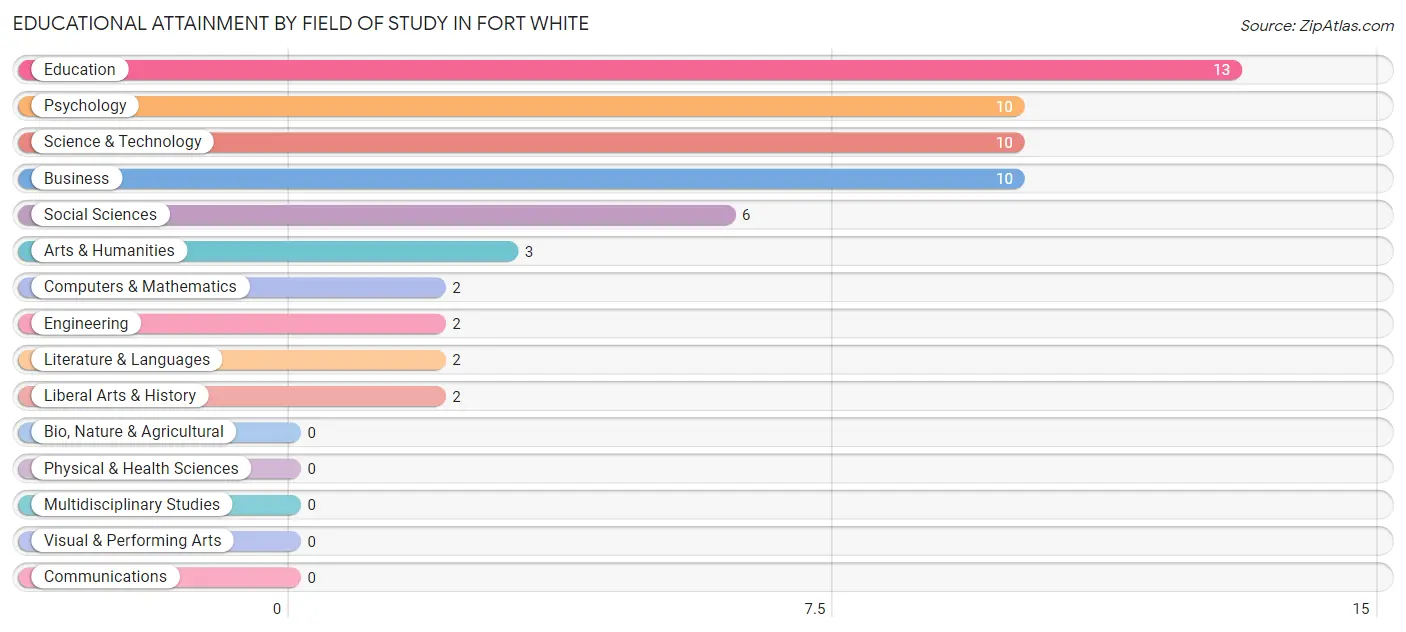
| Field of Study | # Graduates | % Graduates |
| Computers & Mathematics | 2 | 3.3% |
| Bio, Nature & Agricultural | 0 | 0.0% |
| Physical & Health Sciences | 0 | 0.0% |
| Psychology | 10 | 16.7% |
| Social Sciences | 6 | 10.0% |
| Engineering | 2 | 3.3% |
| Multidisciplinary Studies | 0 | 0.0% |
| Science & Technology | 10 | 16.7% |
| Business | 10 | 16.7% |
| Education | 13 | 21.7% |
| Literature & Languages | 2 | 3.3% |
| Liberal Arts & History | 2 | 3.3% |
| Visual & Performing Arts | 0 | 0.0% |
| Communications | 0 | 0.0% |
| Arts & Humanities | 3 | 5.0% |
| Total | 60 | 100.0% |
Transportation & Commute in Fort White
Vehicle Availability by Sex in Fort White
The most prevalent vehicle ownership categories in Fort White are males with 1 vehicle (92, accounting for 55.8%) and females with 1 vehicle (48, making up 81.4%).
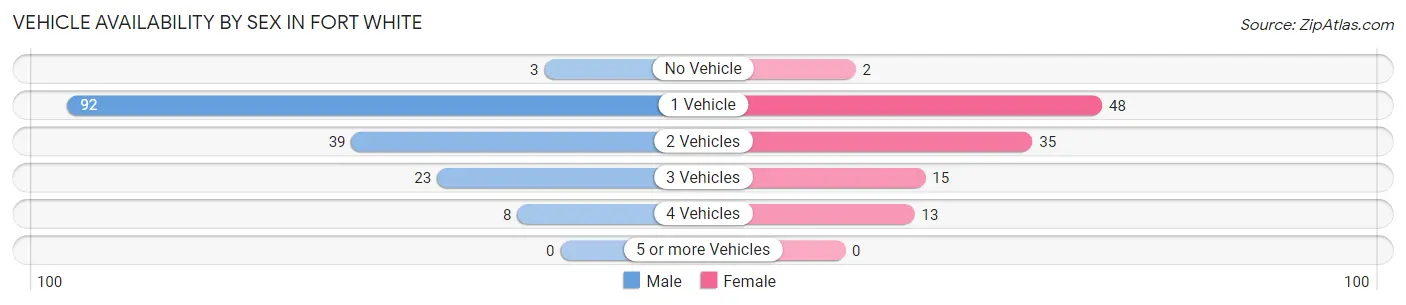
| Vehicles Available | Male | Female |
| No Vehicle | 3 (1.8%) | 2 (1.8%) |
| 1 Vehicle | 92 (55.8%) | 48 (42.5%) |
| 2 Vehicles | 39 (23.6%) | 35 (31.0%) |
| 3 Vehicles | 23 (13.9%) | 15 (13.3%) |
| 4 Vehicles | 8 (4.9%) | 13 (11.5%) |
| 5 or more Vehicles | 0 (0.0%) | 0 (0.0%) |
| Total | 165 (100.0%) | 113 (100.0%) |
Commute Time in Fort White
The most frequently occuring commute durations in Fort White are 15 to 19 minutes (78 commuters, 29.0%), 30 to 34 minutes (56 commuters, 20.8%), and 45 to 59 minutes (46 commuters, 17.1%).
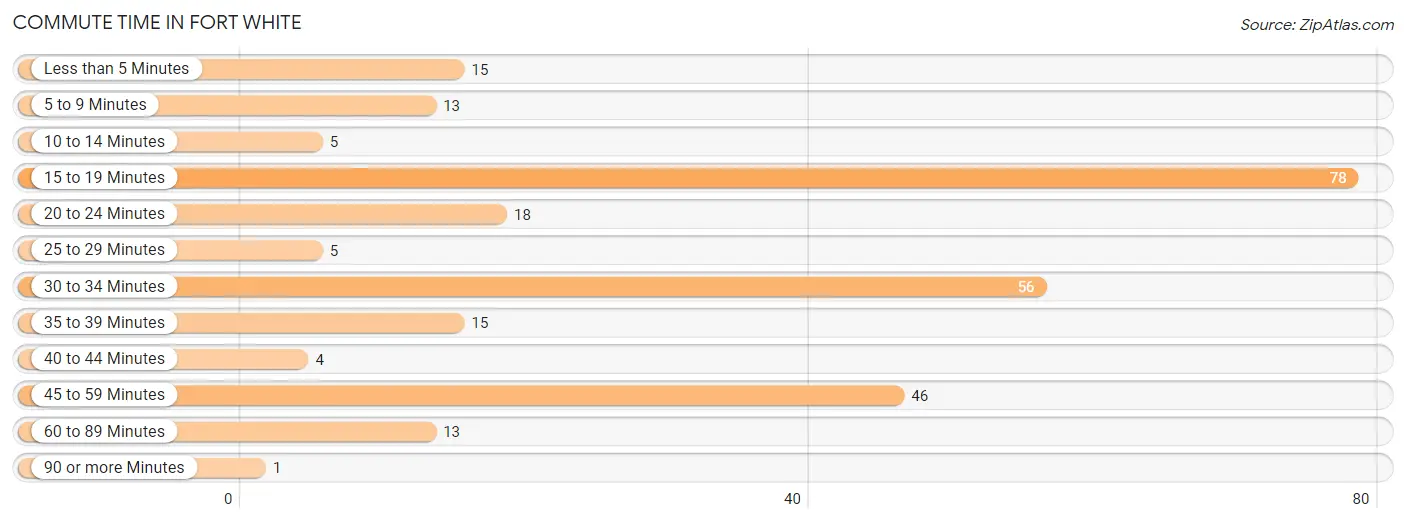
| Commute Time | # Commuters | % Commuters |
| Less than 5 Minutes | 15 | 5.6% |
| 5 to 9 Minutes | 13 | 4.8% |
| 10 to 14 Minutes | 5 | 1.9% |
| 15 to 19 Minutes | 78 | 29.0% |
| 20 to 24 Minutes | 18 | 6.7% |
| 25 to 29 Minutes | 5 | 1.9% |
| 30 to 34 Minutes | 56 | 20.8% |
| 35 to 39 Minutes | 15 | 5.6% |
| 40 to 44 Minutes | 4 | 1.5% |
| 45 to 59 Minutes | 46 | 17.1% |
| 60 to 89 Minutes | 13 | 4.8% |
| 90 or more Minutes | 1 | 0.4% |
Commute Time by Sex in Fort White
The most common commute times in Fort White are 15 to 19 minutes (51 commuters, 31.9%) for males and 15 to 19 minutes (27 commuters, 24.8%) for females.
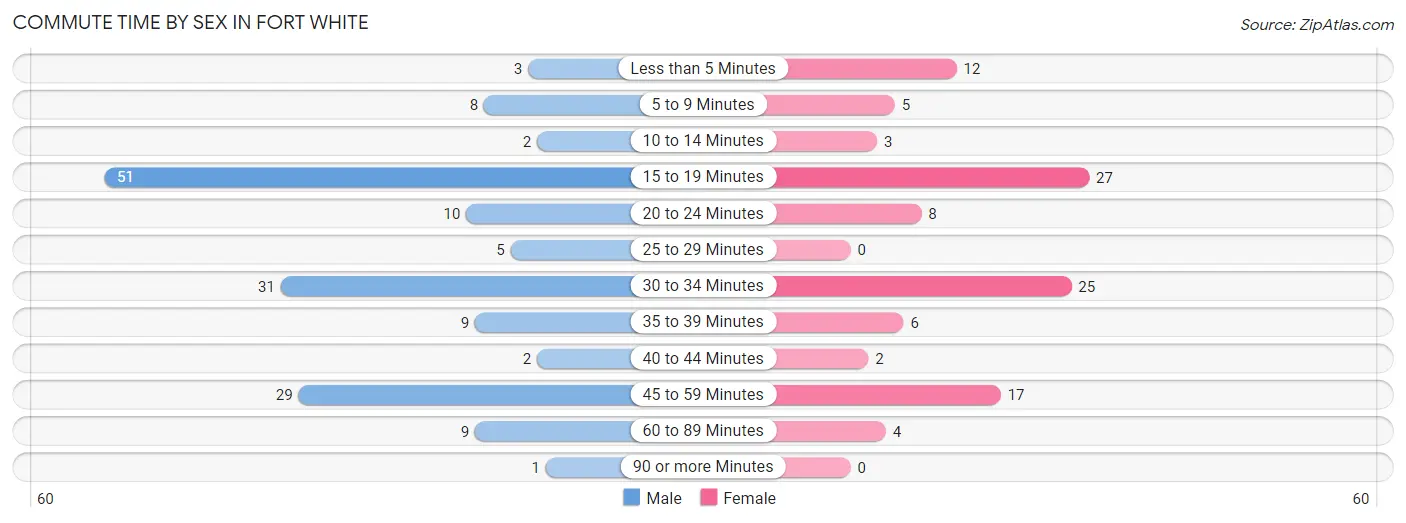
| Commute Time | Male | Female |
| Less than 5 Minutes | 3 (1.9%) | 12 (11.0%) |
| 5 to 9 Minutes | 8 (5.0%) | 5 (4.6%) |
| 10 to 14 Minutes | 2 (1.3%) | 3 (2.8%) |
| 15 to 19 Minutes | 51 (31.9%) | 27 (24.8%) |
| 20 to 24 Minutes | 10 (6.2%) | 8 (7.3%) |
| 25 to 29 Minutes | 5 (3.1%) | 0 (0.0%) |
| 30 to 34 Minutes | 31 (19.4%) | 25 (22.9%) |
| 35 to 39 Minutes | 9 (5.6%) | 6 (5.5%) |
| 40 to 44 Minutes | 2 (1.3%) | 2 (1.8%) |
| 45 to 59 Minutes | 29 (18.1%) | 17 (15.6%) |
| 60 to 89 Minutes | 9 (5.6%) | 4 (3.7%) |
| 90 or more Minutes | 1 (0.6%) | 0 (0.0%) |
Time of Departure to Work by Sex in Fort White
The most frequent times of departure to work in Fort White are 12:00 PM to 3:59 PM (42, 26.3%) for males and 12:00 PM to 3:59 PM (29, 26.6%) for females.
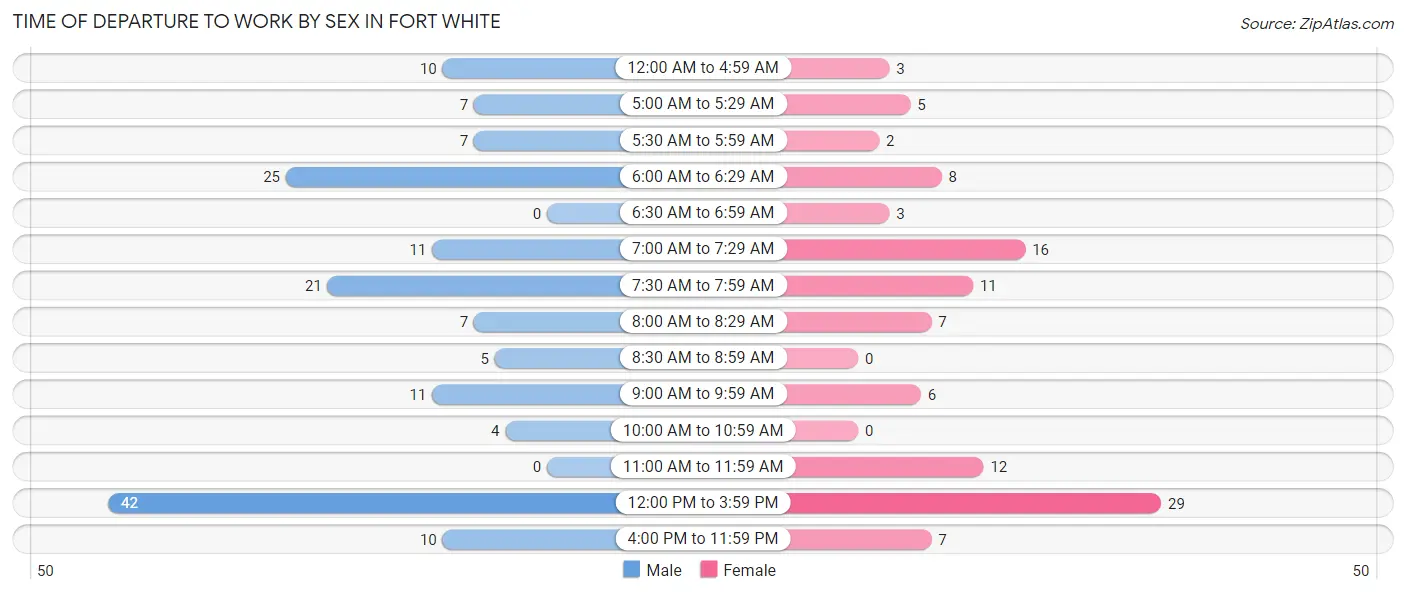
| Time of Departure | Male | Female |
| 12:00 AM to 4:59 AM | 10 (6.2%) | 3 (2.8%) |
| 5:00 AM to 5:29 AM | 7 (4.4%) | 5 (4.6%) |
| 5:30 AM to 5:59 AM | 7 (4.4%) | 2 (1.8%) |
| 6:00 AM to 6:29 AM | 25 (15.6%) | 8 (7.3%) |
| 6:30 AM to 6:59 AM | 0 (0.0%) | 3 (2.8%) |
| 7:00 AM to 7:29 AM | 11 (6.9%) | 16 (14.7%) |
| 7:30 AM to 7:59 AM | 21 (13.1%) | 11 (10.1%) |
| 8:00 AM to 8:29 AM | 7 (4.4%) | 7 (6.4%) |
| 8:30 AM to 8:59 AM | 5 (3.1%) | 0 (0.0%) |
| 9:00 AM to 9:59 AM | 11 (6.9%) | 6 (5.5%) |
| 10:00 AM to 10:59 AM | 4 (2.5%) | 0 (0.0%) |
| 11:00 AM to 11:59 AM | 0 (0.0%) | 12 (11.0%) |
| 12:00 PM to 3:59 PM | 42 (26.3%) | 29 (26.6%) |
| 4:00 PM to 11:59 PM | 10 (6.2%) | 7 (6.4%) |
| Total | 160 (100.0%) | 109 (100.0%) |
Housing Occupancy in Fort White
Occupancy by Ownership in Fort White
Of the total 213 dwellings in Fort White, owner-occupied units account for 153 (71.8%), while renter-occupied units make up 60 (28.2%).
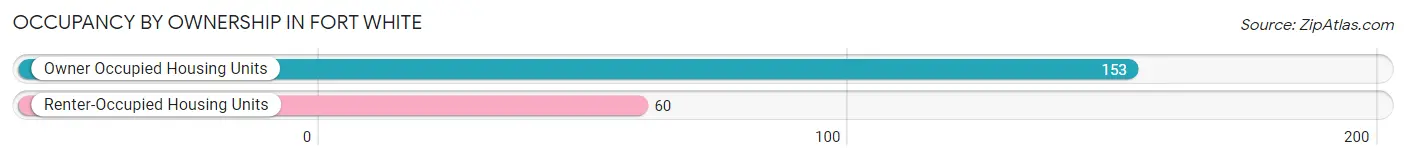
| Occupancy | # Housing Units | % Housing Units |
| Owner Occupied Housing Units | 153 | 71.8% |
| Renter-Occupied Housing Units | 60 | 28.2% |
| Total Occupied Housing Units | 213 | 100.0% |
Occupancy by Household Size in Fort White
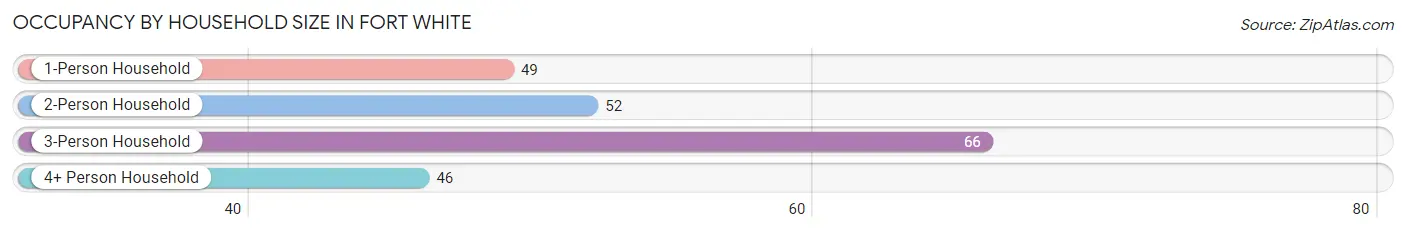
| Household Size | # Housing Units | % Housing Units |
| 1-Person Household | 49 | 23.0% |
| 2-Person Household | 52 | 24.4% |
| 3-Person Household | 66 | 31.0% |
| 4+ Person Household | 46 | 21.6% |
| Total Housing Units | 213 | 100.0% |
Occupancy by Ownership by Household Size in Fort White
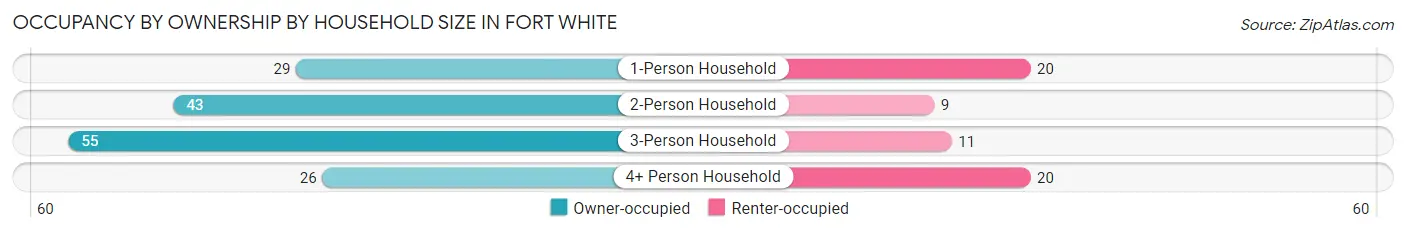
| Household Size | Owner-occupied | Renter-occupied |
| 1-Person Household | 29 (59.2%) | 20 (40.8%) |
| 2-Person Household | 43 (82.7%) | 9 (17.3%) |
| 3-Person Household | 55 (83.3%) | 11 (16.7%) |
| 4+ Person Household | 26 (56.5%) | 20 (43.5%) |
| Total Housing Units | 153 (71.8%) | 60 (28.2%) |
Occupancy by Educational Attainment in Fort White
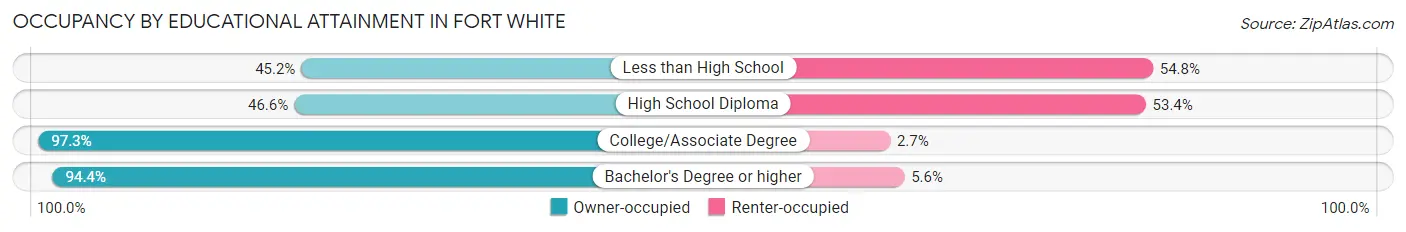
| Household Size | Owner-occupied | Renter-occupied |
| Less than High School | 14 (45.2%) | 17 (54.8%) |
| High School Diploma | 34 (46.6%) | 39 (53.4%) |
| College/Associate Degree | 71 (97.3%) | 2 (2.7%) |
| Bachelor's Degree or higher | 34 (94.4%) | 2 (5.6%) |
Occupancy by Age of Householder in Fort White
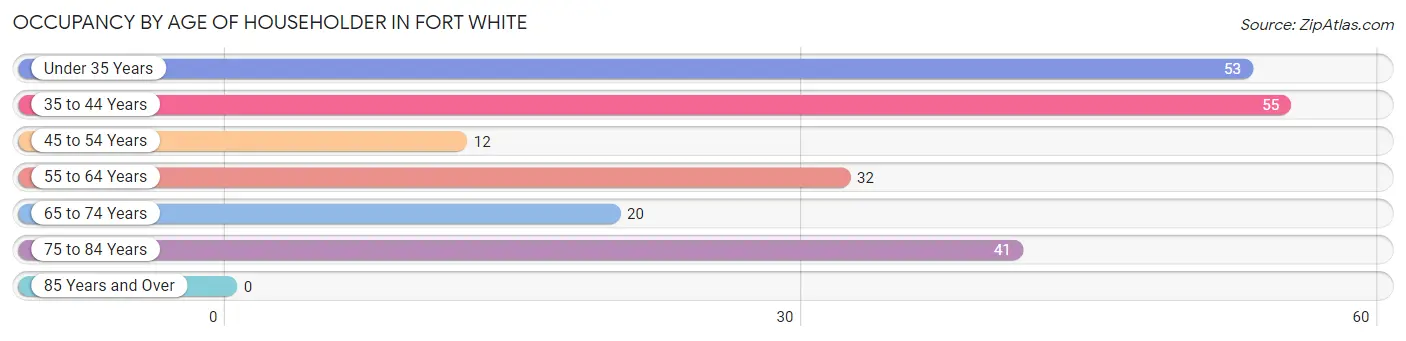
| Age Bracket | # Households | % Households |
| Under 35 Years | 53 | 24.9% |
| 35 to 44 Years | 55 | 25.8% |
| 45 to 54 Years | 12 | 5.6% |
| 55 to 64 Years | 32 | 15.0% |
| 65 to 74 Years | 20 | 9.4% |
| 75 to 84 Years | 41 | 19.3% |
| 85 Years and Over | 0 | 0.0% |
| Total | 213 | 100.0% |
Housing Finances in Fort White
Median Income by Occupancy in Fort White
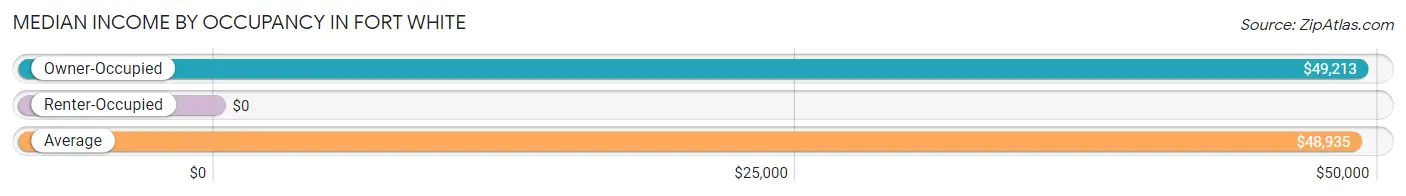
| Occupancy Type | # Households | Median Income |
| Owner-Occupied | 153 (71.8%) | $49,213 |
| Renter-Occupied | 60 (28.2%) | $0 |
| Average | 213 (100.0%) | $48,935 |
Occupancy by Householder Income Bracket in Fort White
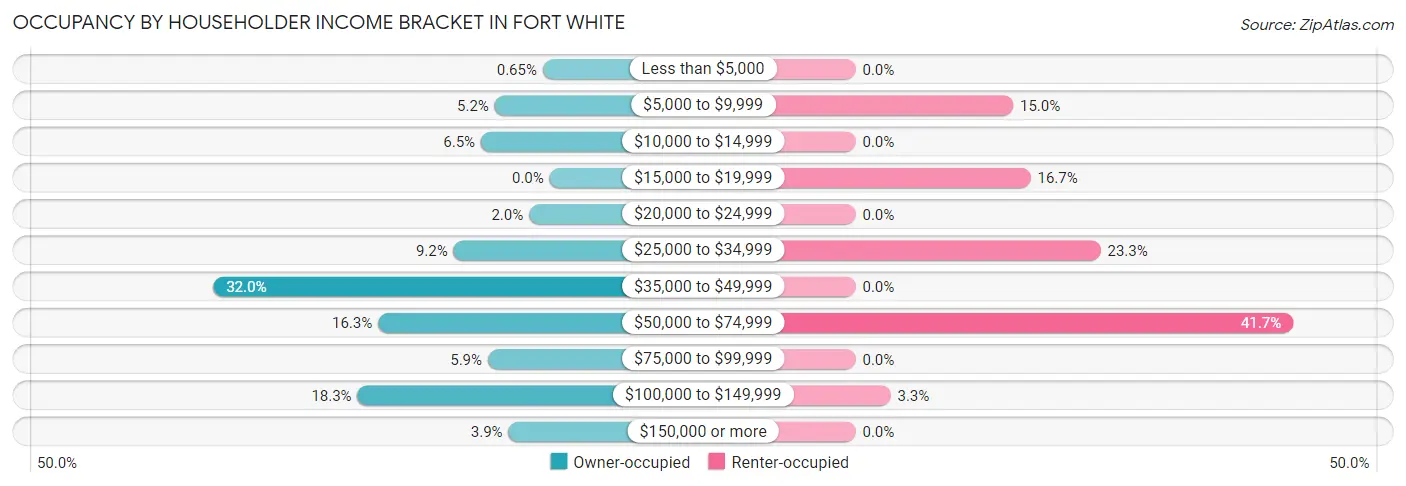
| Income Bracket | Owner-occupied | Renter-occupied |
| Less than $5,000 | 1 (0.6%) | 0 (0.0%) |
| $5,000 to $9,999 | 8 (5.2%) | 9 (15.0%) |
| $10,000 to $14,999 | 10 (6.5%) | 0 (0.0%) |
| $15,000 to $19,999 | 0 (0.0%) | 10 (16.7%) |
| $20,000 to $24,999 | 3 (2.0%) | 0 (0.0%) |
| $25,000 to $34,999 | 14 (9.1%) | 14 (23.3%) |
| $35,000 to $49,999 | 49 (32.0%) | 0 (0.0%) |
| $50,000 to $74,999 | 25 (16.3%) | 25 (41.7%) |
| $75,000 to $99,999 | 9 (5.9%) | 0 (0.0%) |
| $100,000 to $149,999 | 28 (18.3%) | 2 (3.3%) |
| $150,000 or more | 6 (3.9%) | 0 (0.0%) |
| Total | 153 (100.0%) | 60 (100.0%) |
Monthly Housing Cost Tiers in Fort White
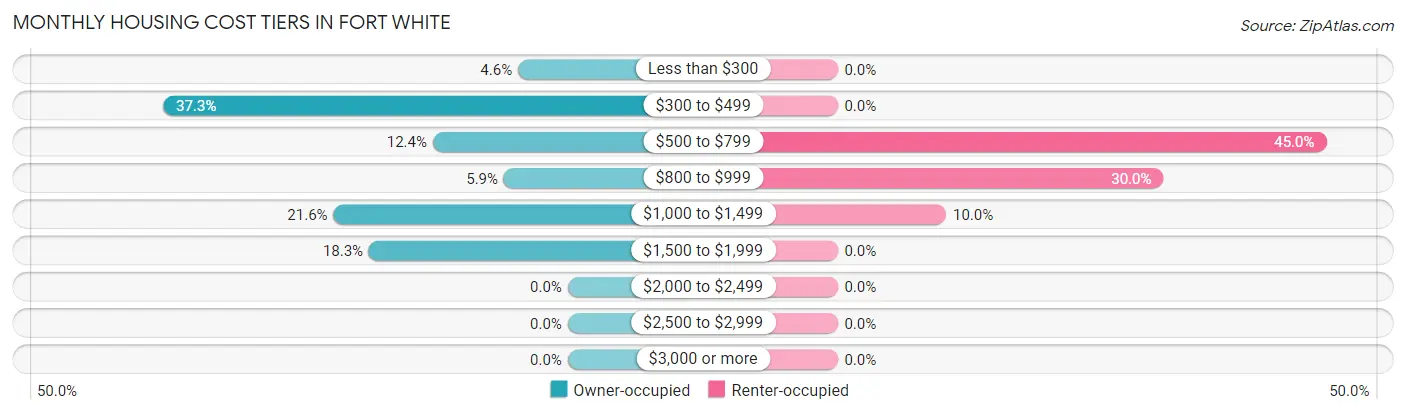
| Monthly Cost | Owner-occupied | Renter-occupied |
| Less than $300 | 7 (4.6%) | 0 (0.0%) |
| $300 to $499 | 57 (37.2%) | 0 (0.0%) |
| $500 to $799 | 19 (12.4%) | 27 (45.0%) |
| $800 to $999 | 9 (5.9%) | 18 (30.0%) |
| $1,000 to $1,499 | 33 (21.6%) | 6 (10.0%) |
| $1,500 to $1,999 | 28 (18.3%) | 0 (0.0%) |
| $2,000 to $2,499 | 0 (0.0%) | 0 (0.0%) |
| $2,500 to $2,999 | 0 (0.0%) | 0 (0.0%) |
| $3,000 or more | 0 (0.0%) | 0 (0.0%) |
| Total | 153 (100.0%) | 60 (100.0%) |
Physical Housing Characteristics in Fort White
Housing Structures in Fort White
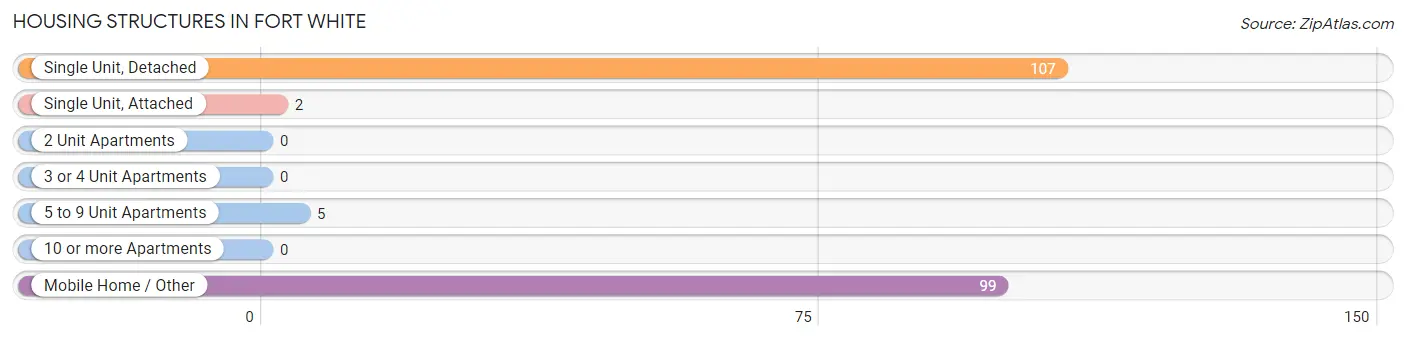
| Structure Type | # Housing Units | % Housing Units |
| Single Unit, Detached | 107 | 50.2% |
| Single Unit, Attached | 2 | 0.9% |
| 2 Unit Apartments | 0 | 0.0% |
| 3 or 4 Unit Apartments | 0 | 0.0% |
| 5 to 9 Unit Apartments | 5 | 2.4% |
| 10 or more Apartments | 0 | 0.0% |
| Mobile Home / Other | 99 | 46.5% |
| Total | 213 | 100.0% |
Housing Structures by Occupancy in Fort White

| Structure Type | Owner-occupied | Renter-occupied |
| Single Unit, Detached | 100 (93.5%) | 7 (6.5%) |
| Single Unit, Attached | 0 (0.0%) | 2 (100.0%) |
| 2 Unit Apartments | 0 (0.0%) | 0 (0.0%) |
| 3 or 4 Unit Apartments | 0 (0.0%) | 0 (0.0%) |
| 5 to 9 Unit Apartments | 5 (100.0%) | 0 (0.0%) |
| 10 or more Apartments | 0 (0.0%) | 0 (0.0%) |
| Mobile Home / Other | 48 (48.5%) | 51 (51.5%) |
| Total | 153 (71.8%) | 60 (28.2%) |
Housing Structures by Number of Rooms in Fort White
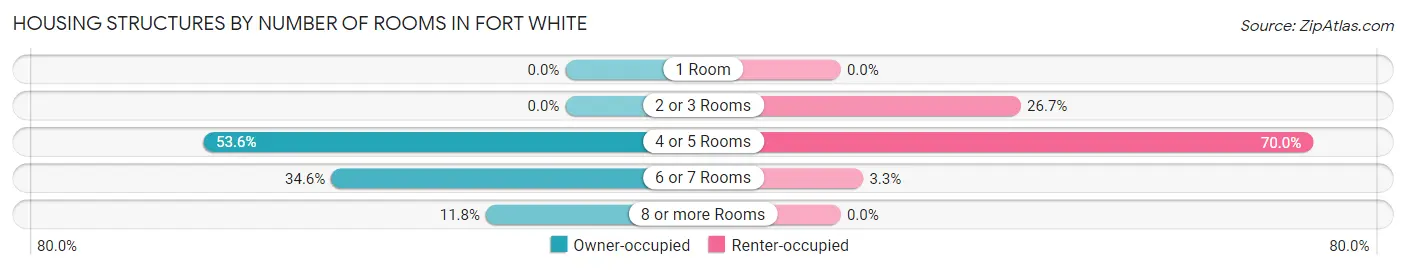
| Number of Rooms | Owner-occupied | Renter-occupied |
| 1 Room | 0 (0.0%) | 0 (0.0%) |
| 2 or 3 Rooms | 0 (0.0%) | 16 (26.7%) |
| 4 or 5 Rooms | 82 (53.6%) | 42 (70.0%) |
| 6 or 7 Rooms | 53 (34.6%) | 2 (3.3%) |
| 8 or more Rooms | 18 (11.8%) | 0 (0.0%) |
| Total | 153 (100.0%) | 60 (100.0%) |
Housing Structure by Heating Type in Fort White
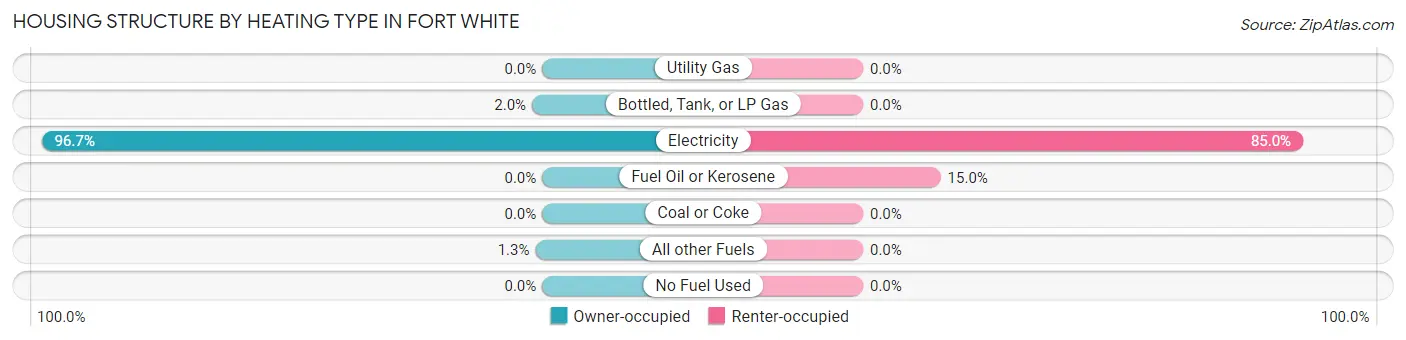
| Heating Type | Owner-occupied | Renter-occupied |
| Utility Gas | 0 (0.0%) | 0 (0.0%) |
| Bottled, Tank, or LP Gas | 3 (2.0%) | 0 (0.0%) |
| Electricity | 148 (96.7%) | 51 (85.0%) |
| Fuel Oil or Kerosene | 0 (0.0%) | 9 (15.0%) |
| Coal or Coke | 0 (0.0%) | 0 (0.0%) |
| All other Fuels | 2 (1.3%) | 0 (0.0%) |
| No Fuel Used | 0 (0.0%) | 0 (0.0%) |
| Total | 153 (100.0%) | 60 (100.0%) |
Household Vehicle Usage in Fort White
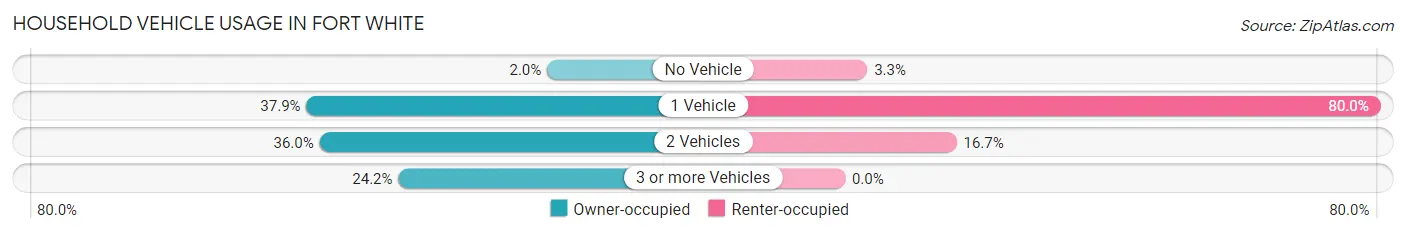
| Vehicles per Household | Owner-occupied | Renter-occupied |
| No Vehicle | 3 (2.0%) | 2 (3.3%) |
| 1 Vehicle | 58 (37.9%) | 48 (80.0%) |
| 2 Vehicles | 55 (35.9%) | 10 (16.7%) |
| 3 or more Vehicles | 37 (24.2%) | 0 (0.0%) |
| Total | 153 (100.0%) | 60 (100.0%) |
Real Estate & Mortgages in Fort White
Real Estate and Mortgage Overview in Fort White
| Characteristic | Without Mortgage | With Mortgage |
| Housing Units | 79 | 74 |
| Median Property Value | - | - |
| Median Household Income | $48,565 | $6 |
| Monthly Housing Costs | $339 | $0 |
| Real Estate Taxes | $750 | $4 |
Property Value by Mortgage Status in Fort White
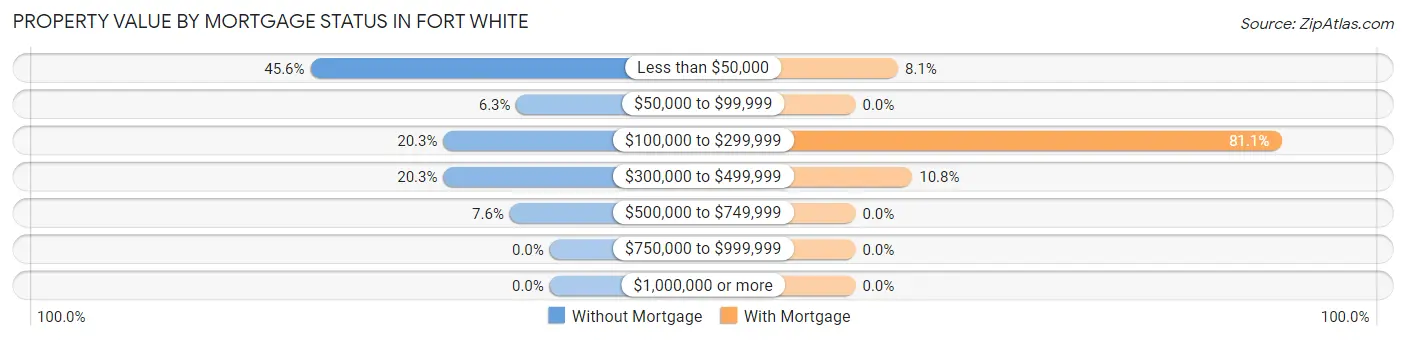
| Property Value | Without Mortgage | With Mortgage |
| Less than $50,000 | 36 (45.6%) | 6 (8.1%) |
| $50,000 to $99,999 | 5 (6.3%) | 0 (0.0%) |
| $100,000 to $299,999 | 16 (20.3%) | 60 (81.1%) |
| $300,000 to $499,999 | 16 (20.3%) | 8 (10.8%) |
| $500,000 to $749,999 | 6 (7.6%) | 0 (0.0%) |
| $750,000 to $999,999 | 0 (0.0%) | 0 (0.0%) |
| $1,000,000 or more | 0 (0.0%) | 0 (0.0%) |
| Total | 79 (100.0%) | 74 (100.0%) |
Household Income by Mortgage Status in Fort White
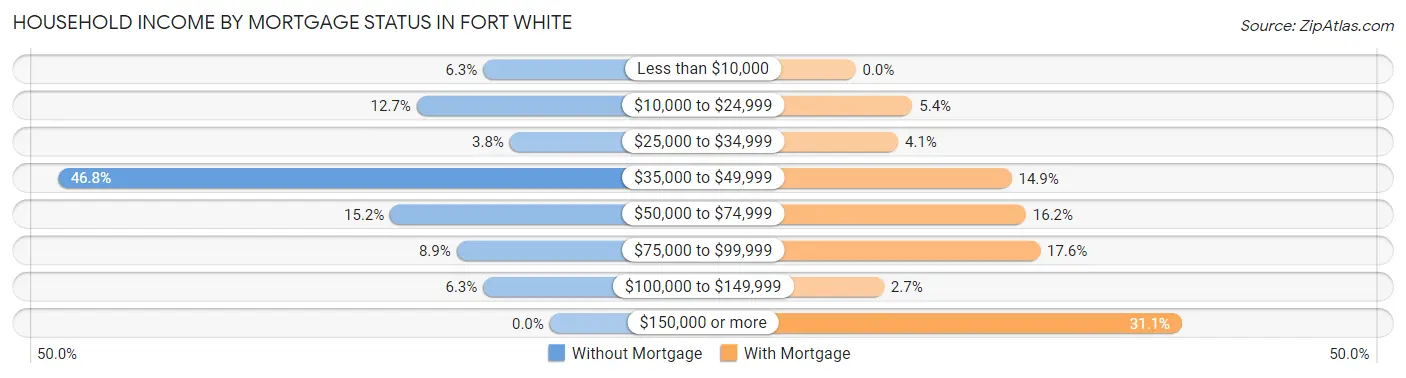
| Household Income | Without Mortgage | With Mortgage |
| Less than $10,000 | 5 (6.3%) | 0 (0.0%) |
| $10,000 to $24,999 | 10 (12.7%) | 4 (5.4%) |
| $25,000 to $34,999 | 3 (3.8%) | 3 (4.1%) |
| $35,000 to $49,999 | 37 (46.8%) | 11 (14.9%) |
| $50,000 to $74,999 | 12 (15.2%) | 12 (16.2%) |
| $75,000 to $99,999 | 7 (8.9%) | 13 (17.6%) |
| $100,000 to $149,999 | 5 (6.3%) | 2 (2.7%) |
| $150,000 or more | 0 (0.0%) | 23 (31.1%) |
| Total | 79 (100.0%) | 74 (100.0%) |
Property Value to Household Income Ratio in Fort White
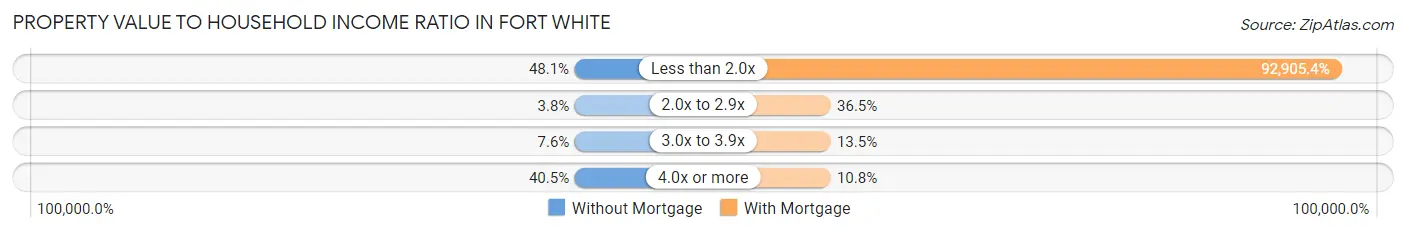
| Value-to-Income Ratio | Without Mortgage | With Mortgage |
| Less than 2.0x | 38 (48.1%) | 68,750 (92,905.4%) |
| 2.0x to 2.9x | 3 (3.8%) | 27 (36.5%) |
| 3.0x to 3.9x | 6 (7.6%) | 10 (13.5%) |
| 4.0x or more | 32 (40.5%) | 8 (10.8%) |
| Total | 79 (100.0%) | 74 (100.0%) |
Real Estate Taxes by Mortgage Status in Fort White
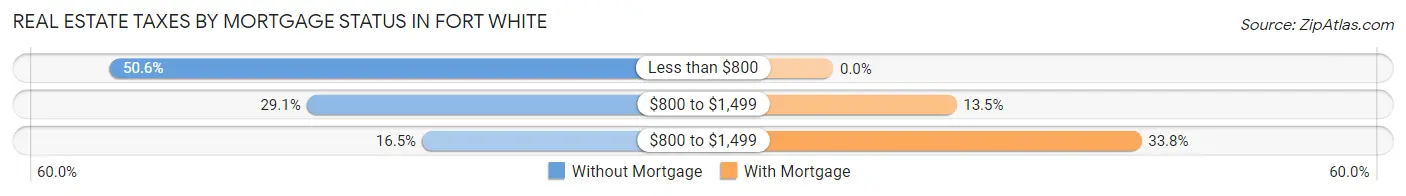
| Property Taxes | Without Mortgage | With Mortgage |
| Less than $800 | 40 (50.6%) | 0 (0.0%) |
| $800 to $1,499 | 23 (29.1%) | 10 (13.5%) |
| $800 to $1,499 | 13 (16.5%) | 25 (33.8%) |
| Total | 79 (100.0%) | 74 (100.0%) |
Health & Disability in Fort White
Health Insurance Coverage by Age in Fort White
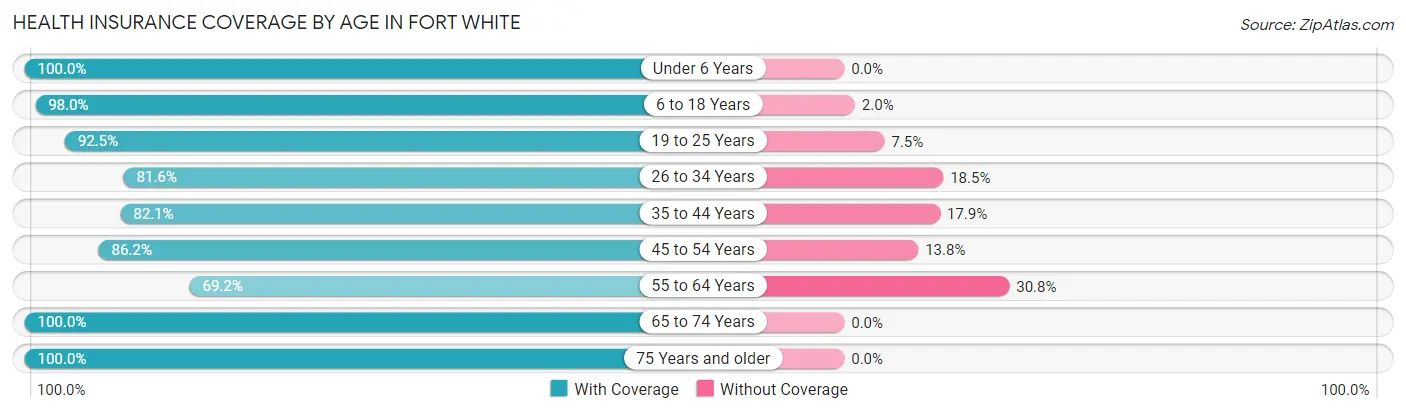
| Age Bracket | With Coverage | Without Coverage |
| Under 6 Years | 59 (100.0%) | 0 (0.0%) |
| 6 to 18 Years | 99 (98.0%) | 2 (2.0%) |
| 19 to 25 Years | 37 (92.5%) | 3 (7.5%) |
| 26 to 34 Years | 84 (81.6%) | 19 (18.4%) |
| 35 to 44 Years | 69 (82.1%) | 15 (17.9%) |
| 45 to 54 Years | 25 (86.2%) | 4 (13.8%) |
| 55 to 64 Years | 45 (69.2%) | 20 (30.8%) |
| 65 to 74 Years | 44 (100.0%) | 0 (0.0%) |
| 75 Years and older | 51 (100.0%) | 0 (0.0%) |
| Total | 513 (89.1%) | 63 (10.9%) |
Health Insurance Coverage by Citizenship Status in Fort White
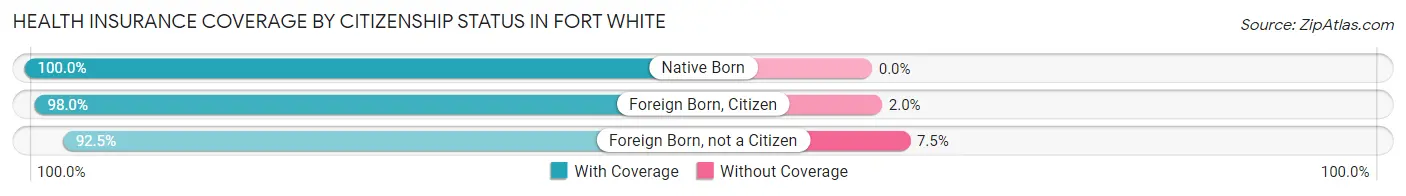
| Citizenship Status | With Coverage | Without Coverage |
| Native Born | 59 (100.0%) | 0 (0.0%) |
| Foreign Born, Citizen | 99 (98.0%) | 2 (2.0%) |
| Foreign Born, not a Citizen | 37 (92.5%) | 3 (7.5%) |
Health Insurance Coverage by Household Income in Fort White
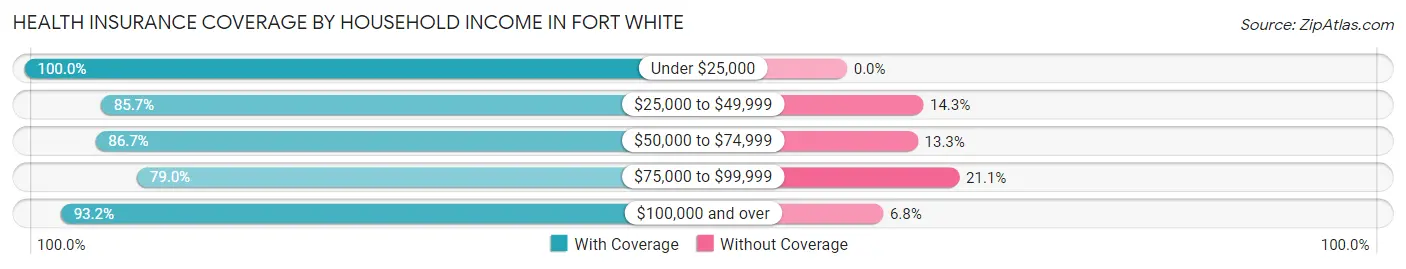
| Household Income | With Coverage | Without Coverage |
| Under $25,000 | 68 (100.0%) | 0 (0.0%) |
| $25,000 to $49,999 | 150 (85.7%) | 25 (14.3%) |
| $50,000 to $74,999 | 170 (86.7%) | 26 (13.3%) |
| $75,000 to $99,999 | 15 (78.9%) | 4 (21.0%) |
| $100,000 and over | 110 (93.2%) | 8 (6.8%) |
Public vs Private Health Insurance Coverage by Age in Fort White
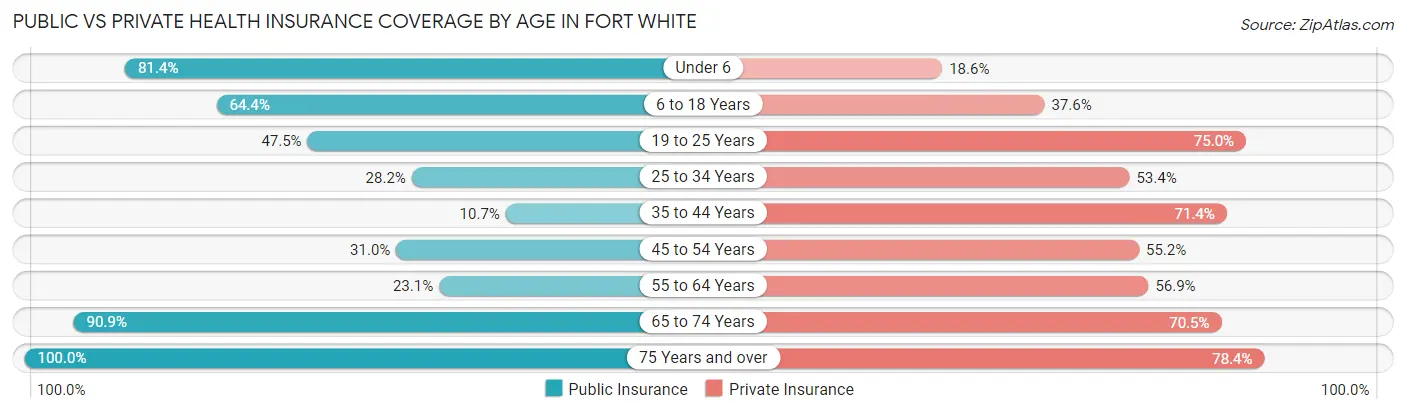
| Age Bracket | Public Insurance | Private Insurance |
| Under 6 | 48 (81.4%) | 11 (18.6%) |
| 6 to 18 Years | 65 (64.4%) | 38 (37.6%) |
| 19 to 25 Years | 19 (47.5%) | 30 (75.0%) |
| 25 to 34 Years | 29 (28.2%) | 55 (53.4%) |
| 35 to 44 Years | 9 (10.7%) | 60 (71.4%) |
| 45 to 54 Years | 9 (31.0%) | 16 (55.2%) |
| 55 to 64 Years | 15 (23.1%) | 37 (56.9%) |
| 65 to 74 Years | 40 (90.9%) | 31 (70.5%) |
| 75 Years and over | 51 (100.0%) | 40 (78.4%) |
| Total | 285 (49.5%) | 318 (55.2%) |
Disability Status by Sex by Age in Fort White
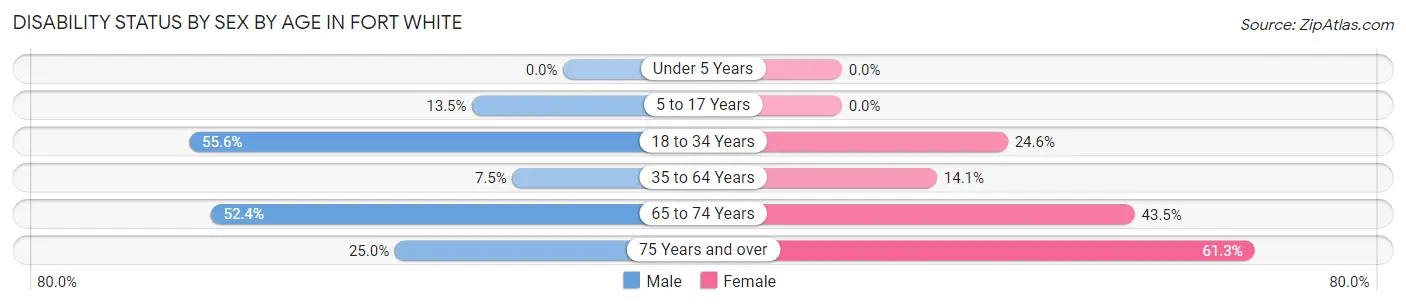
| Age Bracket | Male | Female |
| Under 5 Years | 0 (0.0%) | 0 (0.0%) |
| 5 to 17 Years | 5 (13.5%) | 0 (0.0%) |
| 18 to 34 Years | 45 (55.6%) | 17 (24.6%) |
| 35 to 64 Years | 7 (7.5%) | 12 (14.1%) |
| 65 to 74 Years | 11 (52.4%) | 10 (43.5%) |
| 75 Years and over | 5 (25.0%) | 19 (61.3%) |
Disability Class by Sex by Age in Fort White
Disability Class: Hearing Difficulty
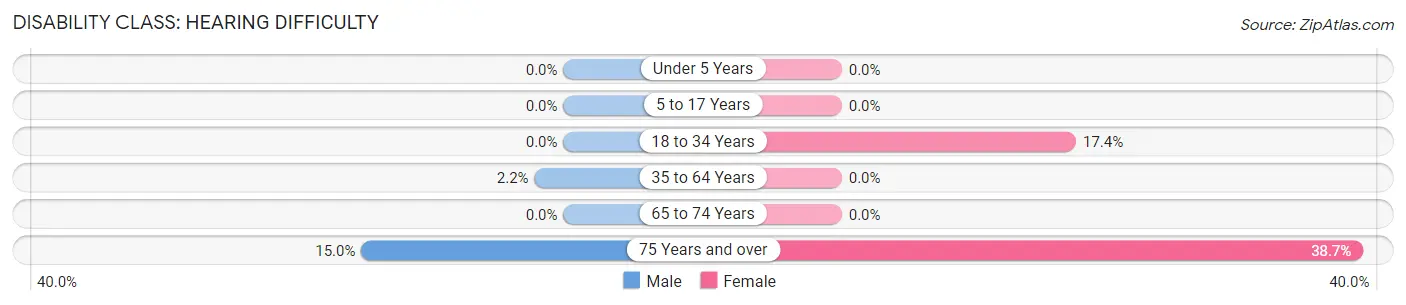
| Age Bracket | Male | Female |
| Under 5 Years | 0 (0.0%) | 0 (0.0%) |
| 5 to 17 Years | 0 (0.0%) | 0 (0.0%) |
| 18 to 34 Years | 0 (0.0%) | 12 (17.4%) |
| 35 to 64 Years | 2 (2.1%) | 0 (0.0%) |
| 65 to 74 Years | 0 (0.0%) | 0 (0.0%) |
| 75 Years and over | 3 (15.0%) | 12 (38.7%) |
Disability Class: Vision Difficulty
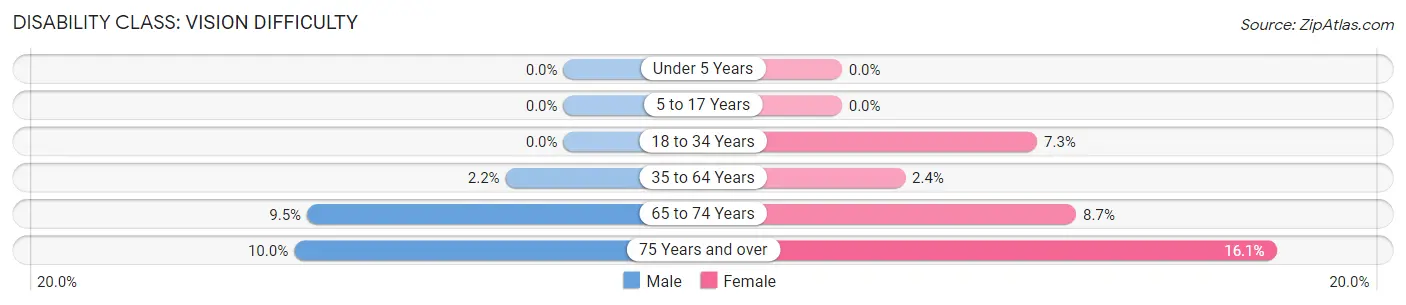
| Age Bracket | Male | Female |
| Under 5 Years | 0 (0.0%) | 0 (0.0%) |
| 5 to 17 Years | 0 (0.0%) | 0 (0.0%) |
| 18 to 34 Years | 0 (0.0%) | 5 (7.2%) |
| 35 to 64 Years | 2 (2.1%) | 2 (2.4%) |
| 65 to 74 Years | 2 (9.5%) | 2 (8.7%) |
| 75 Years and over | 2 (10.0%) | 5 (16.1%) |
Disability Class: Cognitive Difficulty
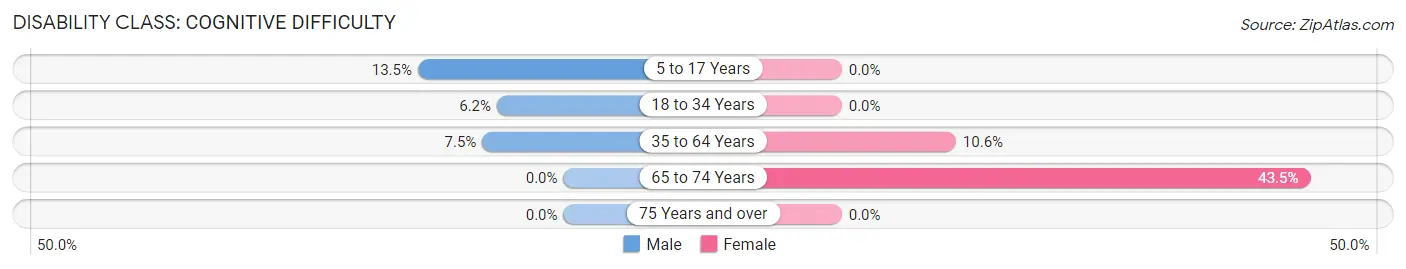
| Age Bracket | Male | Female |
| 5 to 17 Years | 5 (13.5%) | 0 (0.0%) |
| 18 to 34 Years | 5 (6.2%) | 0 (0.0%) |
| 35 to 64 Years | 7 (7.5%) | 9 (10.6%) |
| 65 to 74 Years | 0 (0.0%) | 10 (43.5%) |
| 75 Years and over | 0 (0.0%) | 0 (0.0%) |
Disability Class: Ambulatory Difficulty
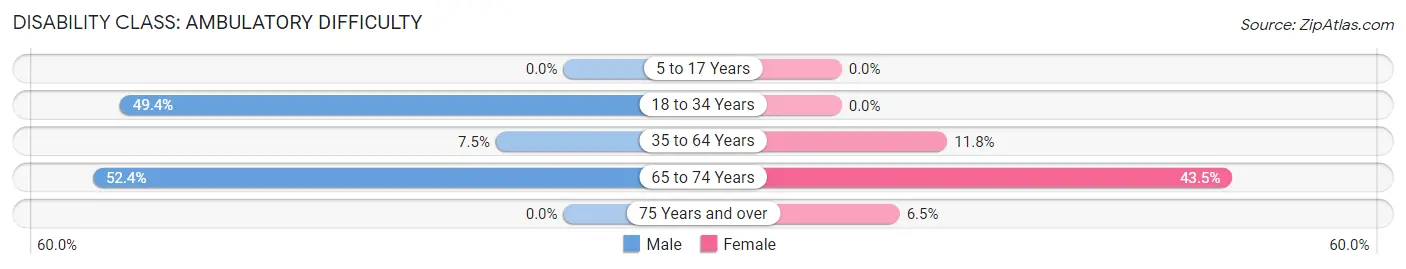
| Age Bracket | Male | Female |
| 5 to 17 Years | 0 (0.0%) | 0 (0.0%) |
| 18 to 34 Years | 40 (49.4%) | 0 (0.0%) |
| 35 to 64 Years | 7 (7.5%) | 10 (11.8%) |
| 65 to 74 Years | 11 (52.4%) | 10 (43.5%) |
| 75 Years and over | 0 (0.0%) | 2 (6.5%) |
Disability Class: Self-Care Difficulty
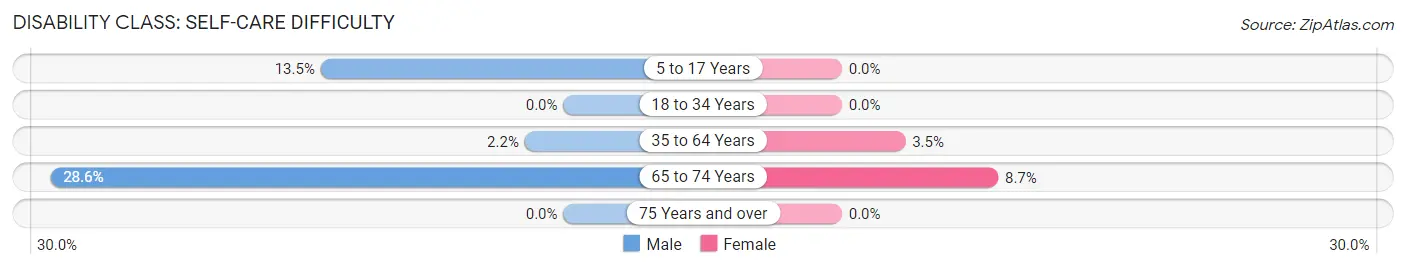
| Age Bracket | Male | Female |
| 5 to 17 Years | 5 (13.5%) | 0 (0.0%) |
| 18 to 34 Years | 0 (0.0%) | 0 (0.0%) |
| 35 to 64 Years | 2 (2.1%) | 3 (3.5%) |
| 65 to 74 Years | 6 (28.6%) | 2 (8.7%) |
| 75 Years and over | 0 (0.0%) | 0 (0.0%) |
Technology Access in Fort White
Computing Device Access in Fort White
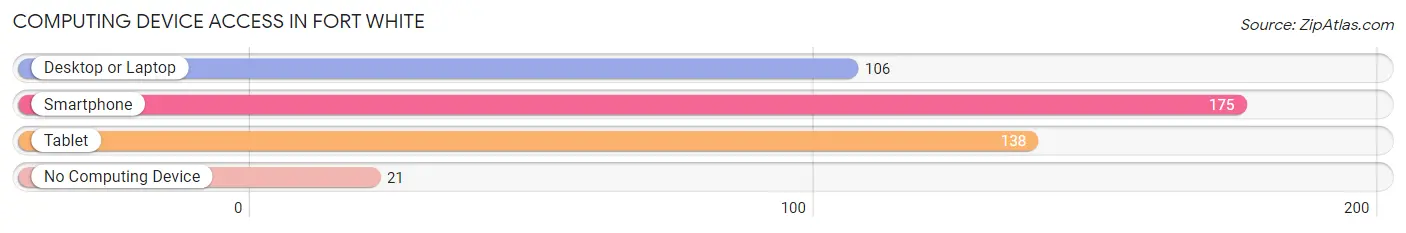
| Device Type | # Households | % Households |
| Desktop or Laptop | 106 | 49.8% |
| Smartphone | 175 | 82.2% |
| Tablet | 138 | 64.8% |
| No Computing Device | 21 | 9.9% |
| Total | 213 | 100.0% |
Internet Access in Fort White
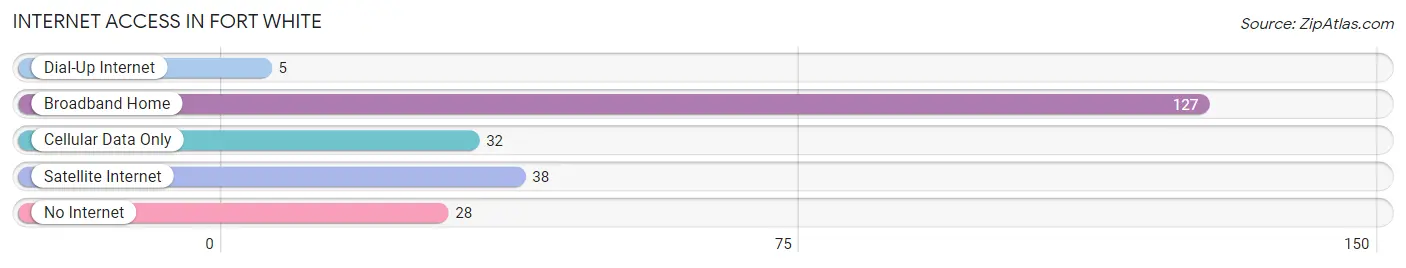
| Internet Type | # Households | % Households |
| Dial-Up Internet | 5 | 2.4% |
| Broadband Home | 127 | 59.6% |
| Cellular Data Only | 32 | 15.0% |
| Satellite Internet | 38 | 17.8% |
| No Internet | 28 | 13.2% |
| Total | 213 | 100.0% |
Fort White Summary
White Springs, Florida is a small town located in Columbia County, Florida. It is situated on the banks of the Suwannee River, approximately 20 miles south of Lake City and 60 miles west of Jacksonville. The town was founded in 1858 and is named after the white sand that lines the banks of the river. The population of White Springs was 1,247 at the 2010 census.
History
White Springs was founded in 1858 by a group of settlers from Georgia. The town was originally known as White Sulphur Springs, named after the white sand that lines the banks of the Suwannee River. The town was incorporated in 1884 and was the first town in Columbia County to be incorporated.
The town was a popular destination for tourists in the late 19th and early 20th centuries. The town was known for its mineral springs, which were believed to have healing properties. The town was also known for its many hotels and resorts, which attracted visitors from all over the country.
In the early 20th century, White Springs was a popular destination for African Americans. The town was home to a number of African American businesses, including a hotel, a barber shop, and a restaurant. The town was also home to a number of African American churches.
Geography
White Springs is located in Columbia County, Florida. It is situated on the banks of the Suwannee River, approximately 20 miles south of Lake City and 60 miles west of Jacksonville. The town is located in a rural area and is surrounded by forests and swamps. The town is located at an elevation of 33 feet above sea level.
Economy
White Springs is a small town with a limited economy. The town is home to a number of small businesses, including restaurants, stores, and a few tourist attractions. The town is also home to a number of small farms and ranches.
The town is home to a number of historic sites, including the Stephen Foster Folk Culture Center State Park, which is dedicated to the life and works of Stephen Foster, the composer of the song “Old Folks at Home”. The park is home to a number of historic buildings, including the Stephen Foster Memorial Museum and the Stephen Foster Carillon Tower.
Demographics
As of the 2010 census, the population of White Springs was 1,247. The racial makeup of the town was 79.3% White, 16.2% African American, 0.3% Native American, 0.2% Asian, 0.1% Pacific Islander, and 3.9% from other races. The median household income was $25,972 and the median family income was $31,250. The per capita income was $14,945.
Conclusion
White Springs, Florida is a small town located in Columbia County, Florida. It is situated on the banks of the Suwannee River, approximately 20 miles south of Lake City and 60 miles west of Jacksonville. The town was founded in 1858 and is named after the white sand that lines the banks of the river. The population of White Springs was 1,247 at the 2010 census. The town is home to a number of small businesses, including restaurants, stores, and a few tourist attractions. The town is also home to a number of historic sites, including the Stephen Foster Folk Culture Center State Park. The racial makeup of the town was 79.3% White, 16.2% African American, 0.3% Native American, 0.2% Asian, 0.1% Pacific Islander, and 3.9% from other races. The median household income was $25,972 and the median family income was $31,250. The per capita income was $14,945.
Common Questions
What is Per Capita Income in Fort White?
Per Capita income in Fort White is $22,114.
What is the Median Family Income in Fort White?
Median Family Income in Fort White is $49,815.
What is the Median Household income in Fort White?
Median Household Income in Fort White is $48,935.
What is Income or Wage Gap in Fort White?
Income or Wage Gap in Fort White is 10.5%.
Women in Fort White earn 89.5 cents for every dollar earned by a man.
What is Inequality or Gini Index in Fort White?
Inequality or Gini Index in Fort White is 0.39.
What is the Total Population of Fort White?
Total Population of Fort White is 576.
What is the Total Male Population of Fort White?
Total Male Population of Fort White is 273.
What is the Total Female Population of Fort White?
Total Female Population of Fort White is 303.
What is the Ratio of Males per 100 Females in Fort White?
There are 90.10 Males per 100 Females in Fort White.
What is the Ratio of Females per 100 Males in Fort White?
There are 110.99 Females per 100 Males in Fort White.
What is the Median Population Age in Fort White?
Median Population Age in Fort White is 34.5 Years.
What is the Average Family Size in Fort White
Average Family Size in Fort White is 3.1 People.
What is the Average Household Size in Fort White
Average Household Size in Fort White is 2.7 People.
How Large is the Labor Force in Fort White?
There are 292 People in the Labor Forcein in Fort White.
What is the Percentage of People in the Labor Force in Fort White?
67.1% of People are in the Labor Force in Fort White.
What is the Unemployment Rate in Fort White?
Unemployment Rate in Fort White is 4.8%.