Zephyrhills South, FL Map & Demographics
Zephyrhills South Map
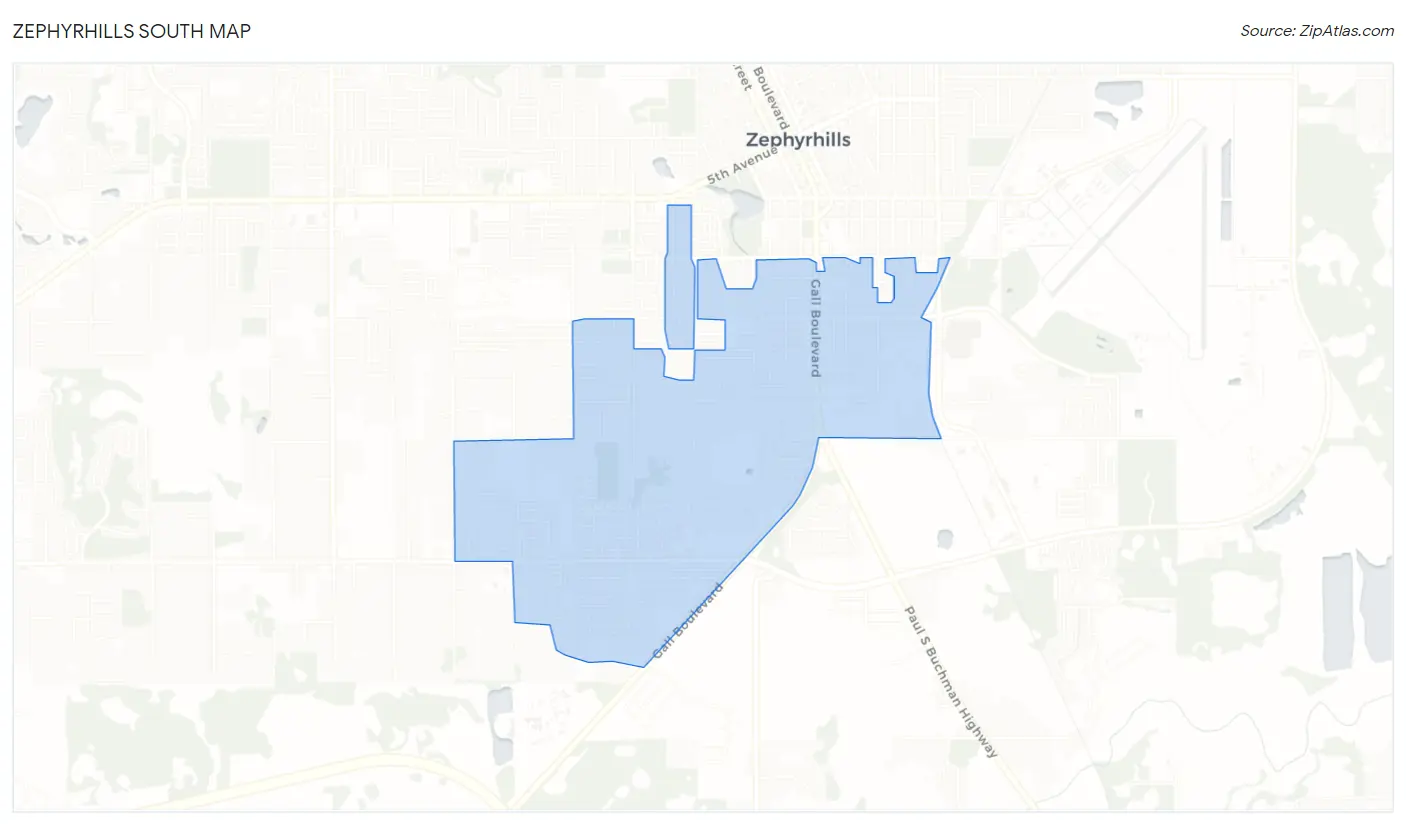
Zephyrhills South Overview
$23,824
PER CAPITA INCOME
$50,926
AVG FAMILY INCOME
$39,684
AVG HOUSEHOLD INCOME
25.0%
WAGE / INCOME GAP [ % ]
75.0¢/ $1
WAGE / INCOME GAP [ $ ]
0.40
INEQUALITY / GINI INDEX
5,470
TOTAL POPULATION
2,759
MALE POPULATION
2,711
FEMALE POPULATION
101.77
MALES / 100 FEMALES
98.26
FEMALES / 100 MALES
60.3
MEDIAN AGE
2.7
AVG FAMILY SIZE
2.1
AVG HOUSEHOLD SIZE
1,557
LABOR FORCE [ PEOPLE ]
32.6%
PERCENT IN LABOR FORCE
8.0%
UNEMPLOYMENT RATE
Income in Zephyrhills South
Income Overview in Zephyrhills South
Per Capita Income in Zephyrhills South is $23,824, while median incomes of families and households are $50,926 and $39,684 respectively.
| Characteristic | Number | Measure |
| Per Capita Income | 5,470 | $23,824 |
| Median Family Income | 1,420 | $50,926 |
| Mean Family Income | 1,420 | $57,928 |
| Median Household Income | 2,573 | $39,684 |
| Mean Household Income | 2,573 | $49,042 |
| Income Deficit | 1,420 | $0 |
| Wage / Income Gap (%) | 5,470 | 25.02% |
| Wage / Income Gap ($) | 5,470 | 74.98¢ per $1 |
| Gini / Inequality Index | 5,470 | 0.40 |
Earnings by Sex in Zephyrhills South
Average Earnings in Zephyrhills South are $31,011, $34,176 for men and $25,625 for women, a difference of 25.0%.
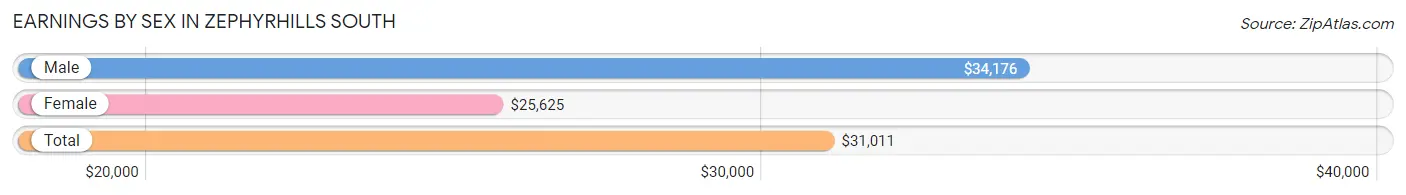
| Sex | Number | Average Earnings |
| Male | 943 (57.6%) | $34,176 |
| Female | 695 (42.4%) | $25,625 |
| Total | 1,638 (100.0%) | $31,011 |
Earnings by Sex by Income Bracket in Zephyrhills South
The most common earnings brackets in Zephyrhills South are $2,499 or less for men (101 | 10.7%) and $22,500 to $24,999 for women (90 | 13.0%).
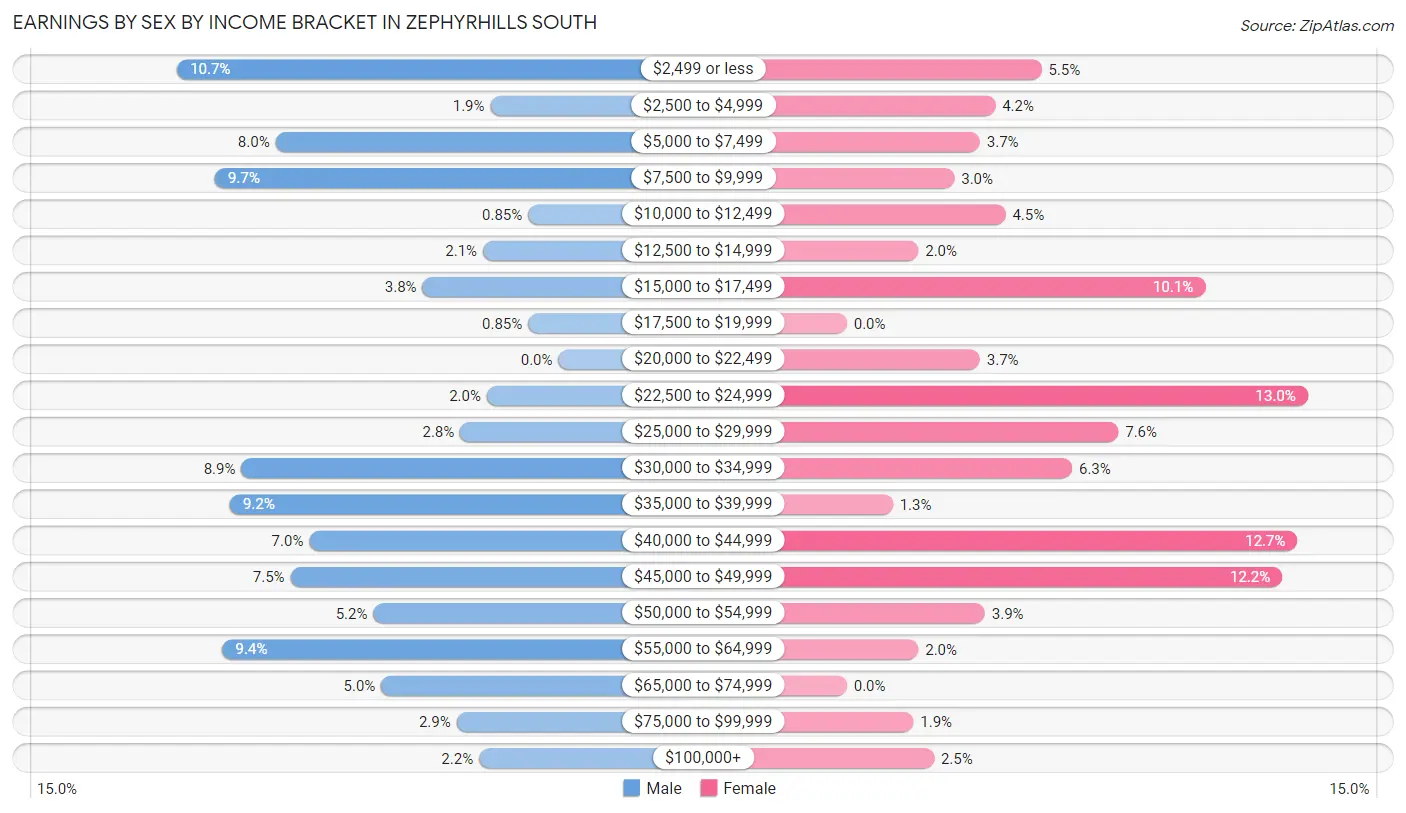
| Income | Male | Female |
| $2,499 or less | 101 (10.7%) | 38 (5.5%) |
| $2,500 to $4,999 | 18 (1.9%) | 29 (4.2%) |
| $5,000 to $7,499 | 75 (8.0%) | 26 (3.7%) |
| $7,500 to $9,999 | 91 (9.7%) | 21 (3.0%) |
| $10,000 to $12,499 | 8 (0.9%) | 31 (4.5%) |
| $12,500 to $14,999 | 20 (2.1%) | 14 (2.0%) |
| $15,000 to $17,499 | 36 (3.8%) | 70 (10.1%) |
| $17,500 to $19,999 | 8 (0.9%) | 0 (0.0%) |
| $20,000 to $22,499 | 0 (0.0%) | 26 (3.7%) |
| $22,500 to $24,999 | 19 (2.0%) | 90 (13.0%) |
| $25,000 to $29,999 | 26 (2.8%) | 53 (7.6%) |
| $30,000 to $34,999 | 84 (8.9%) | 44 (6.3%) |
| $35,000 to $39,999 | 87 (9.2%) | 9 (1.3%) |
| $40,000 to $44,999 | 66 (7.0%) | 88 (12.7%) |
| $45,000 to $49,999 | 71 (7.5%) | 85 (12.2%) |
| $50,000 to $54,999 | 49 (5.2%) | 27 (3.9%) |
| $55,000 to $64,999 | 89 (9.4%) | 14 (2.0%) |
| $65,000 to $74,999 | 47 (5.0%) | 0 (0.0%) |
| $75,000 to $99,999 | 27 (2.9%) | 13 (1.9%) |
| $100,000+ | 21 (2.2%) | 17 (2.5%) |
| Total | 943 (100.0%) | 695 (100.0%) |
Earnings by Sex by Educational Attainment in Zephyrhills South
Average earnings in Zephyrhills South are $37,188 for men and $28,517 for women, a difference of 23.3%. Men with an educational attainment of college or associate's degree enjoy the highest average annual earnings of $41,688, while those with bachelor's degree education earn the least with $11,563. Women with an educational attainment of college or associate's degree earn the most with the average annual earnings of $33,581, while those with less than high school education have the smallest earnings of $15,000.
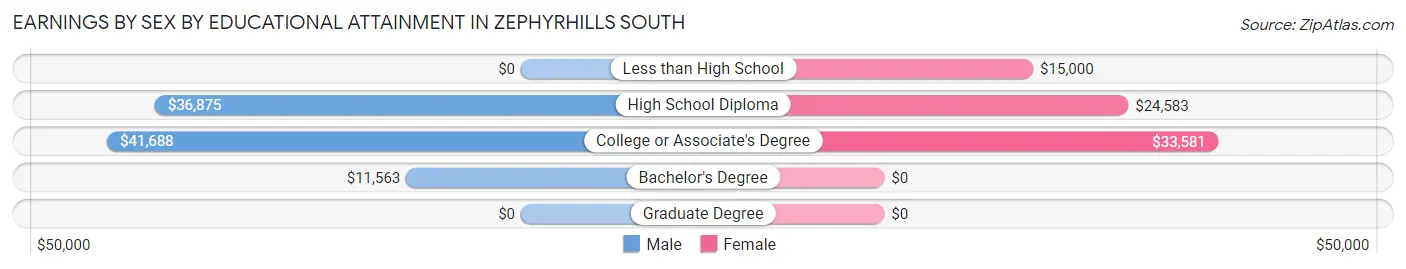
| Educational Attainment | Male Income | Female Income |
| Less than High School | - | - |
| High School Diploma | $36,875 | $24,583 |
| College or Associate's Degree | $41,688 | $33,581 |
| Bachelor's Degree | $11,563 | $0 |
| Graduate Degree | - | - |
| Total | $37,188 | $28,517 |
Family Income in Zephyrhills South
Family Income Brackets in Zephyrhills South
According to the Zephyrhills South family income data, there are 290 families falling into the $50,000 to $74,999 income range, which is the most common income bracket and makes up 20.4% of all families. Conversely, the $200,000+ income bracket is the least frequent group with only 17 families (1.2%) belonging to this category.
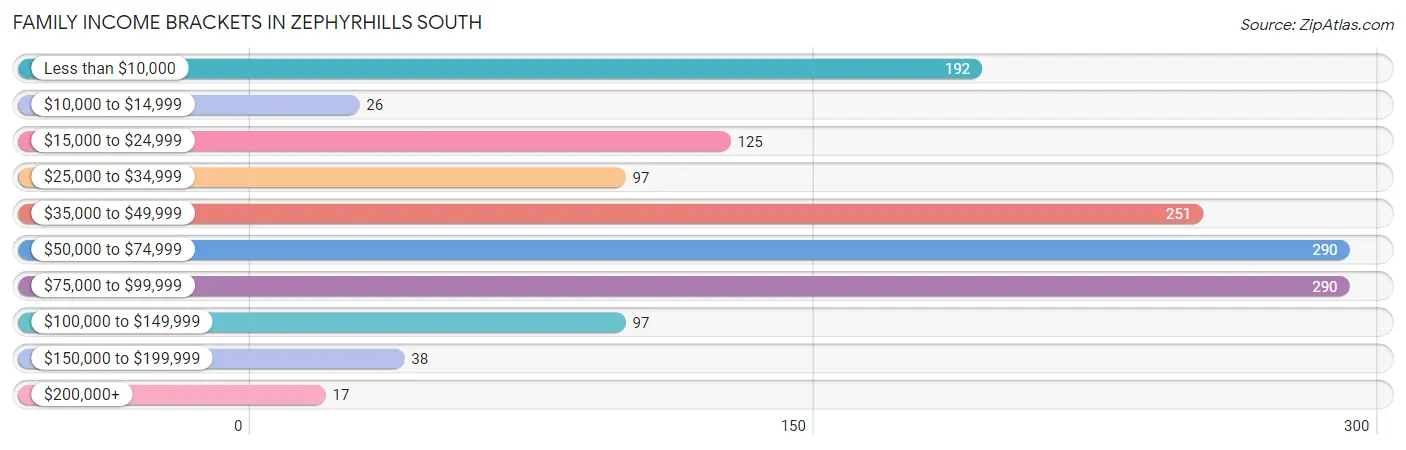
| Income Bracket | # Families | % Families |
| Less than $10,000 | 192 | 13.5% |
| $10,000 to $14,999 | 26 | 1.8% |
| $15,000 to $24,999 | 125 | 8.8% |
| $25,000 to $34,999 | 97 | 6.8% |
| $35,000 to $49,999 | 251 | 17.7% |
| $50,000 to $74,999 | 290 | 20.4% |
| $75,000 to $99,999 | 290 | 20.4% |
| $100,000 to $149,999 | 97 | 6.8% |
| $150,000 to $199,999 | 38 | 2.7% |
| $200,000+ | 17 | 1.2% |
Family Income by Famaliy Size in Zephyrhills South
5-person families (56 | 3.9%) account for the highest median family income in Zephyrhills South with $84,881 per family, while 2-person families (949 | 66.8%) have the highest median income of $23,429 per family member.
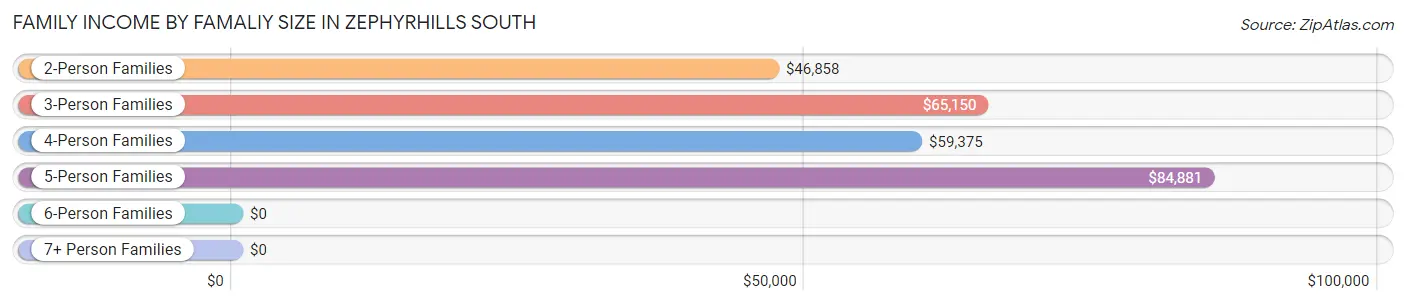
| Income Bracket | # Families | Median Income |
| 2-Person Families | 949 (66.8%) | $46,858 |
| 3-Person Families | 215 (15.1%) | $65,150 |
| 4-Person Families | 179 (12.6%) | $59,375 |
| 5-Person Families | 56 (3.9%) | $84,881 |
| 6-Person Families | 0 (0.0%) | $0 |
| 7+ Person Families | 21 (1.5%) | $0 |
| Total | 1,420 (100.0%) | $50,926 |
Family Income by Number of Earners in Zephyrhills South
The median family income in Zephyrhills South is $50,926, with families comprising 3+ earners (64) having the highest median family income of $77,162, while families with no earners (686) have the lowest median family income of $44,545, accounting for 4.5% and 48.3% of families, respectively.
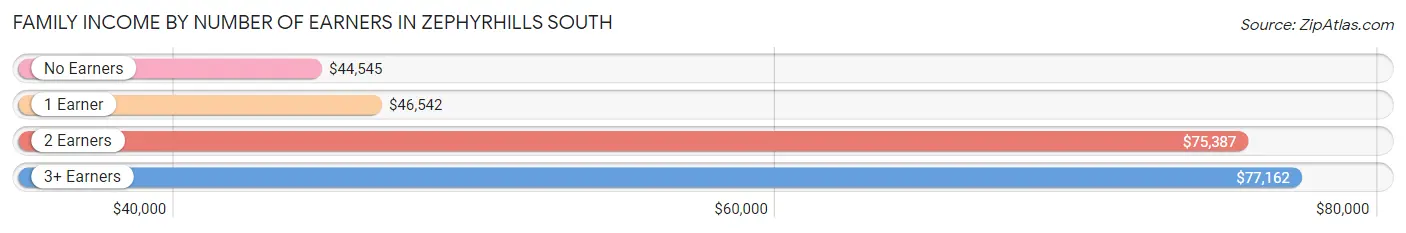
| Number of Earners | # Families | Median Income |
| No Earners | 686 (48.3%) | $44,545 |
| 1 Earner | 485 (34.2%) | $46,542 |
| 2 Earners | 185 (13.0%) | $75,387 |
| 3+ Earners | 64 (4.5%) | $77,162 |
| Total | 1,420 (100.0%) | $50,926 |
Household Income in Zephyrhills South
Household Income Brackets in Zephyrhills South
With 538 households falling in the category, the $15,000 to $24,999 income range is the most frequent in Zephyrhills South, accounting for 20.9% of all households. In contrast, only 18 households (0.7%) fall into the $200,000+ income bracket, making it the least populous group.
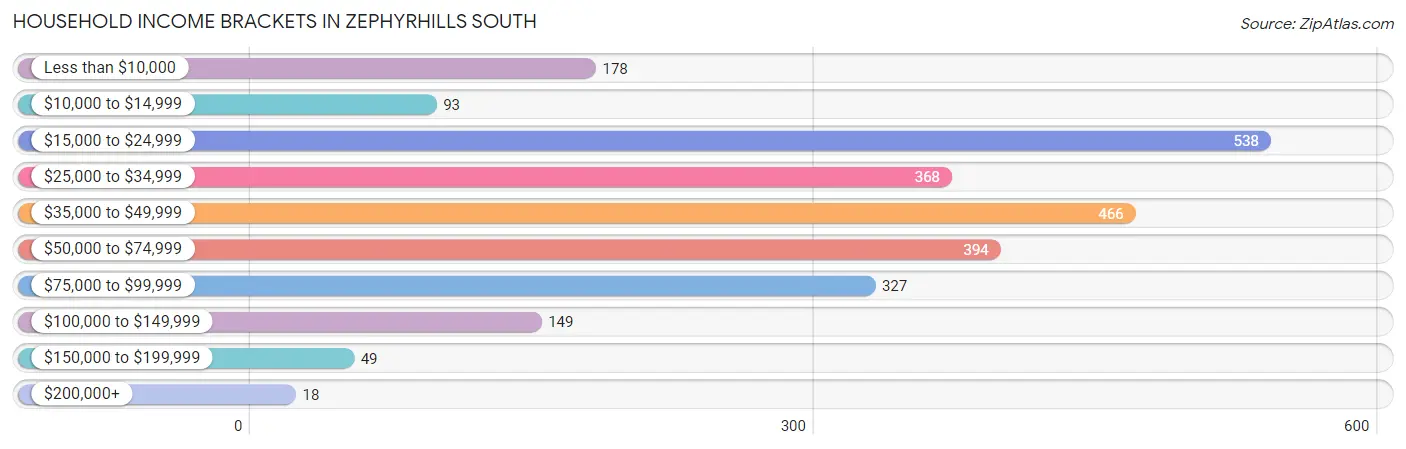
| Income Bracket | # Households | % Households |
| Less than $10,000 | 178 | 6.9% |
| $10,000 to $14,999 | 93 | 3.6% |
| $15,000 to $24,999 | 538 | 20.9% |
| $25,000 to $34,999 | 368 | 14.3% |
| $35,000 to $49,999 | 466 | 18.1% |
| $50,000 to $74,999 | 394 | 15.3% |
| $75,000 to $99,999 | 327 | 12.7% |
| $100,000 to $149,999 | 149 | 5.8% |
| $150,000 to $199,999 | 49 | 1.9% |
| $200,000+ | 18 | 0.7% |
Household Income by Householder Age in Zephyrhills South
The median household income in Zephyrhills South is $39,684, with the highest median household income of $49,762 found in the 25 to 44 years age bracket for the primary householder. A total of 372 households (14.5%) fall into this category. Meanwhile, the 15 to 24 years age bracket for the primary householder has the lowest median household income of $0, with 91 households (3.5%) in this group.
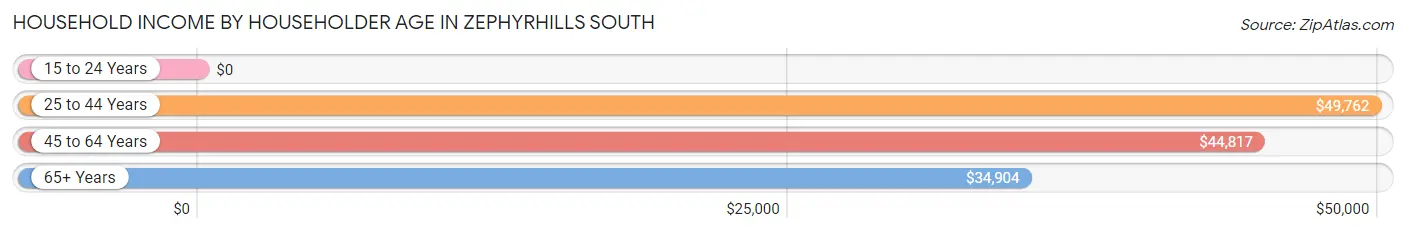
| Income Bracket | # Households | Median Income |
| 15 to 24 Years | 91 (3.5%) | $0 |
| 25 to 44 Years | 372 (14.5%) | $49,762 |
| 45 to 64 Years | 648 (25.2%) | $44,817 |
| 65+ Years | 1,462 (56.8%) | $34,904 |
| Total | 2,573 (100.0%) | $39,684 |
Poverty in Zephyrhills South
Income Below Poverty by Sex and Age in Zephyrhills South
With 16.8% poverty level for males and 21.5% for females among the residents of Zephyrhills South, 12 to 14 year old males and 12 to 14 year old females are the most vulnerable to poverty, with 13 males (44.8%) and 36 females (100.0%) in their respective age groups living below the poverty level.
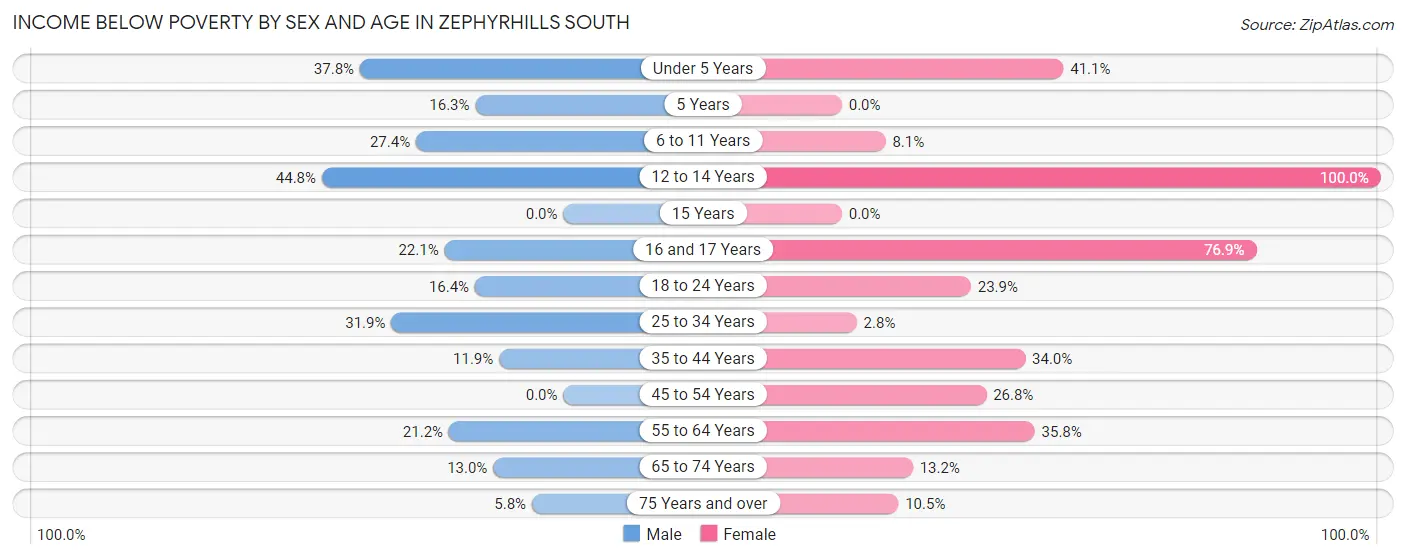
| Age Bracket | Male | Female |
| Under 5 Years | 74 (37.8%) | 37 (41.1%) |
| 5 Years | 8 (16.3%) | 0 (0.0%) |
| 6 to 11 Years | 32 (27.4%) | 6 (8.1%) |
| 12 to 14 Years | 13 (44.8%) | 36 (100.0%) |
| 15 Years | 0 (0.0%) | 0 (0.0%) |
| 16 and 17 Years | 15 (22.1%) | 60 (76.9%) |
| 18 to 24 Years | 32 (16.4%) | 34 (23.9%) |
| 25 to 34 Years | 99 (31.9%) | 7 (2.8%) |
| 35 to 44 Years | 18 (11.9%) | 65 (34.0%) |
| 45 to 54 Years | 0 (0.0%) | 41 (26.8%) |
| 55 to 64 Years | 65 (21.2%) | 141 (35.8%) |
| 65 to 74 Years | 63 (13.0%) | 77 (13.2%) |
| 75 Years and over | 37 (5.8%) | 70 (10.5%) |
| Total | 456 (16.8%) | 574 (21.5%) |
Income Above Poverty by Sex and Age in Zephyrhills South
According to the poverty statistics in Zephyrhills South, males aged 15 years and females aged 25 to 34 years are the age groups that are most secure financially, with 100.0% of males and 97.2% of females in these age groups living above the poverty line.
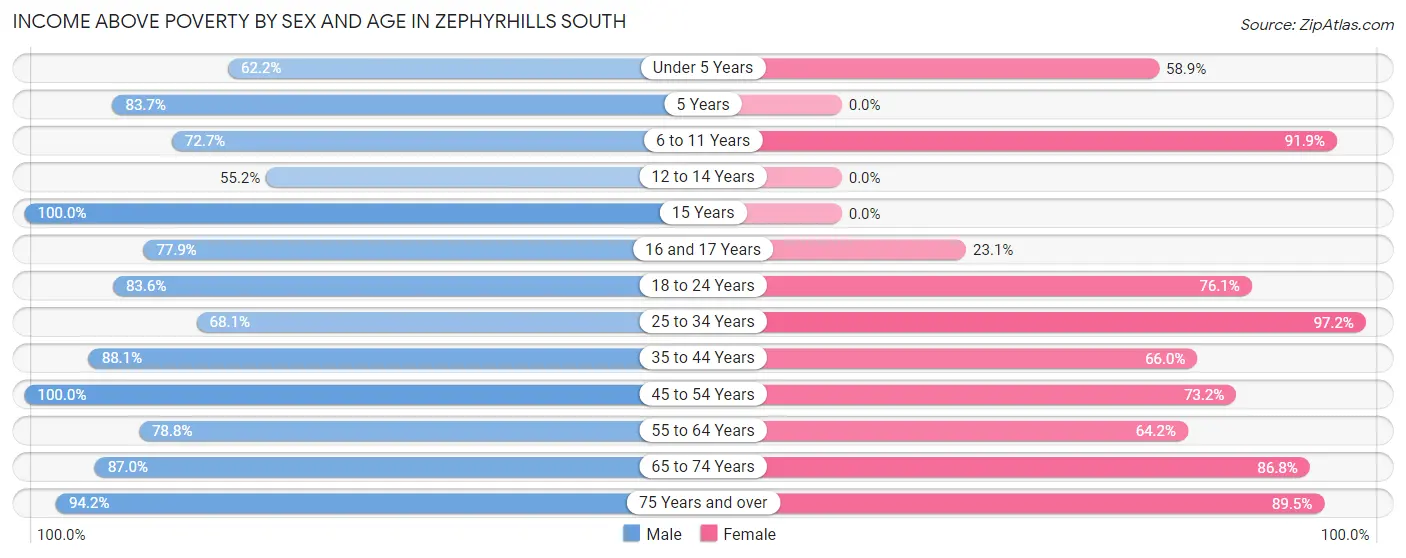
| Age Bracket | Male | Female |
| Under 5 Years | 122 (62.2%) | 53 (58.9%) |
| 5 Years | 41 (83.7%) | 0 (0.0%) |
| 6 to 11 Years | 85 (72.7%) | 68 (91.9%) |
| 12 to 14 Years | 16 (55.2%) | 0 (0.0%) |
| 15 Years | 11 (100.0%) | 0 (0.0%) |
| 16 and 17 Years | 53 (77.9%) | 18 (23.1%) |
| 18 to 24 Years | 163 (83.6%) | 108 (76.1%) |
| 25 to 34 Years | 211 (68.1%) | 247 (97.2%) |
| 35 to 44 Years | 133 (88.1%) | 126 (66.0%) |
| 45 to 54 Years | 162 (100.0%) | 112 (73.2%) |
| 55 to 64 Years | 241 (78.8%) | 253 (64.2%) |
| 65 to 74 Years | 421 (87.0%) | 508 (86.8%) |
| 75 Years and over | 597 (94.2%) | 598 (89.5%) |
| Total | 2,256 (83.2%) | 2,091 (78.5%) |
Income Below Poverty Among Married-Couple Families in Zephyrhills South
The poverty statistics for married-couple families in Zephyrhills South show that 11.3% or 115 of the total 1,017 families live below the poverty line. Families with no children have the highest poverty rate of 13.3%, comprising of 115 families. On the other hand, families with 1 or 2 children have the lowest poverty rate of 0.0%, which includes 0 families.
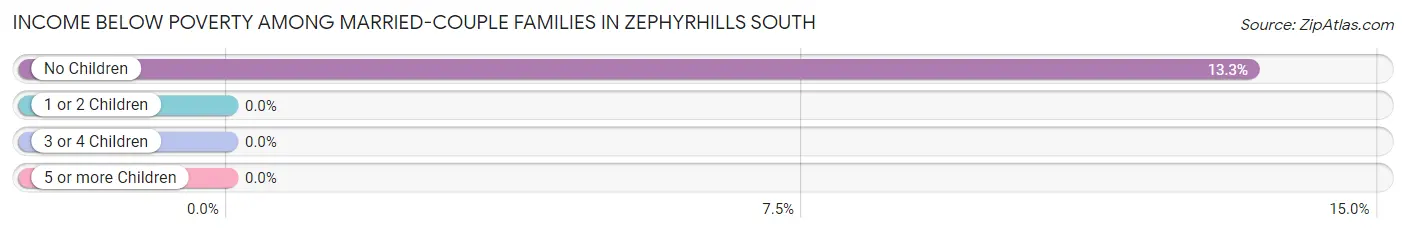
| Children | Above Poverty | Below Poverty |
| No Children | 747 (86.7%) | 115 (13.3%) |
| 1 or 2 Children | 134 (100.0%) | 0 (0.0%) |
| 3 or 4 Children | 21 (100.0%) | 0 (0.0%) |
| 5 or more Children | 0 (0.0%) | 0 (0.0%) |
| Total | 902 (88.7%) | 115 (11.3%) |
Income Below Poverty Among Single-Parent Households in Zephyrhills South
According to the poverty data in Zephyrhills South, 48.6% or 101 single-father households and 48.7% or 95 single-mother households are living below the poverty line. Among single-father households, those with 1 or 2 children have the highest poverty rate, with 101 households (55.5%) experiencing poverty. Likewise, among single-mother households, those with 3 or 4 children have the highest poverty rate, with 38 households (100.0%) falling below the poverty line.
| Children | Single Father | Single Mother |
| No Children | 0 (0.0%) | 11 (10.9%) |
| 1 or 2 Children | 101 (55.5%) | 46 (82.1%) |
| 3 or 4 Children | 0 (0.0%) | 38 (100.0%) |
| 5 or more Children | 0 (0.0%) | 0 (0.0%) |
| Total | 101 (48.6%) | 95 (48.7%) |
Income Below Poverty Among Married-Couple vs Single-Parent Households in Zephyrhills South
The poverty data for Zephyrhills South shows that 115 of the married-couple family households (11.3%) and 196 of the single-parent households (48.6%) are living below the poverty level. Within the married-couple family households, those with no children have the highest poverty rate, with 115 households (13.3%) falling below the poverty line. Among the single-parent households, those with 3 or 4 children have the highest poverty rate, with 38 household (100.0%) living below poverty.
| Children | Married-Couple Families | Single-Parent Households |
| No Children | 115 (13.3%) | 11 (8.7%) |
| 1 or 2 Children | 0 (0.0%) | 147 (61.8%) |
| 3 or 4 Children | 0 (0.0%) | 38 (100.0%) |
| 5 or more Children | 0 (0.0%) | 0 (0.0%) |
| Total | 115 (11.3%) | 196 (48.6%) |
Race in Zephyrhills South
The most populous races in Zephyrhills South are White / Caucasian (5,156 | 94.3%), Hispanic or Latino (661 | 12.1%), and Two or more Races (178 | 3.3%).
| Race | # Population | % Population |
| Asian | 0 | 0.0% |
| Black / African American | 69 | 1.3% |
| Hawaiian / Pacific | 0 | 0.0% |
| Hispanic or Latino | 661 | 12.1% |
| Native / Alaskan | 6 | 0.1% |
| White / Caucasian | 5,156 | 94.3% |
| Two or more Races | 178 | 3.3% |
| Some other Race | 61 | 1.1% |
| Total | 5,470 | 100.0% |
Ancestry in Zephyrhills South
The most populous ancestries reported in Zephyrhills South are English (1,017 | 18.6%), Irish (724 | 13.2%), German (715 | 13.1%), American (467 | 8.5%), and Puerto Rican (424 | 7.7%), together accounting for 61.2% of all Zephyrhills South residents.
| Ancestry | # Population | % Population |
| American | 467 | 8.5% |
| Austrian | 6 | 0.1% |
| Brazilian | 10 | 0.2% |
| British | 56 | 1.0% |
| Canadian | 94 | 1.7% |
| Central American | 59 | 1.1% |
| Cherokee | 28 | 0.5% |
| Costa Rican | 35 | 0.6% |
| Cuban | 6 | 0.1% |
| Czechoslovakian | 11 | 0.2% |
| Danish | 6 | 0.1% |
| Dutch | 238 | 4.3% |
| Eastern European | 25 | 0.5% |
| English | 1,017 | 18.6% |
| European | 34 | 0.6% |
| Finnish | 18 | 0.3% |
| French | 129 | 2.4% |
| French Canadian | 49 | 0.9% |
| German | 715 | 13.1% |
| Guatemalan | 24 | 0.4% |
| Irish | 724 | 13.2% |
| Italian | 92 | 1.7% |
| Mexican | 136 | 2.5% |
| Norwegian | 18 | 0.3% |
| Polish | 49 | 0.9% |
| Portuguese | 48 | 0.9% |
| Puerto Rican | 424 | 7.7% |
| Scandinavian | 26 | 0.5% |
| Scotch-Irish | 116 | 2.1% |
| Scottish | 157 | 2.9% |
| Serbian | 10 | 0.2% |
| South American | 7 | 0.1% |
| Swedish | 58 | 1.1% |
| Venezuelan | 7 | 0.1% |
| Welsh | 86 | 1.6% | View All 35 Rows |
Immigrants in Zephyrhills South
The most numerous immigrant groups reported in Zephyrhills South came from Canada (251 | 4.6%), Europe (49 | 0.9%), Northern Europe (49 | 0.9%), Latin America (41 | 0.7%), and Central America (24 | 0.4%), together accounting for 7.6% of all Zephyrhills South residents.
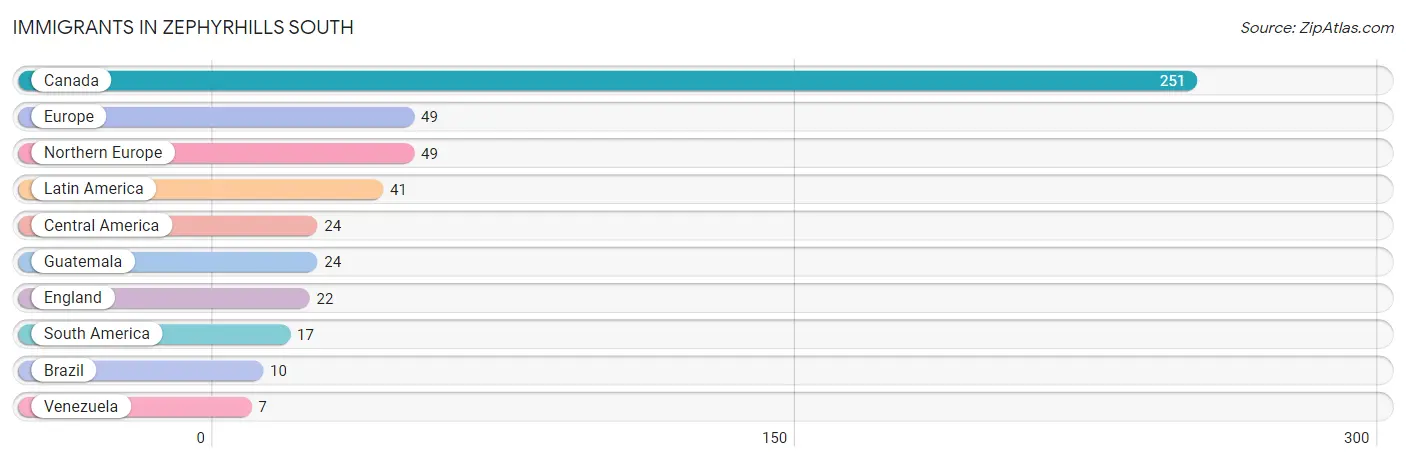
| Immigration Origin | # Population | % Population |
| Brazil | 10 | 0.2% |
| Canada | 251 | 4.6% |
| Central America | 24 | 0.4% |
| England | 22 | 0.4% |
| Europe | 49 | 0.9% |
| Guatemala | 24 | 0.4% |
| Latin America | 41 | 0.7% |
| Northern Europe | 49 | 0.9% |
| South America | 17 | 0.3% |
| Venezuela | 7 | 0.1% | View All 10 Rows |
Sex and Age in Zephyrhills South
Sex and Age in Zephyrhills South
The most populous age groups in Zephyrhills South are 80 to 84 Years (299 | 10.8%) for men and 75 to 79 Years (401 | 14.8%) for women.
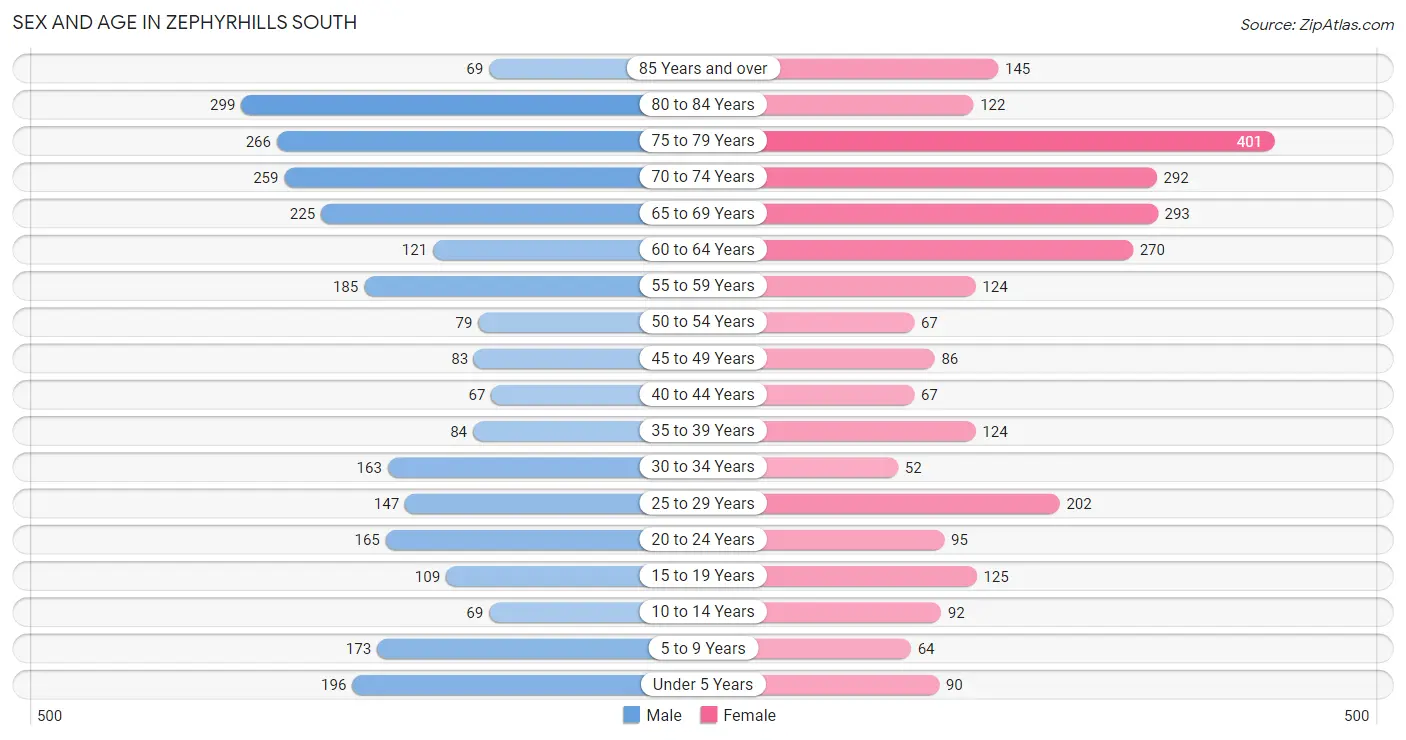
| Age Bracket | Male | Female |
| Under 5 Years | 196 (7.1%) | 90 (3.3%) |
| 5 to 9 Years | 173 (6.3%) | 64 (2.4%) |
| 10 to 14 Years | 69 (2.5%) | 92 (3.4%) |
| 15 to 19 Years | 109 (4.0%) | 125 (4.6%) |
| 20 to 24 Years | 165 (6.0%) | 95 (3.5%) |
| 25 to 29 Years | 147 (5.3%) | 202 (7.4%) |
| 30 to 34 Years | 163 (5.9%) | 52 (1.9%) |
| 35 to 39 Years | 84 (3.0%) | 124 (4.6%) |
| 40 to 44 Years | 67 (2.4%) | 67 (2.5%) |
| 45 to 49 Years | 83 (3.0%) | 86 (3.2%) |
| 50 to 54 Years | 79 (2.9%) | 67 (2.5%) |
| 55 to 59 Years | 185 (6.7%) | 124 (4.6%) |
| 60 to 64 Years | 121 (4.4%) | 270 (10.0%) |
| 65 to 69 Years | 225 (8.2%) | 293 (10.8%) |
| 70 to 74 Years | 259 (9.4%) | 292 (10.8%) |
| 75 to 79 Years | 266 (9.6%) | 401 (14.8%) |
| 80 to 84 Years | 299 (10.8%) | 122 (4.5%) |
| 85 Years and over | 69 (2.5%) | 145 (5.3%) |
| Total | 2,759 (100.0%) | 2,711 (100.0%) |
Families and Households in Zephyrhills South
Median Family Size in Zephyrhills South
The median family size in Zephyrhills South is 2.72 persons per family, with single female/mother families (195 | 13.7%) accounting for the largest median family size of 3.45 persons per family. On the other hand, married-couple families (1,017 | 71.6%) represent the smallest median family size with 2.59 persons per family.
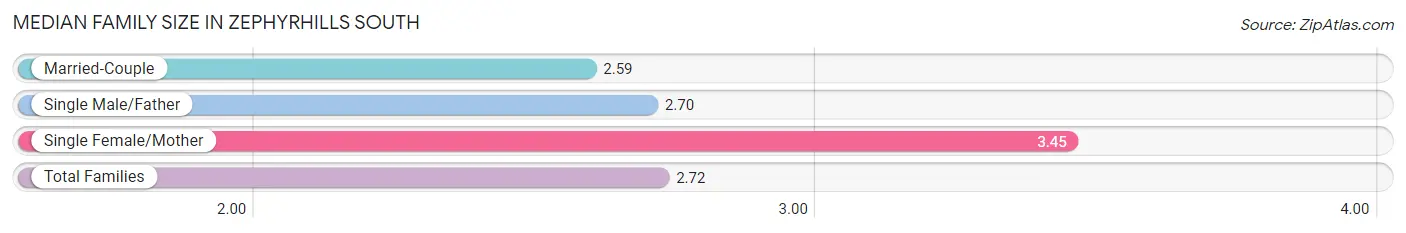
| Family Type | # Families | Family Size |
| Married-Couple | 1,017 (71.6%) | 2.59 |
| Single Male/Father | 208 (14.6%) | 2.70 |
| Single Female/Mother | 195 (13.7%) | 3.45 |
| Total Families | 1,420 (100.0%) | 2.72 |
Median Household Size in Zephyrhills South
The median household size in Zephyrhills South is 2.13 persons per household, with single female/mother households (195 | 7.6%) accounting for the largest median household size of 3.71 persons per household. non-family households (1,153 | 44.8%) represent the smallest median household size with 1.17 persons per household.
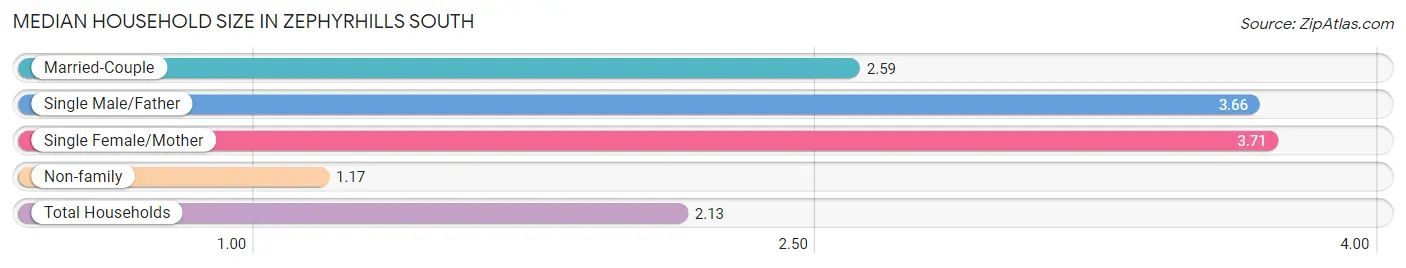
| Household Type | # Households | Household Size |
| Married-Couple | 1,017 (39.5%) | 2.59 |
| Single Male/Father | 208 (8.1%) | 3.66 |
| Single Female/Mother | 195 (7.6%) | 3.71 |
| Non-family | 1,153 (44.8%) | 1.17 |
| Total Households | 2,573 (100.0%) | 2.13 |
Household Size by Marriage Status in Zephyrhills South
Out of a total of 2,573 households in Zephyrhills South, 1,420 (55.2%) are family households, while 1,153 (44.8%) are nonfamily households. The most numerous type of family households are 2-person households, comprising 838, and the most common type of nonfamily households are 1-person households, comprising 1,001.
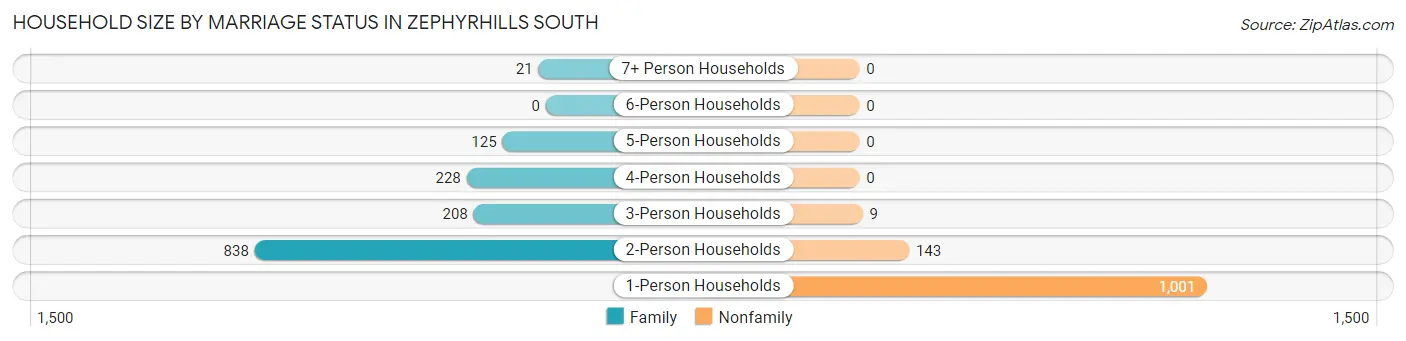
| Household Size | Family Households | Nonfamily Households |
| 1-Person Households | - | 1,001 (38.9%) |
| 2-Person Households | 838 (32.6%) | 143 (5.6%) |
| 3-Person Households | 208 (8.1%) | 9 (0.4%) |
| 4-Person Households | 228 (8.9%) | 0 (0.0%) |
| 5-Person Households | 125 (4.9%) | 0 (0.0%) |
| 6-Person Households | 0 (0.0%) | 0 (0.0%) |
| 7+ Person Households | 21 (0.8%) | 0 (0.0%) |
| Total | 1,420 (55.2%) | 1,153 (44.8%) |
Female Fertility in Zephyrhills South
Fertility by Age in Zephyrhills South
Average fertility rate in Zephyrhills South is 120.0 births per 1,000 women. Women in the age bracket of 20 to 34 years have the highest fertility rate with 172.0 births per 1,000 women. Women in the age bracket of 20 to 34 years acount for 65.9% of all women with births.
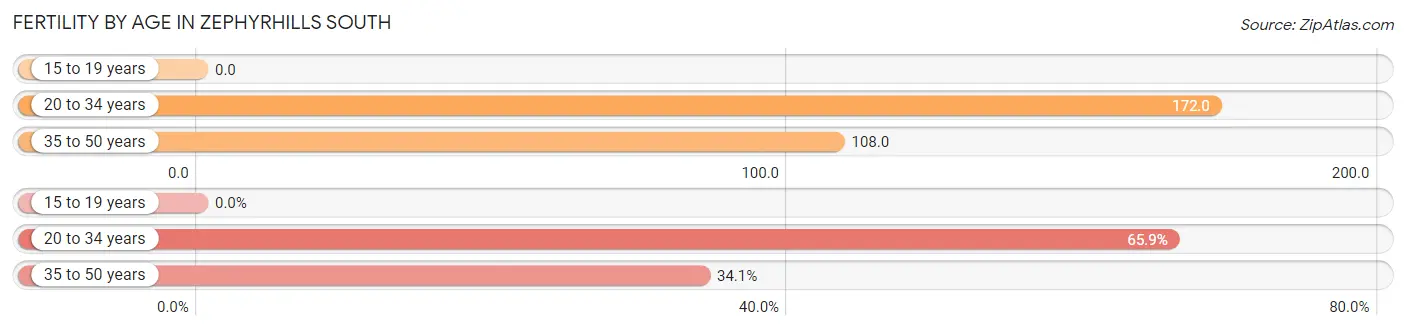
| Age Bracket | Women with Births | Births / 1,000 Women |
| 15 to 19 years | 0 (0.0%) | 0.0 |
| 20 to 34 years | 60 (65.9%) | 172.0 |
| 35 to 50 years | 31 (34.1%) | 108.0 |
| Total | 91 (100.0%) | 120.0 |
Fertility by Age by Marriage Status in Zephyrhills South
46.2% of women with births (91) in Zephyrhills South are married. The highest percentage of unmarried women with births falls into 20 to 34 years age bracket with 81.7% of them unmarried at the time of birth, while the lowest percentage of unmarried women with births belong to 35 to 50 years age bracket with 0.0% of them unmarried.
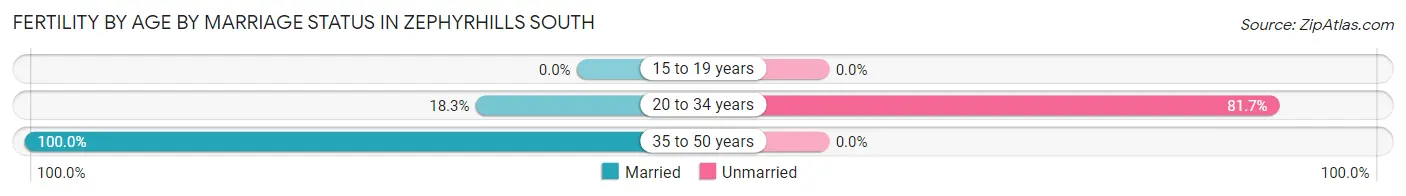
| Age Bracket | Married | Unmarried |
| 15 to 19 years | 0 (0.0%) | 0 (0.0%) |
| 20 to 34 years | 11 (18.3%) | 49 (81.7%) |
| 35 to 50 years | 31 (100.0%) | 0 (0.0%) |
| Total | 42 (46.2%) | 49 (53.8%) |
Fertility by Education in Zephyrhills South
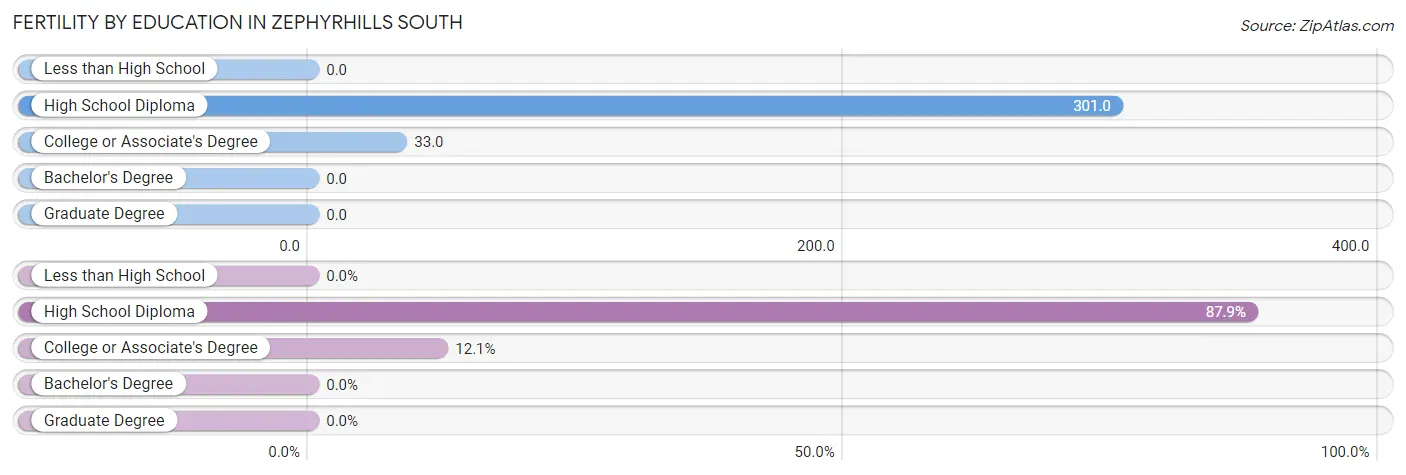
| Educational Attainment | Women with Births | Births / 1,000 Women |
| Less than High School | 0 (0.0%) | 0.0 |
| High School Diploma | 80 (87.9%) | 301.0 |
| College or Associate's Degree | 11 (12.1%) | 33.0 |
| Bachelor's Degree | 0 (0.0%) | 0.0 |
| Graduate Degree | 0 (0.0%) | 0.0 |
| Total | 91 (100.0%) | 120.0 |
Fertility by Education by Marriage Status in Zephyrhills South
53.8% of women with births in Zephyrhills South are unmarried. Women with the educational attainment of college or associate's degree are most likely to be married with 100.0% of them married at childbirth, while women with the educational attainment of high school diploma are least likely to be married with 61.3% of them unmarried at childbirth.
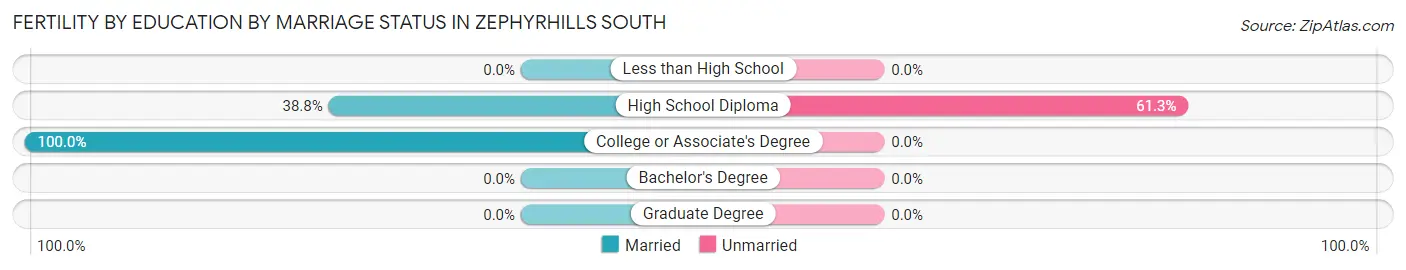
| Educational Attainment | Married | Unmarried |
| Less than High School | 0 (0.0%) | 0 (0.0%) |
| High School Diploma | 31 (38.8%) | 49 (61.3%) |
| College or Associate's Degree | 11 (100.0%) | 0 (0.0%) |
| Bachelor's Degree | 0 (0.0%) | 0 (0.0%) |
| Graduate Degree | 0 (0.0%) | 0 (0.0%) |
| Total | 42 (46.2%) | 49 (53.8%) |
Employment Characteristics in Zephyrhills South
Employment by Class of Employer in Zephyrhills South
Among the 1,407 employed individuals in Zephyrhills South, private company employees (1,176 | 83.6%), not-for-profit organizations (105 | 7.5%), and self-employed (not incorporated) (66 | 4.7%) make up the most common classes of employment.
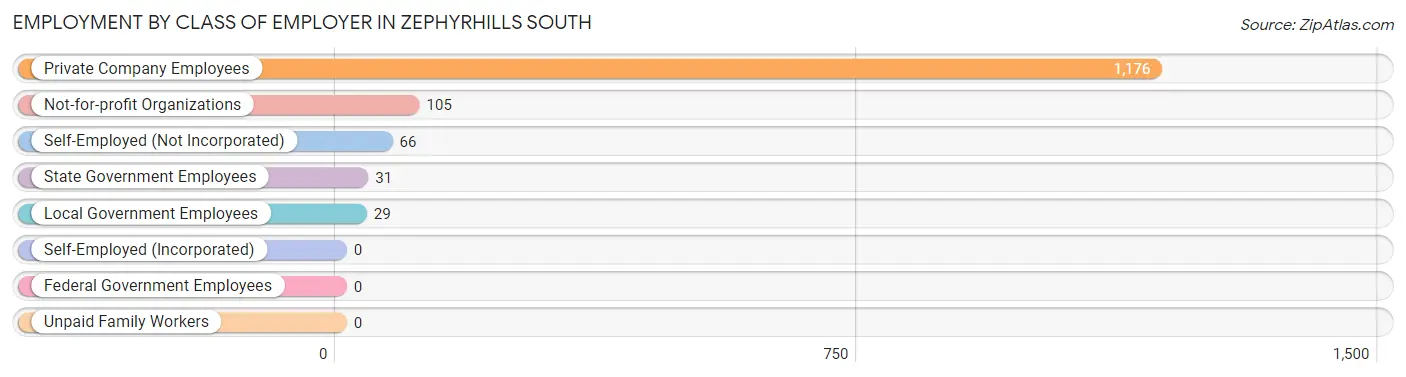
| Employer Class | # Employees | % Employees |
| Private Company Employees | 1,176 | 83.6% |
| Self-Employed (Incorporated) | 0 | 0.0% |
| Self-Employed (Not Incorporated) | 66 | 4.7% |
| Not-for-profit Organizations | 105 | 7.5% |
| Local Government Employees | 29 | 2.1% |
| State Government Employees | 31 | 2.2% |
| Federal Government Employees | 0 | 0.0% |
| Unpaid Family Workers | 0 | 0.0% |
| Total | 1,407 | 100.0% |
Employment Status by Age in Zephyrhills South
According to the labor force statistics for Zephyrhills South, out of the total population over 16 years of age (4,775), 32.6% or 1,557 individuals are in the labor force, with 8.0% or 125 of them unemployed. The age group with the highest labor force participation rate is 25 to 29 years, with 83.1% or 290 individuals in the labor force. Within the labor force, the 16 to 19 years age range has the highest percentage of unemployed individuals, with 34.6% or 9 of them being unemployed.
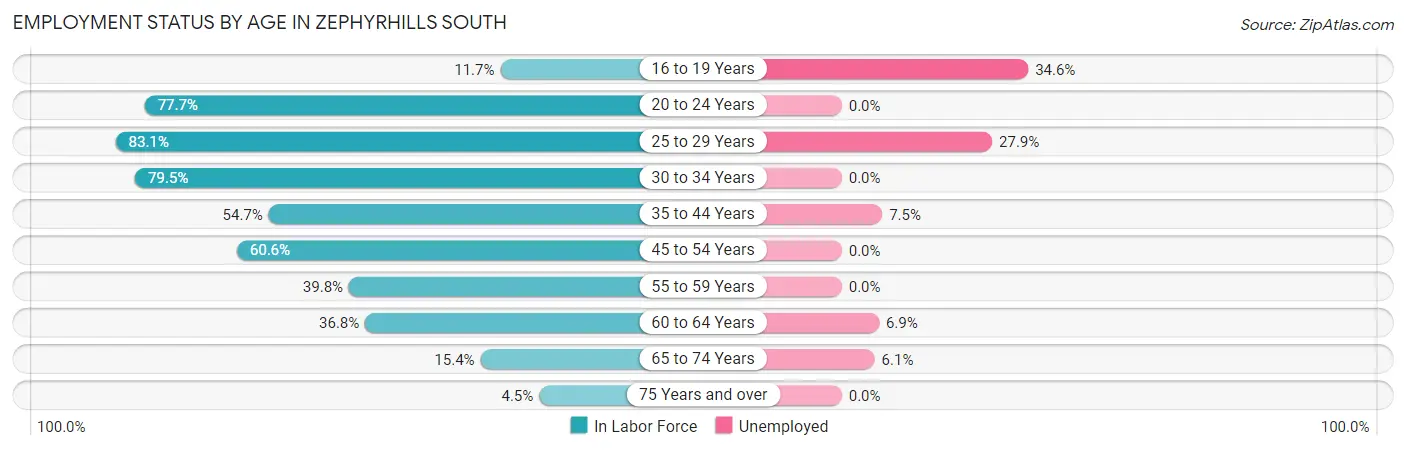
| Age Bracket | In Labor Force | Unemployed |
| 16 to 19 Years | 26 (11.7%) | 9 (34.6%) |
| 20 to 24 Years | 202 (77.7%) | 0 (0.0%) |
| 25 to 29 Years | 290 (83.1%) | 81 (27.9%) |
| 30 to 34 Years | 171 (79.5%) | 0 (0.0%) |
| 35 to 44 Years | 187 (54.7%) | 14 (7.5%) |
| 45 to 54 Years | 191 (60.6%) | 0 (0.0%) |
| 55 to 59 Years | 123 (39.8%) | 0 (0.0%) |
| 60 to 64 Years | 144 (36.8%) | 10 (6.9%) |
| 65 to 74 Years | 165 (15.4%) | 10 (6.1%) |
| 75 Years and over | 59 (4.5%) | 0 (0.0%) |
| Total | 1,557 (32.6%) | 125 (8.0%) |
Employment Status by Educational Attainment in Zephyrhills South
According to labor force statistics for Zephyrhills South, 57.6% of individuals (1,106) out of the total population between 25 and 64 years of age (1,921) are in the labor force, with 9.5% or 105 of them being unemployed. The group with the highest labor force participation rate are those with the educational attainment of college / associate degree, with 62.8% or 448 individuals in the labor force. Within the labor force, individuals with high school diploma education have the highest percentage of unemployment, with 11.6% or 69 of them being unemployed.
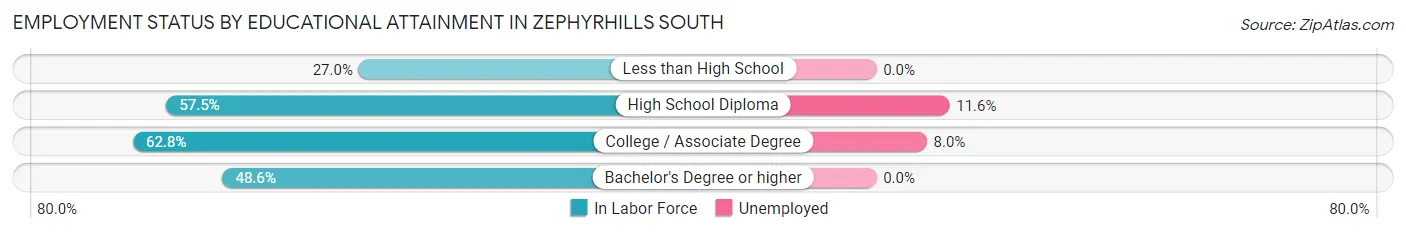
| Educational Attainment | In Labor Force | Unemployed |
| Less than High School | 27 (27.0%) | 0 (0.0%) |
| High School Diploma | 597 (57.5%) | 120 (11.6%) |
| College / Associate Degree | 448 (62.8%) | 57 (8.0%) |
| Bachelor's Degree or higher | 34 (48.6%) | 0 (0.0%) |
| Total | 1,106 (57.6%) | 182 (9.5%) |
Employment Occupations by Sex in Zephyrhills South
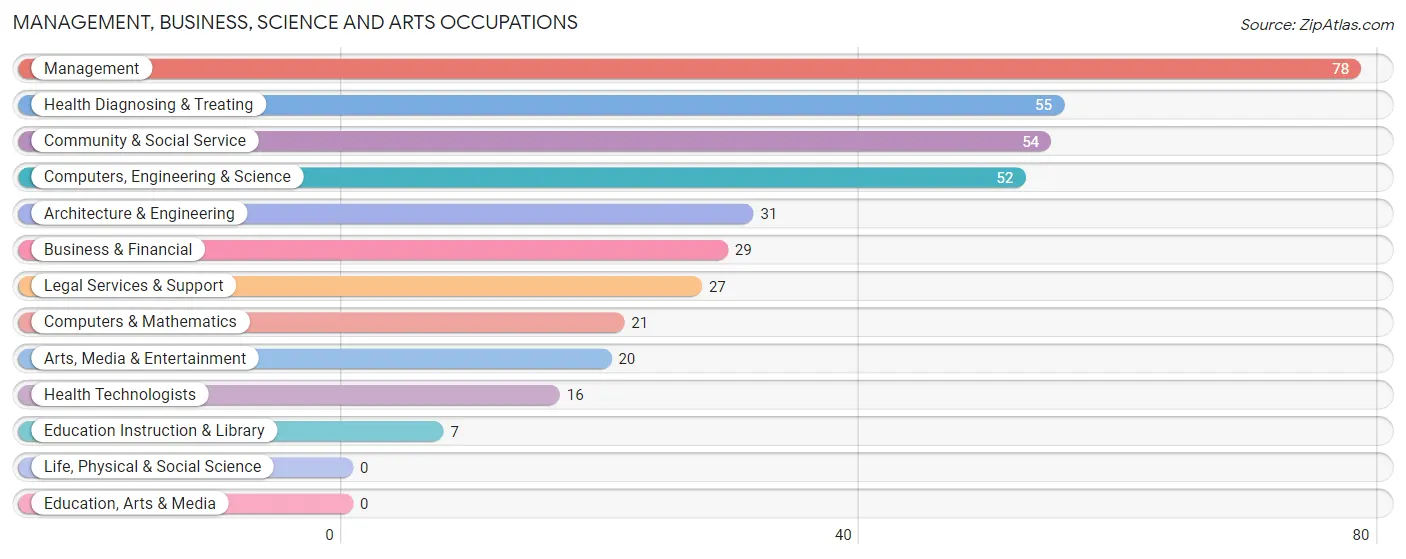
Management, Business, Science and Arts Occupations
The most common Management, Business, Science and Arts occupations in Zephyrhills South are Management (78 | 5.4%), Health Diagnosing & Treating (55 | 3.8%), Community & Social Service (54 | 3.8%), Computers, Engineering & Science (52 | 3.6%), and Architecture & Engineering (31 | 2.2%).
Management, Business, Science and Arts Occupations by Sex
Within the Management, Business, Science and Arts occupations in Zephyrhills South, the most male-oriented occupations are Architecture & Engineering (100.0%), Computers, Engineering & Science (59.6%), and Arts, Media & Entertainment (55.0%), while the most female-oriented occupations are Computers & Mathematics (100.0%), Legal Services & Support (100.0%), and Education Instruction & Library (100.0%).
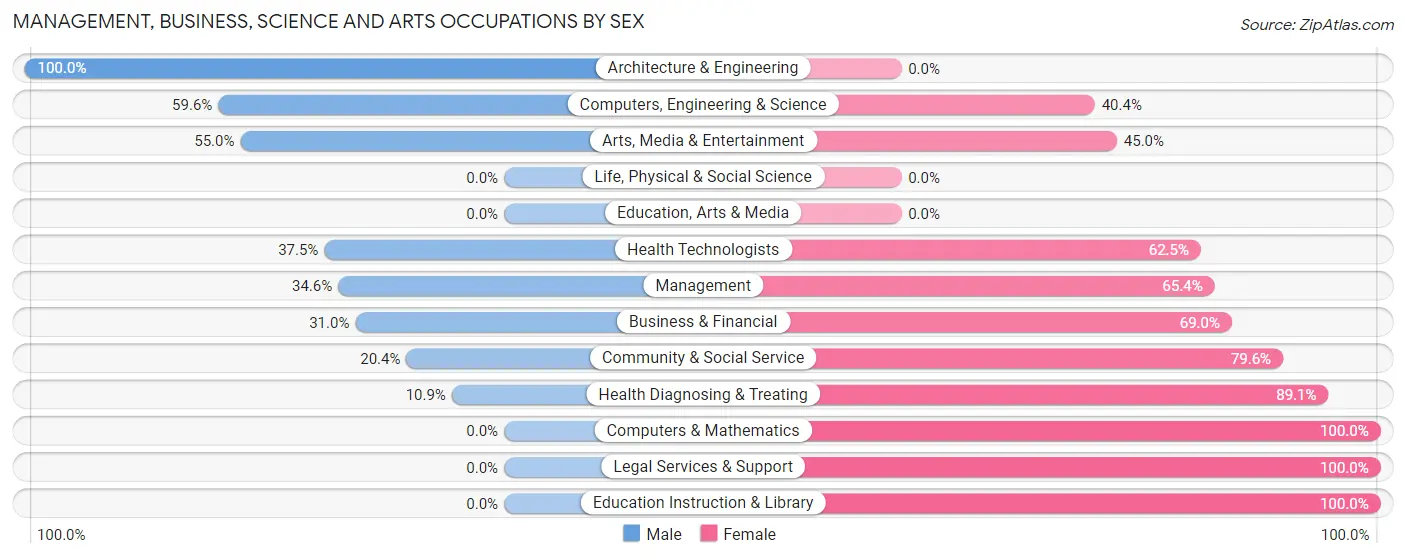
| Occupation | Male | Female |
| Management | 27 (34.6%) | 51 (65.4%) |
| Business & Financial | 9 (31.0%) | 20 (69.0%) |
| Computers, Engineering & Science | 31 (59.6%) | 21 (40.4%) |
| Computers & Mathematics | 0 (0.0%) | 21 (100.0%) |
| Architecture & Engineering | 31 (100.0%) | 0 (0.0%) |
| Life, Physical & Social Science | 0 (0.0%) | 0 (0.0%) |
| Community & Social Service | 11 (20.4%) | 43 (79.6%) |
| Education, Arts & Media | 0 (0.0%) | 0 (0.0%) |
| Legal Services & Support | 0 (0.0%) | 27 (100.0%) |
| Education Instruction & Library | 0 (0.0%) | 7 (100.0%) |
| Arts, Media & Entertainment | 11 (55.0%) | 9 (45.0%) |
| Health Diagnosing & Treating | 6 (10.9%) | 49 (89.1%) |
| Health Technologists | 6 (37.5%) | 10 (62.5%) |
| Total (Category) | 84 (31.3%) | 184 (68.7%) |
| Total (Overall) | 787 (54.9%) | 647 (45.1%) |
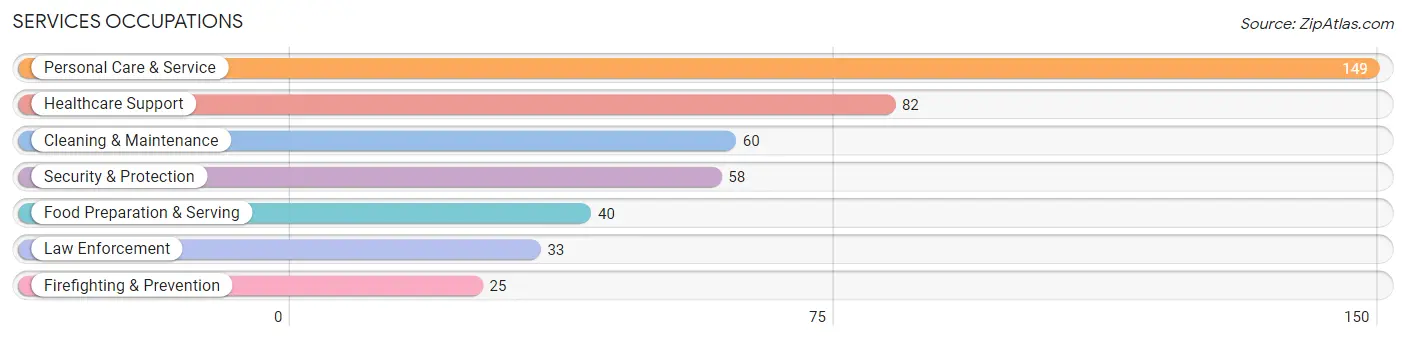
Services Occupations
The most common Services occupations in Zephyrhills South are Personal Care & Service (149 | 10.4%), Healthcare Support (82 | 5.7%), Cleaning & Maintenance (60 | 4.2%), Security & Protection (58 | 4.0%), and Food Preparation & Serving (40 | 2.8%).
Services Occupations by Sex
Within the Services occupations in Zephyrhills South, the most male-oriented occupations are Law Enforcement (100.0%), Security & Protection (81.0%), and Cleaning & Maintenance (61.7%), while the most female-oriented occupations are Personal Care & Service (92.6%), Healthcare Support (87.8%), and Food Preparation & Serving (82.5%).
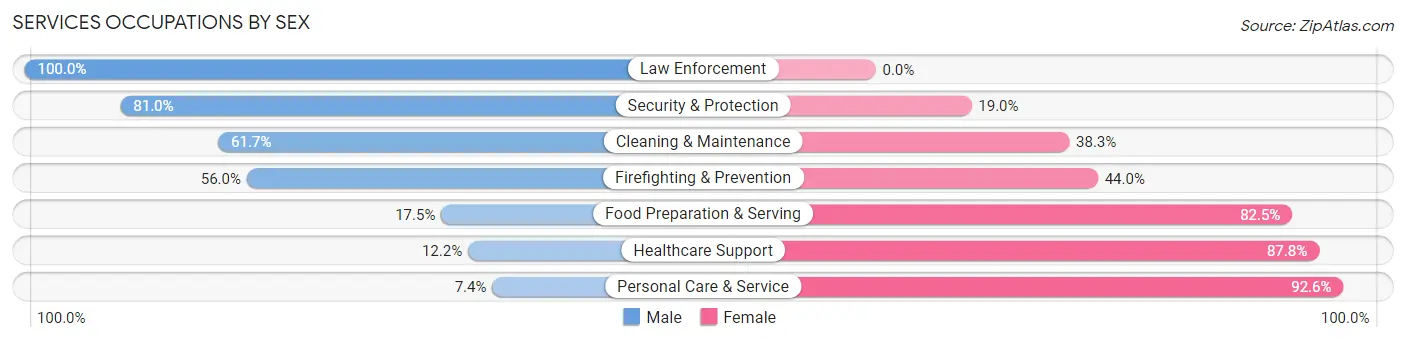
| Occupation | Male | Female |
| Healthcare Support | 10 (12.2%) | 72 (87.8%) |
| Security & Protection | 47 (81.0%) | 11 (19.0%) |
| Firefighting & Prevention | 14 (56.0%) | 11 (44.0%) |
| Law Enforcement | 33 (100.0%) | 0 (0.0%) |
| Food Preparation & Serving | 7 (17.5%) | 33 (82.5%) |
| Cleaning & Maintenance | 37 (61.7%) | 23 (38.3%) |
| Personal Care & Service | 11 (7.4%) | 138 (92.6%) |
| Total (Category) | 112 (28.8%) | 277 (71.2%) |
| Total (Overall) | 787 (54.9%) | 647 (45.1%) |
Sales and Office Occupations
The most common Sales and Office occupations in Zephyrhills South are Office & Administration (182 | 12.7%), and Sales & Related (61 | 4.3%).
Sales and Office Occupations by Sex
| Occupation | Male | Female |
| Sales & Related | 0 (0.0%) | 61 (100.0%) |
| Office & Administration | 66 (36.3%) | 116 (63.7%) |
| Total (Category) | 66 (27.2%) | 177 (72.8%) |
| Total (Overall) | 787 (54.9%) | 647 (45.1%) |
Natural Resources, Construction and Maintenance Occupations
The most common Natural Resources, Construction and Maintenance occupations in Zephyrhills South are Construction & Extraction (258 | 18.0%), and Installation, Maintenance & Repair (77 | 5.4%).
Natural Resources, Construction and Maintenance Occupations by Sex
| Occupation | Male | Female |
| Farming, Fishing & Forestry | 0 (0.0%) | 0 (0.0%) |
| Construction & Extraction | 249 (96.5%) | 9 (3.5%) |
| Installation, Maintenance & Repair | 77 (100.0%) | 0 (0.0%) |
| Total (Category) | 326 (97.3%) | 9 (2.7%) |
| Total (Overall) | 787 (54.9%) | 647 (45.1%) |
Production, Transportation and Moving Occupations
The most common Production, Transportation and Moving occupations in Zephyrhills South are Transportation (76 | 5.3%), Material Moving (67 | 4.7%), and Production (56 | 3.9%).
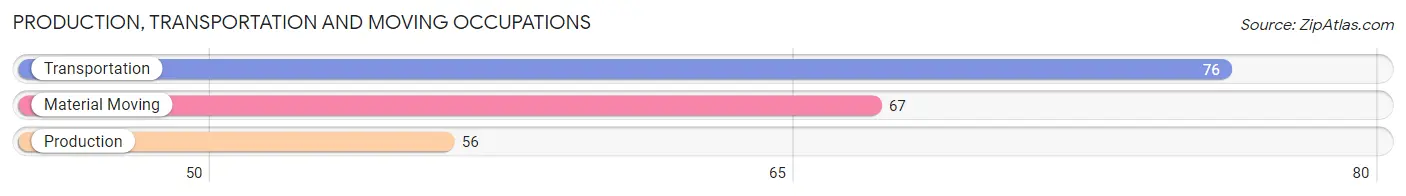
Production, Transportation and Moving Occupations by Sex
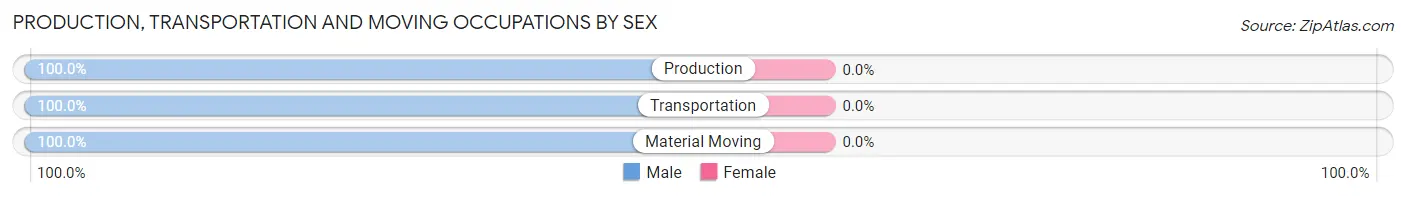
| Occupation | Male | Female |
| Production | 56 (100.0%) | 0 (0.0%) |
| Transportation | 76 (100.0%) | 0 (0.0%) |
| Material Moving | 67 (100.0%) | 0 (0.0%) |
| Total (Category) | 199 (100.0%) | 0 (0.0%) |
| Total (Overall) | 787 (54.9%) | 647 (45.1%) |
Employment Industries by Sex in Zephyrhills South
Employment Industries in Zephyrhills South
The major employment industries in Zephyrhills South include Health Care & Social Assistance (293 | 20.4%), Construction (262 | 18.3%), Professional & Scientific (114 | 8.0%), Retail Trade (113 | 7.9%), and Transportation & Warehousing (110 | 7.7%).
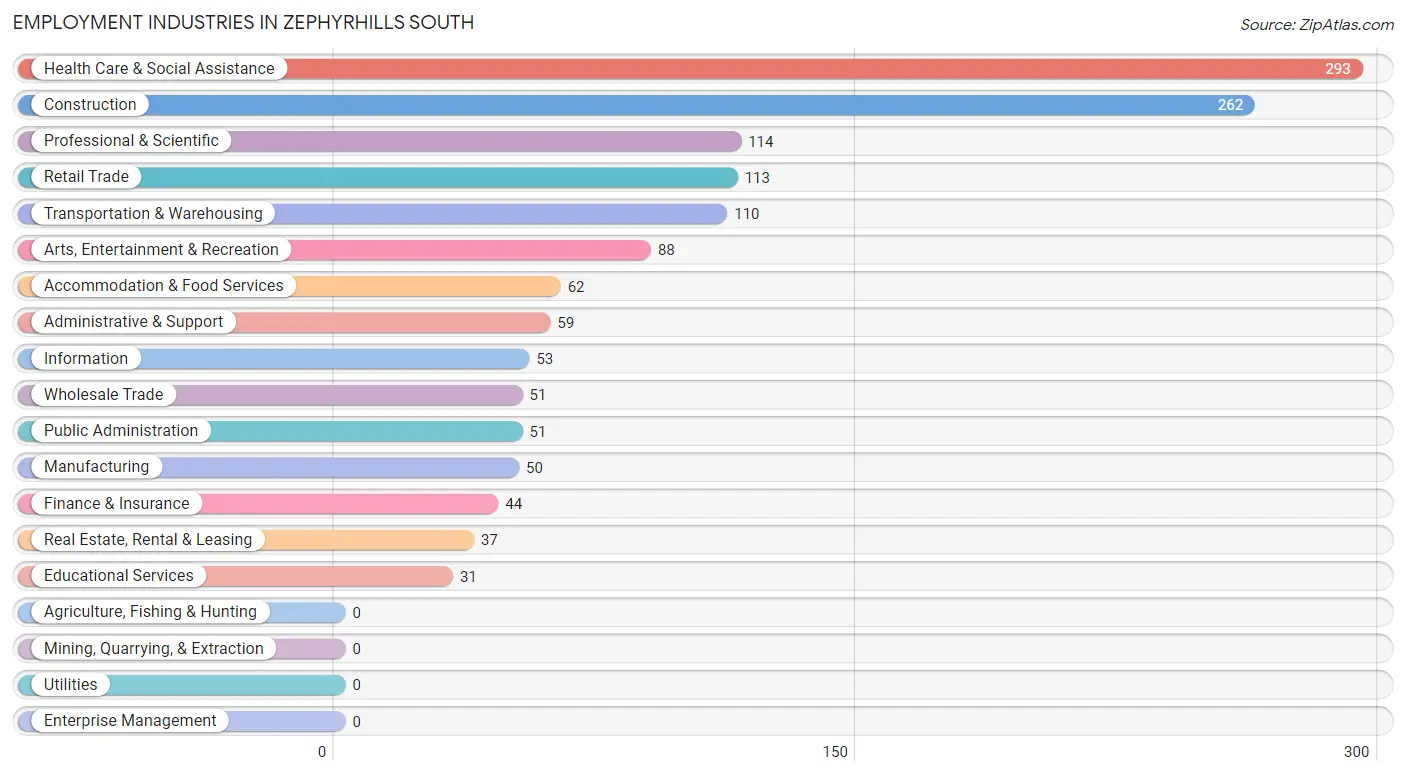
Employment Industries by Sex in Zephyrhills South
The Zephyrhills South industries that see more men than women are Wholesale Trade (100.0%), Real Estate, Rental & Leasing (100.0%), and Construction (96.6%), whereas the industries that tend to have a higher number of women are Health Care & Social Assistance (88.4%), Information (79.2%), and Educational Services (61.3%).
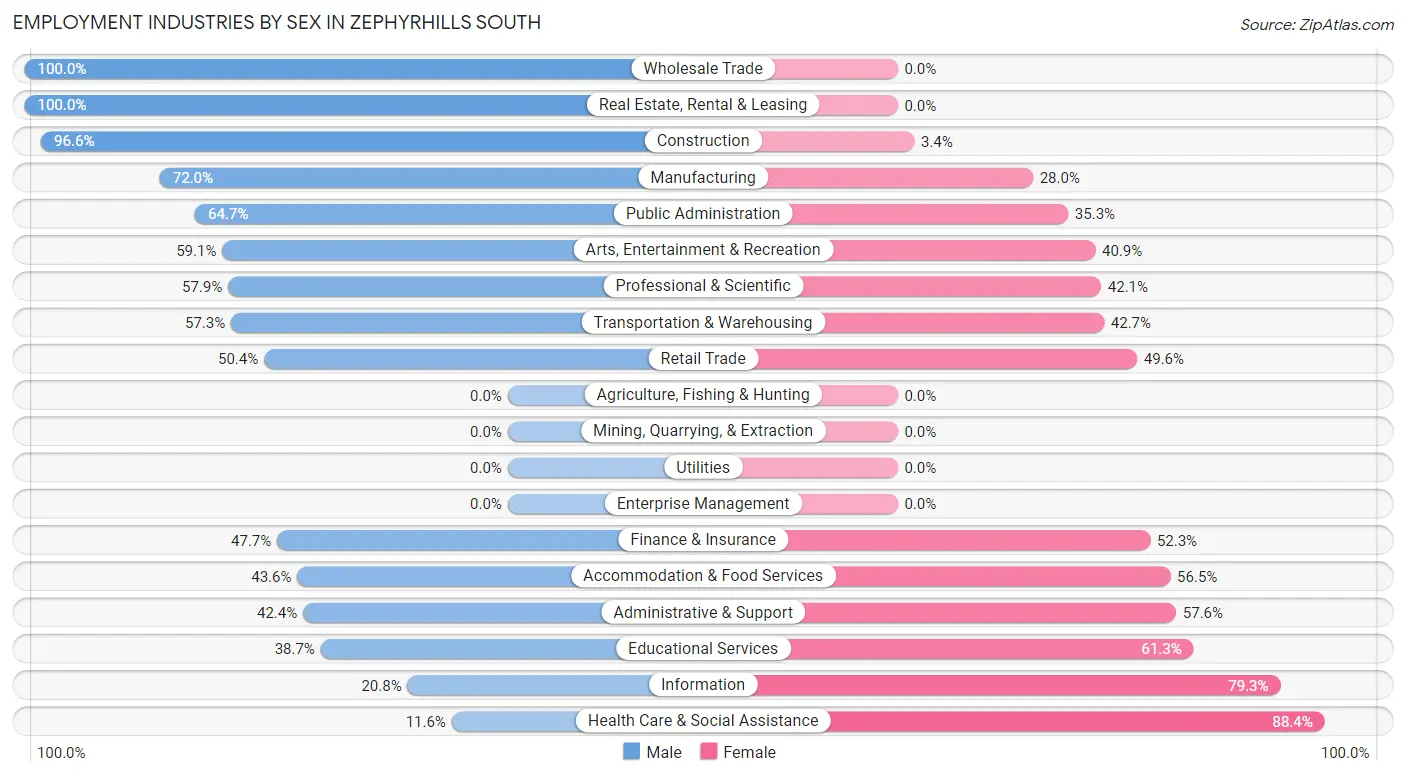
| Industry | Male | Female |
| Agriculture, Fishing & Hunting | 0 (0.0%) | 0 (0.0%) |
| Mining, Quarrying, & Extraction | 0 (0.0%) | 0 (0.0%) |
| Construction | 253 (96.6%) | 9 (3.4%) |
| Manufacturing | 36 (72.0%) | 14 (28.0%) |
| Wholesale Trade | 51 (100.0%) | 0 (0.0%) |
| Retail Trade | 57 (50.4%) | 56 (49.6%) |
| Transportation & Warehousing | 63 (57.3%) | 47 (42.7%) |
| Utilities | 0 (0.0%) | 0 (0.0%) |
| Information | 11 (20.7%) | 42 (79.2%) |
| Finance & Insurance | 21 (47.7%) | 23 (52.3%) |
| Real Estate, Rental & Leasing | 37 (100.0%) | 0 (0.0%) |
| Professional & Scientific | 66 (57.9%) | 48 (42.1%) |
| Enterprise Management | 0 (0.0%) | 0 (0.0%) |
| Administrative & Support | 25 (42.4%) | 34 (57.6%) |
| Educational Services | 12 (38.7%) | 19 (61.3%) |
| Health Care & Social Assistance | 34 (11.6%) | 259 (88.4%) |
| Arts, Entertainment & Recreation | 52 (59.1%) | 36 (40.9%) |
| Accommodation & Food Services | 27 (43.5%) | 35 (56.5%) |
| Public Administration | 33 (64.7%) | 18 (35.3%) |
| Total | 787 (54.9%) | 647 (45.1%) |
Education in Zephyrhills South
School Enrollment in Zephyrhills South
The most common levels of schooling among the 685 students in Zephyrhills South are high school (195 | 28.5%), elementary school (162 | 23.6%), and middle school (124 | 18.1%).
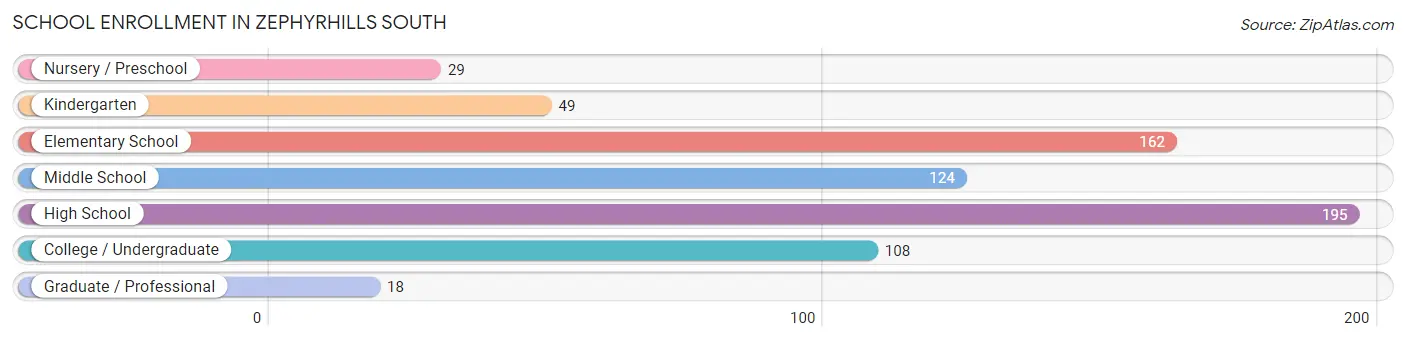
| School Level | # Students | % Students |
| Nursery / Preschool | 29 | 4.2% |
| Kindergarten | 49 | 7.1% |
| Elementary School | 162 | 23.6% |
| Middle School | 124 | 18.1% |
| High School | 195 | 28.5% |
| College / Undergraduate | 108 | 15.8% |
| Graduate / Professional | 18 | 2.6% |
| Total | 685 | 100.0% |
School Enrollment by Age by Funding Source in Zephyrhills South
Out of a total of 685 students who are enrolled in schools in Zephyrhills South, 12 (1.8%) attend a private institution, while the remaining 673 (98.2%) are enrolled in public schools. The age group of 35 years and over has the highest likelihood of being enrolled in private schools, with 12 (27.3% in the age bracket) enrolled. Conversely, the age group of 3 to 4 year olds has the lowest likelihood of being enrolled in a private school, with 29 (100.0% in the age bracket) attending a public institution.
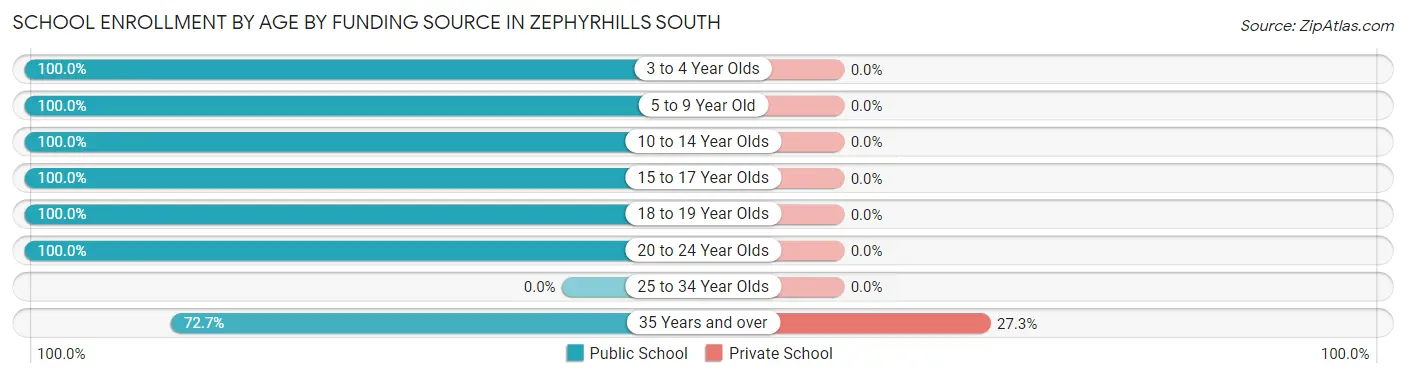
| Age Bracket | Public School | Private School |
| 3 to 4 Year Olds | 29 (100.0%) | 0 (0.0%) |
| 5 to 9 Year Old | 203 (100.0%) | 0 (0.0%) |
| 10 to 14 Year Olds | 161 (100.0%) | 0 (0.0%) |
| 15 to 17 Year Olds | 157 (100.0%) | 0 (0.0%) |
| 18 to 19 Year Olds | 66 (100.0%) | 0 (0.0%) |
| 20 to 24 Year Olds | 25 (100.0%) | 0 (0.0%) |
| 25 to 34 Year Olds | 0 (0.0%) | 0 (0.0%) |
| 35 Years and over | 32 (72.7%) | 12 (27.3%) |
| Total | 673 (98.2%) | 12 (1.8%) |
Educational Attainment by Field of Study in Zephyrhills South
Business (67 | 17.1%), psychology (48 | 12.3%), education (48 | 12.3%), social sciences (38 | 9.7%), and physical & health sciences (36 | 9.2%) are the most common fields of study among 391 individuals in Zephyrhills South who have obtained a bachelor's degree or higher.
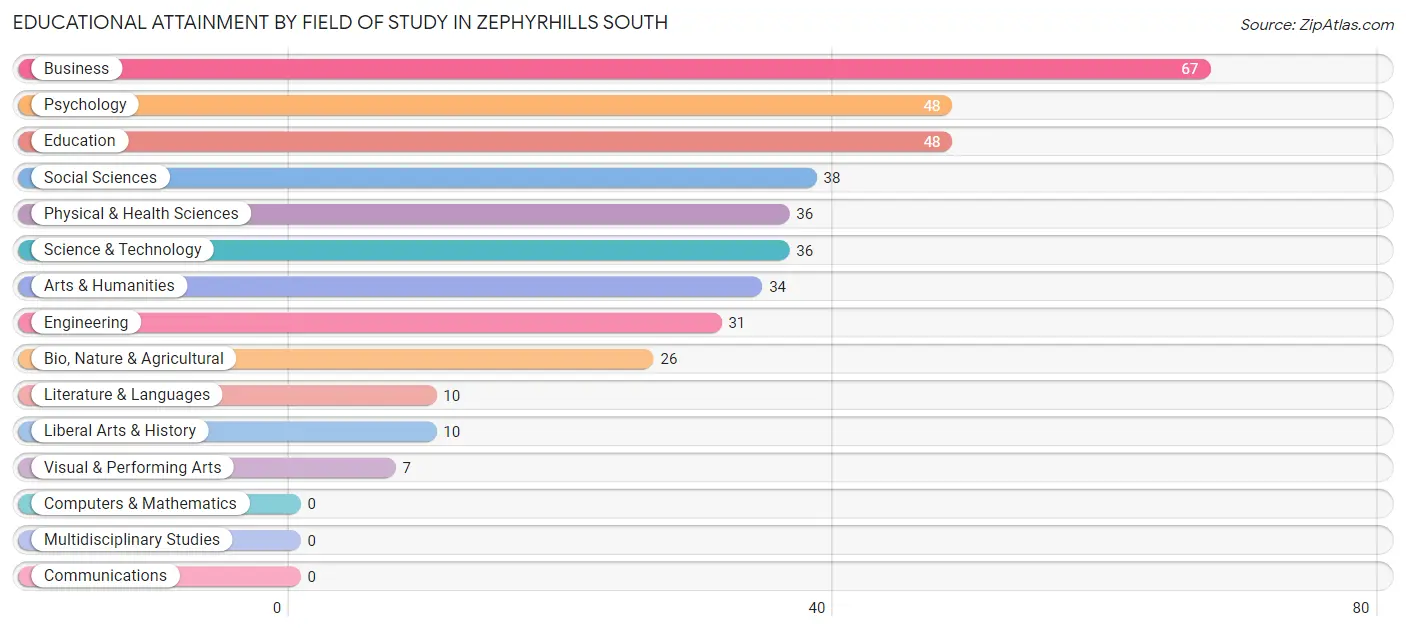
| Field of Study | # Graduates | % Graduates |
| Computers & Mathematics | 0 | 0.0% |
| Bio, Nature & Agricultural | 26 | 6.7% |
| Physical & Health Sciences | 36 | 9.2% |
| Psychology | 48 | 12.3% |
| Social Sciences | 38 | 9.7% |
| Engineering | 31 | 7.9% |
| Multidisciplinary Studies | 0 | 0.0% |
| Science & Technology | 36 | 9.2% |
| Business | 67 | 17.1% |
| Education | 48 | 12.3% |
| Literature & Languages | 10 | 2.6% |
| Liberal Arts & History | 10 | 2.6% |
| Visual & Performing Arts | 7 | 1.8% |
| Communications | 0 | 0.0% |
| Arts & Humanities | 34 | 8.7% |
| Total | 391 | 100.0% |
Transportation & Commute in Zephyrhills South
Vehicle Availability by Sex in Zephyrhills South
The most prevalent vehicle ownership categories in Zephyrhills South are males with 2 vehicles (336, accounting for 43.6%) and females with 2 vehicles (255, making up 52.7%).
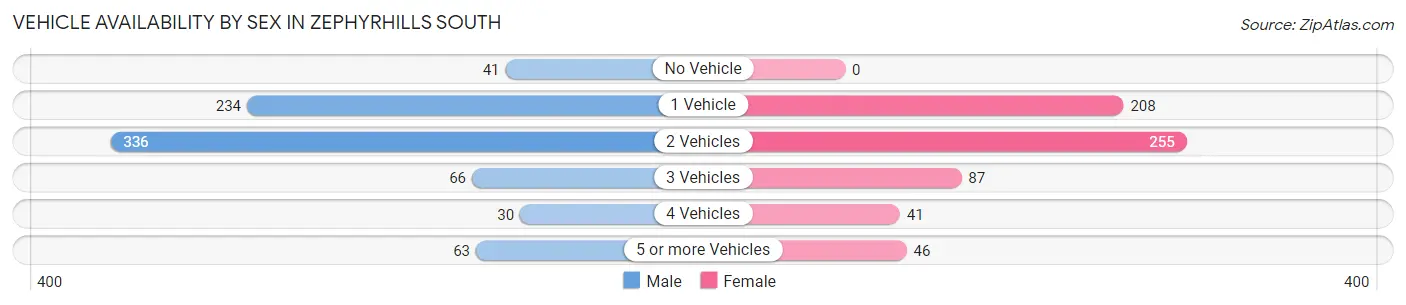
| Vehicles Available | Male | Female |
| No Vehicle | 41 (5.3%) | 0 (0.0%) |
| 1 Vehicle | 234 (30.4%) | 208 (32.7%) |
| 2 Vehicles | 336 (43.6%) | 255 (40.0%) |
| 3 Vehicles | 66 (8.6%) | 87 (13.7%) |
| 4 Vehicles | 30 (3.9%) | 41 (6.4%) |
| 5 or more Vehicles | 63 (8.2%) | 46 (7.2%) |
| Total | 770 (100.0%) | 637 (100.0%) |
Commute Time in Zephyrhills South
The most frequently occuring commute durations in Zephyrhills South are 5 to 9 minutes (270 commuters, 20.6%), 20 to 24 minutes (209 commuters, 15.9%), and 30 to 34 minutes (199 commuters, 15.2%).
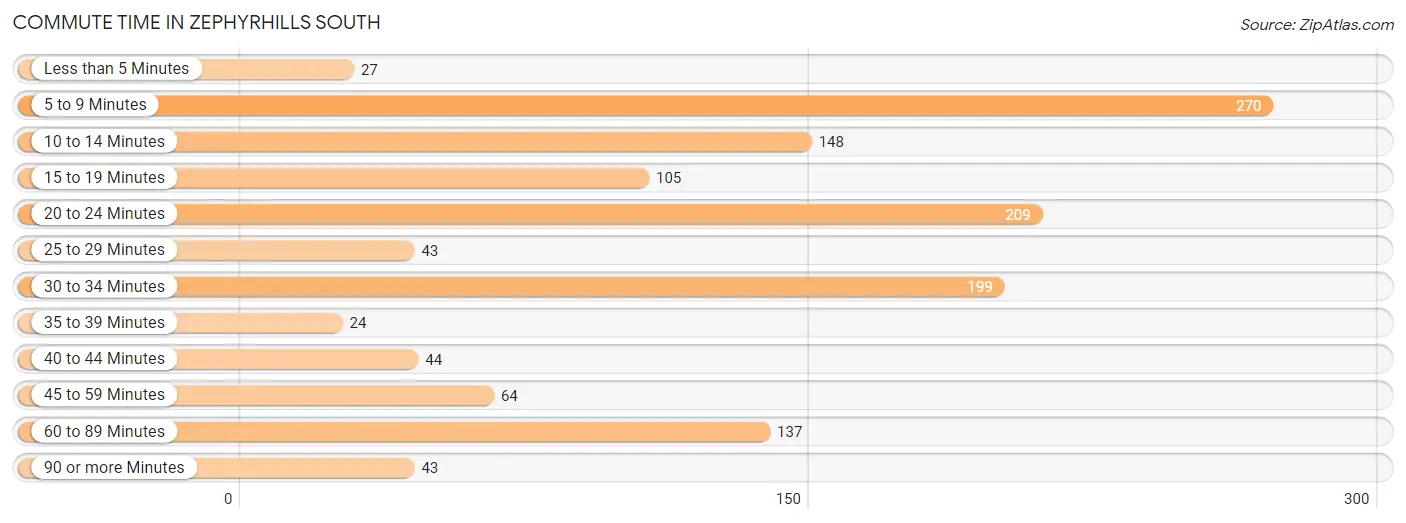
| Commute Time | # Commuters | % Commuters |
| Less than 5 Minutes | 27 | 2.1% |
| 5 to 9 Minutes | 270 | 20.6% |
| 10 to 14 Minutes | 148 | 11.3% |
| 15 to 19 Minutes | 105 | 8.0% |
| 20 to 24 Minutes | 209 | 15.9% |
| 25 to 29 Minutes | 43 | 3.3% |
| 30 to 34 Minutes | 199 | 15.2% |
| 35 to 39 Minutes | 24 | 1.8% |
| 40 to 44 Minutes | 44 | 3.4% |
| 45 to 59 Minutes | 64 | 4.9% |
| 60 to 89 Minutes | 137 | 10.4% |
| 90 or more Minutes | 43 | 3.3% |
Commute Time by Sex in Zephyrhills South
The most common commute times in Zephyrhills South are 60 to 89 minutes (129 commuters, 17.4%) for males and 5 to 9 minutes (157 commuters, 27.4%) for females.
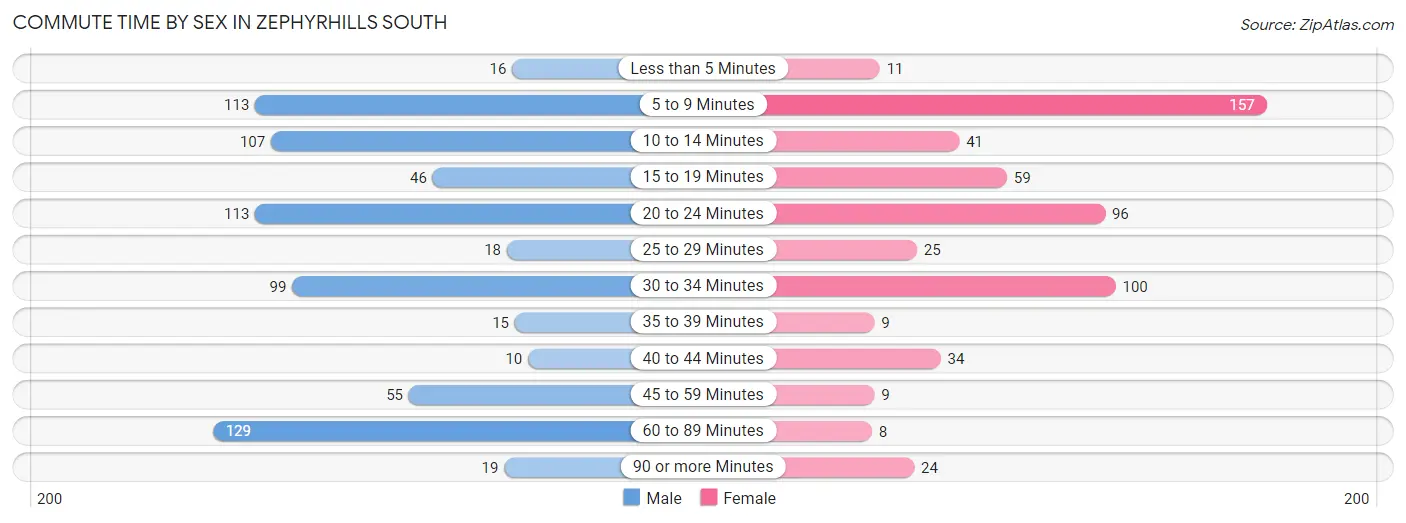
| Commute Time | Male | Female |
| Less than 5 Minutes | 16 (2.2%) | 11 (1.9%) |
| 5 to 9 Minutes | 113 (15.3%) | 157 (27.4%) |
| 10 to 14 Minutes | 107 (14.5%) | 41 (7.2%) |
| 15 to 19 Minutes | 46 (6.2%) | 59 (10.3%) |
| 20 to 24 Minutes | 113 (15.3%) | 96 (16.8%) |
| 25 to 29 Minutes | 18 (2.4%) | 25 (4.4%) |
| 30 to 34 Minutes | 99 (13.4%) | 100 (17.4%) |
| 35 to 39 Minutes | 15 (2.0%) | 9 (1.6%) |
| 40 to 44 Minutes | 10 (1.3%) | 34 (5.9%) |
| 45 to 59 Minutes | 55 (7.4%) | 9 (1.6%) |
| 60 to 89 Minutes | 129 (17.4%) | 8 (1.4%) |
| 90 or more Minutes | 19 (2.6%) | 24 (4.2%) |
Time of Departure to Work by Sex in Zephyrhills South
The most frequent times of departure to work in Zephyrhills South are 6:00 AM to 6:29 AM (154, 20.8%) for males and 6:00 AM to 6:29 AM (114, 19.9%) for females.
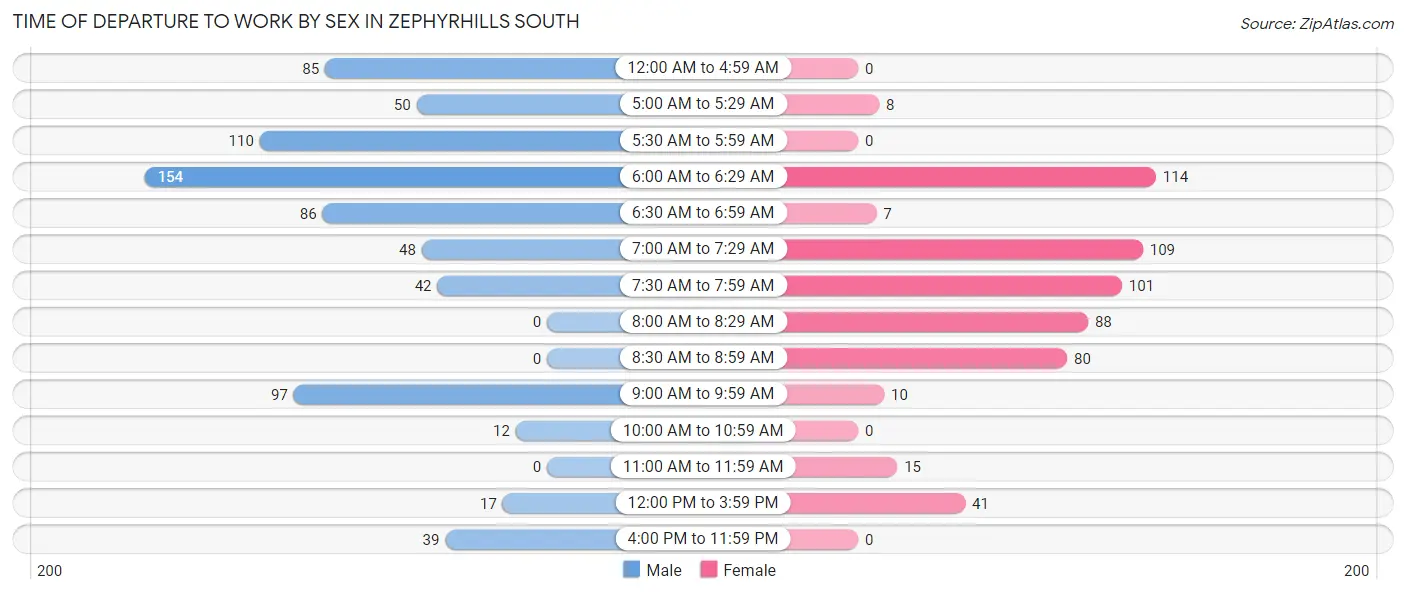
| Time of Departure | Male | Female |
| 12:00 AM to 4:59 AM | 85 (11.5%) | 0 (0.0%) |
| 5:00 AM to 5:29 AM | 50 (6.8%) | 8 (1.4%) |
| 5:30 AM to 5:59 AM | 110 (14.9%) | 0 (0.0%) |
| 6:00 AM to 6:29 AM | 154 (20.8%) | 114 (19.9%) |
| 6:30 AM to 6:59 AM | 86 (11.6%) | 7 (1.2%) |
| 7:00 AM to 7:29 AM | 48 (6.5%) | 109 (19.0%) |
| 7:30 AM to 7:59 AM | 42 (5.7%) | 101 (17.6%) |
| 8:00 AM to 8:29 AM | 0 (0.0%) | 88 (15.4%) |
| 8:30 AM to 8:59 AM | 0 (0.0%) | 80 (14.0%) |
| 9:00 AM to 9:59 AM | 97 (13.1%) | 10 (1.8%) |
| 10:00 AM to 10:59 AM | 12 (1.6%) | 0 (0.0%) |
| 11:00 AM to 11:59 AM | 0 (0.0%) | 15 (2.6%) |
| 12:00 PM to 3:59 PM | 17 (2.3%) | 41 (7.2%) |
| 4:00 PM to 11:59 PM | 39 (5.3%) | 0 (0.0%) |
| Total | 740 (100.0%) | 573 (100.0%) |
Housing Occupancy in Zephyrhills South
Occupancy by Ownership in Zephyrhills South
Of the total 2,573 dwellings in Zephyrhills South, owner-occupied units account for 2,105 (81.8%), while renter-occupied units make up 468 (18.2%).
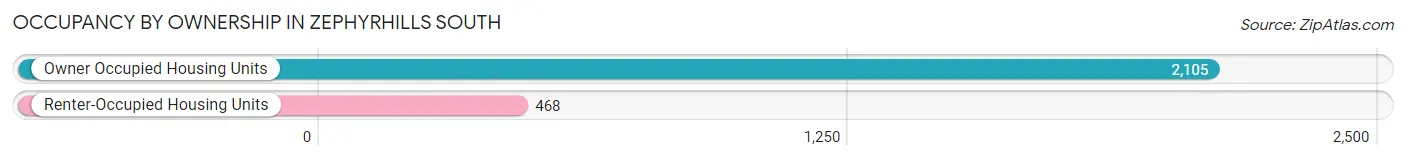
| Occupancy | # Housing Units | % Housing Units |
| Owner Occupied Housing Units | 2,105 | 81.8% |
| Renter-Occupied Housing Units | 468 | 18.2% |
| Total Occupied Housing Units | 2,573 | 100.0% |
Occupancy by Household Size in Zephyrhills South
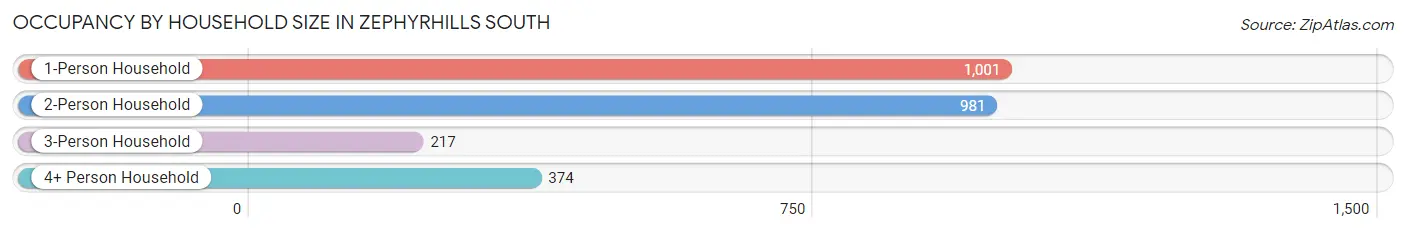
| Household Size | # Housing Units | % Housing Units |
| 1-Person Household | 1,001 | 38.9% |
| 2-Person Household | 981 | 38.1% |
| 3-Person Household | 217 | 8.4% |
| 4+ Person Household | 374 | 14.5% |
| Total Housing Units | 2,573 | 100.0% |
Occupancy by Ownership by Household Size in Zephyrhills South
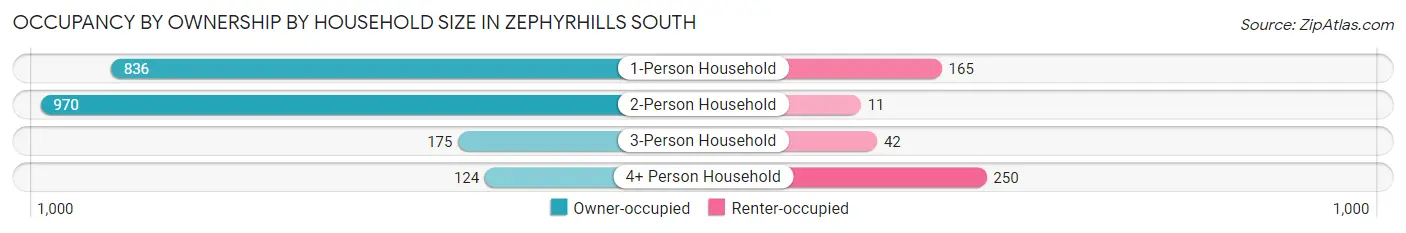
| Household Size | Owner-occupied | Renter-occupied |
| 1-Person Household | 836 (83.5%) | 165 (16.5%) |
| 2-Person Household | 970 (98.9%) | 11 (1.1%) |
| 3-Person Household | 175 (80.6%) | 42 (19.4%) |
| 4+ Person Household | 124 (33.2%) | 250 (66.8%) |
| Total Housing Units | 2,105 (81.8%) | 468 (18.2%) |
Occupancy by Educational Attainment in Zephyrhills South
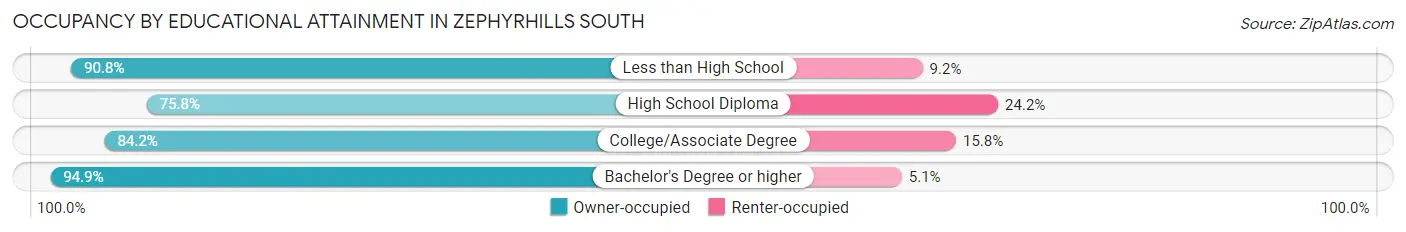
| Household Size | Owner-occupied | Renter-occupied |
| Less than High School | 197 (90.8%) | 20 (9.2%) |
| High School Diploma | 890 (75.8%) | 284 (24.2%) |
| College/Associate Degree | 813 (84.2%) | 153 (15.8%) |
| Bachelor's Degree or higher | 205 (94.9%) | 11 (5.1%) |
Occupancy by Age of Householder in Zephyrhills South
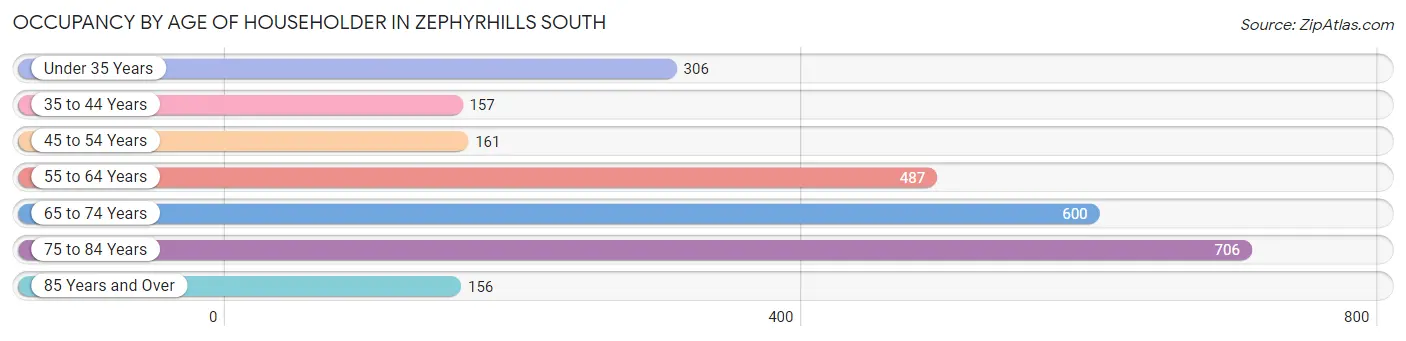
| Age Bracket | # Households | % Households |
| Under 35 Years | 306 | 11.9% |
| 35 to 44 Years | 157 | 6.1% |
| 45 to 54 Years | 161 | 6.3% |
| 55 to 64 Years | 487 | 18.9% |
| 65 to 74 Years | 600 | 23.3% |
| 75 to 84 Years | 706 | 27.4% |
| 85 Years and Over | 156 | 6.1% |
| Total | 2,573 | 100.0% |
Housing Finances in Zephyrhills South
Median Income by Occupancy in Zephyrhills South
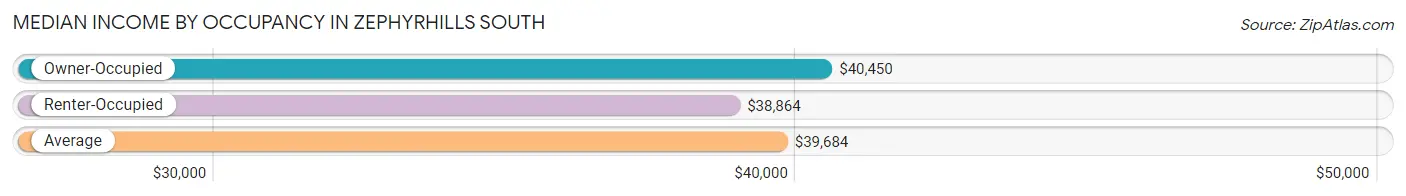
| Occupancy Type | # Households | Median Income |
| Owner-Occupied | 2,105 (81.8%) | $40,450 |
| Renter-Occupied | 468 (18.2%) | $38,864 |
| Average | 2,573 (100.0%) | $39,684 |
Occupancy by Householder Income Bracket in Zephyrhills South
| Income Bracket | Owner-occupied | Renter-occupied |
| Less than $5,000 | 124 (5.9%) | 0 (0.0%) |
| $5,000 to $9,999 | 54 (2.6%) | 0 (0.0%) |
| $10,000 to $14,999 | 83 (3.9%) | 10 (2.1%) |
| $15,000 to $19,999 | 158 (7.5%) | 20 (4.3%) |
| $20,000 to $24,999 | 312 (14.8%) | 48 (10.3%) |
| $25,000 to $34,999 | 229 (10.9%) | 138 (29.5%) |
| $35,000 to $49,999 | 377 (17.9%) | 88 (18.8%) |
| $50,000 to $74,999 | 296 (14.1%) | 97 (20.7%) |
| $75,000 to $99,999 | 259 (12.3%) | 67 (14.3%) |
| $100,000 to $149,999 | 148 (7.0%) | 0 (0.0%) |
| $150,000 or more | 65 (3.1%) | 0 (0.0%) |
| Total | 2,105 (100.0%) | 468 (100.0%) |
Monthly Housing Cost Tiers in Zephyrhills South
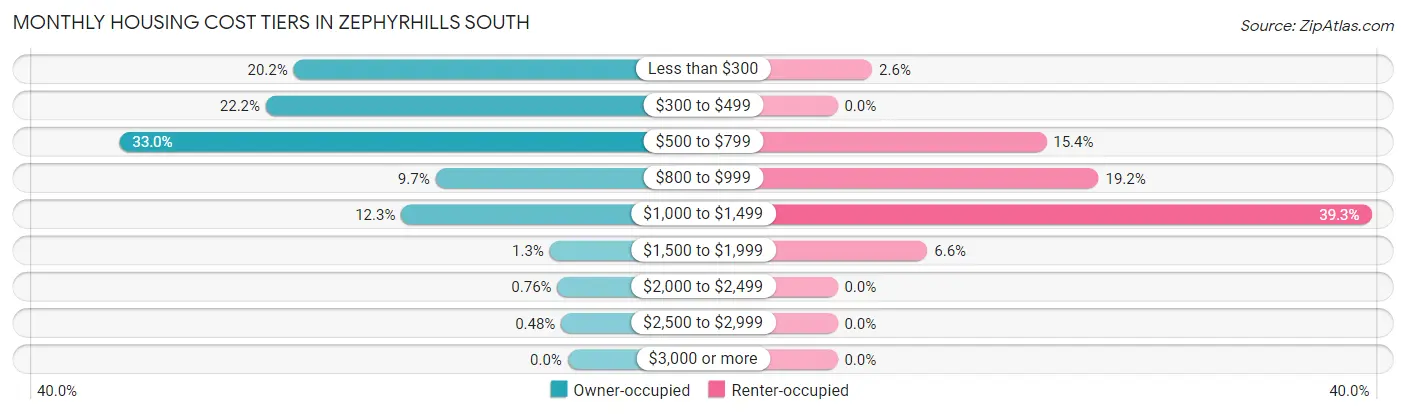
| Monthly Cost | Owner-occupied | Renter-occupied |
| Less than $300 | 425 (20.2%) | 12 (2.6%) |
| $300 to $499 | 468 (22.2%) | 0 (0.0%) |
| $500 to $799 | 695 (33.0%) | 72 (15.4%) |
| $800 to $999 | 205 (9.7%) | 90 (19.2%) |
| $1,000 to $1,499 | 258 (12.3%) | 184 (39.3%) |
| $1,500 to $1,999 | 28 (1.3%) | 31 (6.6%) |
| $2,000 to $2,499 | 16 (0.8%) | 0 (0.0%) |
| $2,500 to $2,999 | 10 (0.5%) | 0 (0.0%) |
| $3,000 or more | 0 (0.0%) | 0 (0.0%) |
| Total | 2,105 (100.0%) | 468 (100.0%) |
Physical Housing Characteristics in Zephyrhills South
Housing Structures in Zephyrhills South
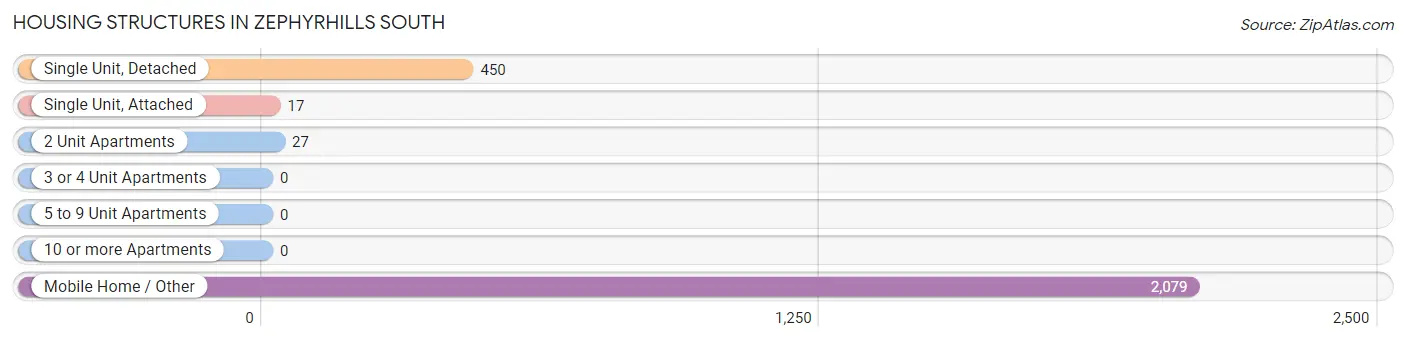
| Structure Type | # Housing Units | % Housing Units |
| Single Unit, Detached | 450 | 17.5% |
| Single Unit, Attached | 17 | 0.7% |
| 2 Unit Apartments | 27 | 1.1% |
| 3 or 4 Unit Apartments | 0 | 0.0% |
| 5 to 9 Unit Apartments | 0 | 0.0% |
| 10 or more Apartments | 0 | 0.0% |
| Mobile Home / Other | 2,079 | 80.8% |
| Total | 2,573 | 100.0% |
Housing Structures by Occupancy in Zephyrhills South
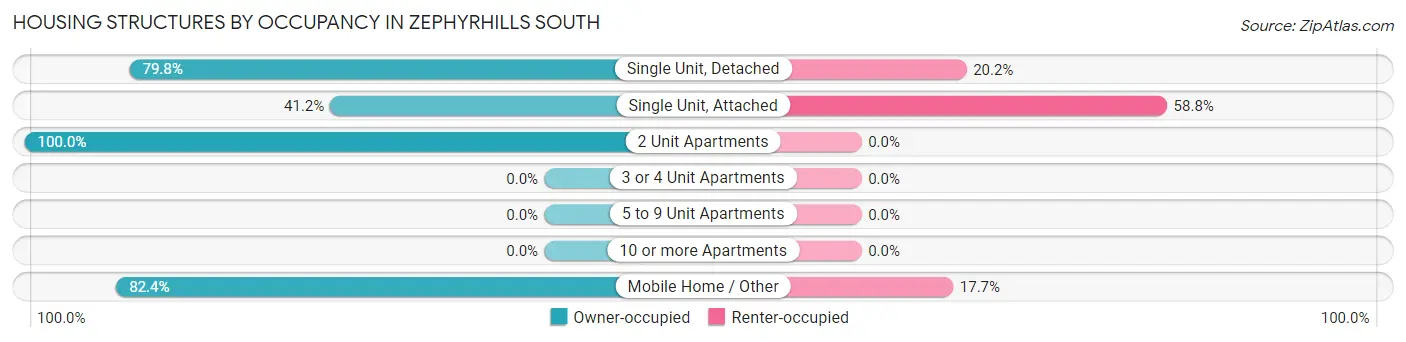
| Structure Type | Owner-occupied | Renter-occupied |
| Single Unit, Detached | 359 (79.8%) | 91 (20.2%) |
| Single Unit, Attached | 7 (41.2%) | 10 (58.8%) |
| 2 Unit Apartments | 27 (100.0%) | 0 (0.0%) |
| 3 or 4 Unit Apartments | 0 (0.0%) | 0 (0.0%) |
| 5 to 9 Unit Apartments | 0 (0.0%) | 0 (0.0%) |
| 10 or more Apartments | 0 (0.0%) | 0 (0.0%) |
| Mobile Home / Other | 1,712 (82.4%) | 367 (17.6%) |
| Total | 2,105 (81.8%) | 468 (18.2%) |
Housing Structures by Number of Rooms in Zephyrhills South
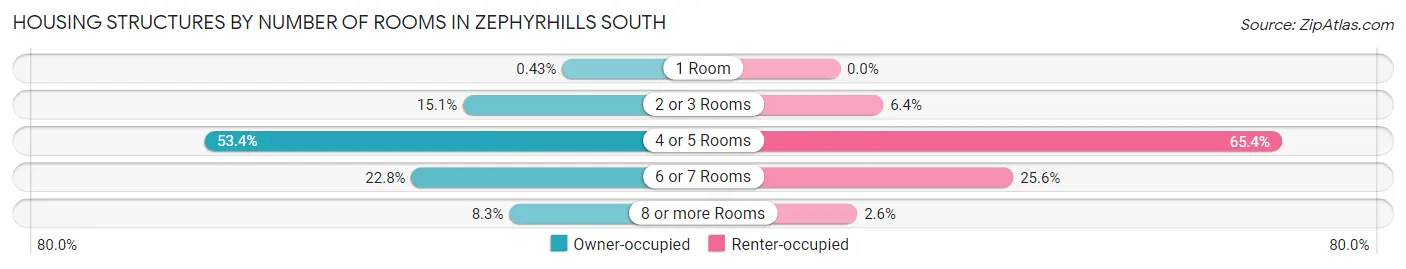
| Number of Rooms | Owner-occupied | Renter-occupied |
| 1 Room | 9 (0.4%) | 0 (0.0%) |
| 2 or 3 Rooms | 318 (15.1%) | 30 (6.4%) |
| 4 or 5 Rooms | 1,125 (53.4%) | 306 (65.4%) |
| 6 or 7 Rooms | 479 (22.8%) | 120 (25.6%) |
| 8 or more Rooms | 174 (8.3%) | 12 (2.6%) |
| Total | 2,105 (100.0%) | 468 (100.0%) |
Housing Structure by Heating Type in Zephyrhills South
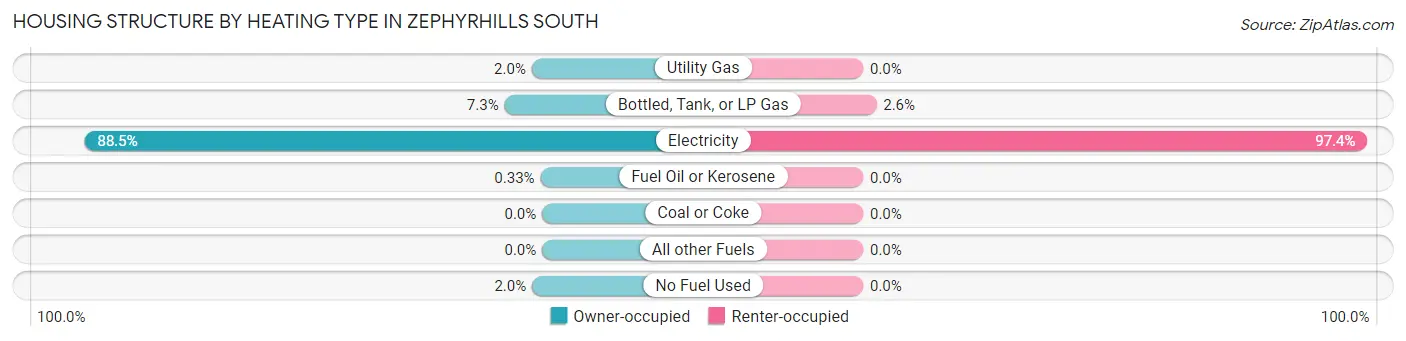
| Heating Type | Owner-occupied | Renter-occupied |
| Utility Gas | 42 (2.0%) | 0 (0.0%) |
| Bottled, Tank, or LP Gas | 153 (7.3%) | 12 (2.6%) |
| Electricity | 1,862 (88.5%) | 456 (97.4%) |
| Fuel Oil or Kerosene | 7 (0.3%) | 0 (0.0%) |
| Coal or Coke | 0 (0.0%) | 0 (0.0%) |
| All other Fuels | 0 (0.0%) | 0 (0.0%) |
| No Fuel Used | 41 (1.9%) | 0 (0.0%) |
| Total | 2,105 (100.0%) | 468 (100.0%) |
Household Vehicle Usage in Zephyrhills South
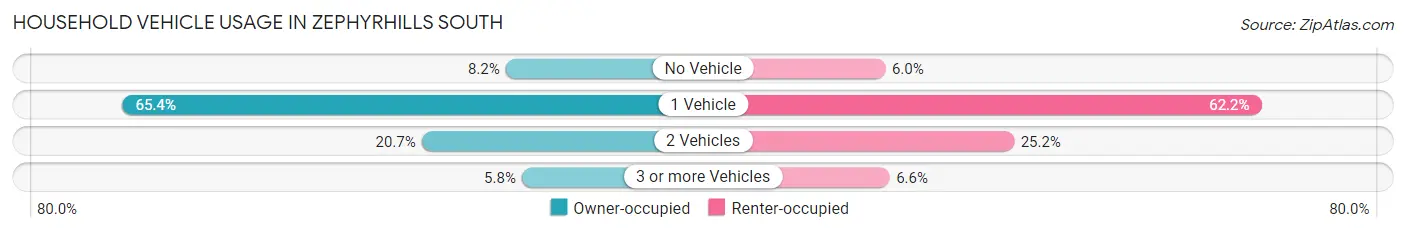
| Vehicles per Household | Owner-occupied | Renter-occupied |
| No Vehicle | 172 (8.2%) | 28 (6.0%) |
| 1 Vehicle | 1,376 (65.4%) | 291 (62.2%) |
| 2 Vehicles | 436 (20.7%) | 118 (25.2%) |
| 3 or more Vehicles | 121 (5.8%) | 31 (6.6%) |
| Total | 2,105 (100.0%) | 468 (100.0%) |
Real Estate & Mortgages in Zephyrhills South
Real Estate and Mortgage Overview in Zephyrhills South
| Characteristic | Without Mortgage | With Mortgage |
| Housing Units | 1,664 | 441 |
| Median Property Value | $27,800 | $138,600 |
| Median Household Income | $37,949 | $9 |
| Monthly Housing Costs | $485 | $0 |
| Real Estate Taxes | - | - |
Property Value by Mortgage Status in Zephyrhills South
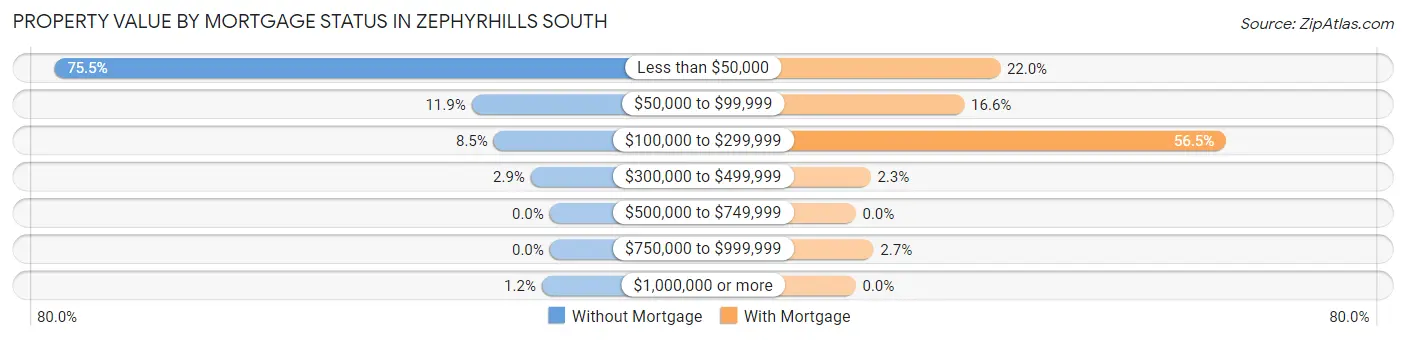
| Property Value | Without Mortgage | With Mortgage |
| Less than $50,000 | 1,256 (75.5%) | 97 (22.0%) |
| $50,000 to $99,999 | 198 (11.9%) | 73 (16.6%) |
| $100,000 to $299,999 | 142 (8.5%) | 249 (56.5%) |
| $300,000 to $499,999 | 48 (2.9%) | 10 (2.3%) |
| $500,000 to $749,999 | 0 (0.0%) | 0 (0.0%) |
| $750,000 to $999,999 | 0 (0.0%) | 12 (2.7%) |
| $1,000,000 or more | 20 (1.2%) | 0 (0.0%) |
| Total | 1,664 (100.0%) | 441 (100.0%) |
Household Income by Mortgage Status in Zephyrhills South
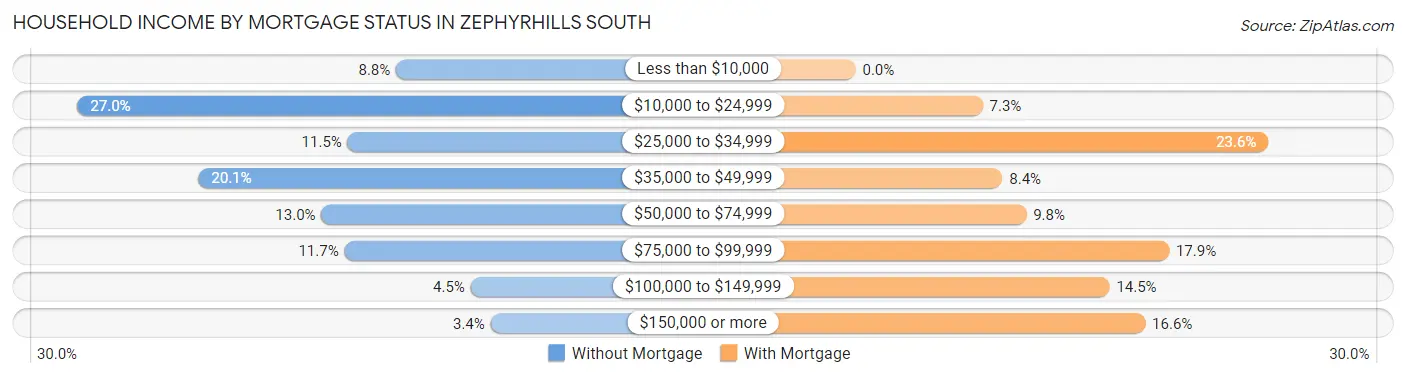
| Household Income | Without Mortgage | With Mortgage |
| Less than $10,000 | 146 (8.8%) | 0 (0.0%) |
| $10,000 to $24,999 | 449 (27.0%) | 32 (7.3%) |
| $25,000 to $34,999 | 192 (11.5%) | 104 (23.6%) |
| $35,000 to $49,999 | 334 (20.1%) | 37 (8.4%) |
| $50,000 to $74,999 | 217 (13.0%) | 43 (9.8%) |
| $75,000 to $99,999 | 195 (11.7%) | 79 (17.9%) |
| $100,000 to $149,999 | 75 (4.5%) | 64 (14.5%) |
| $150,000 or more | 56 (3.4%) | 73 (16.6%) |
| Total | 1,664 (100.0%) | 441 (100.0%) |
Property Value to Household Income Ratio in Zephyrhills South
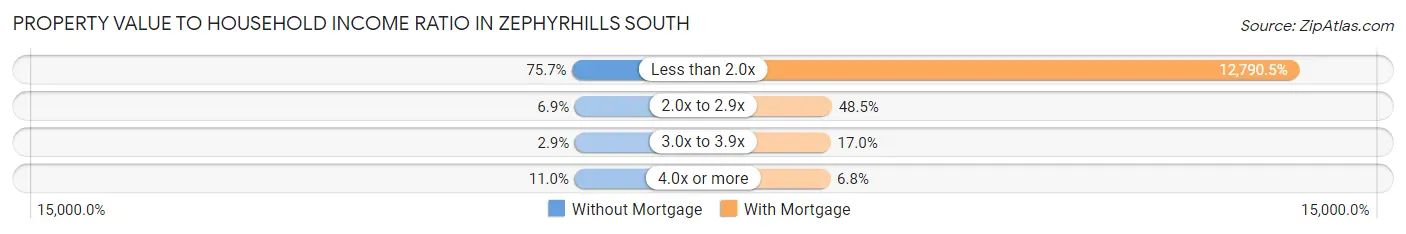
| Value-to-Income Ratio | Without Mortgage | With Mortgage |
| Less than 2.0x | 1,259 (75.7%) | 56,406 (12,790.5%) |
| 2.0x to 2.9x | 114 (6.9%) | 214 (48.5%) |
| 3.0x to 3.9x | 49 (2.9%) | 75 (17.0%) |
| 4.0x or more | 183 (11.0%) | 30 (6.8%) |
| Total | 1,664 (100.0%) | 441 (100.0%) |
Real Estate Taxes by Mortgage Status in Zephyrhills South
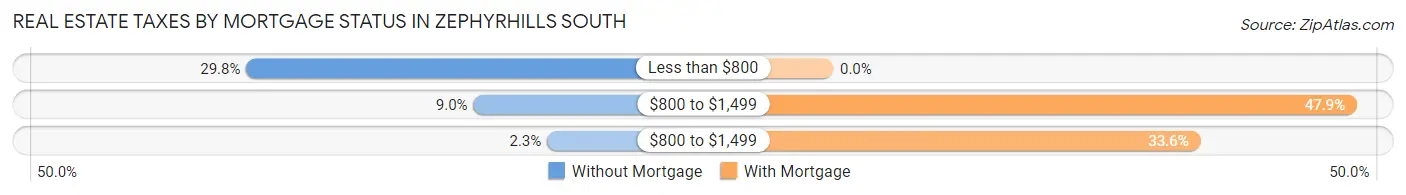
| Property Taxes | Without Mortgage | With Mortgage |
| Less than $800 | 495 (29.7%) | 0 (0.0%) |
| $800 to $1,499 | 150 (9.0%) | 211 (47.8%) |
| $800 to $1,499 | 38 (2.3%) | 148 (33.6%) |
| Total | 1,664 (100.0%) | 441 (100.0%) |
Health & Disability in Zephyrhills South
Health Insurance Coverage by Age in Zephyrhills South
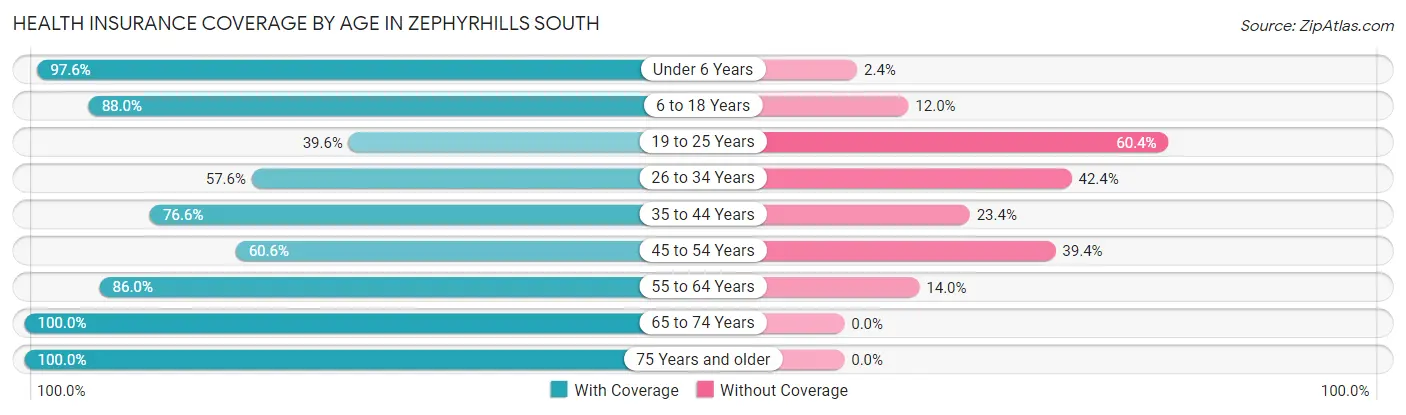
| Age Bracket | With Coverage | Without Coverage |
| Under 6 Years | 327 (97.6%) | 8 (2.4%) |
| 6 to 18 Years | 493 (88.0%) | 67 (12.0%) |
| 19 to 25 Years | 125 (39.6%) | 191 (60.4%) |
| 26 to 34 Years | 306 (57.6%) | 225 (42.4%) |
| 35 to 44 Years | 262 (76.6%) | 80 (23.4%) |
| 45 to 54 Years | 191 (60.6%) | 124 (39.4%) |
| 55 to 64 Years | 602 (86.0%) | 98 (14.0%) |
| 65 to 74 Years | 1,069 (100.0%) | 0 (0.0%) |
| 75 Years and older | 1,302 (100.0%) | 0 (0.0%) |
| Total | 4,677 (85.5%) | 793 (14.5%) |
Health Insurance Coverage by Citizenship Status in Zephyrhills South
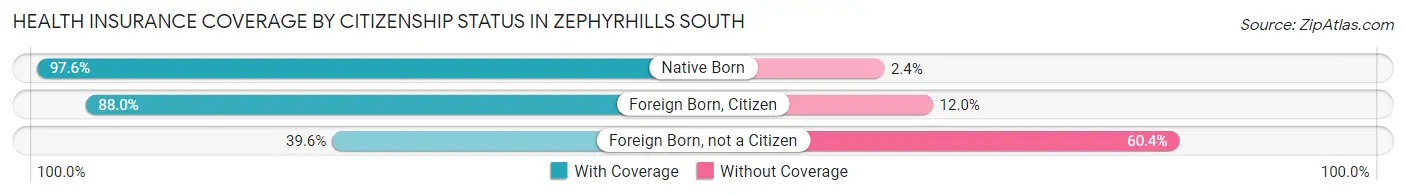
| Citizenship Status | With Coverage | Without Coverage |
| Native Born | 327 (97.6%) | 8 (2.4%) |
| Foreign Born, Citizen | 493 (88.0%) | 67 (12.0%) |
| Foreign Born, not a Citizen | 125 (39.6%) | 191 (60.4%) |
Health Insurance Coverage by Household Income in Zephyrhills South
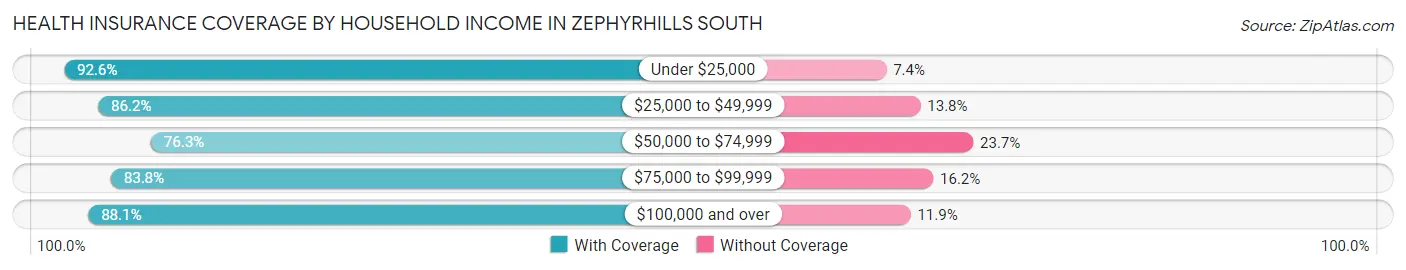
| Household Income | With Coverage | Without Coverage |
| Under $25,000 | 1,102 (92.6%) | 88 (7.4%) |
| $25,000 to $49,999 | 1,420 (86.2%) | 227 (13.8%) |
| $50,000 to $74,999 | 777 (76.3%) | 241 (23.7%) |
| $75,000 to $99,999 | 876 (83.8%) | 169 (16.2%) |
| $100,000 and over | 502 (88.1%) | 68 (11.9%) |
Public vs Private Health Insurance Coverage by Age in Zephyrhills South
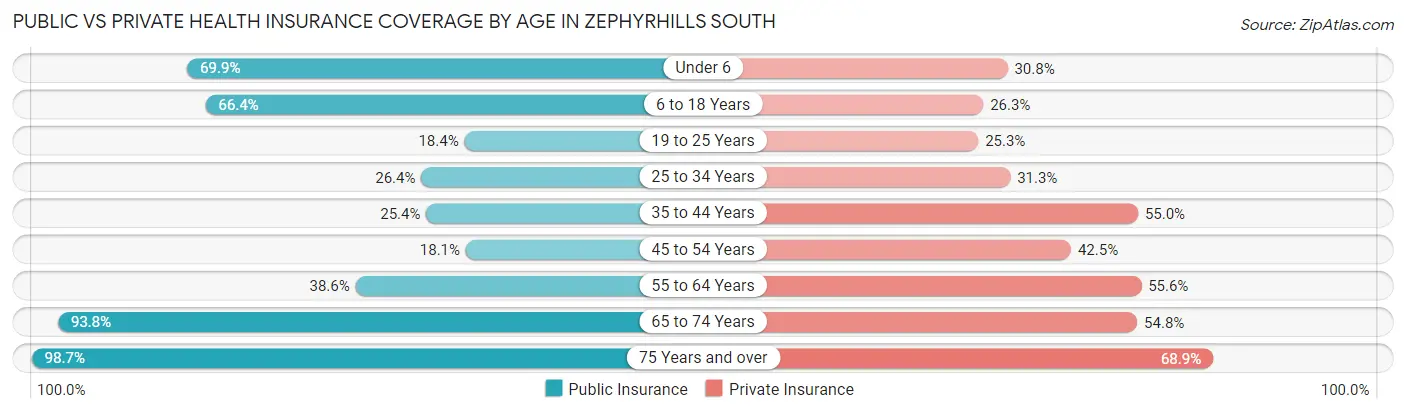
| Age Bracket | Public Insurance | Private Insurance |
| Under 6 | 234 (69.9%) | 103 (30.7%) |
| 6 to 18 Years | 372 (66.4%) | 147 (26.3%) |
| 19 to 25 Years | 58 (18.3%) | 80 (25.3%) |
| 25 to 34 Years | 140 (26.4%) | 166 (31.3%) |
| 35 to 44 Years | 87 (25.4%) | 188 (55.0%) |
| 45 to 54 Years | 57 (18.1%) | 134 (42.5%) |
| 55 to 64 Years | 270 (38.6%) | 389 (55.6%) |
| 65 to 74 Years | 1,003 (93.8%) | 586 (54.8%) |
| 75 Years and over | 1,285 (98.7%) | 897 (68.9%) |
| Total | 3,506 (64.1%) | 2,690 (49.2%) |
Disability Status by Sex by Age in Zephyrhills South
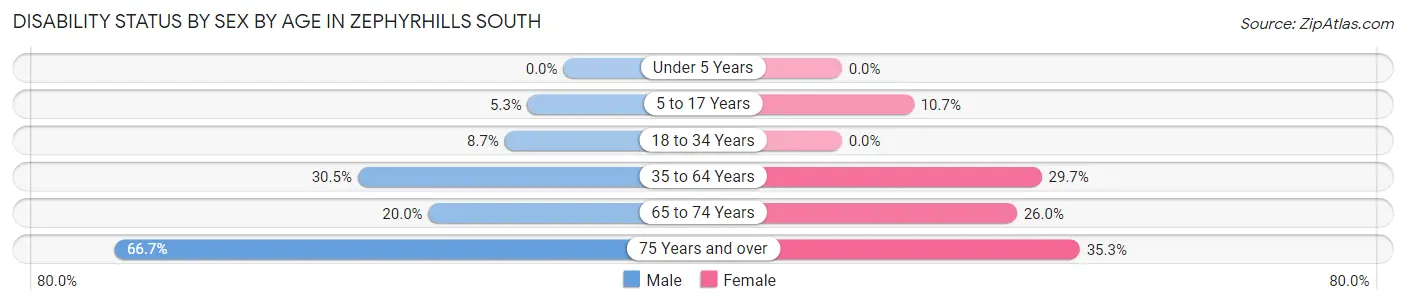
| Age Bracket | Male | Female |
| Under 5 Years | 0 (0.0%) | 0 (0.0%) |
| 5 to 17 Years | 17 (5.3%) | 25 (10.7%) |
| 18 to 34 Years | 44 (8.7%) | 0 (0.0%) |
| 35 to 64 Years | 189 (30.5%) | 219 (29.7%) |
| 65 to 74 Years | 97 (20.0%) | 152 (26.0%) |
| 75 Years and over | 423 (66.7%) | 236 (35.3%) |
Disability Class by Sex by Age in Zephyrhills South
Disability Class: Hearing Difficulty
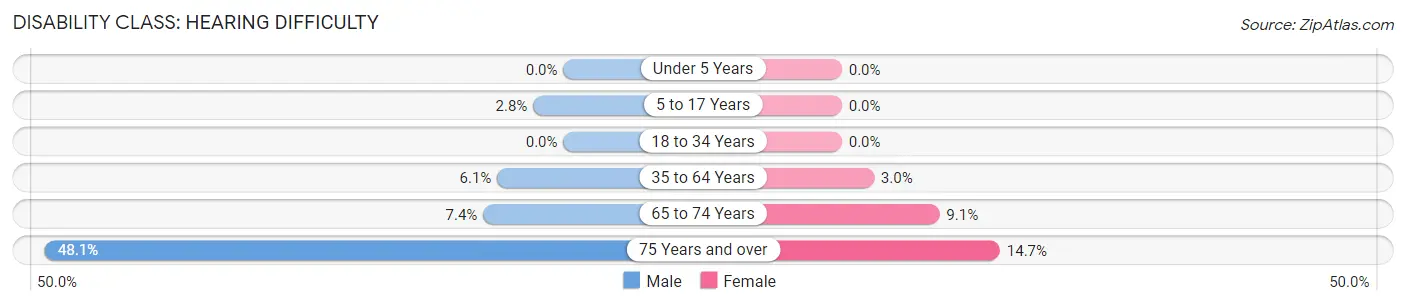
| Age Bracket | Male | Female |
| Under 5 Years | 0 (0.0%) | 0 (0.0%) |
| 5 to 17 Years | 9 (2.8%) | 0 (0.0%) |
| 18 to 34 Years | 0 (0.0%) | 0 (0.0%) |
| 35 to 64 Years | 38 (6.1%) | 22 (3.0%) |
| 65 to 74 Years | 36 (7.4%) | 53 (9.1%) |
| 75 Years and over | 305 (48.1%) | 98 (14.7%) |
Disability Class: Vision Difficulty
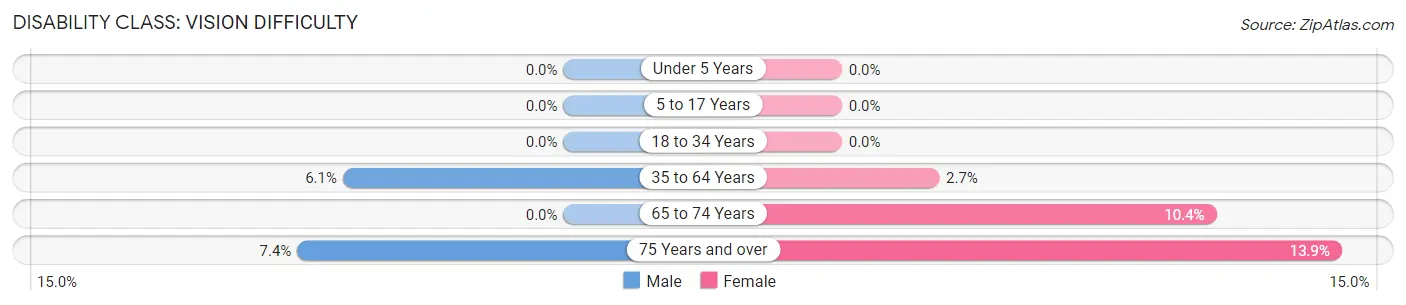
| Age Bracket | Male | Female |
| Under 5 Years | 0 (0.0%) | 0 (0.0%) |
| 5 to 17 Years | 0 (0.0%) | 0 (0.0%) |
| 18 to 34 Years | 0 (0.0%) | 0 (0.0%) |
| 35 to 64 Years | 38 (6.1%) | 20 (2.7%) |
| 65 to 74 Years | 0 (0.0%) | 61 (10.4%) |
| 75 Years and over | 47 (7.4%) | 93 (13.9%) |
Disability Class: Cognitive Difficulty
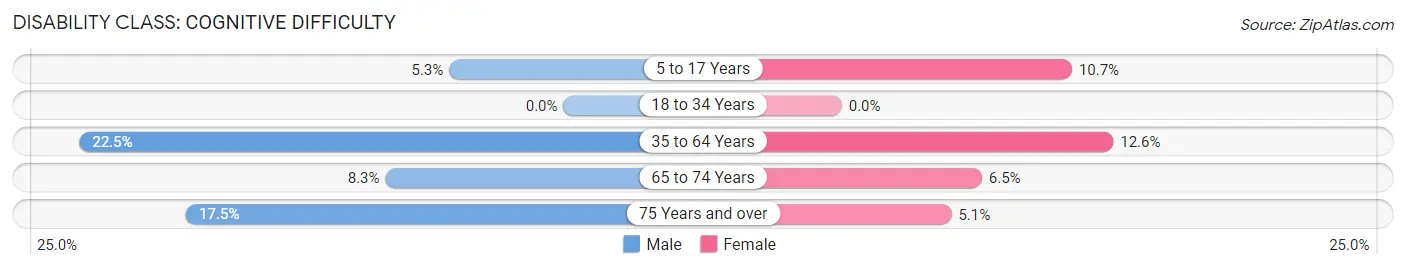
| Age Bracket | Male | Female |
| 5 to 17 Years | 17 (5.3%) | 25 (10.7%) |
| 18 to 34 Years | 0 (0.0%) | 0 (0.0%) |
| 35 to 64 Years | 139 (22.5%) | 93 (12.6%) |
| 65 to 74 Years | 40 (8.3%) | 38 (6.5%) |
| 75 Years and over | 111 (17.5%) | 34 (5.1%) |
Disability Class: Ambulatory Difficulty
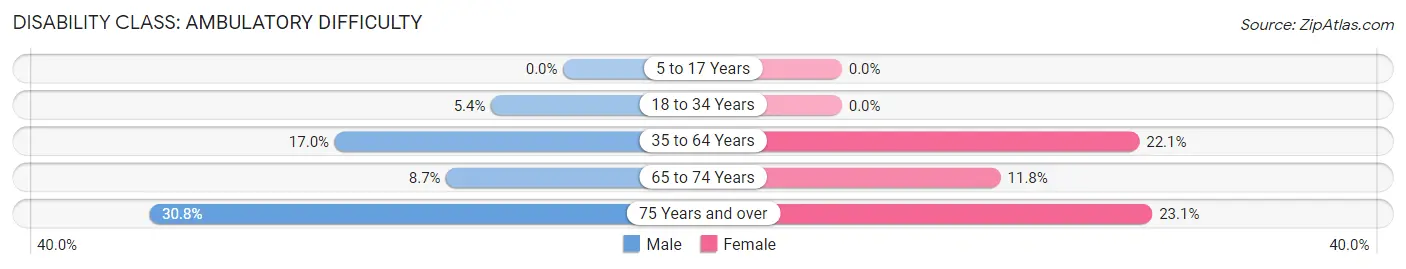
| Age Bracket | Male | Female |
| 5 to 17 Years | 0 (0.0%) | 0 (0.0%) |
| 18 to 34 Years | 27 (5.3%) | 0 (0.0%) |
| 35 to 64 Years | 105 (17.0%) | 163 (22.1%) |
| 65 to 74 Years | 42 (8.7%) | 69 (11.8%) |
| 75 Years and over | 195 (30.8%) | 154 (23.1%) |
Disability Class: Self-Care Difficulty
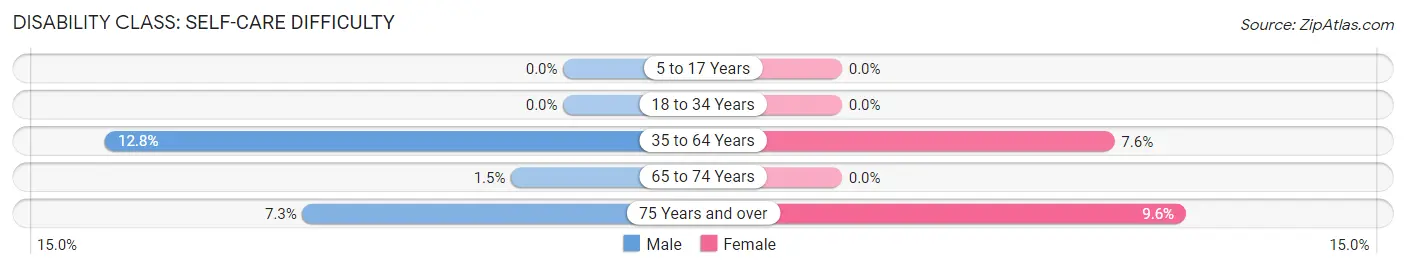
| Age Bracket | Male | Female |
| 5 to 17 Years | 0 (0.0%) | 0 (0.0%) |
| 18 to 34 Years | 0 (0.0%) | 0 (0.0%) |
| 35 to 64 Years | 79 (12.8%) | 56 (7.6%) |
| 65 to 74 Years | 7 (1.5%) | 0 (0.0%) |
| 75 Years and over | 46 (7.3%) | 64 (9.6%) |
Technology Access in Zephyrhills South
Computing Device Access in Zephyrhills South
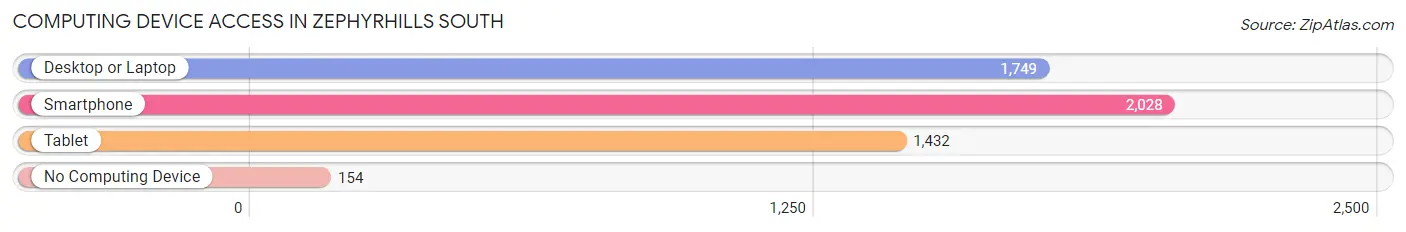
| Device Type | # Households | % Households |
| Desktop or Laptop | 1,749 | 68.0% |
| Smartphone | 2,028 | 78.8% |
| Tablet | 1,432 | 55.6% |
| No Computing Device | 154 | 6.0% |
| Total | 2,573 | 100.0% |
Internet Access in Zephyrhills South
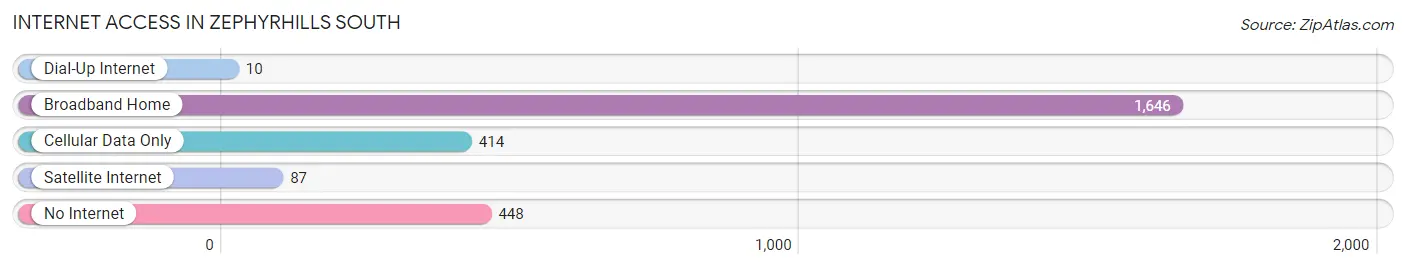
| Internet Type | # Households | % Households |
| Dial-Up Internet | 10 | 0.4% |
| Broadband Home | 1,646 | 64.0% |
| Cellular Data Only | 414 | 16.1% |
| Satellite Internet | 87 | 3.4% |
| No Internet | 448 | 17.4% |
| Total | 2,573 | 100.0% |
Zephyrhills South Summary
Zephyrhills South is a census-designated place (CDP) located in Pasco County, Florida, United States. The population was 4,845 at the 2010 census. It is part of the Tampa-St. Petersburg-Clearwater Metropolitan Statistical Area.
History
The area that is now Zephyrhills South was first settled in the late 19th century by settlers from the north. The area was originally known as "Zephyrhills" and was part of Hillsborough County. In the early 20th century, the area was annexed by Pasco County and renamed "Zephyrhills South".
Geography
Zephyrhills South is located at 28 14 25 North 82 14 45 West 28 240278 82 245833
According to the United States Census Bureau, the CDP has a total area of 4.2 square miles (10.8 km2), all land.
Economy
The economy of Zephyrhills South is largely based on agriculture and tourism. The area is home to several farms, including citrus, vegetable, and dairy farms. The area is also home to several tourist attractions, including the Zephyrhills Museum of Natural History and the Zephyrhills Historical Society.
Demographics
As of the census of 2000, there were 4,845 people, 1,845 households, and 1,323 families residing in the CDP. The population density was 1,154.3 people per square mile (446.7/km2). There were 1,945 housing units at an average density of 462.2/sq mi (178.3/km2). The racial makeup of the CDP was 94.2% White, 2.2% African American, 0.3% Native American, 0.7% Asian, 0.1% Pacific Islander, 1.2% from other races, and 1.4% from two or more races. Hispanic or Latino of any race were 4.7% of the population.
There were 1,845 households, out of which 28.2% had children under the age of 18 living with them, 54.2% were married couples living together, 11.2% had a female householder with no husband present, and 29.7% were non-families. 24.2% of all households were made up of individuals, and 11.2% had someone living alone who was 65 years of age or older. The average household size was 2.60 and the average family size was 3.08.
In the CDP, the population was spread out, with 24.2% under the age of 18, 8.2% from 18 to 24, 25.7% from 25 to 44, 24.2% from 45 to 64, and 17.7% who were 65 years of age or older. The median age was 39 years. For every 100 females, there were 97.2 males. For every 100 females age 18 and over, there were 94.2 males.
The median income for a household in the CDP was $32,917, and the median income for a family was $37,917. Males had a median income of $30,000 versus $21,250 for females. The per capita income for the CDP was $15,917. About 9.2% of families and 11.2% of the population were below the poverty line, including 15.2% of those under age 18 and 8.2% of those age 65 or over.
Common Questions
What is Per Capita Income in Zephyrhills South?
Per Capita income in Zephyrhills South is $23,824.
What is the Median Family Income in Zephyrhills South?
Median Family Income in Zephyrhills South is $50,926.
What is the Median Household income in Zephyrhills South?
Median Household Income in Zephyrhills South is $39,684.
What is Income or Wage Gap in Zephyrhills South?
Income or Wage Gap in Zephyrhills South is 25.0%.
Women in Zephyrhills South earn 75.0 cents for every dollar earned by a man.
What is Inequality or Gini Index in Zephyrhills South?
Inequality or Gini Index in Zephyrhills South is 0.40.
What is the Total Population of Zephyrhills South?
Total Population of Zephyrhills South is 5,470.
What is the Total Male Population of Zephyrhills South?
Total Male Population of Zephyrhills South is 2,759.
What is the Total Female Population of Zephyrhills South?
Total Female Population of Zephyrhills South is 2,711.
What is the Ratio of Males per 100 Females in Zephyrhills South?
There are 101.77 Males per 100 Females in Zephyrhills South.
What is the Ratio of Females per 100 Males in Zephyrhills South?
There are 98.26 Females per 100 Males in Zephyrhills South.
What is the Median Population Age in Zephyrhills South?
Median Population Age in Zephyrhills South is 60.3 Years.
What is the Average Family Size in Zephyrhills South
Average Family Size in Zephyrhills South is 2.7 People.
What is the Average Household Size in Zephyrhills South
Average Household Size in Zephyrhills South is 2.1 People.
How Large is the Labor Force in Zephyrhills South?
There are 1,557 People in the Labor Forcein in Zephyrhills South.
What is the Percentage of People in the Labor Force in Zephyrhills South?
32.6% of People are in the Labor Force in Zephyrhills South.
What is the Unemployment Rate in Zephyrhills South?
Unemployment Rate in Zephyrhills South is 8.0%.