Fort Pierce South, FL Map & Demographics
Fort Pierce South Map
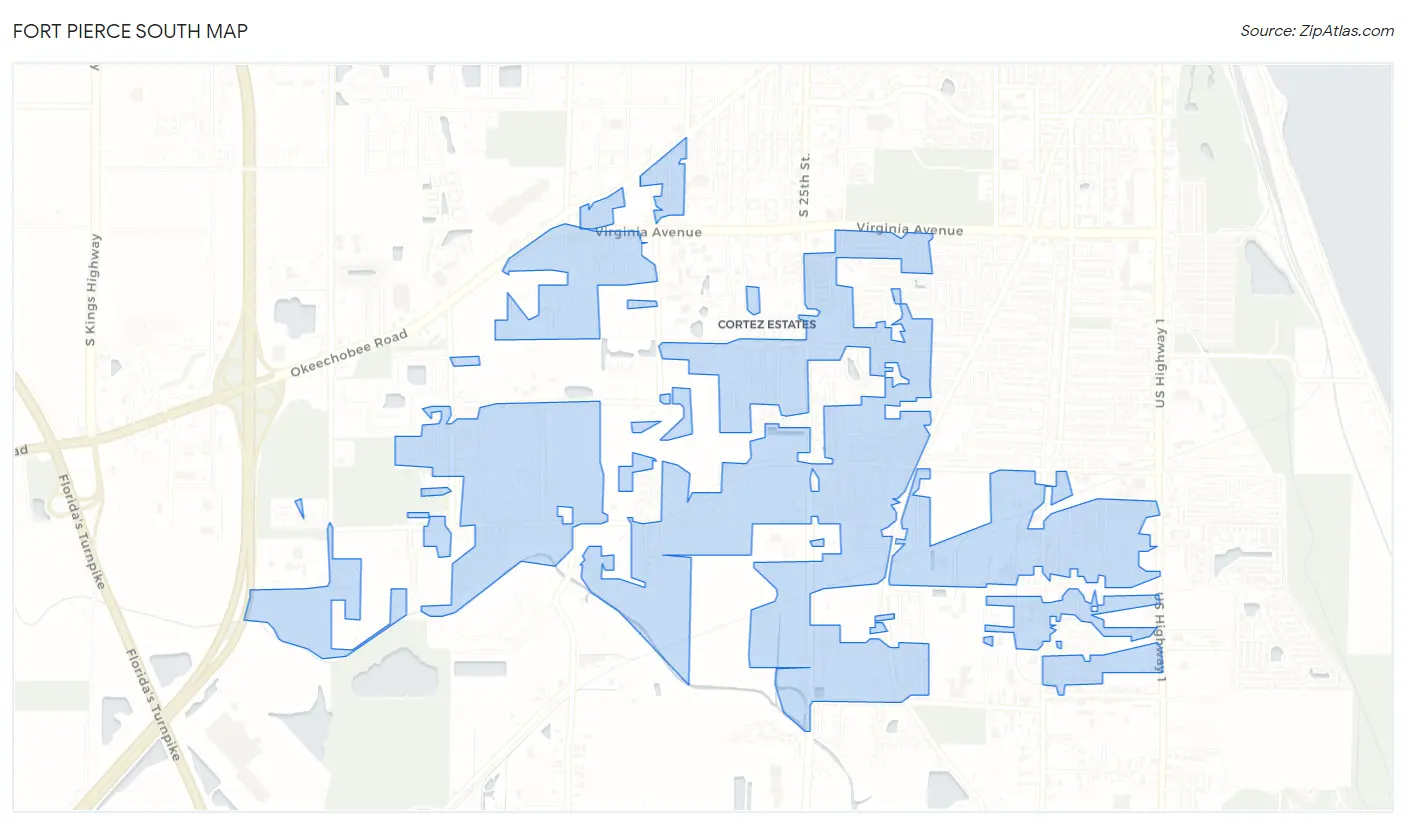
Fort Pierce South Overview
$27,152
PER CAPITA INCOME
$63,184
AVG FAMILY INCOME
$53,302
AVG HOUSEHOLD INCOME
19.1%
WAGE / INCOME GAP [ % ]
80.9¢/ $1
WAGE / INCOME GAP [ $ ]
0.45
INEQUALITY / GINI INDEX
5,314
TOTAL POPULATION
2,490
MALE POPULATION
2,824
FEMALE POPULATION
88.17
MALES / 100 FEMALES
113.41
FEMALES / 100 MALES
39.0
MEDIAN AGE
3.3
AVG FAMILY SIZE
2.5
AVG HOUSEHOLD SIZE
2,630
LABOR FORCE [ PEOPLE ]
60.6%
PERCENT IN LABOR FORCE
1.5%
UNEMPLOYMENT RATE
Income in Fort Pierce South
Income Overview in Fort Pierce South
Per Capita Income in Fort Pierce South is $27,152, while median incomes of families and households are $63,184 and $53,302 respectively.
| Characteristic | Number | Measure |
| Per Capita Income | 5,314 | $27,152 |
| Median Family Income | 1,233 | $63,184 |
| Mean Family Income | 1,233 | $76,756 |
| Median Household Income | 2,156 | $53,302 |
| Mean Household Income | 2,156 | $64,218 |
| Income Deficit | 1,233 | $0 |
| Wage / Income Gap (%) | 5,314 | 19.10% |
| Wage / Income Gap ($) | 5,314 | 80.90¢ per $1 |
| Gini / Inequality Index | 5,314 | 0.45 |
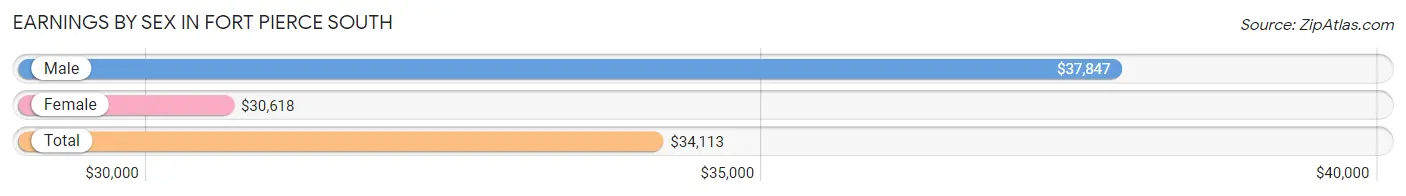
Earnings by Sex in Fort Pierce South
Average Earnings in Fort Pierce South are $34,113, $37,847 for men and $30,618 for women, a difference of 19.1%.
| Sex | Number | Average Earnings |
| Male | 1,608 (60.0%) | $37,847 |
| Female | 1,073 (40.0%) | $30,618 |
| Total | 2,681 (100.0%) | $34,113 |
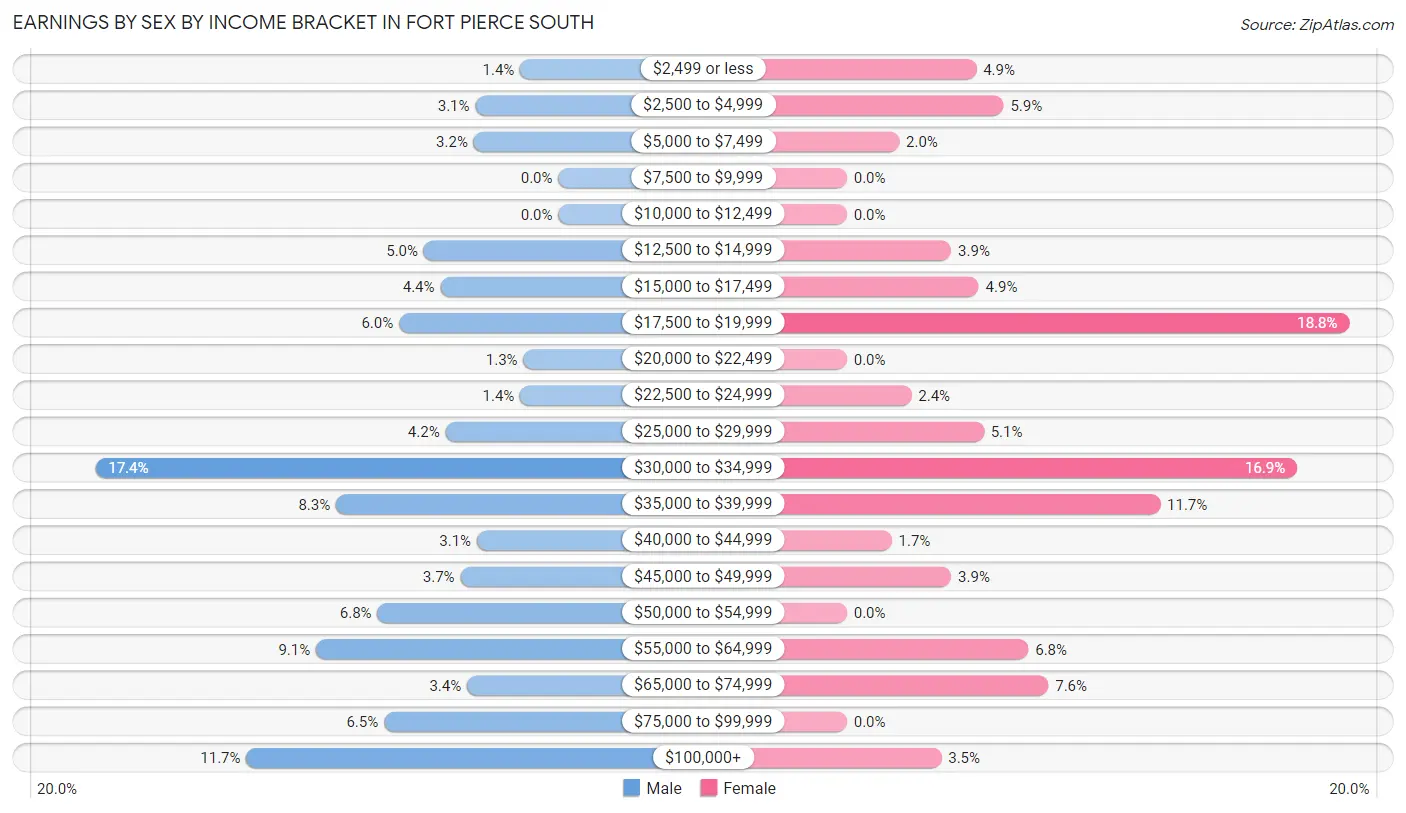
Earnings by Sex by Income Bracket in Fort Pierce South
The most common earnings brackets in Fort Pierce South are $30,000 to $34,999 for men (279 | 17.3%) and $17,500 to $19,999 for women (202 | 18.8%).
| Income | Male | Female |
| $2,499 or less | 23 (1.4%) | 52 (4.9%) |
| $2,500 to $4,999 | 50 (3.1%) | 63 (5.9%) |
| $5,000 to $7,499 | 51 (3.2%) | 21 (2.0%) |
| $7,500 to $9,999 | 0 (0.0%) | 0 (0.0%) |
| $10,000 to $12,499 | 0 (0.0%) | 0 (0.0%) |
| $12,500 to $14,999 | 81 (5.0%) | 42 (3.9%) |
| $15,000 to $17,499 | 71 (4.4%) | 53 (4.9%) |
| $17,500 to $19,999 | 96 (6.0%) | 202 (18.8%) |
| $20,000 to $22,499 | 21 (1.3%) | 0 (0.0%) |
| $22,500 to $24,999 | 23 (1.4%) | 26 (2.4%) |
| $25,000 to $29,999 | 68 (4.2%) | 55 (5.1%) |
| $30,000 to $34,999 | 279 (17.3%) | 181 (16.9%) |
| $35,000 to $39,999 | 134 (8.3%) | 126 (11.7%) |
| $40,000 to $44,999 | 49 (3.0%) | 18 (1.7%) |
| $45,000 to $49,999 | 59 (3.7%) | 42 (3.9%) |
| $50,000 to $54,999 | 109 (6.8%) | 0 (0.0%) |
| $55,000 to $64,999 | 146 (9.1%) | 73 (6.8%) |
| $65,000 to $74,999 | 55 (3.4%) | 81 (7.5%) |
| $75,000 to $99,999 | 105 (6.5%) | 0 (0.0%) |
| $100,000+ | 188 (11.7%) | 38 (3.5%) |
| Total | 1,608 (100.0%) | 1,073 (100.0%) |
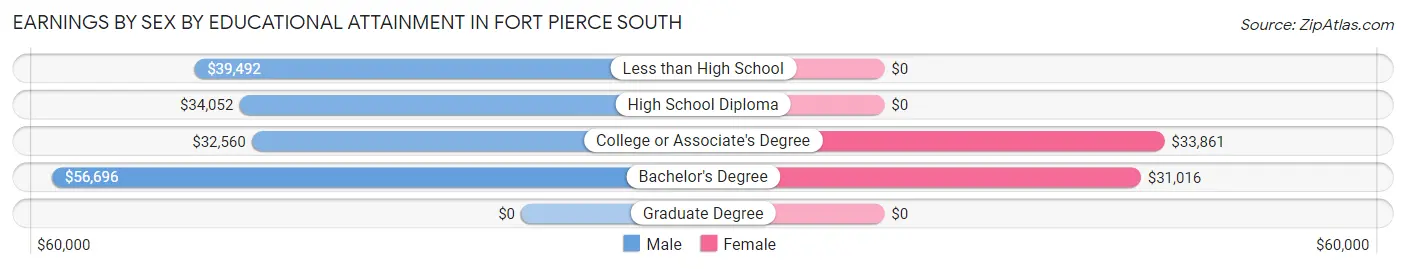
Earnings by Sex by Educational Attainment in Fort Pierce South
Average earnings in Fort Pierce South are $39,479 for men and $30,618 for women, a difference of 22.4%. Men with an educational attainment of bachelor's degree enjoy the highest average annual earnings of $56,696, while those with college or associate's degree education earn the least with $32,560. Women with an educational attainment of college or associate's degree earn the most with the average annual earnings of $33,861, while those with bachelor's degree education have the smallest earnings of $31,016.
| Educational Attainment | Male Income | Female Income |
| Less than High School | $39,492 | $0 |
| High School Diploma | $34,052 | $0 |
| College or Associate's Degree | $32,560 | $33,861 |
| Bachelor's Degree | $56,696 | $31,016 |
| Graduate Degree | - | - |
| Total | $39,479 | $30,618 |
Family Income in Fort Pierce South
Family Income Brackets in Fort Pierce South
According to the Fort Pierce South family income data, there are 354 families falling into the $50,000 to $74,999 income range, which is the most common income bracket and makes up 28.7% of all families. Conversely, the $15,000 to $24,999 income bracket is the least frequent group with only 14 families (1.1%) belonging to this category.
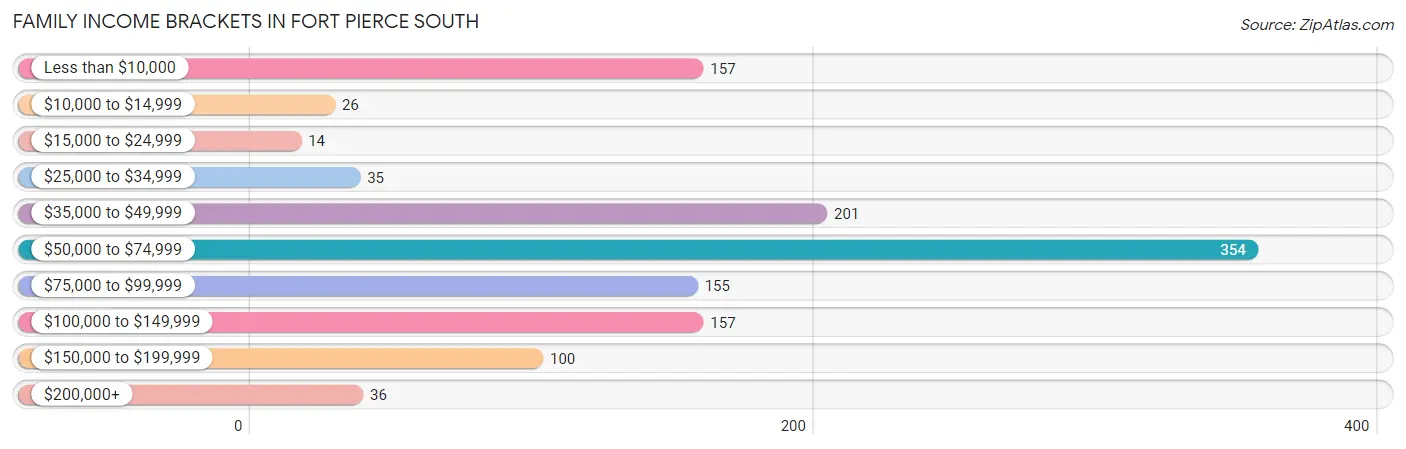
| Income Bracket | # Families | % Families |
| Less than $10,000 | 157 | 12.7% |
| $10,000 to $14,999 | 26 | 2.1% |
| $15,000 to $24,999 | 14 | 1.1% |
| $25,000 to $34,999 | 35 | 2.8% |
| $35,000 to $49,999 | 201 | 16.3% |
| $50,000 to $74,999 | 354 | 28.7% |
| $75,000 to $99,999 | 155 | 12.6% |
| $100,000 to $149,999 | 157 | 12.7% |
| $150,000 to $199,999 | 100 | 8.1% |
| $200,000+ | 36 | 2.9% |
Family Income by Famaliy Size in Fort Pierce South
3-person families (427 | 34.6%) account for the highest median family income in Fort Pierce South with $88,341 per family, while 2-person families (393 | 31.9%) have the highest median income of $31,412 per family member.
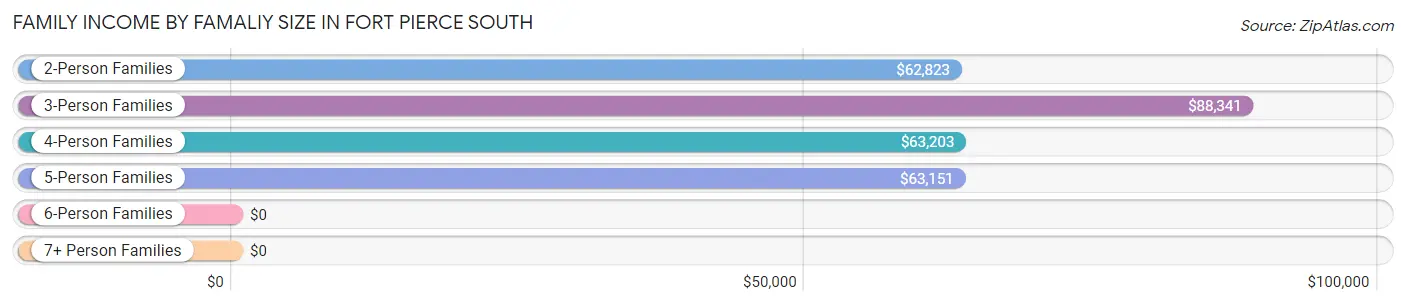
| Income Bracket | # Families | Median Income |
| 2-Person Families | 393 (31.9%) | $62,823 |
| 3-Person Families | 427 (34.6%) | $88,341 |
| 4-Person Families | 254 (20.6%) | $63,203 |
| 5-Person Families | 159 (12.9%) | $63,151 |
| 6-Person Families | 0 (0.0%) | $0 |
| 7+ Person Families | 0 (0.0%) | $0 |
| Total | 1,233 (100.0%) | $63,184 |
Family Income by Number of Earners in Fort Pierce South
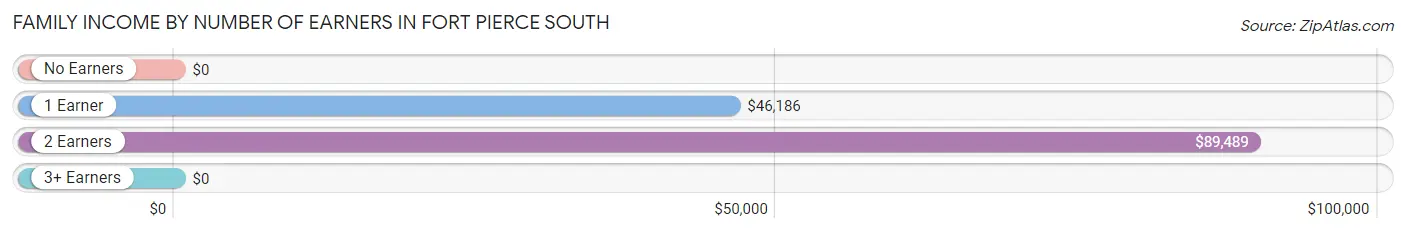
| Number of Earners | # Families | Median Income |
| No Earners | 119 (9.7%) | $0 |
| 1 Earner | 502 (40.7%) | $46,186 |
| 2 Earners | 487 (39.5%) | $89,489 |
| 3+ Earners | 125 (10.1%) | $0 |
| Total | 1,233 (100.0%) | $63,184 |
Household Income in Fort Pierce South
Household Income Brackets in Fort Pierce South
With 433 households falling in the category, the $50,000 to $74,999 income range is the most frequent in Fort Pierce South, accounting for 20.1% of all households. In contrast, only 37 households (1.7%) fall into the $200,000+ income bracket, making it the least populous group.
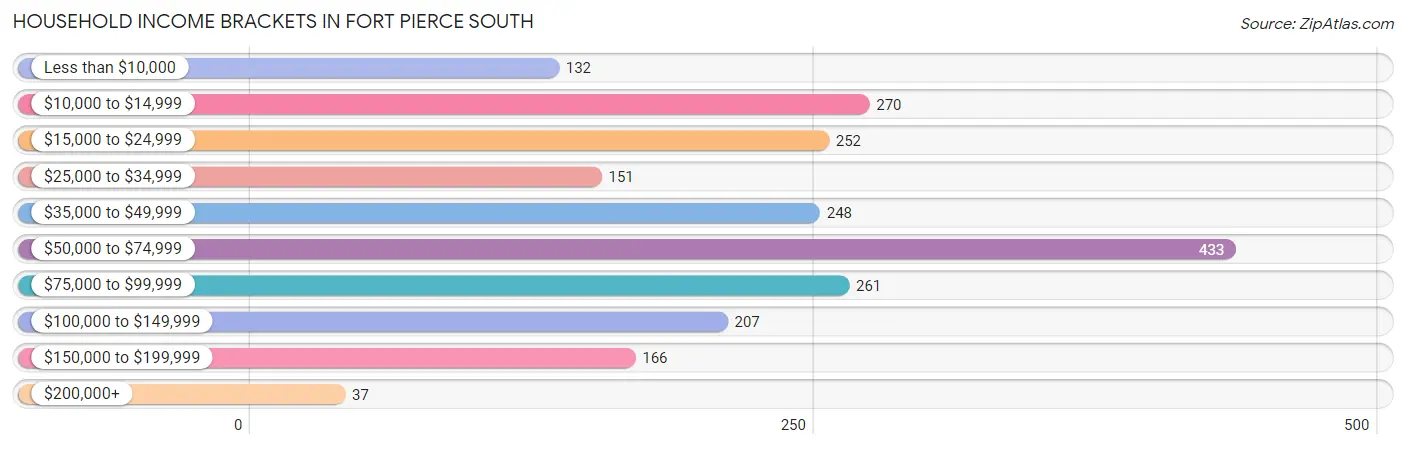
| Income Bracket | # Households | % Households |
| Less than $10,000 | 132 | 6.1% |
| $10,000 to $14,999 | 270 | 12.5% |
| $15,000 to $24,999 | 252 | 11.7% |
| $25,000 to $34,999 | 151 | 7.0% |
| $35,000 to $49,999 | 248 | 11.5% |
| $50,000 to $74,999 | 433 | 20.1% |
| $75,000 to $99,999 | 261 | 12.1% |
| $100,000 to $149,999 | 207 | 9.6% |
| $150,000 to $199,999 | 166 | 7.7% |
| $200,000+ | 37 | 1.7% |
Household Income by Householder Age in Fort Pierce South
The median household income in Fort Pierce South is $53,302, with the highest median household income of $63,521 found in the 25 to 44 years age bracket for the primary householder. A total of 858 households (39.8%) fall into this category.
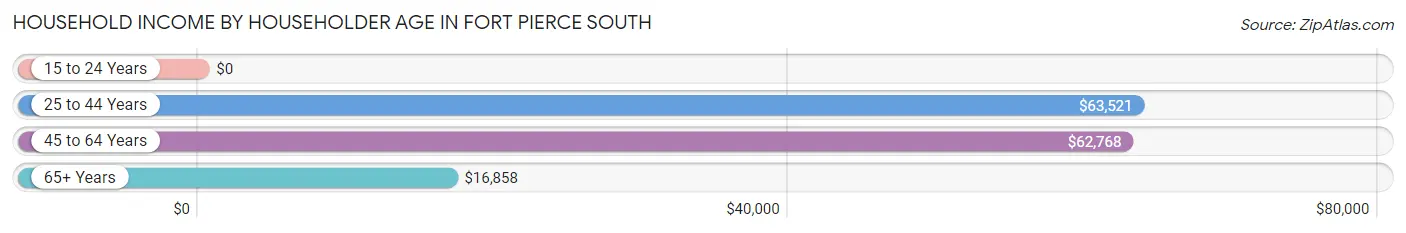
| Income Bracket | # Households | Median Income |
| 15 to 24 Years | 0 (0.0%) | $0 |
| 25 to 44 Years | 858 (39.8%) | $63,521 |
| 45 to 64 Years | 590 (27.4%) | $62,768 |
| 65+ Years | 708 (32.8%) | $16,858 |
| Total | 2,156 (100.0%) | $53,302 |
Poverty in Fort Pierce South
Income Below Poverty by Sex and Age in Fort Pierce South
With 10.4% poverty level for males and 15.3% for females among the residents of Fort Pierce South, under 5 year old males and 16 and 17 year old females are the most vulnerable to poverty, with 19 males (100.0%) and 51 females (43.6%) in their respective age groups living below the poverty level.
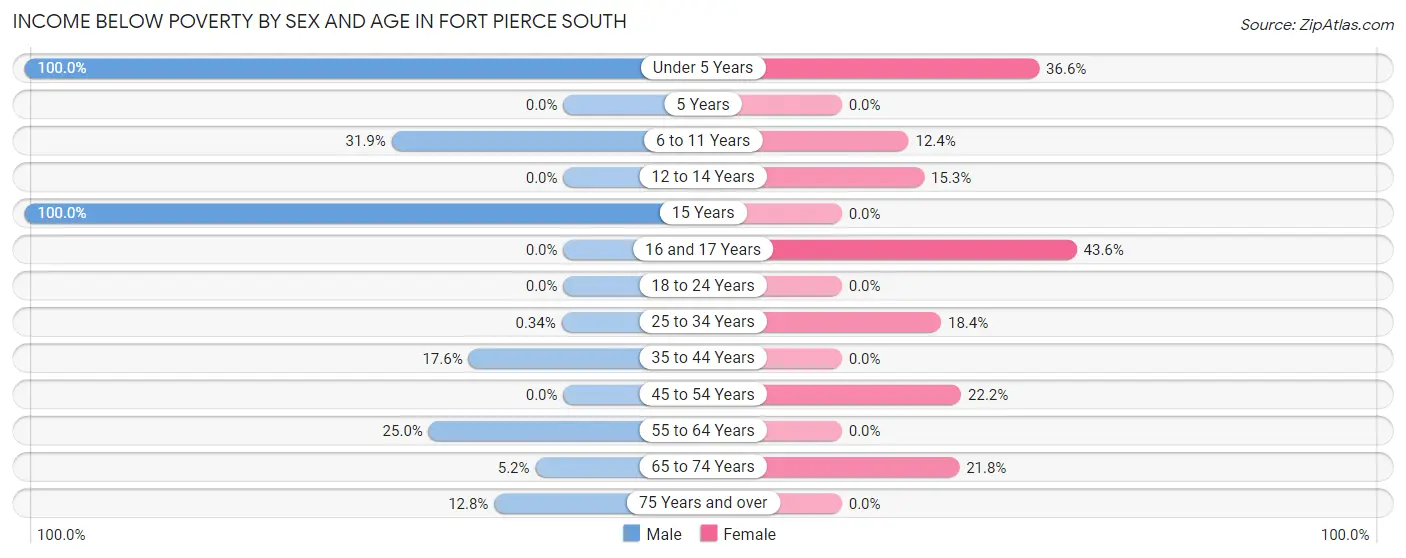
| Age Bracket | Male | Female |
| Under 5 Years | 19 (100.0%) | 63 (36.6%) |
| 5 Years | 0 (0.0%) | 0 (0.0%) |
| 6 to 11 Years | 51 (31.9%) | 43 (12.4%) |
| 12 to 14 Years | 0 (0.0%) | 22 (15.3%) |
| 15 Years | 23 (100.0%) | 0 (0.0%) |
| 16 and 17 Years | 0 (0.0%) | 51 (43.6%) |
| 18 to 24 Years | 0 (0.0%) | 0 (0.0%) |
| 25 to 34 Years | 2 (0.3%) | 77 (18.4%) |
| 35 to 44 Years | 90 (17.6%) | 0 (0.0%) |
| 45 to 54 Years | 0 (0.0%) | 107 (22.2%) |
| 55 to 64 Years | 39 (25.0%) | 0 (0.0%) |
| 65 to 74 Years | 16 (5.2%) | 68 (21.8%) |
| 75 Years and over | 19 (12.8%) | 0 (0.0%) |
| Total | 259 (10.4%) | 431 (15.3%) |
Income Above Poverty by Sex and Age in Fort Pierce South
According to the poverty statistics in Fort Pierce South, males aged 12 to 14 years and females aged 5 years are the age groups that are most secure financially, with 100.0% of males and 100.0% of females in these age groups living above the poverty line.
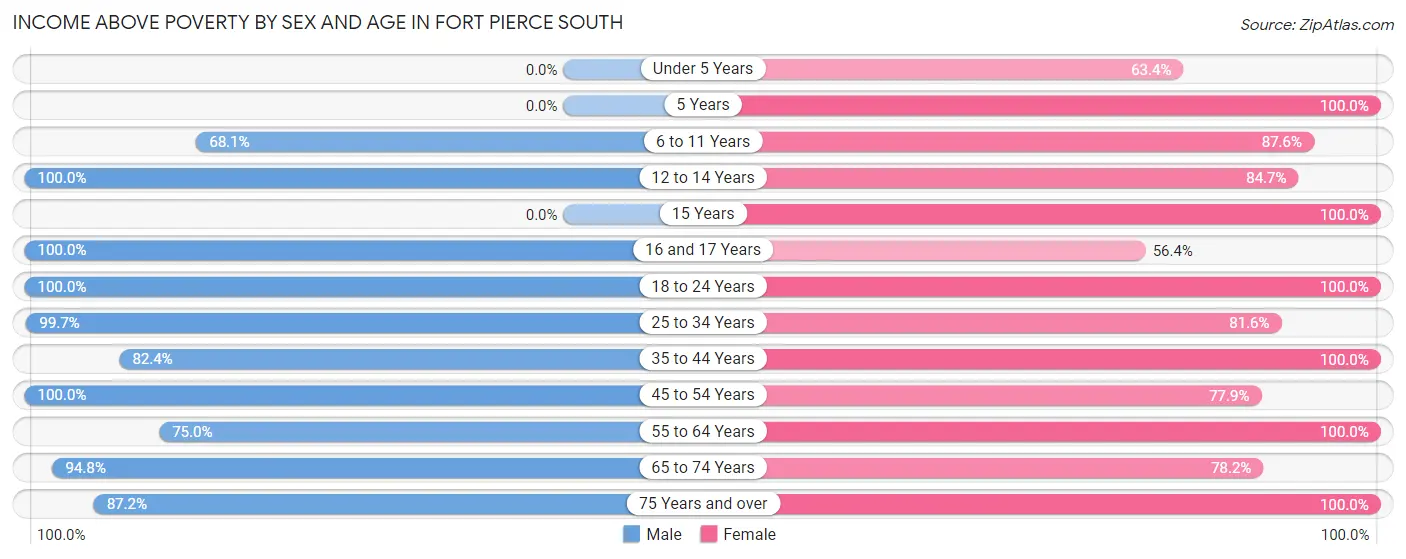
| Age Bracket | Male | Female |
| Under 5 Years | 0 (0.0%) | 109 (63.4%) |
| 5 Years | 0 (0.0%) | 21 (100.0%) |
| 6 to 11 Years | 109 (68.1%) | 304 (87.6%) |
| 12 to 14 Years | 66 (100.0%) | 122 (84.7%) |
| 15 Years | 0 (0.0%) | 22 (100.0%) |
| 16 and 17 Years | 51 (100.0%) | 66 (56.4%) |
| 18 to 24 Years | 164 (100.0%) | 64 (100.0%) |
| 25 to 34 Years | 593 (99.7%) | 341 (81.6%) |
| 35 to 44 Years | 421 (82.4%) | 248 (100.0%) |
| 45 to 54 Years | 289 (100.0%) | 376 (77.8%) |
| 55 to 64 Years | 117 (75.0%) | 233 (100.0%) |
| 65 to 74 Years | 292 (94.8%) | 244 (78.2%) |
| 75 Years and over | 129 (87.2%) | 229 (100.0%) |
| Total | 2,231 (89.6%) | 2,379 (84.7%) |
Income Below Poverty Among Married-Couple Families in Fort Pierce South
The poverty statistics for married-couple families in Fort Pierce South show that 7.9% or 64 of the total 807 families live below the poverty line. Families with 1 or 2 children have the highest poverty rate of 18.4%, comprising of 50 families. On the other hand, families with 3 or 4 children have the lowest poverty rate of 0.0%, which includes 0 families.
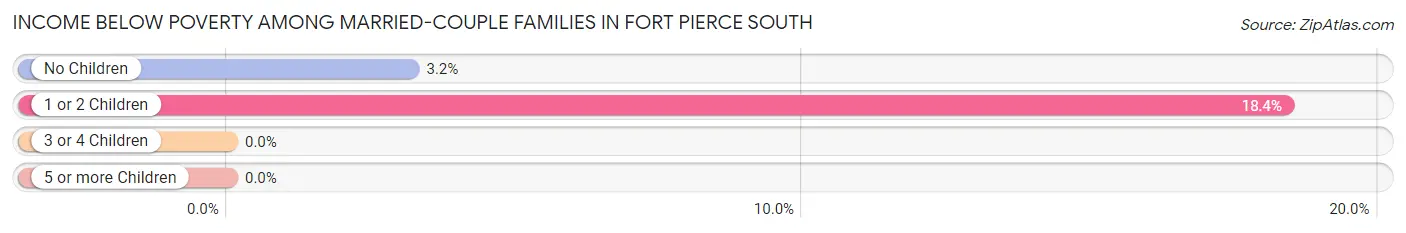
| Children | Above Poverty | Below Poverty |
| No Children | 429 (96.8%) | 14 (3.2%) |
| 1 or 2 Children | 222 (81.6%) | 50 (18.4%) |
| 3 or 4 Children | 92 (100.0%) | 0 (0.0%) |
| 5 or more Children | 0 (0.0%) | 0 (0.0%) |
| Total | 743 (92.1%) | 64 (7.9%) |
Income Below Poverty Among Single-Parent Households in Fort Pierce South
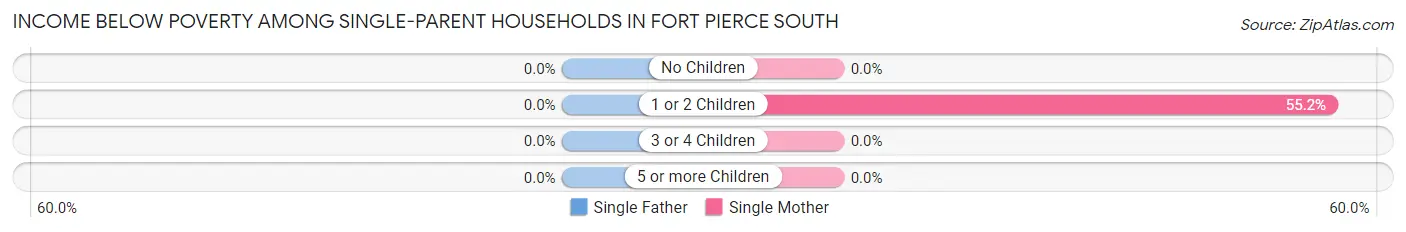
| Children | Single Father | Single Mother |
| No Children | 0 (0.0%) | 0 (0.0%) |
| 1 or 2 Children | 0 (0.0%) | 132 (55.2%) |
| 3 or 4 Children | 0 (0.0%) | 0 (0.0%) |
| 5 or more Children | 0 (0.0%) | 0 (0.0%) |
| Total | 0 (0.0%) | 132 (43.7%) |
Income Below Poverty Among Married-Couple vs Single-Parent Households in Fort Pierce South
The poverty data for Fort Pierce South shows that 64 of the married-couple family households (7.9%) and 132 of the single-parent households (31.0%) are living below the poverty level. Within the married-couple family households, those with 1 or 2 children have the highest poverty rate, with 50 households (18.4%) falling below the poverty line. Among the single-parent households, those with 1 or 2 children have the highest poverty rate, with 132 household (37.7%) living below poverty.
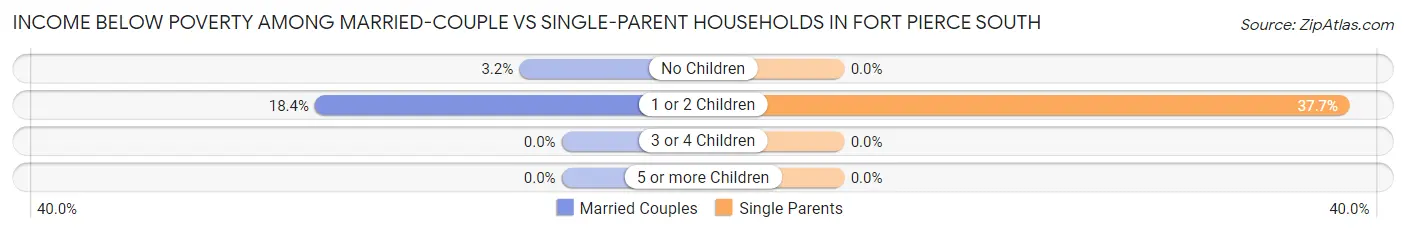
| Children | Married-Couple Families | Single-Parent Households |
| No Children | 14 (3.2%) | 0 (0.0%) |
| 1 or 2 Children | 50 (18.4%) | 132 (37.7%) |
| 3 or 4 Children | 0 (0.0%) | 0 (0.0%) |
| 5 or more Children | 0 (0.0%) | 0 (0.0%) |
| Total | 64 (7.9%) | 132 (31.0%) |
Race in Fort Pierce South
The most populous races in Fort Pierce South are White / Caucasian (3,872 | 72.9%), Hispanic or Latino (1,725 | 32.5%), and Black / African American (666 | 12.5%).
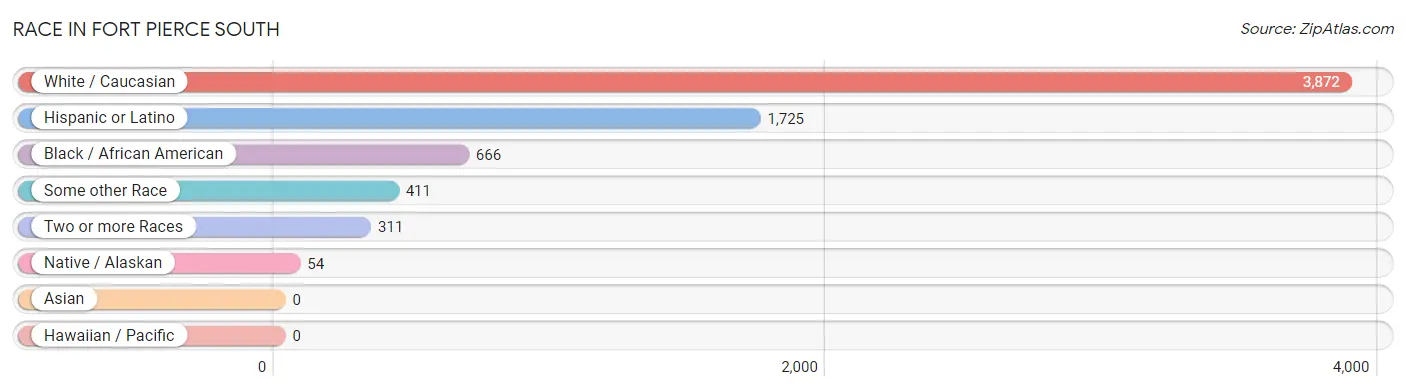
| Race | # Population | % Population |
| Asian | 0 | 0.0% |
| Black / African American | 666 | 12.5% |
| Hawaiian / Pacific | 0 | 0.0% |
| Hispanic or Latino | 1,725 | 32.5% |
| Native / Alaskan | 54 | 1.0% |
| White / Caucasian | 3,872 | 72.9% |
| Two or more Races | 311 | 5.9% |
| Some other Race | 411 | 7.7% |
| Total | 5,314 | 100.0% |
Ancestry in Fort Pierce South
The most populous ancestries reported in Fort Pierce South are American (1,198 | 22.5%), Mexican (1,010 | 19.0%), German (369 | 6.9%), Central American (330 | 6.2%), and Irish (323 | 6.1%), together accounting for 60.8% of all Fort Pierce South residents.
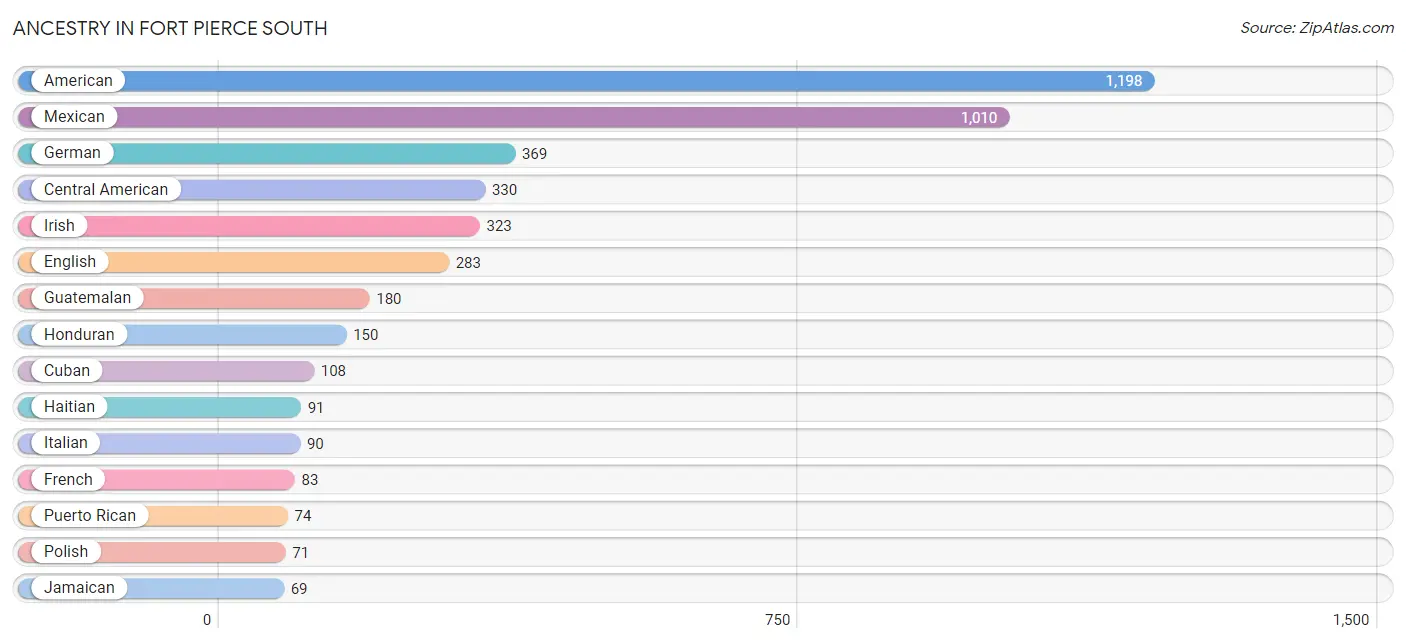
| Ancestry | # Population | % Population |
| American | 1,198 | 22.5% |
| Arab | 1 | 0.0% |
| British | 21 | 0.4% |
| Central American | 330 | 6.2% |
| Cuban | 108 | 2.0% |
| Dominican | 67 | 1.3% |
| English | 283 | 5.3% |
| French | 83 | 1.6% |
| French Canadian | 51 | 1.0% |
| German | 369 | 6.9% |
| Guatemalan | 180 | 3.4% |
| Haitian | 91 | 1.7% |
| Honduran | 150 | 2.8% |
| Hungarian | 60 | 1.1% |
| Irish | 323 | 6.1% |
| Italian | 90 | 1.7% |
| Jamaican | 69 | 1.3% |
| Lithuanian | 14 | 0.3% |
| Mexican | 1,010 | 19.0% |
| Mexican American Indian | 21 | 0.4% |
| Norwegian | 36 | 0.7% |
| Pennsylvania German | 20 | 0.4% |
| Polish | 71 | 1.3% |
| Portuguese | 38 | 0.7% |
| Puerto Rican | 74 | 1.4% |
| Scandinavian | 25 | 0.5% |
| Syrian | 1 | 0.0% | View All 27 Rows |
Immigrants in Fort Pierce South
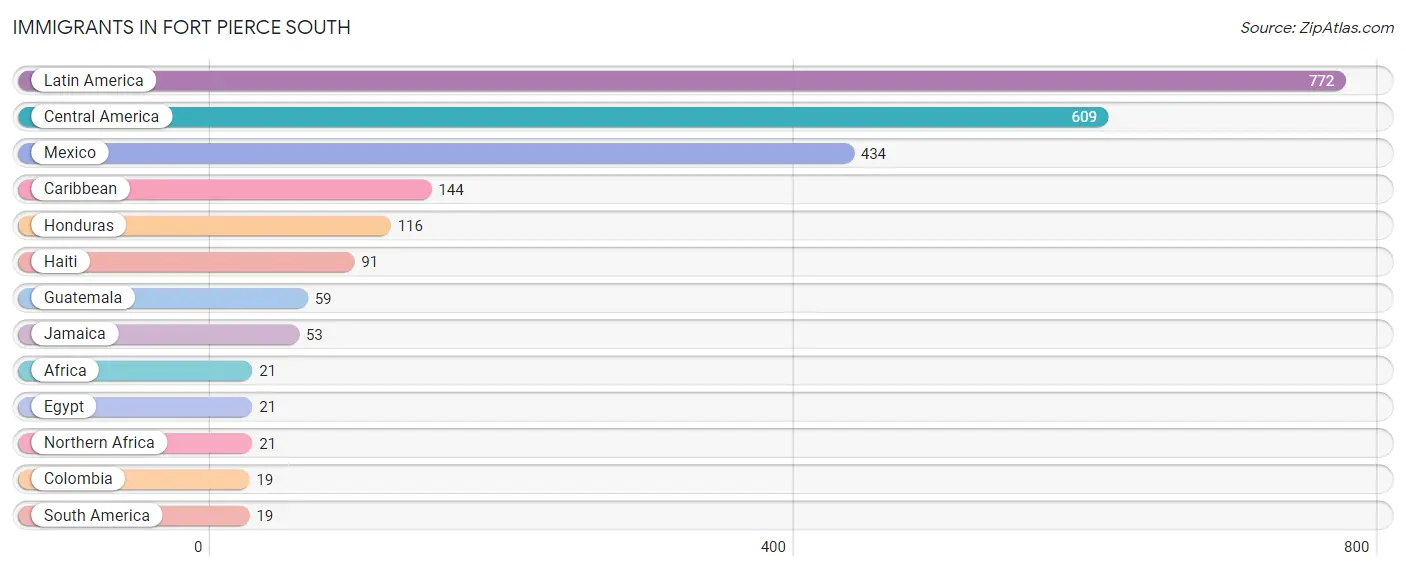
The most numerous immigrant groups reported in Fort Pierce South came from Latin America (772 | 14.5%), Central America (609 | 11.5%), Mexico (434 | 8.2%), Caribbean (144 | 2.7%), and Honduras (116 | 2.2%), together accounting for 39.1% of all Fort Pierce South residents.
| Immigration Origin | # Population | % Population |
| Africa | 21 | 0.4% |
| Caribbean | 144 | 2.7% |
| Central America | 609 | 11.5% |
| Colombia | 19 | 0.4% |
| Egypt | 21 | 0.4% |
| Guatemala | 59 | 1.1% |
| Haiti | 91 | 1.7% |
| Honduras | 116 | 2.2% |
| Jamaica | 53 | 1.0% |
| Latin America | 772 | 14.5% |
| Mexico | 434 | 8.2% |
| Northern Africa | 21 | 0.4% |
| South America | 19 | 0.4% | View All 13 Rows |
Sex and Age in Fort Pierce South
Sex and Age in Fort Pierce South
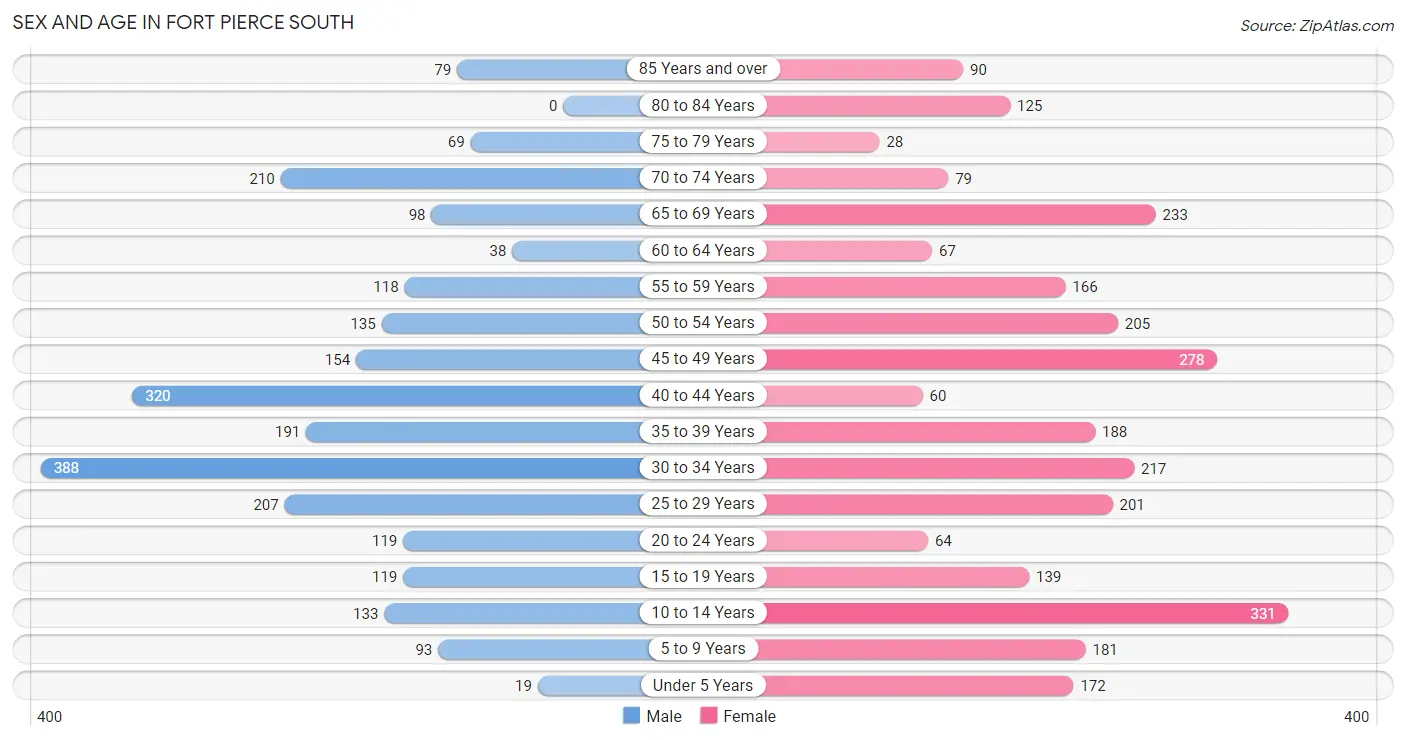
The most populous age groups in Fort Pierce South are 30 to 34 Years (388 | 15.6%) for men and 10 to 14 Years (331 | 11.7%) for women.
| Age Bracket | Male | Female |
| Under 5 Years | 19 (0.8%) | 172 (6.1%) |
| 5 to 9 Years | 93 (3.7%) | 181 (6.4%) |
| 10 to 14 Years | 133 (5.3%) | 331 (11.7%) |
| 15 to 19 Years | 119 (4.8%) | 139 (4.9%) |
| 20 to 24 Years | 119 (4.8%) | 64 (2.3%) |
| 25 to 29 Years | 207 (8.3%) | 201 (7.1%) |
| 30 to 34 Years | 388 (15.6%) | 217 (7.7%) |
| 35 to 39 Years | 191 (7.7%) | 188 (6.7%) |
| 40 to 44 Years | 320 (12.9%) | 60 (2.1%) |
| 45 to 49 Years | 154 (6.2%) | 278 (9.8%) |
| 50 to 54 Years | 135 (5.4%) | 205 (7.3%) |
| 55 to 59 Years | 118 (4.7%) | 166 (5.9%) |
| 60 to 64 Years | 38 (1.5%) | 67 (2.4%) |
| 65 to 69 Years | 98 (3.9%) | 233 (8.3%) |
| 70 to 74 Years | 210 (8.4%) | 79 (2.8%) |
| 75 to 79 Years | 69 (2.8%) | 28 (1.0%) |
| 80 to 84 Years | 0 (0.0%) | 125 (4.4%) |
| 85 Years and over | 79 (3.2%) | 90 (3.2%) |
| Total | 2,490 (100.0%) | 2,824 (100.0%) |
Families and Households in Fort Pierce South
Median Family Size in Fort Pierce South
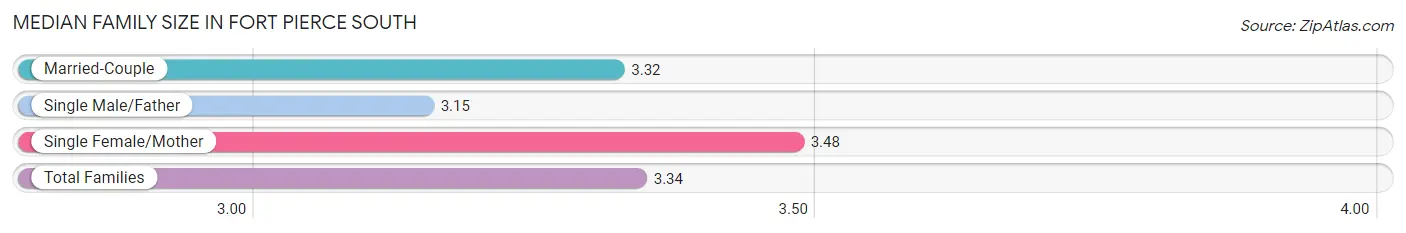
The median family size in Fort Pierce South is 3.34 persons per family, with single female/mother families (302 | 24.5%) accounting for the largest median family size of 3.48 persons per family. On the other hand, single male/father families (124 | 10.1%) represent the smallest median family size with 3.15 persons per family.
| Family Type | # Families | Family Size |
| Married-Couple | 807 (65.4%) | 3.32 |
| Single Male/Father | 124 (10.1%) | 3.15 |
| Single Female/Mother | 302 (24.5%) | 3.48 |
| Total Families | 1,233 (100.0%) | 3.34 |
Median Household Size in Fort Pierce South
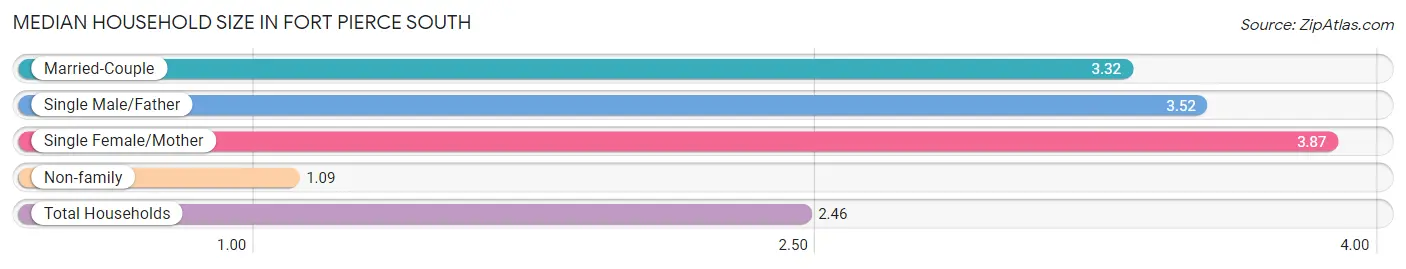
The median household size in Fort Pierce South is 2.46 persons per household, with single female/mother households (302 | 14.0%) accounting for the largest median household size of 3.87 persons per household. non-family households (923 | 42.8%) represent the smallest median household size with 1.09 persons per household.
| Household Type | # Households | Household Size |
| Married-Couple | 807 (37.4%) | 3.32 |
| Single Male/Father | 124 (5.8%) | 3.52 |
| Single Female/Mother | 302 (14.0%) | 3.87 |
| Non-family | 923 (42.8%) | 1.09 |
| Total Households | 2,156 (100.0%) | 2.46 |
Household Size by Marriage Status in Fort Pierce South
Out of a total of 2,156 households in Fort Pierce South, 1,233 (57.2%) are family households, while 923 (42.8%) are nonfamily households. The most numerous type of family households are 3-person households, comprising 428, and the most common type of nonfamily households are 1-person households, comprising 857.
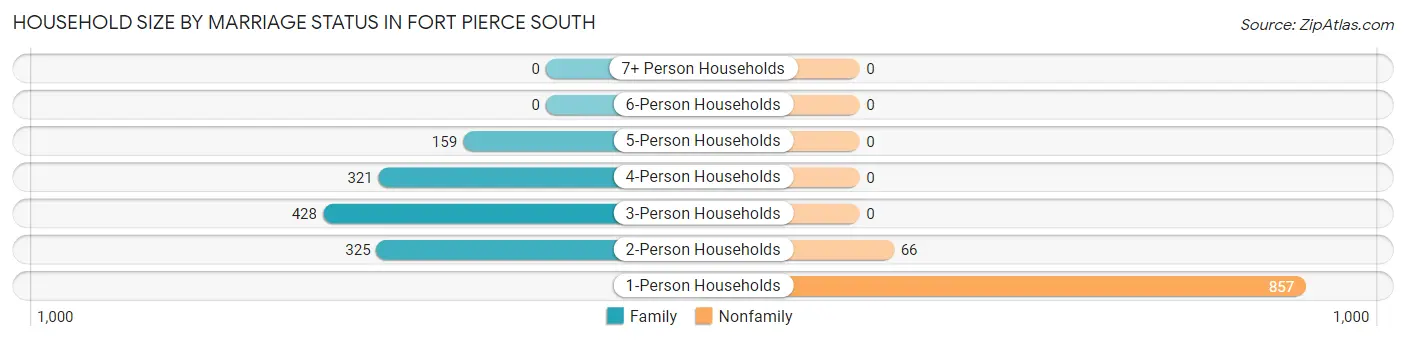
| Household Size | Family Households | Nonfamily Households |
| 1-Person Households | - | 857 (39.8%) |
| 2-Person Households | 325 (15.1%) | 66 (3.1%) |
| 3-Person Households | 428 (19.9%) | 0 (0.0%) |
| 4-Person Households | 321 (14.9%) | 0 (0.0%) |
| 5-Person Households | 159 (7.4%) | 0 (0.0%) |
| 6-Person Households | 0 (0.0%) | 0 (0.0%) |
| 7+ Person Households | 0 (0.0%) | 0 (0.0%) |
| Total | 1,233 (57.2%) | 923 (42.8%) |
Female Fertility in Fort Pierce South
Fertility by Age in Fort Pierce South
Average fertility rate in Fort Pierce South is 22.0 births per 1,000 women. Women in the age bracket of 20 to 34 years have the highest fertility rate with 52.0 births per 1,000 women. Women in the age bracket of 20 to 34 years acount for 100.0% of all women with births.
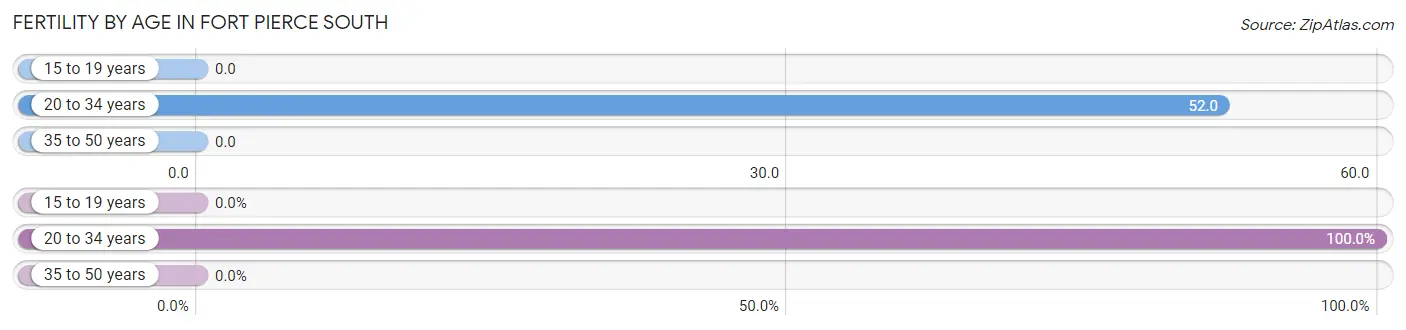
| Age Bracket | Women with Births | Births / 1,000 Women |
| 15 to 19 years | 0 (0.0%) | 0.0 |
| 20 to 34 years | 25 (100.0%) | 52.0 |
| 35 to 50 years | 0 (0.0%) | 0.0 |
| Total | 25 (100.0%) | 22.0 |
Fertility by Age by Marriage Status in Fort Pierce South
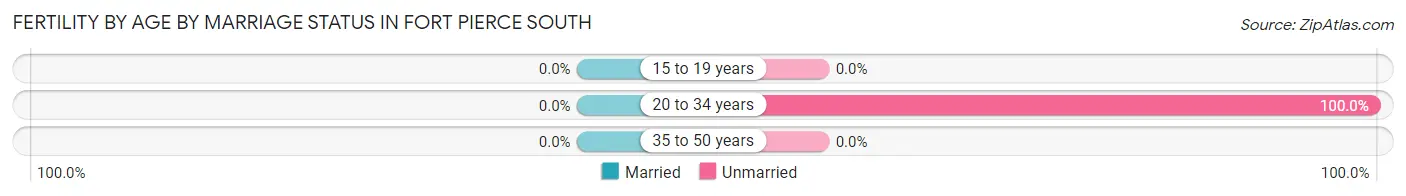
| Age Bracket | Married | Unmarried |
| 15 to 19 years | 0 (0.0%) | 0 (0.0%) |
| 20 to 34 years | 0 (0.0%) | 25 (100.0%) |
| 35 to 50 years | 0 (0.0%) | 0 (0.0%) |
| Total | 0 (0.0%) | 25 (100.0%) |
Fertility by Education in Fort Pierce South
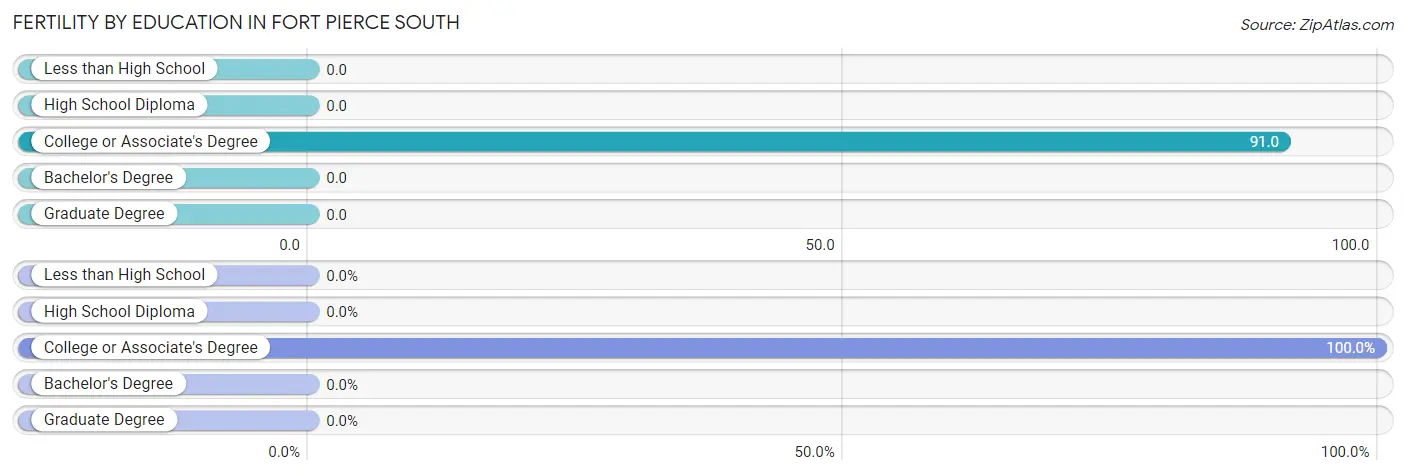
| Educational Attainment | Women with Births | Births / 1,000 Women |
| Less than High School | 0 (0.0%) | 0.0 |
| High School Diploma | 0 (0.0%) | 0.0 |
| College or Associate's Degree | 25 (100.0%) | 91.0 |
| Bachelor's Degree | 0 (0.0%) | 0.0 |
| Graduate Degree | 0 (0.0%) | 0.0 |
| Total | 25 (100.0%) | 22.0 |
Fertility by Education by Marriage Status in Fort Pierce South
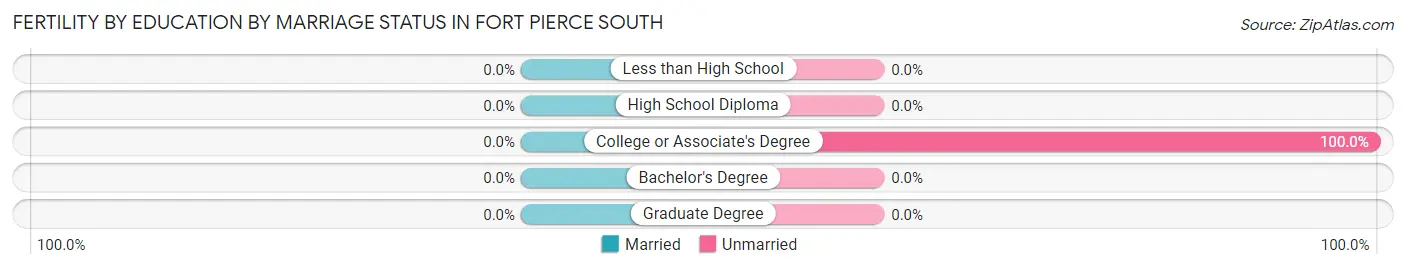
| Educational Attainment | Married | Unmarried |
| Less than High School | 0 (0.0%) | 0 (0.0%) |
| High School Diploma | 0 (0.0%) | 0 (0.0%) |
| College or Associate's Degree | 0 (0.0%) | 25 (100.0%) |
| Bachelor's Degree | 0 (0.0%) | 0 (0.0%) |
| Graduate Degree | 0 (0.0%) | 0 (0.0%) |
| Total | 0 (0.0%) | 25 (100.0%) |
Employment Characteristics in Fort Pierce South
Employment by Class of Employer in Fort Pierce South
Among the 2,540 employed individuals in Fort Pierce South, private company employees (1,885 | 74.2%), local government employees (306 | 12.0%), and self-employed (not incorporated) (127 | 5.0%) make up the most common classes of employment.
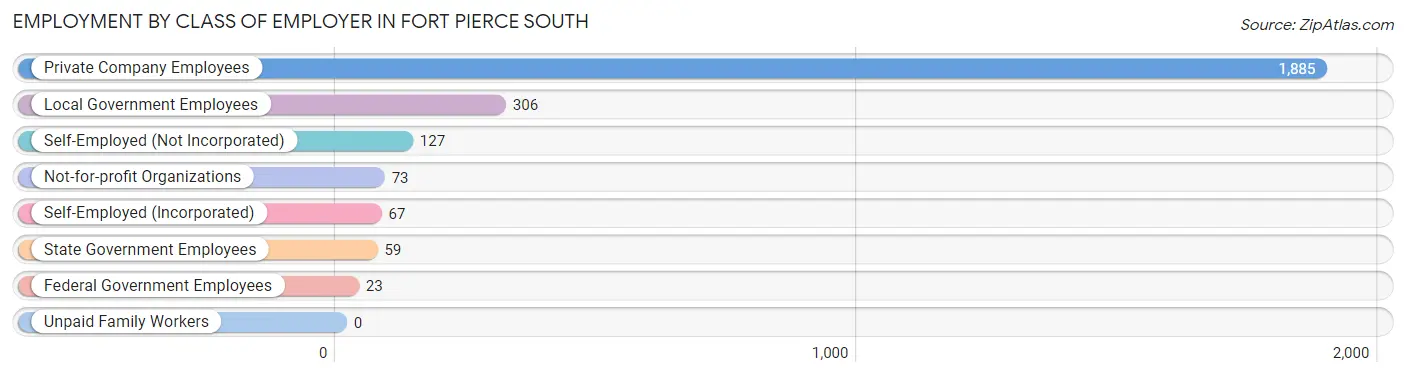
| Employer Class | # Employees | % Employees |
| Private Company Employees | 1,885 | 74.2% |
| Self-Employed (Incorporated) | 67 | 2.6% |
| Self-Employed (Not Incorporated) | 127 | 5.0% |
| Not-for-profit Organizations | 73 | 2.9% |
| Local Government Employees | 306 | 12.0% |
| State Government Employees | 59 | 2.3% |
| Federal Government Employees | 23 | 0.9% |
| Unpaid Family Workers | 0 | 0.0% |
| Total | 2,540 | 100.0% |
Employment Status by Age in Fort Pierce South
According to the labor force statistics for Fort Pierce South, out of the total population over 16 years of age (4,340), 60.6% or 2,630 individuals are in the labor force, with 1.5% or 39 of them unemployed. The age group with the highest labor force participation rate is 25 to 29 years, with 93.9% or 383 individuals in the labor force. Within the labor force, the 55 to 59 years age range has the highest percentage of unemployed individuals, with 7.3% or 14 of them being unemployed.
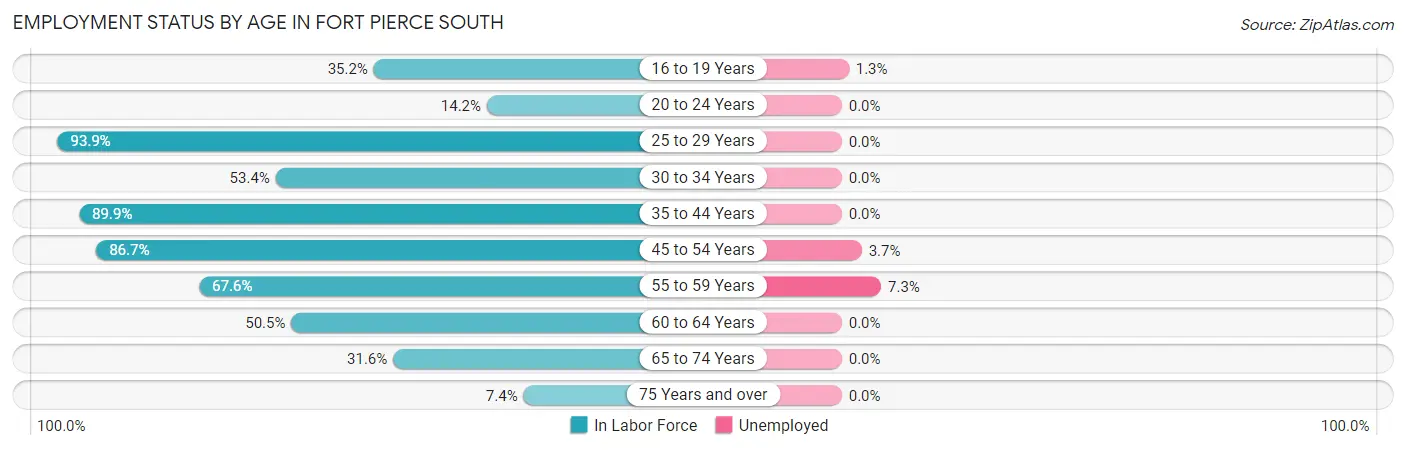
| Age Bracket | In Labor Force | Unemployed |
| 16 to 19 Years | 75 (35.2%) | 1 (1.3%) |
| 20 to 24 Years | 26 (14.2%) | 0 (0.0%) |
| 25 to 29 Years | 383 (93.9%) | 0 (0.0%) |
| 30 to 34 Years | 323 (53.4%) | 0 (0.0%) |
| 35 to 44 Years | 682 (89.9%) | 0 (0.0%) |
| 45 to 54 Years | 669 (86.7%) | 25 (3.7%) |
| 55 to 59 Years | 192 (67.6%) | 14 (7.3%) |
| 60 to 64 Years | 53 (50.5%) | 0 (0.0%) |
| 65 to 74 Years | 196 (31.6%) | 0 (0.0%) |
| 75 Years and over | 29 (7.4%) | 0 (0.0%) |
| Total | 2,630 (60.6%) | 39 (1.5%) |
Employment Status by Educational Attainment in Fort Pierce South
According to labor force statistics for Fort Pierce South, 78.5% of individuals (2,302) out of the total population between 25 and 64 years of age (2,933) are in the labor force, with 1.7% or 39 of them being unemployed. The group with the highest labor force participation rate are those with the educational attainment of bachelor's degree or higher, with 100.0% or 438 individuals in the labor force. Within the labor force, individuals with college / associate degree education have the highest percentage of unemployment, with 4.0% or 25 of them being unemployed.
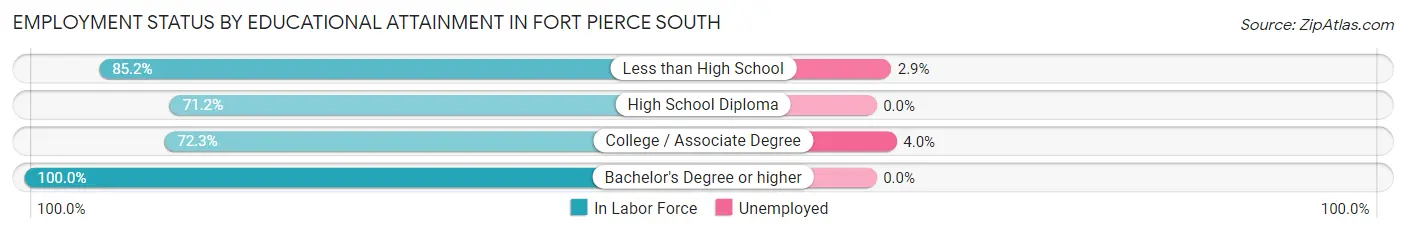
| Educational Attainment | In Labor Force | Unemployed |
| Less than High School | 476 (85.2%) | 16 (2.9%) |
| High School Diploma | 764 (71.2%) | 0 (0.0%) |
| College / Associate Degree | 624 (72.3%) | 35 (4.0%) |
| Bachelor's Degree or higher | 438 (100.0%) | 0 (0.0%) |
| Total | 2,302 (78.5%) | 50 (1.7%) |
Employment Occupations by Sex in Fort Pierce South
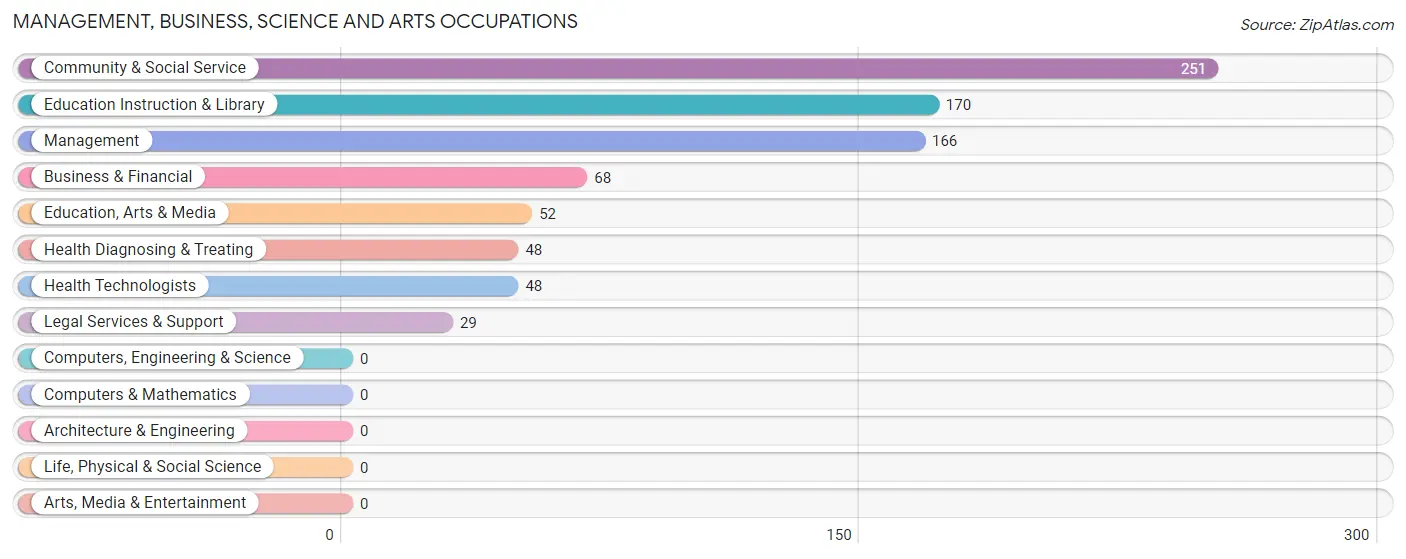
Management, Business, Science and Arts Occupations
The most common Management, Business, Science and Arts occupations in Fort Pierce South are Community & Social Service (251 | 9.7%), Education Instruction & Library (170 | 6.6%), Management (166 | 6.4%), Business & Financial (68 | 2.6%), and Education, Arts & Media (52 | 2.0%).
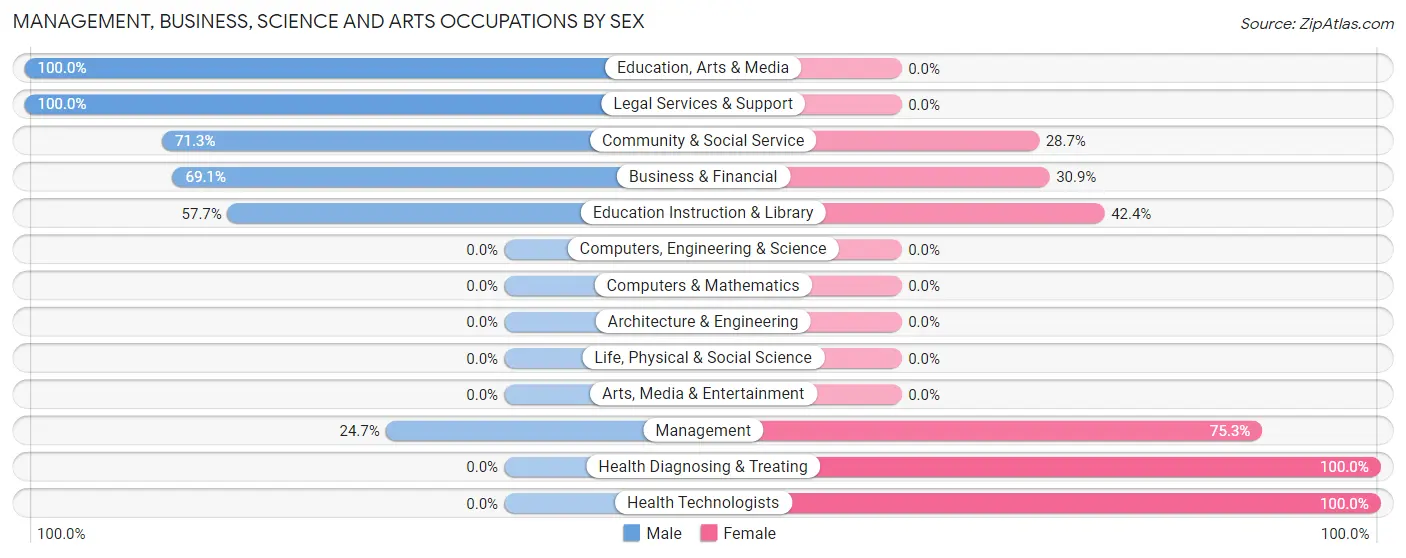
Management, Business, Science and Arts Occupations by Sex
Within the Management, Business, Science and Arts occupations in Fort Pierce South, the most male-oriented occupations are Education, Arts & Media (100.0%), Legal Services & Support (100.0%), and Community & Social Service (71.3%), while the most female-oriented occupations are Health Diagnosing & Treating (100.0%), Health Technologists (100.0%), and Management (75.3%).
| Occupation | Male | Female |
| Management | 41 (24.7%) | 125 (75.3%) |
| Business & Financial | 47 (69.1%) | 21 (30.9%) |
| Computers, Engineering & Science | 0 (0.0%) | 0 (0.0%) |
| Computers & Mathematics | 0 (0.0%) | 0 (0.0%) |
| Architecture & Engineering | 0 (0.0%) | 0 (0.0%) |
| Life, Physical & Social Science | 0 (0.0%) | 0 (0.0%) |
| Community & Social Service | 179 (71.3%) | 72 (28.7%) |
| Education, Arts & Media | 52 (100.0%) | 0 (0.0%) |
| Legal Services & Support | 29 (100.0%) | 0 (0.0%) |
| Education Instruction & Library | 98 (57.7%) | 72 (42.3%) |
| Arts, Media & Entertainment | 0 (0.0%) | 0 (0.0%) |
| Health Diagnosing & Treating | 0 (0.0%) | 48 (100.0%) |
| Health Technologists | 0 (0.0%) | 48 (100.0%) |
| Total (Category) | 267 (50.1%) | 266 (49.9%) |
| Total (Overall) | 1,546 (59.7%) | 1,042 (40.3%) |
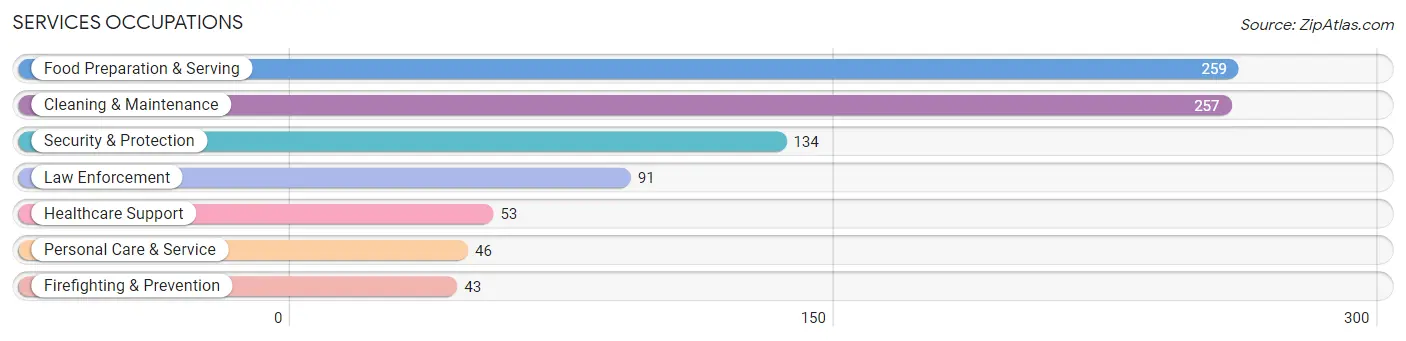
Services Occupations
The most common Services occupations in Fort Pierce South are Food Preparation & Serving (259 | 10.0%), Cleaning & Maintenance (257 | 9.9%), Security & Protection (134 | 5.2%), Law Enforcement (91 | 3.5%), and Healthcare Support (53 | 2.1%).
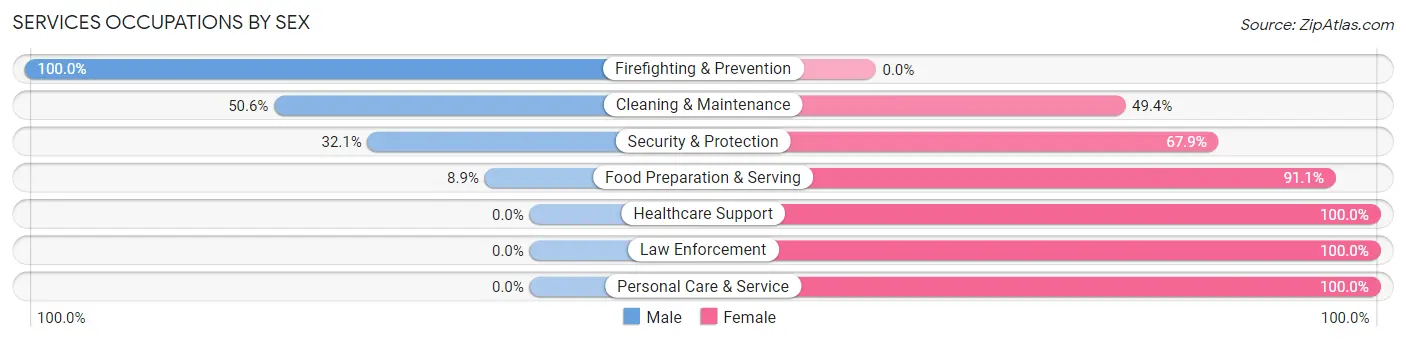
Services Occupations by Sex
Within the Services occupations in Fort Pierce South, the most male-oriented occupations are Firefighting & Prevention (100.0%), Cleaning & Maintenance (50.6%), and Security & Protection (32.1%), while the most female-oriented occupations are Healthcare Support (100.0%), Law Enforcement (100.0%), and Personal Care & Service (100.0%).
| Occupation | Male | Female |
| Healthcare Support | 0 (0.0%) | 53 (100.0%) |
| Security & Protection | 43 (32.1%) | 91 (67.9%) |
| Firefighting & Prevention | 43 (100.0%) | 0 (0.0%) |
| Law Enforcement | 0 (0.0%) | 91 (100.0%) |
| Food Preparation & Serving | 23 (8.9%) | 236 (91.1%) |
| Cleaning & Maintenance | 130 (50.6%) | 127 (49.4%) |
| Personal Care & Service | 0 (0.0%) | 46 (100.0%) |
| Total (Category) | 196 (26.2%) | 553 (73.8%) |
| Total (Overall) | 1,546 (59.7%) | 1,042 (40.3%) |
Sales and Office Occupations
The most common Sales and Office occupations in Fort Pierce South are Office & Administration (211 | 8.2%), and Sales & Related (68 | 2.6%).
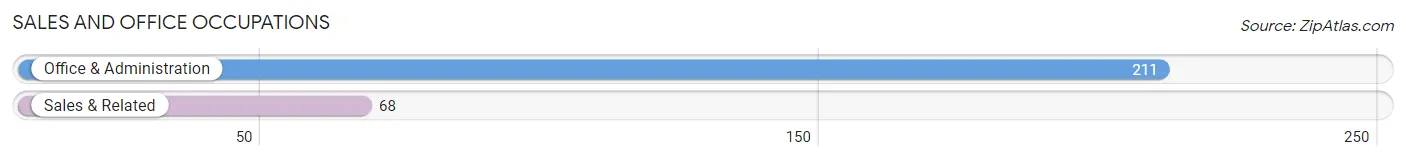
Sales and Office Occupations by Sex
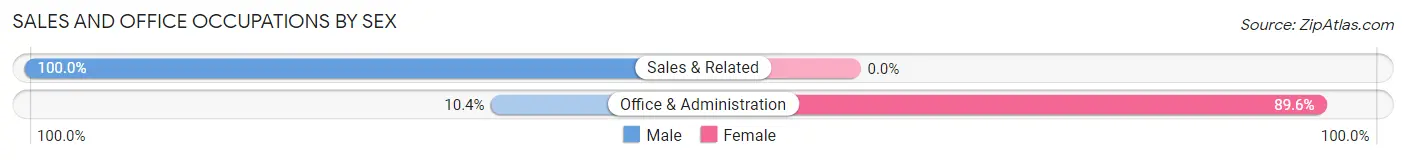
| Occupation | Male | Female |
| Sales & Related | 68 (100.0%) | 0 (0.0%) |
| Office & Administration | 22 (10.4%) | 189 (89.6%) |
| Total (Category) | 90 (32.3%) | 189 (67.7%) |
| Total (Overall) | 1,546 (59.7%) | 1,042 (40.3%) |
Natural Resources, Construction and Maintenance Occupations
The most common Natural Resources, Construction and Maintenance occupations in Fort Pierce South are Construction & Extraction (342 | 13.2%), and Installation, Maintenance & Repair (106 | 4.1%).
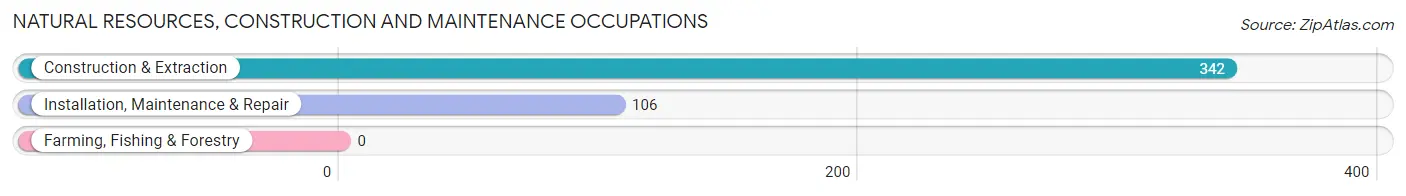
Natural Resources, Construction and Maintenance Occupations by Sex
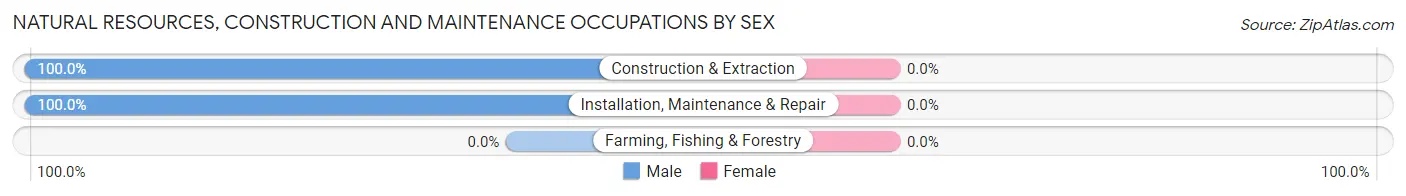
| Occupation | Male | Female |
| Farming, Fishing & Forestry | 0 (0.0%) | 0 (0.0%) |
| Construction & Extraction | 342 (100.0%) | 0 (0.0%) |
| Installation, Maintenance & Repair | 106 (100.0%) | 0 (0.0%) |
| Total (Category) | 448 (100.0%) | 0 (0.0%) |
| Total (Overall) | 1,546 (59.7%) | 1,042 (40.3%) |
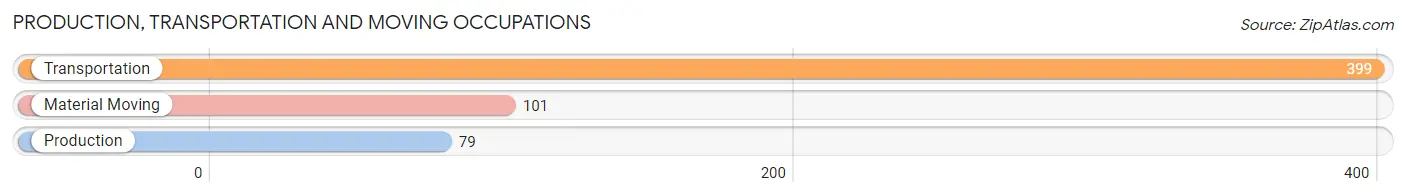
Production, Transportation and Moving Occupations
The most common Production, Transportation and Moving occupations in Fort Pierce South are Transportation (399 | 15.4%), Material Moving (101 | 3.9%), and Production (79 | 3.0%).
Production, Transportation and Moving Occupations by Sex
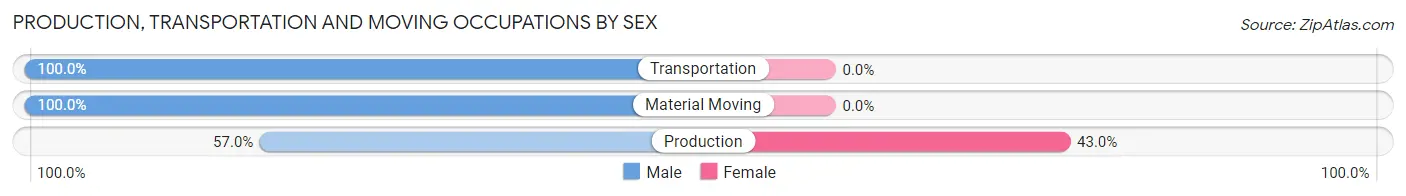
| Occupation | Male | Female |
| Production | 45 (57.0%) | 34 (43.0%) |
| Transportation | 399 (100.0%) | 0 (0.0%) |
| Material Moving | 101 (100.0%) | 0 (0.0%) |
| Total (Category) | 545 (94.1%) | 34 (5.9%) |
| Total (Overall) | 1,546 (59.7%) | 1,042 (40.3%) |
Employment Industries by Sex in Fort Pierce South
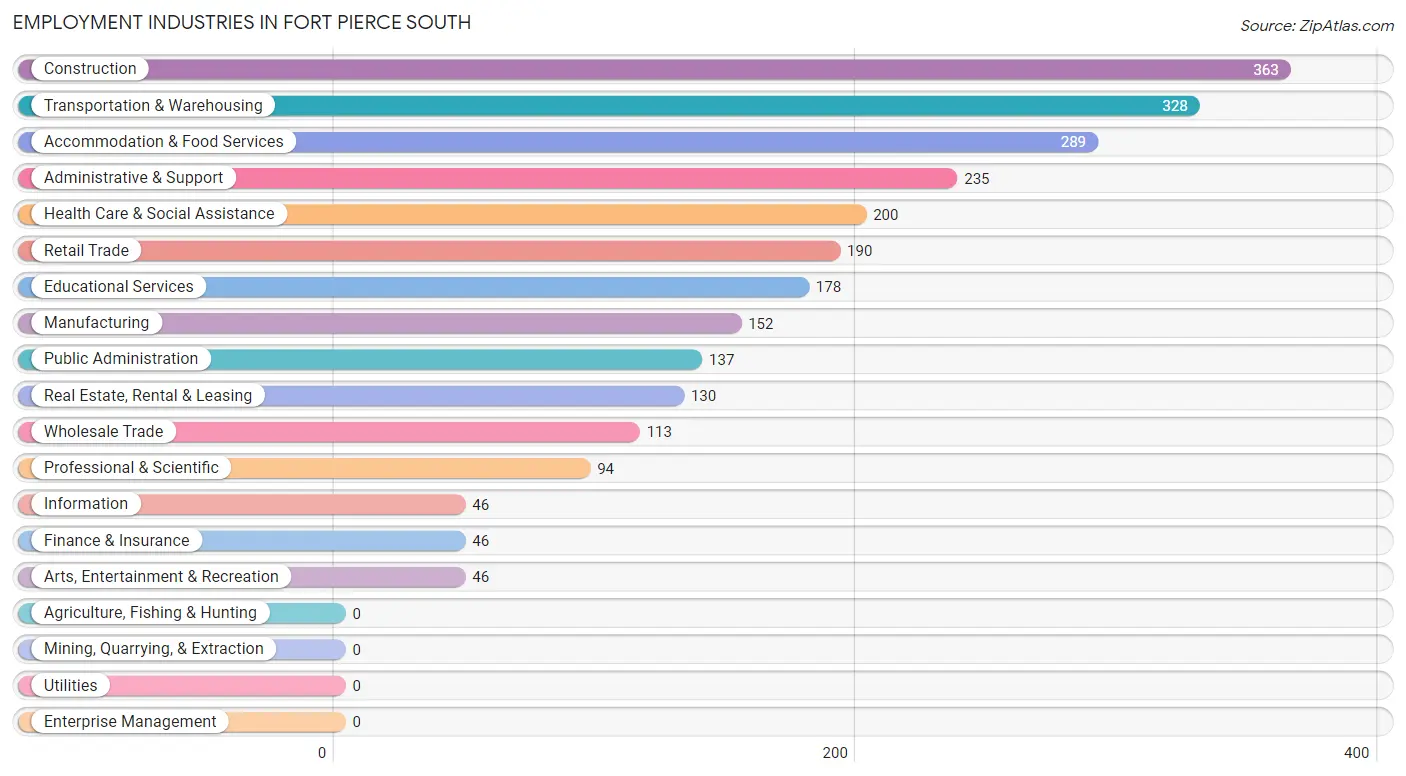
Employment Industries in Fort Pierce South
The major employment industries in Fort Pierce South include Construction (363 | 14.0%), Transportation & Warehousing (328 | 12.7%), Accommodation & Food Services (289 | 11.2%), Administrative & Support (235 | 9.1%), and Health Care & Social Assistance (200 | 7.7%).
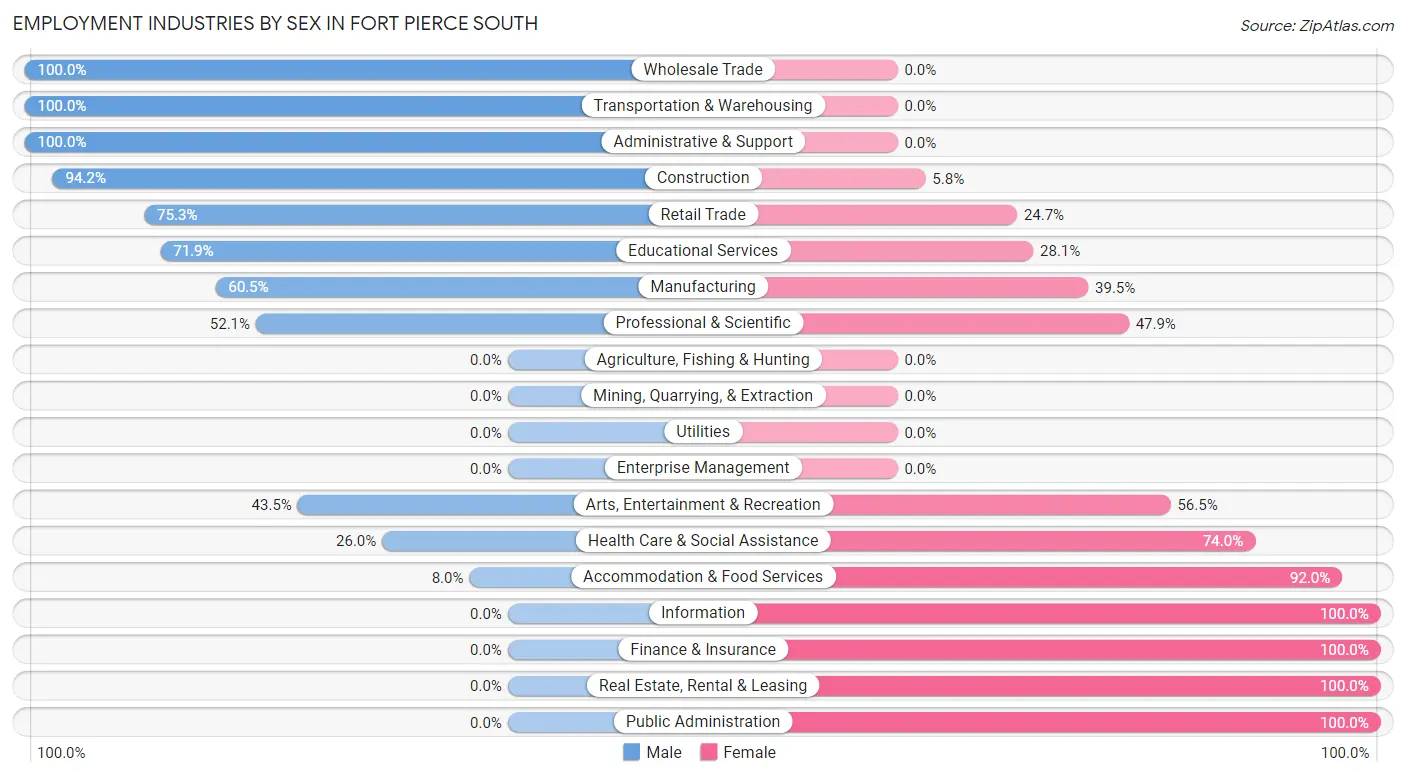
Employment Industries by Sex in Fort Pierce South
The Fort Pierce South industries that see more men than women are Wholesale Trade (100.0%), Transportation & Warehousing (100.0%), and Administrative & Support (100.0%), whereas the industries that tend to have a higher number of women are Information (100.0%), Finance & Insurance (100.0%), and Real Estate, Rental & Leasing (100.0%).
| Industry | Male | Female |
| Agriculture, Fishing & Hunting | 0 (0.0%) | 0 (0.0%) |
| Mining, Quarrying, & Extraction | 0 (0.0%) | 0 (0.0%) |
| Construction | 342 (94.2%) | 21 (5.8%) |
| Manufacturing | 92 (60.5%) | 60 (39.5%) |
| Wholesale Trade | 113 (100.0%) | 0 (0.0%) |
| Retail Trade | 143 (75.3%) | 47 (24.7%) |
| Transportation & Warehousing | 328 (100.0%) | 0 (0.0%) |
| Utilities | 0 (0.0%) | 0 (0.0%) |
| Information | 0 (0.0%) | 46 (100.0%) |
| Finance & Insurance | 0 (0.0%) | 46 (100.0%) |
| Real Estate, Rental & Leasing | 0 (0.0%) | 130 (100.0%) |
| Professional & Scientific | 49 (52.1%) | 45 (47.9%) |
| Enterprise Management | 0 (0.0%) | 0 (0.0%) |
| Administrative & Support | 235 (100.0%) | 0 (0.0%) |
| Educational Services | 128 (71.9%) | 50 (28.1%) |
| Health Care & Social Assistance | 52 (26.0%) | 148 (74.0%) |
| Arts, Entertainment & Recreation | 20 (43.5%) | 26 (56.5%) |
| Accommodation & Food Services | 23 (8.0%) | 266 (92.0%) |
| Public Administration | 0 (0.0%) | 137 (100.0%) |
| Total | 1,546 (59.7%) | 1,042 (40.3%) |
Education in Fort Pierce South
School Enrollment in Fort Pierce South
The most common levels of schooling among the 1,156 students in Fort Pierce South are middle school (400 | 34.6%), high school (273 | 23.6%), and kindergarten (155 | 13.4%).
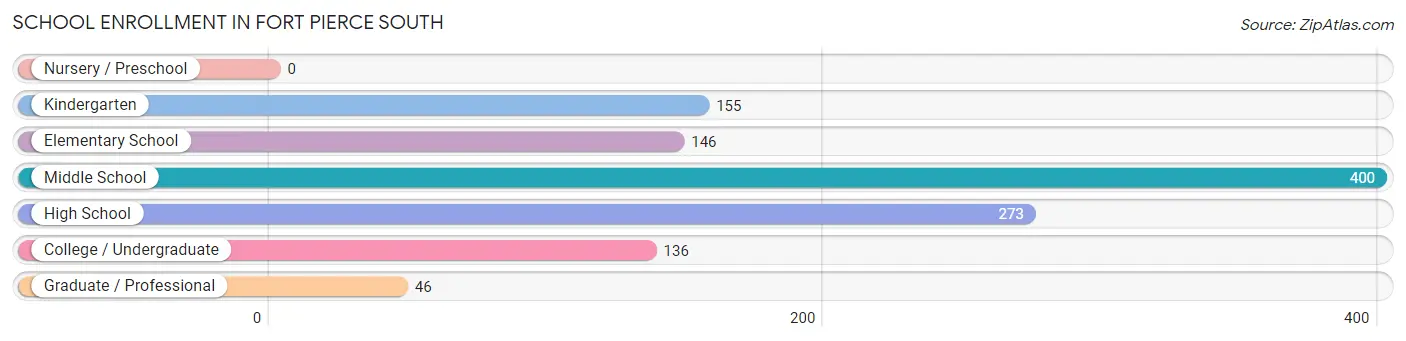
| School Level | # Students | % Students |
| Nursery / Preschool | 0 | 0.0% |
| Kindergarten | 155 | 13.4% |
| Elementary School | 146 | 12.6% |
| Middle School | 400 | 34.6% |
| High School | 273 | 23.6% |
| College / Undergraduate | 136 | 11.8% |
| Graduate / Professional | 46 | 4.0% |
| Total | 1,156 | 100.0% |
School Enrollment by Age by Funding Source in Fort Pierce South
Out of a total of 1,156 students who are enrolled in schools in Fort Pierce South, 381 (33.0%) attend a private institution, while the remaining 775 (67.0%) are enrolled in public schools. The age group of 25 to 34 year olds has the highest likelihood of being enrolled in private schools, with 66 (72.5% in the age bracket) enrolled. Conversely, the age group of 18 to 19 year olds has the lowest likelihood of being enrolled in a private school, with 45 (100.0% in the age bracket) attending a public institution.
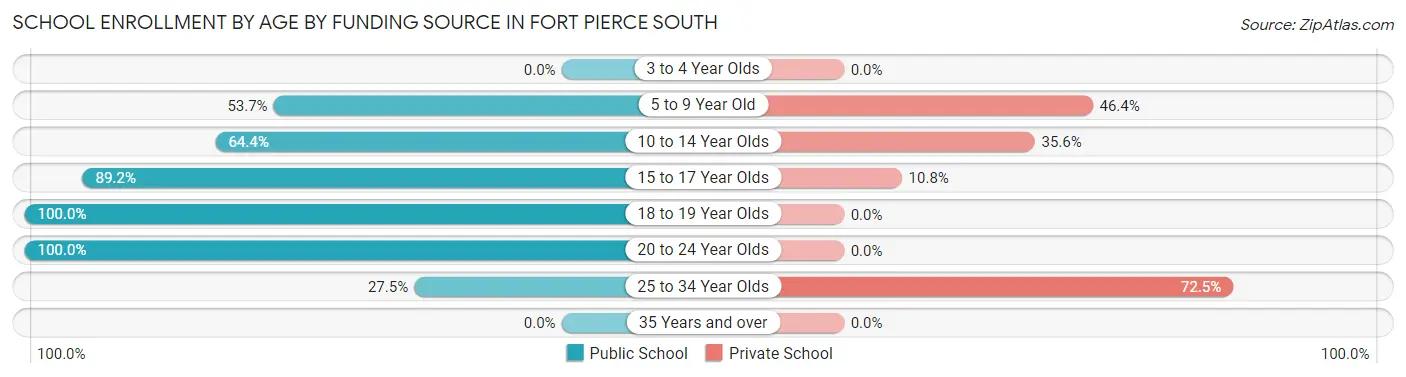
| Age Bracket | Public School | Private School |
| 3 to 4 Year Olds | 0 (0.0%) | 0 (0.0%) |
| 5 to 9 Year Old | 147 (53.6%) | 127 (46.4%) |
| 10 to 14 Year Olds | 299 (64.4%) | 165 (35.6%) |
| 15 to 17 Year Olds | 190 (89.2%) | 23 (10.8%) |
| 18 to 19 Year Olds | 45 (100.0%) | 0 (0.0%) |
| 20 to 24 Year Olds | 69 (100.0%) | 0 (0.0%) |
| 25 to 34 Year Olds | 25 (27.5%) | 66 (72.5%) |
| 35 Years and over | 0 (0.0%) | 0 (0.0%) |
| Total | 775 (67.0%) | 381 (33.0%) |
Educational Attainment by Field of Study in Fort Pierce South
Social sciences (174 | 28.6%), arts & humanities (155 | 25.5%), science & technology (62 | 10.2%), computers & mathematics (47 | 7.7%), and bio, nature & agricultural (46 | 7.6%) are the most common fields of study among 608 individuals in Fort Pierce South who have obtained a bachelor's degree or higher.
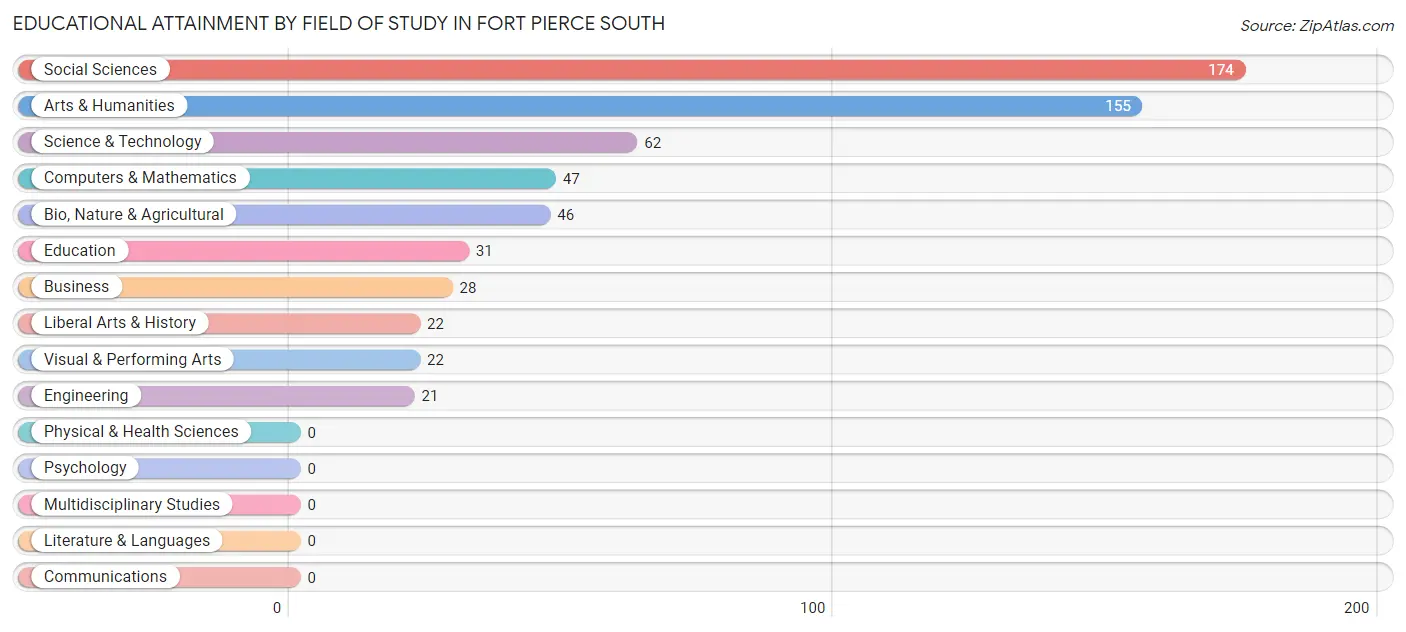
| Field of Study | # Graduates | % Graduates |
| Computers & Mathematics | 47 | 7.7% |
| Bio, Nature & Agricultural | 46 | 7.6% |
| Physical & Health Sciences | 0 | 0.0% |
| Psychology | 0 | 0.0% |
| Social Sciences | 174 | 28.6% |
| Engineering | 21 | 3.5% |
| Multidisciplinary Studies | 0 | 0.0% |
| Science & Technology | 62 | 10.2% |
| Business | 28 | 4.6% |
| Education | 31 | 5.1% |
| Literature & Languages | 0 | 0.0% |
| Liberal Arts & History | 22 | 3.6% |
| Visual & Performing Arts | 22 | 3.6% |
| Communications | 0 | 0.0% |
| Arts & Humanities | 155 | 25.5% |
| Total | 608 | 100.0% |
Transportation & Commute in Fort Pierce South
Vehicle Availability by Sex in Fort Pierce South
The most prevalent vehicle ownership categories in Fort Pierce South are males with 2 vehicles (811, accounting for 54.1%) and females with 2 vehicles (373, making up 77.8%).
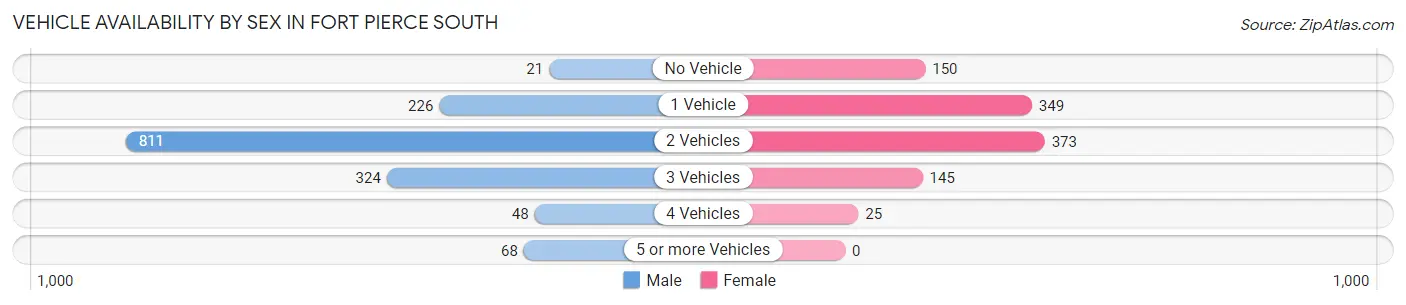
| Vehicles Available | Male | Female |
| No Vehicle | 21 (1.4%) | 150 (14.4%) |
| 1 Vehicle | 226 (15.1%) | 349 (33.5%) |
| 2 Vehicles | 811 (54.1%) | 373 (35.8%) |
| 3 Vehicles | 324 (21.6%) | 145 (13.9%) |
| 4 Vehicles | 48 (3.2%) | 25 (2.4%) |
| 5 or more Vehicles | 68 (4.5%) | 0 (0.0%) |
| Total | 1,498 (100.0%) | 1,042 (100.0%) |
Commute Time in Fort Pierce South
The most frequently occuring commute durations in Fort Pierce South are 20 to 24 minutes (467 commuters, 19.7%), 15 to 19 minutes (407 commuters, 17.2%), and 10 to 14 minutes (392 commuters, 16.6%).
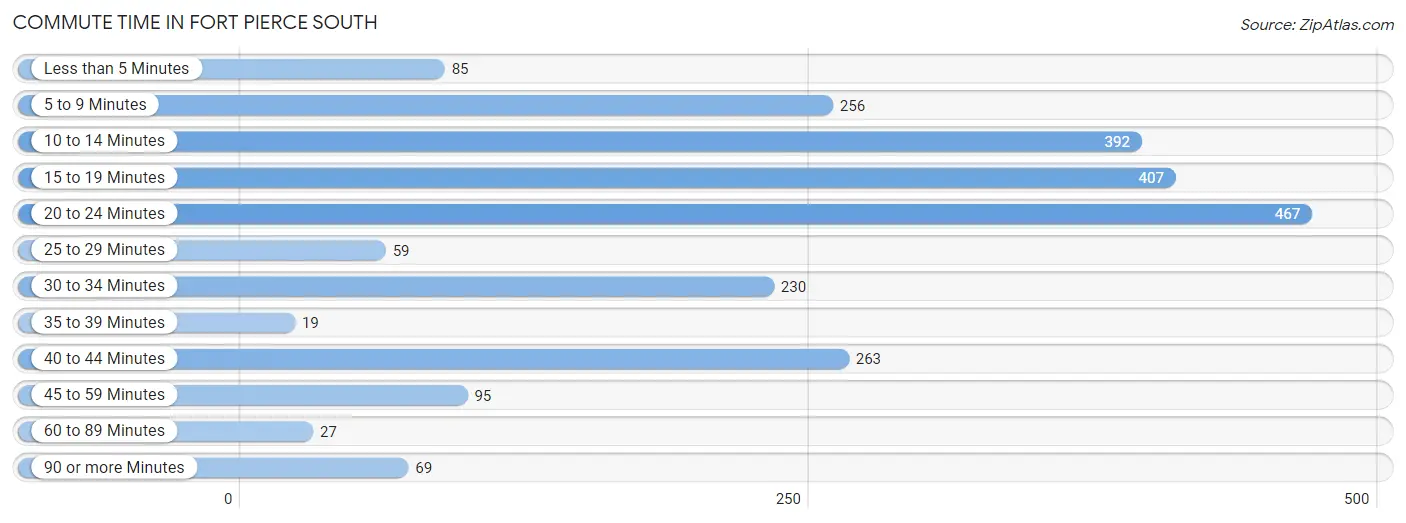
| Commute Time | # Commuters | % Commuters |
| Less than 5 Minutes | 85 | 3.6% |
| 5 to 9 Minutes | 256 | 10.8% |
| 10 to 14 Minutes | 392 | 16.6% |
| 15 to 19 Minutes | 407 | 17.2% |
| 20 to 24 Minutes | 467 | 19.7% |
| 25 to 29 Minutes | 59 | 2.5% |
| 30 to 34 Minutes | 230 | 9.7% |
| 35 to 39 Minutes | 19 | 0.8% |
| 40 to 44 Minutes | 263 | 11.1% |
| 45 to 59 Minutes | 95 | 4.0% |
| 60 to 89 Minutes | 27 | 1.1% |
| 90 or more Minutes | 69 | 2.9% |
Commute Time by Sex in Fort Pierce South
The most common commute times in Fort Pierce South are 20 to 24 minutes (317 commuters, 22.1%) for males and 15 to 19 minutes (232 commuters, 24.8%) for females.
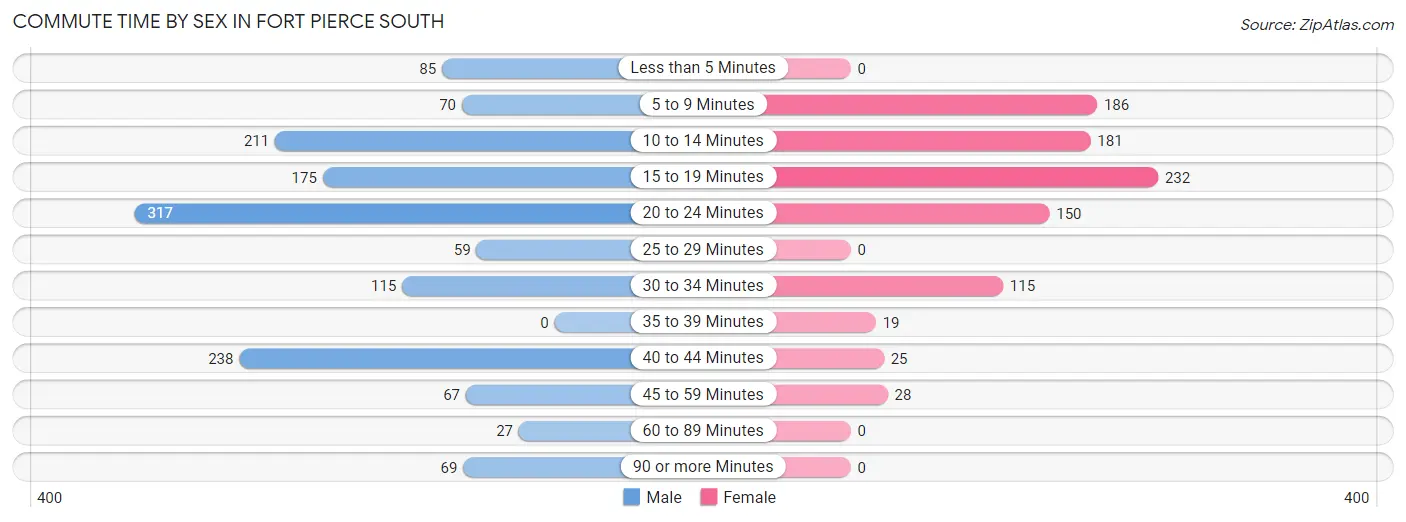
| Commute Time | Male | Female |
| Less than 5 Minutes | 85 (5.9%) | 0 (0.0%) |
| 5 to 9 Minutes | 70 (4.9%) | 186 (19.9%) |
| 10 to 14 Minutes | 211 (14.7%) | 181 (19.3%) |
| 15 to 19 Minutes | 175 (12.2%) | 232 (24.8%) |
| 20 to 24 Minutes | 317 (22.1%) | 150 (16.0%) |
| 25 to 29 Minutes | 59 (4.1%) | 0 (0.0%) |
| 30 to 34 Minutes | 115 (8.0%) | 115 (12.3%) |
| 35 to 39 Minutes | 0 (0.0%) | 19 (2.0%) |
| 40 to 44 Minutes | 238 (16.6%) | 25 (2.7%) |
| 45 to 59 Minutes | 67 (4.7%) | 28 (3.0%) |
| 60 to 89 Minutes | 27 (1.9%) | 0 (0.0%) |
| 90 or more Minutes | 69 (4.8%) | 0 (0.0%) |
Time of Departure to Work by Sex in Fort Pierce South
The most frequent times of departure to work in Fort Pierce South are 7:00 AM to 7:29 AM (350, 24.4%) for males and 7:30 AM to 7:59 AM (276, 29.5%) for females.
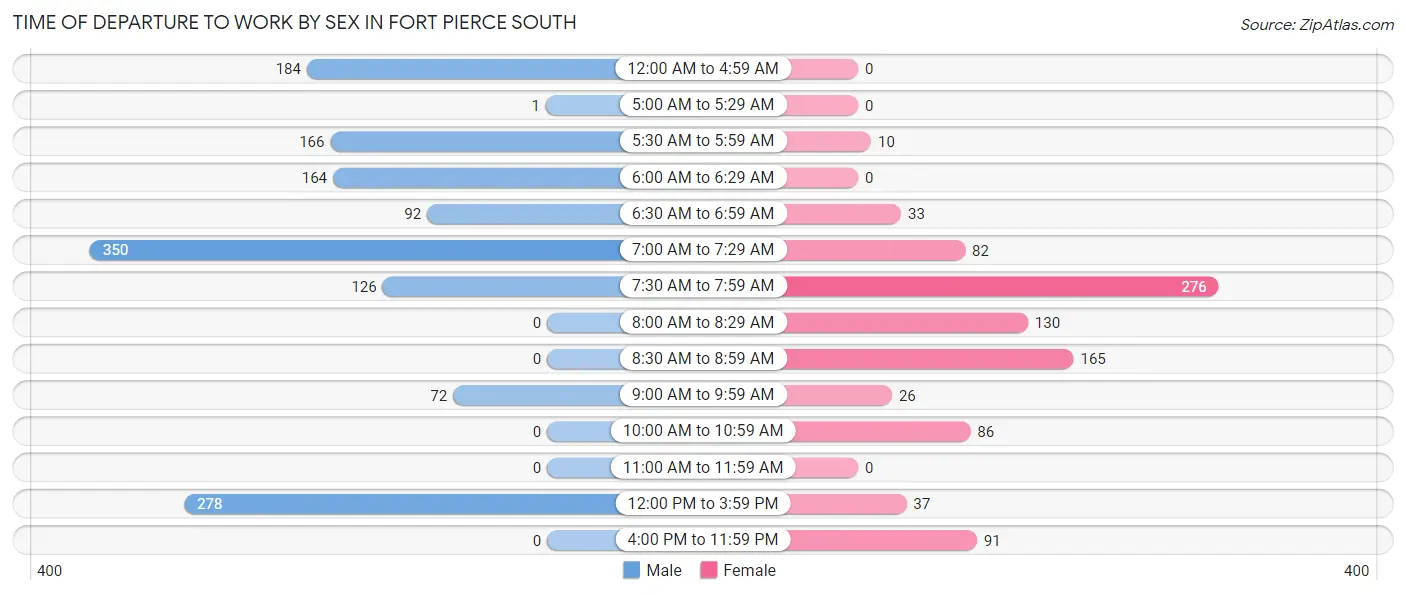
| Time of Departure | Male | Female |
| 12:00 AM to 4:59 AM | 184 (12.8%) | 0 (0.0%) |
| 5:00 AM to 5:29 AM | 1 (0.1%) | 0 (0.0%) |
| 5:30 AM to 5:59 AM | 166 (11.6%) | 10 (1.1%) |
| 6:00 AM to 6:29 AM | 164 (11.4%) | 0 (0.0%) |
| 6:30 AM to 6:59 AM | 92 (6.4%) | 33 (3.5%) |
| 7:00 AM to 7:29 AM | 350 (24.4%) | 82 (8.8%) |
| 7:30 AM to 7:59 AM | 126 (8.8%) | 276 (29.5%) |
| 8:00 AM to 8:29 AM | 0 (0.0%) | 130 (13.9%) |
| 8:30 AM to 8:59 AM | 0 (0.0%) | 165 (17.6%) |
| 9:00 AM to 9:59 AM | 72 (5.0%) | 26 (2.8%) |
| 10:00 AM to 10:59 AM | 0 (0.0%) | 86 (9.2%) |
| 11:00 AM to 11:59 AM | 0 (0.0%) | 0 (0.0%) |
| 12:00 PM to 3:59 PM | 278 (19.4%) | 37 (4.0%) |
| 4:00 PM to 11:59 PM | 0 (0.0%) | 91 (9.7%) |
| Total | 1,433 (100.0%) | 936 (100.0%) |
Housing Occupancy in Fort Pierce South
Occupancy by Ownership in Fort Pierce South
Of the total 2,156 dwellings in Fort Pierce South, owner-occupied units account for 1,422 (66.0%), while renter-occupied units make up 734 (34.0%).
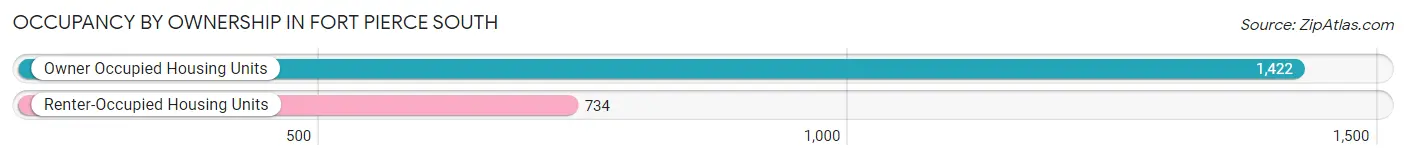
| Occupancy | # Housing Units | % Housing Units |
| Owner Occupied Housing Units | 1,422 | 66.0% |
| Renter-Occupied Housing Units | 734 | 34.0% |
| Total Occupied Housing Units | 2,156 | 100.0% |
Occupancy by Household Size in Fort Pierce South
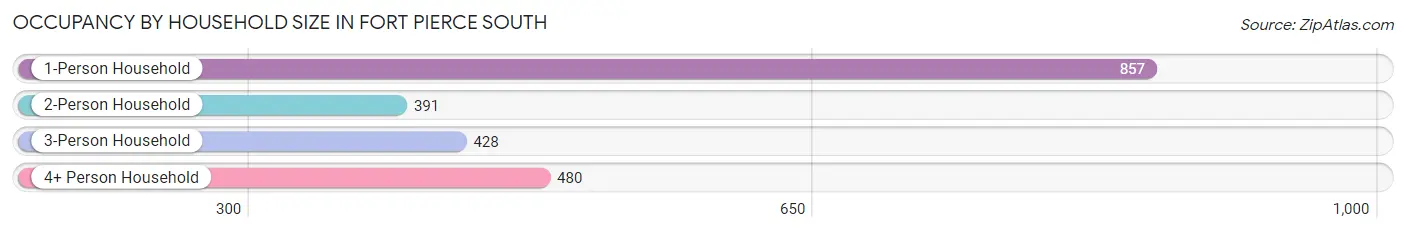
| Household Size | # Housing Units | % Housing Units |
| 1-Person Household | 857 | 39.8% |
| 2-Person Household | 391 | 18.1% |
| 3-Person Household | 428 | 19.9% |
| 4+ Person Household | 480 | 22.3% |
| Total Housing Units | 2,156 | 100.0% |
Occupancy by Ownership by Household Size in Fort Pierce South
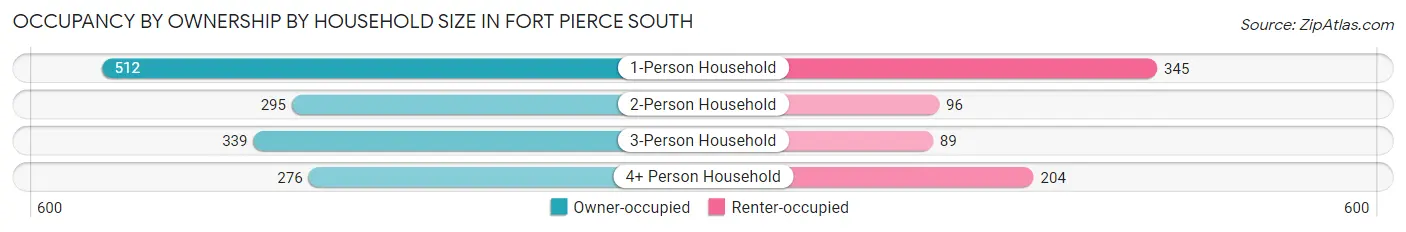
| Household Size | Owner-occupied | Renter-occupied |
| 1-Person Household | 512 (59.7%) | 345 (40.3%) |
| 2-Person Household | 295 (75.4%) | 96 (24.5%) |
| 3-Person Household | 339 (79.2%) | 89 (20.8%) |
| 4+ Person Household | 276 (57.5%) | 204 (42.5%) |
| Total Housing Units | 1,422 (66.0%) | 734 (34.0%) |
Occupancy by Educational Attainment in Fort Pierce South
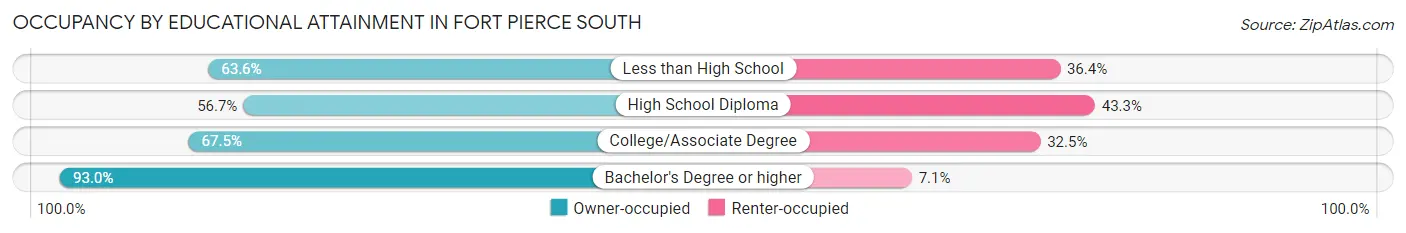
| Household Size | Owner-occupied | Renter-occupied |
| Less than High School | 314 (63.6%) | 180 (36.4%) |
| High School Diploma | 468 (56.7%) | 358 (43.3%) |
| College/Associate Degree | 363 (67.5%) | 175 (32.5%) |
| Bachelor's Degree or higher | 277 (92.9%) | 21 (7.0%) |
Occupancy by Age of Householder in Fort Pierce South
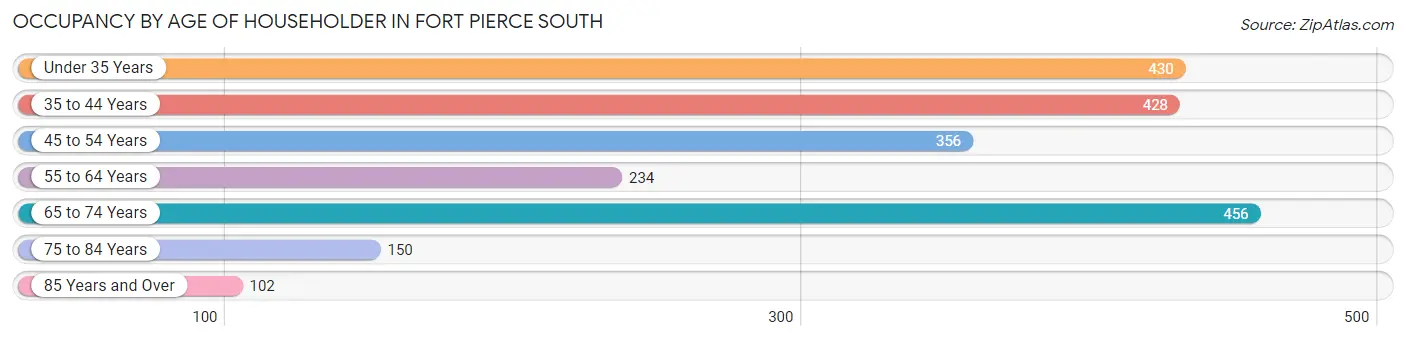
| Age Bracket | # Households | % Households |
| Under 35 Years | 430 | 19.9% |
| 35 to 44 Years | 428 | 19.9% |
| 45 to 54 Years | 356 | 16.5% |
| 55 to 64 Years | 234 | 10.8% |
| 65 to 74 Years | 456 | 21.1% |
| 75 to 84 Years | 150 | 7.0% |
| 85 Years and Over | 102 | 4.7% |
| Total | 2,156 | 100.0% |
Housing Finances in Fort Pierce South
Median Income by Occupancy in Fort Pierce South
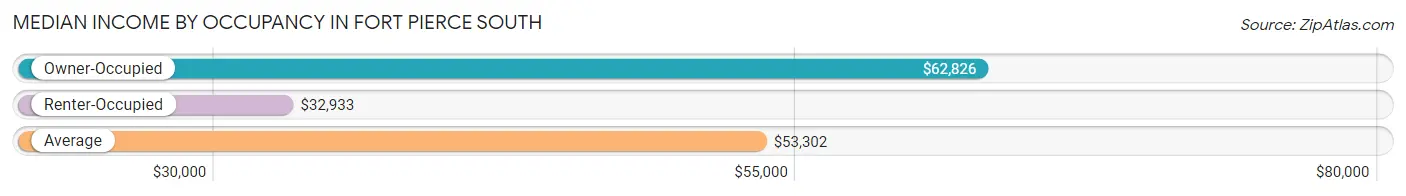
| Occupancy Type | # Households | Median Income |
| Owner-Occupied | 1,422 (66.0%) | $62,826 |
| Renter-Occupied | 734 (34.0%) | $32,933 |
| Average | 2,156 (100.0%) | $53,302 |
Occupancy by Householder Income Bracket in Fort Pierce South
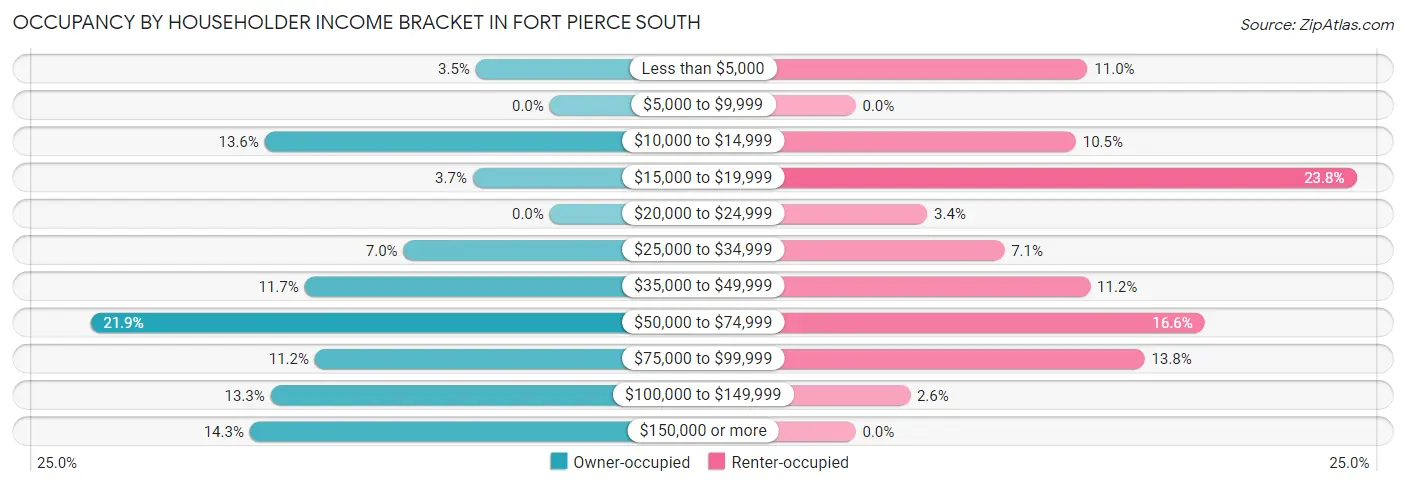
| Income Bracket | Owner-occupied | Renter-occupied |
| Less than $5,000 | 50 (3.5%) | 81 (11.0%) |
| $5,000 to $9,999 | 0 (0.0%) | 0 (0.0%) |
| $10,000 to $14,999 | 193 (13.6%) | 77 (10.5%) |
| $15,000 to $19,999 | 52 (3.7%) | 175 (23.8%) |
| $20,000 to $24,999 | 0 (0.0%) | 25 (3.4%) |
| $25,000 to $34,999 | 99 (7.0%) | 52 (7.1%) |
| $35,000 to $49,999 | 166 (11.7%) | 82 (11.2%) |
| $50,000 to $74,999 | 311 (21.9%) | 122 (16.6%) |
| $75,000 to $99,999 | 159 (11.2%) | 101 (13.8%) |
| $100,000 to $149,999 | 189 (13.3%) | 19 (2.6%) |
| $150,000 or more | 203 (14.3%) | 0 (0.0%) |
| Total | 1,422 (100.0%) | 734 (100.0%) |
Monthly Housing Cost Tiers in Fort Pierce South
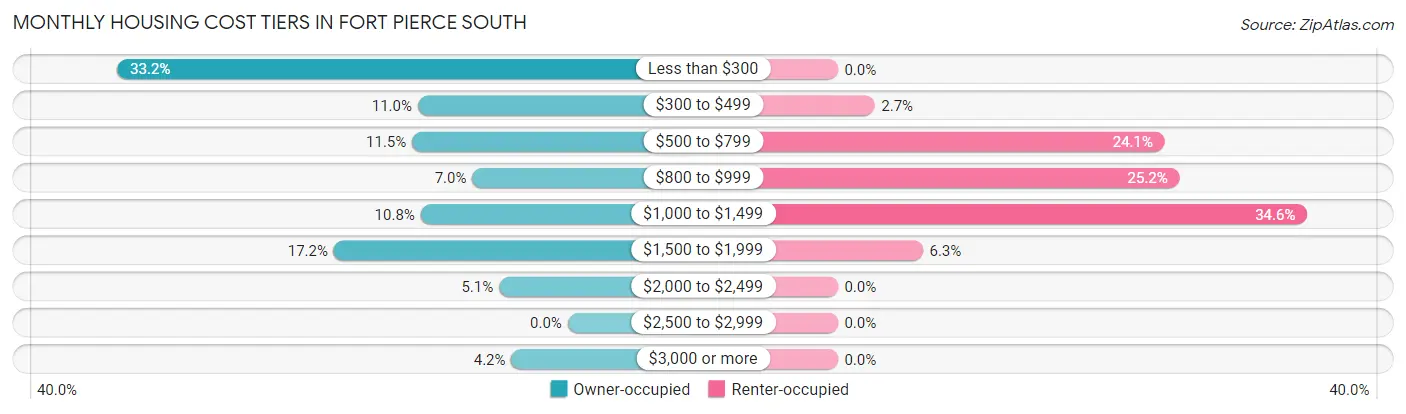
| Monthly Cost | Owner-occupied | Renter-occupied |
| Less than $300 | 472 (33.2%) | 0 (0.0%) |
| $300 to $499 | 157 (11.0%) | 20 (2.7%) |
| $500 to $799 | 163 (11.5%) | 177 (24.1%) |
| $800 to $999 | 100 (7.0%) | 185 (25.2%) |
| $1,000 to $1,499 | 154 (10.8%) | 254 (34.6%) |
| $1,500 to $1,999 | 245 (17.2%) | 46 (6.3%) |
| $2,000 to $2,499 | 72 (5.1%) | 0 (0.0%) |
| $2,500 to $2,999 | 0 (0.0%) | 0 (0.0%) |
| $3,000 or more | 59 (4.2%) | 0 (0.0%) |
| Total | 1,422 (100.0%) | 734 (100.0%) |
Physical Housing Characteristics in Fort Pierce South
Housing Structures in Fort Pierce South
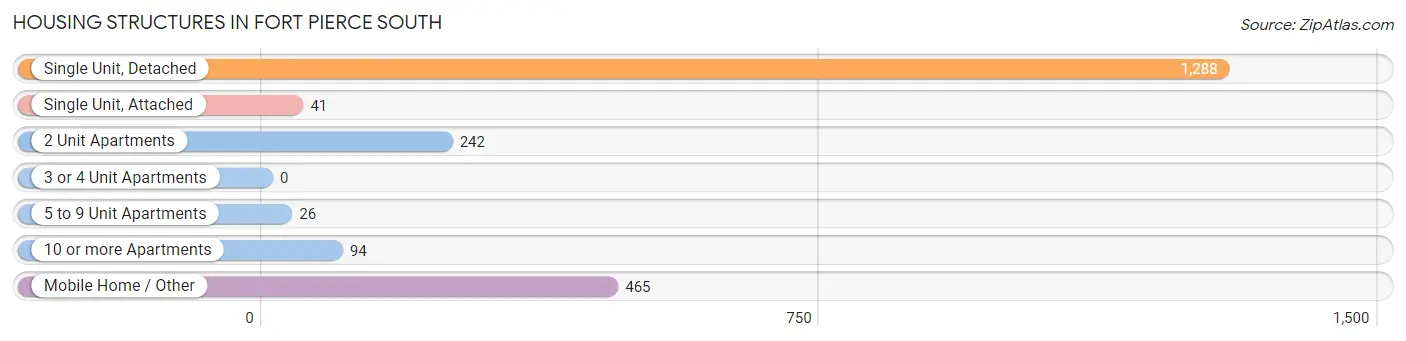
| Structure Type | # Housing Units | % Housing Units |
| Single Unit, Detached | 1,288 | 59.7% |
| Single Unit, Attached | 41 | 1.9% |
| 2 Unit Apartments | 242 | 11.2% |
| 3 or 4 Unit Apartments | 0 | 0.0% |
| 5 to 9 Unit Apartments | 26 | 1.2% |
| 10 or more Apartments | 94 | 4.4% |
| Mobile Home / Other | 465 | 21.6% |
| Total | 2,156 | 100.0% |
Housing Structures by Occupancy in Fort Pierce South
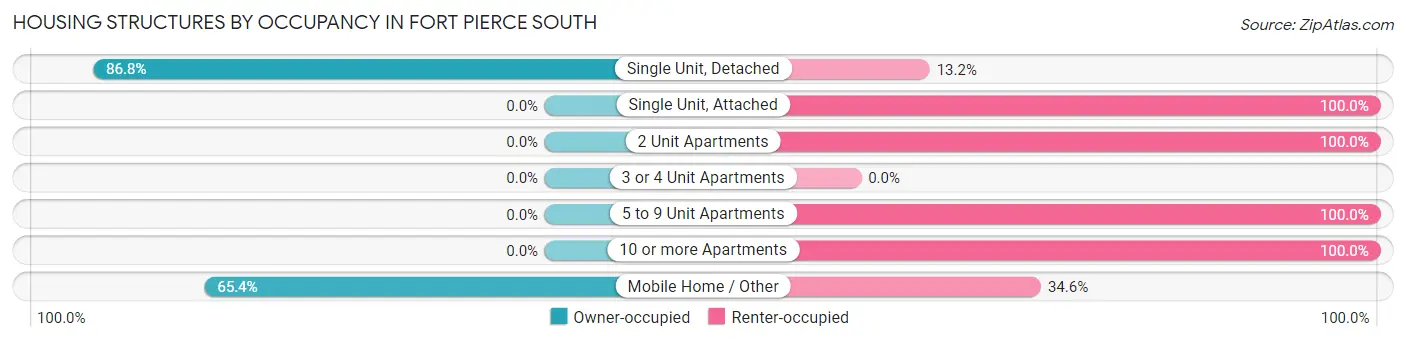
| Structure Type | Owner-occupied | Renter-occupied |
| Single Unit, Detached | 1,118 (86.8%) | 170 (13.2%) |
| Single Unit, Attached | 0 (0.0%) | 41 (100.0%) |
| 2 Unit Apartments | 0 (0.0%) | 242 (100.0%) |
| 3 or 4 Unit Apartments | 0 (0.0%) | 0 (0.0%) |
| 5 to 9 Unit Apartments | 0 (0.0%) | 26 (100.0%) |
| 10 or more Apartments | 0 (0.0%) | 94 (100.0%) |
| Mobile Home / Other | 304 (65.4%) | 161 (34.6%) |
| Total | 1,422 (66.0%) | 734 (34.0%) |
Housing Structures by Number of Rooms in Fort Pierce South
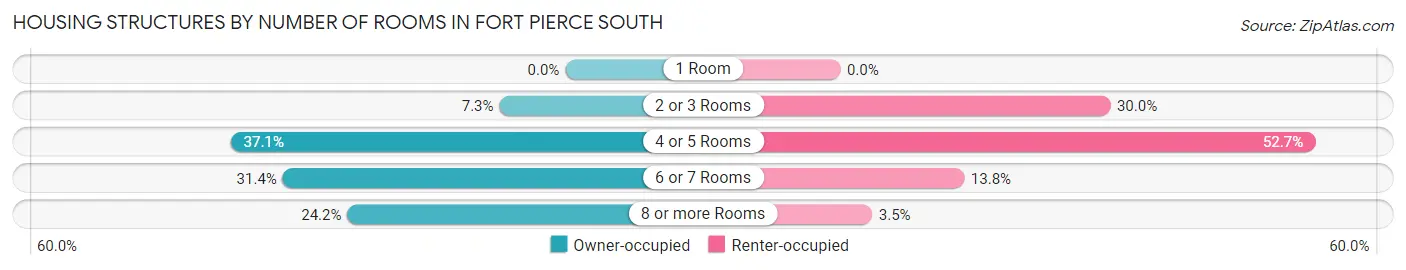
| Number of Rooms | Owner-occupied | Renter-occupied |
| 1 Room | 0 (0.0%) | 0 (0.0%) |
| 2 or 3 Rooms | 104 (7.3%) | 220 (30.0%) |
| 4 or 5 Rooms | 528 (37.1%) | 387 (52.7%) |
| 6 or 7 Rooms | 446 (31.4%) | 101 (13.8%) |
| 8 or more Rooms | 344 (24.2%) | 26 (3.5%) |
| Total | 1,422 (100.0%) | 734 (100.0%) |
Housing Structure by Heating Type in Fort Pierce South
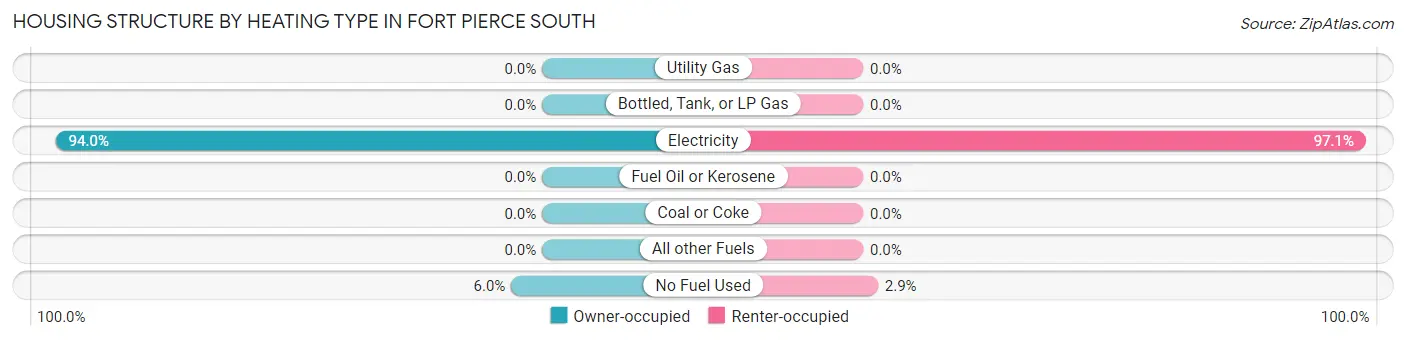
| Heating Type | Owner-occupied | Renter-occupied |
| Utility Gas | 0 (0.0%) | 0 (0.0%) |
| Bottled, Tank, or LP Gas | 0 (0.0%) | 0 (0.0%) |
| Electricity | 1,337 (94.0%) | 713 (97.1%) |
| Fuel Oil or Kerosene | 0 (0.0%) | 0 (0.0%) |
| Coal or Coke | 0 (0.0%) | 0 (0.0%) |
| All other Fuels | 0 (0.0%) | 0 (0.0%) |
| No Fuel Used | 85 (6.0%) | 21 (2.9%) |
| Total | 1,422 (100.0%) | 734 (100.0%) |
Household Vehicle Usage in Fort Pierce South
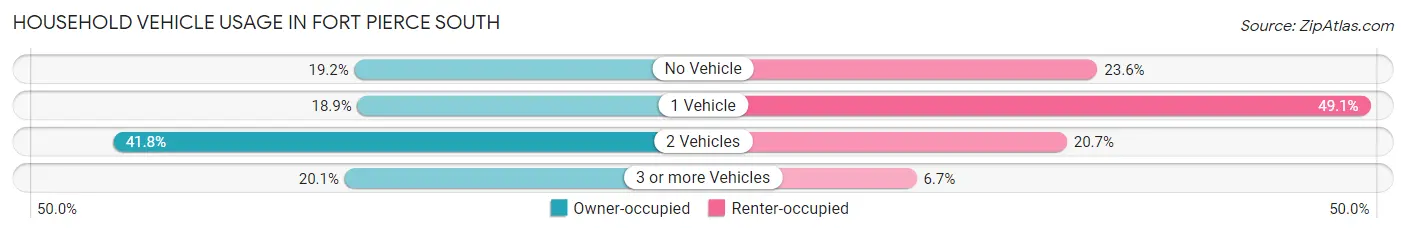
| Vehicles per Household | Owner-occupied | Renter-occupied |
| No Vehicle | 273 (19.2%) | 173 (23.6%) |
| 1 Vehicle | 269 (18.9%) | 360 (49.0%) |
| 2 Vehicles | 594 (41.8%) | 152 (20.7%) |
| 3 or more Vehicles | 286 (20.1%) | 49 (6.7%) |
| Total | 1,422 (100.0%) | 734 (100.0%) |
Real Estate & Mortgages in Fort Pierce South
Real Estate and Mortgage Overview in Fort Pierce South
| Characteristic | Without Mortgage | With Mortgage |
| Housing Units | 816 | 606 |
| Median Property Value | $80,500 | $291,300 |
| Median Household Income | $38,846 | $138 |
| Monthly Housing Costs | $216 | $59 |
| Real Estate Taxes | $676 | $13 |
Property Value by Mortgage Status in Fort Pierce South
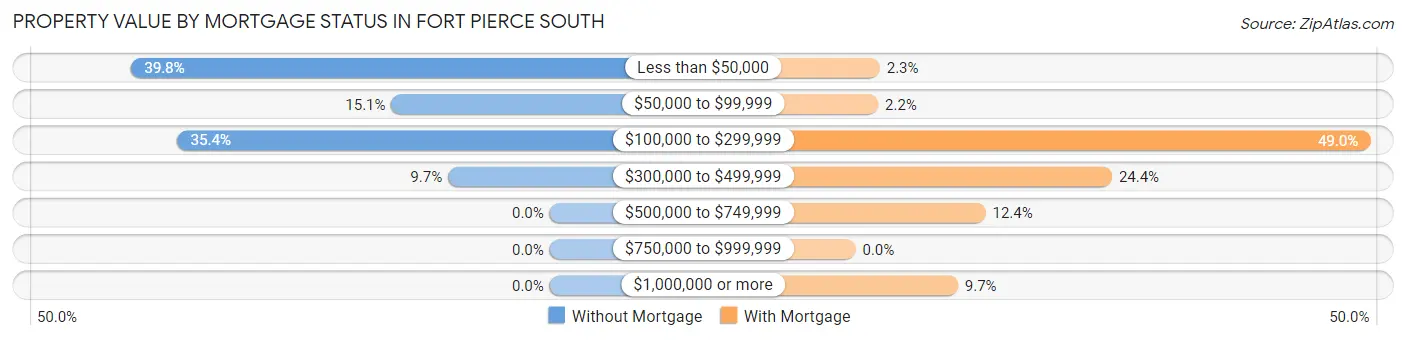
| Property Value | Without Mortgage | With Mortgage |
| Less than $50,000 | 325 (39.8%) | 14 (2.3%) |
| $50,000 to $99,999 | 123 (15.1%) | 13 (2.1%) |
| $100,000 to $299,999 | 289 (35.4%) | 297 (49.0%) |
| $300,000 to $499,999 | 79 (9.7%) | 148 (24.4%) |
| $500,000 to $749,999 | 0 (0.0%) | 75 (12.4%) |
| $750,000 to $999,999 | 0 (0.0%) | 0 (0.0%) |
| $1,000,000 or more | 0 (0.0%) | 59 (9.7%) |
| Total | 816 (100.0%) | 606 (100.0%) |
Household Income by Mortgage Status in Fort Pierce South
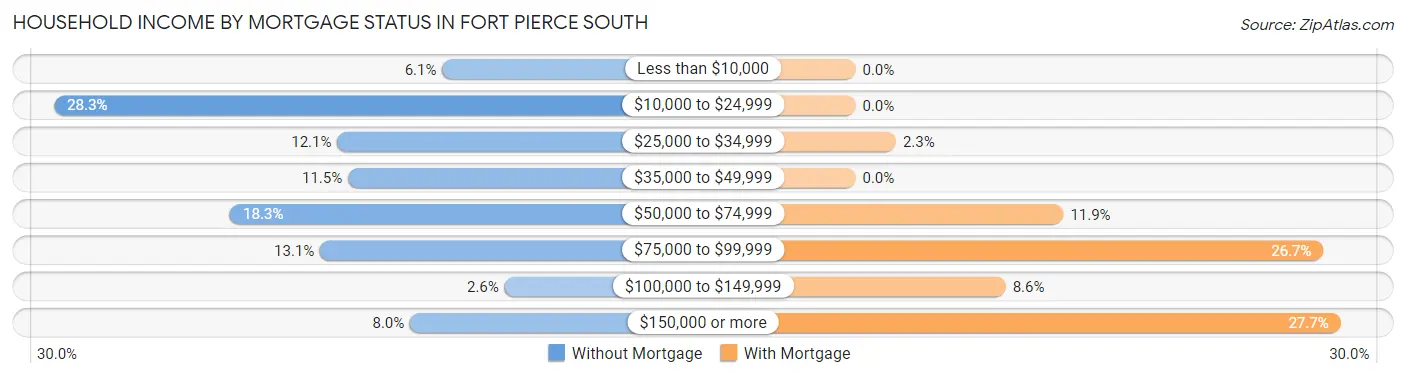
| Household Income | Without Mortgage | With Mortgage |
| Less than $10,000 | 50 (6.1%) | 0 (0.0%) |
| $10,000 to $24,999 | 231 (28.3%) | 0 (0.0%) |
| $25,000 to $34,999 | 99 (12.1%) | 14 (2.3%) |
| $35,000 to $49,999 | 94 (11.5%) | 0 (0.0%) |
| $50,000 to $74,999 | 149 (18.3%) | 72 (11.9%) |
| $75,000 to $99,999 | 107 (13.1%) | 162 (26.7%) |
| $100,000 to $149,999 | 21 (2.6%) | 52 (8.6%) |
| $150,000 or more | 65 (8.0%) | 168 (27.7%) |
| Total | 816 (100.0%) | 606 (100.0%) |
Property Value to Household Income Ratio in Fort Pierce South
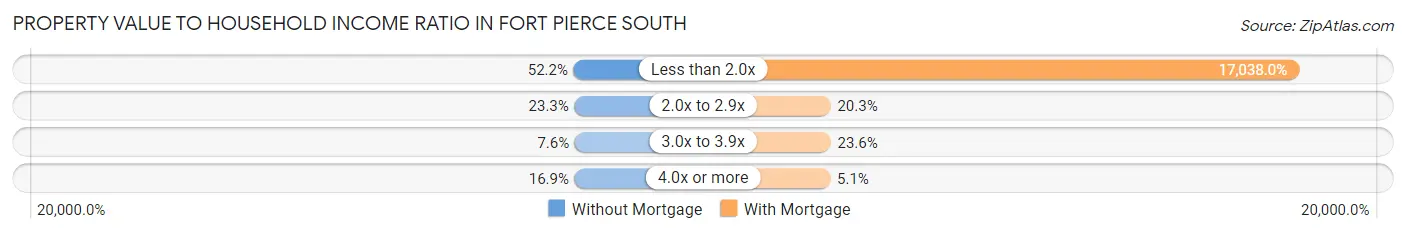
| Value-to-Income Ratio | Without Mortgage | With Mortgage |
| Less than 2.0x | 426 (52.2%) | 103,250 (17,038.0%) |
| 2.0x to 2.9x | 190 (23.3%) | 123 (20.3%) |
| 3.0x to 3.9x | 62 (7.6%) | 143 (23.6%) |
| 4.0x or more | 138 (16.9%) | 31 (5.1%) |
| Total | 816 (100.0%) | 606 (100.0%) |
Real Estate Taxes by Mortgage Status in Fort Pierce South
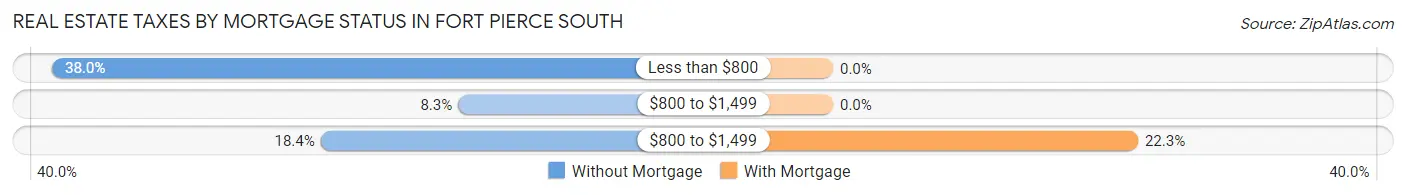
| Property Taxes | Without Mortgage | With Mortgage |
| Less than $800 | 310 (38.0%) | 0 (0.0%) |
| $800 to $1,499 | 68 (8.3%) | 0 (0.0%) |
| $800 to $1,499 | 150 (18.4%) | 135 (22.3%) |
| Total | 816 (100.0%) | 606 (100.0%) |
Health & Disability in Fort Pierce South
Health Insurance Coverage by Age in Fort Pierce South
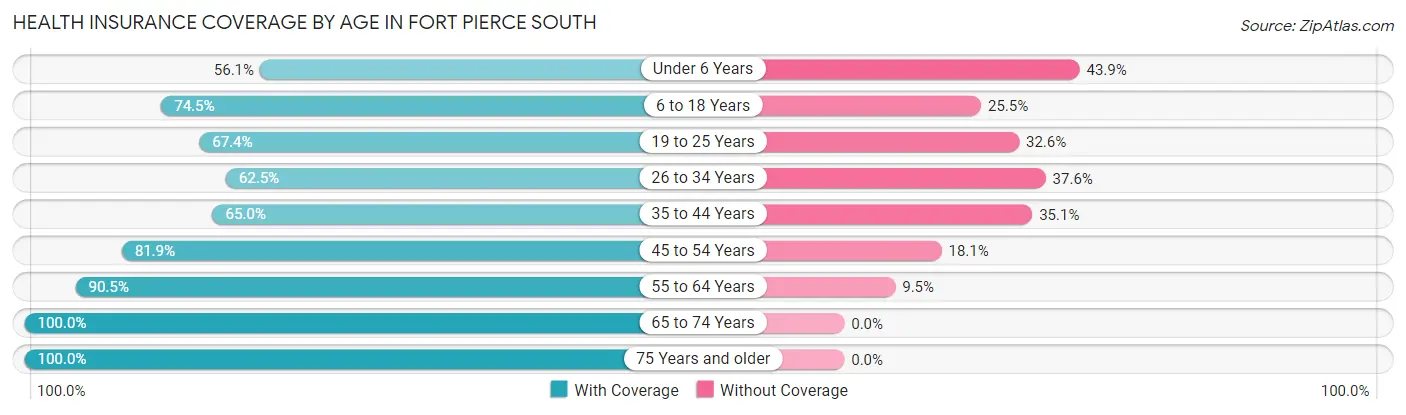
| Age Bracket | With Coverage | Without Coverage |
| Under 6 Years | 119 (56.1%) | 93 (43.9%) |
| 6 to 18 Years | 710 (74.5%) | 243 (25.5%) |
| 19 to 25 Years | 182 (67.4%) | 88 (32.6%) |
| 26 to 34 Years | 592 (62.5%) | 356 (37.6%) |
| 35 to 44 Years | 493 (64.9%) | 266 (35.0%) |
| 45 to 54 Years | 632 (81.9%) | 140 (18.1%) |
| 55 to 64 Years | 352 (90.5%) | 37 (9.5%) |
| 65 to 74 Years | 620 (100.0%) | 0 (0.0%) |
| 75 Years and older | 377 (100.0%) | 0 (0.0%) |
| Total | 4,077 (76.9%) | 1,223 (23.1%) |
Health Insurance Coverage by Citizenship Status in Fort Pierce South
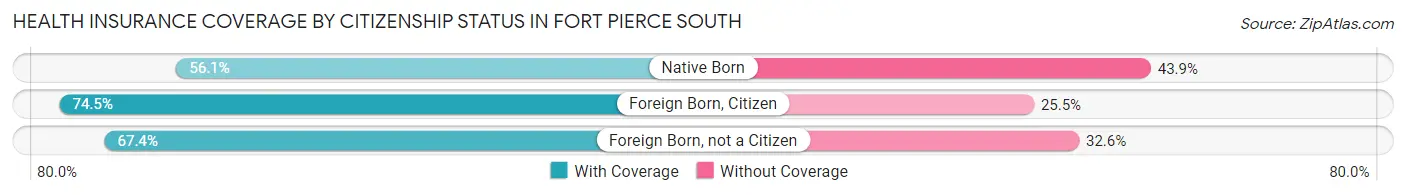
| Citizenship Status | With Coverage | Without Coverage |
| Native Born | 119 (56.1%) | 93 (43.9%) |
| Foreign Born, Citizen | 710 (74.5%) | 243 (25.5%) |
| Foreign Born, not a Citizen | 182 (67.4%) | 88 (32.6%) |
Health Insurance Coverage by Household Income in Fort Pierce South
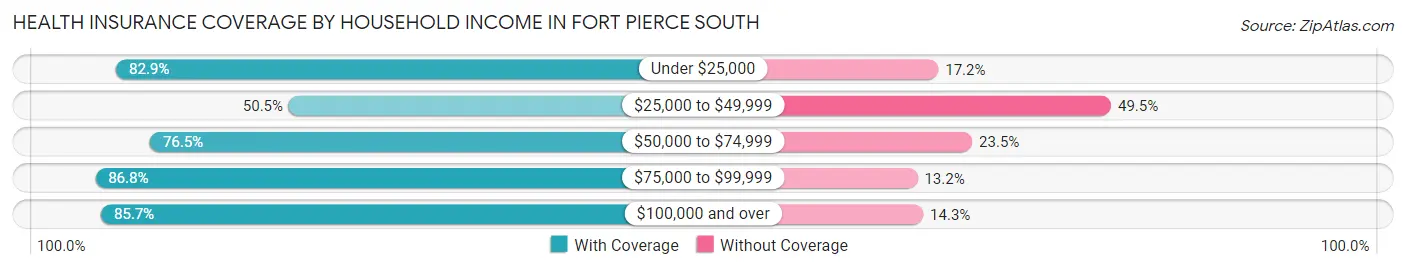
| Household Income | With Coverage | Without Coverage |
| Under $25,000 | 821 (82.9%) | 170 (17.2%) |
| $25,000 to $49,999 | 466 (50.5%) | 457 (49.5%) |
| $50,000 to $74,999 | 1,003 (76.5%) | 308 (23.5%) |
| $75,000 to $99,999 | 662 (86.8%) | 101 (13.2%) |
| $100,000 and over | 1,120 (85.7%) | 187 (14.3%) |
Public vs Private Health Insurance Coverage by Age in Fort Pierce South
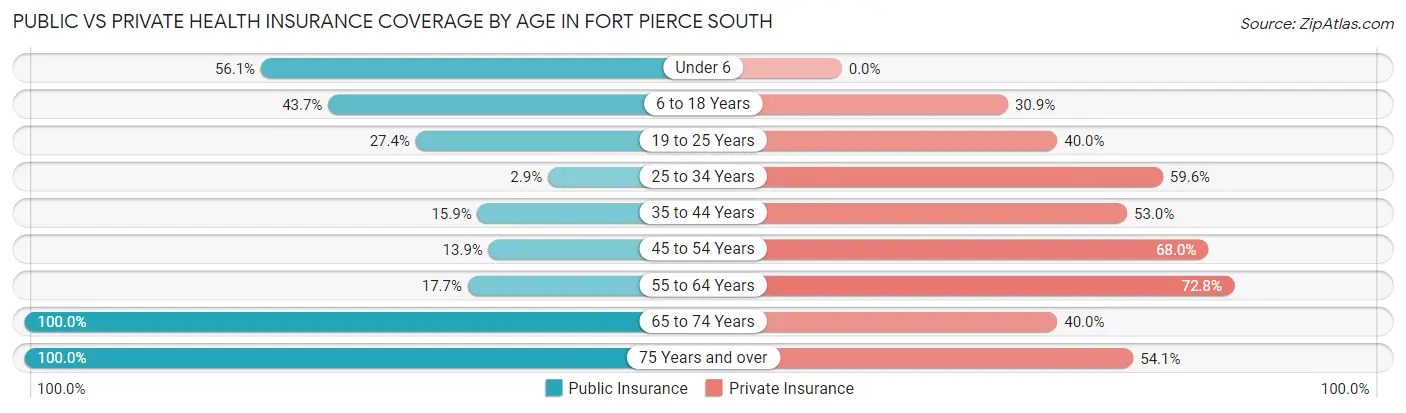
| Age Bracket | Public Insurance | Private Insurance |
| Under 6 | 119 (56.1%) | 0 (0.0%) |
| 6 to 18 Years | 416 (43.6%) | 294 (30.8%) |
| 19 to 25 Years | 74 (27.4%) | 108 (40.0%) |
| 25 to 34 Years | 27 (2.9%) | 565 (59.6%) |
| 35 to 44 Years | 121 (15.9%) | 402 (53.0%) |
| 45 to 54 Years | 107 (13.9%) | 525 (68.0%) |
| 55 to 64 Years | 69 (17.7%) | 283 (72.8%) |
| 65 to 74 Years | 620 (100.0%) | 248 (40.0%) |
| 75 Years and over | 377 (100.0%) | 204 (54.1%) |
| Total | 1,930 (36.4%) | 2,629 (49.6%) |
Disability Status by Sex by Age in Fort Pierce South
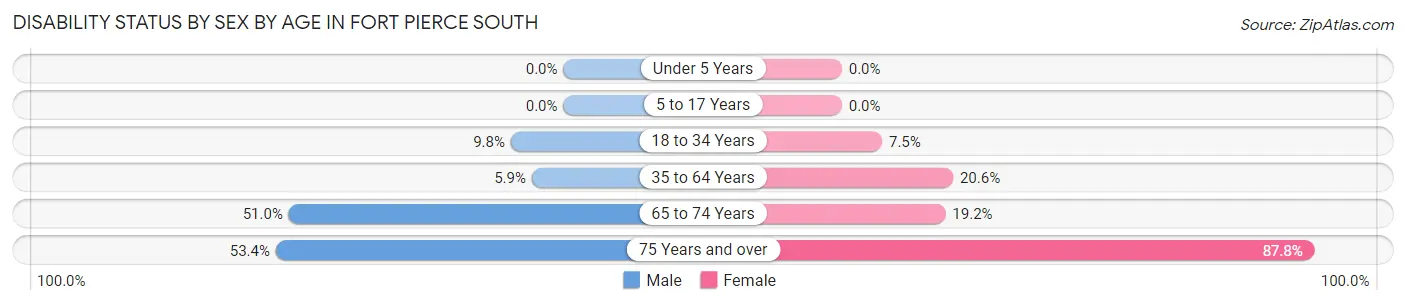
| Age Bracket | Male | Female |
| Under 5 Years | 0 (0.0%) | 0 (0.0%) |
| 5 to 17 Years | 0 (0.0%) | 0 (0.0%) |
| 18 to 34 Years | 74 (9.8%) | 36 (7.5%) |
| 35 to 64 Years | 56 (5.9%) | 199 (20.6%) |
| 65 to 74 Years | 157 (51.0%) | 60 (19.2%) |
| 75 Years and over | 79 (53.4%) | 201 (87.8%) |
Disability Class by Sex by Age in Fort Pierce South
Disability Class: Hearing Difficulty
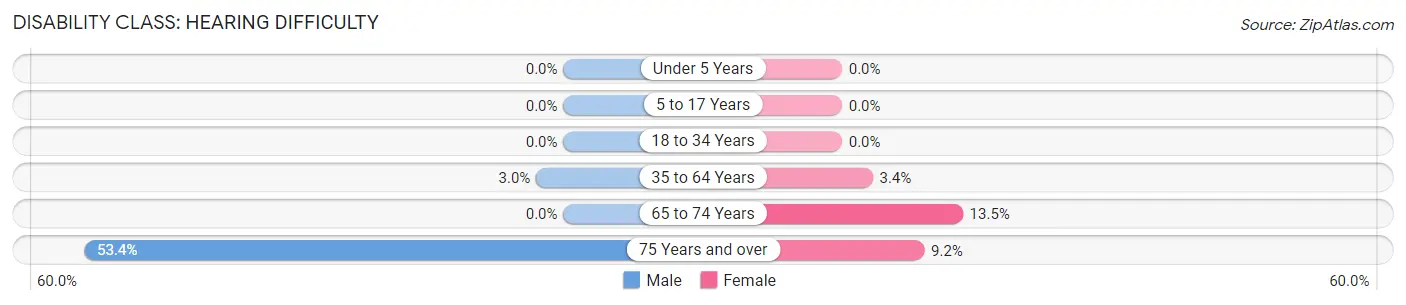
| Age Bracket | Male | Female |
| Under 5 Years | 0 (0.0%) | 0 (0.0%) |
| 5 to 17 Years | 0 (0.0%) | 0 (0.0%) |
| 18 to 34 Years | 0 (0.0%) | 0 (0.0%) |
| 35 to 64 Years | 29 (3.0%) | 33 (3.4%) |
| 65 to 74 Years | 0 (0.0%) | 42 (13.5%) |
| 75 Years and over | 79 (53.4%) | 21 (9.2%) |
Disability Class: Vision Difficulty
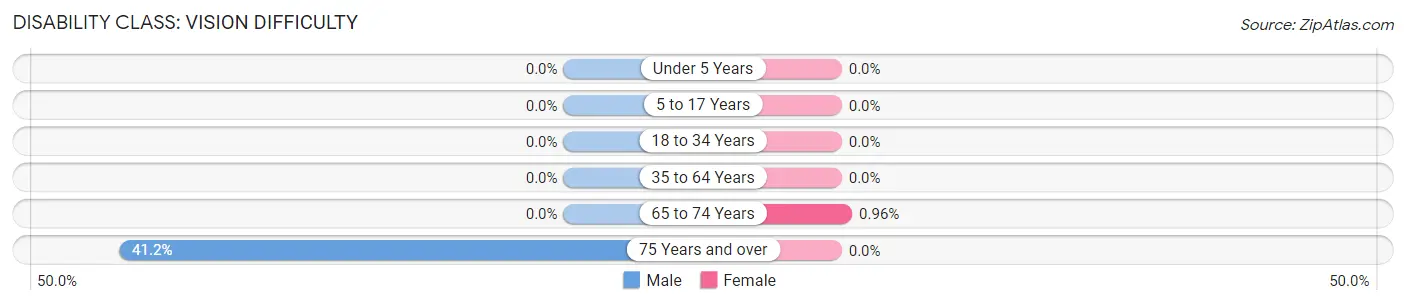
| Age Bracket | Male | Female |
| Under 5 Years | 0 (0.0%) | 0 (0.0%) |
| 5 to 17 Years | 0 (0.0%) | 0 (0.0%) |
| 18 to 34 Years | 0 (0.0%) | 0 (0.0%) |
| 35 to 64 Years | 0 (0.0%) | 0 (0.0%) |
| 65 to 74 Years | 0 (0.0%) | 3 (1.0%) |
| 75 Years and over | 61 (41.2%) | 0 (0.0%) |
Disability Class: Cognitive Difficulty
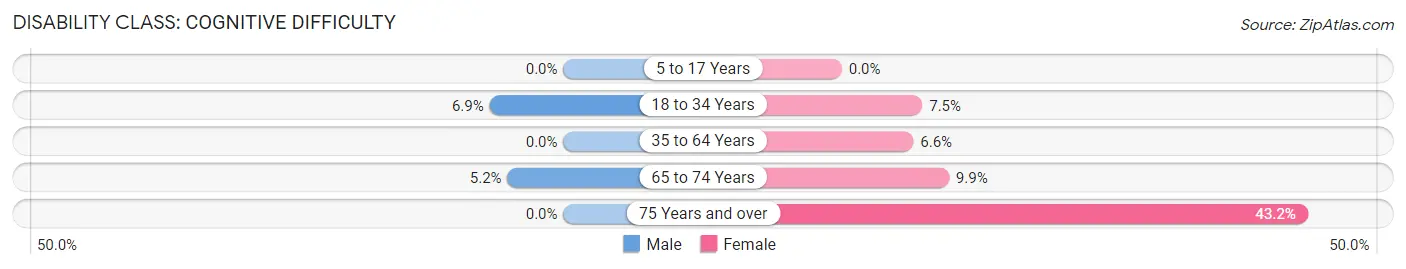
| Age Bracket | Male | Female |
| 5 to 17 Years | 0 (0.0%) | 0 (0.0%) |
| 18 to 34 Years | 52 (6.9%) | 36 (7.5%) |
| 35 to 64 Years | 0 (0.0%) | 64 (6.6%) |
| 65 to 74 Years | 16 (5.2%) | 31 (9.9%) |
| 75 Years and over | 0 (0.0%) | 99 (43.2%) |
Disability Class: Ambulatory Difficulty
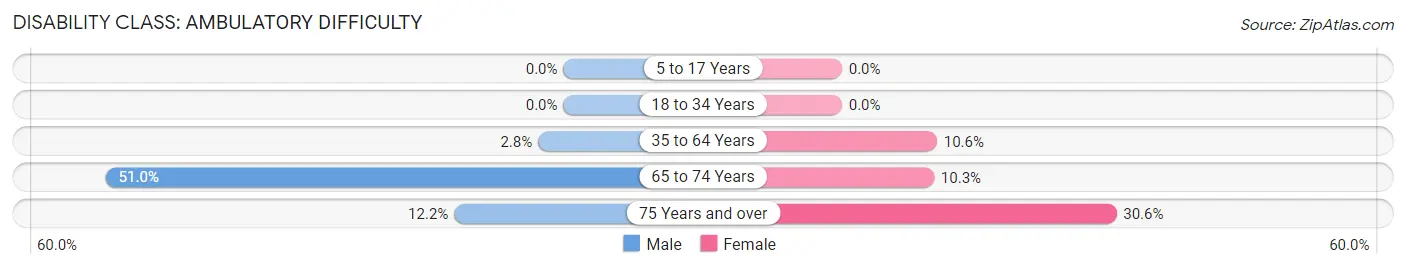
| Age Bracket | Male | Female |
| 5 to 17 Years | 0 (0.0%) | 0 (0.0%) |
| 18 to 34 Years | 0 (0.0%) | 0 (0.0%) |
| 35 to 64 Years | 27 (2.8%) | 102 (10.6%) |
| 65 to 74 Years | 157 (51.0%) | 32 (10.3%) |
| 75 Years and over | 18 (12.2%) | 70 (30.6%) |
Disability Class: Self-Care Difficulty
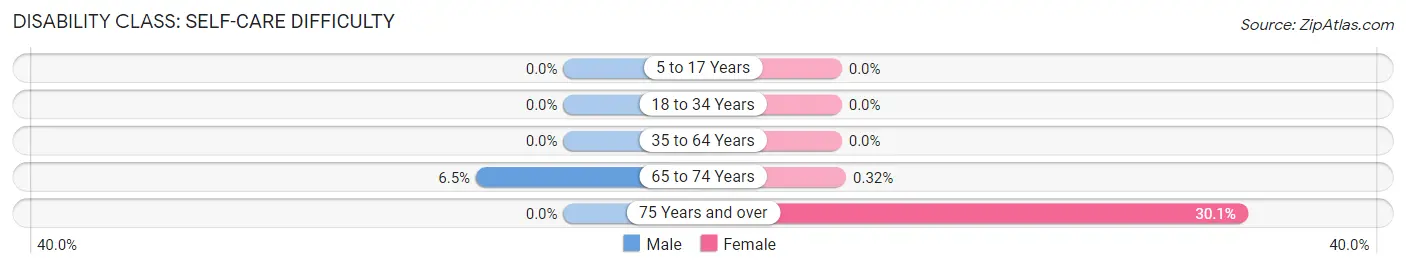
| Age Bracket | Male | Female |
| 5 to 17 Years | 0 (0.0%) | 0 (0.0%) |
| 18 to 34 Years | 0 (0.0%) | 0 (0.0%) |
| 35 to 64 Years | 0 (0.0%) | 0 (0.0%) |
| 65 to 74 Years | 20 (6.5%) | 1 (0.3%) |
| 75 Years and over | 0 (0.0%) | 69 (30.1%) |
Technology Access in Fort Pierce South
Computing Device Access in Fort Pierce South
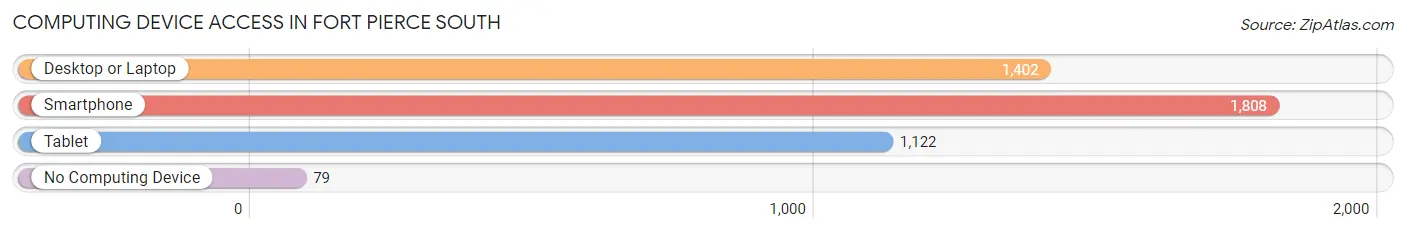
| Device Type | # Households | % Households |
| Desktop or Laptop | 1,402 | 65.0% |
| Smartphone | 1,808 | 83.9% |
| Tablet | 1,122 | 52.0% |
| No Computing Device | 79 | 3.7% |
| Total | 2,156 | 100.0% |
Internet Access in Fort Pierce South
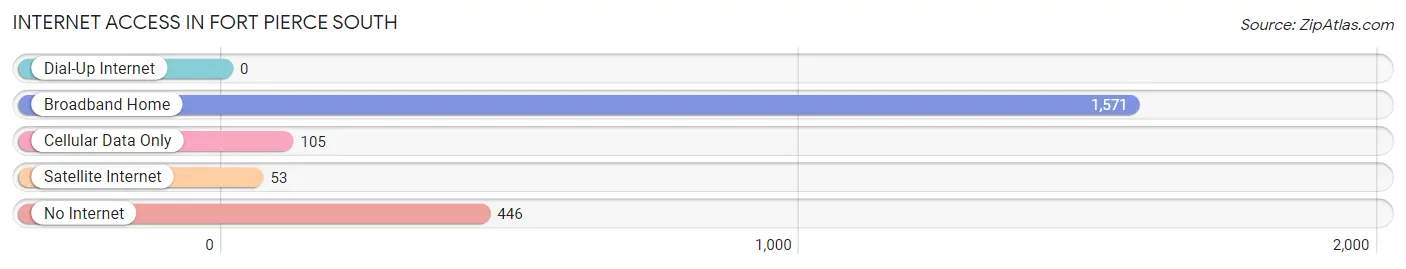
| Internet Type | # Households | % Households |
| Dial-Up Internet | 0 | 0.0% |
| Broadband Home | 1,571 | 72.9% |
| Cellular Data Only | 105 | 4.9% |
| Satellite Internet | 53 | 2.5% |
| No Internet | 446 | 20.7% |
| Total | 2,156 | 100.0% |
Fort Pierce South Summary
Pierce South, Florida is a city located in St. Lucie County, Florida, United States. It is part of the Port St. Lucie Metropolitan Statistical Area. As of the 2010 census, the population of Fort Pierce South was 16,845.
History
Fort Pierce South was originally part of the Seminole Indian Reservation, which was established in 1838. The area was later developed as a farming community in the late 19th century. The city was incorporated in 1925 and was named after Fort Pierce, a nearby military fort that was built in 1838.
Geography
Fort Pierce South is located at 27°25'N 80°20'W (27.4167, -80.3333). It is situated on the Indian River Lagoon, which is part of the Atlantic Intracoastal Waterway. The city has a total area of 8.3 square miles, of which 8.2 square miles is land and 0.1 square miles is water.
Economy
The economy of Fort Pierce South is largely based on tourism and agriculture. The city is home to several tourist attractions, including the St. Lucie County Aquarium, the St. Lucie County Historical Museum, and the St. Lucie County Fairgrounds. The city also has a thriving agricultural industry, with citrus, sugarcane, and vegetables being the main crops.
Demographics
As of the 2010 census, there were 16,845 people, 6,845 households, and 4,541 families residing in the city. The population density was 2,039.3 people per square mile. The racial makeup of the city was 68.2% White, 22.3% African American, 0.4% Native American, 1.2% Asian, 0.1% Pacific Islander, 5.2% from other races, and 2.7% from two or more races. Hispanic or Latino of any race were 14.3% of the population.
The median income for a household in the city was $35,945, and the median income for a family was $41,945. Males had a median income of $30,945 versus $25,945 for females. The per capita income for the city was $17,945. About 14.3% of families and 17.3% of the population were below the poverty line, including 25.3% of those under age 18 and 11.3% of those age 65 or over.
Conclusion
Fort Pierce South, Florida is a city located in St. Lucie County, Florida, United States. It is part of the Port St. Lucie Metropolitan Statistical Area. The city has a rich history, with its roots in the Seminole Indian Reservation and its development as a farming community in the late 19th century. The city has a total area of 8.3 square miles, of which 8.2 square miles is land and 0.1 square miles is water. The economy of Fort Pierce South is largely based on tourism and agriculture. As of the 2010 census, there were 16,845 people, 6,845 households, and 4,541 families residing in the city. The median income for a household in the city was $35,945, and the median income for a family was $41,945. Fort Pierce South is a vibrant city with a rich history and a diverse economy.
Common Questions
What is Per Capita Income in Fort Pierce South?
Per Capita income in Fort Pierce South is $27,152.
What is the Median Family Income in Fort Pierce South?
Median Family Income in Fort Pierce South is $63,184.
What is the Median Household income in Fort Pierce South?
Median Household Income in Fort Pierce South is $53,302.
What is Income or Wage Gap in Fort Pierce South?
Income or Wage Gap in Fort Pierce South is 19.1%.
Women in Fort Pierce South earn 80.9 cents for every dollar earned by a man.
What is Inequality or Gini Index in Fort Pierce South?
Inequality or Gini Index in Fort Pierce South is 0.45.
What is the Total Population of Fort Pierce South?
Total Population of Fort Pierce South is 5,314.
What is the Total Male Population of Fort Pierce South?
Total Male Population of Fort Pierce South is 2,490.
What is the Total Female Population of Fort Pierce South?
Total Female Population of Fort Pierce South is 2,824.
What is the Ratio of Males per 100 Females in Fort Pierce South?
There are 88.17 Males per 100 Females in Fort Pierce South.
What is the Ratio of Females per 100 Males in Fort Pierce South?
There are 113.41 Females per 100 Males in Fort Pierce South.
What is the Median Population Age in Fort Pierce South?
Median Population Age in Fort Pierce South is 39.0 Years.
What is the Average Family Size in Fort Pierce South
Average Family Size in Fort Pierce South is 3.3 People.
What is the Average Household Size in Fort Pierce South
Average Household Size in Fort Pierce South is 2.5 People.
How Large is the Labor Force in Fort Pierce South?
There are 2,630 People in the Labor Forcein in Fort Pierce South.
What is the Percentage of People in the Labor Force in Fort Pierce South?
60.6% of People are in the Labor Force in Fort Pierce South.
What is the Unemployment Rate in Fort Pierce South?
Unemployment Rate in Fort Pierce South is 1.5%.