Cheval, FL Map & Demographics
Cheval Map
Cheval Overview
$48,945
PER CAPITA INCOME
$119,696
AVG FAMILY INCOME
$79,963
AVG HOUSEHOLD INCOME
41.7%
WAGE / INCOME GAP [ % ]
58.3¢/ $1
WAGE / INCOME GAP [ $ ]
0.48
INEQUALITY / GINI INDEX
13,189
TOTAL POPULATION
6,637
MALE POPULATION
6,552
FEMALE POPULATION
101.30
MALES / 100 FEMALES
98.72
FEMALES / 100 MALES
39.8
MEDIAN AGE
3.2
AVG FAMILY SIZE
2.6
AVG HOUSEHOLD SIZE
6,724
LABOR FORCE [ PEOPLE ]
65.0%
PERCENT IN LABOR FORCE
4.8%
UNEMPLOYMENT RATE
Income in Cheval
Income Overview in Cheval
Per Capita Income in Cheval is $48,945, while median incomes of families and households are $119,696 and $79,963 respectively.
| Characteristic | Number | Measure |
| Per Capita Income | 13,189 | $48,945 |
| Median Family Income | 3,516 | $119,696 |
| Mean Family Income | 3,516 | $157,026 |
| Median Household Income | 5,029 | $79,963 |
| Mean Household Income | 5,029 | $129,370 |
| Income Deficit | 3,516 | $0 |
| Wage / Income Gap (%) | 13,189 | 41.66% |
| Wage / Income Gap ($) | 13,189 | 58.34¢ per $1 |
| Gini / Inequality Index | 13,189 | 0.48 |
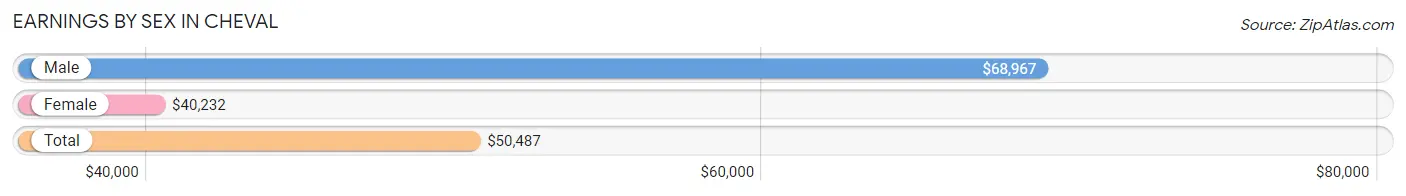
Earnings by Sex in Cheval
Average Earnings in Cheval are $50,487, $68,967 for men and $40,232 for women, a difference of 41.7%.
| Sex | Number | Average Earnings |
| Male | 3,988 (56.1%) | $68,967 |
| Female | 3,122 (43.9%) | $40,232 |
| Total | 7,110 (100.0%) | $50,487 |
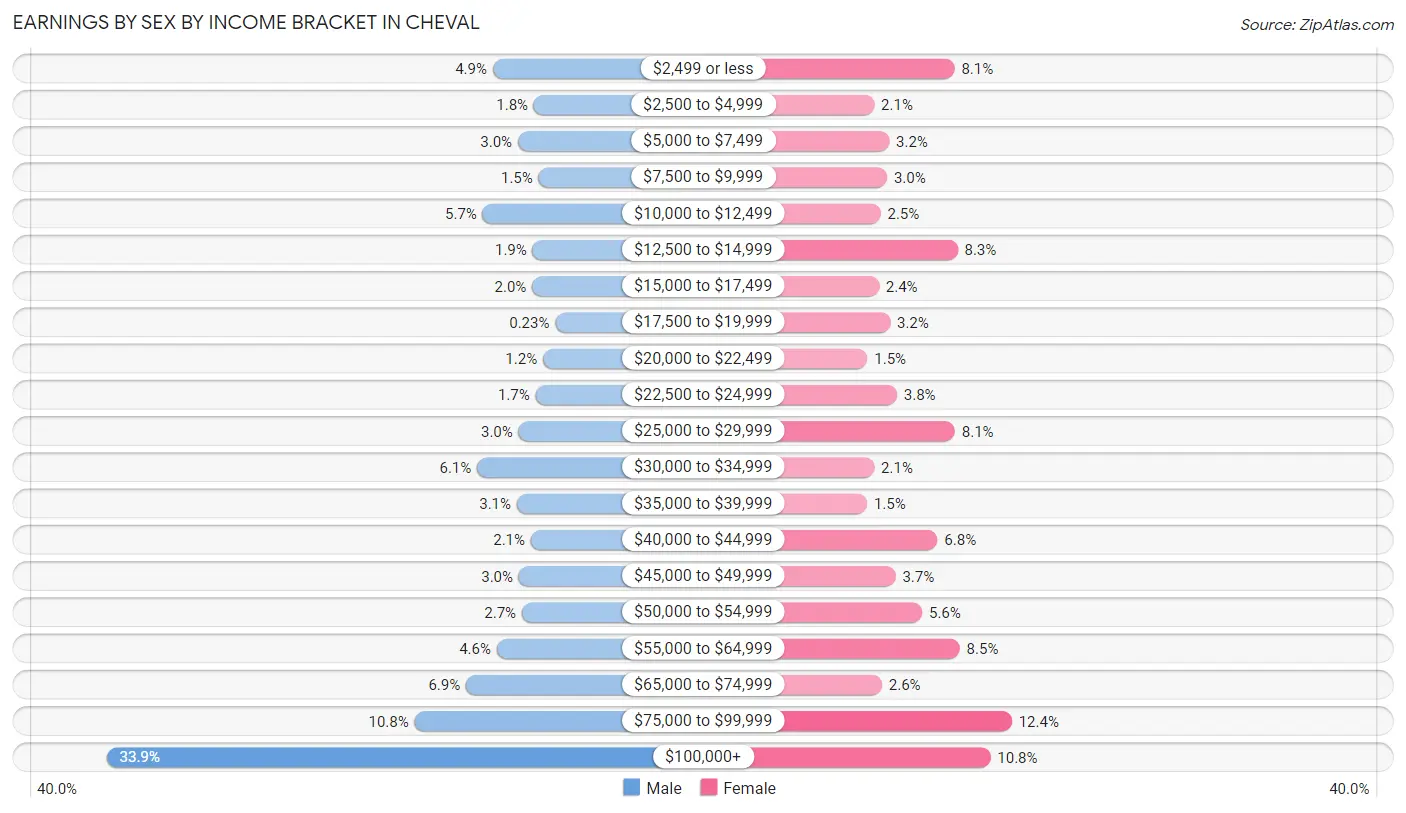
Earnings by Sex by Income Bracket in Cheval
The most common earnings brackets in Cheval are $100,000+ for men (1,350 | 33.9%) and $75,000 to $99,999 for women (386 | 12.4%).
| Income | Male | Female |
| $2,499 or less | 196 (4.9%) | 252 (8.1%) |
| $2,500 to $4,999 | 73 (1.8%) | 64 (2.1%) |
| $5,000 to $7,499 | 121 (3.0%) | 99 (3.2%) |
| $7,500 to $9,999 | 59 (1.5%) | 94 (3.0%) |
| $10,000 to $12,499 | 226 (5.7%) | 79 (2.5%) |
| $12,500 to $14,999 | 77 (1.9%) | 259 (8.3%) |
| $15,000 to $17,499 | 78 (2.0%) | 75 (2.4%) |
| $17,500 to $19,999 | 9 (0.2%) | 101 (3.2%) |
| $20,000 to $22,499 | 46 (1.1%) | 48 (1.5%) |
| $22,500 to $24,999 | 68 (1.7%) | 117 (3.7%) |
| $25,000 to $29,999 | 119 (3.0%) | 253 (8.1%) |
| $30,000 to $34,999 | 243 (6.1%) | 64 (2.1%) |
| $35,000 to $39,999 | 124 (3.1%) | 47 (1.5%) |
| $40,000 to $44,999 | 82 (2.1%) | 212 (6.8%) |
| $45,000 to $49,999 | 118 (3.0%) | 114 (3.6%) |
| $50,000 to $54,999 | 109 (2.7%) | 176 (5.6%) |
| $55,000 to $64,999 | 184 (4.6%) | 264 (8.5%) |
| $65,000 to $74,999 | 276 (6.9%) | 82 (2.6%) |
| $75,000 to $99,999 | 430 (10.8%) | 386 (12.4%) |
| $100,000+ | 1,350 (33.9%) | 336 (10.8%) |
| Total | 3,988 (100.0%) | 3,122 (100.0%) |
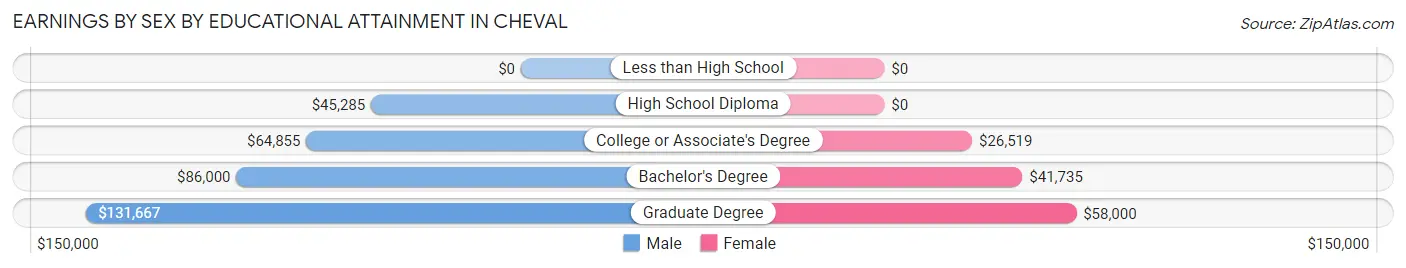
Earnings by Sex by Educational Attainment in Cheval
Average earnings in Cheval are $80,413 for men and $45,609 for women, a difference of 43.3%. Men with an educational attainment of graduate degree enjoy the highest average annual earnings of $131,667, while those with high school diploma education earn the least with $45,285. Women with an educational attainment of graduate degree earn the most with the average annual earnings of $58,000, while those with college or associate's degree education have the smallest earnings of $26,519.
| Educational Attainment | Male Income | Female Income |
| Less than High School | - | - |
| High School Diploma | $45,285 | $0 |
| College or Associate's Degree | $64,855 | $26,519 |
| Bachelor's Degree | $86,000 | $41,735 |
| Graduate Degree | $131,667 | $58,000 |
| Total | $80,413 | $45,609 |
Family Income in Cheval
Family Income Brackets in Cheval
According to the Cheval family income data, there are 717 families falling into the $200,000+ income range, which is the most common income bracket and makes up 20.4% of all families. Conversely, the $15,000 to $24,999 income bracket is the least frequent group with only 28 families (0.8%) belonging to this category.
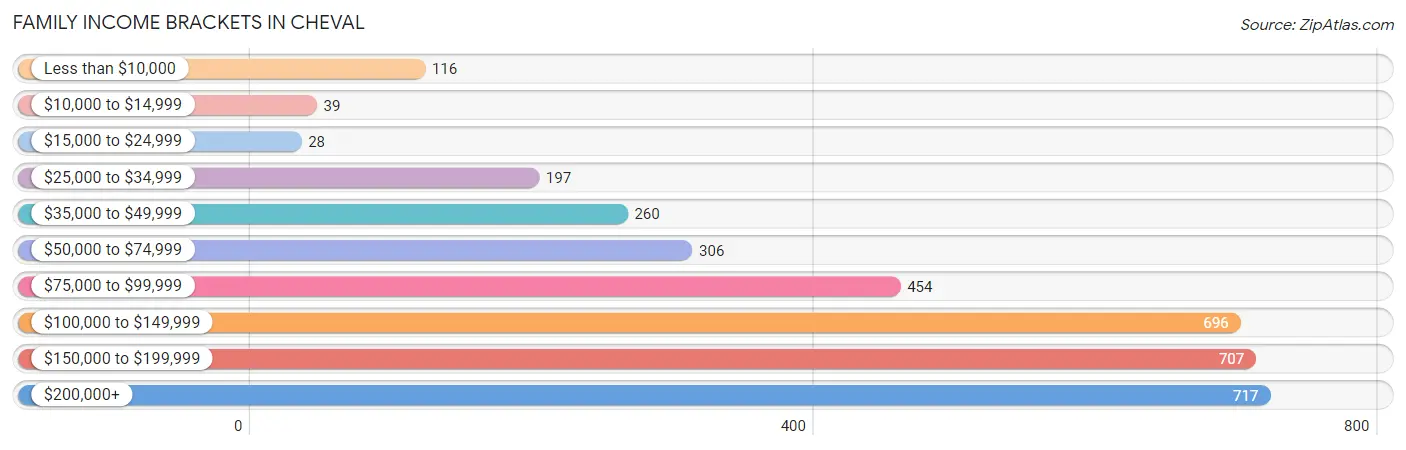
| Income Bracket | # Families | % Families |
| Less than $10,000 | 116 | 3.3% |
| $10,000 to $14,999 | 39 | 1.1% |
| $15,000 to $24,999 | 28 | 0.8% |
| $25,000 to $34,999 | 197 | 5.6% |
| $35,000 to $49,999 | 260 | 7.4% |
| $50,000 to $74,999 | 306 | 8.7% |
| $75,000 to $99,999 | 454 | 12.9% |
| $100,000 to $149,999 | 696 | 19.8% |
| $150,000 to $199,999 | 707 | 20.1% |
| $200,000+ | 717 | 20.4% |
Family Income by Famaliy Size in Cheval
6-person families (91 | 2.6%) account for the highest median family income in Cheval with $250,001 per family, while 2-person families (1,431 | 40.7%) have the highest median income of $50,670 per family member.
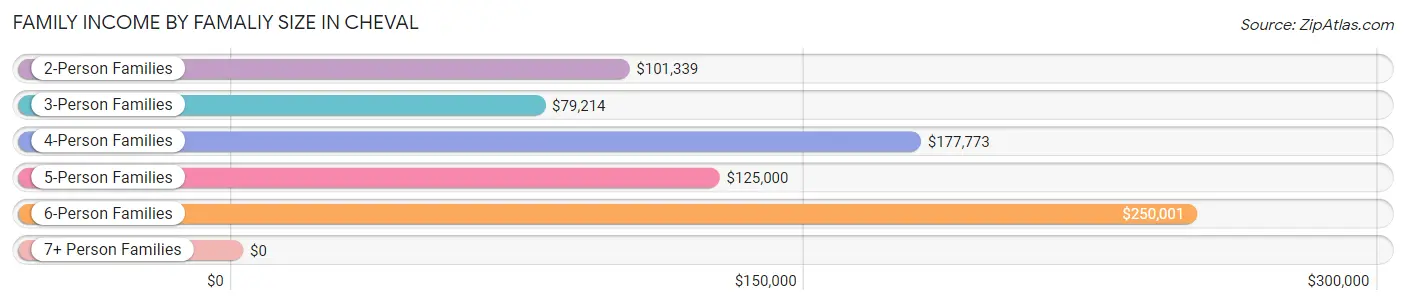
| Income Bracket | # Families | Median Income |
| 2-Person Families | 1,431 (40.7%) | $101,339 |
| 3-Person Families | 787 (22.4%) | $79,214 |
| 4-Person Families | 826 (23.5%) | $177,773 |
| 5-Person Families | 368 (10.5%) | $125,000 |
| 6-Person Families | 91 (2.6%) | $250,001 |
| 7+ Person Families | 13 (0.4%) | $0 |
| Total | 3,516 (100.0%) | $119,696 |
Family Income by Number of Earners in Cheval
The median family income in Cheval is $119,696, with families comprising 2 earners (1,764) having the highest median family income of $147,083, while families with no earners (402) have the lowest median family income of $54,400, accounting for 50.2% and 11.4% of families, respectively.
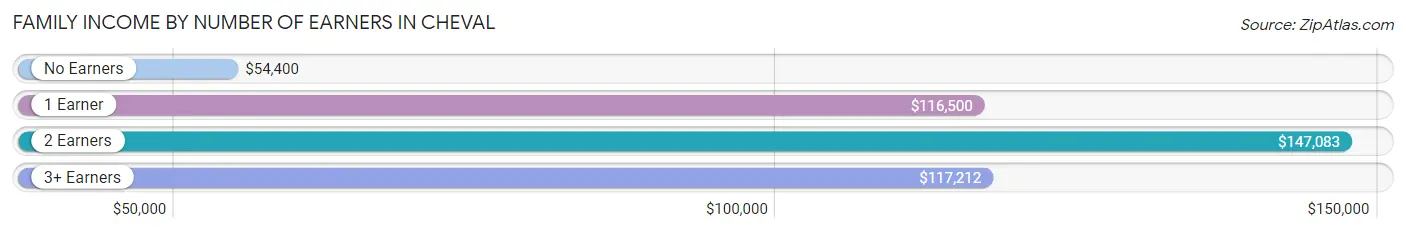
| Number of Earners | # Families | Median Income |
| No Earners | 402 (11.4%) | $54,400 |
| 1 Earner | 1,002 (28.5%) | $116,500 |
| 2 Earners | 1,764 (50.2%) | $147,083 |
| 3+ Earners | 348 (9.9%) | $117,212 |
| Total | 3,516 (100.0%) | $119,696 |
Household Income in Cheval
Household Income Brackets in Cheval
With 790 households falling in the category, the $200,000+ income range is the most frequent in Cheval, accounting for 15.7% of all households. In contrast, only 126 households (2.5%) fall into the $10,000 to $14,999 income bracket, making it the least populous group.
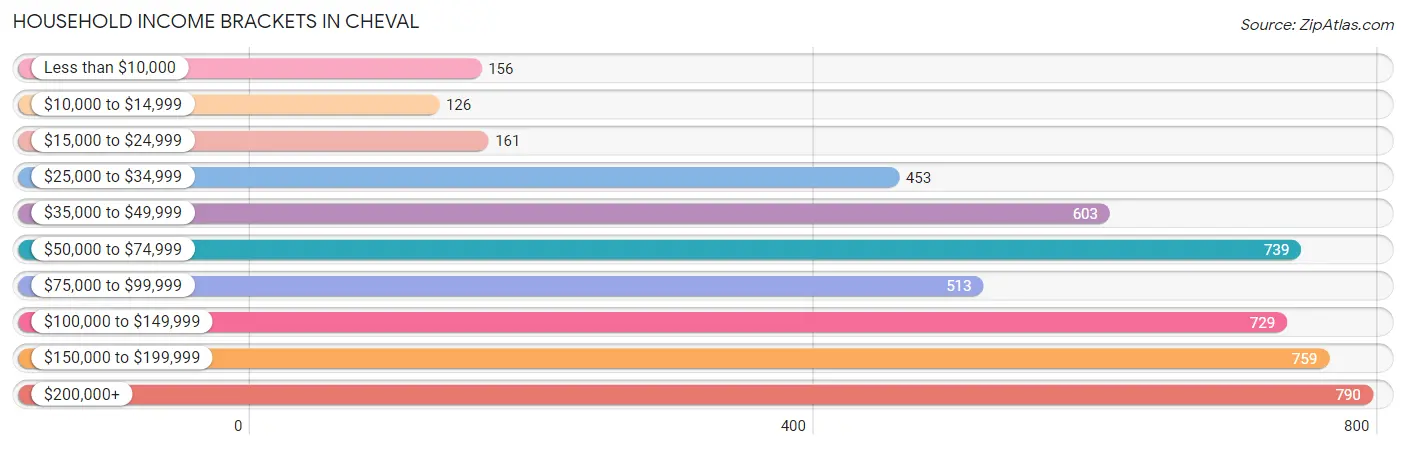
| Income Bracket | # Households | % Households |
| Less than $10,000 | 156 | 3.1% |
| $10,000 to $14,999 | 126 | 2.5% |
| $15,000 to $24,999 | 161 | 3.2% |
| $25,000 to $34,999 | 453 | 9.0% |
| $35,000 to $49,999 | 603 | 12.0% |
| $50,000 to $74,999 | 739 | 14.7% |
| $75,000 to $99,999 | 513 | 10.2% |
| $100,000 to $149,999 | 729 | 14.5% |
| $150,000 to $199,999 | 759 | 15.1% |
| $200,000+ | 790 | 15.7% |
Household Income by Householder Age in Cheval
The median household income in Cheval is $79,963, with the highest median household income of $116,940 found in the 45 to 64 years age bracket for the primary householder. A total of 2,362 households (47.0%) fall into this category. Meanwhile, the 15 to 24 years age bracket for the primary householder has the lowest median household income of $0, with 173 households (3.4%) in this group.
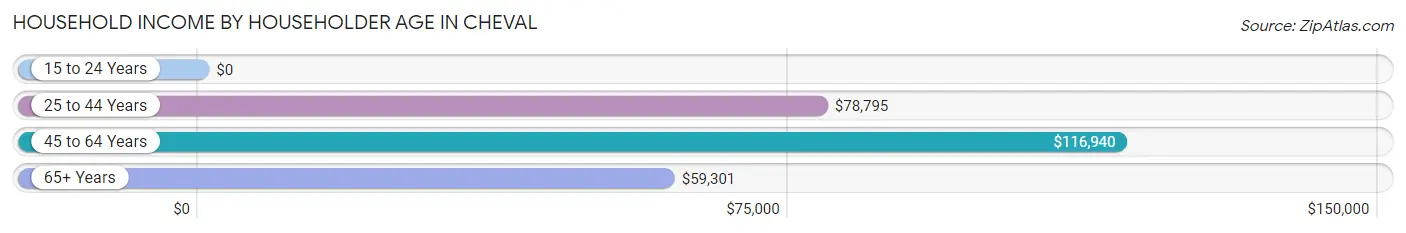
| Income Bracket | # Households | Median Income |
| 15 to 24 Years | 173 (3.4%) | $0 |
| 25 to 44 Years | 1,349 (26.8%) | $78,795 |
| 45 to 64 Years | 2,362 (47.0%) | $116,940 |
| 65+ Years | 1,145 (22.8%) | $59,301 |
| Total | 5,029 (100.0%) | $79,963 |
Poverty in Cheval
Income Below Poverty by Sex and Age in Cheval
With 5.2% poverty level for males and 5.2% for females among the residents of Cheval, 15 year old males and 12 to 14 year old females are the most vulnerable to poverty, with 63 males (35.0%) and 26 females (12.6%) in their respective age groups living below the poverty level.
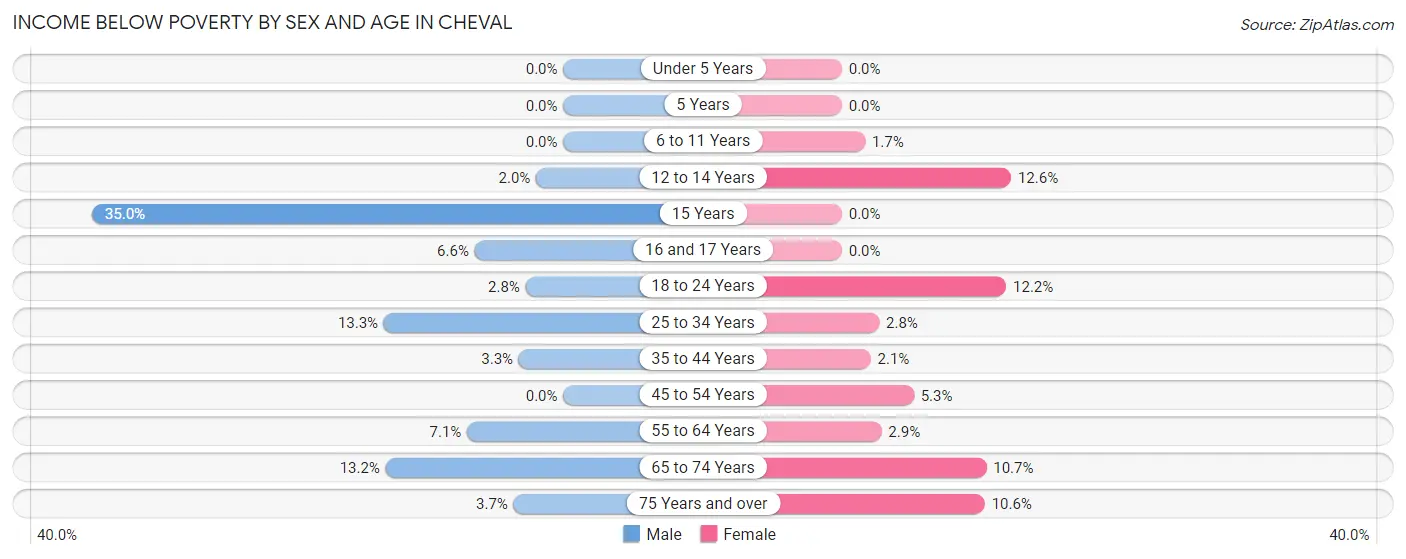
| Age Bracket | Male | Female |
| Under 5 Years | 0 (0.0%) | 0 (0.0%) |
| 5 Years | 0 (0.0%) | 0 (0.0%) |
| 6 to 11 Years | 0 (0.0%) | 9 (1.7%) |
| 12 to 14 Years | 7 (2.0%) | 26 (12.6%) |
| 15 Years | 63 (35.0%) | 0 (0.0%) |
| 16 and 17 Years | 10 (6.6%) | 0 (0.0%) |
| 18 to 24 Years | 21 (2.8%) | 65 (12.2%) |
| 25 to 34 Years | 75 (13.3%) | 19 (2.8%) |
| 35 to 44 Years | 26 (3.3%) | 18 (2.1%) |
| 45 to 54 Years | 0 (0.0%) | 46 (5.3%) |
| 55 to 64 Years | 64 (7.1%) | 25 (2.9%) |
| 65 to 74 Years | 69 (13.2%) | 91 (10.7%) |
| 75 Years and over | 11 (3.7%) | 40 (10.6%) |
| Total | 346 (5.2%) | 339 (5.2%) |
Income Above Poverty by Sex and Age in Cheval
According to the poverty statistics in Cheval, males aged under 5 years and females aged under 5 years are the age groups that are most secure financially, with 100.0% of males and 100.0% of females in these age groups living above the poverty line.
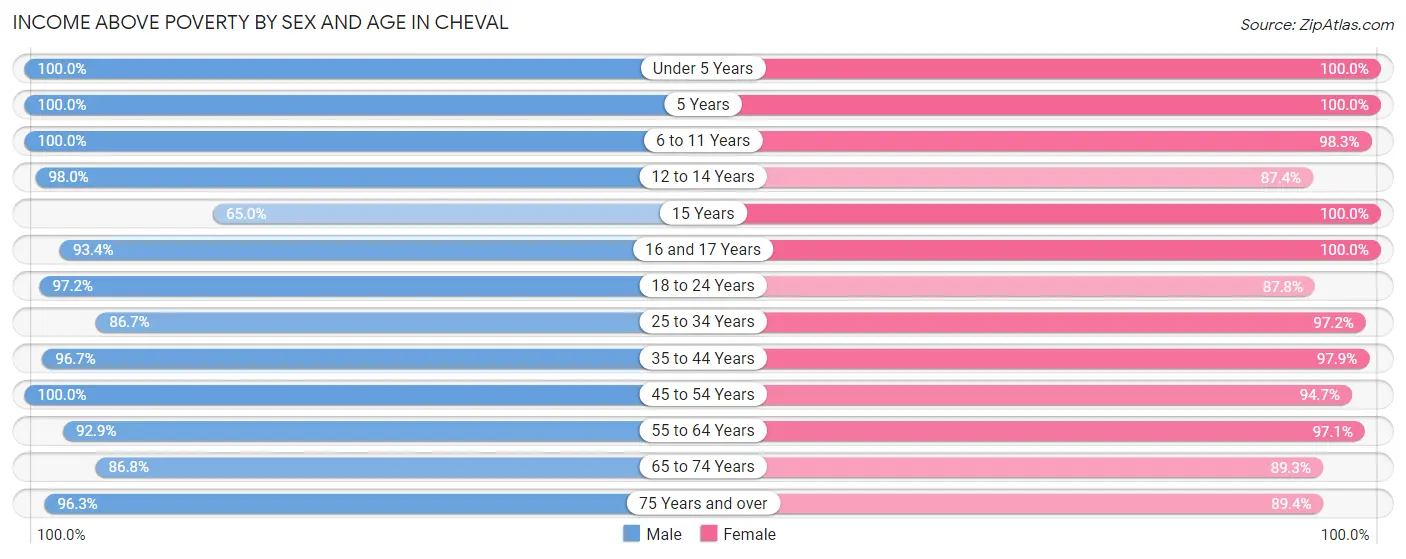
| Age Bracket | Male | Female |
| Under 5 Years | 359 (100.0%) | 435 (100.0%) |
| 5 Years | 159 (100.0%) | 15 (100.0%) |
| 6 to 11 Years | 476 (100.0%) | 515 (98.3%) |
| 12 to 14 Years | 340 (98.0%) | 181 (87.4%) |
| 15 Years | 117 (65.0%) | 107 (100.0%) |
| 16 and 17 Years | 142 (93.4%) | 245 (100.0%) |
| 18 to 24 Years | 729 (97.2%) | 468 (87.8%) |
| 25 to 34 Years | 488 (86.7%) | 667 (97.2%) |
| 35 to 44 Years | 762 (96.7%) | 825 (97.9%) |
| 45 to 54 Years | 1,133 (100.0%) | 815 (94.7%) |
| 55 to 64 Years | 832 (92.9%) | 824 (97.1%) |
| 65 to 74 Years | 454 (86.8%) | 757 (89.3%) |
| 75 Years and over | 287 (96.3%) | 337 (89.4%) |
| Total | 6,278 (94.8%) | 6,191 (94.8%) |
Income Below Poverty Among Married-Couple Families in Cheval
The poverty statistics for married-couple families in Cheval show that 4.8% or 130 of the total 2,708 families live below the poverty line. Families with no children have the highest poverty rate of 8.3%, comprising of 111 families. On the other hand, families with 3 or 4 children have the lowest poverty rate of 0.0%, which includes 0 families.
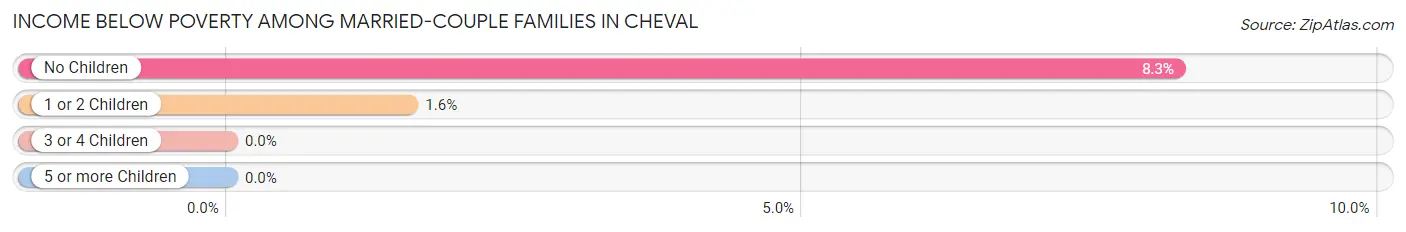
| Children | Above Poverty | Below Poverty |
| No Children | 1,234 (91.7%) | 111 (8.3%) |
| 1 or 2 Children | 1,189 (98.4%) | 19 (1.6%) |
| 3 or 4 Children | 142 (100.0%) | 0 (0.0%) |
| 5 or more Children | 13 (100.0%) | 0 (0.0%) |
| Total | 2,578 (95.2%) | 130 (4.8%) |
Income Below Poverty Among Single-Parent Households in Cheval
According to the poverty data in Cheval, 12.2% or 25 single-father households and 3.2% or 19 single-mother households are living below the poverty line. Among single-father households, those with no children have the highest poverty rate, with 25 households (17.2%) experiencing poverty. Likewise, among single-mother households, those with 3 or 4 children have the highest poverty rate, with 10 households (100.0%) falling below the poverty line.
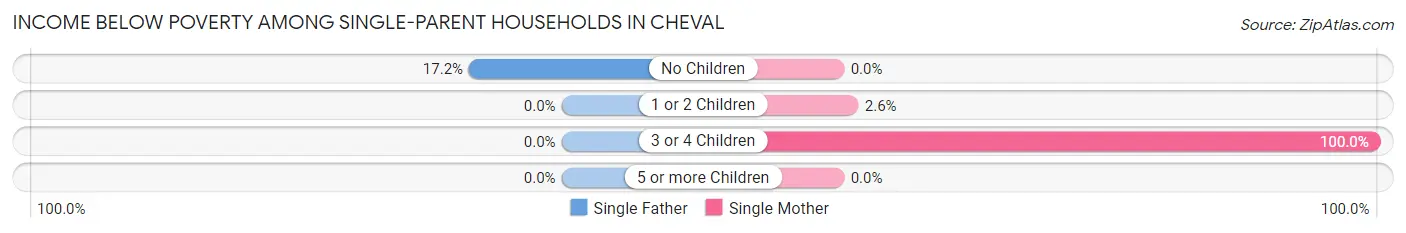
| Children | Single Father | Single Mother |
| No Children | 25 (17.2%) | 0 (0.0%) |
| 1 or 2 Children | 0 (0.0%) | 9 (2.6%) |
| 3 or 4 Children | 0 (0.0%) | 10 (100.0%) |
| 5 or more Children | 0 (0.0%) | 0 (0.0%) |
| Total | 25 (12.2%) | 19 (3.2%) |
Income Below Poverty Among Married-Couple vs Single-Parent Households in Cheval
The poverty data for Cheval shows that 130 of the married-couple family households (4.8%) and 44 of the single-parent households (5.4%) are living below the poverty level. Within the married-couple family households, those with no children have the highest poverty rate, with 111 households (8.3%) falling below the poverty line. Among the single-parent households, those with 3 or 4 children have the highest poverty rate, with 10 household (26.3%) living below poverty.
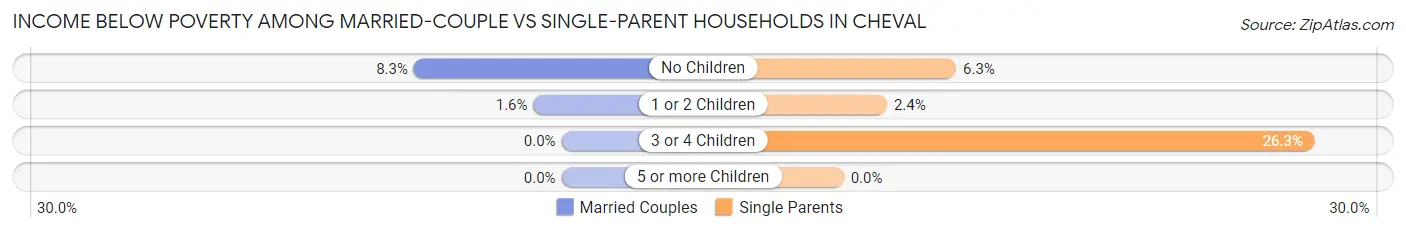
| Children | Married-Couple Families | Single-Parent Households |
| No Children | 111 (8.3%) | 25 (6.3%) |
| 1 or 2 Children | 19 (1.6%) | 9 (2.4%) |
| 3 or 4 Children | 0 (0.0%) | 10 (26.3%) |
| 5 or more Children | 0 (0.0%) | 0 (0.0%) |
| Total | 130 (4.8%) | 44 (5.4%) |
Race in Cheval
The most populous races in Cheval are White / Caucasian (7,865 | 59.6%), Hispanic or Latino (3,179 | 24.1%), and Two or more Races (1,612 | 12.2%).
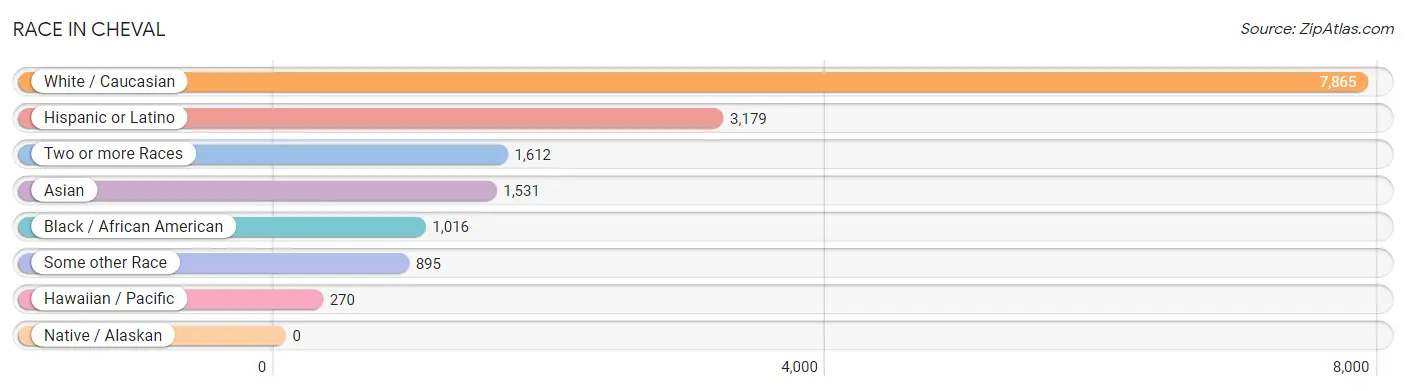
| Race | # Population | % Population |
| Asian | 1,531 | 11.6% |
| Black / African American | 1,016 | 7.7% |
| Hawaiian / Pacific | 270 | 2.1% |
| Hispanic or Latino | 3,179 | 24.1% |
| Native / Alaskan | 0 | 0.0% |
| White / Caucasian | 7,865 | 59.6% |
| Two or more Races | 1,612 | 12.2% |
| Some other Race | 895 | 6.8% |
| Total | 13,189 | 100.0% |
Ancestry in Cheval
The most populous ancestries reported in Cheval are Irish (1,822 | 13.8%), German (1,591 | 12.1%), Puerto Rican (1,202 | 9.1%), Italian (1,064 | 8.1%), and Thai (1,052 | 8.0%), together accounting for 51.0% of all Cheval residents.
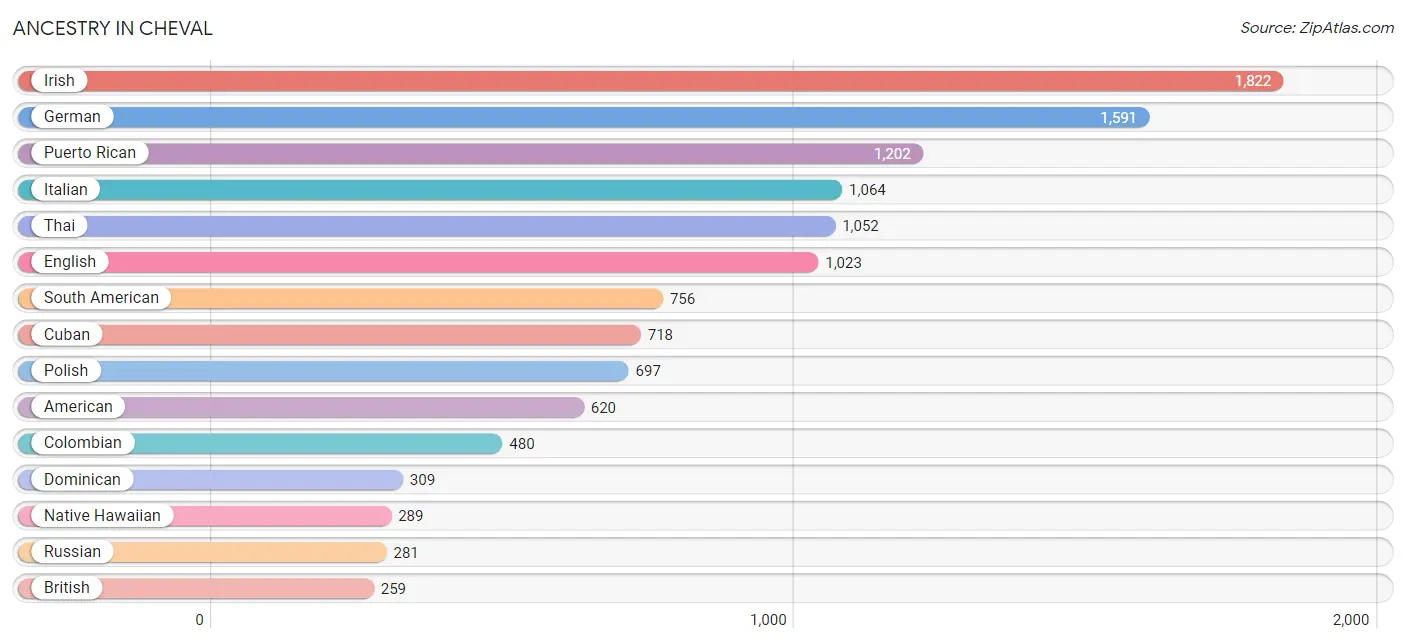
| Ancestry | # Population | % Population |
| African | 5 | 0.0% |
| American | 620 | 4.7% |
| Arab | 18 | 0.1% |
| Bangladeshi | 35 | 0.3% |
| Belgian | 18 | 0.1% |
| Bhutanese | 47 | 0.4% |
| Brazilian | 35 | 0.3% |
| British | 259 | 2.0% |
| British West Indian | 23 | 0.2% |
| Burmese | 67 | 0.5% |
| Canadian | 34 | 0.3% |
| Central American | 65 | 0.5% |
| Chilean | 13 | 0.1% |
| Colombian | 480 | 3.6% |
| Costa Rican | 10 | 0.1% |
| Cuban | 718 | 5.4% |
| Czech | 30 | 0.2% |
| Dominican | 309 | 2.3% |
| Dutch | 121 | 0.9% |
| Eastern European | 80 | 0.6% |
| Ecuadorian | 37 | 0.3% |
| Egyptian | 1 | 0.0% |
| English | 1,023 | 7.8% |
| Ethiopian | 7 | 0.1% |
| European | 111 | 0.8% |
| French | 176 | 1.3% |
| French Canadian | 41 | 0.3% |
| German | 1,591 | 12.1% |
| Greek | 122 | 0.9% |
| Guyanese | 130 | 1.0% |
| Haitian | 28 | 0.2% |
| Honduran | 17 | 0.1% |
| Hungarian | 28 | 0.2% |
| Indian (Asian) | 61 | 0.5% |
| Iranian | 33 | 0.3% |
| Irish | 1,822 | 13.8% |
| Italian | 1,064 | 8.1% |
| Jamaican | 21 | 0.2% |
| Japanese | 47 | 0.4% |
| Korean | 213 | 1.6% |
| Lithuanian | 42 | 0.3% |
| Maltese | 19 | 0.1% |
| Mexican | 70 | 0.5% |
| Native Hawaiian | 289 | 2.2% |
| Nigerian | 185 | 1.4% |
| Northern European | 86 | 0.6% |
| Norwegian | 41 | 0.3% |
| Pakistani | 49 | 0.4% |
| Palestinian | 17 | 0.1% |
| Panamanian | 38 | 0.3% |
| Pennsylvania German | 18 | 0.1% |
| Peruvian | 91 | 0.7% |
| Polish | 697 | 5.3% |
| Portuguese | 14 | 0.1% |
| Puerto Rican | 1,202 | 9.1% |
| Russian | 281 | 2.1% |
| Scandinavian | 25 | 0.2% |
| Scotch-Irish | 119 | 0.9% |
| Scottish | 175 | 1.3% |
| Slovak | 29 | 0.2% |
| South African | 14 | 0.1% |
| South American | 756 | 5.7% |
| Spaniard | 36 | 0.3% |
| Sri Lankan | 45 | 0.3% |
| Subsaharan African | 240 | 1.8% |
| Swedish | 38 | 0.3% |
| Swiss | 9 | 0.1% |
| Thai | 1,052 | 8.0% |
| Ukrainian | 63 | 0.5% |
| Uruguayan | 20 | 0.2% |
| Venezuelan | 115 | 0.9% |
| Welsh | 52 | 0.4% | View All 72 Rows |
Immigrants in Cheval
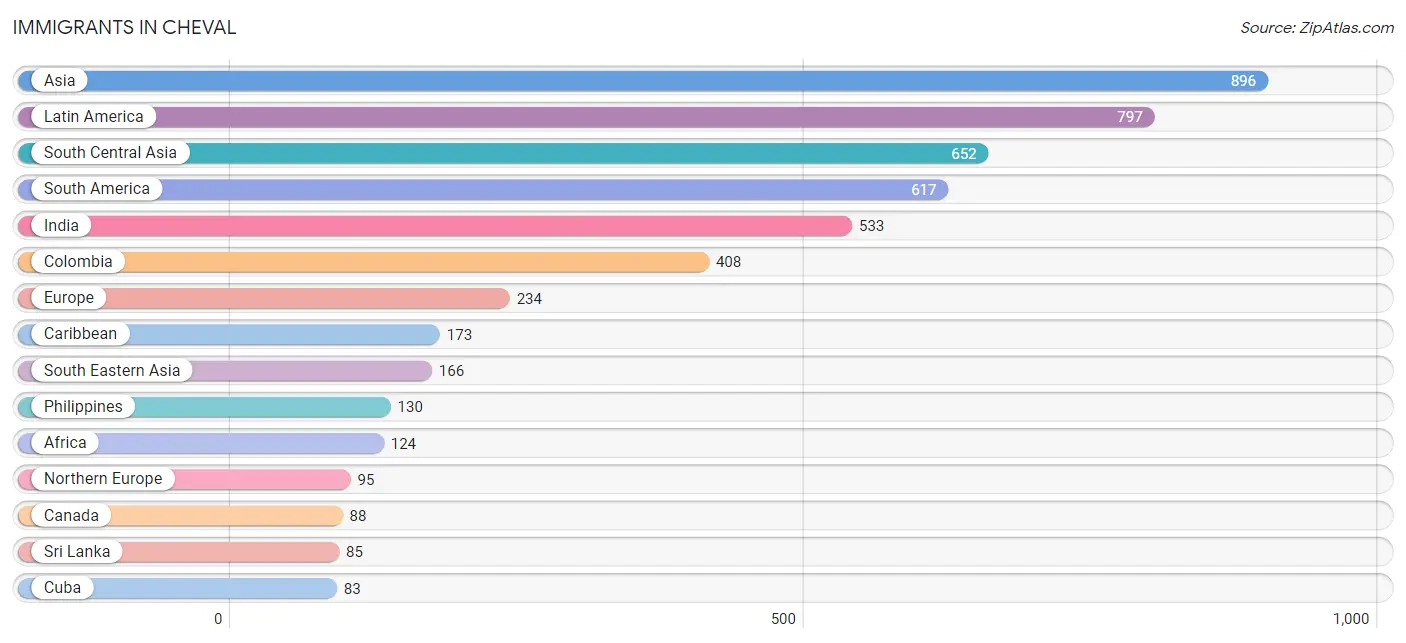
The most numerous immigrant groups reported in Cheval came from Asia (896 | 6.8%), Latin America (797 | 6.0%), South Central Asia (652 | 4.9%), South America (617 | 4.7%), and India (533 | 4.0%), together accounting for 26.5% of all Cheval residents.
| Immigration Origin | # Population | % Population |
| Africa | 124 | 0.9% |
| Asia | 896 | 6.8% |
| Brazil | 11 | 0.1% |
| Cameroon | 15 | 0.1% |
| Canada | 88 | 0.7% |
| Caribbean | 173 | 1.3% |
| Central America | 7 | 0.1% |
| China | 27 | 0.2% |
| Colombia | 408 | 3.1% |
| Cuba | 83 | 0.6% |
| Dominican Republic | 28 | 0.2% |
| Eastern Africa | 30 | 0.2% |
| Eastern Asia | 69 | 0.5% |
| Eastern Europe | 51 | 0.4% |
| Ecuador | 21 | 0.2% |
| Egypt | 2 | 0.0% |
| England | 11 | 0.1% |
| Europe | 234 | 1.8% |
| France | 18 | 0.1% |
| Germany | 34 | 0.3% |
| Guyana | 48 | 0.4% |
| Hungary | 8 | 0.1% |
| India | 533 | 4.0% |
| Indonesia | 8 | 0.1% |
| Iran | 30 | 0.2% |
| Israel | 9 | 0.1% |
| Italy | 11 | 0.1% |
| Jamaica | 39 | 0.3% |
| Japan | 11 | 0.1% |
| Kenya | 9 | 0.1% |
| Korea | 31 | 0.2% |
| Latin America | 797 | 6.0% |
| Middle Africa | 15 | 0.1% |
| Nepal | 4 | 0.0% |
| Nigeria | 63 | 0.5% |
| Northern Africa | 2 | 0.0% |
| Northern Europe | 95 | 0.7% |
| Panama | 7 | 0.1% |
| Peru | 28 | 0.2% |
| Philippines | 130 | 1.0% |
| Russia | 43 | 0.3% |
| South Africa | 14 | 0.1% |
| South America | 617 | 4.7% |
| South Central Asia | 652 | 4.9% |
| South Eastern Asia | 166 | 1.3% |
| Southern Europe | 36 | 0.3% |
| Spain | 25 | 0.2% |
| Sri Lanka | 85 | 0.6% |
| Sweden | 7 | 0.1% |
| Venezuela | 75 | 0.6% |
| Vietnam | 28 | 0.2% |
| Western Africa | 63 | 0.5% |
| Western Asia | 9 | 0.1% |
| Western Europe | 52 | 0.4% | View All 54 Rows |
Sex and Age in Cheval
Sex and Age in Cheval
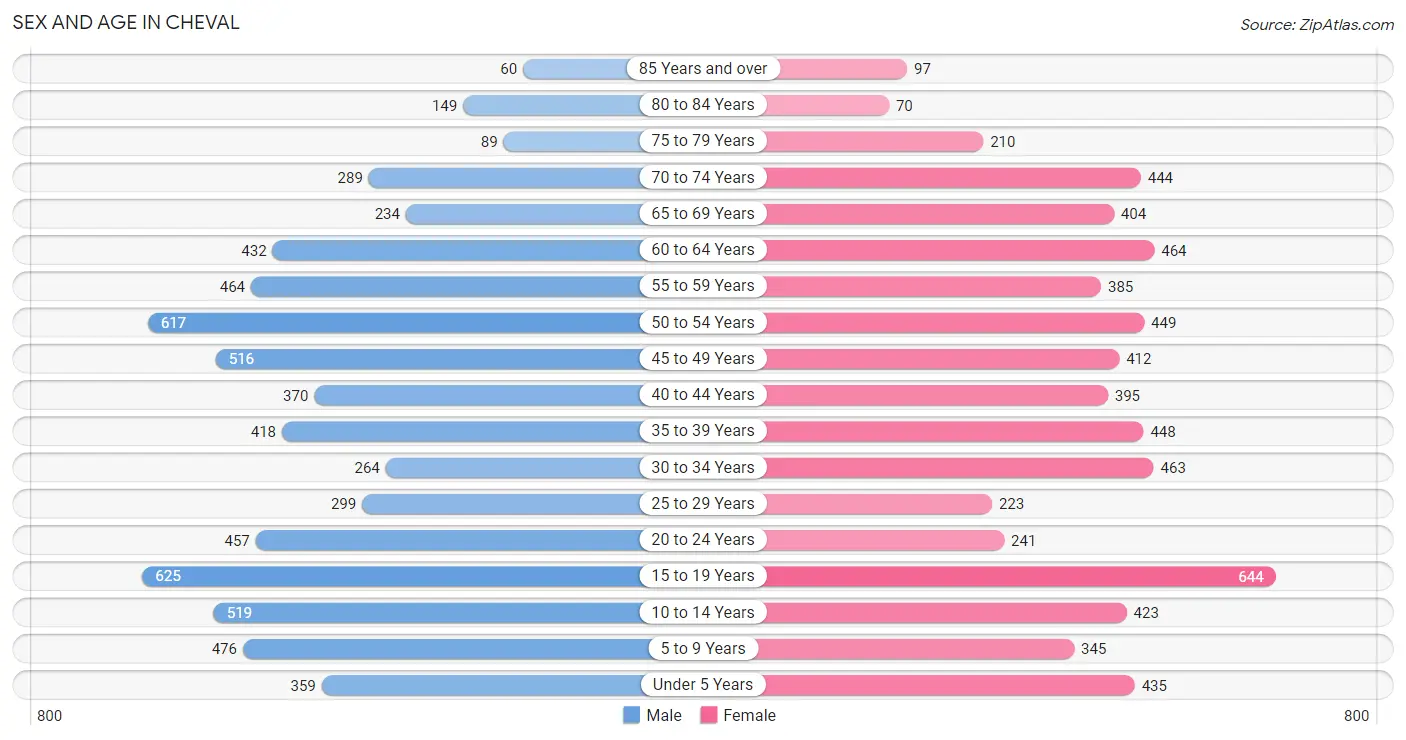
The most populous age groups in Cheval are 15 to 19 Years (625 | 9.4%) for men and 15 to 19 Years (644 | 9.8%) for women.
| Age Bracket | Male | Female |
| Under 5 Years | 359 (5.4%) | 435 (6.6%) |
| 5 to 9 Years | 476 (7.2%) | 345 (5.3%) |
| 10 to 14 Years | 519 (7.8%) | 423 (6.5%) |
| 15 to 19 Years | 625 (9.4%) | 644 (9.8%) |
| 20 to 24 Years | 457 (6.9%) | 241 (3.7%) |
| 25 to 29 Years | 299 (4.5%) | 223 (3.4%) |
| 30 to 34 Years | 264 (4.0%) | 463 (7.1%) |
| 35 to 39 Years | 418 (6.3%) | 448 (6.8%) |
| 40 to 44 Years | 370 (5.6%) | 395 (6.0%) |
| 45 to 49 Years | 516 (7.8%) | 412 (6.3%) |
| 50 to 54 Years | 617 (9.3%) | 449 (6.9%) |
| 55 to 59 Years | 464 (7.0%) | 385 (5.9%) |
| 60 to 64 Years | 432 (6.5%) | 464 (7.1%) |
| 65 to 69 Years | 234 (3.5%) | 404 (6.2%) |
| 70 to 74 Years | 289 (4.3%) | 444 (6.8%) |
| 75 to 79 Years | 89 (1.3%) | 210 (3.2%) |
| 80 to 84 Years | 149 (2.2%) | 70 (1.1%) |
| 85 Years and over | 60 (0.9%) | 97 (1.5%) |
| Total | 6,637 (100.0%) | 6,552 (100.0%) |
Families and Households in Cheval
Median Family Size in Cheval
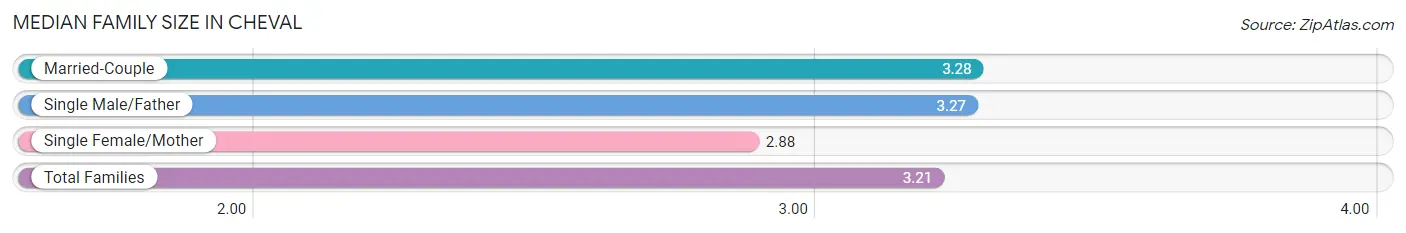
The median family size in Cheval is 3.21 persons per family, with married-couple families (2,708 | 77.0%) accounting for the largest median family size of 3.28 persons per family. On the other hand, single female/mother families (604 | 17.2%) represent the smallest median family size with 2.88 persons per family.
| Family Type | # Families | Family Size |
| Married-Couple | 2,708 (77.0%) | 3.28 |
| Single Male/Father | 204 (5.8%) | 3.27 |
| Single Female/Mother | 604 (17.2%) | 2.88 |
| Total Families | 3,516 (100.0%) | 3.21 |
Median Household Size in Cheval
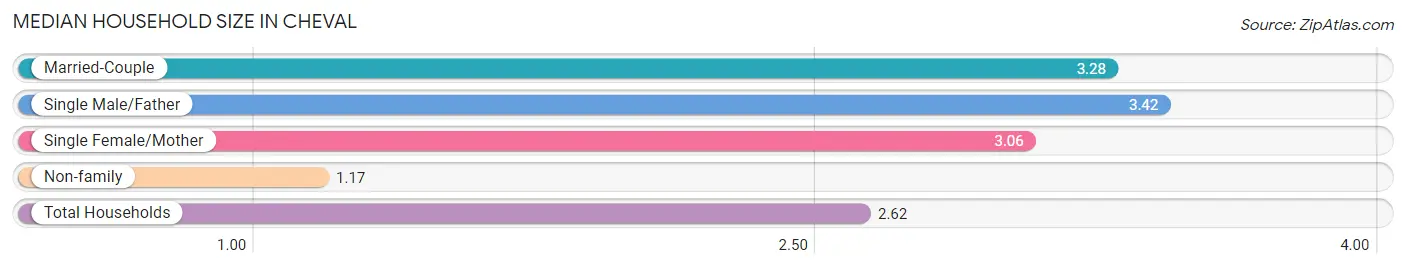
The median household size in Cheval is 2.62 persons per household, with single male/father households (204 | 4.1%) accounting for the largest median household size of 3.42 persons per household. non-family households (1,513 | 30.1%) represent the smallest median household size with 1.17 persons per household.
| Household Type | # Households | Household Size |
| Married-Couple | 2,708 (53.8%) | 3.28 |
| Single Male/Father | 204 (4.1%) | 3.42 |
| Single Female/Mother | 604 (12.0%) | 3.06 |
| Non-family | 1,513 (30.1%) | 1.17 |
| Total Households | 5,029 (100.0%) | 2.62 |
Household Size by Marriage Status in Cheval
Out of a total of 5,029 households in Cheval, 3,516 (69.9%) are family households, while 1,513 (30.1%) are nonfamily households. The most numerous type of family households are 2-person households, comprising 1,365, and the most common type of nonfamily households are 1-person households, comprising 1,320.
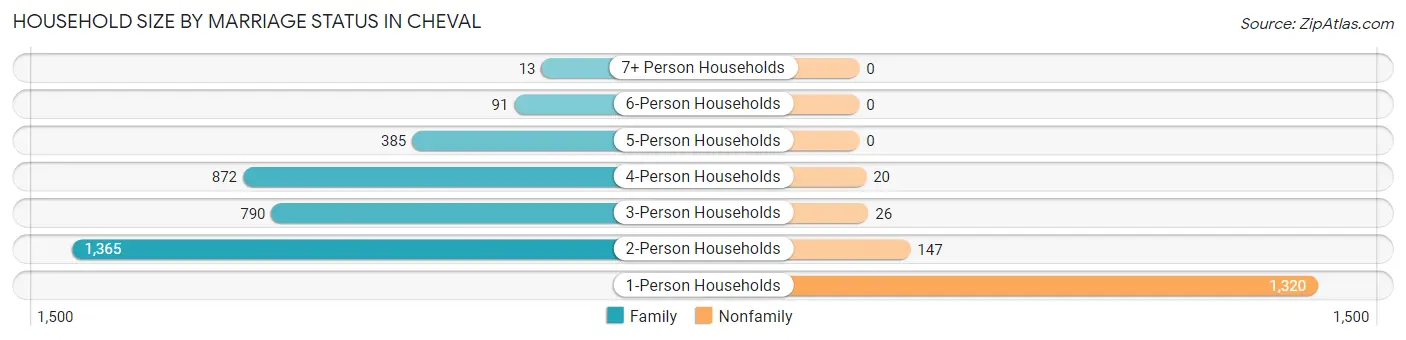
| Household Size | Family Households | Nonfamily Households |
| 1-Person Households | - | 1,320 (26.3%) |
| 2-Person Households | 1,365 (27.1%) | 147 (2.9%) |
| 3-Person Households | 790 (15.7%) | 26 (0.5%) |
| 4-Person Households | 872 (17.3%) | 20 (0.4%) |
| 5-Person Households | 385 (7.7%) | 0 (0.0%) |
| 6-Person Households | 91 (1.8%) | 0 (0.0%) |
| 7+ Person Households | 13 (0.3%) | 0 (0.0%) |
| Total | 3,516 (69.9%) | 1,513 (30.1%) |
Female Fertility in Cheval
Fertility by Age in Cheval
Average fertility rate in Cheval is 23.0 births per 1,000 women. Women in the age bracket of 20 to 34 years have the highest fertility rate with 31.0 births per 1,000 women. Women in the age bracket of 35 to 50 years acount for 56.7% of all women with births.
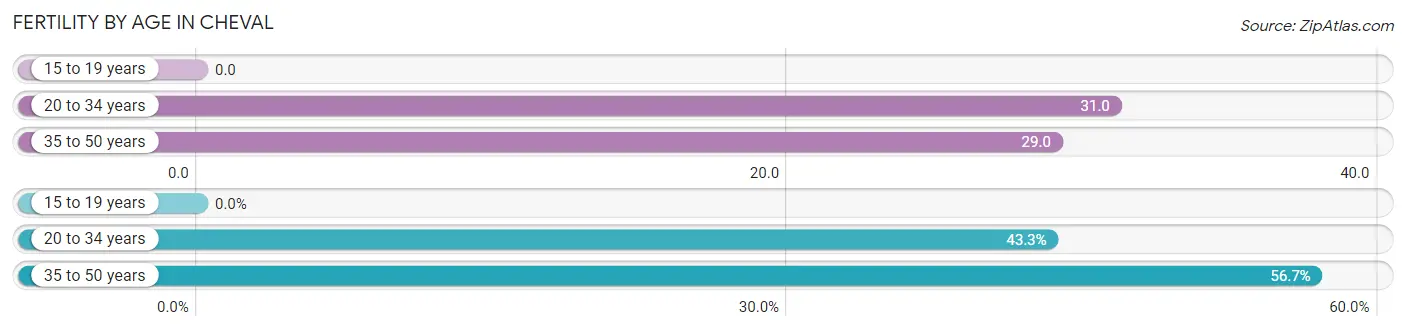
| Age Bracket | Women with Births | Births / 1,000 Women |
| 15 to 19 years | 0 (0.0%) | 0.0 |
| 20 to 34 years | 29 (43.3%) | 31.0 |
| 35 to 50 years | 38 (56.7%) | 29.0 |
| Total | 67 (100.0%) | 23.0 |
Fertility by Age by Marriage Status in Cheval
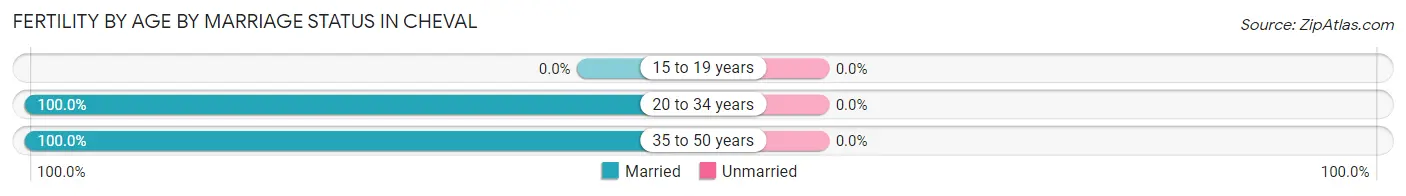
| Age Bracket | Married | Unmarried |
| 15 to 19 years | 0 (0.0%) | 0 (0.0%) |
| 20 to 34 years | 29 (100.0%) | 0 (0.0%) |
| 35 to 50 years | 38 (100.0%) | 0 (0.0%) |
| Total | 67 (100.0%) | 0 (0.0%) |
Fertility by Education in Cheval
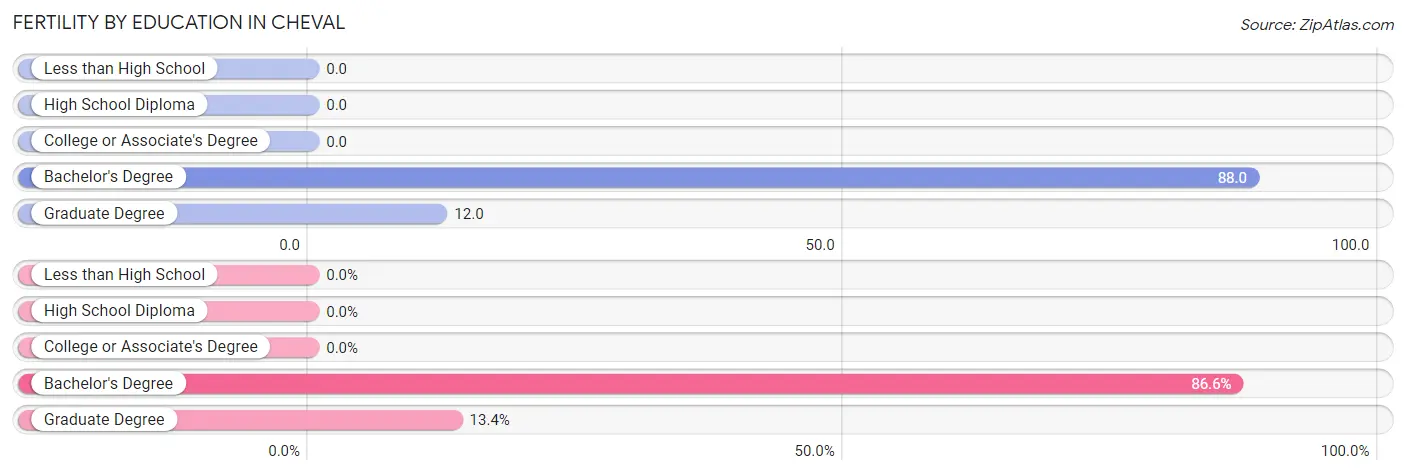
| Educational Attainment | Women with Births | Births / 1,000 Women |
| Less than High School | 0 (0.0%) | 0.0 |
| High School Diploma | 0 (0.0%) | 0.0 |
| College or Associate's Degree | 0 (0.0%) | 0.0 |
| Bachelor's Degree | 58 (86.6%) | 88.0 |
| Graduate Degree | 9 (13.4%) | 12.0 |
| Total | 67 (100.0%) | 23.0 |
Fertility by Education by Marriage Status in Cheval
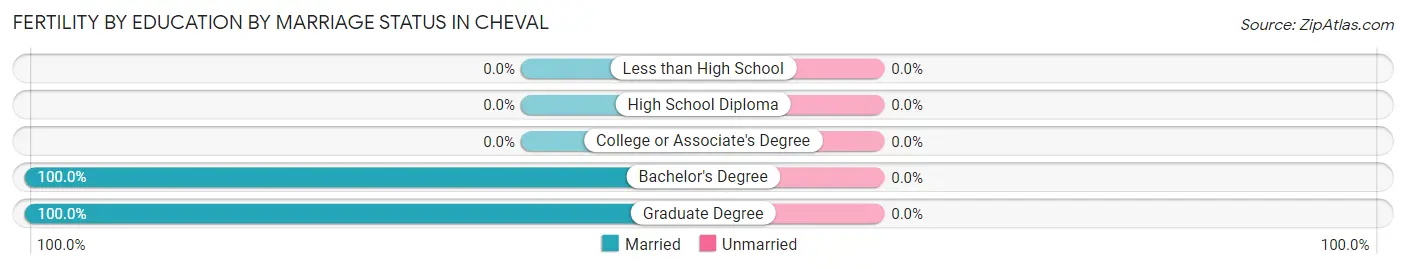
| Educational Attainment | Married | Unmarried |
| Less than High School | 0 (0.0%) | 0 (0.0%) |
| High School Diploma | 0 (0.0%) | 0 (0.0%) |
| College or Associate's Degree | 0 (0.0%) | 0 (0.0%) |
| Bachelor's Degree | 58 (100.0%) | 0 (0.0%) |
| Graduate Degree | 9 (100.0%) | 0 (0.0%) |
| Total | 67 (100.0%) | 0 (0.0%) |
Employment Characteristics in Cheval
Employment by Class of Employer in Cheval
Among the 6,251 employed individuals in Cheval, private company employees (3,992 | 63.9%), local government employees (608 | 9.7%), and not-for-profit organizations (565 | 9.0%) make up the most common classes of employment.
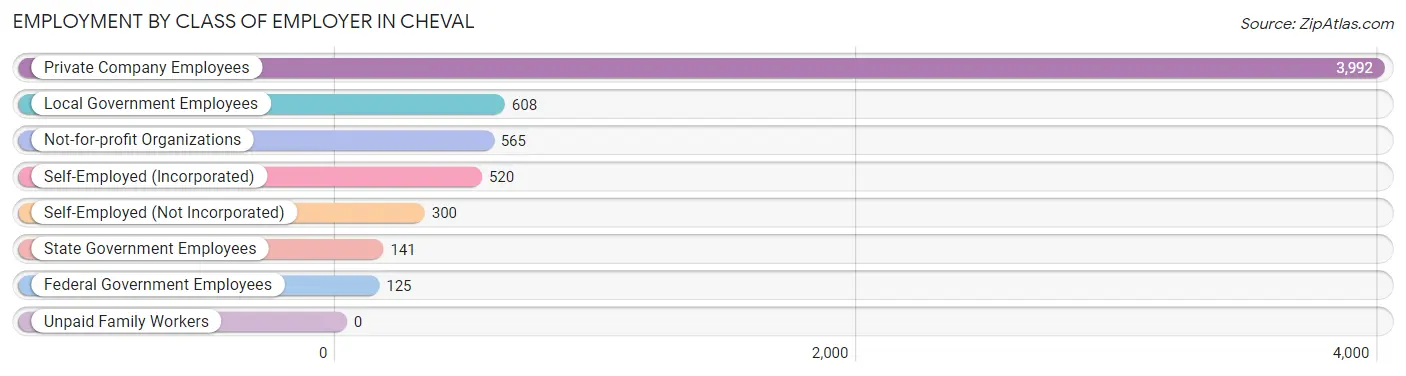
| Employer Class | # Employees | % Employees |
| Private Company Employees | 3,992 | 63.9% |
| Self-Employed (Incorporated) | 520 | 8.3% |
| Self-Employed (Not Incorporated) | 300 | 4.8% |
| Not-for-profit Organizations | 565 | 9.0% |
| Local Government Employees | 608 | 9.7% |
| State Government Employees | 141 | 2.3% |
| Federal Government Employees | 125 | 2.0% |
| Unpaid Family Workers | 0 | 0.0% |
| Total | 6,251 | 100.0% |
Employment Status by Age in Cheval
According to the labor force statistics for Cheval, out of the total population over 16 years of age (10,345), 65.0% or 6,724 individuals are in the labor force, with 4.8% or 323 of them unemployed. The age group with the highest labor force participation rate is 35 to 44 years, with 93.2% or 1,520 individuals in the labor force. Within the labor force, the 16 to 19 years age range has the highest percentage of unemployed individuals, with 9.7% or 25 of them being unemployed.
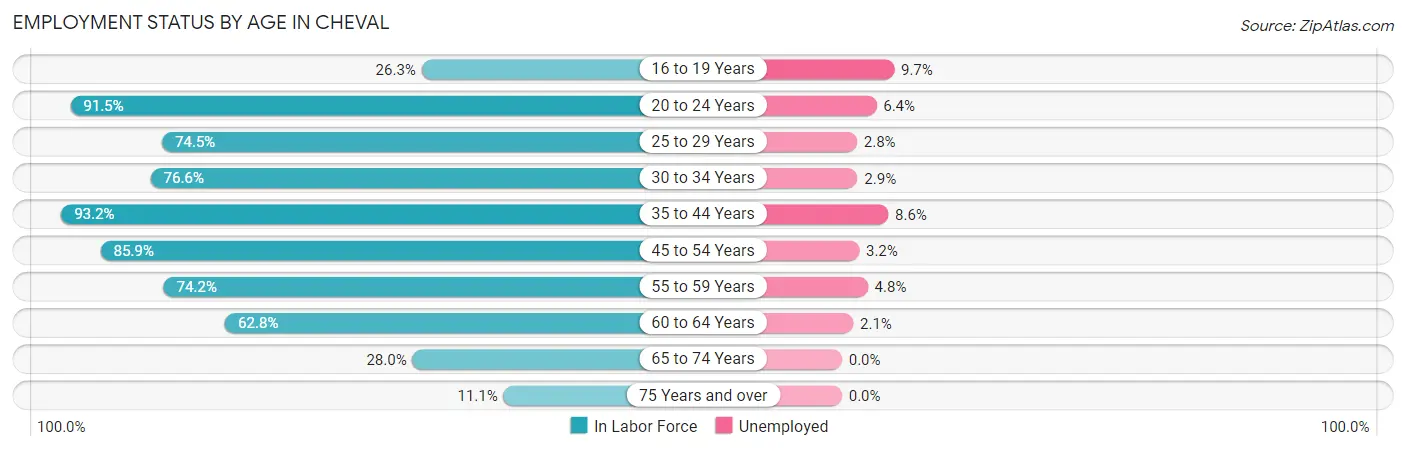
| Age Bracket | In Labor Force | Unemployed |
| 16 to 19 Years | 258 (26.3%) | 25 (9.7%) |
| 20 to 24 Years | 639 (91.5%) | 41 (6.4%) |
| 25 to 29 Years | 389 (74.5%) | 11 (2.8%) |
| 30 to 34 Years | 557 (76.6%) | 16 (2.9%) |
| 35 to 44 Years | 1,520 (93.2%) | 131 (8.6%) |
| 45 to 54 Years | 1,713 (85.9%) | 55 (3.2%) |
| 55 to 59 Years | 630 (74.2%) | 30 (4.8%) |
| 60 to 64 Years | 563 (62.8%) | 12 (2.1%) |
| 65 to 74 Years | 384 (28.0%) | 0 (0.0%) |
| 75 Years and over | 75 (11.1%) | 0 (0.0%) |
| Total | 6,724 (65.0%) | 323 (4.8%) |
Employment Status by Educational Attainment in Cheval
According to labor force statistics for Cheval, 81.2% of individuals (5,375) out of the total population between 25 and 64 years of age (6,619) are in the labor force, with 4.7% or 253 of them being unemployed. The group with the highest labor force participation rate are those with the educational attainment of bachelor's degree or higher, with 86.7% or 3,421 individuals in the labor force. Within the labor force, individuals with bachelor's degree or higher education have the highest percentage of unemployment, with 5.7% or 195 of them being unemployed.
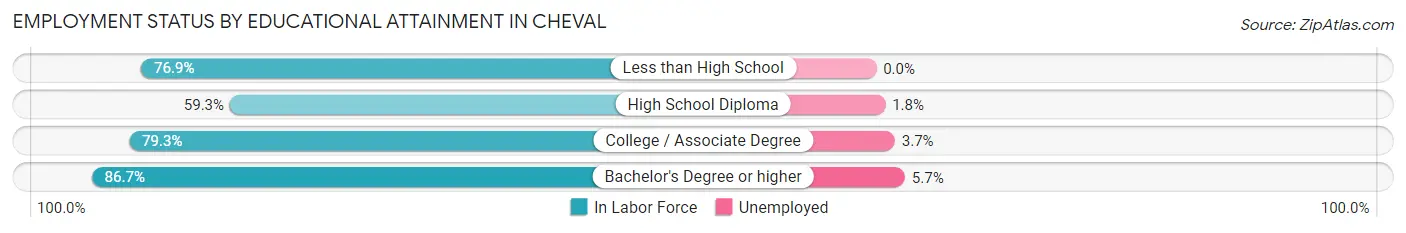
| Educational Attainment | In Labor Force | Unemployed |
| Less than High School | 90 (76.9%) | 0 (0.0%) |
| High School Diploma | 491 (59.3%) | 15 (1.8%) |
| College / Associate Degree | 1,370 (79.3%) | 64 (3.7%) |
| Bachelor's Degree or higher | 3,421 (86.7%) | 225 (5.7%) |
| Total | 5,375 (81.2%) | 311 (4.7%) |
Employment Occupations by Sex in Cheval
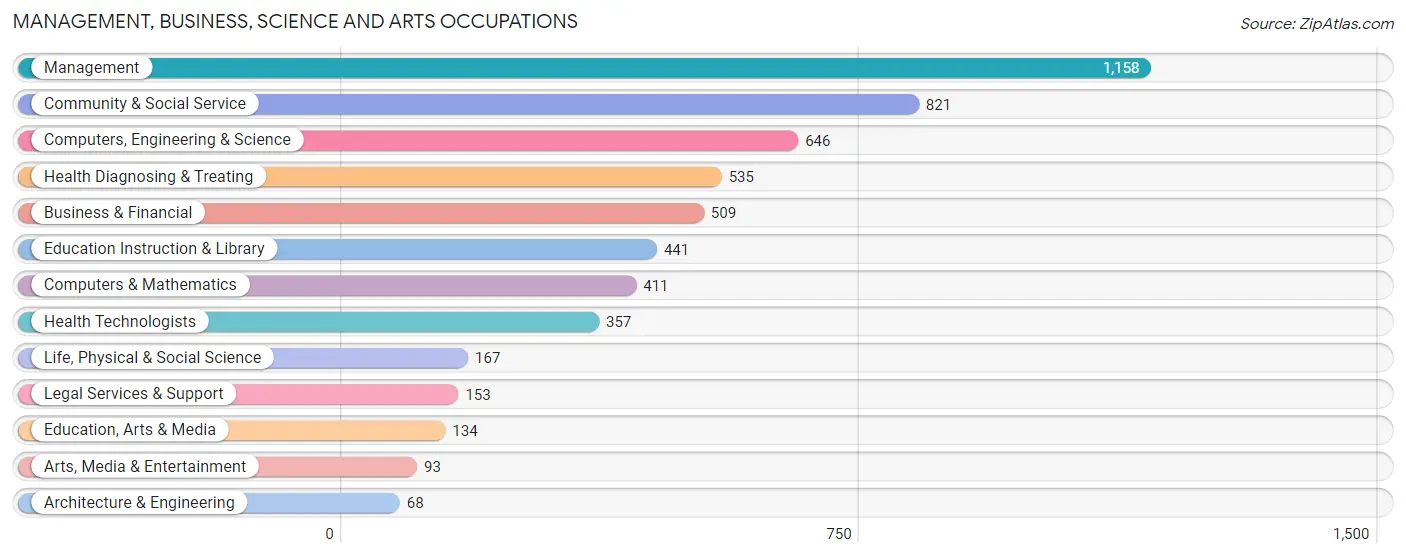
Management, Business, Science and Arts Occupations
The most common Management, Business, Science and Arts occupations in Cheval are Management (1,158 | 18.1%), Community & Social Service (821 | 12.8%), Computers, Engineering & Science (646 | 10.1%), Health Diagnosing & Treating (535 | 8.4%), and Business & Financial (509 | 7.9%).
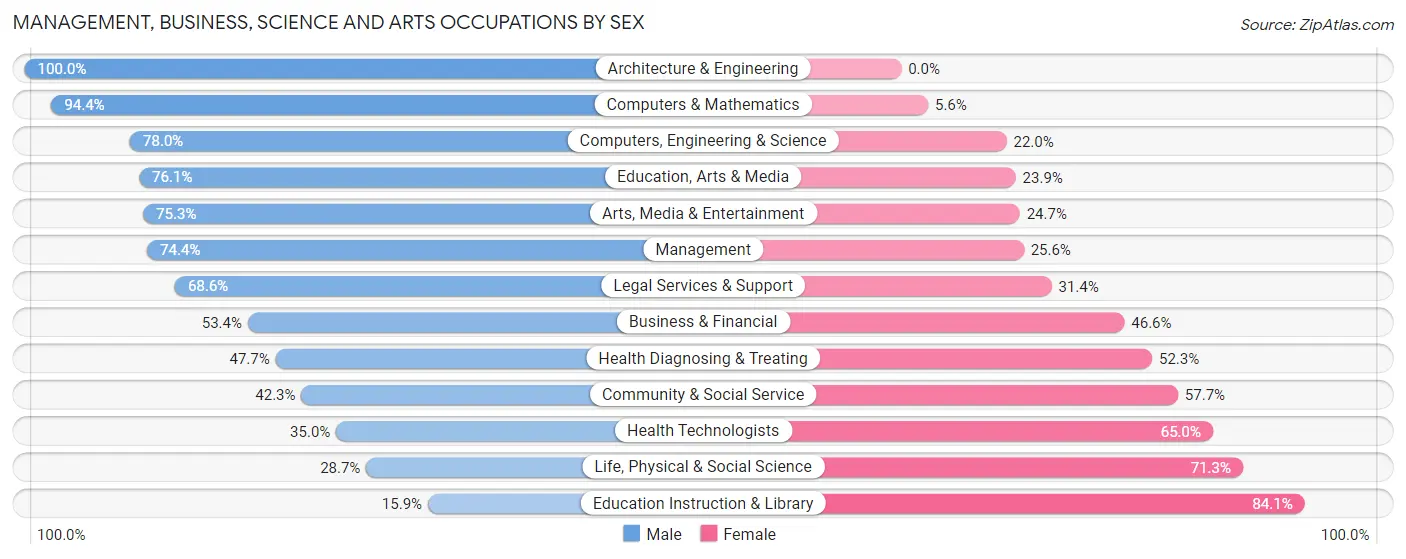
Management, Business, Science and Arts Occupations by Sex
Within the Management, Business, Science and Arts occupations in Cheval, the most male-oriented occupations are Architecture & Engineering (100.0%), Computers & Mathematics (94.4%), and Computers, Engineering & Science (78.0%), while the most female-oriented occupations are Education Instruction & Library (84.1%), Life, Physical & Social Science (71.3%), and Health Technologists (65.0%).
| Occupation | Male | Female |
| Management | 862 (74.4%) | 296 (25.6%) |
| Business & Financial | 272 (53.4%) | 237 (46.6%) |
| Computers, Engineering & Science | 504 (78.0%) | 142 (22.0%) |
| Computers & Mathematics | 388 (94.4%) | 23 (5.6%) |
| Architecture & Engineering | 68 (100.0%) | 0 (0.0%) |
| Life, Physical & Social Science | 48 (28.7%) | 119 (71.3%) |
| Community & Social Service | 347 (42.3%) | 474 (57.7%) |
| Education, Arts & Media | 102 (76.1%) | 32 (23.9%) |
| Legal Services & Support | 105 (68.6%) | 48 (31.4%) |
| Education Instruction & Library | 70 (15.9%) | 371 (84.1%) |
| Arts, Media & Entertainment | 70 (75.3%) | 23 (24.7%) |
| Health Diagnosing & Treating | 255 (47.7%) | 280 (52.3%) |
| Health Technologists | 125 (35.0%) | 232 (65.0%) |
| Total (Category) | 2,240 (61.1%) | 1,429 (39.0%) |
| Total (Overall) | 3,761 (58.7%) | 2,646 (41.3%) |
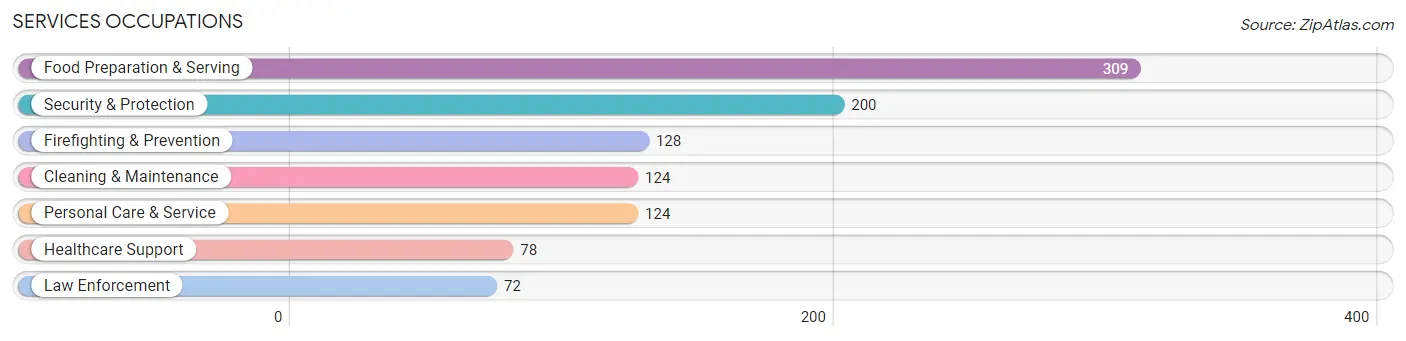
Services Occupations
The most common Services occupations in Cheval are Food Preparation & Serving (309 | 4.8%), Security & Protection (200 | 3.1%), Firefighting & Prevention (128 | 2.0%), Cleaning & Maintenance (124 | 1.9%), and Personal Care & Service (124 | 1.9%).
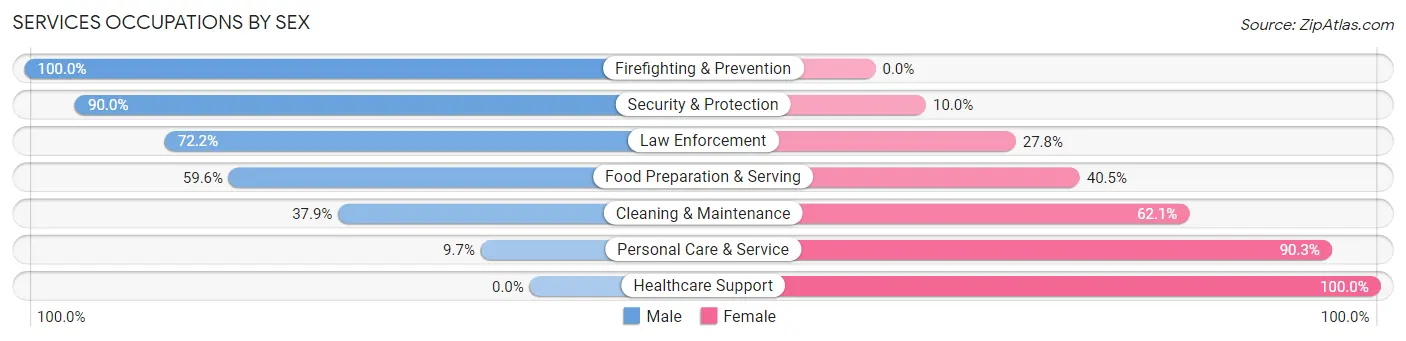
Services Occupations by Sex
Within the Services occupations in Cheval, the most male-oriented occupations are Firefighting & Prevention (100.0%), Security & Protection (90.0%), and Law Enforcement (72.2%), while the most female-oriented occupations are Healthcare Support (100.0%), Personal Care & Service (90.3%), and Cleaning & Maintenance (62.1%).
| Occupation | Male | Female |
| Healthcare Support | 0 (0.0%) | 78 (100.0%) |
| Security & Protection | 180 (90.0%) | 20 (10.0%) |
| Firefighting & Prevention | 128 (100.0%) | 0 (0.0%) |
| Law Enforcement | 52 (72.2%) | 20 (27.8%) |
| Food Preparation & Serving | 184 (59.6%) | 125 (40.5%) |
| Cleaning & Maintenance | 47 (37.9%) | 77 (62.1%) |
| Personal Care & Service | 12 (9.7%) | 112 (90.3%) |
| Total (Category) | 423 (50.7%) | 412 (49.3%) |
| Total (Overall) | 3,761 (58.7%) | 2,646 (41.3%) |
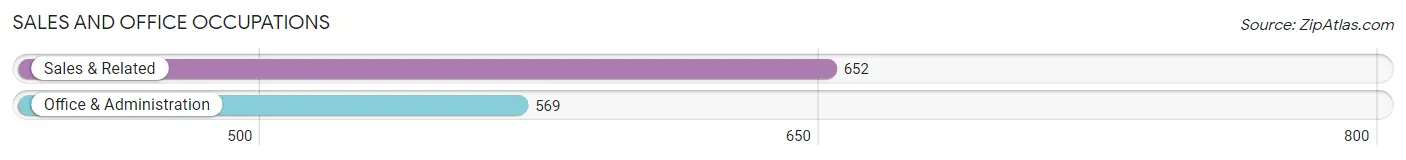
Sales and Office Occupations
The most common Sales and Office occupations in Cheval are Sales & Related (652 | 10.2%), and Office & Administration (569 | 8.9%).
Sales and Office Occupations by Sex
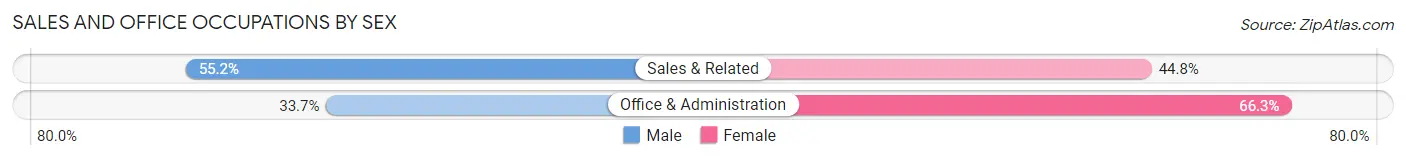
| Occupation | Male | Female |
| Sales & Related | 360 (55.2%) | 292 (44.8%) |
| Office & Administration | 192 (33.7%) | 377 (66.3%) |
| Total (Category) | 552 (45.2%) | 669 (54.8%) |
| Total (Overall) | 3,761 (58.7%) | 2,646 (41.3%) |
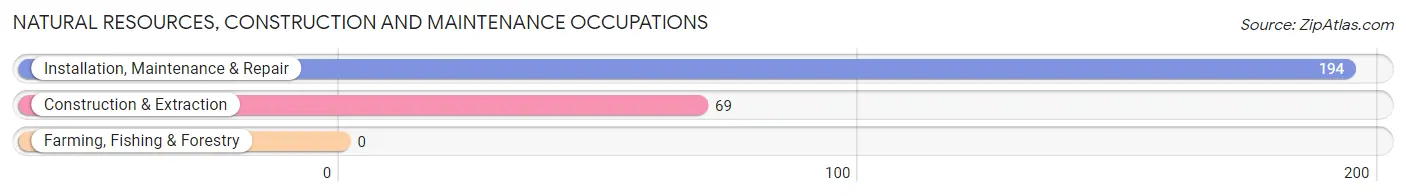
Natural Resources, Construction and Maintenance Occupations
The most common Natural Resources, Construction and Maintenance occupations in Cheval are Installation, Maintenance & Repair (194 | 3.0%), and Construction & Extraction (69 | 1.1%).
Natural Resources, Construction and Maintenance Occupations by Sex
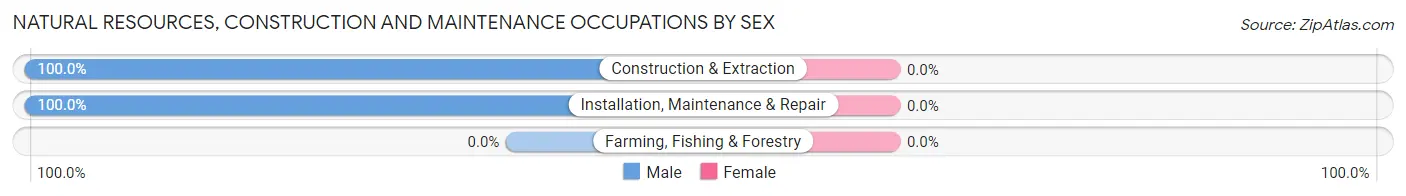
| Occupation | Male | Female |
| Farming, Fishing & Forestry | 0 (0.0%) | 0 (0.0%) |
| Construction & Extraction | 69 (100.0%) | 0 (0.0%) |
| Installation, Maintenance & Repair | 194 (100.0%) | 0 (0.0%) |
| Total (Category) | 263 (100.0%) | 0 (0.0%) |
| Total (Overall) | 3,761 (58.7%) | 2,646 (41.3%) |
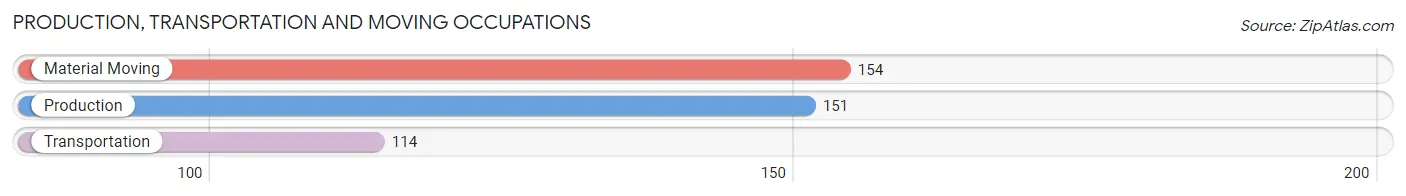
Production, Transportation and Moving Occupations
The most common Production, Transportation and Moving occupations in Cheval are Material Moving (154 | 2.4%), Production (151 | 2.4%), and Transportation (114 | 1.8%).
Production, Transportation and Moving Occupations by Sex
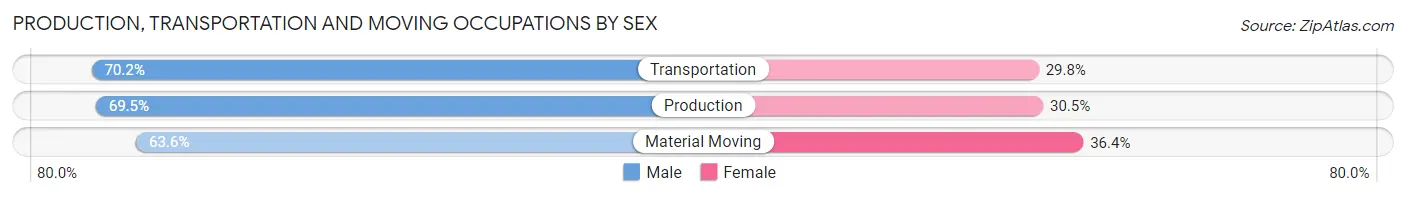
| Occupation | Male | Female |
| Production | 105 (69.5%) | 46 (30.5%) |
| Transportation | 80 (70.2%) | 34 (29.8%) |
| Material Moving | 98 (63.6%) | 56 (36.4%) |
| Total (Category) | 283 (67.5%) | 136 (32.5%) |
| Total (Overall) | 3,761 (58.7%) | 2,646 (41.3%) |
Employment Industries by Sex in Cheval
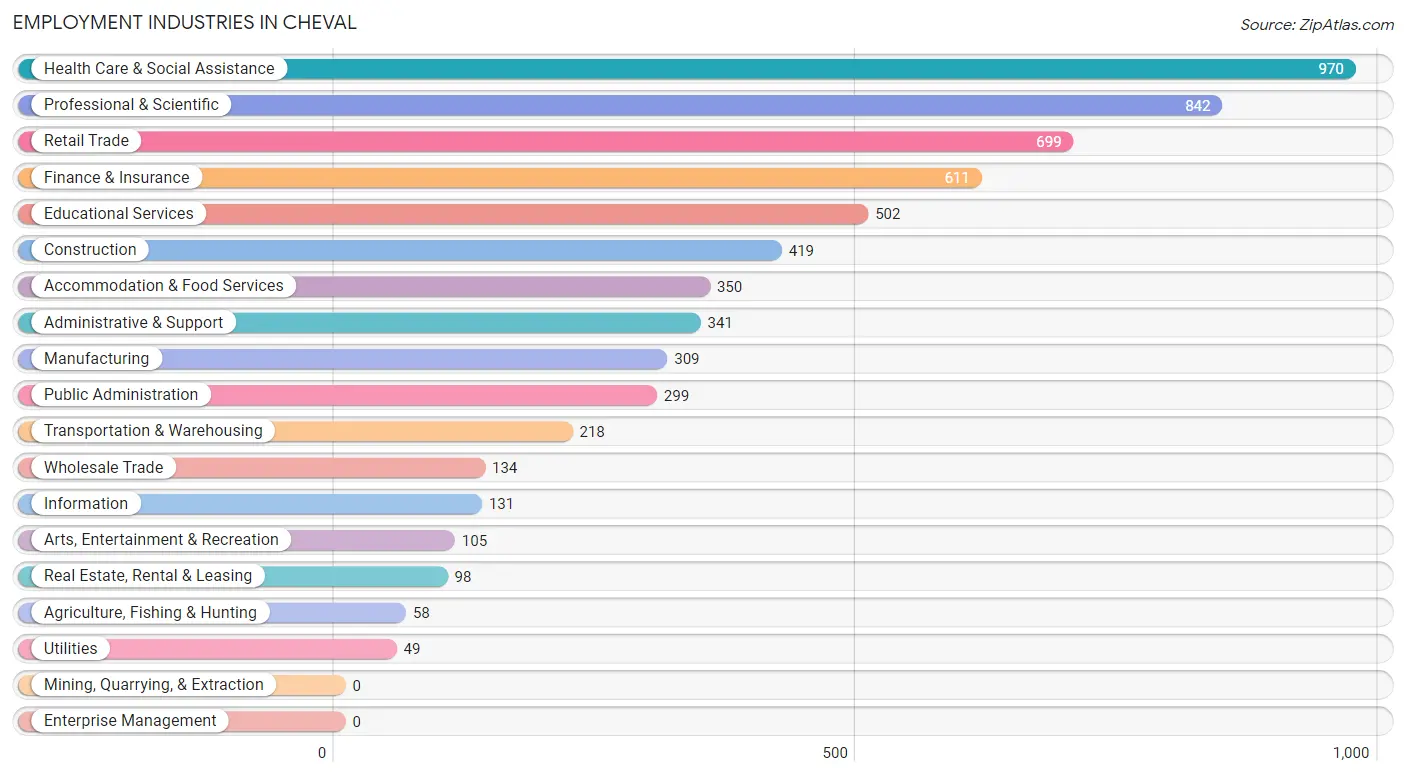
Employment Industries in Cheval
The major employment industries in Cheval include Health Care & Social Assistance (970 | 15.1%), Professional & Scientific (842 | 13.1%), Retail Trade (699 | 10.9%), Finance & Insurance (611 | 9.5%), and Educational Services (502 | 7.8%).
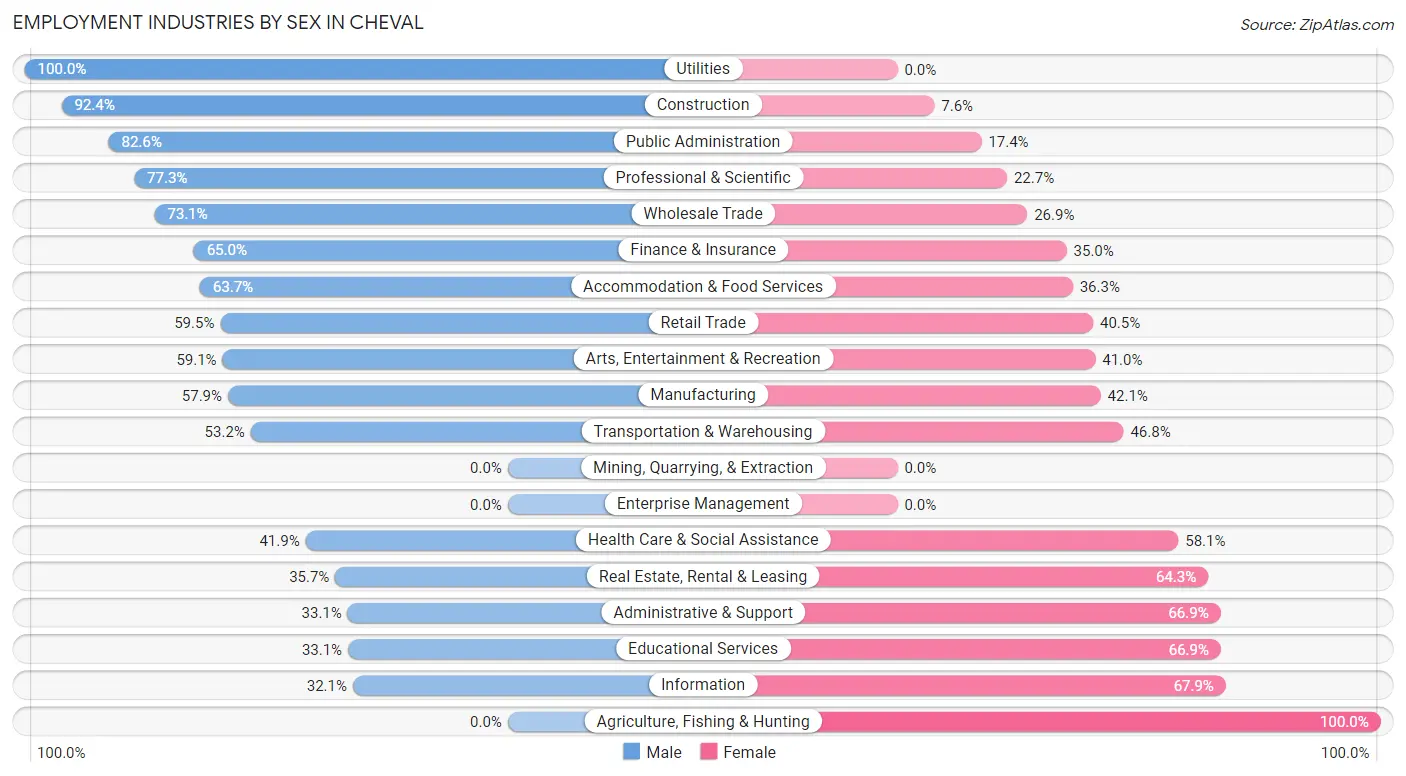
Employment Industries by Sex in Cheval
The Cheval industries that see more men than women are Utilities (100.0%), Construction (92.4%), and Public Administration (82.6%), whereas the industries that tend to have a higher number of women are Agriculture, Fishing & Hunting (100.0%), Information (67.9%), and Educational Services (66.9%).
| Industry | Male | Female |
| Agriculture, Fishing & Hunting | 0 (0.0%) | 58 (100.0%) |
| Mining, Quarrying, & Extraction | 0 (0.0%) | 0 (0.0%) |
| Construction | 387 (92.4%) | 32 (7.6%) |
| Manufacturing | 179 (57.9%) | 130 (42.1%) |
| Wholesale Trade | 98 (73.1%) | 36 (26.9%) |
| Retail Trade | 416 (59.5%) | 283 (40.5%) |
| Transportation & Warehousing | 116 (53.2%) | 102 (46.8%) |
| Utilities | 49 (100.0%) | 0 (0.0%) |
| Information | 42 (32.1%) | 89 (67.9%) |
| Finance & Insurance | 397 (65.0%) | 214 (35.0%) |
| Real Estate, Rental & Leasing | 35 (35.7%) | 63 (64.3%) |
| Professional & Scientific | 651 (77.3%) | 191 (22.7%) |
| Enterprise Management | 0 (0.0%) | 0 (0.0%) |
| Administrative & Support | 113 (33.1%) | 228 (66.9%) |
| Educational Services | 166 (33.1%) | 336 (66.9%) |
| Health Care & Social Assistance | 406 (41.9%) | 564 (58.1%) |
| Arts, Entertainment & Recreation | 62 (59.1%) | 43 (40.9%) |
| Accommodation & Food Services | 223 (63.7%) | 127 (36.3%) |
| Public Administration | 247 (82.6%) | 52 (17.4%) |
| Total | 3,761 (58.7%) | 2,646 (41.3%) |
Education in Cheval
School Enrollment in Cheval
The most common levels of schooling among the 4,094 students in Cheval are high school (1,229 | 30.0%), college / undergraduate (817 | 20.0%), and elementary school (694 | 17.0%).
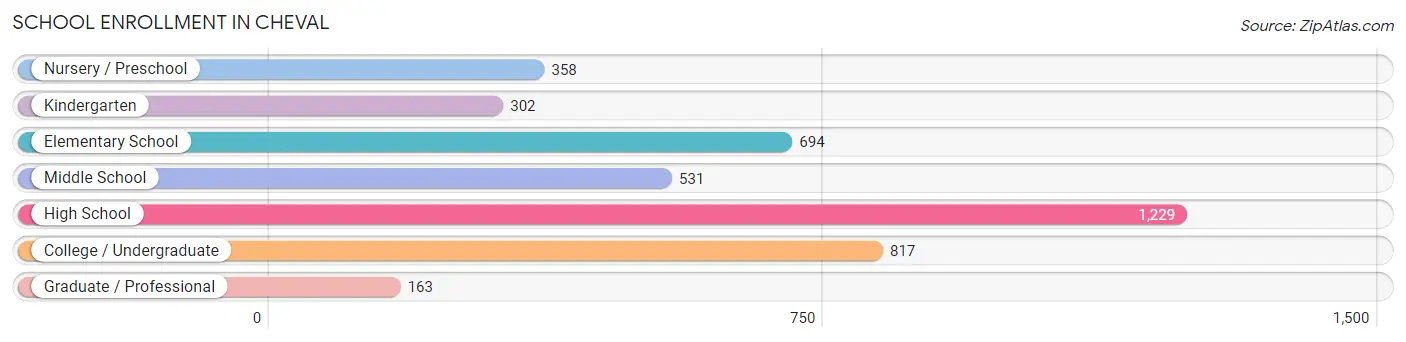
| School Level | # Students | % Students |
| Nursery / Preschool | 358 | 8.7% |
| Kindergarten | 302 | 7.4% |
| Elementary School | 694 | 17.0% |
| Middle School | 531 | 13.0% |
| High School | 1,229 | 30.0% |
| College / Undergraduate | 817 | 20.0% |
| Graduate / Professional | 163 | 4.0% |
| Total | 4,094 | 100.0% |
School Enrollment by Age by Funding Source in Cheval
Out of a total of 4,094 students who are enrolled in schools in Cheval, 671 (16.4%) attend a private institution, while the remaining 3,423 (83.6%) are enrolled in public schools. The age group of 3 to 4 year olds has the highest likelihood of being enrolled in private schools, with 332 (95.7% in the age bracket) enrolled. Conversely, the age group of 10 to 14 year olds has the lowest likelihood of being enrolled in a private school, with 858 (94.7% in the age bracket) attending a public institution.
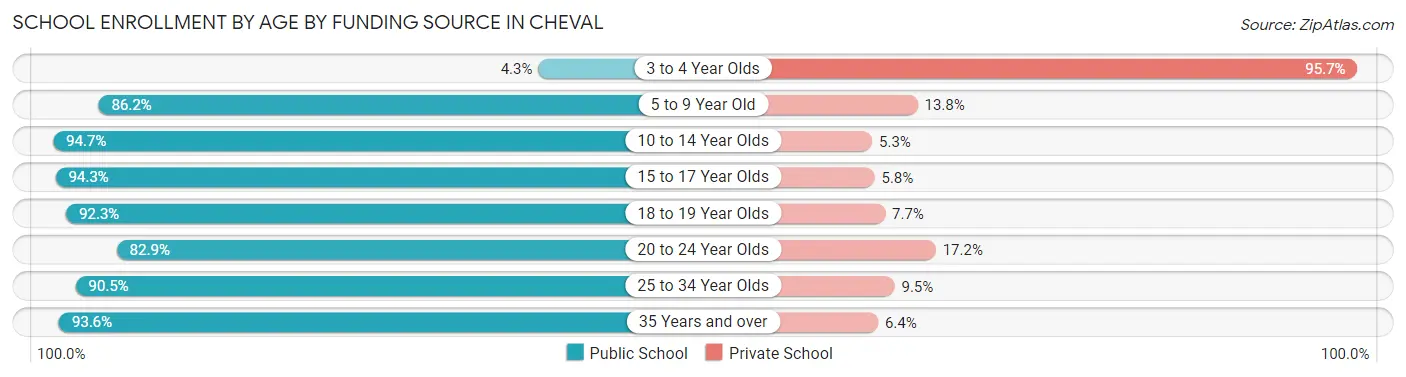
| Age Bracket | Public School | Private School |
| 3 to 4 Year Olds | 15 (4.3%) | 332 (95.7%) |
| 5 to 9 Year Old | 708 (86.2%) | 113 (13.8%) |
| 10 to 14 Year Olds | 858 (94.7%) | 48 (5.3%) |
| 15 to 17 Year Olds | 623 (94.3%) | 38 (5.8%) |
| 18 to 19 Year Olds | 503 (92.3%) | 42 (7.7%) |
| 20 to 24 Year Olds | 314 (82.9%) | 65 (17.2%) |
| 25 to 34 Year Olds | 153 (90.5%) | 16 (9.5%) |
| 35 Years and over | 249 (93.6%) | 17 (6.4%) |
| Total | 3,423 (83.6%) | 671 (16.4%) |
Educational Attainment by Field of Study in Cheval
Business (1,216 | 23.1%), engineering (604 | 11.5%), science & technology (574 | 10.9%), social sciences (477 | 9.1%), and psychology (379 | 7.2%) are the most common fields of study among 5,264 individuals in Cheval who have obtained a bachelor's degree or higher.
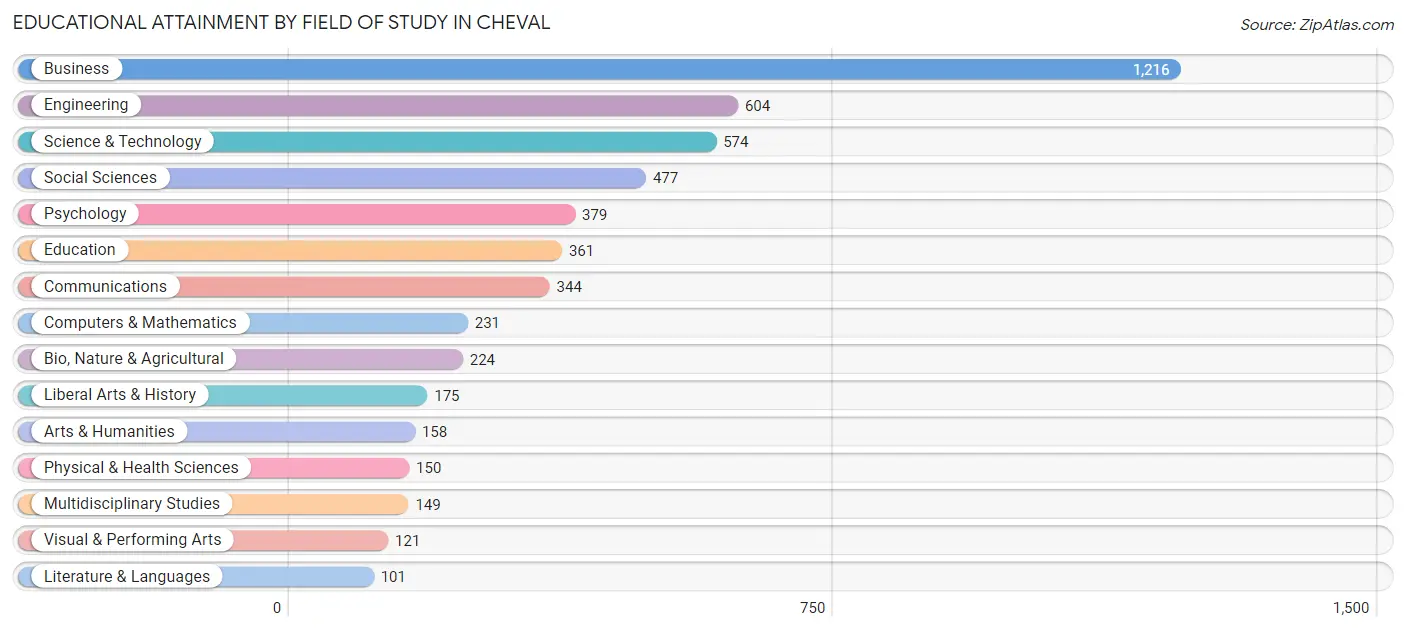
| Field of Study | # Graduates | % Graduates |
| Computers & Mathematics | 231 | 4.4% |
| Bio, Nature & Agricultural | 224 | 4.3% |
| Physical & Health Sciences | 150 | 2.9% |
| Psychology | 379 | 7.2% |
| Social Sciences | 477 | 9.1% |
| Engineering | 604 | 11.5% |
| Multidisciplinary Studies | 149 | 2.8% |
| Science & Technology | 574 | 10.9% |
| Business | 1,216 | 23.1% |
| Education | 361 | 6.9% |
| Literature & Languages | 101 | 1.9% |
| Liberal Arts & History | 175 | 3.3% |
| Visual & Performing Arts | 121 | 2.3% |
| Communications | 344 | 6.5% |
| Arts & Humanities | 158 | 3.0% |
| Total | 5,264 | 100.0% |
Transportation & Commute in Cheval
Vehicle Availability by Sex in Cheval
The most prevalent vehicle ownership categories in Cheval are males with 2 vehicles (1,870, accounting for 50.5%) and females with 2 vehicles (1,292, making up 73.4%).
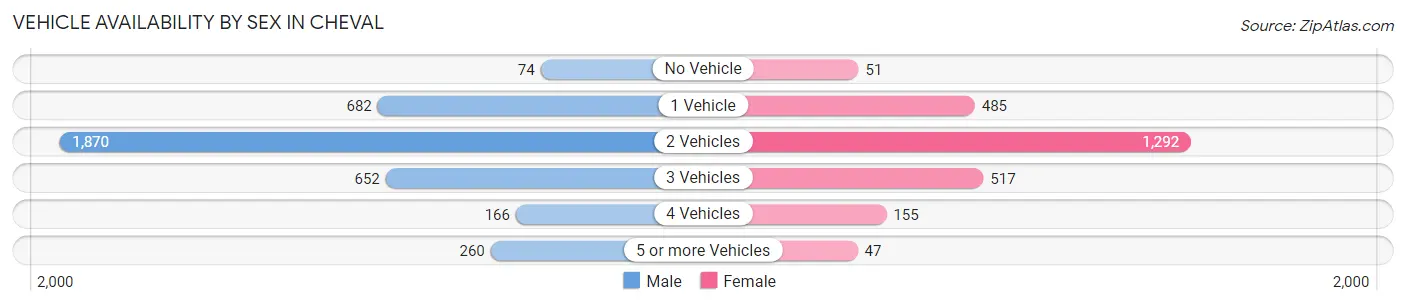
| Vehicles Available | Male | Female |
| No Vehicle | 74 (2.0%) | 51 (2.0%) |
| 1 Vehicle | 682 (18.4%) | 485 (19.0%) |
| 2 Vehicles | 1,870 (50.5%) | 1,292 (50.7%) |
| 3 Vehicles | 652 (17.6%) | 517 (20.3%) |
| 4 Vehicles | 166 (4.5%) | 155 (6.1%) |
| 5 or more Vehicles | 260 (7.0%) | 47 (1.8%) |
| Total | 3,704 (100.0%) | 2,547 (100.0%) |
Commute Time in Cheval
The most frequently occuring commute durations in Cheval are 30 to 34 minutes (1,477 commuters, 28.9%), 20 to 24 minutes (1,109 commuters, 21.7%), and 25 to 29 minutes (463 commuters, 9.1%).
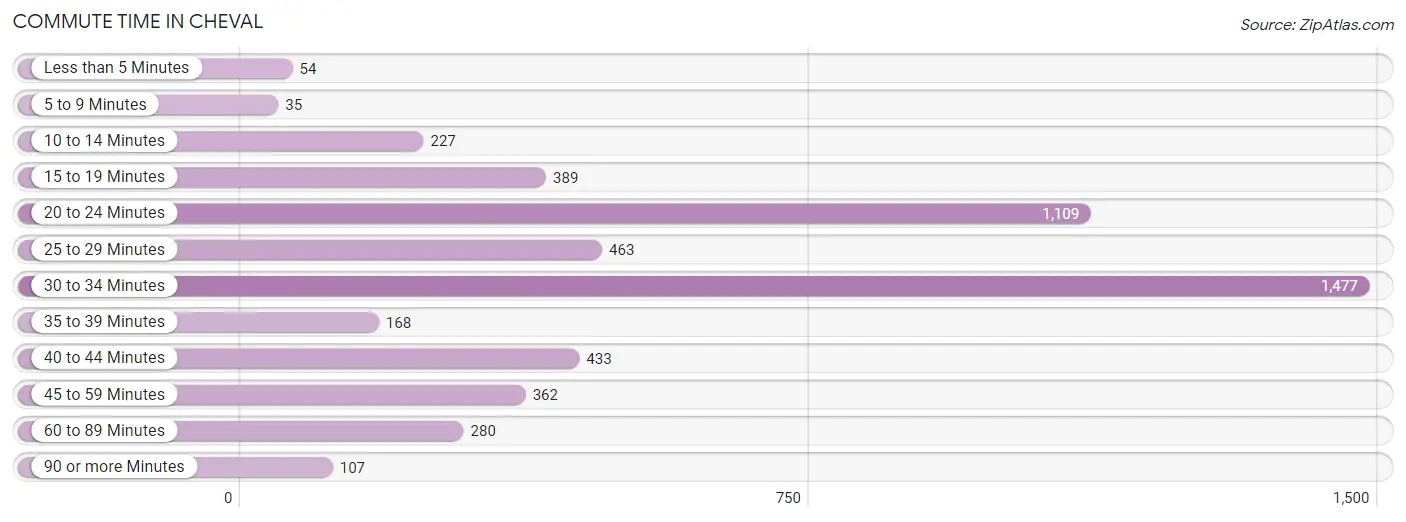
| Commute Time | # Commuters | % Commuters |
| Less than 5 Minutes | 54 | 1.1% |
| 5 to 9 Minutes | 35 | 0.7% |
| 10 to 14 Minutes | 227 | 4.4% |
| 15 to 19 Minutes | 389 | 7.6% |
| 20 to 24 Minutes | 1,109 | 21.7% |
| 25 to 29 Minutes | 463 | 9.1% |
| 30 to 34 Minutes | 1,477 | 28.9% |
| 35 to 39 Minutes | 168 | 3.3% |
| 40 to 44 Minutes | 433 | 8.5% |
| 45 to 59 Minutes | 362 | 7.1% |
| 60 to 89 Minutes | 280 | 5.5% |
| 90 or more Minutes | 107 | 2.1% |
Commute Time by Sex in Cheval
The most common commute times in Cheval are 30 to 34 minutes (867 commuters, 29.5%) for males and 30 to 34 minutes (610 commuters, 28.2%) for females.
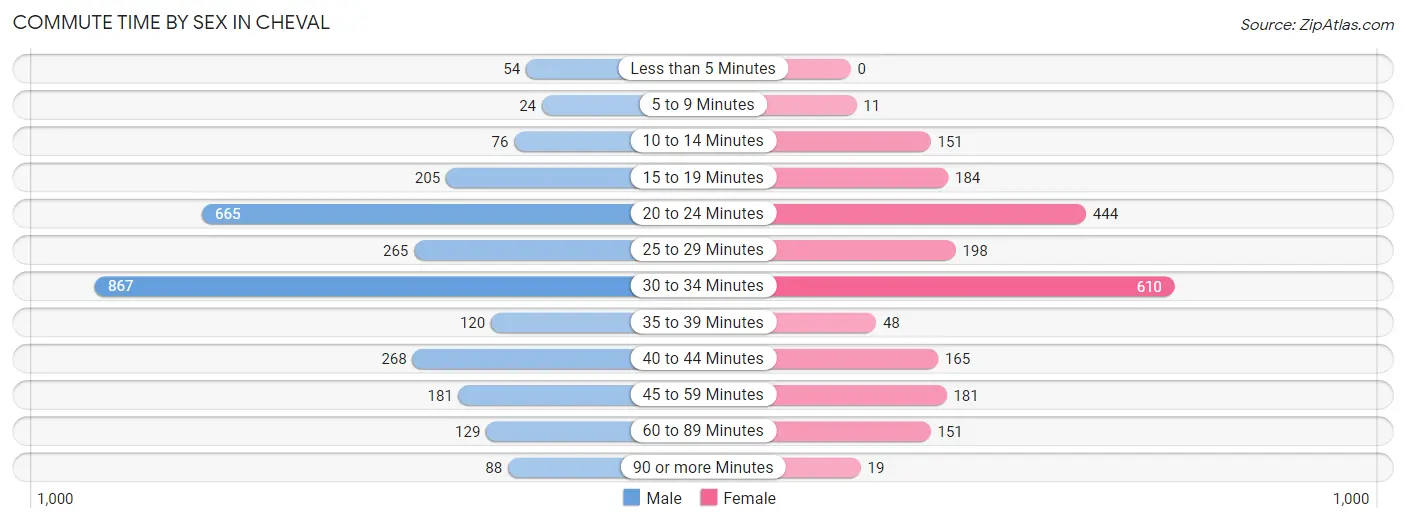
| Commute Time | Male | Female |
| Less than 5 Minutes | 54 (1.8%) | 0 (0.0%) |
| 5 to 9 Minutes | 24 (0.8%) | 11 (0.5%) |
| 10 to 14 Minutes | 76 (2.6%) | 151 (7.0%) |
| 15 to 19 Minutes | 205 (7.0%) | 184 (8.5%) |
| 20 to 24 Minutes | 665 (22.6%) | 444 (20.5%) |
| 25 to 29 Minutes | 265 (9.0%) | 198 (9.2%) |
| 30 to 34 Minutes | 867 (29.5%) | 610 (28.2%) |
| 35 to 39 Minutes | 120 (4.1%) | 48 (2.2%) |
| 40 to 44 Minutes | 268 (9.1%) | 165 (7.6%) |
| 45 to 59 Minutes | 181 (6.1%) | 181 (8.4%) |
| 60 to 89 Minutes | 129 (4.4%) | 151 (7.0%) |
| 90 or more Minutes | 88 (3.0%) | 19 (0.9%) |
Time of Departure to Work by Sex in Cheval
The most frequent times of departure to work in Cheval are 7:00 AM to 7:29 AM (546, 18.6%) for males and 6:30 AM to 6:59 AM (320, 14.8%) for females.
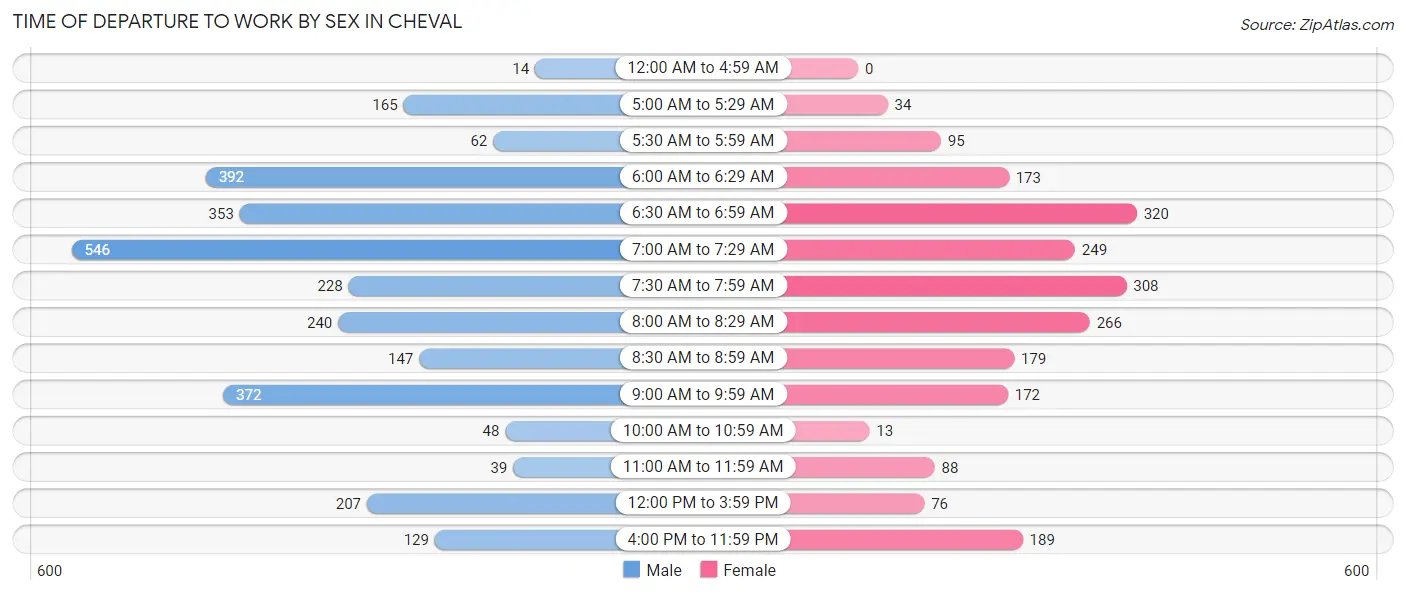
| Time of Departure | Male | Female |
| 12:00 AM to 4:59 AM | 14 (0.5%) | 0 (0.0%) |
| 5:00 AM to 5:29 AM | 165 (5.6%) | 34 (1.6%) |
| 5:30 AM to 5:59 AM | 62 (2.1%) | 95 (4.4%) |
| 6:00 AM to 6:29 AM | 392 (13.3%) | 173 (8.0%) |
| 6:30 AM to 6:59 AM | 353 (12.0%) | 320 (14.8%) |
| 7:00 AM to 7:29 AM | 546 (18.6%) | 249 (11.5%) |
| 7:30 AM to 7:59 AM | 228 (7.7%) | 308 (14.2%) |
| 8:00 AM to 8:29 AM | 240 (8.2%) | 266 (12.3%) |
| 8:30 AM to 8:59 AM | 147 (5.0%) | 179 (8.3%) |
| 9:00 AM to 9:59 AM | 372 (12.6%) | 172 (8.0%) |
| 10:00 AM to 10:59 AM | 48 (1.6%) | 13 (0.6%) |
| 11:00 AM to 11:59 AM | 39 (1.3%) | 88 (4.1%) |
| 12:00 PM to 3:59 PM | 207 (7.0%) | 76 (3.5%) |
| 4:00 PM to 11:59 PM | 129 (4.4%) | 189 (8.7%) |
| Total | 2,942 (100.0%) | 2,162 (100.0%) |
Housing Occupancy in Cheval
Occupancy by Ownership in Cheval
Of the total 5,029 dwellings in Cheval, owner-occupied units account for 2,839 (56.5%), while renter-occupied units make up 2,190 (43.5%).
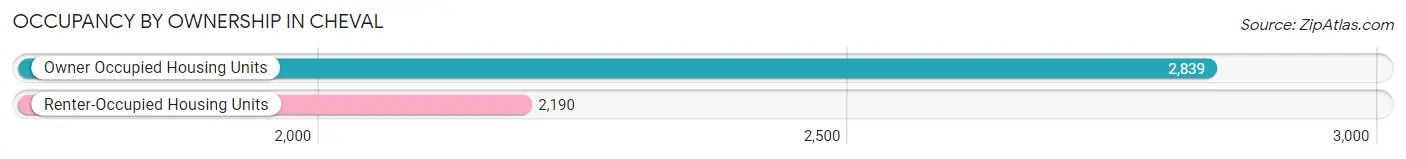
| Occupancy | # Housing Units | % Housing Units |
| Owner Occupied Housing Units | 2,839 | 56.5% |
| Renter-Occupied Housing Units | 2,190 | 43.5% |
| Total Occupied Housing Units | 5,029 | 100.0% |
Occupancy by Household Size in Cheval
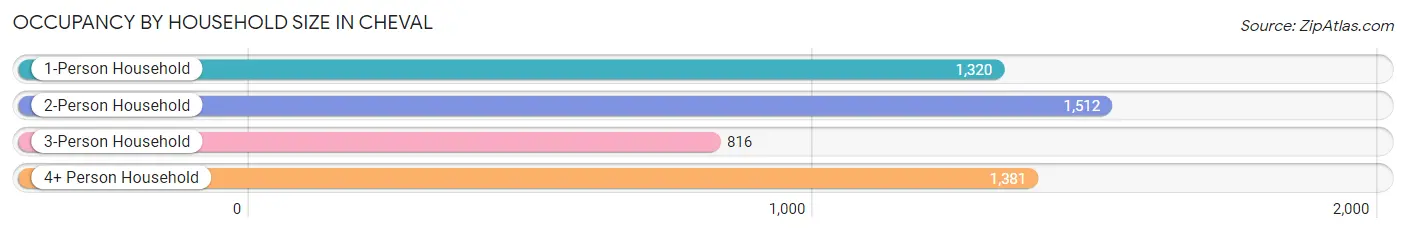
| Household Size | # Housing Units | % Housing Units |
| 1-Person Household | 1,320 | 26.3% |
| 2-Person Household | 1,512 | 30.1% |
| 3-Person Household | 816 | 16.2% |
| 4+ Person Household | 1,381 | 27.5% |
| Total Housing Units | 5,029 | 100.0% |
Occupancy by Ownership by Household Size in Cheval
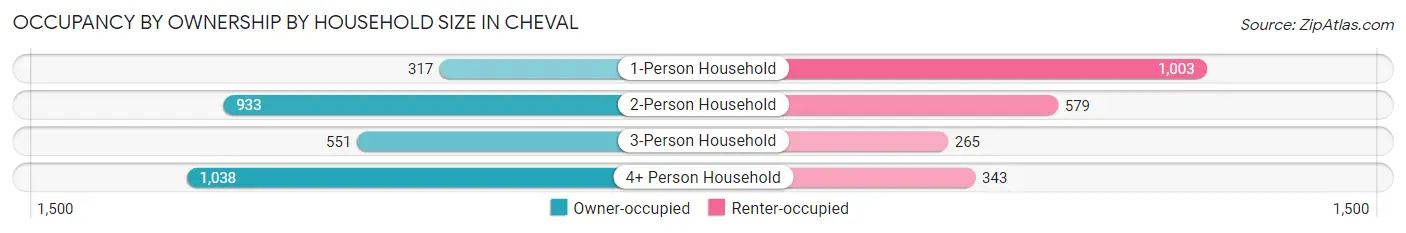
| Household Size | Owner-occupied | Renter-occupied |
| 1-Person Household | 317 (24.0%) | 1,003 (76.0%) |
| 2-Person Household | 933 (61.7%) | 579 (38.3%) |
| 3-Person Household | 551 (67.5%) | 265 (32.5%) |
| 4+ Person Household | 1,038 (75.2%) | 343 (24.8%) |
| Total Housing Units | 2,839 (56.5%) | 2,190 (43.5%) |
Occupancy by Educational Attainment in Cheval
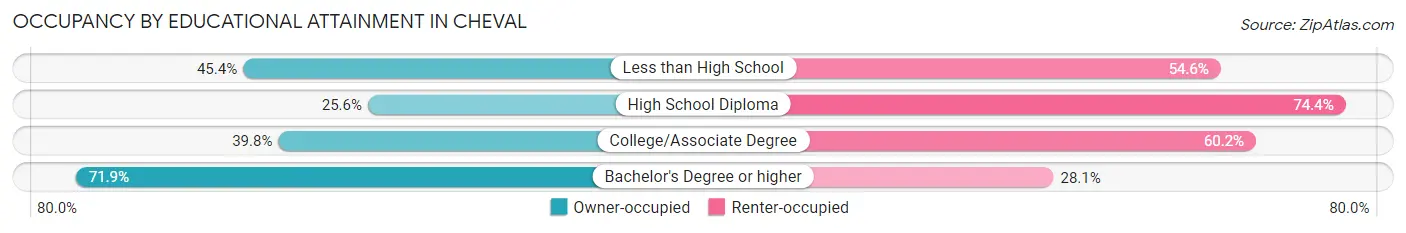
| Household Size | Owner-occupied | Renter-occupied |
| Less than High School | 44 (45.4%) | 53 (54.6%) |
| High School Diploma | 168 (25.6%) | 489 (74.4%) |
| College/Associate Degree | 552 (39.8%) | 836 (60.2%) |
| Bachelor's Degree or higher | 2,075 (71.9%) | 812 (28.1%) |
Occupancy by Age of Householder in Cheval
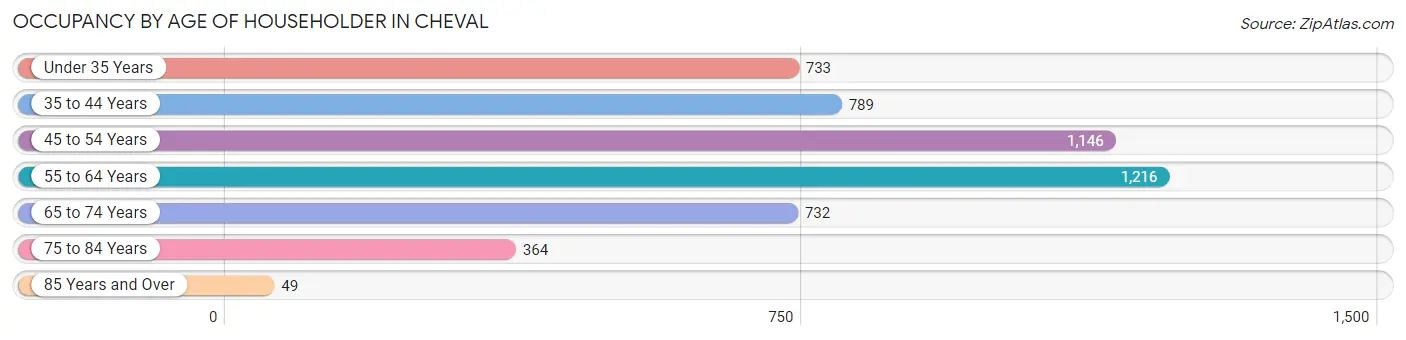
| Age Bracket | # Households | % Households |
| Under 35 Years | 733 | 14.6% |
| 35 to 44 Years | 789 | 15.7% |
| 45 to 54 Years | 1,146 | 22.8% |
| 55 to 64 Years | 1,216 | 24.2% |
| 65 to 74 Years | 732 | 14.6% |
| 75 to 84 Years | 364 | 7.2% |
| 85 Years and Over | 49 | 1.0% |
| Total | 5,029 | 100.0% |
Housing Finances in Cheval
Median Income by Occupancy in Cheval
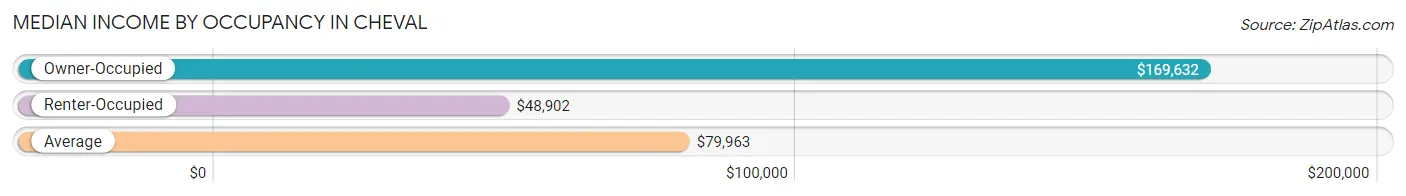
| Occupancy Type | # Households | Median Income |
| Owner-Occupied | 2,839 (56.5%) | $169,632 |
| Renter-Occupied | 2,190 (43.5%) | $48,902 |
| Average | 5,029 (100.0%) | $79,963 |
Occupancy by Householder Income Bracket in Cheval
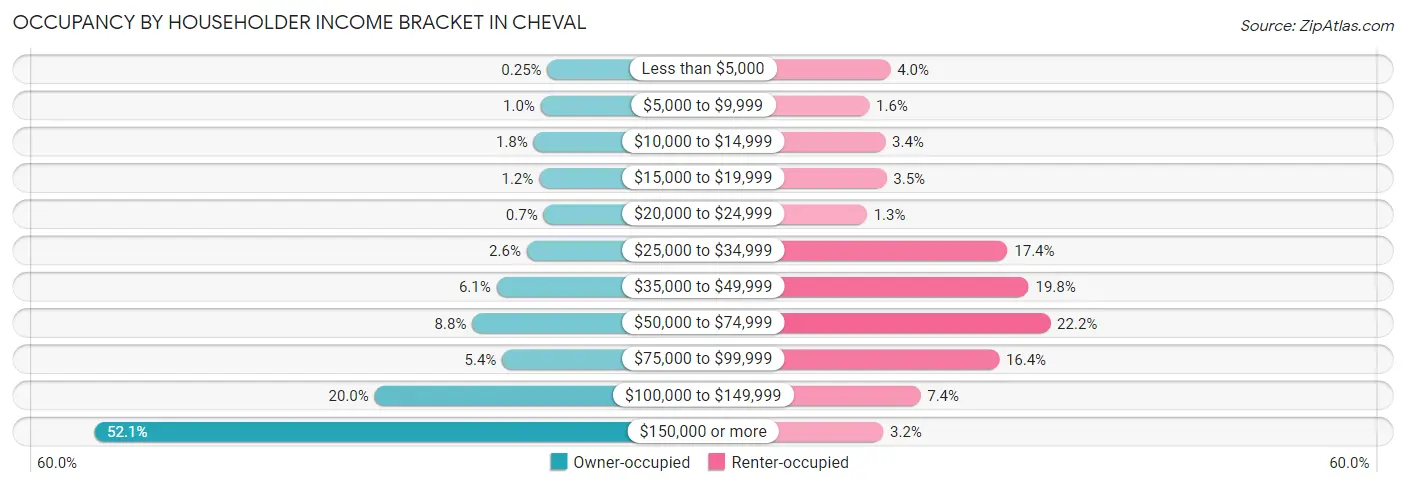
| Income Bracket | Owner-occupied | Renter-occupied |
| Less than $5,000 | 7 (0.3%) | 87 (4.0%) |
| $5,000 to $9,999 | 29 (1.0%) | 34 (1.5%) |
| $10,000 to $14,999 | 52 (1.8%) | 74 (3.4%) |
| $15,000 to $19,999 | 34 (1.2%) | 77 (3.5%) |
| $20,000 to $24,999 | 20 (0.7%) | 28 (1.3%) |
| $25,000 to $34,999 | 74 (2.6%) | 380 (17.3%) |
| $35,000 to $49,999 | 172 (6.1%) | 433 (19.8%) |
| $50,000 to $74,999 | 251 (8.8%) | 487 (22.2%) |
| $75,000 to $99,999 | 154 (5.4%) | 359 (16.4%) |
| $100,000 to $149,999 | 568 (20.0%) | 162 (7.4%) |
| $150,000 or more | 1,478 (52.1%) | 69 (3.2%) |
| Total | 2,839 (100.0%) | 2,190 (100.0%) |
Monthly Housing Cost Tiers in Cheval
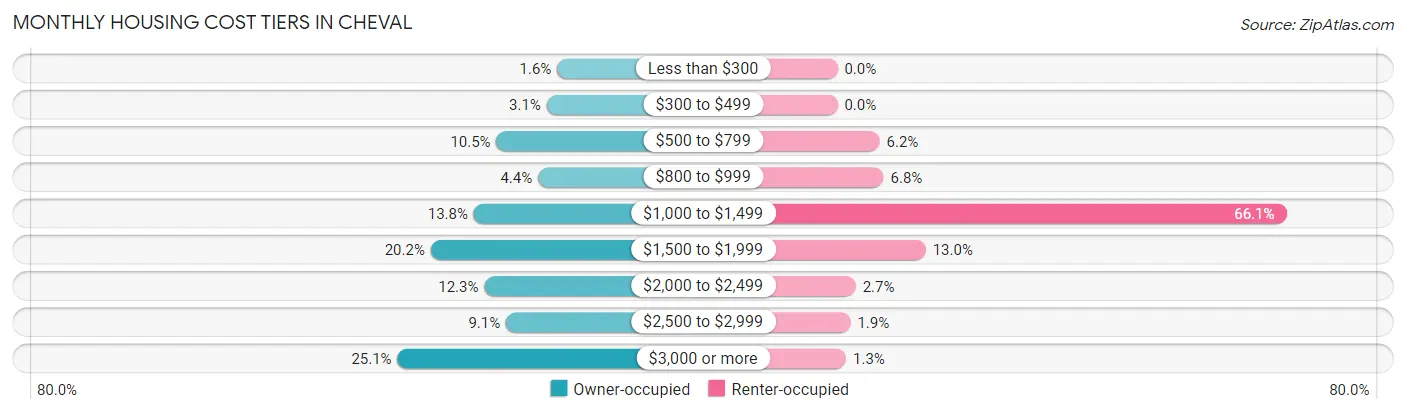
| Monthly Cost | Owner-occupied | Renter-occupied |
| Less than $300 | 44 (1.5%) | 0 (0.0%) |
| $300 to $499 | 88 (3.1%) | 0 (0.0%) |
| $500 to $799 | 298 (10.5%) | 136 (6.2%) |
| $800 to $999 | 124 (4.4%) | 149 (6.8%) |
| $1,000 to $1,499 | 393 (13.8%) | 1,448 (66.1%) |
| $1,500 to $1,999 | 573 (20.2%) | 285 (13.0%) |
| $2,000 to $2,499 | 349 (12.3%) | 59 (2.7%) |
| $2,500 to $2,999 | 258 (9.1%) | 42 (1.9%) |
| $3,000 or more | 712 (25.1%) | 28 (1.3%) |
| Total | 2,839 (100.0%) | 2,190 (100.0%) |
Physical Housing Characteristics in Cheval
Housing Structures in Cheval
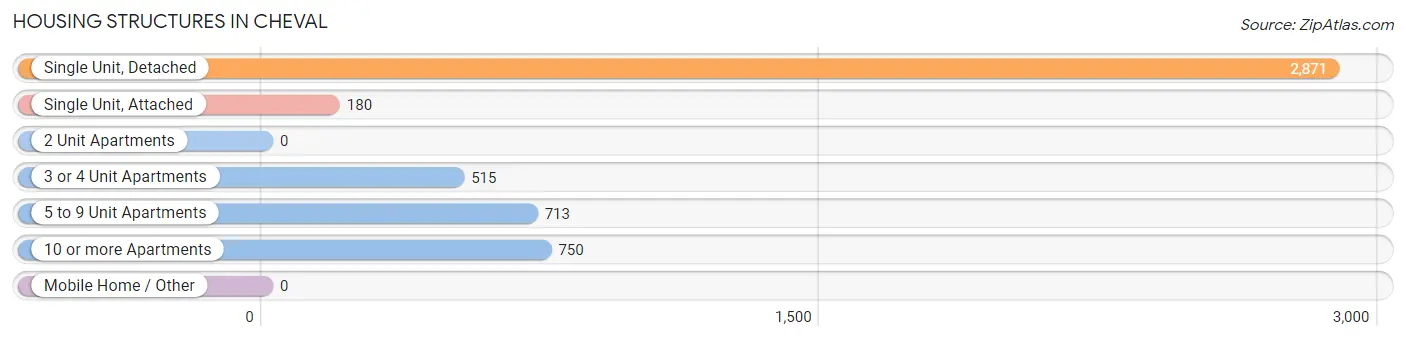
| Structure Type | # Housing Units | % Housing Units |
| Single Unit, Detached | 2,871 | 57.1% |
| Single Unit, Attached | 180 | 3.6% |
| 2 Unit Apartments | 0 | 0.0% |
| 3 or 4 Unit Apartments | 515 | 10.2% |
| 5 to 9 Unit Apartments | 713 | 14.2% |
| 10 or more Apartments | 750 | 14.9% |
| Mobile Home / Other | 0 | 0.0% |
| Total | 5,029 | 100.0% |
Housing Structures by Occupancy in Cheval
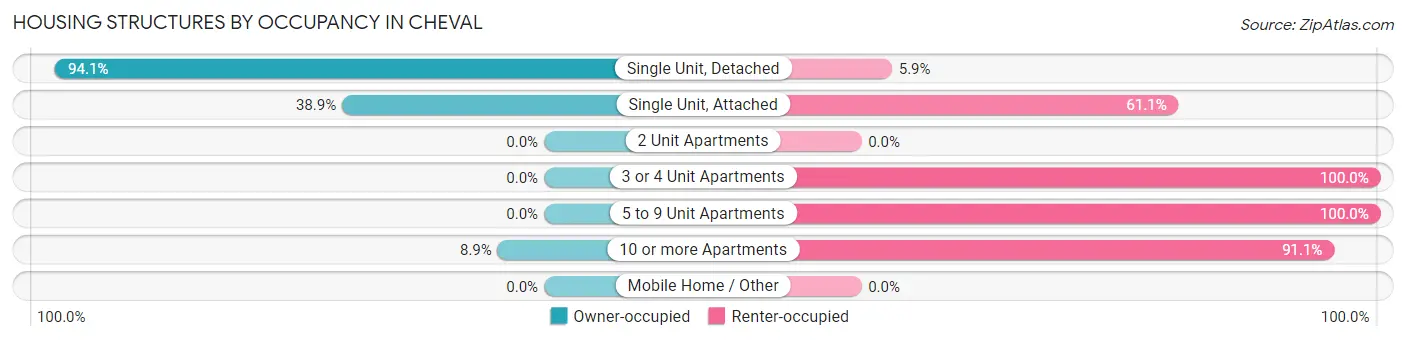
| Structure Type | Owner-occupied | Renter-occupied |
| Single Unit, Detached | 2,702 (94.1%) | 169 (5.9%) |
| Single Unit, Attached | 70 (38.9%) | 110 (61.1%) |
| 2 Unit Apartments | 0 (0.0%) | 0 (0.0%) |
| 3 or 4 Unit Apartments | 0 (0.0%) | 515 (100.0%) |
| 5 to 9 Unit Apartments | 0 (0.0%) | 713 (100.0%) |
| 10 or more Apartments | 67 (8.9%) | 683 (91.1%) |
| Mobile Home / Other | 0 (0.0%) | 0 (0.0%) |
| Total | 2,839 (56.5%) | 2,190 (43.5%) |
Housing Structures by Number of Rooms in Cheval
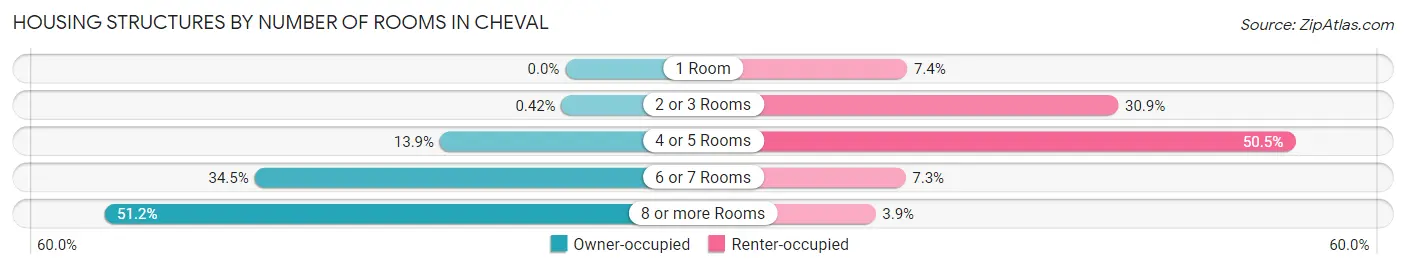
| Number of Rooms | Owner-occupied | Renter-occupied |
| 1 Room | 0 (0.0%) | 163 (7.4%) |
| 2 or 3 Rooms | 12 (0.4%) | 676 (30.9%) |
| 4 or 5 Rooms | 395 (13.9%) | 1,106 (50.5%) |
| 6 or 7 Rooms | 979 (34.5%) | 159 (7.3%) |
| 8 or more Rooms | 1,453 (51.2%) | 86 (3.9%) |
| Total | 2,839 (100.0%) | 2,190 (100.0%) |
Housing Structure by Heating Type in Cheval
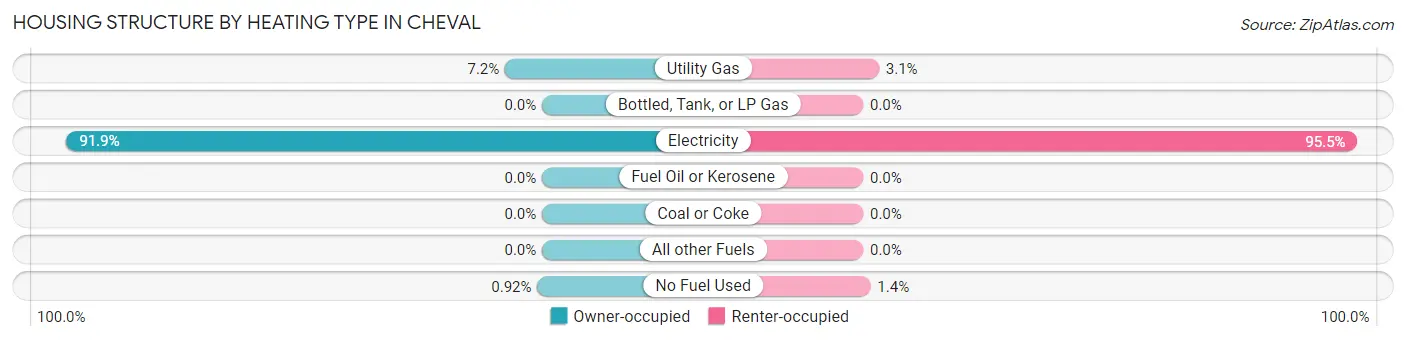
| Heating Type | Owner-occupied | Renter-occupied |
| Utility Gas | 203 (7.1%) | 67 (3.1%) |
| Bottled, Tank, or LP Gas | 0 (0.0%) | 0 (0.0%) |
| Electricity | 2,610 (91.9%) | 2,092 (95.5%) |
| Fuel Oil or Kerosene | 0 (0.0%) | 0 (0.0%) |
| Coal or Coke | 0 (0.0%) | 0 (0.0%) |
| All other Fuels | 0 (0.0%) | 0 (0.0%) |
| No Fuel Used | 26 (0.9%) | 31 (1.4%) |
| Total | 2,839 (100.0%) | 2,190 (100.0%) |
Household Vehicle Usage in Cheval
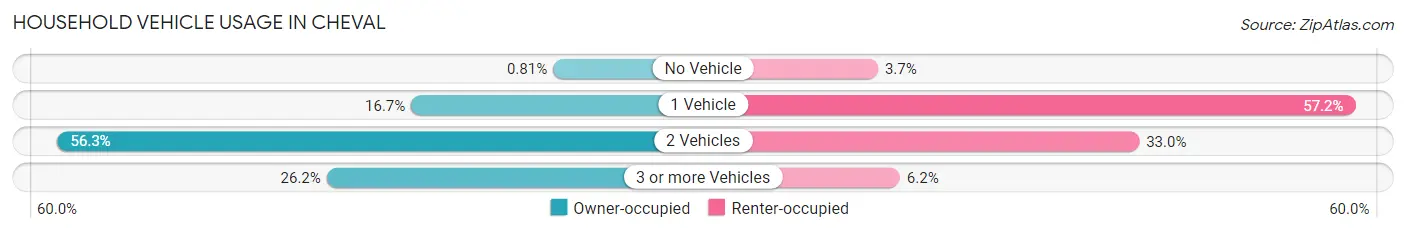
| Vehicles per Household | Owner-occupied | Renter-occupied |
| No Vehicle | 23 (0.8%) | 81 (3.7%) |
| 1 Vehicle | 474 (16.7%) | 1,252 (57.2%) |
| 2 Vehicles | 1,599 (56.3%) | 722 (33.0%) |
| 3 or more Vehicles | 743 (26.2%) | 135 (6.2%) |
| Total | 2,839 (100.0%) | 2,190 (100.0%) |
Real Estate & Mortgages in Cheval
Real Estate and Mortgage Overview in Cheval
| Characteristic | Without Mortgage | With Mortgage |
| Housing Units | 867 | 1,972 |
| Median Property Value | $416,700 | $458,500 |
| Median Household Income | $117,330 | $1,132 |
| Monthly Housing Costs | $805 | $712 |
| Real Estate Taxes | $4,672 | $15 |
Property Value by Mortgage Status in Cheval
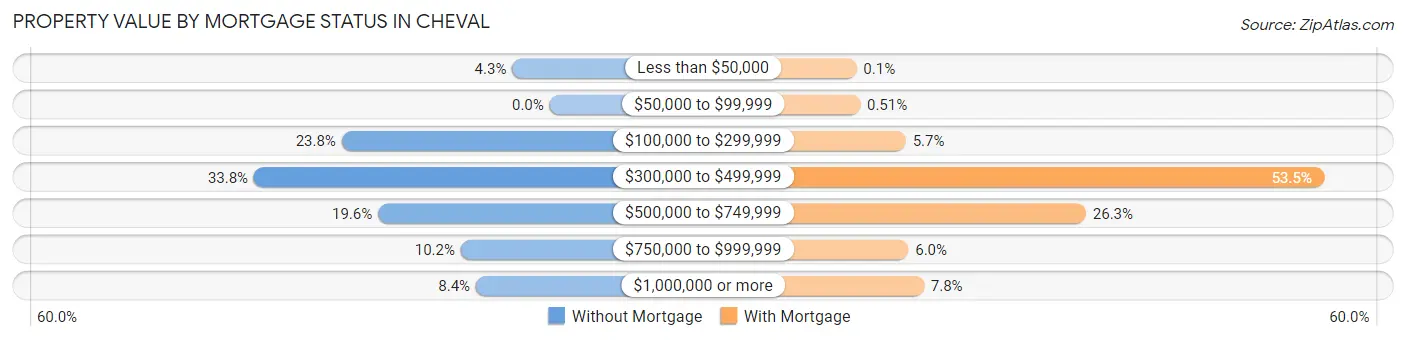
| Property Value | Without Mortgage | With Mortgage |
| Less than $50,000 | 37 (4.3%) | 2 (0.1%) |
| $50,000 to $99,999 | 0 (0.0%) | 10 (0.5%) |
| $100,000 to $299,999 | 206 (23.8%) | 113 (5.7%) |
| $300,000 to $499,999 | 293 (33.8%) | 1,055 (53.5%) |
| $500,000 to $749,999 | 170 (19.6%) | 519 (26.3%) |
| $750,000 to $999,999 | 88 (10.2%) | 119 (6.0%) |
| $1,000,000 or more | 73 (8.4%) | 154 (7.8%) |
| Total | 867 (100.0%) | 1,972 (100.0%) |
Household Income by Mortgage Status in Cheval
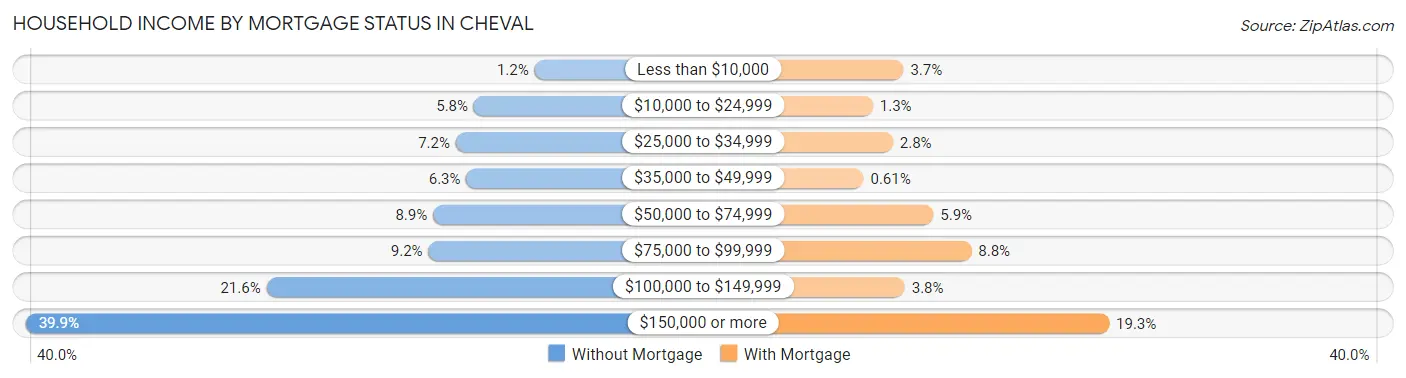
| Household Income | Without Mortgage | With Mortgage |
| Less than $10,000 | 10 (1.1%) | 72 (3.6%) |
| $10,000 to $24,999 | 50 (5.8%) | 26 (1.3%) |
| $25,000 to $34,999 | 62 (7.1%) | 56 (2.8%) |
| $35,000 to $49,999 | 55 (6.3%) | 12 (0.6%) |
| $50,000 to $74,999 | 77 (8.9%) | 117 (5.9%) |
| $75,000 to $99,999 | 80 (9.2%) | 174 (8.8%) |
| $100,000 to $149,999 | 187 (21.6%) | 74 (3.7%) |
| $150,000 or more | 346 (39.9%) | 381 (19.3%) |
| Total | 867 (100.0%) | 1,972 (100.0%) |
Property Value to Household Income Ratio in Cheval
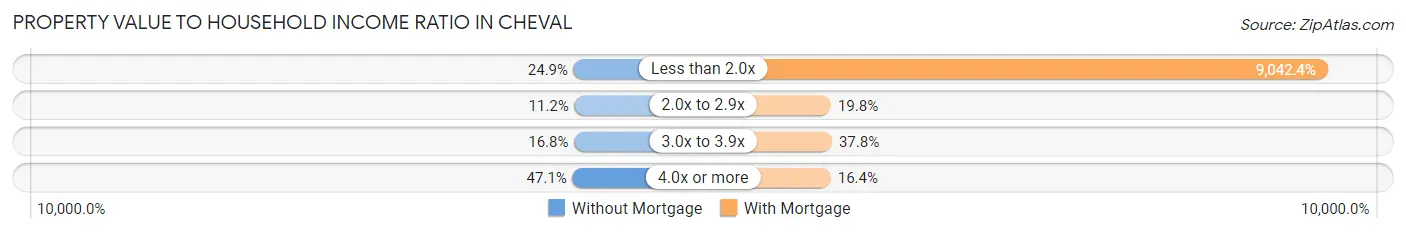
| Value-to-Income Ratio | Without Mortgage | With Mortgage |
| Less than 2.0x | 216 (24.9%) | 178,317 (9,042.4%) |
| 2.0x to 2.9x | 97 (11.2%) | 390 (19.8%) |
| 3.0x to 3.9x | 146 (16.8%) | 746 (37.8%) |
| 4.0x or more | 408 (47.1%) | 324 (16.4%) |
| Total | 867 (100.0%) | 1,972 (100.0%) |
Real Estate Taxes by Mortgage Status in Cheval
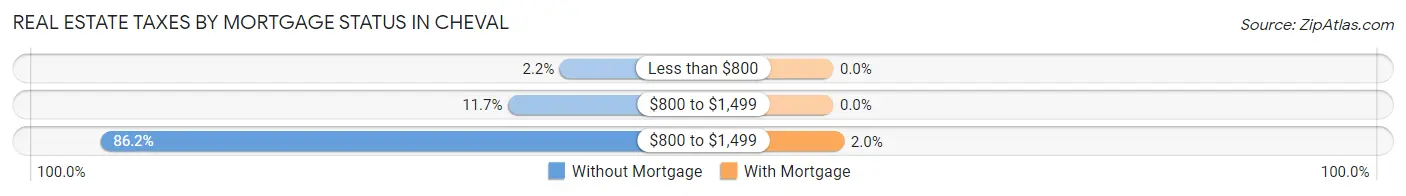
| Property Taxes | Without Mortgage | With Mortgage |
| Less than $800 | 19 (2.2%) | 0 (0.0%) |
| $800 to $1,499 | 101 (11.7%) | 0 (0.0%) |
| $800 to $1,499 | 747 (86.2%) | 39 (2.0%) |
| Total | 867 (100.0%) | 1,972 (100.0%) |
Health & Disability in Cheval
Health Insurance Coverage by Age in Cheval
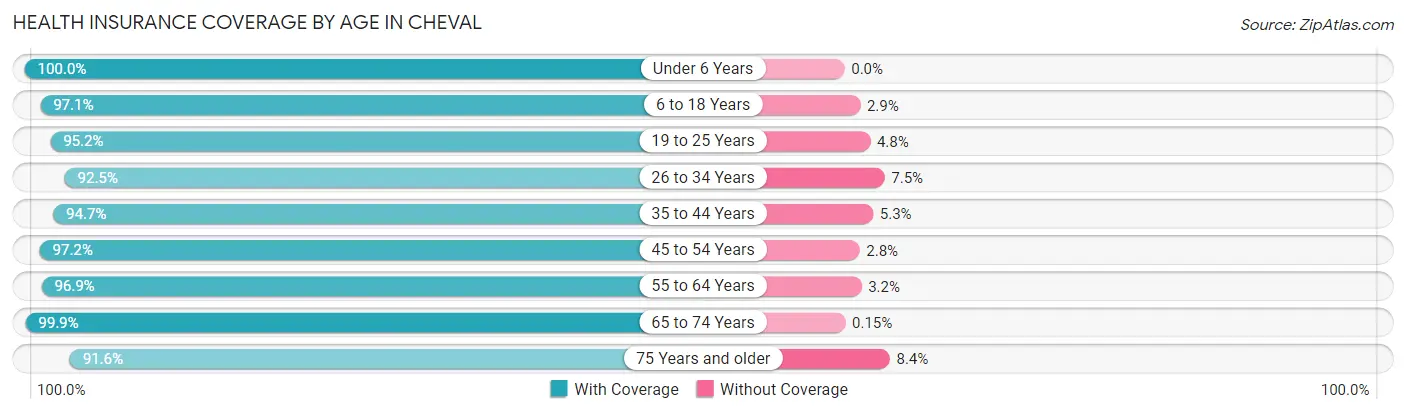
| Age Bracket | With Coverage | Without Coverage |
| Under 6 Years | 968 (100.0%) | 0 (0.0%) |
| 6 to 18 Years | 2,662 (97.1%) | 80 (2.9%) |
| 19 to 25 Years | 957 (95.2%) | 48 (4.8%) |
| 26 to 34 Years | 979 (92.5%) | 79 (7.5%) |
| 35 to 44 Years | 1,544 (94.7%) | 87 (5.3%) |
| 45 to 54 Years | 1,938 (97.2%) | 56 (2.8%) |
| 55 to 64 Years | 1,690 (96.9%) | 55 (3.2%) |
| 65 to 74 Years | 1,369 (99.9%) | 2 (0.2%) |
| 75 Years and older | 618 (91.6%) | 57 (8.4%) |
| Total | 12,725 (96.5%) | 464 (3.5%) |
Health Insurance Coverage by Citizenship Status in Cheval
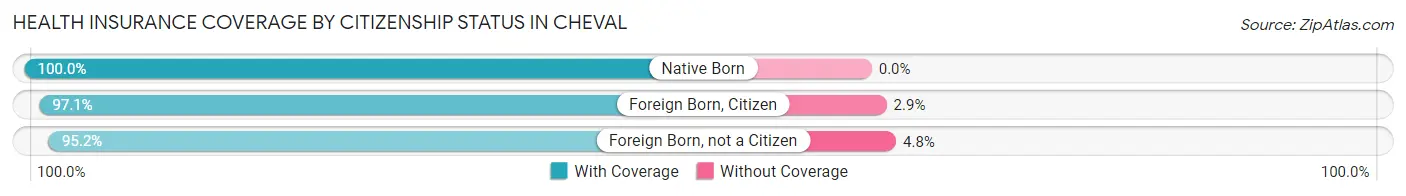
| Citizenship Status | With Coverage | Without Coverage |
| Native Born | 968 (100.0%) | 0 (0.0%) |
| Foreign Born, Citizen | 2,662 (97.1%) | 80 (2.9%) |
| Foreign Born, not a Citizen | 957 (95.2%) | 48 (4.8%) |
Health Insurance Coverage by Household Income in Cheval
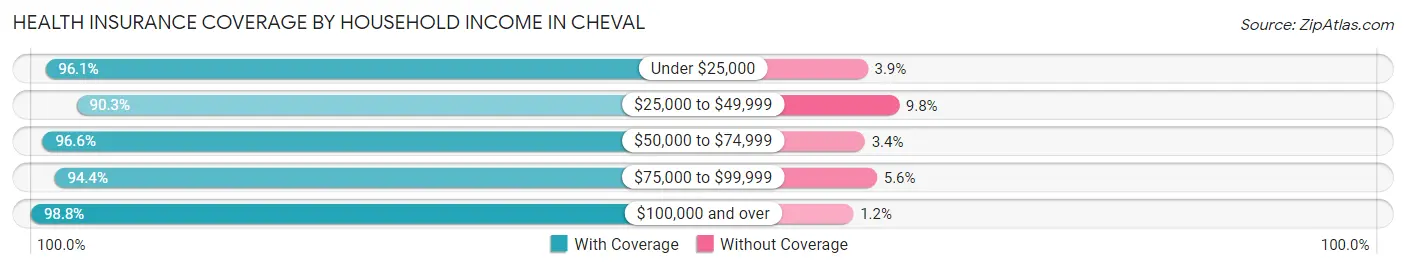
| Household Income | With Coverage | Without Coverage |
| Under $25,000 | 620 (96.1%) | 25 (3.9%) |
| $25,000 to $49,999 | 1,990 (90.2%) | 215 (9.8%) |
| $50,000 to $74,999 | 1,207 (96.6%) | 42 (3.4%) |
| $75,000 to $99,999 | 1,561 (94.4%) | 93 (5.6%) |
| $100,000 and over | 7,347 (98.8%) | 89 (1.2%) |
Public vs Private Health Insurance Coverage by Age in Cheval
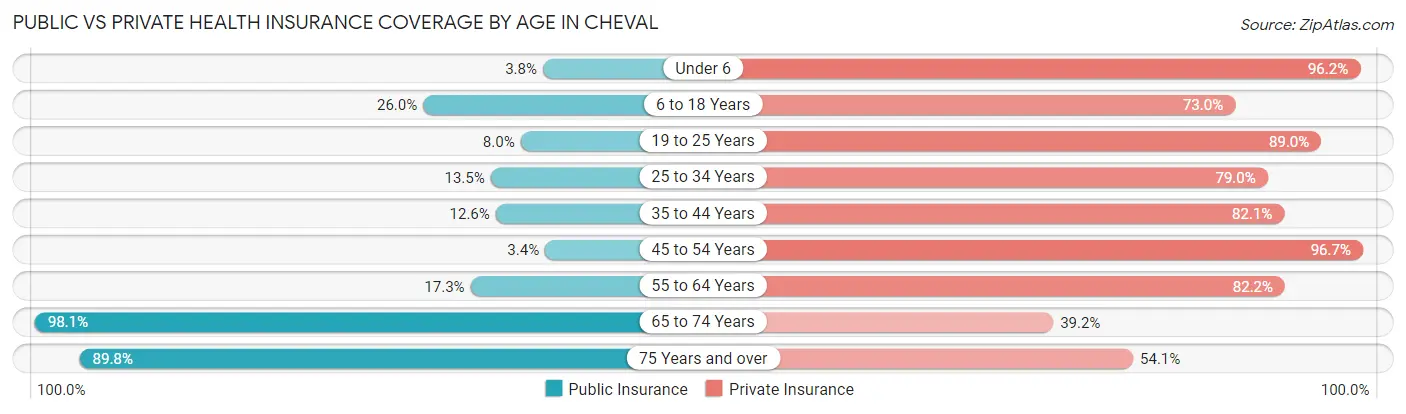
| Age Bracket | Public Insurance | Private Insurance |
| Under 6 | 37 (3.8%) | 931 (96.2%) |
| 6 to 18 Years | 714 (26.0%) | 2,001 (73.0%) |
| 19 to 25 Years | 80 (8.0%) | 894 (89.0%) |
| 25 to 34 Years | 143 (13.5%) | 836 (79.0%) |
| 35 to 44 Years | 205 (12.6%) | 1,339 (82.1%) |
| 45 to 54 Years | 68 (3.4%) | 1,928 (96.7%) |
| 55 to 64 Years | 301 (17.2%) | 1,435 (82.2%) |
| 65 to 74 Years | 1,345 (98.1%) | 538 (39.2%) |
| 75 Years and over | 606 (89.8%) | 365 (54.1%) |
| Total | 3,499 (26.5%) | 10,267 (77.8%) |
Disability Status by Sex by Age in Cheval
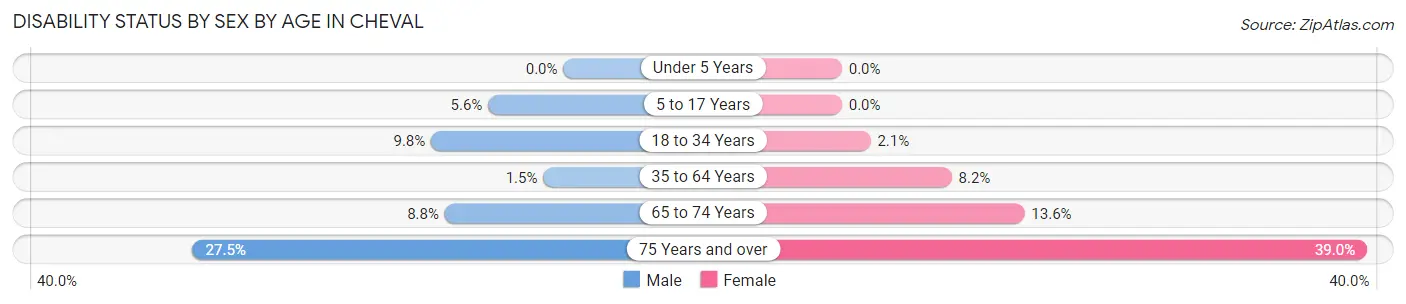
| Age Bracket | Male | Female |
| Under 5 Years | 0 (0.0%) | 0 (0.0%) |
| 5 to 17 Years | 74 (5.6%) | 0 (0.0%) |
| 18 to 34 Years | 129 (9.8%) | 26 (2.1%) |
| 35 to 64 Years | 42 (1.5%) | 208 (8.2%) |
| 65 to 74 Years | 46 (8.8%) | 115 (13.6%) |
| 75 Years and over | 82 (27.5%) | 147 (39.0%) |
Disability Class by Sex by Age in Cheval
Disability Class: Hearing Difficulty
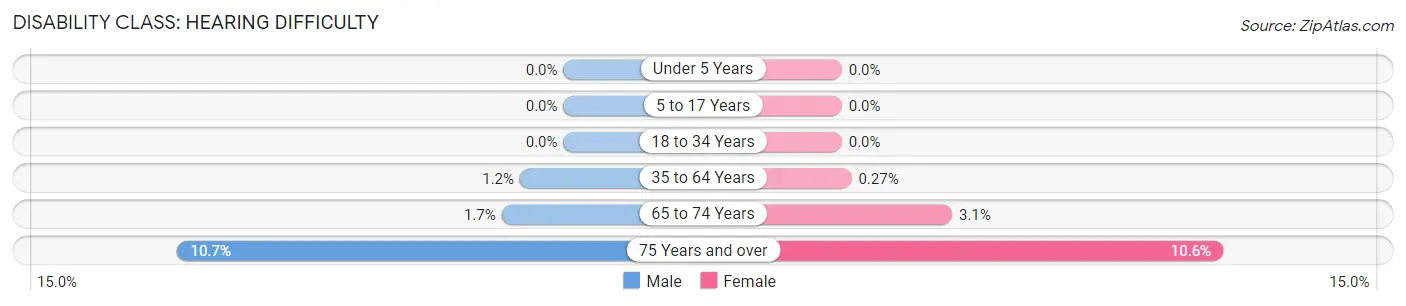
| Age Bracket | Male | Female |
| Under 5 Years | 0 (0.0%) | 0 (0.0%) |
| 5 to 17 Years | 0 (0.0%) | 0 (0.0%) |
| 18 to 34 Years | 0 (0.0%) | 0 (0.0%) |
| 35 to 64 Years | 34 (1.2%) | 7 (0.3%) |
| 65 to 74 Years | 9 (1.7%) | 26 (3.1%) |
| 75 Years and over | 32 (10.7%) | 40 (10.6%) |
Disability Class: Vision Difficulty
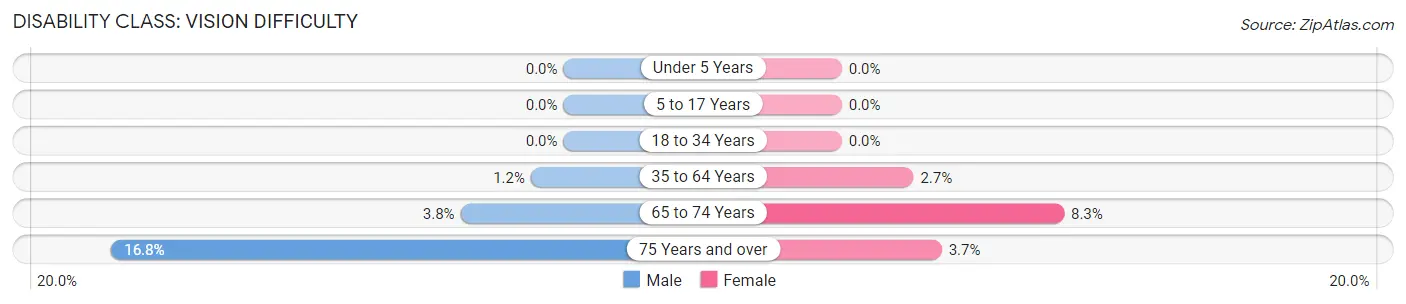
| Age Bracket | Male | Female |
| Under 5 Years | 0 (0.0%) | 0 (0.0%) |
| 5 to 17 Years | 0 (0.0%) | 0 (0.0%) |
| 18 to 34 Years | 0 (0.0%) | 0 (0.0%) |
| 35 to 64 Years | 34 (1.2%) | 68 (2.7%) |
| 65 to 74 Years | 20 (3.8%) | 70 (8.3%) |
| 75 Years and over | 50 (16.8%) | 14 (3.7%) |
Disability Class: Cognitive Difficulty
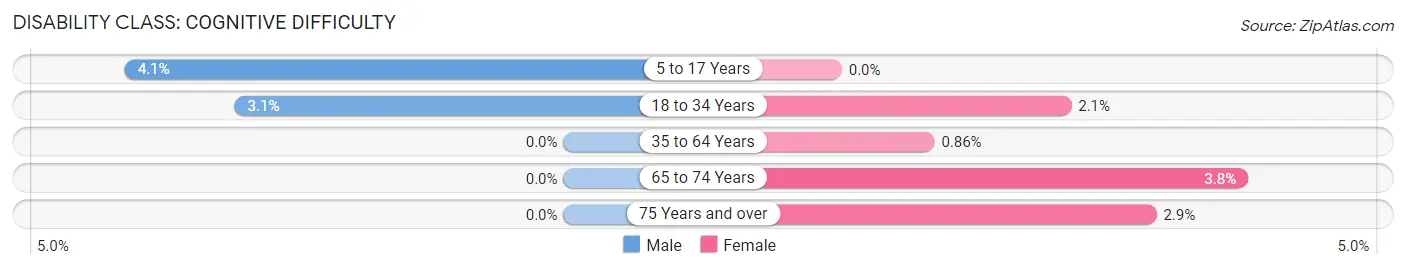
| Age Bracket | Male | Female |
| 5 to 17 Years | 54 (4.1%) | 0 (0.0%) |
| 18 to 34 Years | 40 (3.0%) | 26 (2.1%) |
| 35 to 64 Years | 0 (0.0%) | 22 (0.9%) |
| 65 to 74 Years | 0 (0.0%) | 32 (3.8%) |
| 75 Years and over | 0 (0.0%) | 11 (2.9%) |
Disability Class: Ambulatory Difficulty
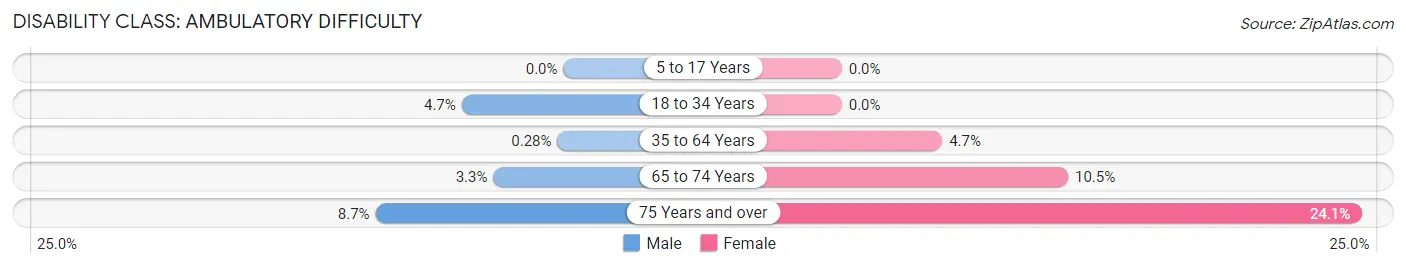
| Age Bracket | Male | Female |
| 5 to 17 Years | 0 (0.0%) | 0 (0.0%) |
| 18 to 34 Years | 62 (4.7%) | 0 (0.0%) |
| 35 to 64 Years | 8 (0.3%) | 119 (4.7%) |
| 65 to 74 Years | 17 (3.3%) | 89 (10.5%) |
| 75 Years and over | 26 (8.7%) | 91 (24.1%) |
Disability Class: Self-Care Difficulty
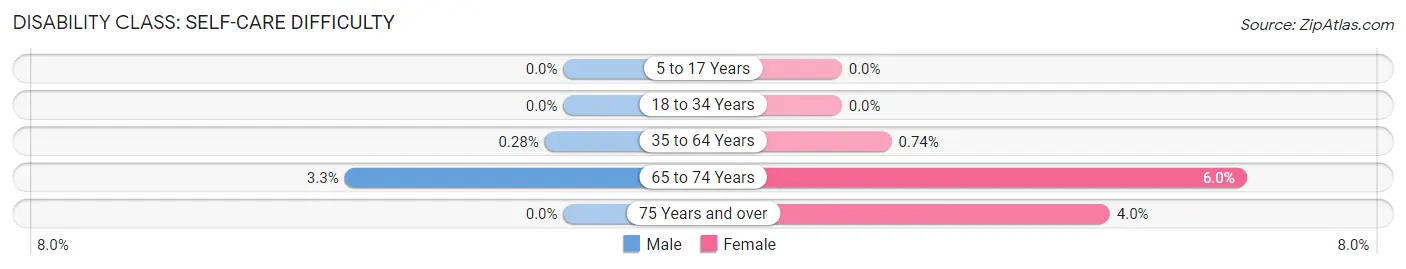
| Age Bracket | Male | Female |
| 5 to 17 Years | 0 (0.0%) | 0 (0.0%) |
| 18 to 34 Years | 0 (0.0%) | 0 (0.0%) |
| 35 to 64 Years | 8 (0.3%) | 19 (0.7%) |
| 65 to 74 Years | 17 (3.3%) | 51 (6.0%) |
| 75 Years and over | 0 (0.0%) | 15 (4.0%) |
Technology Access in Cheval
Computing Device Access in Cheval
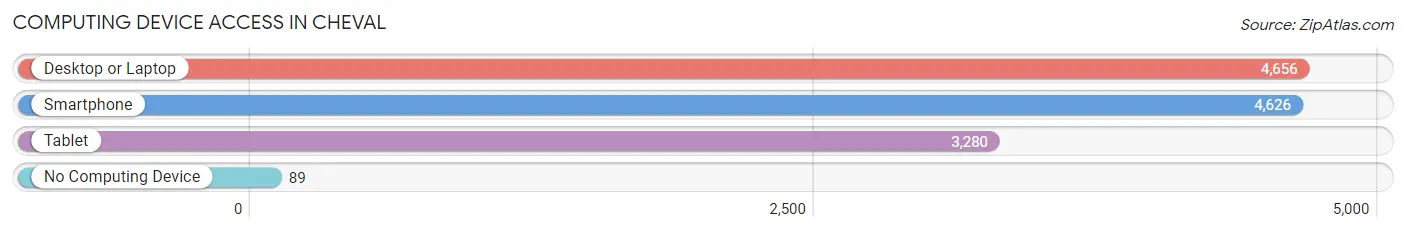
| Device Type | # Households | % Households |
| Desktop or Laptop | 4,656 | 92.6% |
| Smartphone | 4,626 | 92.0% |
| Tablet | 3,280 | 65.2% |
| No Computing Device | 89 | 1.8% |
| Total | 5,029 | 100.0% |
Internet Access in Cheval
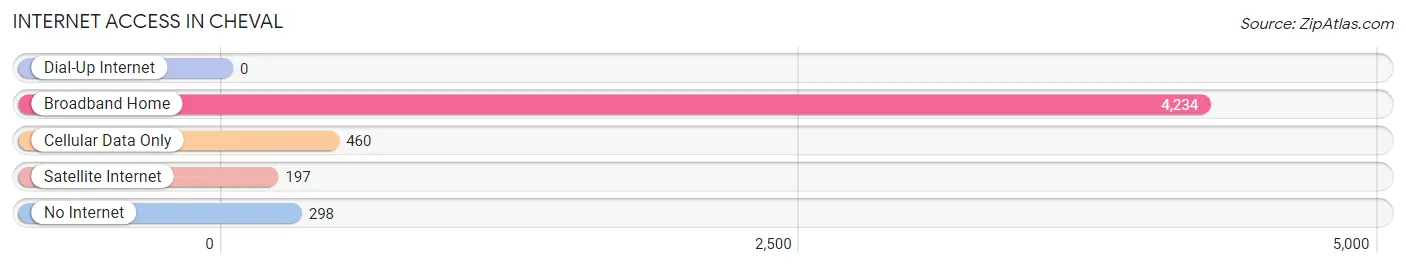
| Internet Type | # Households | % Households |
| Dial-Up Internet | 0 | 0.0% |
| Broadband Home | 4,234 | 84.2% |
| Cellular Data Only | 460 | 9.1% |
| Satellite Internet | 197 | 3.9% |
| No Internet | 298 | 5.9% |
| Total | 5,029 | 100.0% |
Cheval Summary
Cheval is a census-designated place (CDP) located in Hillsborough County, Florida. It is located in the northern part of the county, approximately 20 miles northeast of Tampa. As of the 2010 census, the population of Cheval was 8,945.
Geography
Cheval is located at 28°7'25" North, 82°20'25" West (28.123611, -82.340278). The CDP has a total area of 8.3 square miles, of which 8.2 square miles is land and 0.1 square miles is water.
Cheval is located in the northern part of Hillsborough County, approximately 20 miles northeast of Tampa. It is bordered by the city of Lutz to the north, the city of Tampa to the south, and the city of Wesley Chapel to the east.
History
Cheval was first settled in the late 19th century by settlers from the nearby city of Tampa. The area was originally known as "Cheval Station" due to the presence of a railroad station in the area. The name was later shortened to "Cheval".
The area remained largely rural until the late 20th century, when it began to experience rapid growth due to its proximity to Tampa. The population of Cheval increased from 1,845 in 2000 to 8,945 in 2010.
Economy
Cheval is primarily a residential community, with most of its residents commuting to nearby cities for work. The largest employers in the area are the University of South Florida, Tampa General Hospital, and the Hillsborough County School District.
Demographics
As of the 2010 census, there were 8,945 people, 3,093 households, and 2,521 families residing in Cheval. The population density was 1,082.3 people per square mile. The racial makeup of the CDP was 81.2% White, 8.2% African American, 0.3% Native American, 4.2% Asian, 0.1% Pacific Islander, 3.7% from other races, and 2.3% from two or more races. Hispanic or Latino of any race were 11.2% of the population.
The median income for a household in Cheval was $76,945, and the median income for a family was $86,945. The per capita income for the CDP was $31,945. About 3.2% of families and 4.3% of the population were below the poverty line, including 5.2% of those under age 18 and 4.2% of those age 65 or over.
Common Questions
What is Per Capita Income in Cheval?
Per Capita income in Cheval is $48,945.
What is the Median Family Income in Cheval?
Median Family Income in Cheval is $119,696.
What is the Median Household income in Cheval?
Median Household Income in Cheval is $79,963.
What is Income or Wage Gap in Cheval?
Income or Wage Gap in Cheval is 41.7%.
Women in Cheval earn 58.3 cents for every dollar earned by a man.
What is Inequality or Gini Index in Cheval?
Inequality or Gini Index in Cheval is 0.48.
What is the Total Population of Cheval?
Total Population of Cheval is 13,189.
What is the Total Male Population of Cheval?
Total Male Population of Cheval is 6,637.
What is the Total Female Population of Cheval?
Total Female Population of Cheval is 6,552.
What is the Ratio of Males per 100 Females in Cheval?
There are 101.30 Males per 100 Females in Cheval.
What is the Ratio of Females per 100 Males in Cheval?
There are 98.72 Females per 100 Males in Cheval.
What is the Median Population Age in Cheval?
Median Population Age in Cheval is 39.8 Years.
What is the Average Family Size in Cheval
Average Family Size in Cheval is 3.2 People.
What is the Average Household Size in Cheval
Average Household Size in Cheval is 2.6 People.
How Large is the Labor Force in Cheval?
There are 6,724 People in the Labor Forcein in Cheval.
What is the Percentage of People in the Labor Force in Cheval?
65.0% of People are in the Labor Force in Cheval.
What is the Unemployment Rate in Cheval?
Unemployment Rate in Cheval is 4.8%.