Palm Valley, FL Map & Demographics
Palm Valley Map
Palm Valley Overview
$81,394
PER CAPITA INCOME
$142,500
AVG FAMILY INCOME
$118,245
AVG HOUSEHOLD INCOME
40.7%
WAGE / INCOME GAP [ % ]
59.3¢/ $1
WAGE / INCOME GAP [ $ ]
0.51
INEQUALITY / GINI INDEX
19,766
TOTAL POPULATION
9,626
MALE POPULATION
10,140
FEMALE POPULATION
94.93
MALES / 100 FEMALES
105.34
FEMALES / 100 MALES
50.8
MEDIAN AGE
2.9
AVG FAMILY SIZE
2.4
AVG HOUSEHOLD SIZE
9,538
LABOR FORCE [ PEOPLE ]
57.5%
PERCENT IN LABOR FORCE
2.7%
UNEMPLOYMENT RATE
Income in Palm Valley
Income Overview in Palm Valley
Per Capita Income in Palm Valley is $81,394, while median incomes of families and households are $142,500 and $118,245 respectively.
| Characteristic | Number | Measure |
| Per Capita Income | 19,766 | $81,394 |
| Median Family Income | 5,500 | $142,500 |
| Mean Family Income | 5,500 | $230,771 |
| Median Household Income | 8,387 | $118,245 |
| Mean Household Income | 8,387 | $185,208 |
| Income Deficit | 5,500 | $0 |
| Wage / Income Gap (%) | 19,766 | 40.70% |
| Wage / Income Gap ($) | 19,766 | 59.30¢ per $1 |
| Gini / Inequality Index | 19,766 | 0.51 |
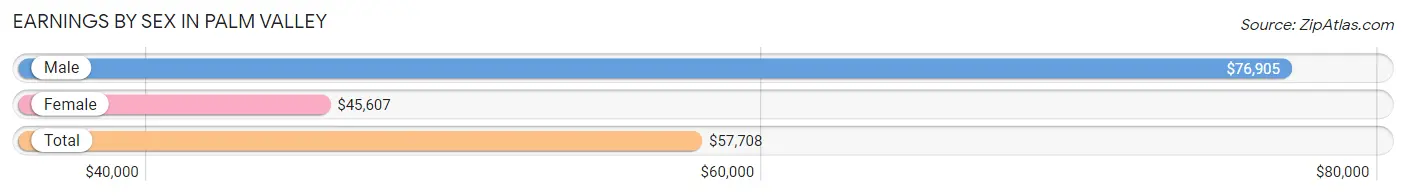
Earnings by Sex in Palm Valley
Average Earnings in Palm Valley are $57,708, $76,905 for men and $45,607 for women, a difference of 40.7%.
| Sex | Number | Average Earnings |
| Male | 5,300 (52.4%) | $76,905 |
| Female | 4,809 (47.6%) | $45,607 |
| Total | 10,109 (100.0%) | $57,708 |
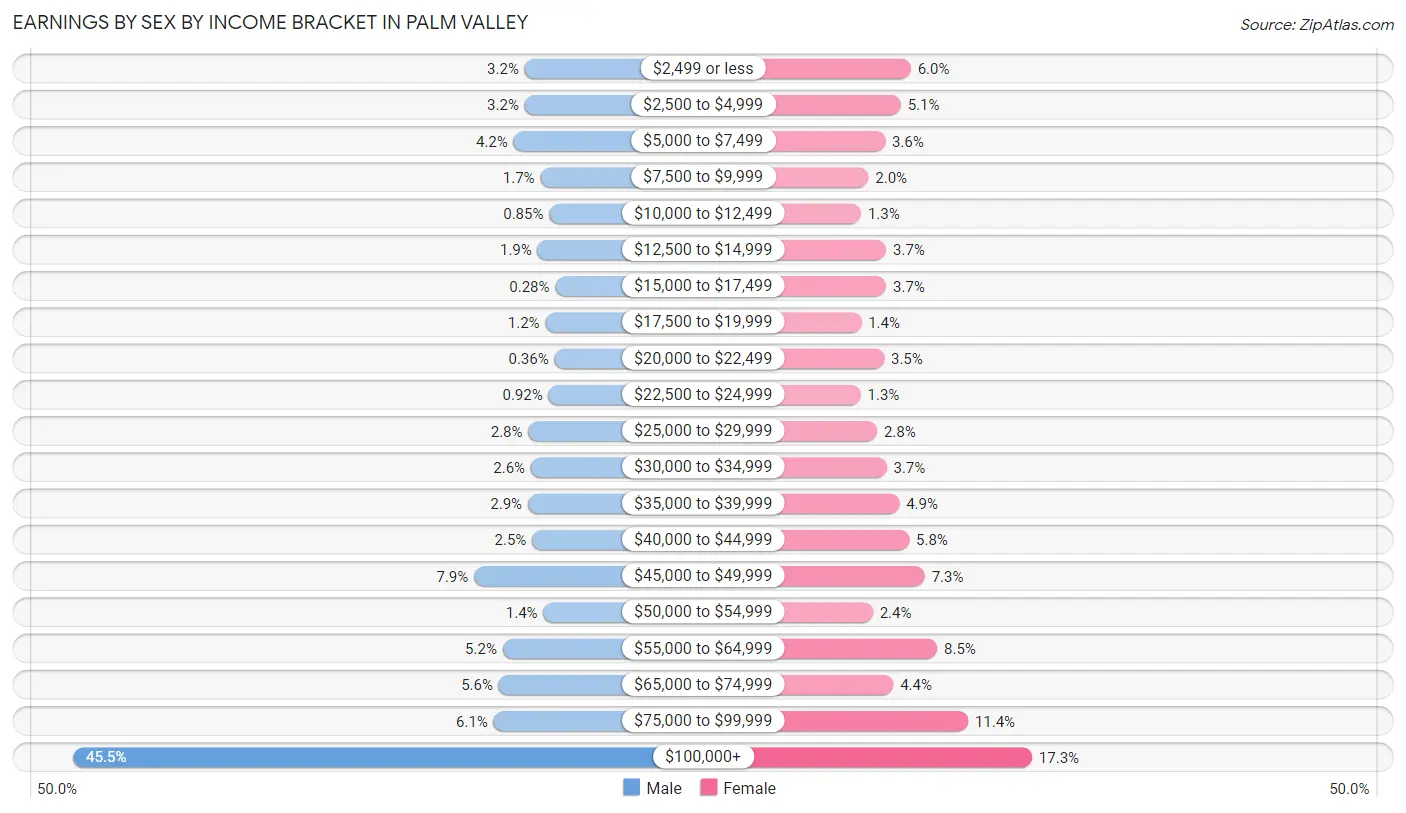
Earnings by Sex by Income Bracket in Palm Valley
The most common earnings brackets in Palm Valley are $100,000+ for men (2,409 | 45.5%) and $100,000+ for women (834 | 17.3%).
| Income | Male | Female |
| $2,499 or less | 167 (3.2%) | 288 (6.0%) |
| $2,500 to $4,999 | 167 (3.2%) | 243 (5.1%) |
| $5,000 to $7,499 | 222 (4.2%) | 172 (3.6%) |
| $7,500 to $9,999 | 89 (1.7%) | 97 (2.0%) |
| $10,000 to $12,499 | 45 (0.9%) | 64 (1.3%) |
| $12,500 to $14,999 | 103 (1.9%) | 177 (3.7%) |
| $15,000 to $17,499 | 15 (0.3%) | 177 (3.7%) |
| $17,500 to $19,999 | 64 (1.2%) | 65 (1.3%) |
| $20,000 to $22,499 | 19 (0.4%) | 168 (3.5%) |
| $22,500 to $24,999 | 49 (0.9%) | 62 (1.3%) |
| $25,000 to $29,999 | 149 (2.8%) | 136 (2.8%) |
| $30,000 to $34,999 | 136 (2.6%) | 179 (3.7%) |
| $35,000 to $39,999 | 151 (2.9%) | 236 (4.9%) |
| $40,000 to $44,999 | 130 (2.5%) | 281 (5.8%) |
| $45,000 to $49,999 | 418 (7.9%) | 351 (7.3%) |
| $50,000 to $54,999 | 74 (1.4%) | 117 (2.4%) |
| $55,000 to $64,999 | 276 (5.2%) | 407 (8.5%) |
| $65,000 to $74,999 | 296 (5.6%) | 209 (4.3%) |
| $75,000 to $99,999 | 321 (6.1%) | 546 (11.4%) |
| $100,000+ | 2,409 (45.5%) | 834 (17.3%) |
| Total | 5,300 (100.0%) | 4,809 (100.0%) |
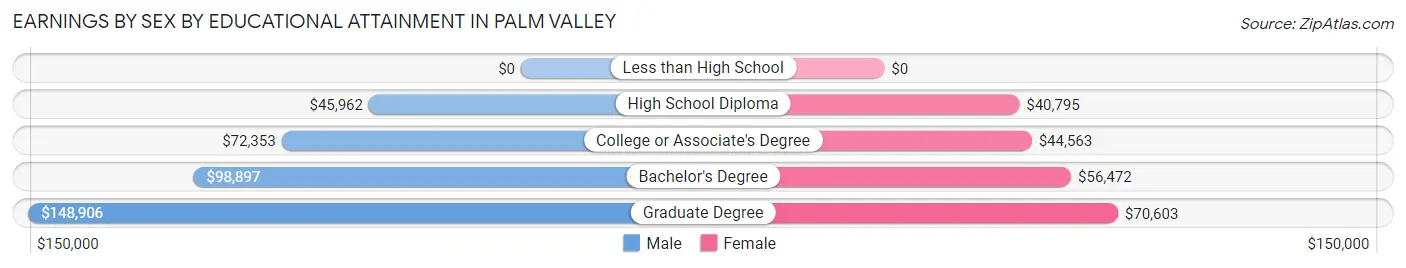
Earnings by Sex by Educational Attainment in Palm Valley
Average earnings in Palm Valley are $100,214 for men and $48,602 for women, a difference of 51.5%. Men with an educational attainment of graduate degree enjoy the highest average annual earnings of $148,906, while those with high school diploma education earn the least with $45,962. Women with an educational attainment of graduate degree earn the most with the average annual earnings of $70,603, while those with high school diploma education have the smallest earnings of $40,795.
| Educational Attainment | Male Income | Female Income |
| Less than High School | - | - |
| High School Diploma | $45,962 | $40,795 |
| College or Associate's Degree | $72,353 | $44,563 |
| Bachelor's Degree | $98,897 | $56,472 |
| Graduate Degree | $148,906 | $70,603 |
| Total | $100,214 | $48,602 |
Family Income in Palm Valley
Family Income Brackets in Palm Valley
According to the Palm Valley family income data, there are 2,084 families falling into the $200,000+ income range, which is the most common income bracket and makes up 37.9% of all families. Conversely, the $10,000 to $14,999 income bracket is the least frequent group with only 33 families (0.6%) belonging to this category.
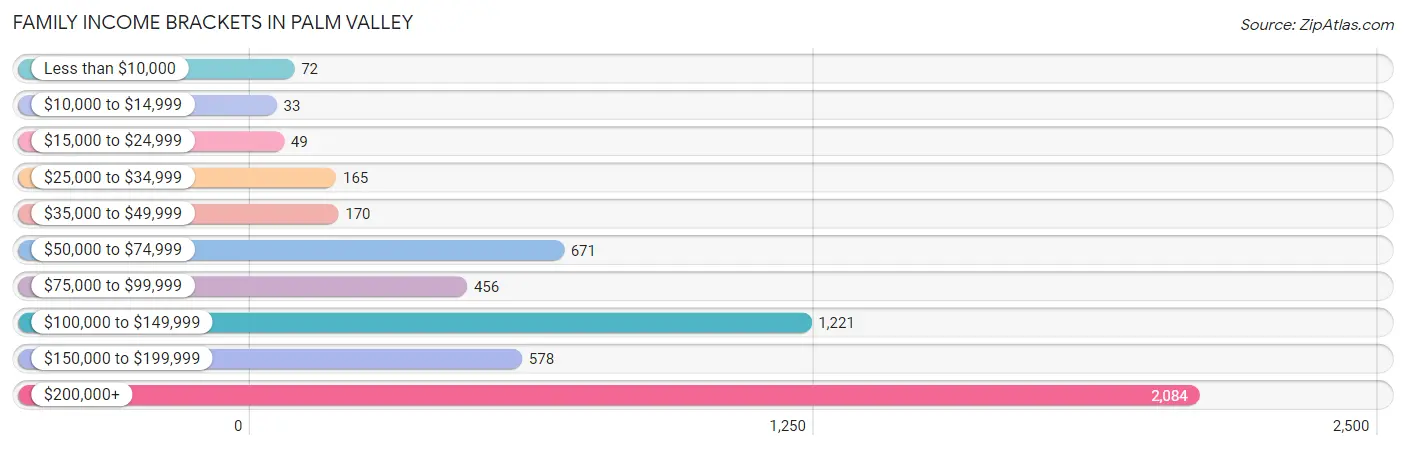
| Income Bracket | # Families | % Families |
| Less than $10,000 | 72 | 1.3% |
| $10,000 to $14,999 | 33 | 0.6% |
| $15,000 to $24,999 | 49 | 0.9% |
| $25,000 to $34,999 | 165 | 3.0% |
| $35,000 to $49,999 | 170 | 3.1% |
| $50,000 to $74,999 | 671 | 12.2% |
| $75,000 to $99,999 | 456 | 8.3% |
| $100,000 to $149,999 | 1,221 | 22.2% |
| $150,000 to $199,999 | 578 | 10.5% |
| $200,000+ | 2,084 | 37.9% |
Family Income by Famaliy Size in Palm Valley
5-person families (506 | 9.2%) account for the highest median family income in Palm Valley with $250,001 per family, while 2-person families (3,276 | 59.6%) have the highest median income of $60,813 per family member.
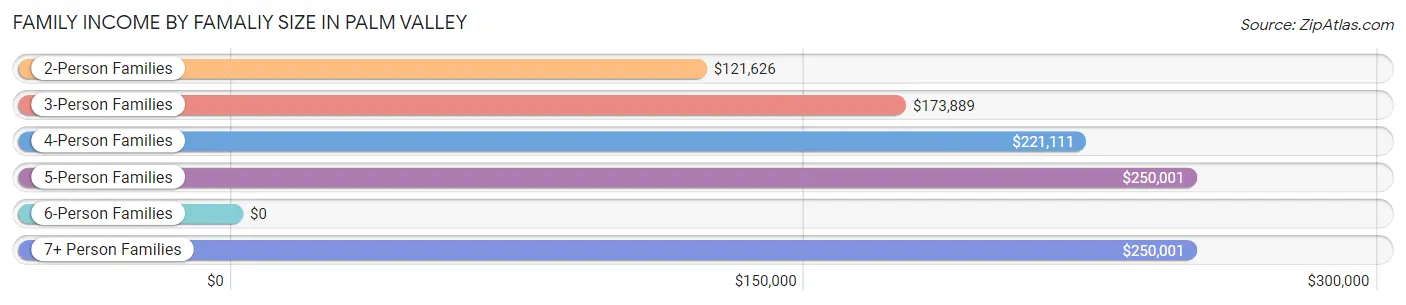
| Income Bracket | # Families | Median Income |
| 2-Person Families | 3,276 (59.6%) | $121,626 |
| 3-Person Families | 876 (15.9%) | $173,889 |
| 4-Person Families | 766 (13.9%) | $221,111 |
| 5-Person Families | 506 (9.2%) | $250,001 |
| 6-Person Families | 30 (0.5%) | $0 |
| 7+ Person Families | 46 (0.8%) | $250,001 |
| Total | 5,500 (100.0%) | $142,500 |
Family Income by Number of Earners in Palm Valley
The median family income in Palm Valley is $142,500, with families comprising 3+ earners (492) having the highest median family income of $250,001, while families with no earners (1,175) have the lowest median family income of $100,430, accounting for 8.9% and 21.4% of families, respectively.
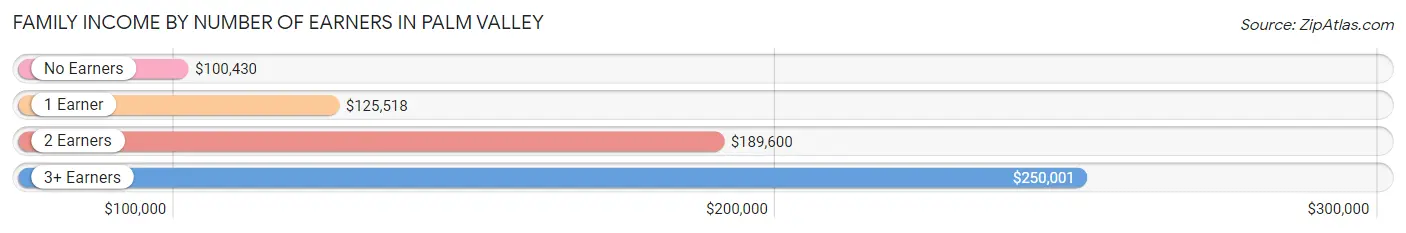
| Number of Earners | # Families | Median Income |
| No Earners | 1,175 (21.4%) | $100,430 |
| 1 Earner | 1,957 (35.6%) | $125,518 |
| 2 Earners | 1,876 (34.1%) | $189,600 |
| 3+ Earners | 492 (8.9%) | $250,001 |
| Total | 5,500 (100.0%) | $142,500 |
Household Income in Palm Valley
Household Income Brackets in Palm Valley
With 2,441 households falling in the category, the $200,000+ income range is the most frequent in Palm Valley, accounting for 29.1% of all households. In contrast, only 134 households (1.6%) fall into the $10,000 to $14,999 income bracket, making it the least populous group.
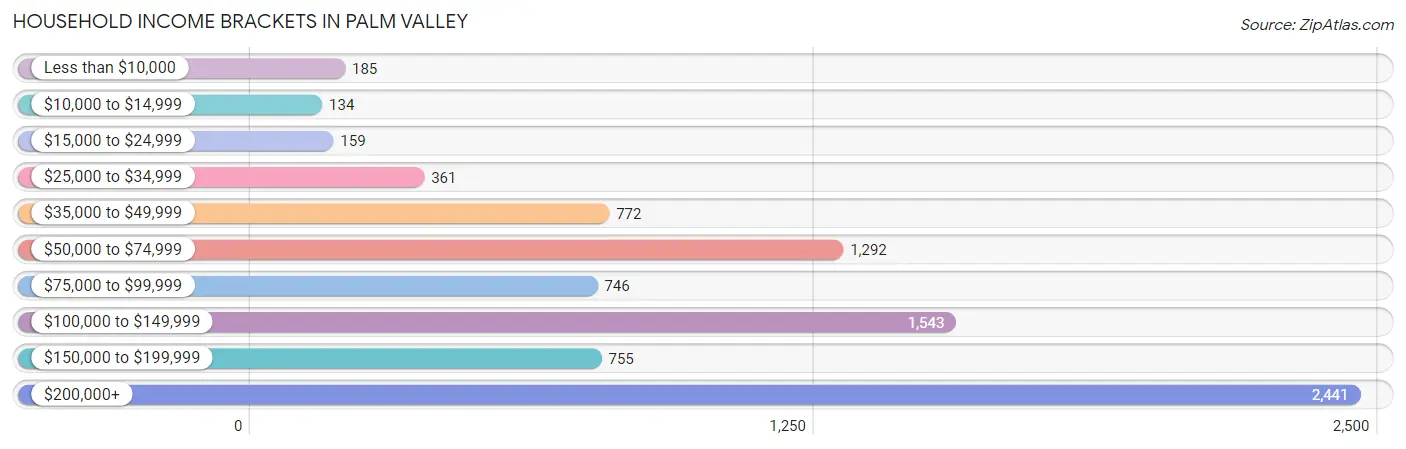
| Income Bracket | # Households | % Households |
| Less than $10,000 | 185 | 2.2% |
| $10,000 to $14,999 | 134 | 1.6% |
| $15,000 to $24,999 | 159 | 1.9% |
| $25,000 to $34,999 | 361 | 4.3% |
| $35,000 to $49,999 | 772 | 9.2% |
| $50,000 to $74,999 | 1,292 | 15.4% |
| $75,000 to $99,999 | 746 | 8.9% |
| $100,000 to $149,999 | 1,543 | 18.4% |
| $150,000 to $199,999 | 755 | 9.0% |
| $200,000+ | 2,441 | 29.1% |
Household Income by Householder Age in Palm Valley
The median household income in Palm Valley is $118,245, with the highest median household income of $174,961 found in the 45 to 64 years age bracket for the primary householder. A total of 3,281 households (39.1%) fall into this category. Meanwhile, the 15 to 24 years age bracket for the primary householder has the lowest median household income of $0, with 77 households (0.9%) in this group.
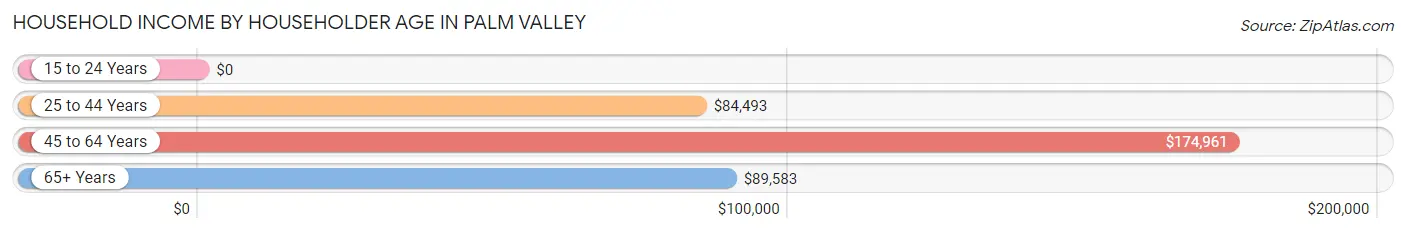
| Income Bracket | # Households | Median Income |
| 15 to 24 Years | 77 (0.9%) | $0 |
| 25 to 44 Years | 1,595 (19.0%) | $84,493 |
| 45 to 64 Years | 3,281 (39.1%) | $174,961 |
| 65+ Years | 3,434 (40.9%) | $89,583 |
| Total | 8,387 (100.0%) | $118,245 |
Poverty in Palm Valley
Income Below Poverty by Sex and Age in Palm Valley
With 3.8% poverty level for males and 3.2% for females among the residents of Palm Valley, 55 to 64 year old males and 15 year old females are the most vulnerable to poverty, with 180 males (11.8%) and 31 females (19.1%) in their respective age groups living below the poverty level.
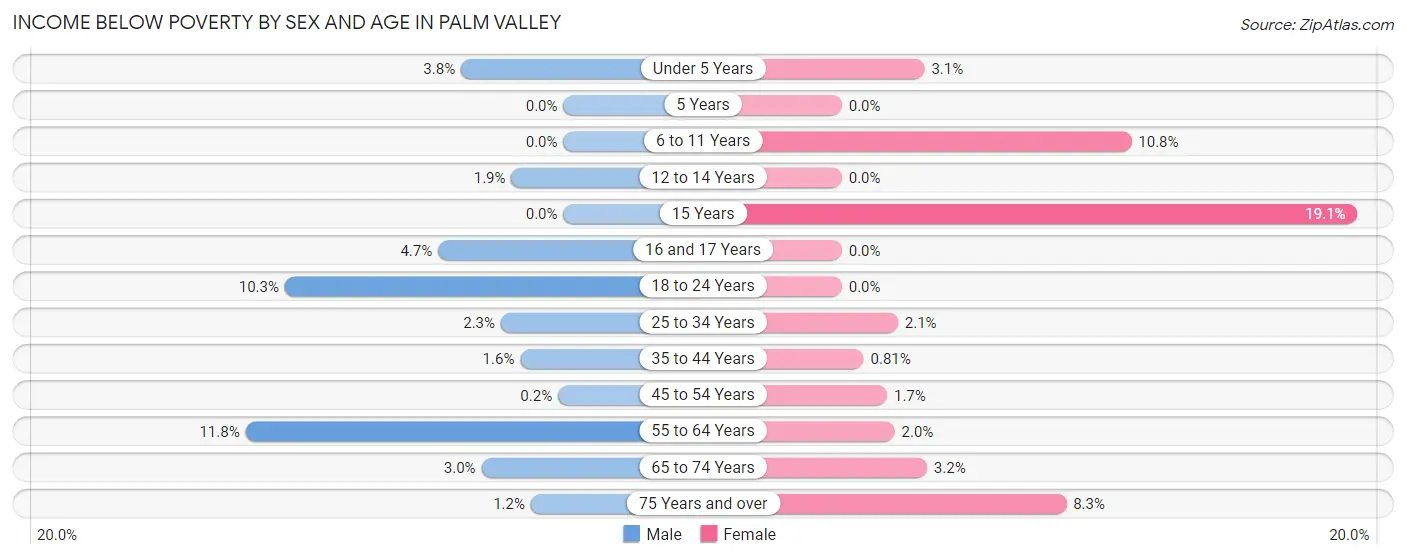
| Age Bracket | Male | Female |
| Under 5 Years | 14 (3.8%) | 7 (3.1%) |
| 5 Years | 0 (0.0%) | 0 (0.0%) |
| 6 to 11 Years | 0 (0.0%) | 49 (10.7%) |
| 12 to 14 Years | 8 (1.9%) | 0 (0.0%) |
| 15 Years | 0 (0.0%) | 31 (19.1%) |
| 16 and 17 Years | 12 (4.6%) | 0 (0.0%) |
| 18 to 24 Years | 54 (10.3%) | 0 (0.0%) |
| 25 to 34 Years | 21 (2.3%) | 24 (2.1%) |
| 35 to 44 Years | 10 (1.6%) | 8 (0.8%) |
| 45 to 54 Years | 3 (0.2%) | 21 (1.7%) |
| 55 to 64 Years | 180 (11.8%) | 33 (2.0%) |
| 65 to 74 Years | 44 (3.0%) | 59 (3.2%) |
| 75 Years and over | 12 (1.2%) | 89 (8.3%) |
| Total | 358 (3.8%) | 321 (3.2%) |
Income Above Poverty by Sex and Age in Palm Valley
According to the poverty statistics in Palm Valley, males aged 5 years and females aged 5 years are the age groups that are most secure financially, with 100.0% of males and 100.0% of females in these age groups living above the poverty line.
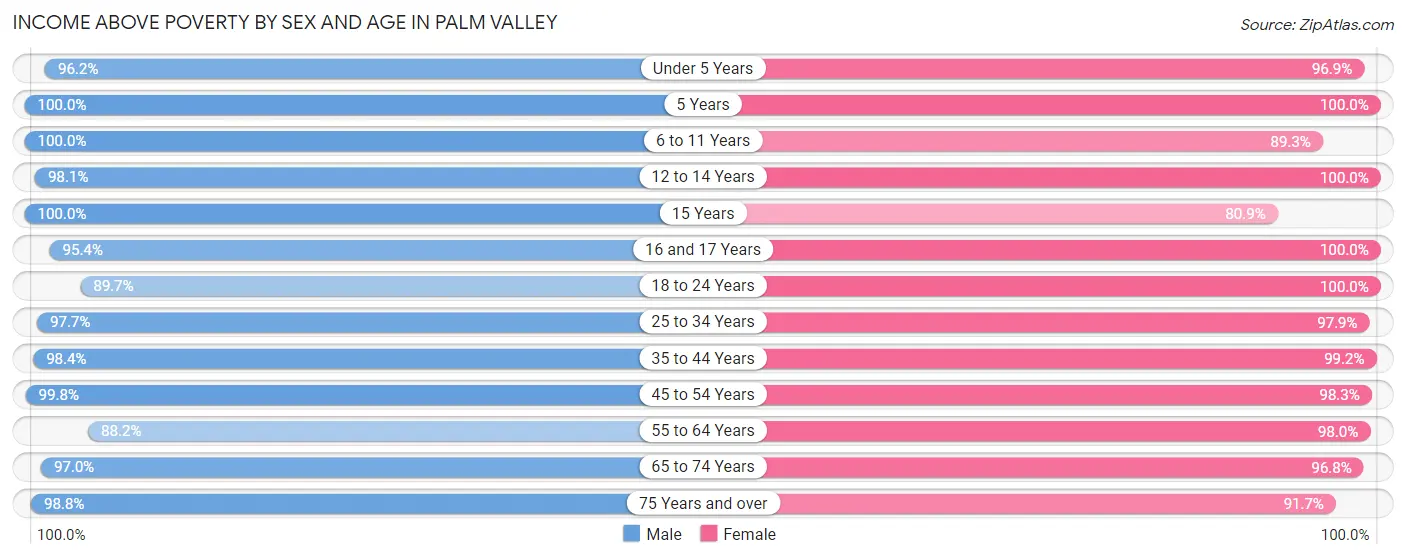
| Age Bracket | Male | Female |
| Under 5 Years | 354 (96.2%) | 221 (96.9%) |
| 5 Years | 54 (100.0%) | 21 (100.0%) |
| 6 to 11 Years | 760 (100.0%) | 407 (89.2%) |
| 12 to 14 Years | 407 (98.1%) | 479 (100.0%) |
| 15 Years | 187 (100.0%) | 131 (80.9%) |
| 16 and 17 Years | 246 (95.4%) | 323 (100.0%) |
| 18 to 24 Years | 468 (89.7%) | 421 (100.0%) |
| 25 to 34 Years | 883 (97.7%) | 1,132 (97.9%) |
| 35 to 44 Years | 616 (98.4%) | 985 (99.2%) |
| 45 to 54 Years | 1,470 (99.8%) | 1,226 (98.3%) |
| 55 to 64 Years | 1,346 (88.2%) | 1,651 (98.0%) |
| 65 to 74 Years | 1,402 (97.0%) | 1,806 (96.8%) |
| 75 Years and over | 980 (98.8%) | 980 (91.7%) |
| Total | 9,173 (96.2%) | 9,783 (96.8%) |
Income Below Poverty Among Married-Couple Families in Palm Valley
The poverty statistics for married-couple families in Palm Valley show that 1.3% or 60 of the total 4,691 families live below the poverty line. Families with no children have the highest poverty rate of 1.7%, comprising of 50 families. On the other hand, families with 3 or 4 children have the lowest poverty rate of 0.0%, which includes 0 families.
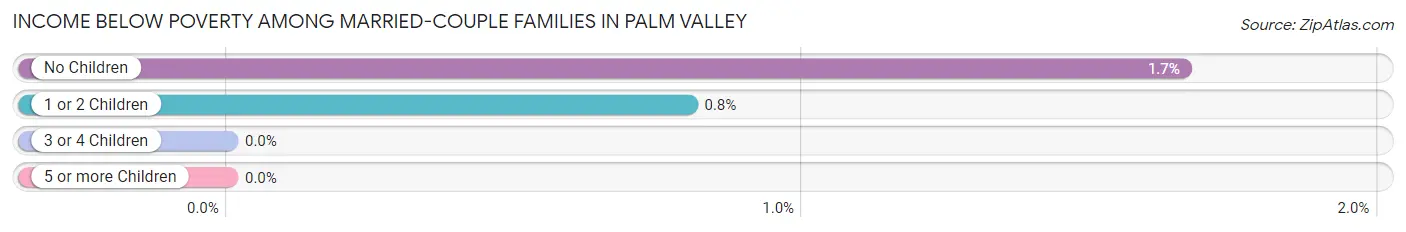
| Children | Above Poverty | Below Poverty |
| No Children | 2,964 (98.3%) | 50 (1.7%) |
| 1 or 2 Children | 1,233 (99.2%) | 10 (0.8%) |
| 3 or 4 Children | 401 (100.0%) | 0 (0.0%) |
| 5 or more Children | 33 (100.0%) | 0 (0.0%) |
| Total | 4,631 (98.7%) | 60 (1.3%) |
Income Below Poverty Among Single-Parent Households in Palm Valley
According to the poverty data in Palm Valley, 2.1% or 6 single-father households and 10.0% or 53 single-mother households are living below the poverty line. Among single-father households, those with no children have the highest poverty rate, with 6 households (3.2%) experiencing poverty. Likewise, among single-mother households, those with 3 or 4 children have the highest poverty rate, with 16 households (88.9%) falling below the poverty line.
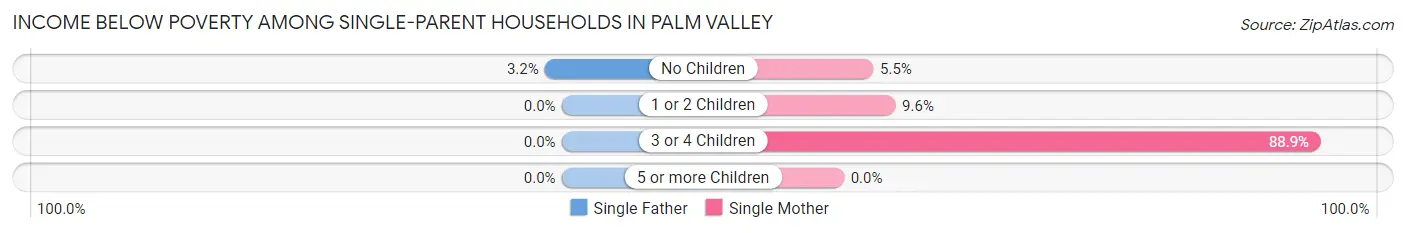
| Children | Single Father | Single Mother |
| No Children | 6 (3.2%) | 16 (5.5%) |
| 1 or 2 Children | 0 (0.0%) | 21 (9.6%) |
| 3 or 4 Children | 0 (0.0%) | 16 (88.9%) |
| 5 or more Children | 0 (0.0%) | 0 (0.0%) |
| Total | 6 (2.1%) | 53 (10.0%) |
Income Below Poverty Among Married-Couple vs Single-Parent Households in Palm Valley
The poverty data for Palm Valley shows that 60 of the married-couple family households (1.3%) and 59 of the single-parent households (7.3%) are living below the poverty level. Within the married-couple family households, those with no children have the highest poverty rate, with 50 households (1.7%) falling below the poverty line. Among the single-parent households, those with 3 or 4 children have the highest poverty rate, with 16 household (69.6%) living below poverty.
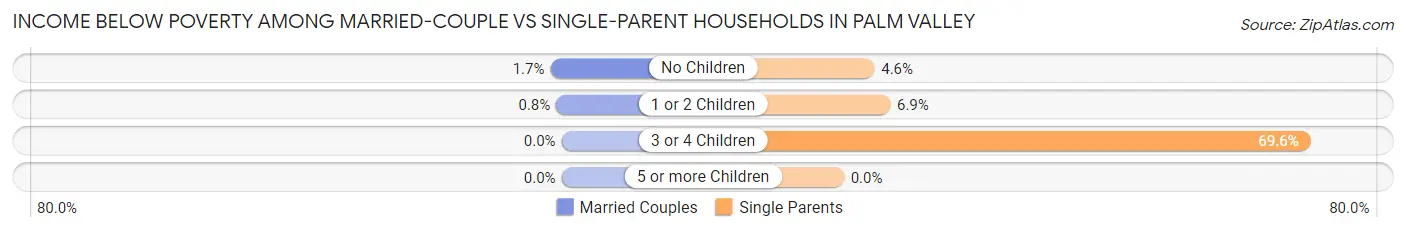
| Children | Married-Couple Families | Single-Parent Households |
| No Children | 50 (1.7%) | 22 (4.6%) |
| 1 or 2 Children | 10 (0.8%) | 21 (6.9%) |
| 3 or 4 Children | 0 (0.0%) | 16 (69.6%) |
| 5 or more Children | 0 (0.0%) | 0 (0.0%) |
| Total | 60 (1.3%) | 59 (7.3%) |
Race in Palm Valley
The most populous races in Palm Valley are White / Caucasian (17,675 | 89.4%), Hispanic or Latino (1,096 | 5.5%), and Two or more Races (1,041 | 5.3%).
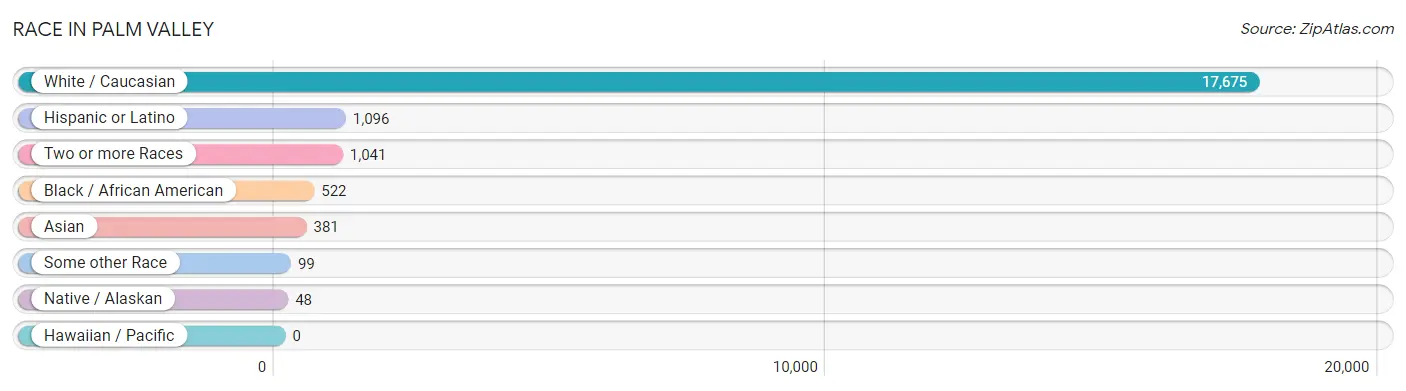
| Race | # Population | % Population |
| Asian | 381 | 1.9% |
| Black / African American | 522 | 2.6% |
| Hawaiian / Pacific | 0 | 0.0% |
| Hispanic or Latino | 1,096 | 5.5% |
| Native / Alaskan | 48 | 0.2% |
| White / Caucasian | 17,675 | 89.4% |
| Two or more Races | 1,041 | 5.3% |
| Some other Race | 99 | 0.5% |
| Total | 19,766 | 100.0% |
Ancestry in Palm Valley
The most populous ancestries reported in Palm Valley are English (3,456 | 17.5%), German (2,999 | 15.2%), American (2,711 | 13.7%), Irish (2,332 | 11.8%), and Italian (1,442 | 7.3%), together accounting for 65.5% of all Palm Valley residents.
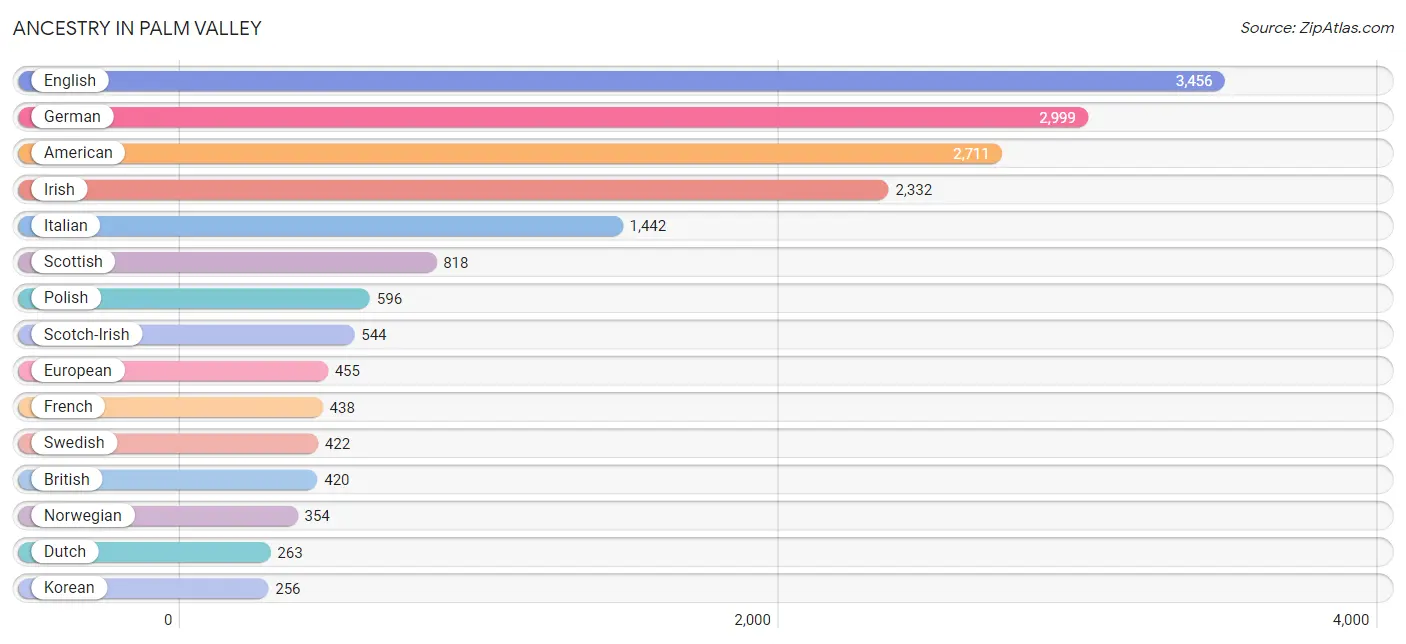
| Ancestry | # Population | % Population |
| African | 39 | 0.2% |
| Albanian | 35 | 0.2% |
| American | 2,711 | 13.7% |
| Arab | 190 | 1.0% |
| Armenian | 42 | 0.2% |
| Australian | 11 | 0.1% |
| Austrian | 132 | 0.7% |
| Belgian | 45 | 0.2% |
| Bhutanese | 14 | 0.1% |
| British | 420 | 2.1% |
| Canadian | 114 | 0.6% |
| Central American | 72 | 0.4% |
| Central American Indian | 40 | 0.2% |
| Cherokee | 91 | 0.5% |
| Colombian | 101 | 0.5% |
| Croatian | 93 | 0.5% |
| Cuban | 228 | 1.1% |
| Czech | 124 | 0.6% |
| Danish | 66 | 0.3% |
| Dominican | 66 | 0.3% |
| Dutch | 263 | 1.3% |
| Eastern European | 141 | 0.7% |
| Ecuadorian | 4 | 0.0% |
| Egyptian | 15 | 0.1% |
| English | 3,456 | 17.5% |
| European | 455 | 2.3% |
| Finnish | 23 | 0.1% |
| French | 438 | 2.2% |
| French Canadian | 87 | 0.4% |
| German | 2,999 | 15.2% |
| Greek | 88 | 0.4% |
| Guatemalan | 14 | 0.1% |
| Hungarian | 164 | 0.8% |
| Icelander | 12 | 0.1% |
| Indian (Asian) | 48 | 0.2% |
| Iranian | 6 | 0.0% |
| Iraqi | 34 | 0.2% |
| Irish | 2,332 | 11.8% |
| Israeli | 14 | 0.1% |
| Italian | 1,442 | 7.3% |
| Jamaican | 40 | 0.2% |
| Korean | 256 | 1.3% |
| Lebanese | 138 | 0.7% |
| Lithuanian | 33 | 0.2% |
| Mexican | 114 | 0.6% |
| Native Hawaiian | 22 | 0.1% |
| Navajo | 48 | 0.2% |
| Nicaraguan | 20 | 0.1% |
| Nigerian | 12 | 0.1% |
| Northern European | 102 | 0.5% |
| Norwegian | 354 | 1.8% |
| Pakistani | 14 | 0.1% |
| Panamanian | 25 | 0.1% |
| Pennsylvania German | 21 | 0.1% |
| Peruvian | 18 | 0.1% |
| Polish | 596 | 3.0% |
| Portuguese | 109 | 0.5% |
| Puerto Rican | 165 | 0.8% |
| Romanian | 54 | 0.3% |
| Russian | 126 | 0.6% |
| Salvadoran | 13 | 0.1% |
| Scandinavian | 156 | 0.8% |
| Scotch-Irish | 544 | 2.8% |
| Scottish | 818 | 4.1% |
| Slavic | 5 | 0.0% |
| Slovak | 52 | 0.3% |
| Slovene | 25 | 0.1% |
| South African | 45 | 0.2% |
| South American | 232 | 1.2% |
| Spaniard | 19 | 0.1% |
| Spanish | 34 | 0.2% |
| Sri Lankan | 9 | 0.1% |
| Subsaharan African | 105 | 0.5% |
| Swedish | 422 | 2.1% |
| Swiss | 15 | 0.1% |
| Syrian | 18 | 0.1% |
| Thai | 164 | 0.8% |
| Turkish | 148 | 0.7% |
| Ukrainian | 32 | 0.2% |
| Uruguayan | 12 | 0.1% |
| Venezuelan | 97 | 0.5% |
| Welsh | 163 | 0.8% |
| West Indian | 40 | 0.2% |
| Yugoslavian | 59 | 0.3% | View All 84 Rows |
Immigrants in Palm Valley
The most numerous immigrant groups reported in Palm Valley came from Europe (653 | 3.3%), Asia (375 | 1.9%), Latin America (306 | 1.5%), Northern Europe (284 | 1.4%), and Eastern Europe (226 | 1.1%), together accounting for 9.3% of all Palm Valley residents.
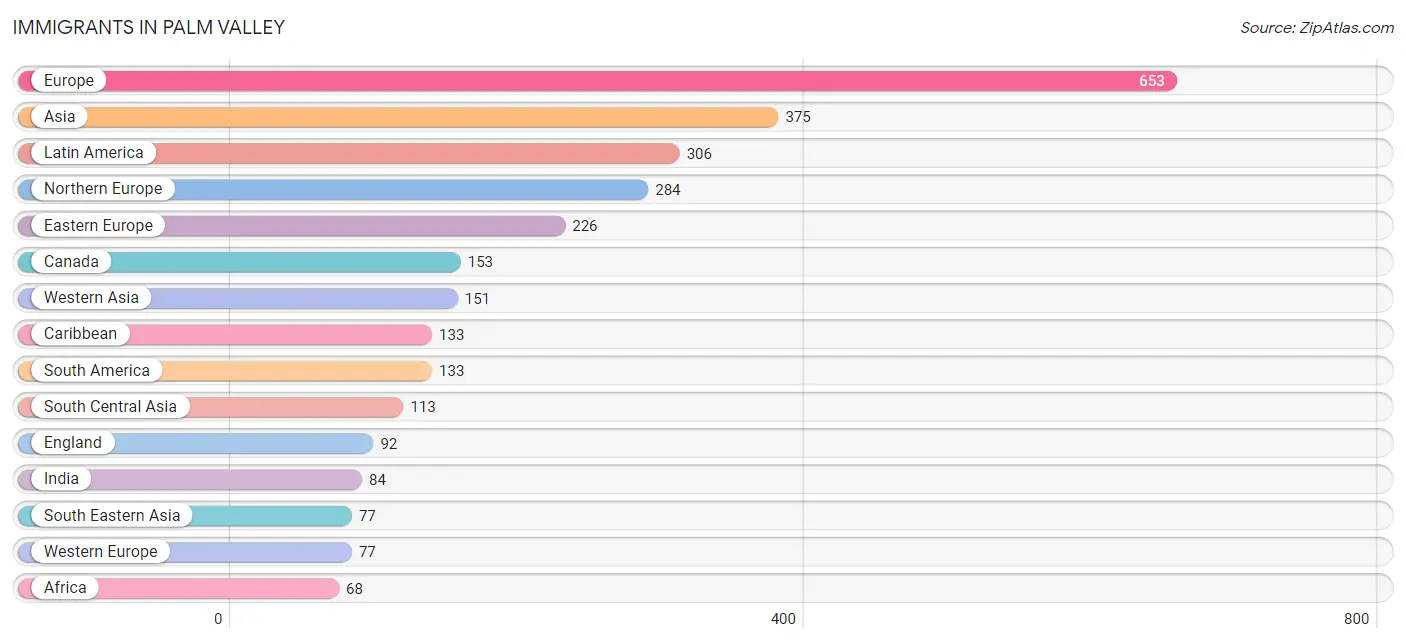
| Immigration Origin | # Population | % Population |
| Africa | 68 | 0.3% |
| Armenia | 25 | 0.1% |
| Asia | 375 | 1.9% |
| Australia | 64 | 0.3% |
| Austria | 12 | 0.1% |
| Bosnia and Herzegovina | 28 | 0.1% |
| Brazil | 37 | 0.2% |
| Canada | 153 | 0.8% |
| Caribbean | 133 | 0.7% |
| Central America | 40 | 0.2% |
| China | 18 | 0.1% |
| Colombia | 24 | 0.1% |
| Croatia | 28 | 0.1% |
| Cuba | 23 | 0.1% |
| Czechoslovakia | 15 | 0.1% |
| Dominican Republic | 66 | 0.3% |
| Eastern Asia | 34 | 0.2% |
| Eastern Europe | 226 | 1.1% |
| El Salvador | 13 | 0.1% |
| England | 92 | 0.5% |
| Europe | 653 | 3.3% |
| France | 6 | 0.0% |
| Germany | 28 | 0.1% |
| Ghana | 18 | 0.1% |
| Greece | 8 | 0.0% |
| Guatemala | 14 | 0.1% |
| Hungary | 14 | 0.1% |
| India | 84 | 0.4% |
| Iraq | 34 | 0.2% |
| Ireland | 53 | 0.3% |
| Israel | 23 | 0.1% |
| Italy | 56 | 0.3% |
| Jamaica | 44 | 0.2% |
| Japan | 10 | 0.1% |
| Korea | 6 | 0.0% |
| Kuwait | 15 | 0.1% |
| Laos | 4 | 0.0% |
| Latin America | 306 | 1.5% |
| Lebanon | 18 | 0.1% |
| Mexico | 11 | 0.1% |
| Nepal | 29 | 0.2% |
| Netherlands | 31 | 0.2% |
| Nigeria | 12 | 0.1% |
| Northern Europe | 284 | 1.4% |
| Norway | 7 | 0.0% |
| Oceania | 64 | 0.3% |
| Panama | 2 | 0.0% |
| Philippines | 58 | 0.3% |
| Poland | 9 | 0.1% |
| Romania | 35 | 0.2% |
| Scotland | 30 | 0.2% |
| South Africa | 38 | 0.2% |
| South America | 133 | 0.7% |
| South Central Asia | 113 | 0.6% |
| South Eastern Asia | 77 | 0.4% |
| Southern Europe | 66 | 0.3% |
| Spain | 2 | 0.0% |
| Sweden | 7 | 0.0% |
| Taiwan | 5 | 0.0% |
| Thailand | 6 | 0.0% |
| Turkey | 27 | 0.1% |
| Ukraine | 24 | 0.1% |
| Uruguay | 12 | 0.1% |
| Venezuela | 60 | 0.3% |
| Vietnam | 9 | 0.1% |
| Western Africa | 30 | 0.2% |
| Western Asia | 151 | 0.8% |
| Western Europe | 77 | 0.4% | View All 68 Rows |
Sex and Age in Palm Valley
Sex and Age in Palm Valley
The most populous age groups in Palm Valley are 55 to 59 Years (892 | 9.3%) for men and 65 to 69 Years (1,026 | 10.1%) for women.
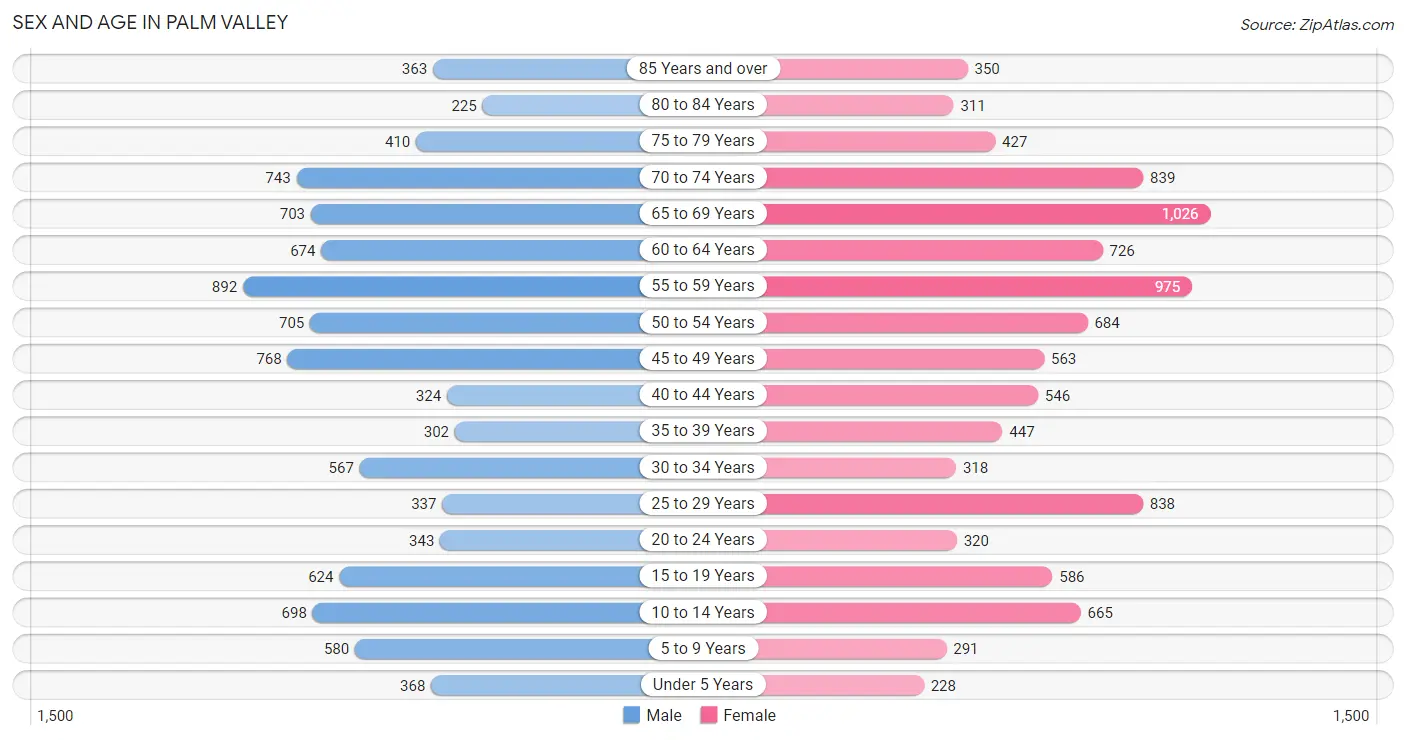
| Age Bracket | Male | Female |
| Under 5 Years | 368 (3.8%) | 228 (2.2%) |
| 5 to 9 Years | 580 (6.0%) | 291 (2.9%) |
| 10 to 14 Years | 698 (7.2%) | 665 (6.6%) |
| 15 to 19 Years | 624 (6.5%) | 586 (5.8%) |
| 20 to 24 Years | 343 (3.6%) | 320 (3.2%) |
| 25 to 29 Years | 337 (3.5%) | 838 (8.3%) |
| 30 to 34 Years | 567 (5.9%) | 318 (3.1%) |
| 35 to 39 Years | 302 (3.1%) | 447 (4.4%) |
| 40 to 44 Years | 324 (3.4%) | 546 (5.4%) |
| 45 to 49 Years | 768 (8.0%) | 563 (5.6%) |
| 50 to 54 Years | 705 (7.3%) | 684 (6.8%) |
| 55 to 59 Years | 892 (9.3%) | 975 (9.6%) |
| 60 to 64 Years | 674 (7.0%) | 726 (7.2%) |
| 65 to 69 Years | 703 (7.3%) | 1,026 (10.1%) |
| 70 to 74 Years | 743 (7.7%) | 839 (8.3%) |
| 75 to 79 Years | 410 (4.3%) | 427 (4.2%) |
| 80 to 84 Years | 225 (2.3%) | 311 (3.1%) |
| 85 Years and over | 363 (3.8%) | 350 (3.5%) |
| Total | 9,626 (100.0%) | 10,140 (100.0%) |
Families and Households in Palm Valley
Median Family Size in Palm Valley
The median family size in Palm Valley is 2.92 persons per family, with married-couple families (4,691 | 85.3%) accounting for the largest median family size of 2.94 persons per family. On the other hand, single male/father families (280 | 5.1%) represent the smallest median family size with 2.59 persons per family.
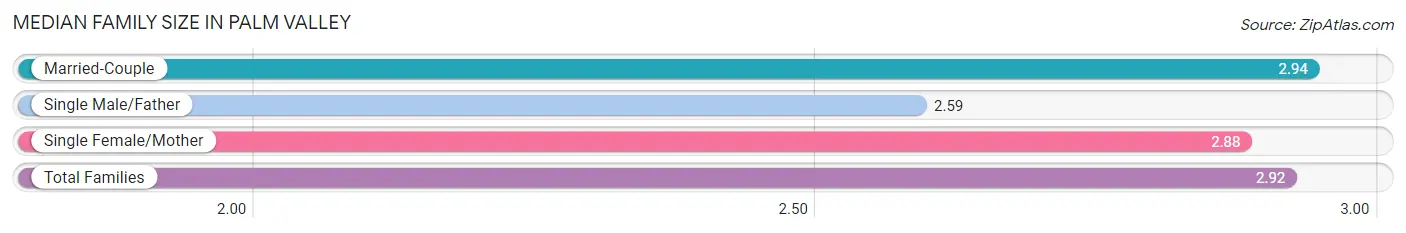
| Family Type | # Families | Family Size |
| Married-Couple | 4,691 (85.3%) | 2.94 |
| Single Male/Father | 280 (5.1%) | 2.59 |
| Single Female/Mother | 529 (9.6%) | 2.88 |
| Total Families | 5,500 (100.0%) | 2.92 |
Median Household Size in Palm Valley
The median household size in Palm Valley is 2.35 persons per household, with single female/mother households (529 | 6.3%) accounting for the largest median household size of 3.08 persons per household. non-family households (2,887 | 34.4%) represent the smallest median household size with 1.19 persons per household.
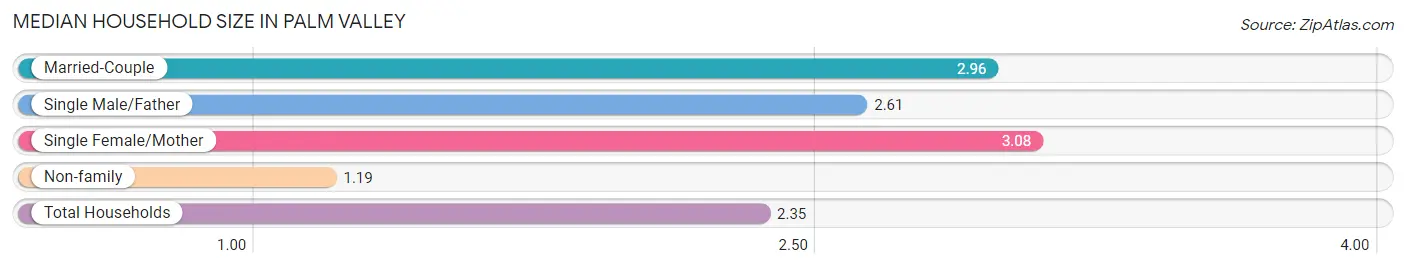
| Household Type | # Households | Household Size |
| Married-Couple | 4,691 (55.9%) | 2.96 |
| Single Male/Father | 280 (3.3%) | 2.61 |
| Single Female/Mother | 529 (6.3%) | 3.08 |
| Non-family | 2,887 (34.4%) | 1.19 |
| Total Households | 8,387 (100.0%) | 2.35 |
Household Size by Marriage Status in Palm Valley
Out of a total of 8,387 households in Palm Valley, 5,500 (65.6%) are family households, while 2,887 (34.4%) are nonfamily households. The most numerous type of family households are 2-person households, comprising 3,235, and the most common type of nonfamily households are 1-person households, comprising 2,540.
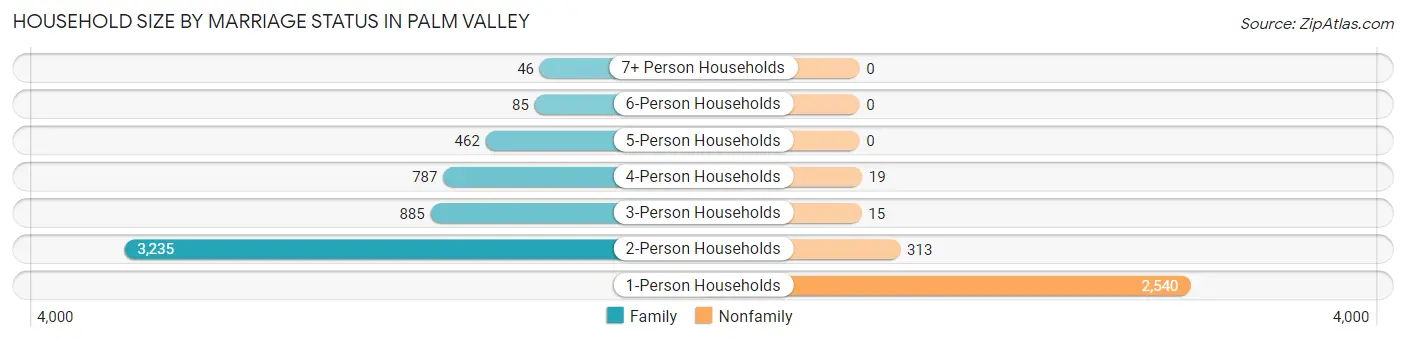
| Household Size | Family Households | Nonfamily Households |
| 1-Person Households | - | 2,540 (30.3%) |
| 2-Person Households | 3,235 (38.6%) | 313 (3.7%) |
| 3-Person Households | 885 (10.5%) | 15 (0.2%) |
| 4-Person Households | 787 (9.4%) | 19 (0.2%) |
| 5-Person Households | 462 (5.5%) | 0 (0.0%) |
| 6-Person Households | 85 (1.0%) | 0 (0.0%) |
| 7+ Person Households | 46 (0.5%) | 0 (0.0%) |
| Total | 5,500 (65.6%) | 2,887 (34.4%) |
Female Fertility in Palm Valley
Fertility by Age in Palm Valley
Average fertility rate in Palm Valley is 39.0 births per 1,000 women. Women in the age bracket of 20 to 34 years have the highest fertility rate with 79.0 births per 1,000 women. Women in the age bracket of 20 to 34 years acount for 77.8% of all women with births.
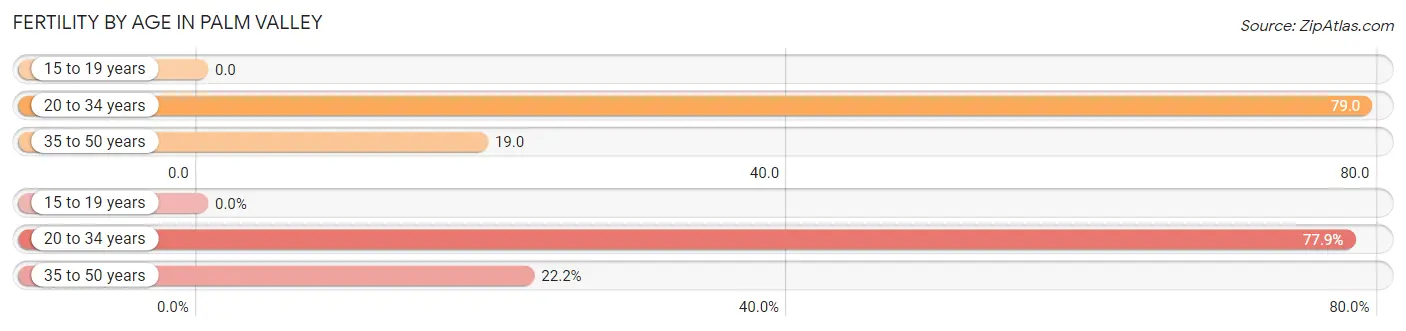
| Age Bracket | Women with Births | Births / 1,000 Women |
| 15 to 19 years | 0 (0.0%) | 0.0 |
| 20 to 34 years | 116 (77.8%) | 79.0 |
| 35 to 50 years | 33 (22.2%) | 19.0 |
| Total | 149 (100.0%) | 39.0 |
Fertility by Age by Marriage Status in Palm Valley
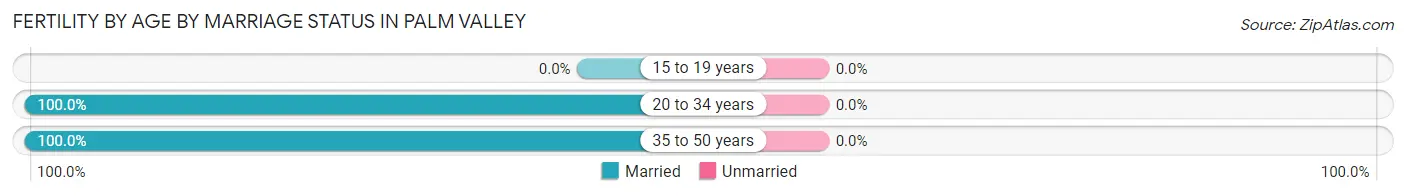
| Age Bracket | Married | Unmarried |
| 15 to 19 years | 0 (0.0%) | 0 (0.0%) |
| 20 to 34 years | 116 (100.0%) | 0 (0.0%) |
| 35 to 50 years | 33 (100.0%) | 0 (0.0%) |
| Total | 149 (100.0%) | 0 (0.0%) |
Fertility by Education in Palm Valley
Average fertility rate in Palm Valley is 39.0 births per 1,000 women. Women with the education attainment of high school diploma have the highest fertility rate of 218.0 births per 1,000 women, while women with the education attainment of graduate degree have the lowest fertility at 6.0 births per 1,000 women. Women with the education attainment of high school diploma represent 53.7% of all women with births.
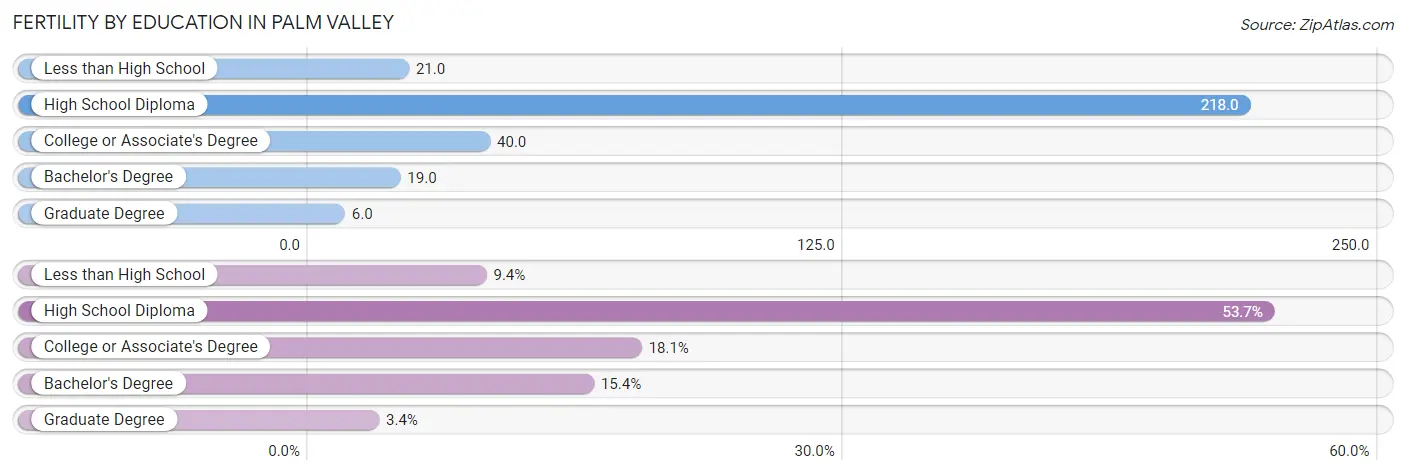
| Educational Attainment | Women with Births | Births / 1,000 Women |
| Less than High School | 14 (9.4%) | 21.0 |
| High School Diploma | 80 (53.7%) | 218.0 |
| College or Associate's Degree | 27 (18.1%) | 40.0 |
| Bachelor's Degree | 23 (15.4%) | 19.0 |
| Graduate Degree | 5 (3.4%) | 6.0 |
| Total | 149 (100.0%) | 39.0 |
Fertility by Education by Marriage Status in Palm Valley
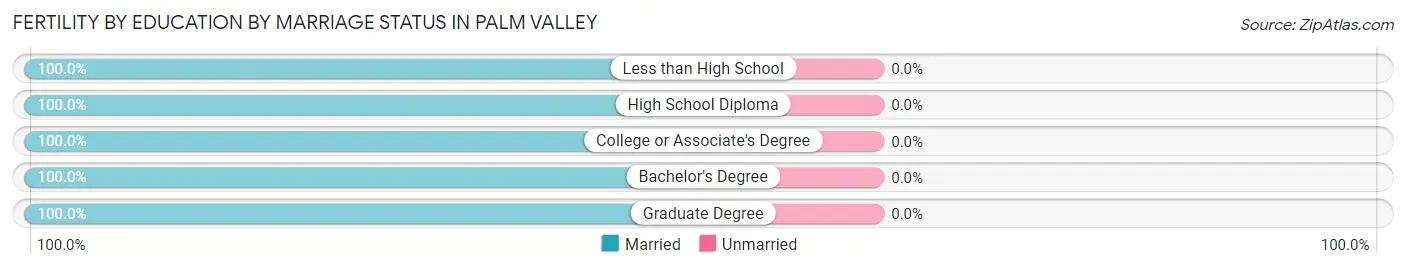
| Educational Attainment | Married | Unmarried |
| Less than High School | 14 (100.0%) | 0 (0.0%) |
| High School Diploma | 80 (100.0%) | 0 (0.0%) |
| College or Associate's Degree | 27 (100.0%) | 0 (0.0%) |
| Bachelor's Degree | 23 (100.0%) | 0 (0.0%) |
| Graduate Degree | 5 (100.0%) | 0 (0.0%) |
| Total | 149 (100.0%) | 0 (0.0%) |
Employment Characteristics in Palm Valley
Employment by Class of Employer in Palm Valley
Among the 9,130 employed individuals in Palm Valley, private company employees (5,876 | 64.4%), not-for-profit organizations (999 | 10.9%), and self-employed (incorporated) (926 | 10.1%) make up the most common classes of employment.
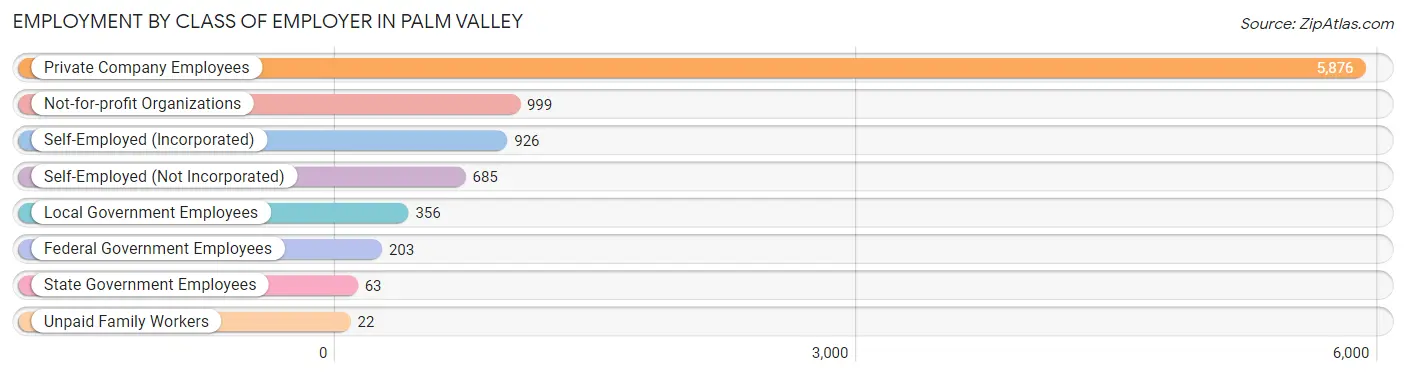
| Employer Class | # Employees | % Employees |
| Private Company Employees | 5,876 | 64.4% |
| Self-Employed (Incorporated) | 926 | 10.1% |
| Self-Employed (Not Incorporated) | 685 | 7.5% |
| Not-for-profit Organizations | 999 | 10.9% |
| Local Government Employees | 356 | 3.9% |
| State Government Employees | 63 | 0.7% |
| Federal Government Employees | 203 | 2.2% |
| Unpaid Family Workers | 22 | 0.2% |
| Total | 9,130 | 100.0% |
Employment Status by Age in Palm Valley
According to the labor force statistics for Palm Valley, out of the total population over 16 years of age (16,587), 57.5% or 9,538 individuals are in the labor force, with 2.7% or 258 of them unemployed. The age group with the highest labor force participation rate is 30 to 34 years, with 88.5% or 783 individuals in the labor force. Within the labor force, the 30 to 34 years age range has the highest percentage of unemployed individuals, with 8.3% or 65 of them being unemployed.
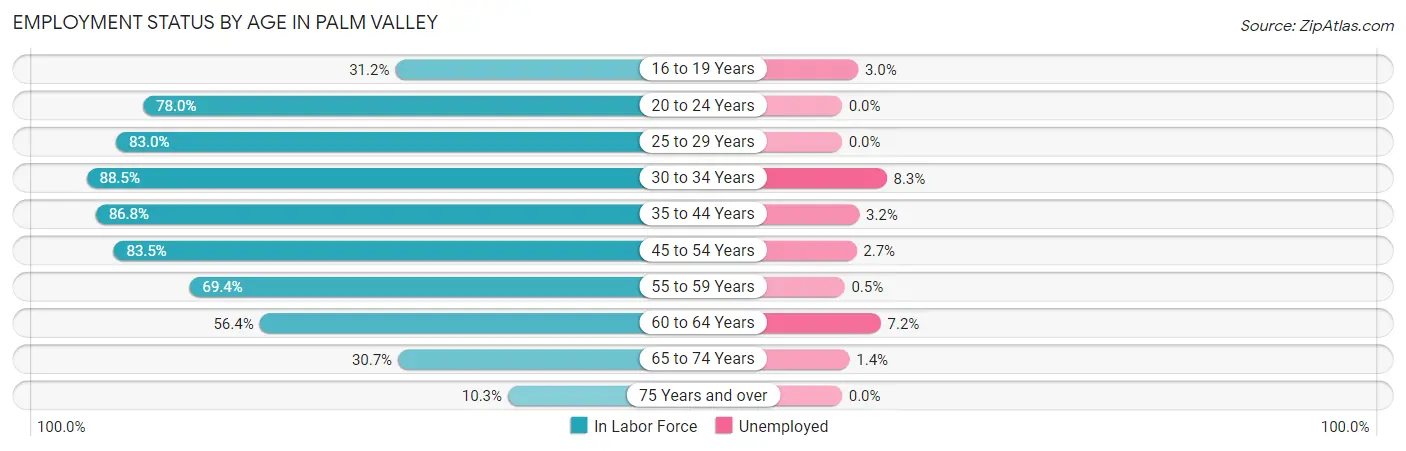
| Age Bracket | In Labor Force | Unemployed |
| 16 to 19 Years | 269 (31.2%) | 8 (3.0%) |
| 20 to 24 Years | 517 (78.0%) | 0 (0.0%) |
| 25 to 29 Years | 975 (83.0%) | 0 (0.0%) |
| 30 to 34 Years | 783 (88.5%) | 65 (8.3%) |
| 35 to 44 Years | 1,405 (86.8%) | 45 (3.2%) |
| 45 to 54 Years | 2,271 (83.5%) | 61 (2.7%) |
| 55 to 59 Years | 1,296 (69.4%) | 6 (0.5%) |
| 60 to 64 Years | 790 (56.4%) | 57 (7.2%) |
| 65 to 74 Years | 1,016 (30.7%) | 14 (1.4%) |
| 75 Years and over | 215 (10.3%) | 0 (0.0%) |
| Total | 9,538 (57.5%) | 258 (2.7%) |
Employment Status by Educational Attainment in Palm Valley
According to labor force statistics for Palm Valley, 77.8% of individuals (7,520) out of the total population between 25 and 64 years of age (9,666) are in the labor force, with 3.1% or 233 of them being unemployed. The group with the highest labor force participation rate are those with the educational attainment of bachelor's degree or higher, with 80.8% or 5,281 individuals in the labor force. Within the labor force, individuals with high school diploma education have the highest percentage of unemployment, with 8.3% or 51 of them being unemployed.
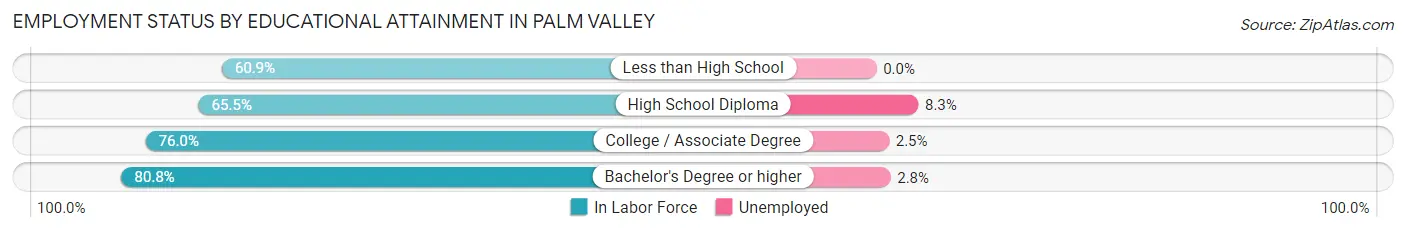
| Educational Attainment | In Labor Force | Unemployed |
| Less than High School | 170 (60.9%) | 0 (0.0%) |
| High School Diploma | 615 (65.5%) | 78 (8.3%) |
| College / Associate Degree | 1,453 (76.0%) | 48 (2.5%) |
| Bachelor's Degree or higher | 5,281 (80.8%) | 183 (2.8%) |
| Total | 7,520 (77.8%) | 300 (3.1%) |
Employment Occupations by Sex in Palm Valley
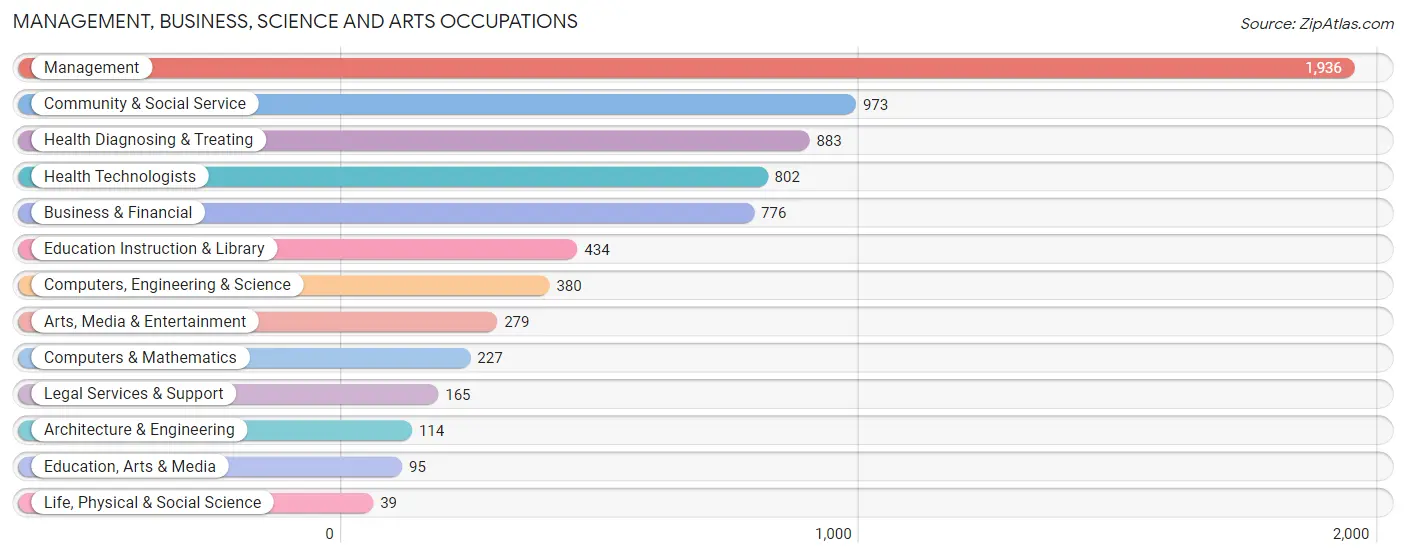
Management, Business, Science and Arts Occupations
The most common Management, Business, Science and Arts occupations in Palm Valley are Management (1,936 | 20.9%), Community & Social Service (973 | 10.5%), Health Diagnosing & Treating (883 | 9.5%), Health Technologists (802 | 8.6%), and Business & Financial (776 | 8.4%).
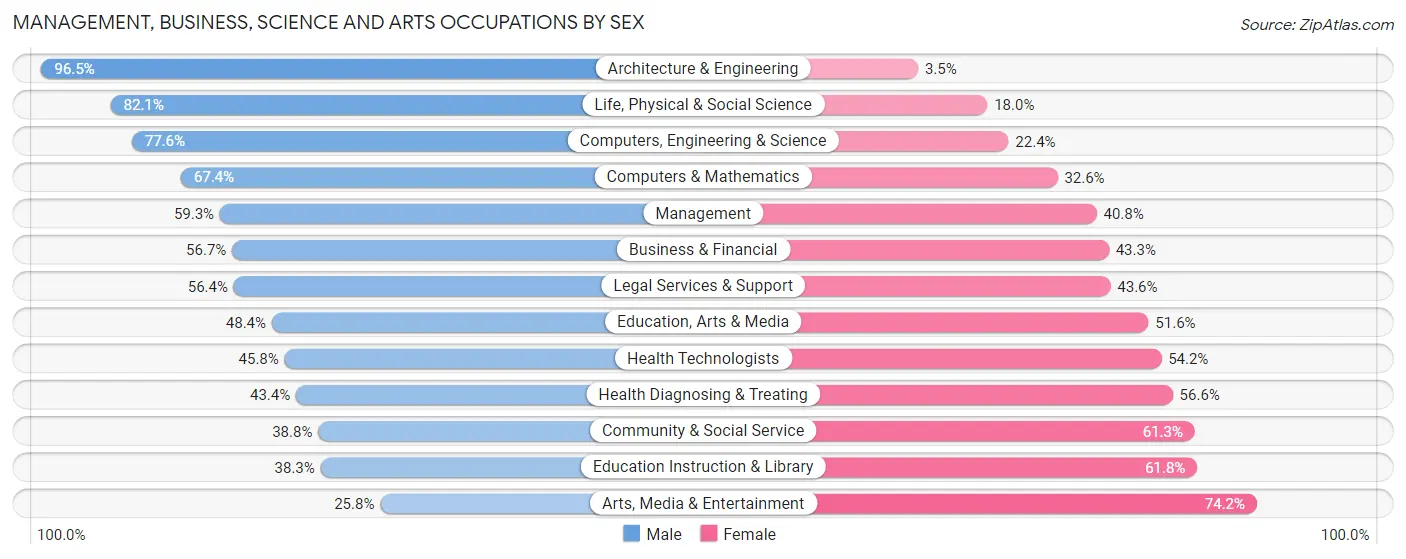
Management, Business, Science and Arts Occupations by Sex
Within the Management, Business, Science and Arts occupations in Palm Valley, the most male-oriented occupations are Architecture & Engineering (96.5%), Life, Physical & Social Science (82.1%), and Computers, Engineering & Science (77.6%), while the most female-oriented occupations are Arts, Media & Entertainment (74.2%), Education Instruction & Library (61.8%), and Community & Social Service (61.3%).
| Occupation | Male | Female |
| Management | 1,147 (59.3%) | 789 (40.7%) |
| Business & Financial | 440 (56.7%) | 336 (43.3%) |
| Computers, Engineering & Science | 295 (77.6%) | 85 (22.4%) |
| Computers & Mathematics | 153 (67.4%) | 74 (32.6%) |
| Architecture & Engineering | 110 (96.5%) | 4 (3.5%) |
| Life, Physical & Social Science | 32 (82.1%) | 7 (17.9%) |
| Community & Social Service | 377 (38.8%) | 596 (61.3%) |
| Education, Arts & Media | 46 (48.4%) | 49 (51.6%) |
| Legal Services & Support | 93 (56.4%) | 72 (43.6%) |
| Education Instruction & Library | 166 (38.3%) | 268 (61.8%) |
| Arts, Media & Entertainment | 72 (25.8%) | 207 (74.2%) |
| Health Diagnosing & Treating | 383 (43.4%) | 500 (56.6%) |
| Health Technologists | 367 (45.8%) | 435 (54.2%) |
| Total (Category) | 2,642 (53.4%) | 2,306 (46.6%) |
| Total (Overall) | 4,913 (53.0%) | 4,362 (47.0%) |
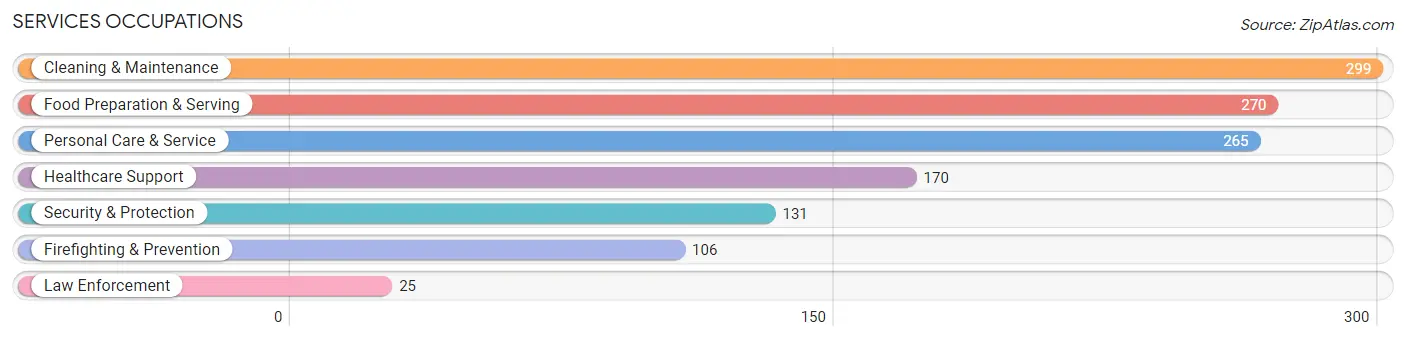
Services Occupations
The most common Services occupations in Palm Valley are Cleaning & Maintenance (299 | 3.2%), Food Preparation & Serving (270 | 2.9%), Personal Care & Service (265 | 2.9%), Healthcare Support (170 | 1.8%), and Security & Protection (131 | 1.4%).
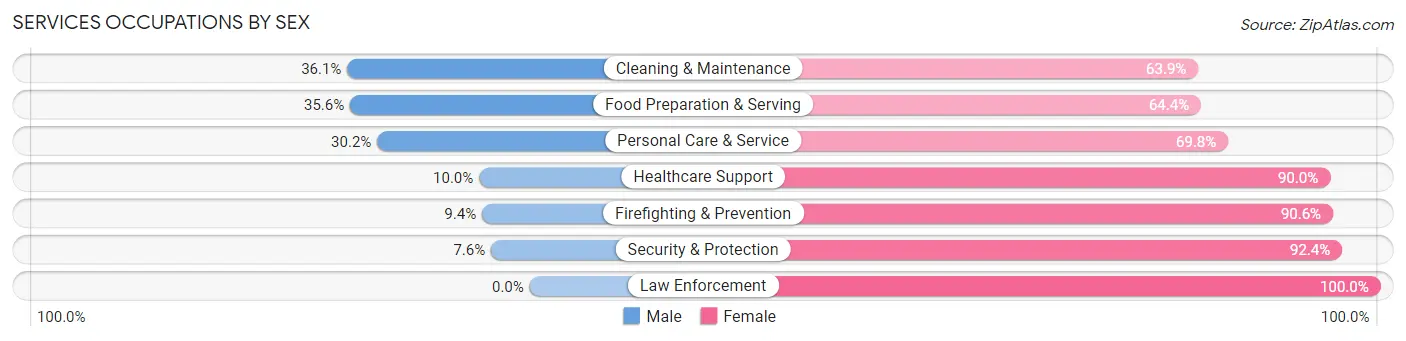
Services Occupations by Sex
Within the Services occupations in Palm Valley, the most male-oriented occupations are Cleaning & Maintenance (36.1%), Food Preparation & Serving (35.6%), and Personal Care & Service (30.2%), while the most female-oriented occupations are Law Enforcement (100.0%), Security & Protection (92.4%), and Firefighting & Prevention (90.6%).
| Occupation | Male | Female |
| Healthcare Support | 17 (10.0%) | 153 (90.0%) |
| Security & Protection | 10 (7.6%) | 121 (92.4%) |
| Firefighting & Prevention | 10 (9.4%) | 96 (90.6%) |
| Law Enforcement | 0 (0.0%) | 25 (100.0%) |
| Food Preparation & Serving | 96 (35.6%) | 174 (64.4%) |
| Cleaning & Maintenance | 108 (36.1%) | 191 (63.9%) |
| Personal Care & Service | 80 (30.2%) | 185 (69.8%) |
| Total (Category) | 311 (27.4%) | 824 (72.6%) |
| Total (Overall) | 4,913 (53.0%) | 4,362 (47.0%) |
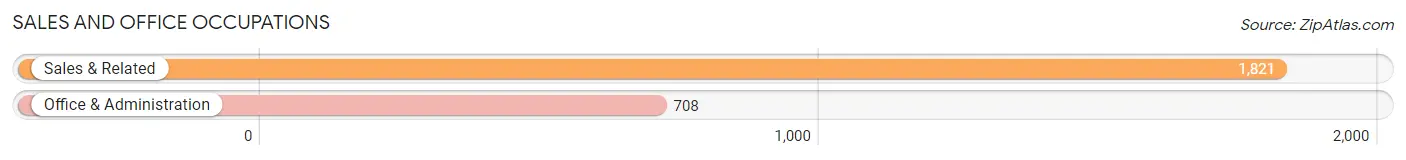
Sales and Office Occupations
The most common Sales and Office occupations in Palm Valley are Sales & Related (1,821 | 19.6%), and Office & Administration (708 | 7.6%).
Sales and Office Occupations by Sex
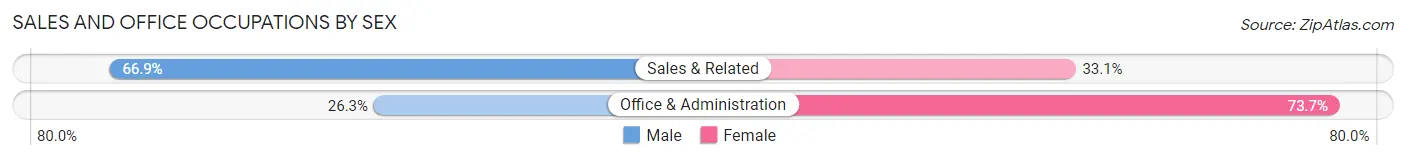
| Occupation | Male | Female |
| Sales & Related | 1,219 (66.9%) | 602 (33.1%) |
| Office & Administration | 186 (26.3%) | 522 (73.7%) |
| Total (Category) | 1,405 (55.6%) | 1,124 (44.4%) |
| Total (Overall) | 4,913 (53.0%) | 4,362 (47.0%) |
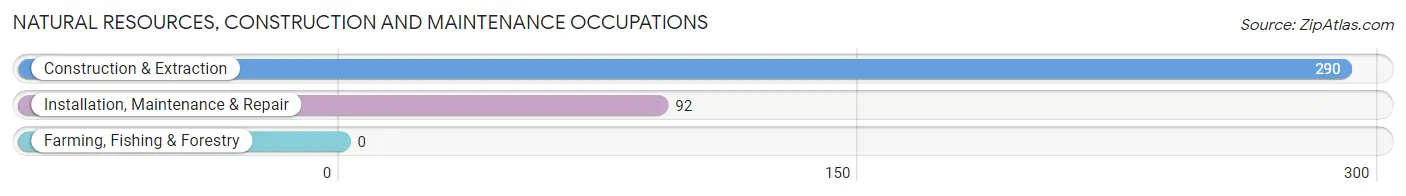
Natural Resources, Construction and Maintenance Occupations
The most common Natural Resources, Construction and Maintenance occupations in Palm Valley are Construction & Extraction (290 | 3.1%), and Installation, Maintenance & Repair (92 | 1.0%).
Natural Resources, Construction and Maintenance Occupations by Sex
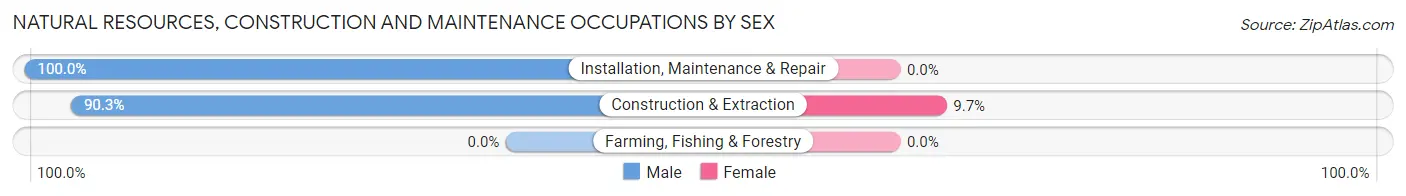
| Occupation | Male | Female |
| Farming, Fishing & Forestry | 0 (0.0%) | 0 (0.0%) |
| Construction & Extraction | 262 (90.3%) | 28 (9.7%) |
| Installation, Maintenance & Repair | 92 (100.0%) | 0 (0.0%) |
| Total (Category) | 354 (92.7%) | 28 (7.3%) |
| Total (Overall) | 4,913 (53.0%) | 4,362 (47.0%) |
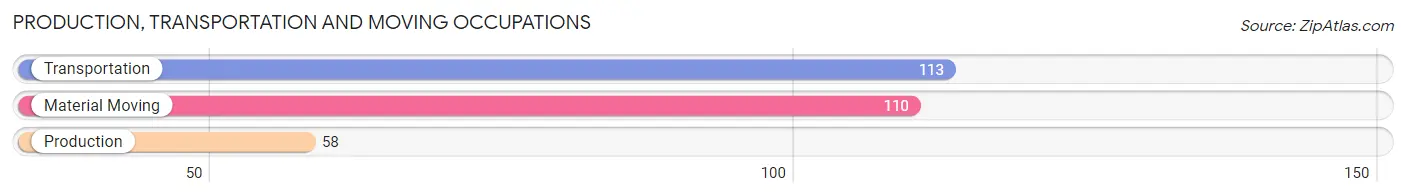
Production, Transportation and Moving Occupations
The most common Production, Transportation and Moving occupations in Palm Valley are Transportation (113 | 1.2%), Material Moving (110 | 1.2%), and Production (58 | 0.6%).
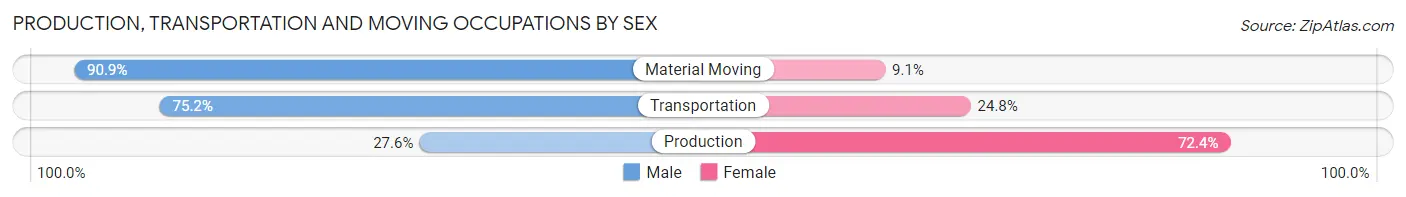
Production, Transportation and Moving Occupations by Sex
| Occupation | Male | Female |
| Production | 16 (27.6%) | 42 (72.4%) |
| Transportation | 85 (75.2%) | 28 (24.8%) |
| Material Moving | 100 (90.9%) | 10 (9.1%) |
| Total (Category) | 201 (71.5%) | 80 (28.5%) |
| Total (Overall) | 4,913 (53.0%) | 4,362 (47.0%) |
Employment Industries by Sex in Palm Valley
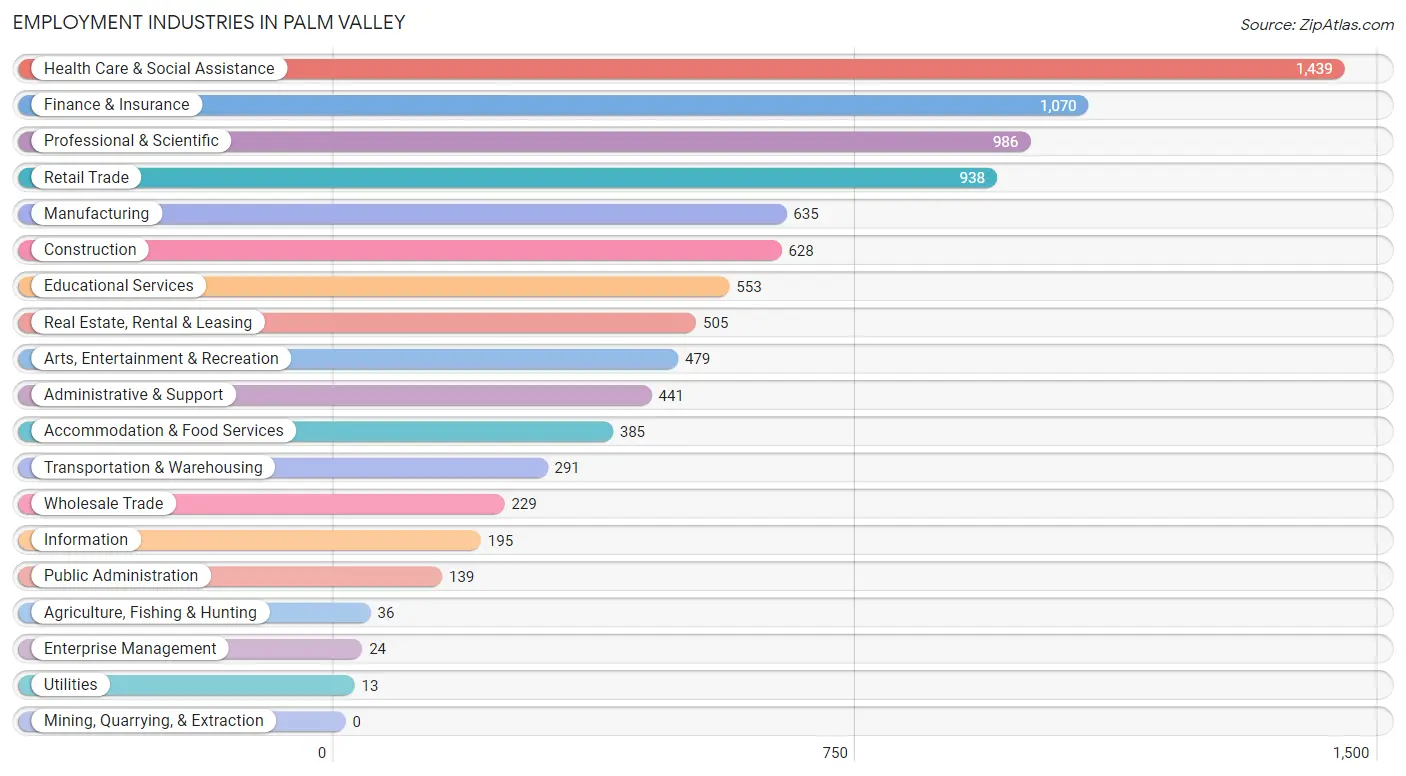
Employment Industries in Palm Valley
The major employment industries in Palm Valley include Health Care & Social Assistance (1,439 | 15.5%), Finance & Insurance (1,070 | 11.5%), Professional & Scientific (986 | 10.6%), Retail Trade (938 | 10.1%), and Manufacturing (635 | 6.9%).
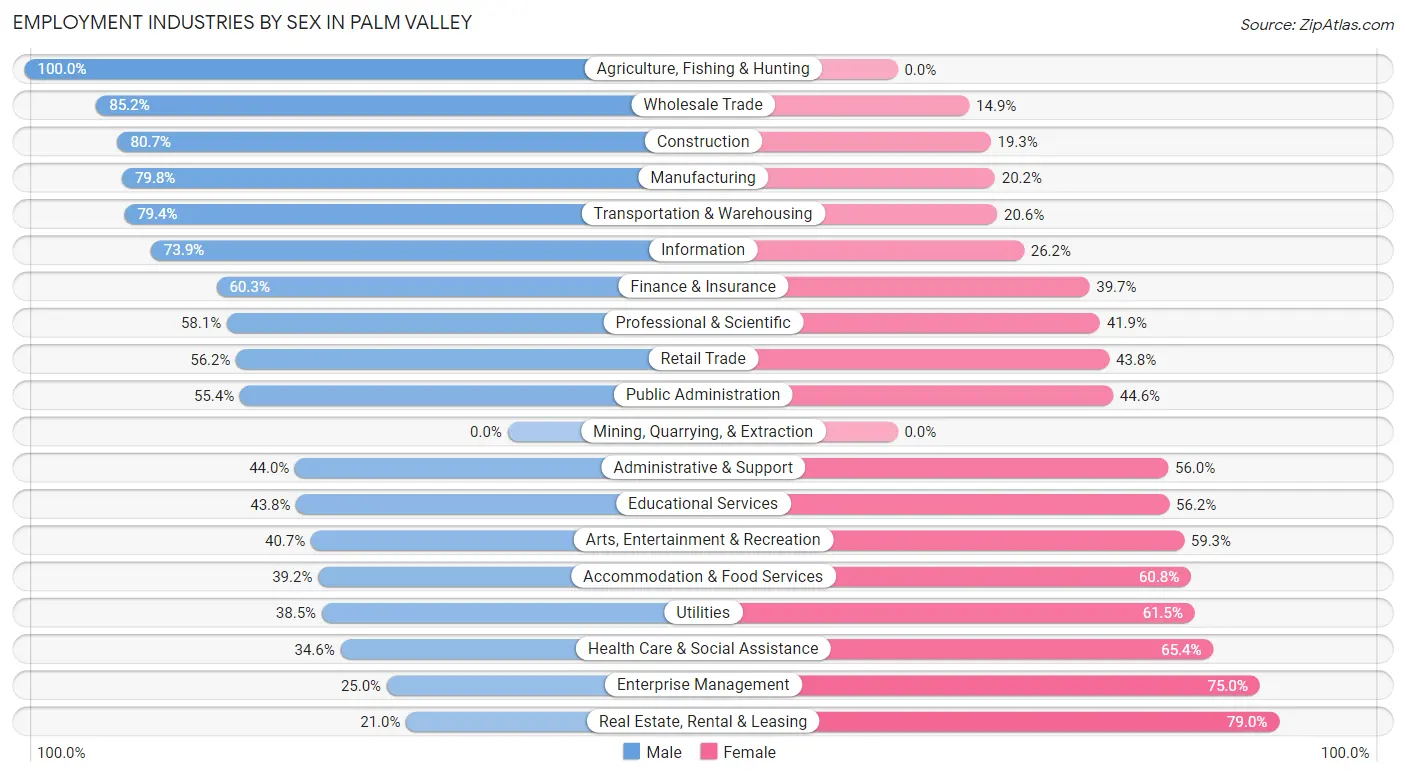
Employment Industries by Sex in Palm Valley
The Palm Valley industries that see more men than women are Agriculture, Fishing & Hunting (100.0%), Wholesale Trade (85.2%), and Construction (80.7%), whereas the industries that tend to have a higher number of women are Real Estate, Rental & Leasing (79.0%), Enterprise Management (75.0%), and Health Care & Social Assistance (65.4%).
| Industry | Male | Female |
| Agriculture, Fishing & Hunting | 36 (100.0%) | 0 (0.0%) |
| Mining, Quarrying, & Extraction | 0 (0.0%) | 0 (0.0%) |
| Construction | 507 (80.7%) | 121 (19.3%) |
| Manufacturing | 507 (79.8%) | 128 (20.2%) |
| Wholesale Trade | 195 (85.2%) | 34 (14.8%) |
| Retail Trade | 527 (56.2%) | 411 (43.8%) |
| Transportation & Warehousing | 231 (79.4%) | 60 (20.6%) |
| Utilities | 5 (38.5%) | 8 (61.5%) |
| Information | 144 (73.9%) | 51 (26.2%) |
| Finance & Insurance | 645 (60.3%) | 425 (39.7%) |
| Real Estate, Rental & Leasing | 106 (21.0%) | 399 (79.0%) |
| Professional & Scientific | 573 (58.1%) | 413 (41.9%) |
| Enterprise Management | 6 (25.0%) | 18 (75.0%) |
| Administrative & Support | 194 (44.0%) | 247 (56.0%) |
| Educational Services | 242 (43.8%) | 311 (56.2%) |
| Health Care & Social Assistance | 498 (34.6%) | 941 (65.4%) |
| Arts, Entertainment & Recreation | 195 (40.7%) | 284 (59.3%) |
| Accommodation & Food Services | 151 (39.2%) | 234 (60.8%) |
| Public Administration | 77 (55.4%) | 62 (44.6%) |
| Total | 4,913 (53.0%) | 4,362 (47.0%) |
Education in Palm Valley
School Enrollment in Palm Valley
The most common levels of schooling among the 3,943 students in Palm Valley are high school (1,280 | 32.5%), middle school (944 | 23.9%), and elementary school (839 | 21.3%).
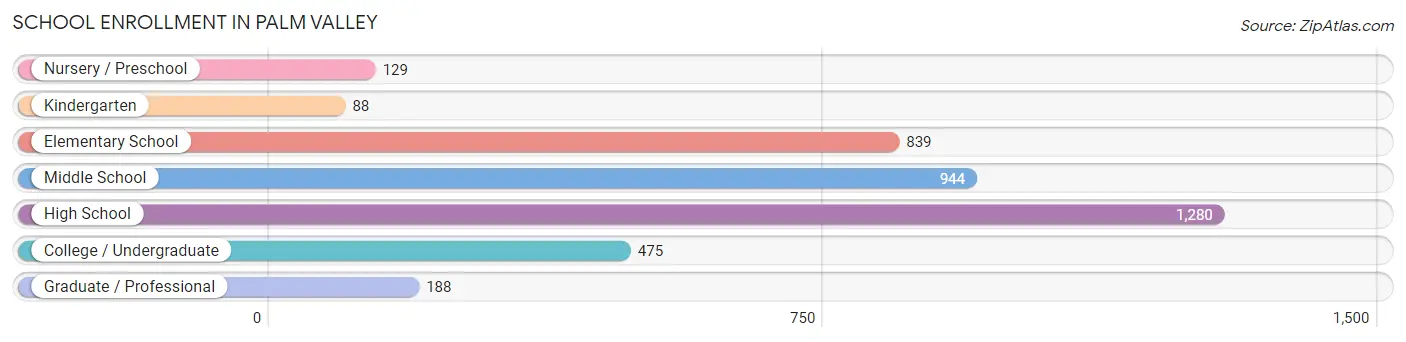
| School Level | # Students | % Students |
| Nursery / Preschool | 129 | 3.3% |
| Kindergarten | 88 | 2.2% |
| Elementary School | 839 | 21.3% |
| Middle School | 944 | 23.9% |
| High School | 1,280 | 32.5% |
| College / Undergraduate | 475 | 12.0% |
| Graduate / Professional | 188 | 4.8% |
| Total | 3,943 | 100.0% |
School Enrollment by Age by Funding Source in Palm Valley
Out of a total of 3,943 students who are enrolled in schools in Palm Valley, 761 (19.3%) attend a private institution, while the remaining 3,182 (80.7%) are enrolled in public schools. The age group of 25 to 34 year olds has the highest likelihood of being enrolled in private schools, with 92 (43.8% in the age bracket) enrolled. Conversely, the age group of 15 to 17 year olds has the lowest likelihood of being enrolled in a private school, with 850 (94.1% in the age bracket) attending a public institution.
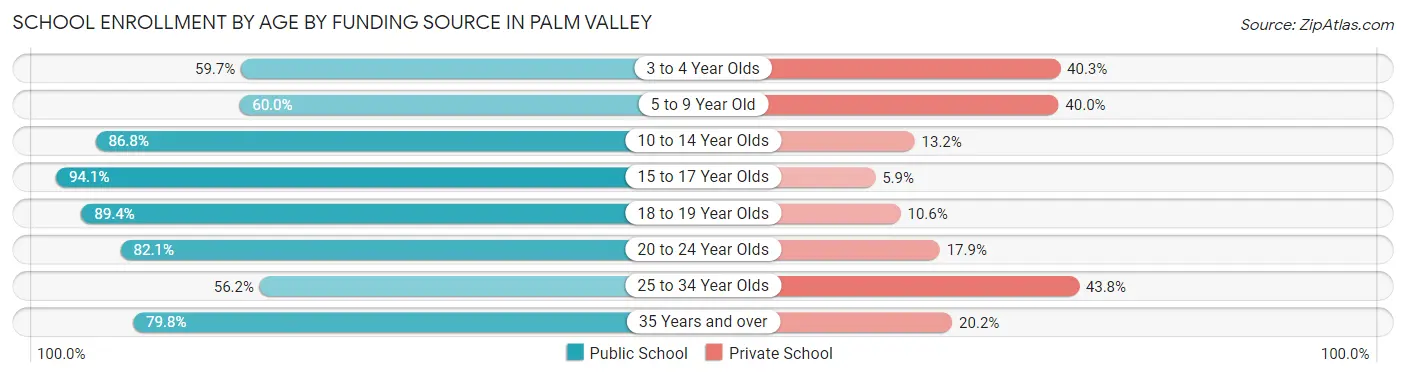
| Age Bracket | Public School | Private School |
| 3 to 4 Year Olds | 77 (59.7%) | 52 (40.3%) |
| 5 to 9 Year Old | 432 (60.0%) | 288 (40.0%) |
| 10 to 14 Year Olds | 1,169 (86.8%) | 178 (13.2%) |
| 15 to 17 Year Olds | 850 (94.1%) | 53 (5.9%) |
| 18 to 19 Year Olds | 228 (89.4%) | 27 (10.6%) |
| 20 to 24 Year Olds | 234 (82.1%) | 51 (17.9%) |
| 25 to 34 Year Olds | 118 (56.2%) | 92 (43.8%) |
| 35 Years and over | 75 (79.8%) | 19 (20.2%) |
| Total | 3,182 (80.7%) | 761 (19.3%) |
Educational Attainment by Field of Study in Palm Valley
Business (2,755 | 25.7%), science & technology (1,047 | 9.8%), social sciences (952 | 8.9%), education (927 | 8.7%), and psychology (825 | 7.7%) are the most common fields of study among 10,705 individuals in Palm Valley who have obtained a bachelor's degree or higher.
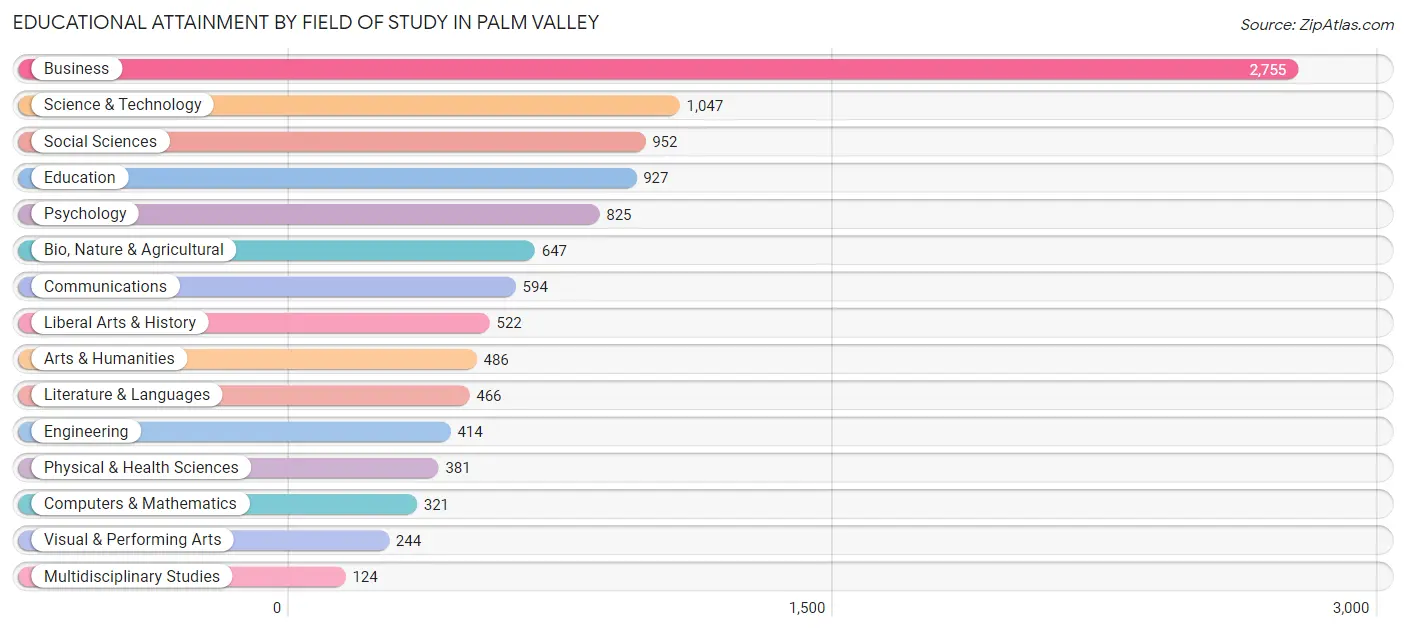
| Field of Study | # Graduates | % Graduates |
| Computers & Mathematics | 321 | 3.0% |
| Bio, Nature & Agricultural | 647 | 6.0% |
| Physical & Health Sciences | 381 | 3.6% |
| Psychology | 825 | 7.7% |
| Social Sciences | 952 | 8.9% |
| Engineering | 414 | 3.9% |
| Multidisciplinary Studies | 124 | 1.2% |
| Science & Technology | 1,047 | 9.8% |
| Business | 2,755 | 25.7% |
| Education | 927 | 8.7% |
| Literature & Languages | 466 | 4.3% |
| Liberal Arts & History | 522 | 4.9% |
| Visual & Performing Arts | 244 | 2.3% |
| Communications | 594 | 5.6% |
| Arts & Humanities | 486 | 4.5% |
| Total | 10,705 | 100.0% |
Transportation & Commute in Palm Valley
Vehicle Availability by Sex in Palm Valley
The most prevalent vehicle ownership categories in Palm Valley are males with 2 vehicles (2,609, accounting for 53.7%) and females with 2 vehicles (1,981, making up 61.0%).
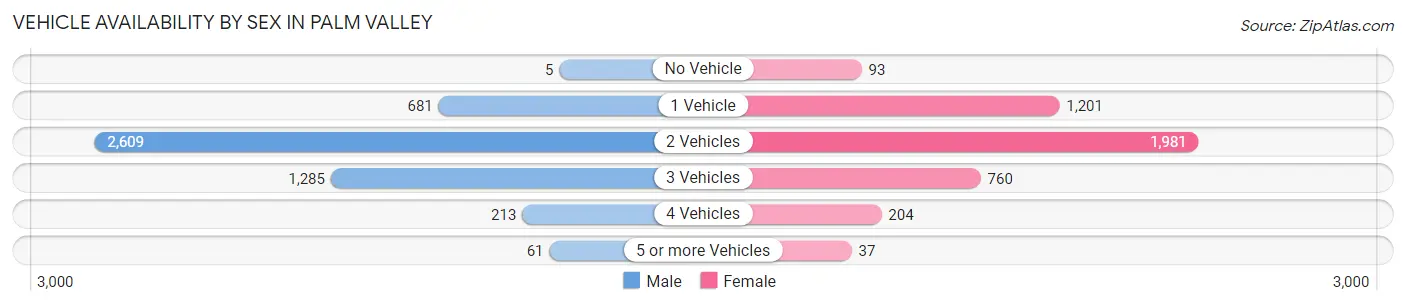
| Vehicles Available | Male | Female |
| No Vehicle | 5 (0.1%) | 93 (2.2%) |
| 1 Vehicle | 681 (14.0%) | 1,201 (28.1%) |
| 2 Vehicles | 2,609 (53.7%) | 1,981 (46.3%) |
| 3 Vehicles | 1,285 (26.5%) | 760 (17.8%) |
| 4 Vehicles | 213 (4.4%) | 204 (4.8%) |
| 5 or more Vehicles | 61 (1.3%) | 37 (0.9%) |
| Total | 4,854 (100.0%) | 4,276 (100.0%) |
Commute Time in Palm Valley
The most frequently occuring commute durations in Palm Valley are 30 to 34 minutes (1,542 commuters, 21.3%), 15 to 19 minutes (1,122 commuters, 15.5%), and 5 to 9 minutes (834 commuters, 11.5%).
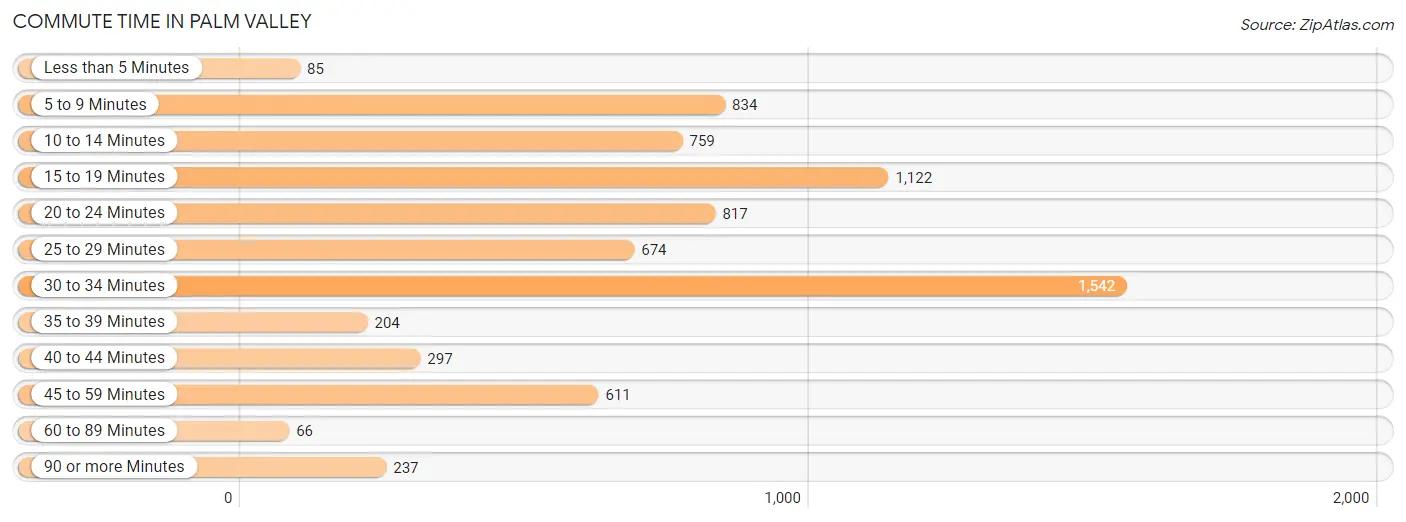
| Commute Time | # Commuters | % Commuters |
| Less than 5 Minutes | 85 | 1.2% |
| 5 to 9 Minutes | 834 | 11.5% |
| 10 to 14 Minutes | 759 | 10.5% |
| 15 to 19 Minutes | 1,122 | 15.5% |
| 20 to 24 Minutes | 817 | 11.3% |
| 25 to 29 Minutes | 674 | 9.3% |
| 30 to 34 Minutes | 1,542 | 21.3% |
| 35 to 39 Minutes | 204 | 2.8% |
| 40 to 44 Minutes | 297 | 4.1% |
| 45 to 59 Minutes | 611 | 8.4% |
| 60 to 89 Minutes | 66 | 0.9% |
| 90 or more Minutes | 237 | 3.3% |
Commute Time by Sex in Palm Valley
The most common commute times in Palm Valley are 30 to 34 minutes (1,119 commuters, 28.9%) for males and 5 to 9 minutes (564 commuters, 16.7%) for females.
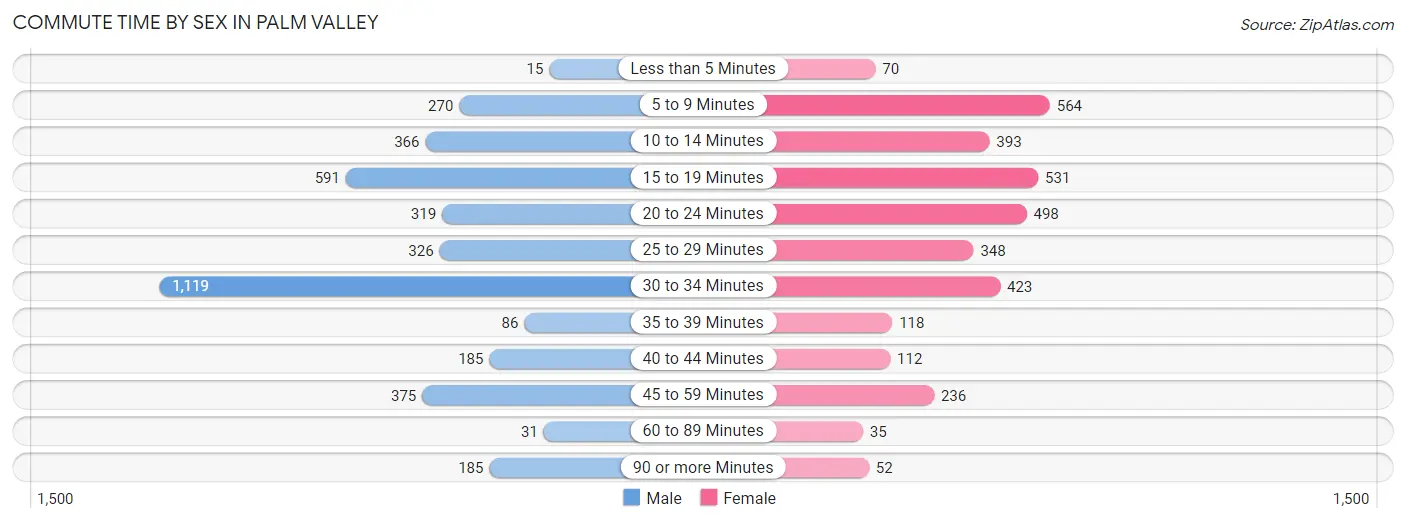
| Commute Time | Male | Female |
| Less than 5 Minutes | 15 (0.4%) | 70 (2.1%) |
| 5 to 9 Minutes | 270 (7.0%) | 564 (16.7%) |
| 10 to 14 Minutes | 366 (9.5%) | 393 (11.6%) |
| 15 to 19 Minutes | 591 (15.3%) | 531 (15.7%) |
| 20 to 24 Minutes | 319 (8.3%) | 498 (14.7%) |
| 25 to 29 Minutes | 326 (8.4%) | 348 (10.3%) |
| 30 to 34 Minutes | 1,119 (28.9%) | 423 (12.5%) |
| 35 to 39 Minutes | 86 (2.2%) | 118 (3.5%) |
| 40 to 44 Minutes | 185 (4.8%) | 112 (3.3%) |
| 45 to 59 Minutes | 375 (9.7%) | 236 (7.0%) |
| 60 to 89 Minutes | 31 (0.8%) | 35 (1.0%) |
| 90 or more Minutes | 185 (4.8%) | 52 (1.5%) |
Time of Departure to Work by Sex in Palm Valley
The most frequent times of departure to work in Palm Valley are 8:00 AM to 8:29 AM (984, 25.4%) for males and 8:00 AM to 8:29 AM (713, 21.1%) for females.
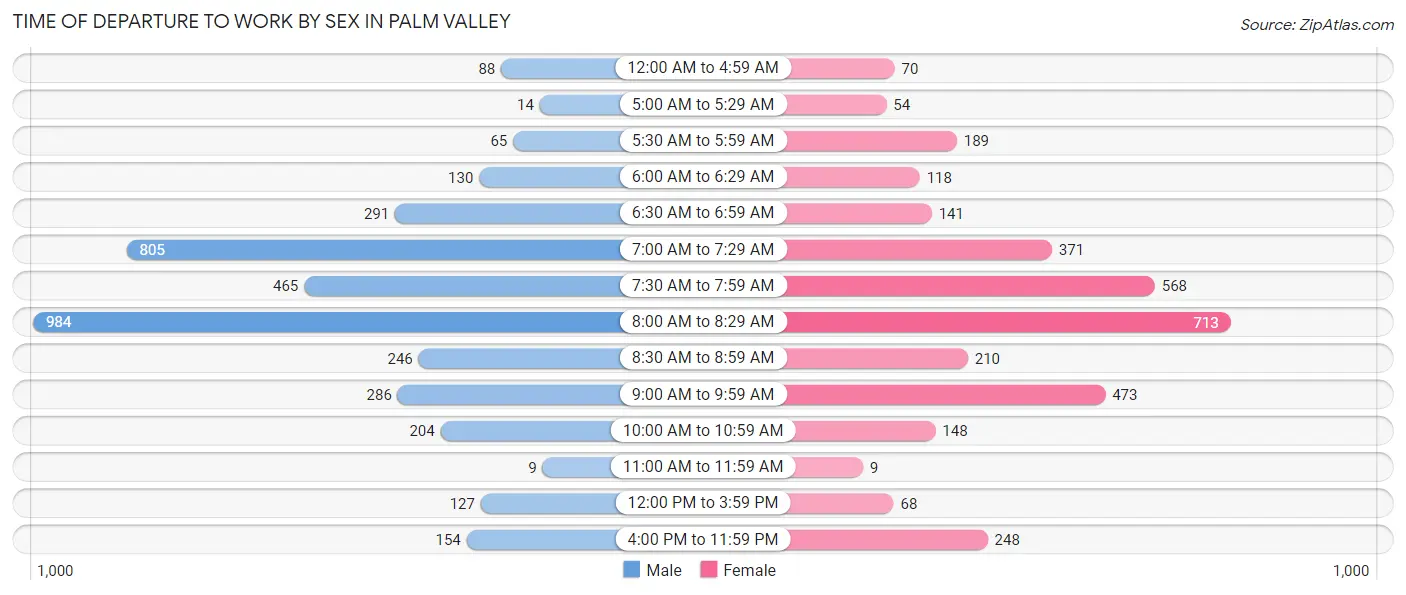
| Time of Departure | Male | Female |
| 12:00 AM to 4:59 AM | 88 (2.3%) | 70 (2.1%) |
| 5:00 AM to 5:29 AM | 14 (0.4%) | 54 (1.6%) |
| 5:30 AM to 5:59 AM | 65 (1.7%) | 189 (5.6%) |
| 6:00 AM to 6:29 AM | 130 (3.4%) | 118 (3.5%) |
| 6:30 AM to 6:59 AM | 291 (7.5%) | 141 (4.2%) |
| 7:00 AM to 7:29 AM | 805 (20.8%) | 371 (11.0%) |
| 7:30 AM to 7:59 AM | 465 (12.0%) | 568 (16.8%) |
| 8:00 AM to 8:29 AM | 984 (25.4%) | 713 (21.1%) |
| 8:30 AM to 8:59 AM | 246 (6.4%) | 210 (6.2%) |
| 9:00 AM to 9:59 AM | 286 (7.4%) | 473 (14.0%) |
| 10:00 AM to 10:59 AM | 204 (5.3%) | 148 (4.4%) |
| 11:00 AM to 11:59 AM | 9 (0.2%) | 9 (0.3%) |
| 12:00 PM to 3:59 PM | 127 (3.3%) | 68 (2.0%) |
| 4:00 PM to 11:59 PM | 154 (4.0%) | 248 (7.3%) |
| Total | 3,868 (100.0%) | 3,380 (100.0%) |
Housing Occupancy in Palm Valley
Occupancy by Ownership in Palm Valley
Of the total 8,387 dwellings in Palm Valley, owner-occupied units account for 6,779 (80.8%), while renter-occupied units make up 1,608 (19.2%).
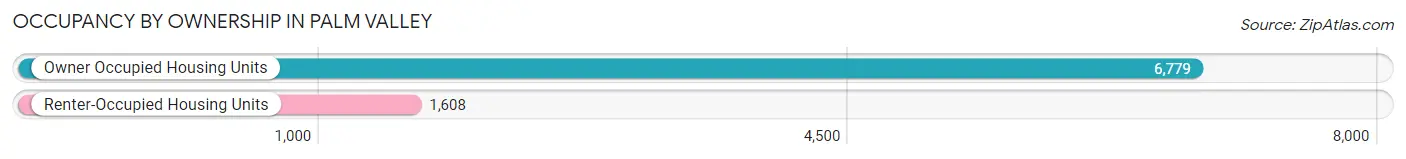
| Occupancy | # Housing Units | % Housing Units |
| Owner Occupied Housing Units | 6,779 | 80.8% |
| Renter-Occupied Housing Units | 1,608 | 19.2% |
| Total Occupied Housing Units | 8,387 | 100.0% |
Occupancy by Household Size in Palm Valley
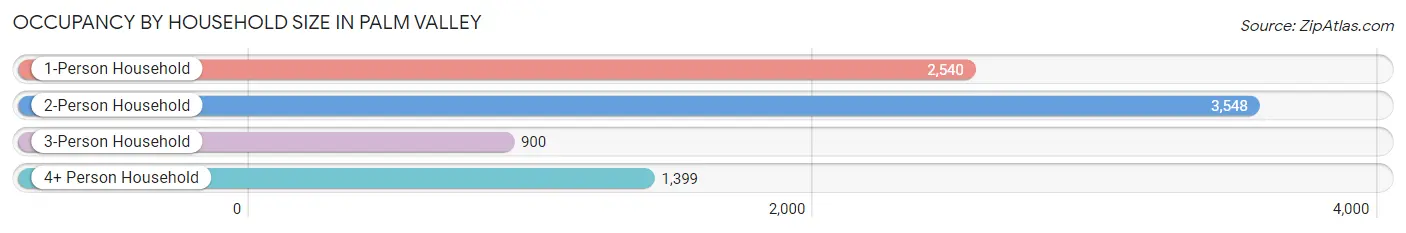
| Household Size | # Housing Units | % Housing Units |
| 1-Person Household | 2,540 | 30.3% |
| 2-Person Household | 3,548 | 42.3% |
| 3-Person Household | 900 | 10.7% |
| 4+ Person Household | 1,399 | 16.7% |
| Total Housing Units | 8,387 | 100.0% |
Occupancy by Ownership by Household Size in Palm Valley
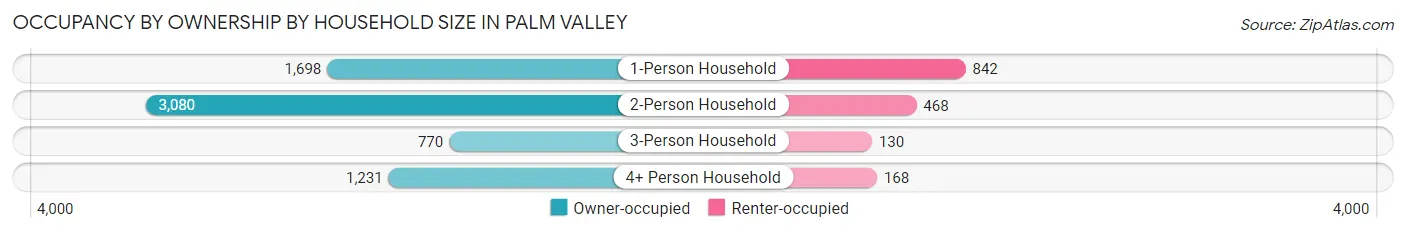
| Household Size | Owner-occupied | Renter-occupied |
| 1-Person Household | 1,698 (66.8%) | 842 (33.2%) |
| 2-Person Household | 3,080 (86.8%) | 468 (13.2%) |
| 3-Person Household | 770 (85.6%) | 130 (14.4%) |
| 4+ Person Household | 1,231 (88.0%) | 168 (12.0%) |
| Total Housing Units | 6,779 (80.8%) | 1,608 (19.2%) |
Occupancy by Educational Attainment in Palm Valley
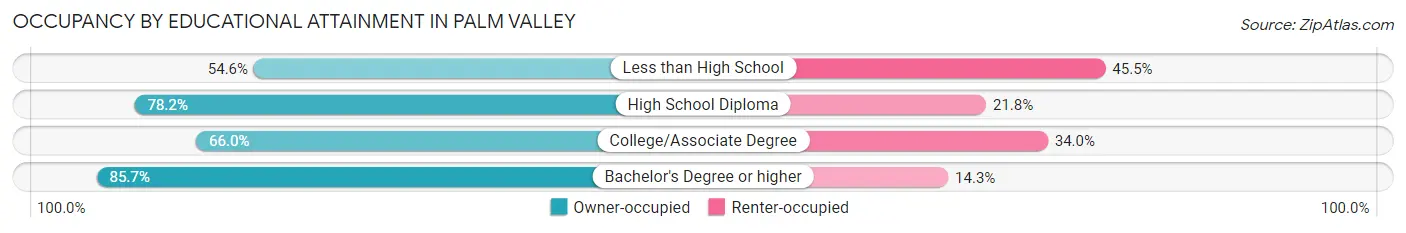
| Household Size | Owner-occupied | Renter-occupied |
| Less than High School | 90 (54.5%) | 75 (45.5%) |
| High School Diploma | 542 (78.2%) | 151 (21.8%) |
| College/Associate Degree | 1,028 (66.0%) | 530 (34.0%) |
| Bachelor's Degree or higher | 5,119 (85.7%) | 852 (14.3%) |
Occupancy by Age of Householder in Palm Valley
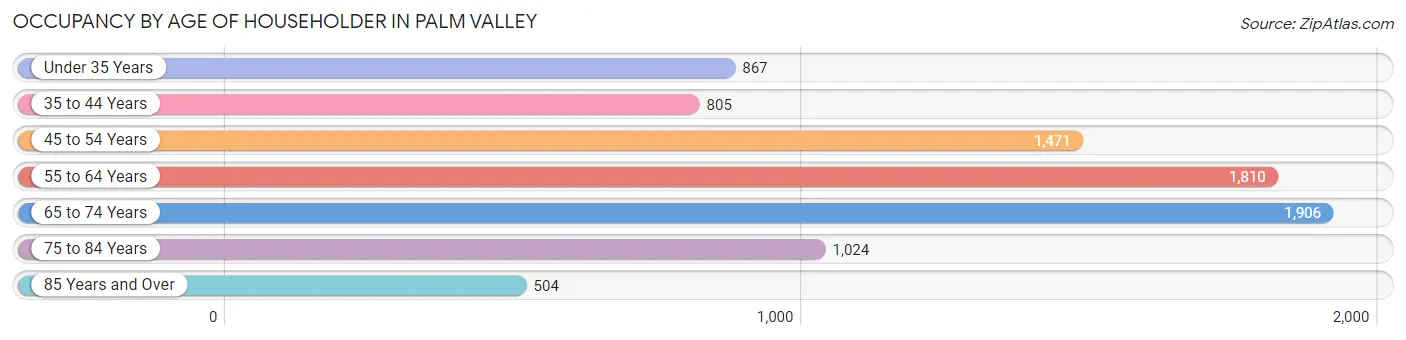
| Age Bracket | # Households | % Households |
| Under 35 Years | 867 | 10.3% |
| 35 to 44 Years | 805 | 9.6% |
| 45 to 54 Years | 1,471 | 17.5% |
| 55 to 64 Years | 1,810 | 21.6% |
| 65 to 74 Years | 1,906 | 22.7% |
| 75 to 84 Years | 1,024 | 12.2% |
| 85 Years and Over | 504 | 6.0% |
| Total | 8,387 | 100.0% |
Housing Finances in Palm Valley
Median Income by Occupancy in Palm Valley
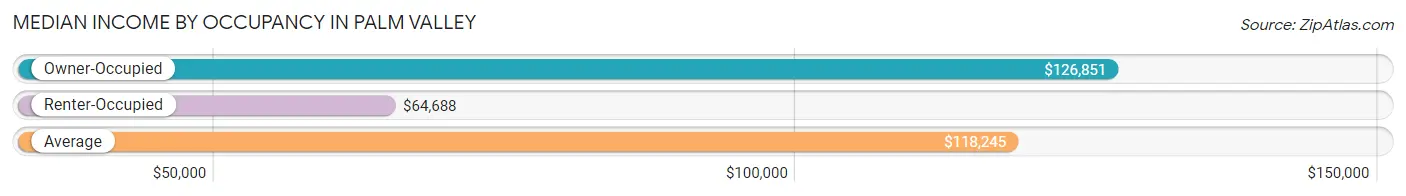
| Occupancy Type | # Households | Median Income |
| Owner-Occupied | 6,779 (80.8%) | $126,851 |
| Renter-Occupied | 1,608 (19.2%) | $64,688 |
| Average | 8,387 (100.0%) | $118,245 |
Occupancy by Householder Income Bracket in Palm Valley
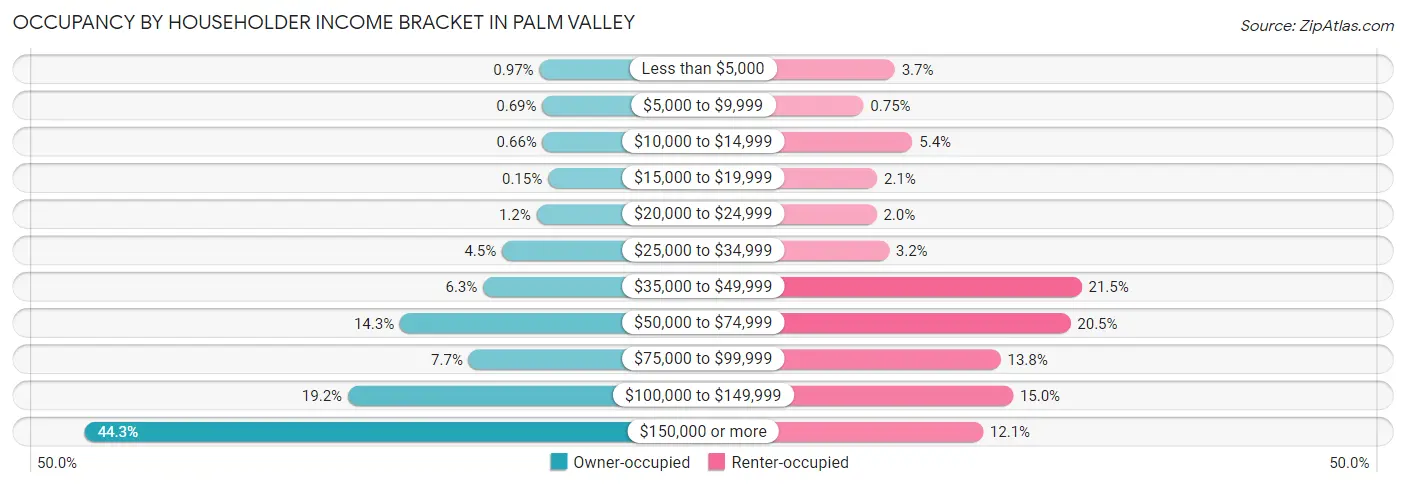
| Income Bracket | Owner-occupied | Renter-occupied |
| Less than $5,000 | 66 (1.0%) | 60 (3.7%) |
| $5,000 to $9,999 | 47 (0.7%) | 12 (0.7%) |
| $10,000 to $14,999 | 45 (0.7%) | 87 (5.4%) |
| $15,000 to $19,999 | 10 (0.2%) | 33 (2.1%) |
| $20,000 to $24,999 | 84 (1.2%) | 32 (2.0%) |
| $25,000 to $34,999 | 307 (4.5%) | 51 (3.2%) |
| $35,000 to $49,999 | 429 (6.3%) | 346 (21.5%) |
| $50,000 to $74,999 | 966 (14.2%) | 329 (20.5%) |
| $75,000 to $99,999 | 522 (7.7%) | 222 (13.8%) |
| $100,000 to $149,999 | 1,302 (19.2%) | 241 (15.0%) |
| $150,000 or more | 3,001 (44.3%) | 195 (12.1%) |
| Total | 6,779 (100.0%) | 1,608 (100.0%) |
Monthly Housing Cost Tiers in Palm Valley
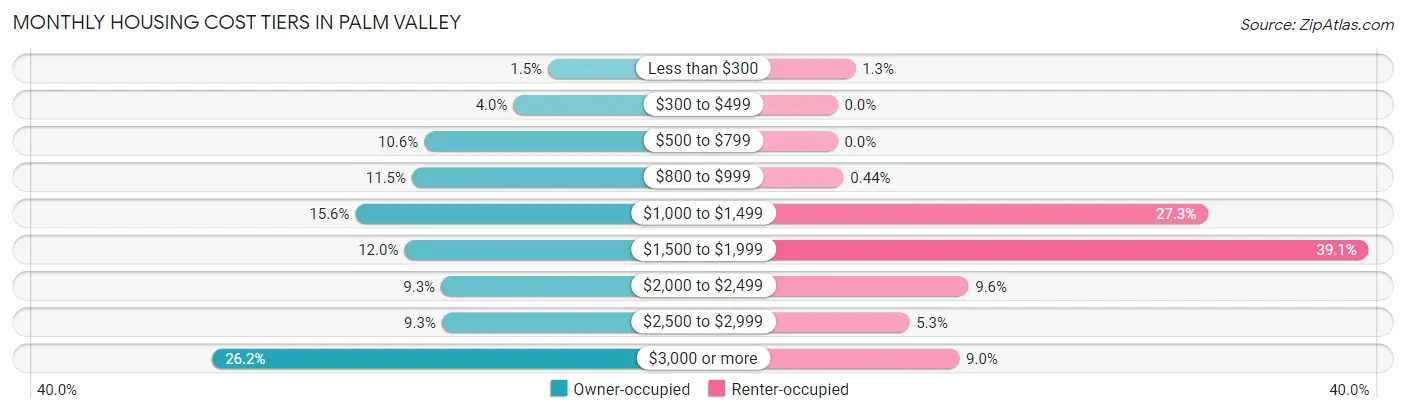
| Monthly Cost | Owner-occupied | Renter-occupied |
| Less than $300 | 99 (1.5%) | 21 (1.3%) |
| $300 to $499 | 272 (4.0%) | 0 (0.0%) |
| $500 to $799 | 717 (10.6%) | 0 (0.0%) |
| $800 to $999 | 778 (11.5%) | 7 (0.4%) |
| $1,000 to $1,499 | 1,060 (15.6%) | 439 (27.3%) |
| $1,500 to $1,999 | 816 (12.0%) | 629 (39.1%) |
| $2,000 to $2,499 | 633 (9.3%) | 155 (9.6%) |
| $2,500 to $2,999 | 629 (9.3%) | 85 (5.3%) |
| $3,000 or more | 1,775 (26.2%) | 144 (9.0%) |
| Total | 6,779 (100.0%) | 1,608 (100.0%) |
Physical Housing Characteristics in Palm Valley
Housing Structures in Palm Valley
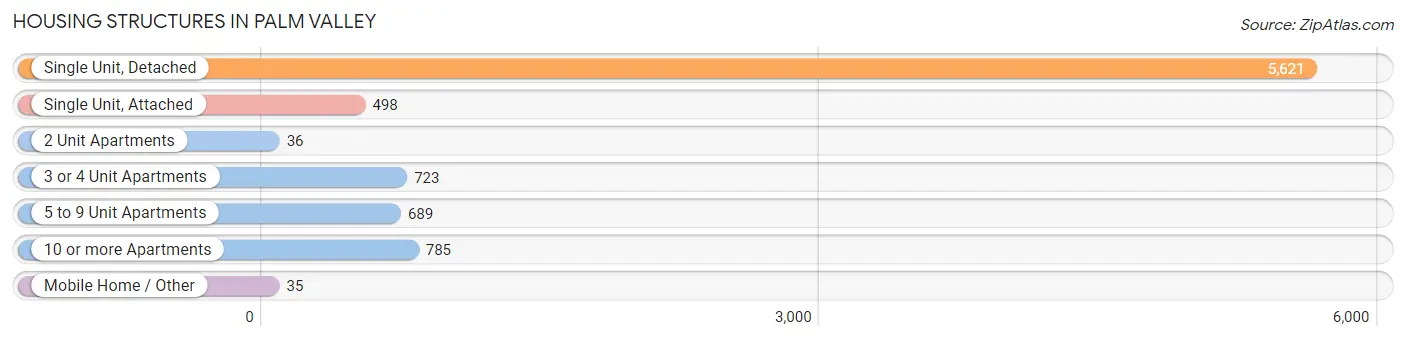
| Structure Type | # Housing Units | % Housing Units |
| Single Unit, Detached | 5,621 | 67.0% |
| Single Unit, Attached | 498 | 5.9% |
| 2 Unit Apartments | 36 | 0.4% |
| 3 or 4 Unit Apartments | 723 | 8.6% |
| 5 to 9 Unit Apartments | 689 | 8.2% |
| 10 or more Apartments | 785 | 9.4% |
| Mobile Home / Other | 35 | 0.4% |
| Total | 8,387 | 100.0% |
Housing Structures by Occupancy in Palm Valley
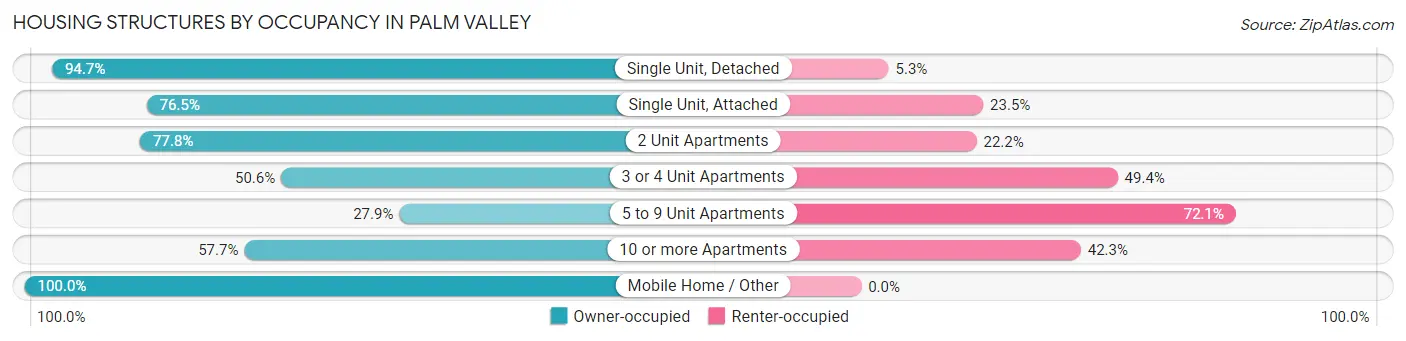
| Structure Type | Owner-occupied | Renter-occupied |
| Single Unit, Detached | 5,324 (94.7%) | 297 (5.3%) |
| Single Unit, Attached | 381 (76.5%) | 117 (23.5%) |
| 2 Unit Apartments | 28 (77.8%) | 8 (22.2%) |
| 3 or 4 Unit Apartments | 366 (50.6%) | 357 (49.4%) |
| 5 to 9 Unit Apartments | 192 (27.9%) | 497 (72.1%) |
| 10 or more Apartments | 453 (57.7%) | 332 (42.3%) |
| Mobile Home / Other | 35 (100.0%) | 0 (0.0%) |
| Total | 6,779 (80.8%) | 1,608 (19.2%) |
Housing Structures by Number of Rooms in Palm Valley
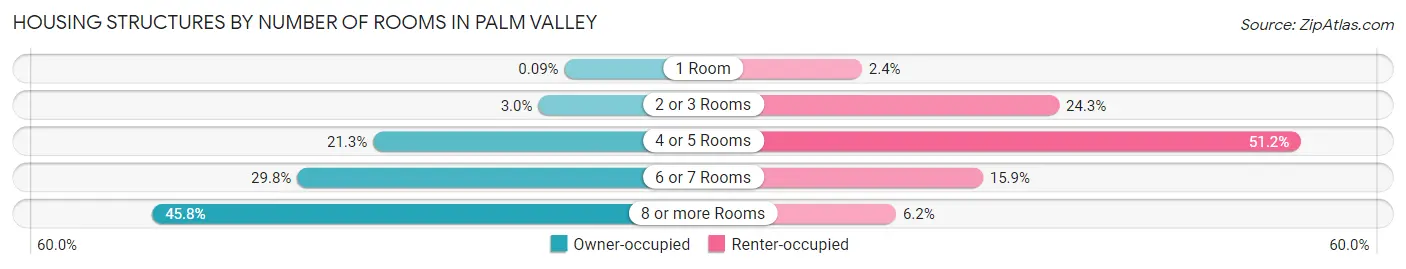
| Number of Rooms | Owner-occupied | Renter-occupied |
| 1 Room | 6 (0.1%) | 39 (2.4%) |
| 2 or 3 Rooms | 203 (3.0%) | 391 (24.3%) |
| 4 or 5 Rooms | 1,446 (21.3%) | 823 (51.2%) |
| 6 or 7 Rooms | 2,017 (29.7%) | 255 (15.9%) |
| 8 or more Rooms | 3,107 (45.8%) | 100 (6.2%) |
| Total | 6,779 (100.0%) | 1,608 (100.0%) |
Housing Structure by Heating Type in Palm Valley
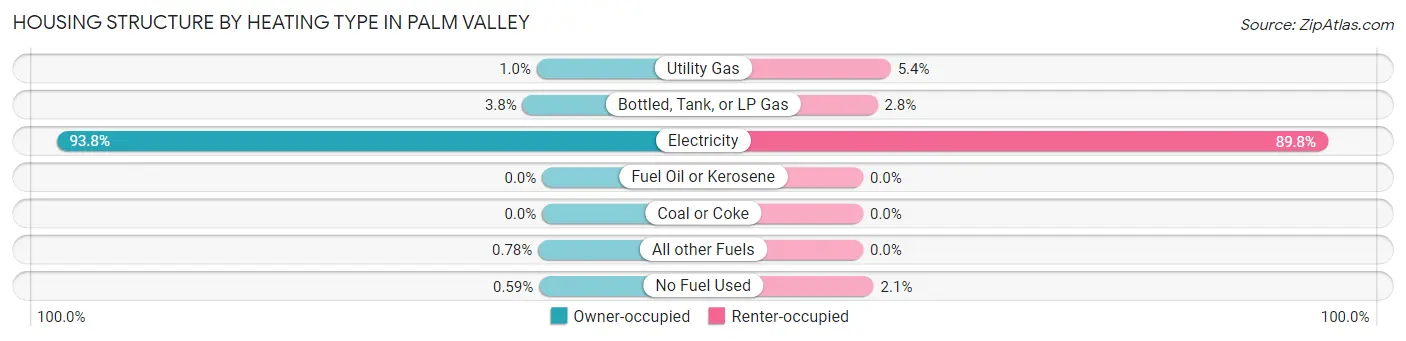
| Heating Type | Owner-occupied | Renter-occupied |
| Utility Gas | 69 (1.0%) | 86 (5.3%) |
| Bottled, Tank, or LP Gas | 256 (3.8%) | 45 (2.8%) |
| Electricity | 6,361 (93.8%) | 1,444 (89.8%) |
| Fuel Oil or Kerosene | 0 (0.0%) | 0 (0.0%) |
| Coal or Coke | 0 (0.0%) | 0 (0.0%) |
| All other Fuels | 53 (0.8%) | 0 (0.0%) |
| No Fuel Used | 40 (0.6%) | 33 (2.1%) |
| Total | 6,779 (100.0%) | 1,608 (100.0%) |
Household Vehicle Usage in Palm Valley
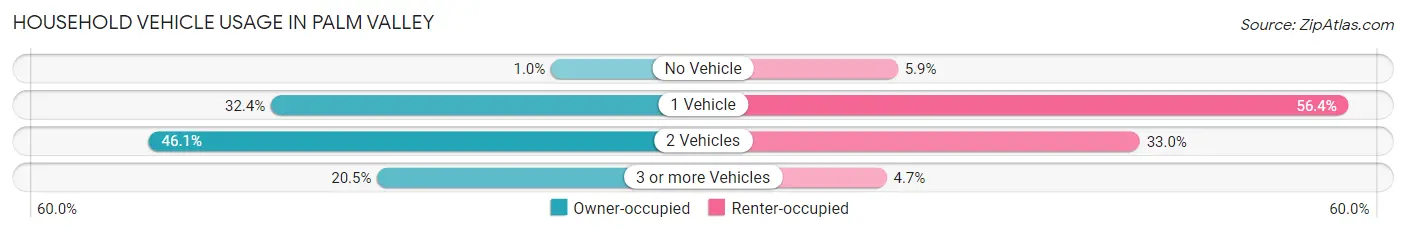
| Vehicles per Household | Owner-occupied | Renter-occupied |
| No Vehicle | 69 (1.0%) | 95 (5.9%) |
| 1 Vehicle | 2,196 (32.4%) | 907 (56.4%) |
| 2 Vehicles | 3,125 (46.1%) | 531 (33.0%) |
| 3 or more Vehicles | 1,389 (20.5%) | 75 (4.7%) |
| Total | 6,779 (100.0%) | 1,608 (100.0%) |
Real Estate & Mortgages in Palm Valley
Real Estate and Mortgage Overview in Palm Valley
| Characteristic | Without Mortgage | With Mortgage |
| Housing Units | 2,697 | 4,082 |
| Median Property Value | $592,700 | $611,900 |
| Median Household Income | $120,140 | $1,937 |
| Monthly Housing Costs | $868 | $1,705 |
| Real Estate Taxes | $3,765 | $28 |
Property Value by Mortgage Status in Palm Valley
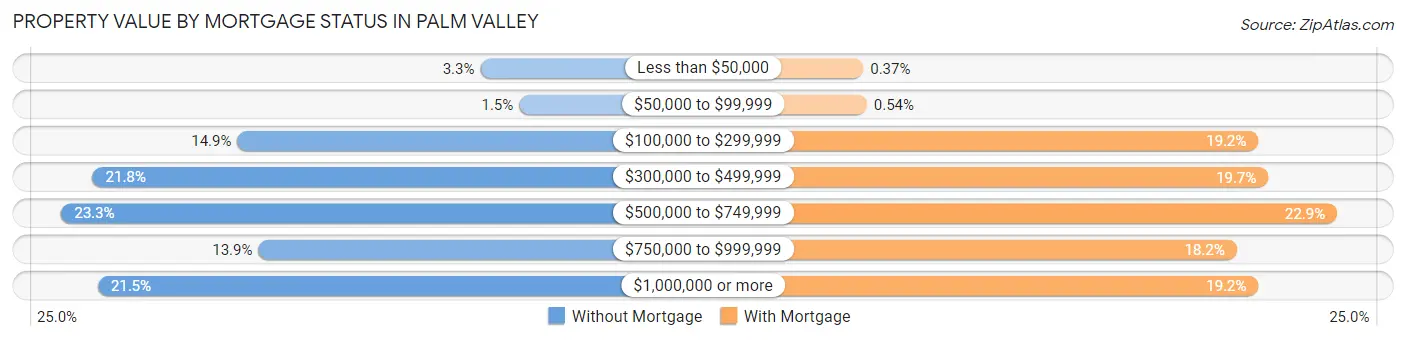
| Property Value | Without Mortgage | With Mortgage |
| Less than $50,000 | 89 (3.3%) | 15 (0.4%) |
| $50,000 to $99,999 | 39 (1.5%) | 22 (0.5%) |
| $100,000 to $299,999 | 401 (14.9%) | 783 (19.2%) |
| $300,000 to $499,999 | 587 (21.8%) | 802 (19.7%) |
| $500,000 to $749,999 | 627 (23.3%) | 936 (22.9%) |
| $750,000 to $999,999 | 374 (13.9%) | 741 (18.1%) |
| $1,000,000 or more | 580 (21.5%) | 783 (19.2%) |
| Total | 2,697 (100.0%) | 4,082 (100.0%) |
Household Income by Mortgage Status in Palm Valley
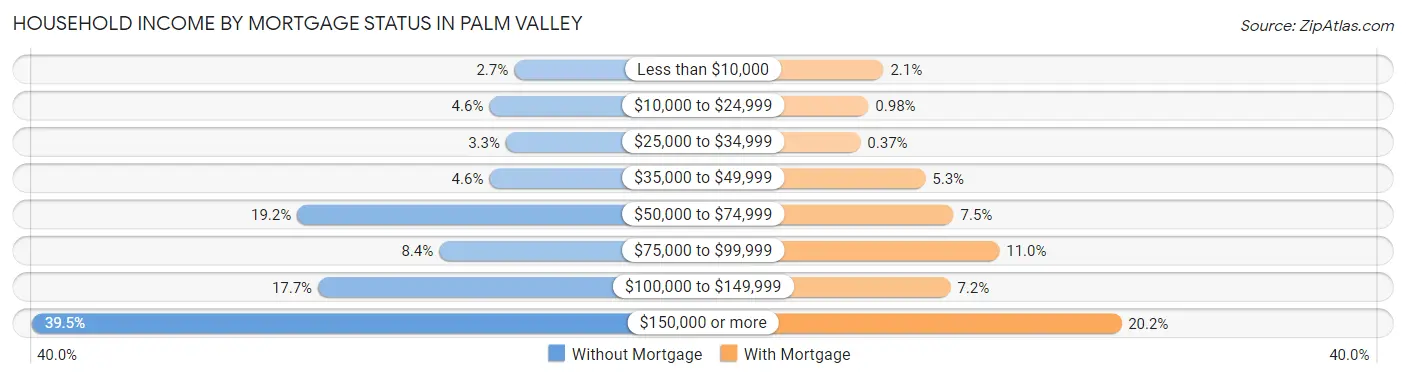
| Household Income | Without Mortgage | With Mortgage |
| Less than $10,000 | 73 (2.7%) | 87 (2.1%) |
| $10,000 to $24,999 | 124 (4.6%) | 40 (1.0%) |
| $25,000 to $34,999 | 90 (3.3%) | 15 (0.4%) |
| $35,000 to $49,999 | 124 (4.6%) | 217 (5.3%) |
| $50,000 to $74,999 | 519 (19.2%) | 305 (7.5%) |
| $75,000 to $99,999 | 227 (8.4%) | 447 (11.0%) |
| $100,000 to $149,999 | 476 (17.6%) | 295 (7.2%) |
| $150,000 or more | 1,064 (39.5%) | 826 (20.2%) |
| Total | 2,697 (100.0%) | 4,082 (100.0%) |
Property Value to Household Income Ratio in Palm Valley
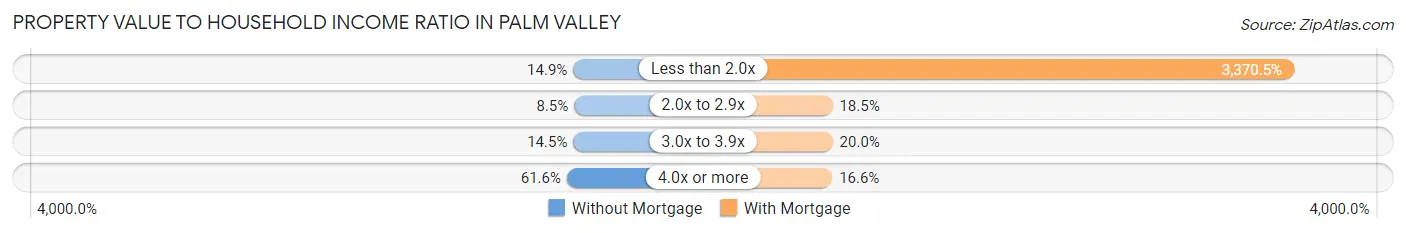
| Value-to-Income Ratio | Without Mortgage | With Mortgage |
| Less than 2.0x | 402 (14.9%) | 137,583 (3,370.5%) |
| 2.0x to 2.9x | 230 (8.5%) | 755 (18.5%) |
| 3.0x to 3.9x | 390 (14.5%) | 815 (20.0%) |
| 4.0x or more | 1,660 (61.6%) | 677 (16.6%) |
| Total | 2,697 (100.0%) | 4,082 (100.0%) |
Real Estate Taxes by Mortgage Status in Palm Valley
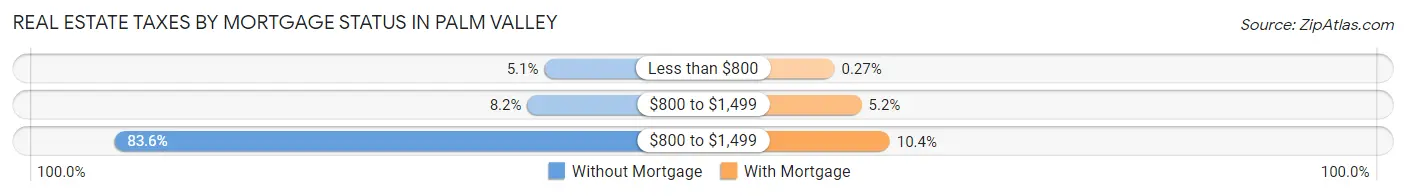
| Property Taxes | Without Mortgage | With Mortgage |
| Less than $800 | 137 (5.1%) | 11 (0.3%) |
| $800 to $1,499 | 221 (8.2%) | 213 (5.2%) |
| $800 to $1,499 | 2,255 (83.6%) | 423 (10.4%) |
| Total | 2,697 (100.0%) | 4,082 (100.0%) |
Health & Disability in Palm Valley
Health Insurance Coverage by Age in Palm Valley
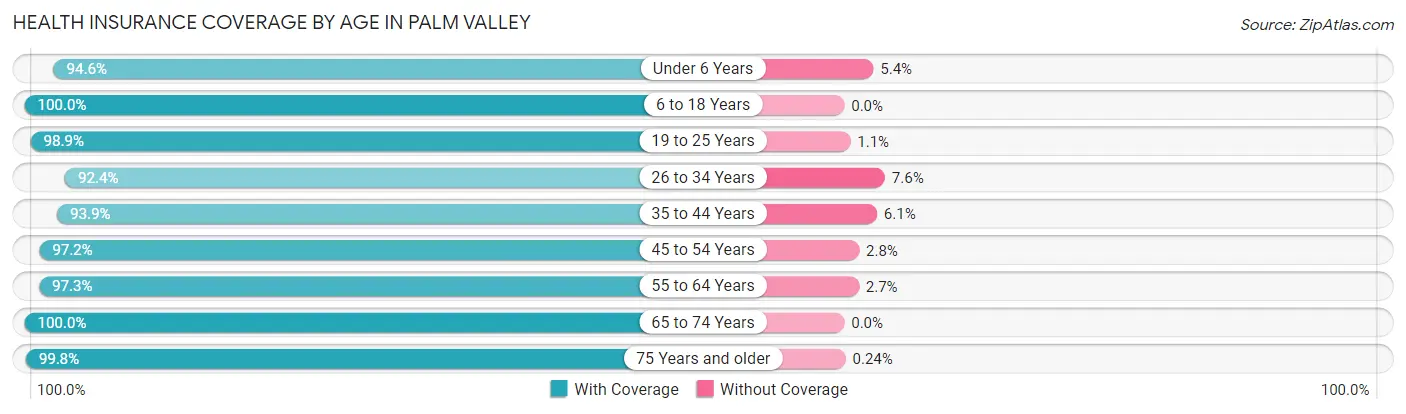
| Age Bracket | With Coverage | Without Coverage |
| Under 6 Years | 681 (94.6%) | 39 (5.4%) |
| 6 to 18 Years | 3,283 (100.0%) | 0 (0.0%) |
| 19 to 25 Years | 966 (98.9%) | 11 (1.1%) |
| 26 to 34 Years | 1,648 (92.4%) | 135 (7.6%) |
| 35 to 44 Years | 1,515 (93.9%) | 98 (6.1%) |
| 45 to 54 Years | 2,645 (97.2%) | 75 (2.8%) |
| 55 to 64 Years | 3,123 (97.3%) | 87 (2.7%) |
| 65 to 74 Years | 3,311 (100.0%) | 0 (0.0%) |
| 75 Years and older | 2,056 (99.8%) | 5 (0.2%) |
| Total | 19,228 (97.7%) | 450 (2.3%) |
Health Insurance Coverage by Citizenship Status in Palm Valley
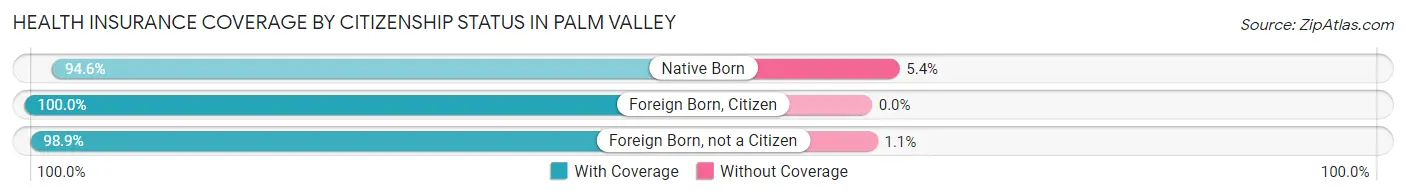
| Citizenship Status | With Coverage | Without Coverage |
| Native Born | 681 (94.6%) | 39 (5.4%) |
| Foreign Born, Citizen | 3,283 (100.0%) | 0 (0.0%) |
| Foreign Born, not a Citizen | 966 (98.9%) | 11 (1.1%) |
Health Insurance Coverage by Household Income in Palm Valley
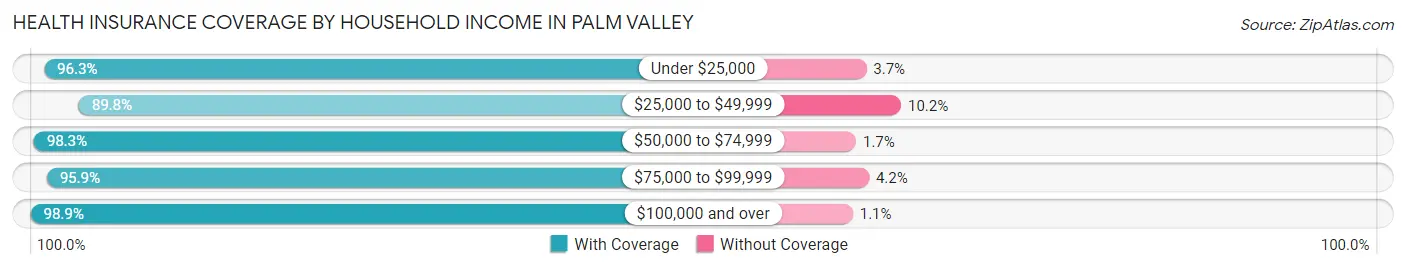
| Household Income | With Coverage | Without Coverage |
| Under $25,000 | 682 (96.3%) | 26 (3.7%) |
| $25,000 to $49,999 | 1,494 (89.8%) | 169 (10.2%) |
| $50,000 to $74,999 | 2,730 (98.3%) | 48 (1.7%) |
| $75,000 to $99,999 | 1,408 (95.9%) | 61 (4.2%) |
| $100,000 and over | 12,914 (98.9%) | 146 (1.1%) |
Public vs Private Health Insurance Coverage by Age in Palm Valley
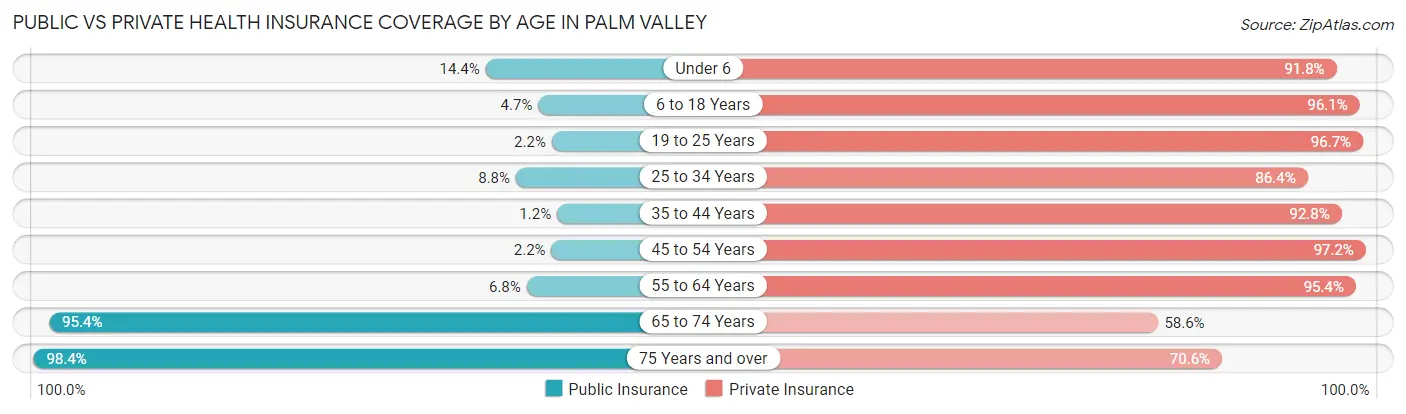
| Age Bracket | Public Insurance | Private Insurance |
| Under 6 | 104 (14.4%) | 661 (91.8%) |
| 6 to 18 Years | 153 (4.7%) | 3,155 (96.1%) |
| 19 to 25 Years | 21 (2.1%) | 945 (96.7%) |
| 25 to 34 Years | 157 (8.8%) | 1,541 (86.4%) |
| 35 to 44 Years | 19 (1.2%) | 1,496 (92.7%) |
| 45 to 54 Years | 60 (2.2%) | 2,645 (97.2%) |
| 55 to 64 Years | 219 (6.8%) | 3,062 (95.4%) |
| 65 to 74 Years | 3,160 (95.4%) | 1,940 (58.6%) |
| 75 Years and over | 2,027 (98.4%) | 1,454 (70.6%) |
| Total | 5,920 (30.1%) | 16,899 (85.9%) |
Disability Status by Sex by Age in Palm Valley
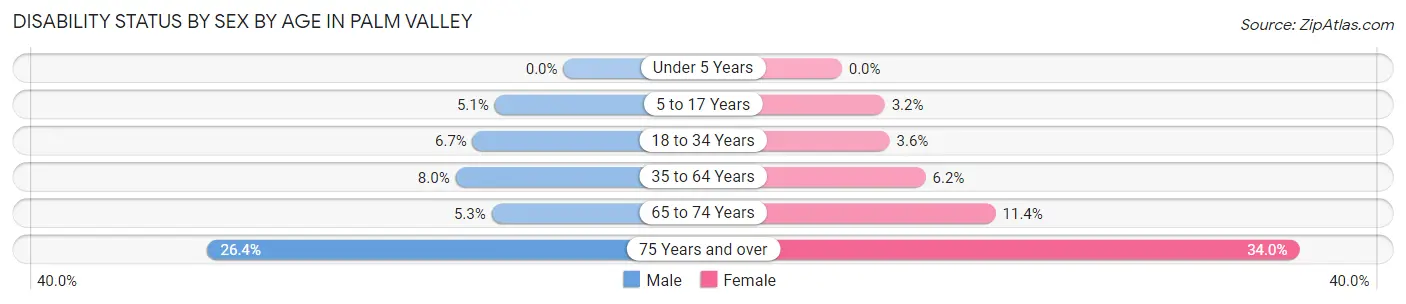
| Age Bracket | Male | Female |
| Under 5 Years | 0 (0.0%) | 0 (0.0%) |
| 5 to 17 Years | 88 (5.1%) | 46 (3.2%) |
| 18 to 34 Years | 96 (6.7%) | 56 (3.5%) |
| 35 to 64 Years | 290 (8.0%) | 244 (6.2%) |
| 65 to 74 Years | 77 (5.3%) | 213 (11.4%) |
| 75 Years and over | 262 (26.4%) | 363 (34.0%) |
Disability Class by Sex by Age in Palm Valley
Disability Class: Hearing Difficulty
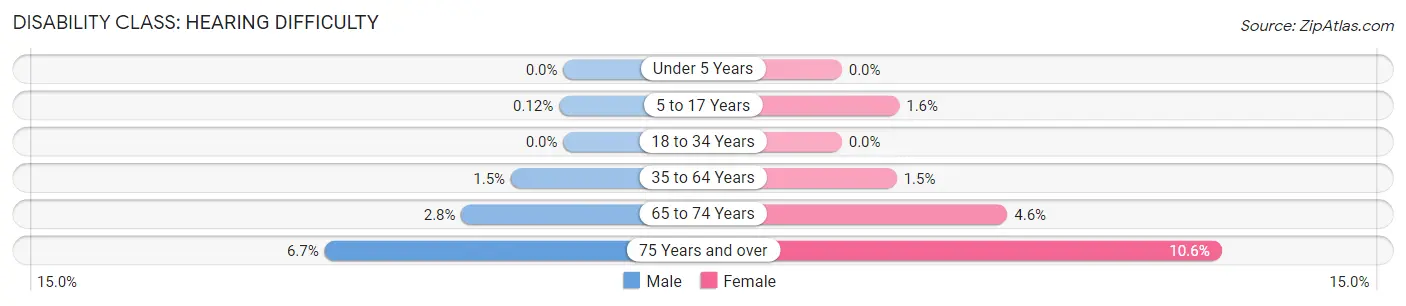
| Age Bracket | Male | Female |
| Under 5 Years | 0 (0.0%) | 0 (0.0%) |
| 5 to 17 Years | 2 (0.1%) | 23 (1.6%) |
| 18 to 34 Years | 0 (0.0%) | 0 (0.0%) |
| 35 to 64 Years | 53 (1.5%) | 60 (1.5%) |
| 65 to 74 Years | 41 (2.8%) | 86 (4.6%) |
| 75 Years and over | 66 (6.7%) | 113 (10.6%) |
Disability Class: Vision Difficulty
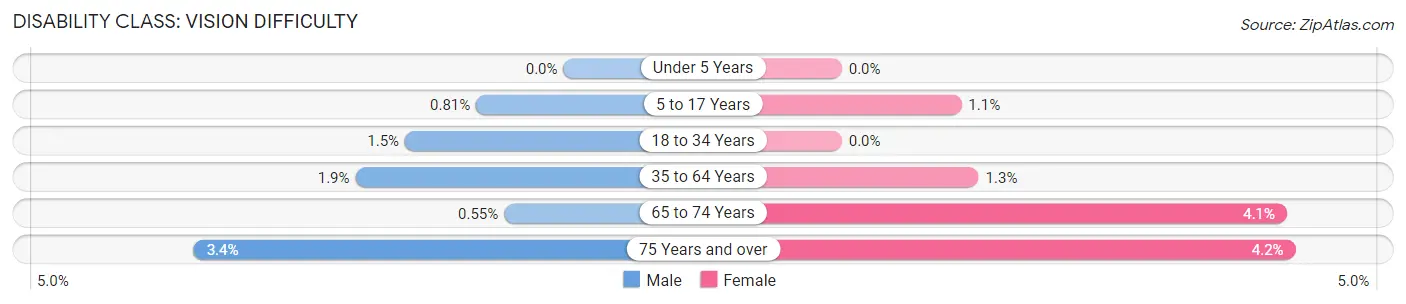
| Age Bracket | Male | Female |
| Under 5 Years | 0 (0.0%) | 0 (0.0%) |
| 5 to 17 Years | 14 (0.8%) | 16 (1.1%) |
| 18 to 34 Years | 21 (1.5%) | 0 (0.0%) |
| 35 to 64 Years | 70 (1.9%) | 50 (1.3%) |
| 65 to 74 Years | 8 (0.5%) | 77 (4.1%) |
| 75 Years and over | 34 (3.4%) | 45 (4.2%) |
Disability Class: Cognitive Difficulty
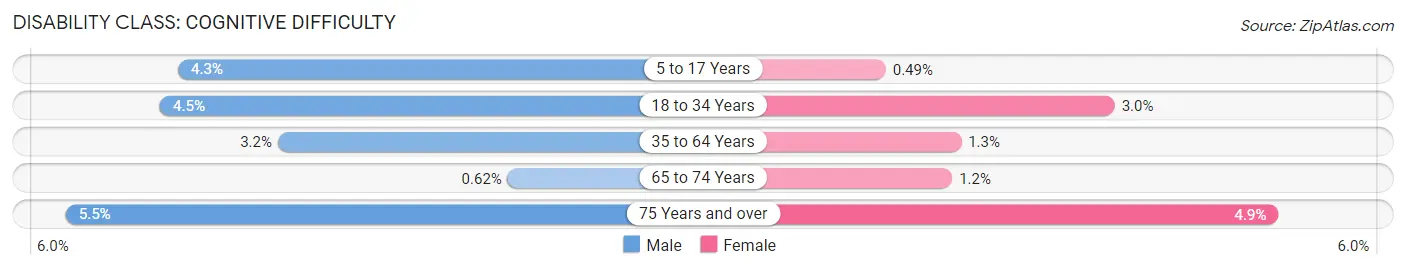
| Age Bracket | Male | Female |
| 5 to 17 Years | 74 (4.3%) | 7 (0.5%) |
| 18 to 34 Years | 64 (4.5%) | 48 (3.0%) |
| 35 to 64 Years | 115 (3.2%) | 52 (1.3%) |
| 65 to 74 Years | 9 (0.6%) | 23 (1.2%) |
| 75 Years and over | 55 (5.5%) | 52 (4.9%) |
Disability Class: Ambulatory Difficulty
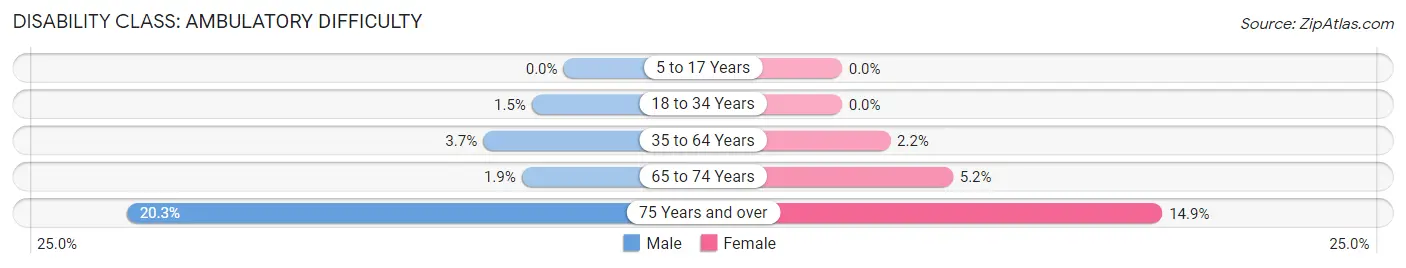
| Age Bracket | Male | Female |
| 5 to 17 Years | 0 (0.0%) | 0 (0.0%) |
| 18 to 34 Years | 21 (1.5%) | 0 (0.0%) |
| 35 to 64 Years | 135 (3.7%) | 88 (2.2%) |
| 65 to 74 Years | 28 (1.9%) | 96 (5.1%) |
| 75 Years and over | 201 (20.3%) | 159 (14.9%) |
Disability Class: Self-Care Difficulty
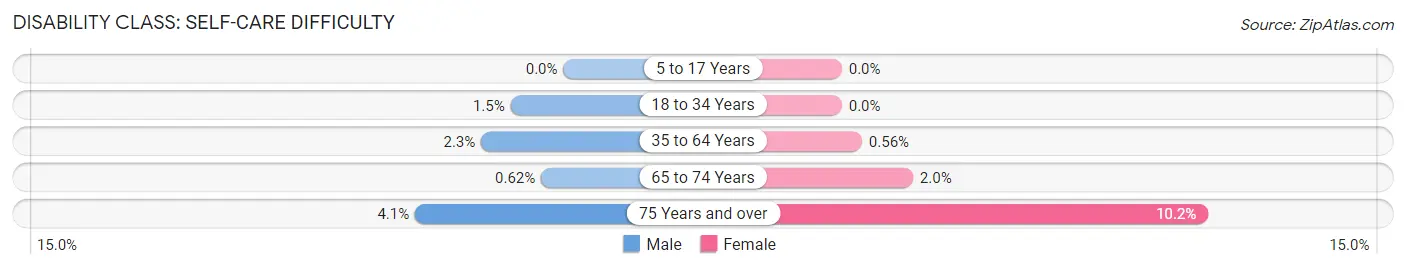
| Age Bracket | Male | Female |
| 5 to 17 Years | 0 (0.0%) | 0 (0.0%) |
| 18 to 34 Years | 21 (1.5%) | 0 (0.0%) |
| 35 to 64 Years | 83 (2.3%) | 22 (0.6%) |
| 65 to 74 Years | 9 (0.6%) | 37 (2.0%) |
| 75 Years and over | 41 (4.1%) | 109 (10.2%) |
Technology Access in Palm Valley
Computing Device Access in Palm Valley
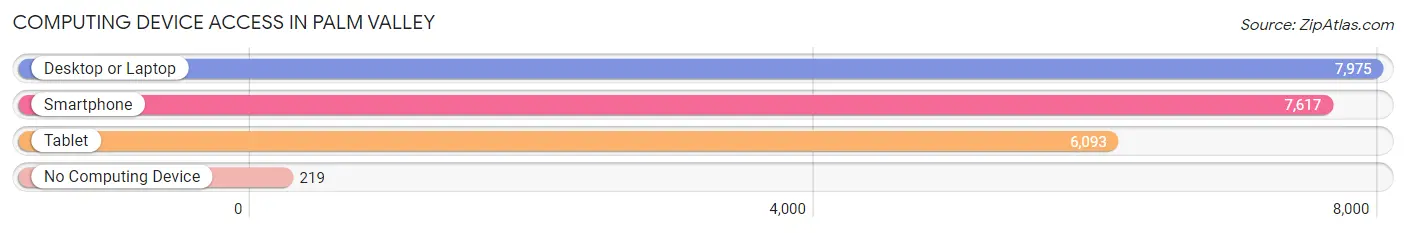
| Device Type | # Households | % Households |
| Desktop or Laptop | 7,975 | 95.1% |
| Smartphone | 7,617 | 90.8% |
| Tablet | 6,093 | 72.7% |
| No Computing Device | 219 | 2.6% |
| Total | 8,387 | 100.0% |
Internet Access in Palm Valley
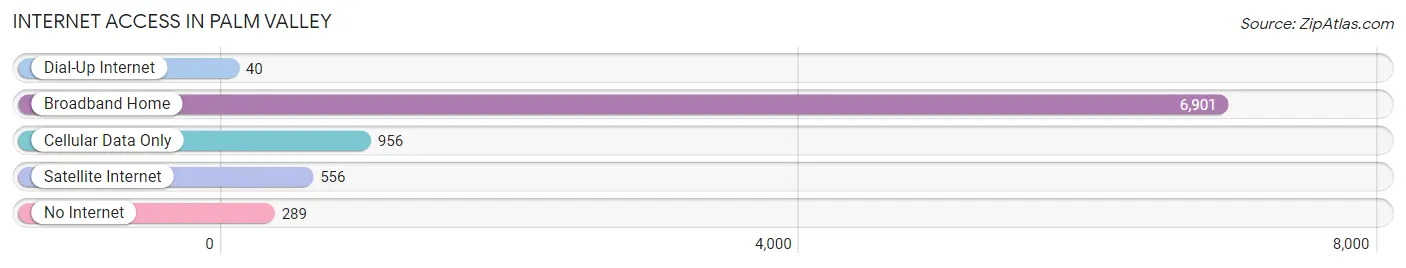
| Internet Type | # Households | % Households |
| Dial-Up Internet | 40 | 0.5% |
| Broadband Home | 6,901 | 82.3% |
| Cellular Data Only | 956 | 11.4% |
| Satellite Internet | 556 | 6.6% |
| No Internet | 289 | 3.5% |
| Total | 8,387 | 100.0% |
Palm Valley Summary
Palm Valley is a census-designated place (CDP) located in St. Johns County, Florida, United States. It is located on the Intracoastal Waterway, just south of Ponte Vedra Beach. As of the 2010 census, the population of Palm Valley was 8,451.
Geography
Palm Valley is located at 30°10'25" North, 81°22'17" West (30.173611, -81.371389). It is bordered by the Intracoastal Waterway to the east, Ponte Vedra Beach to the north, and Nocatee to the south.
The total area of Palm Valley is 8.3 square miles, of which 8.2 square miles is land and 0.1 square miles is water.
History
Palm Valley was originally inhabited by the Timucua Indians. The area was first settled by Europeans in the late 1700s, when it was part of the Spanish colony of East Florida. The area was later part of the Second Spanish Period, when it was part of the United States.
In the early 1900s, the area was developed as a resort community. The area was known as "Palm Valley Beach" and was a popular destination for vacationers.
In the 1950s, the area began to be developed as a residential community. The area was incorporated as the Town of Palm Valley in 1959.
Economy
The economy of Palm Valley is largely based on tourism and real estate. The area is home to several resorts and golf courses, as well as a number of restaurants and retail stores.
The area is also home to several corporate headquarters, including the headquarters of the PGA Tour and the PGA of America.
Demographics
As of the 2010 census, the population of Palm Valley was 8,451. The racial makeup of the population was 87.3% White, 5.2% African American, 0.4% Native American, 2.2% Asian, 0.1% Pacific Islander, 2.2% from other races, and 2.7% from two or more races. Hispanic or Latino of any race were 8.3% of the population.
The median household income in Palm Valley was $76,945, and the median family income was $87,945. The per capita income was $37,945.
Conclusion
Palm Valley is a census-designated place located in St. Johns County, Florida. It is located on the Intracoastal Waterway, just south of Ponte Vedra Beach. The area was originally inhabited by the Timucua Indians and was later developed as a resort community in the early 1900s. The economy of Palm Valley is largely based on tourism and real estate. As of the 2010 census, the population of Palm Valley was 8,451. The median household income in Palm Valley was $76,945, and the median family income was $87,945.
Common Questions
What is Per Capita Income in Palm Valley?
Per Capita income in Palm Valley is $81,394.
What is the Median Family Income in Palm Valley?
Median Family Income in Palm Valley is $142,500.
What is the Median Household income in Palm Valley?
Median Household Income in Palm Valley is $118,245.
What is Income or Wage Gap in Palm Valley?
Income or Wage Gap in Palm Valley is 40.7%.
Women in Palm Valley earn 59.3 cents for every dollar earned by a man.
What is Inequality or Gini Index in Palm Valley?
Inequality or Gini Index in Palm Valley is 0.51.
What is the Total Population of Palm Valley?
Total Population of Palm Valley is 19,766.
What is the Total Male Population of Palm Valley?
Total Male Population of Palm Valley is 9,626.
What is the Total Female Population of Palm Valley?
Total Female Population of Palm Valley is 10,140.
What is the Ratio of Males per 100 Females in Palm Valley?
There are 94.93 Males per 100 Females in Palm Valley.
What is the Ratio of Females per 100 Males in Palm Valley?
There are 105.34 Females per 100 Males in Palm Valley.
What is the Median Population Age in Palm Valley?
Median Population Age in Palm Valley is 50.8 Years.
What is the Average Family Size in Palm Valley
Average Family Size in Palm Valley is 2.9 People.
What is the Average Household Size in Palm Valley
Average Household Size in Palm Valley is 2.4 People.
How Large is the Labor Force in Palm Valley?
There are 9,538 People in the Labor Forcein in Palm Valley.
What is the Percentage of People in the Labor Force in Palm Valley?
57.5% of People are in the Labor Force in Palm Valley.
What is the Unemployment Rate in Palm Valley?
Unemployment Rate in Palm Valley is 2.7%.