Southwest Ranches, FL Map & Demographics
Southwest Ranches Map
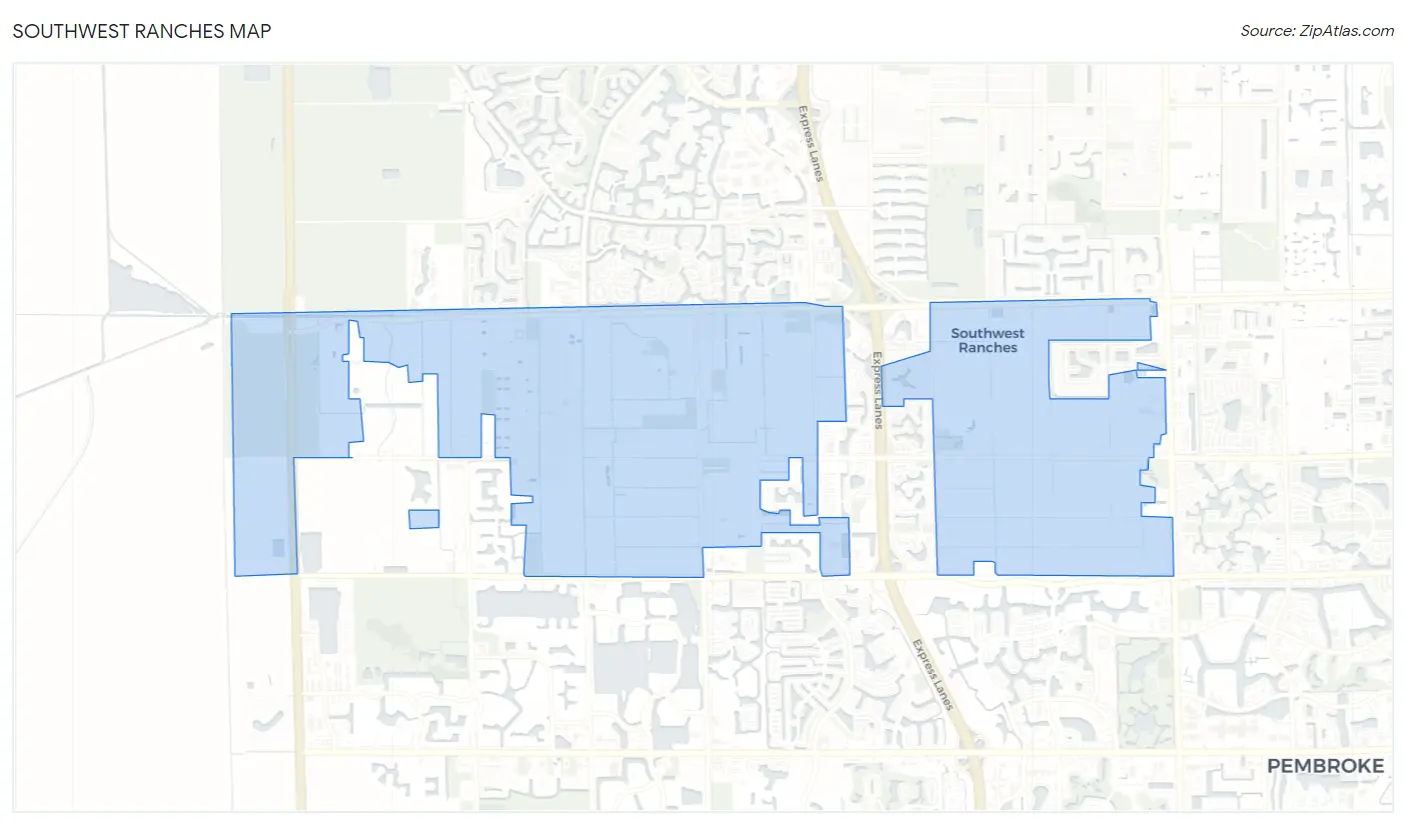
Southwest Ranches Overview
$65,046
PER CAPITA INCOME
$190,273
AVG FAMILY INCOME
$165,556
AVG HOUSEHOLD INCOME
33.3%
WAGE / INCOME GAP [ % ]
66.7¢/ $1
WAGE / INCOME GAP [ $ ]
0.46
INEQUALITY / GINI INDEX
7,589
TOTAL POPULATION
3,821
MALE POPULATION
3,768
FEMALE POPULATION
101.41
MALES / 100 FEMALES
98.61
FEMALES / 100 MALES
41.6
MEDIAN AGE
4.0
AVG FAMILY SIZE
3.7
AVG HOUSEHOLD SIZE
3,816
LABOR FORCE [ PEOPLE ]
62.7%
PERCENT IN LABOR FORCE
1.6%
UNEMPLOYMENT RATE
Income in Southwest Ranches
Income Overview in Southwest Ranches
Per Capita Income in Southwest Ranches is $65,046, while median incomes of families and households are $190,273 and $165,556 respectively.
| Characteristic | Number | Measure |
| Per Capita Income | 7,589 | $65,046 |
| Median Family Income | 1,745 | $190,273 |
| Mean Family Income | 1,745 | $250,985 |
| Median Household Income | 2,024 | $165,556 |
| Mean Household Income | 2,024 | $227,717 |
| Income Deficit | 1,745 | $0 |
| Wage / Income Gap (%) | 7,589 | 33.33% |
| Wage / Income Gap ($) | 7,589 | 66.67¢ per $1 |
| Gini / Inequality Index | 7,589 | 0.46 |
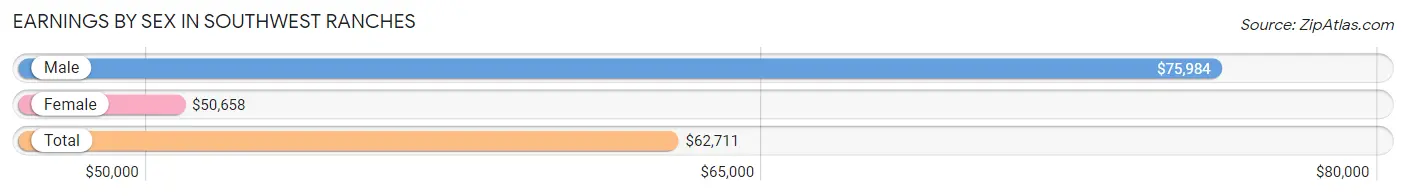
Earnings by Sex in Southwest Ranches
Average Earnings in Southwest Ranches are $62,711, $75,984 for men and $50,658 for women, a difference of 33.3%.
| Sex | Number | Average Earnings |
| Male | 2,175 (55.0%) | $75,984 |
| Female | 1,782 (45.0%) | $50,658 |
| Total | 3,957 (100.0%) | $62,711 |
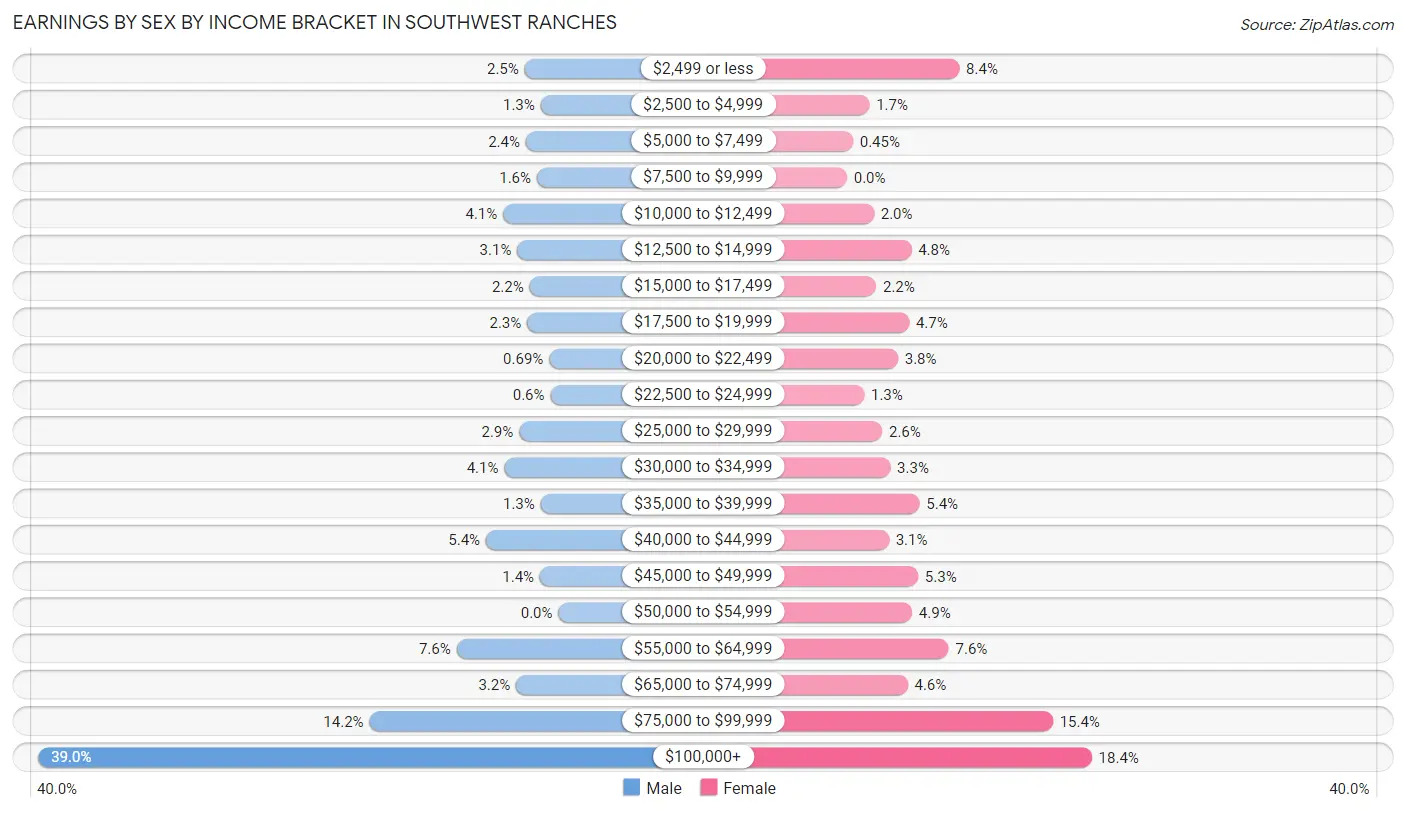
Earnings by Sex by Income Bracket in Southwest Ranches
The most common earnings brackets in Southwest Ranches are $100,000+ for men (848 | 39.0%) and $100,000+ for women (327 | 18.3%).
| Income | Male | Female |
| $2,499 or less | 55 (2.5%) | 150 (8.4%) |
| $2,500 to $4,999 | 29 (1.3%) | 30 (1.7%) |
| $5,000 to $7,499 | 53 (2.4%) | 8 (0.4%) |
| $7,500 to $9,999 | 35 (1.6%) | 0 (0.0%) |
| $10,000 to $12,499 | 90 (4.1%) | 36 (2.0%) |
| $12,500 to $14,999 | 67 (3.1%) | 86 (4.8%) |
| $15,000 to $17,499 | 47 (2.2%) | 39 (2.2%) |
| $17,500 to $19,999 | 51 (2.3%) | 83 (4.7%) |
| $20,000 to $22,499 | 15 (0.7%) | 68 (3.8%) |
| $22,500 to $24,999 | 13 (0.6%) | 23 (1.3%) |
| $25,000 to $29,999 | 64 (2.9%) | 47 (2.6%) |
| $30,000 to $34,999 | 88 (4.1%) | 58 (3.3%) |
| $35,000 to $39,999 | 29 (1.3%) | 97 (5.4%) |
| $40,000 to $44,999 | 118 (5.4%) | 56 (3.1%) |
| $45,000 to $49,999 | 30 (1.4%) | 95 (5.3%) |
| $50,000 to $54,999 | 0 (0.0%) | 87 (4.9%) |
| $55,000 to $64,999 | 166 (7.6%) | 136 (7.6%) |
| $65,000 to $74,999 | 69 (3.2%) | 81 (4.5%) |
| $75,000 to $99,999 | 308 (14.2%) | 275 (15.4%) |
| $100,000+ | 848 (39.0%) | 327 (18.3%) |
| Total | 2,175 (100.0%) | 1,782 (100.0%) |
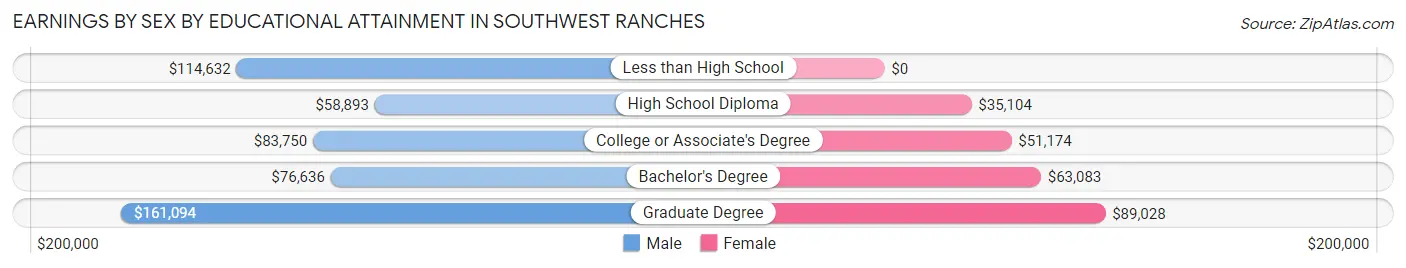
Earnings by Sex by Educational Attainment in Southwest Ranches
Average earnings in Southwest Ranches are $90,606 for men and $59,191 for women, a difference of 34.7%. Men with an educational attainment of graduate degree enjoy the highest average annual earnings of $161,094, while those with high school diploma education earn the least with $58,893. Women with an educational attainment of graduate degree earn the most with the average annual earnings of $89,028, while those with high school diploma education have the smallest earnings of $35,104.
| Educational Attainment | Male Income | Female Income |
| Less than High School | $114,632 | $0 |
| High School Diploma | $58,893 | $35,104 |
| College or Associate's Degree | $83,750 | $51,174 |
| Bachelor's Degree | $76,636 | $63,083 |
| Graduate Degree | $161,094 | $89,028 |
| Total | $90,606 | $59,191 |
Family Income in Southwest Ranches
Family Income Brackets in Southwest Ranches
According to the Southwest Ranches family income data, there are 804 families falling into the $200,000+ income range, which is the most common income bracket and makes up 46.1% of all families.
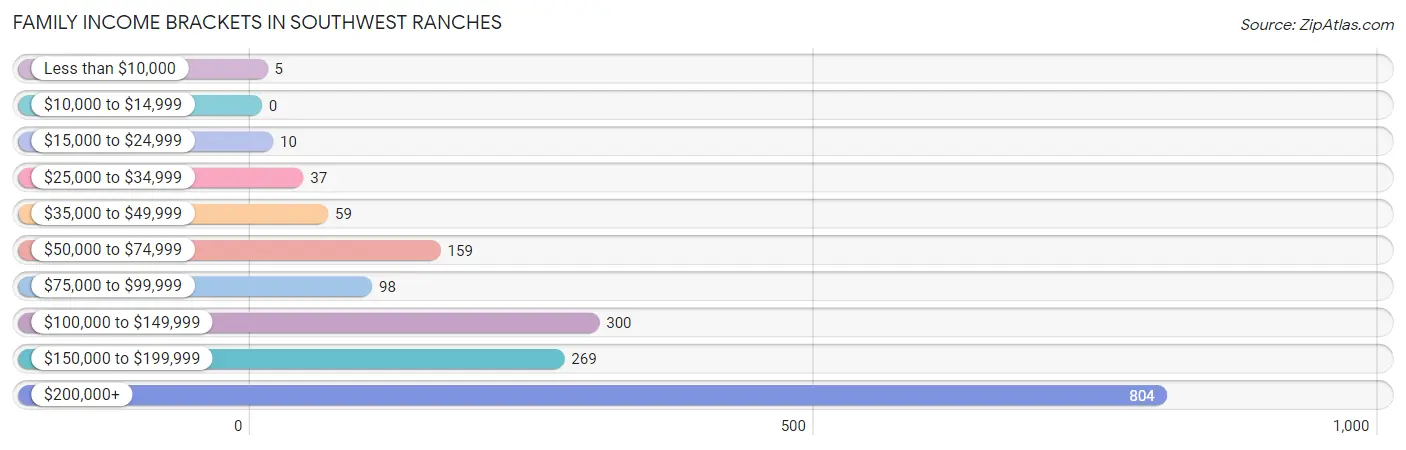
| Income Bracket | # Families | % Families |
| Less than $10,000 | 5 | 0.3% |
| $10,000 to $14,999 | 0 | 0.0% |
| $15,000 to $24,999 | 10 | 0.6% |
| $25,000 to $34,999 | 37 | 2.1% |
| $35,000 to $49,999 | 59 | 3.4% |
| $50,000 to $74,999 | 159 | 9.1% |
| $75,000 to $99,999 | 98 | 5.6% |
| $100,000 to $149,999 | 300 | 17.2% |
| $150,000 to $199,999 | 269 | 15.4% |
| $200,000+ | 804 | 46.1% |
Family Income by Famaliy Size in Southwest Ranches
4-person families (272 | 15.6%) account for the highest median family income in Southwest Ranches with $250,001 per family, while 2-person families (674 | 38.6%) have the highest median income of $70,135 per family member.
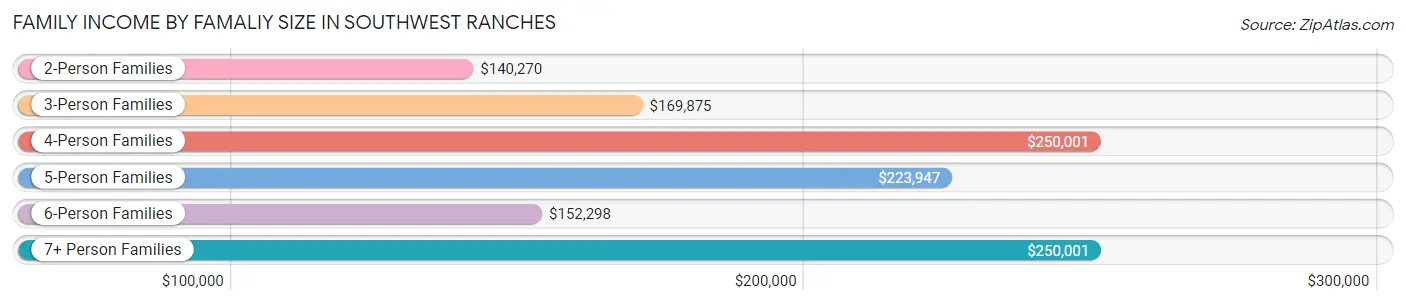
| Income Bracket | # Families | Median Income |
| 2-Person Families | 674 (38.6%) | $140,270 |
| 3-Person Families | 291 (16.7%) | $169,875 |
| 4-Person Families | 272 (15.6%) | $250,001 |
| 5-Person Families | 224 (12.8%) | $223,947 |
| 6-Person Families | 201 (11.5%) | $152,298 |
| 7+ Person Families | 83 (4.8%) | $250,001 |
| Total | 1,745 (100.0%) | $190,273 |
Family Income by Number of Earners in Southwest Ranches
The median family income in Southwest Ranches is $190,273, with families comprising 3+ earners (416) having the highest median family income of $233,182, while families with no earners (246) have the lowest median family income of $115,667, accounting for 23.8% and 14.1% of families, respectively.
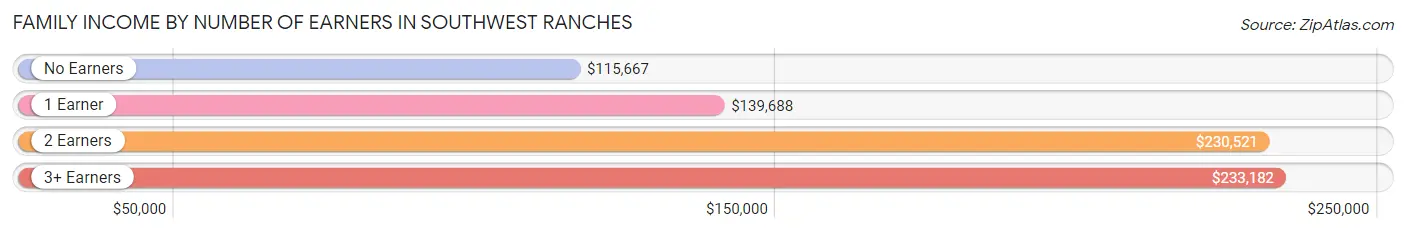
| Number of Earners | # Families | Median Income |
| No Earners | 246 (14.1%) | $115,667 |
| 1 Earner | 380 (21.8%) | $139,688 |
| 2 Earners | 703 (40.3%) | $230,521 |
| 3+ Earners | 416 (23.8%) | $233,182 |
| Total | 1,745 (100.0%) | $190,273 |
Household Income in Southwest Ranches
Household Income Brackets in Southwest Ranches
With 814 households falling in the category, the $200,000+ income range is the most frequent in Southwest Ranches, accounting for 40.2% of all households. In contrast, only 18 households (0.9%) fall into the $15,000 to $24,999 income bracket, making it the least populous group.
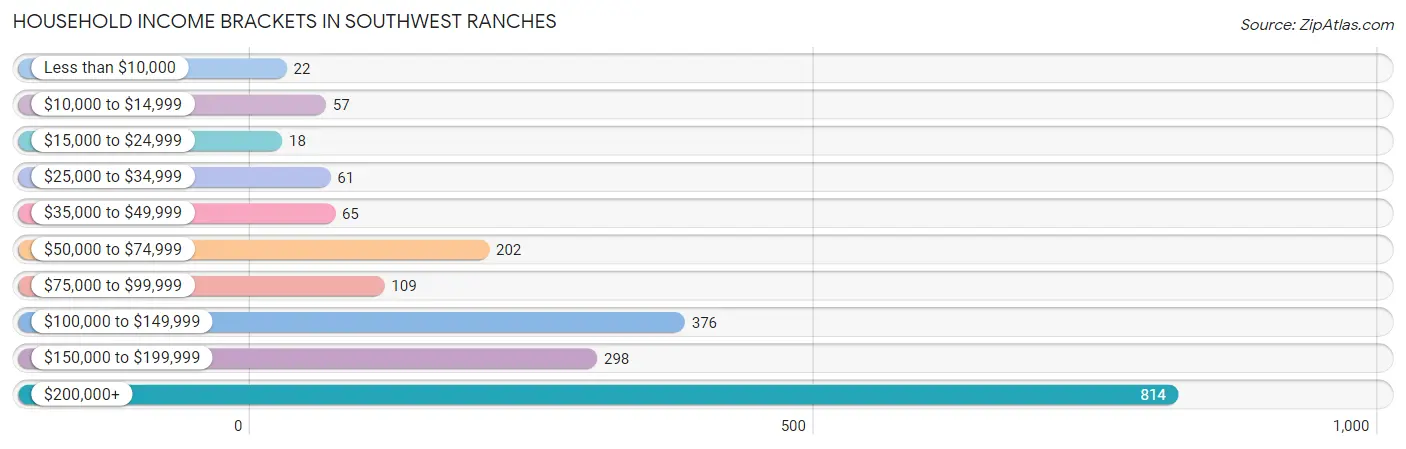
| Income Bracket | # Households | % Households |
| Less than $10,000 | 22 | 1.1% |
| $10,000 to $14,999 | 57 | 2.8% |
| $15,000 to $24,999 | 18 | 0.9% |
| $25,000 to $34,999 | 61 | 3.0% |
| $35,000 to $49,999 | 65 | 3.2% |
| $50,000 to $74,999 | 202 | 10.0% |
| $75,000 to $99,999 | 109 | 5.4% |
| $100,000 to $149,999 | 376 | 18.6% |
| $150,000 to $199,999 | 298 | 14.7% |
| $200,000+ | 814 | 40.2% |
Household Income by Householder Age in Southwest Ranches
The median household income in Southwest Ranches is $165,556, with the highest median household income of $205,455 found in the 45 to 64 years age bracket for the primary householder. A total of 988 households (48.8%) fall into this category.
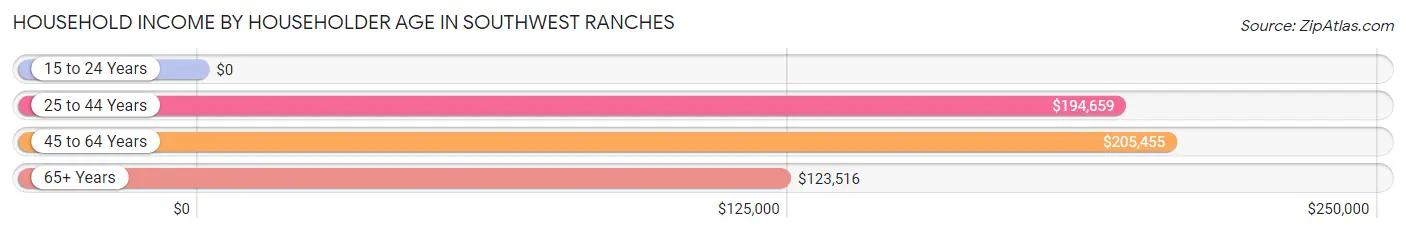
| Income Bracket | # Households | Median Income |
| 15 to 24 Years | 0 (0.0%) | $0 |
| 25 to 44 Years | 403 (19.9%) | $194,659 |
| 45 to 64 Years | 988 (48.8%) | $205,455 |
| 65+ Years | 633 (31.3%) | $123,516 |
| Total | 2,024 (100.0%) | $165,556 |
Poverty in Southwest Ranches
Income Below Poverty by Sex and Age in Southwest Ranches
With 6.0% poverty level for males and 3.2% for females among the residents of Southwest Ranches, 75 year old and over males and 25 to 34 year old females are the most vulnerable to poverty, with 71 males (17.0%) and 24 females (9.6%) in their respective age groups living below the poverty level.
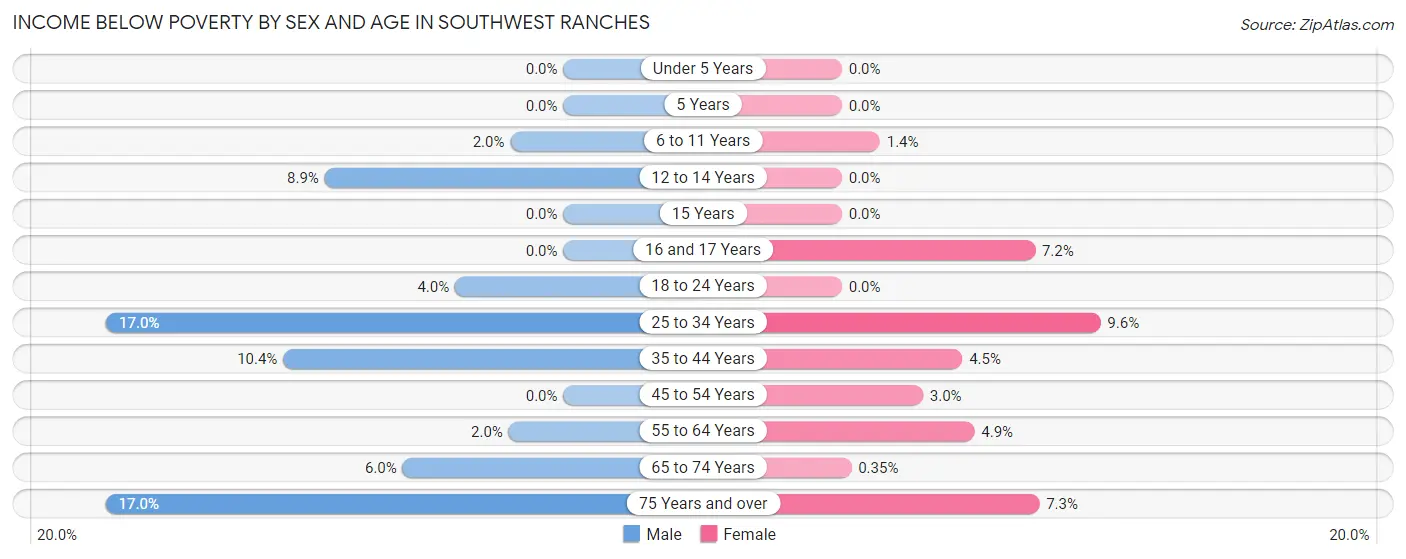
| Age Bracket | Male | Female |
| Under 5 Years | 0 (0.0%) | 0 (0.0%) |
| 5 Years | 0 (0.0%) | 0 (0.0%) |
| 6 to 11 Years | 7 (2.0%) | 7 (1.4%) |
| 12 to 14 Years | 14 (8.9%) | 0 (0.0%) |
| 15 Years | 0 (0.0%) | 0 (0.0%) |
| 16 and 17 Years | 0 (0.0%) | 16 (7.2%) |
| 18 to 24 Years | 17 (4.0%) | 0 (0.0%) |
| 25 to 34 Years | 47 (17.0%) | 24 (9.6%) |
| 35 to 44 Years | 42 (10.4%) | 27 (4.5%) |
| 45 to 54 Years | 0 (0.0%) | 13 (3.0%) |
| 55 to 64 Years | 12 (2.0%) | 22 (4.9%) |
| 65 to 74 Years | 21 (6.0%) | 2 (0.4%) |
| 75 Years and over | 71 (17.0%) | 11 (7.3%) |
| Total | 231 (6.0%) | 122 (3.2%) |
Income Above Poverty by Sex and Age in Southwest Ranches
According to the poverty statistics in Southwest Ranches, males aged under 5 years and females aged under 5 years are the age groups that are most secure financially, with 100.0% of males and 100.0% of females in these age groups living above the poverty line.
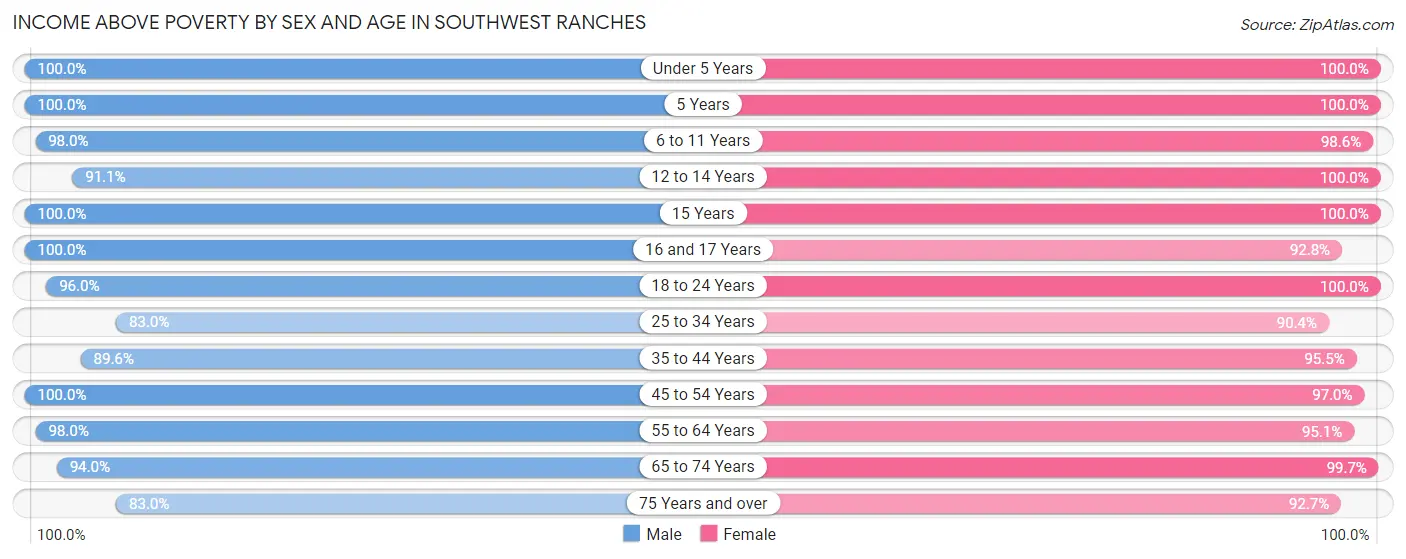
| Age Bracket | Male | Female |
| Under 5 Years | 129 (100.0%) | 82 (100.0%) |
| 5 Years | 51 (100.0%) | 43 (100.0%) |
| 6 to 11 Years | 348 (98.0%) | 490 (98.6%) |
| 12 to 14 Years | 144 (91.1%) | 100 (100.0%) |
| 15 Years | 35 (100.0%) | 53 (100.0%) |
| 16 and 17 Years | 139 (100.0%) | 207 (92.8%) |
| 18 to 24 Years | 406 (96.0%) | 305 (100.0%) |
| 25 to 34 Years | 230 (83.0%) | 226 (90.4%) |
| 35 to 44 Years | 362 (89.6%) | 577 (95.5%) |
| 45 to 54 Years | 488 (100.0%) | 419 (97.0%) |
| 55 to 64 Years | 580 (98.0%) | 425 (95.1%) |
| 65 to 74 Years | 331 (94.0%) | 577 (99.7%) |
| 75 Years and over | 347 (83.0%) | 139 (92.7%) |
| Total | 3,590 (94.0%) | 3,643 (96.8%) |
Income Below Poverty Among Married-Couple Families in Southwest Ranches
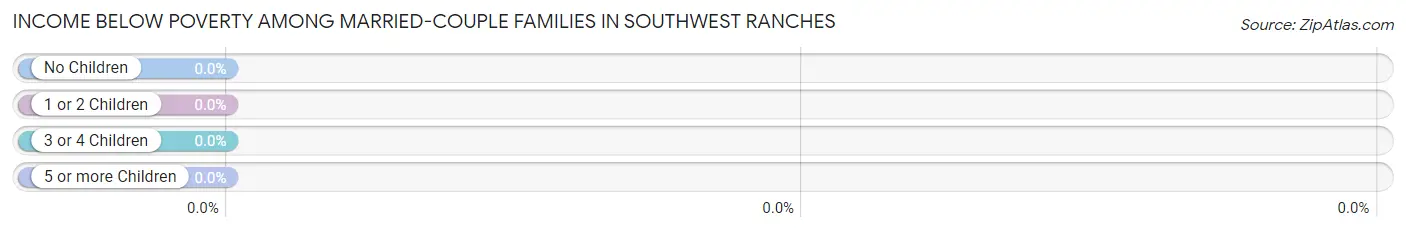
| Children | Above Poverty | Below Poverty |
| No Children | 903 (100.0%) | 0 (0.0%) |
| 1 or 2 Children | 442 (100.0%) | 0 (0.0%) |
| 3 or 4 Children | 198 (100.0%) | 0 (0.0%) |
| 5 or more Children | 40 (100.0%) | 0 (0.0%) |
| Total | 1,583 (100.0%) | 0 (0.0%) |
Income Below Poverty Among Single-Parent Households in Southwest Ranches
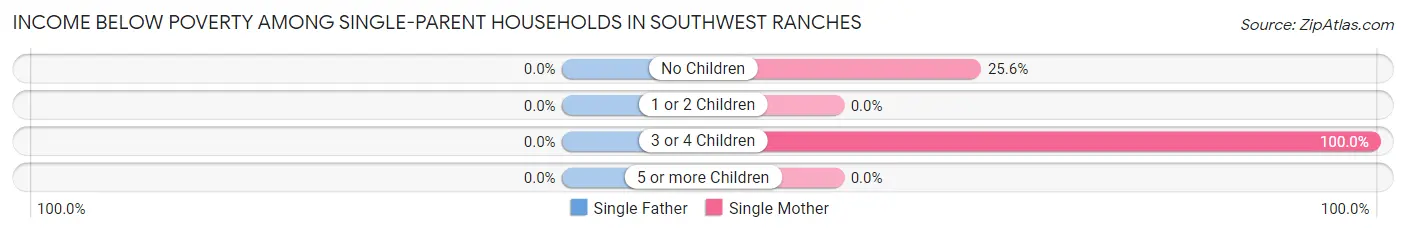
| Children | Single Father | Single Mother |
| No Children | 0 (0.0%) | 11 (25.6%) |
| 1 or 2 Children | 0 (0.0%) | 0 (0.0%) |
| 3 or 4 Children | 0 (0.0%) | 6 (100.0%) |
| 5 or more Children | 0 (0.0%) | 0 (0.0%) |
| Total | 0 (0.0%) | 17 (14.7%) |
Income Below Poverty Among Married-Couple vs Single-Parent Households in Southwest Ranches
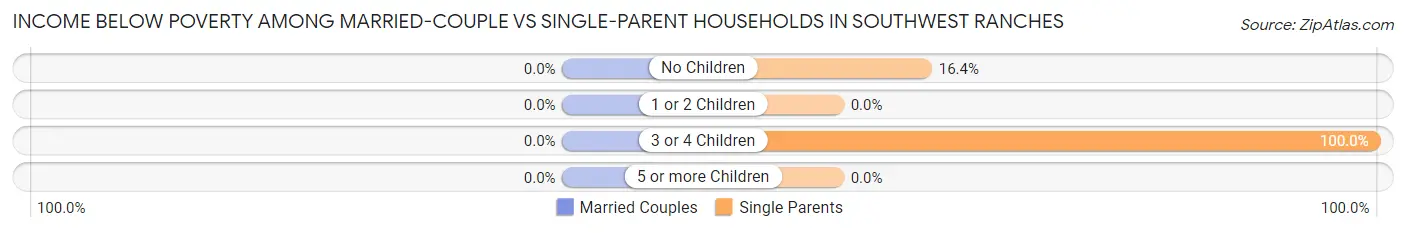
| Children | Married-Couple Families | Single-Parent Households |
| No Children | 0 (0.0%) | 11 (16.4%) |
| 1 or 2 Children | 0 (0.0%) | 0 (0.0%) |
| 3 or 4 Children | 0 (0.0%) | 6 (100.0%) |
| 5 or more Children | 0 (0.0%) | 0 (0.0%) |
| Total | 0 (0.0%) | 17 (10.5%) |
Race in Southwest Ranches
The most populous races in Southwest Ranches are White / Caucasian (5,145 | 67.8%), Hispanic or Latino (2,976 | 39.2%), and Two or more Races (1,586 | 20.9%).
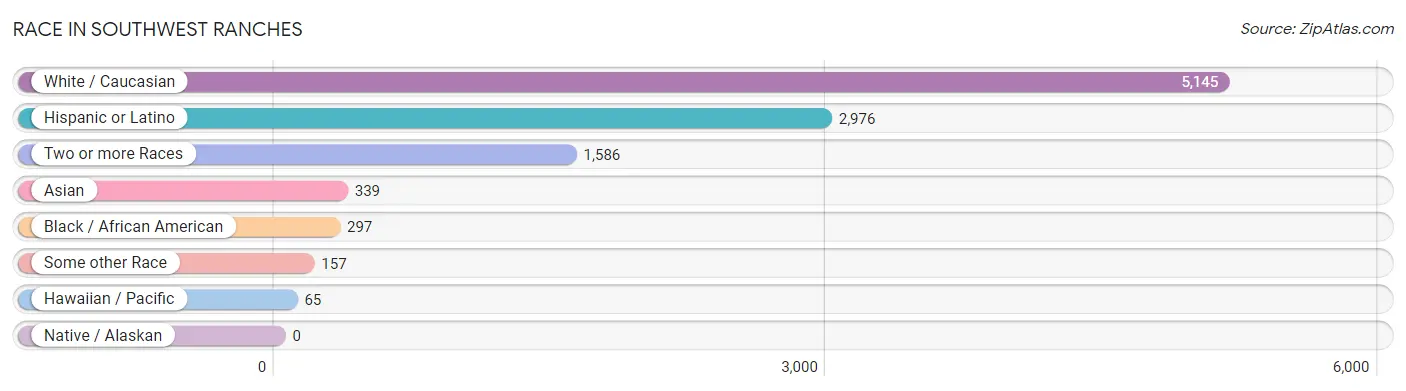
| Race | # Population | % Population |
| Asian | 339 | 4.5% |
| Black / African American | 297 | 3.9% |
| Hawaiian / Pacific | 65 | 0.9% |
| Hispanic or Latino | 2,976 | 39.2% |
| Native / Alaskan | 0 | 0.0% |
| White / Caucasian | 5,145 | 67.8% |
| Two or more Races | 1,586 | 20.9% |
| Some other Race | 157 | 2.1% |
| Total | 7,589 | 100.0% |
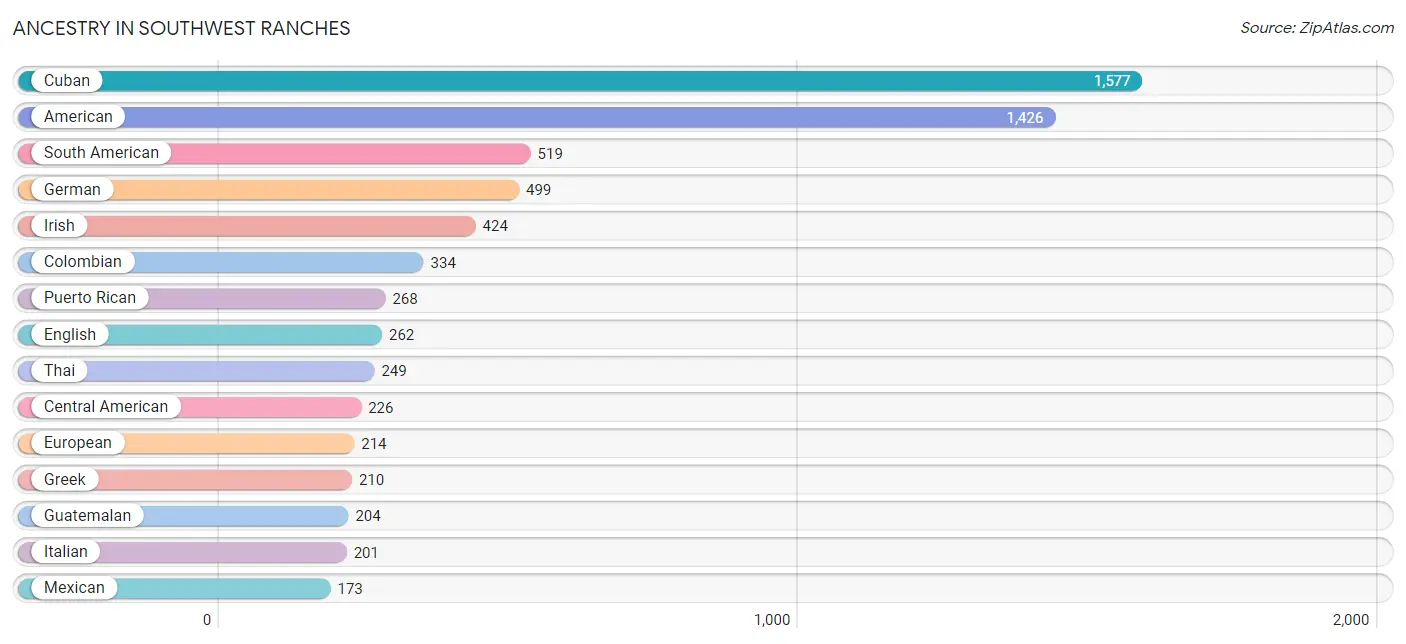
Ancestry in Southwest Ranches
The most populous ancestries reported in Southwest Ranches are Cuban (1,577 | 20.8%), American (1,426 | 18.8%), South American (519 | 6.8%), German (499 | 6.6%), and Irish (424 | 5.6%), together accounting for 58.6% of all Southwest Ranches residents.
| Ancestry | # Population | % Population |
| African | 49 | 0.6% |
| American | 1,426 | 18.8% |
| Arab | 104 | 1.4% |
| Argentinean | 2 | 0.0% |
| Austrian | 111 | 1.5% |
| Bolivian | 11 | 0.1% |
| Brazilian | 57 | 0.7% |
| British | 43 | 0.6% |
| Canadian | 38 | 0.5% |
| Central American | 226 | 3.0% |
| Chilean | 21 | 0.3% |
| Colombian | 334 | 4.4% |
| Costa Rican | 6 | 0.1% |
| Cuban | 1,577 | 20.8% |
| Danish | 20 | 0.3% |
| Dominican | 30 | 0.4% |
| Egyptian | 73 | 1.0% |
| English | 262 | 3.5% |
| European | 214 | 2.8% |
| French | 95 | 1.3% |
| French Canadian | 23 | 0.3% |
| German | 499 | 6.6% |
| Greek | 210 | 2.8% |
| Guamanian / Chamorro | 21 | 0.3% |
| Guatemalan | 204 | 2.7% |
| Guyanese | 33 | 0.4% |
| Haitian | 86 | 1.1% |
| Indian (Asian) | 98 | 1.3% |
| Irish | 424 | 5.6% |
| Italian | 201 | 2.6% |
| Jamaican | 90 | 1.2% |
| Korean | 93 | 1.2% |
| Lebanese | 19 | 0.3% |
| Lithuanian | 13 | 0.2% |
| Mexican | 173 | 2.3% |
| Mongolian | 27 | 0.4% |
| Native Hawaiian | 114 | 1.5% |
| Nicaraguan | 16 | 0.2% |
| Norwegian | 27 | 0.4% |
| Palestinian | 12 | 0.2% |
| Peruvian | 90 | 1.2% |
| Polish | 65 | 0.9% |
| Puerto Rican | 268 | 3.5% |
| Russian | 16 | 0.2% |
| Scandinavian | 19 | 0.3% |
| Scotch-Irish | 43 | 0.6% |
| Scottish | 112 | 1.5% |
| South American | 519 | 6.8% |
| Spaniard | 56 | 0.7% |
| Spanish | 63 | 0.8% |
| Sri Lankan | 40 | 0.5% |
| Subsaharan African | 49 | 0.6% |
| Swiss | 20 | 0.3% |
| Thai | 249 | 3.3% |
| Trinidadian and Tobagonian | 10 | 0.1% |
| Uruguayan | 14 | 0.2% |
| Venezuelan | 47 | 0.6% |
| Welsh | 7 | 0.1% | View All 58 Rows |
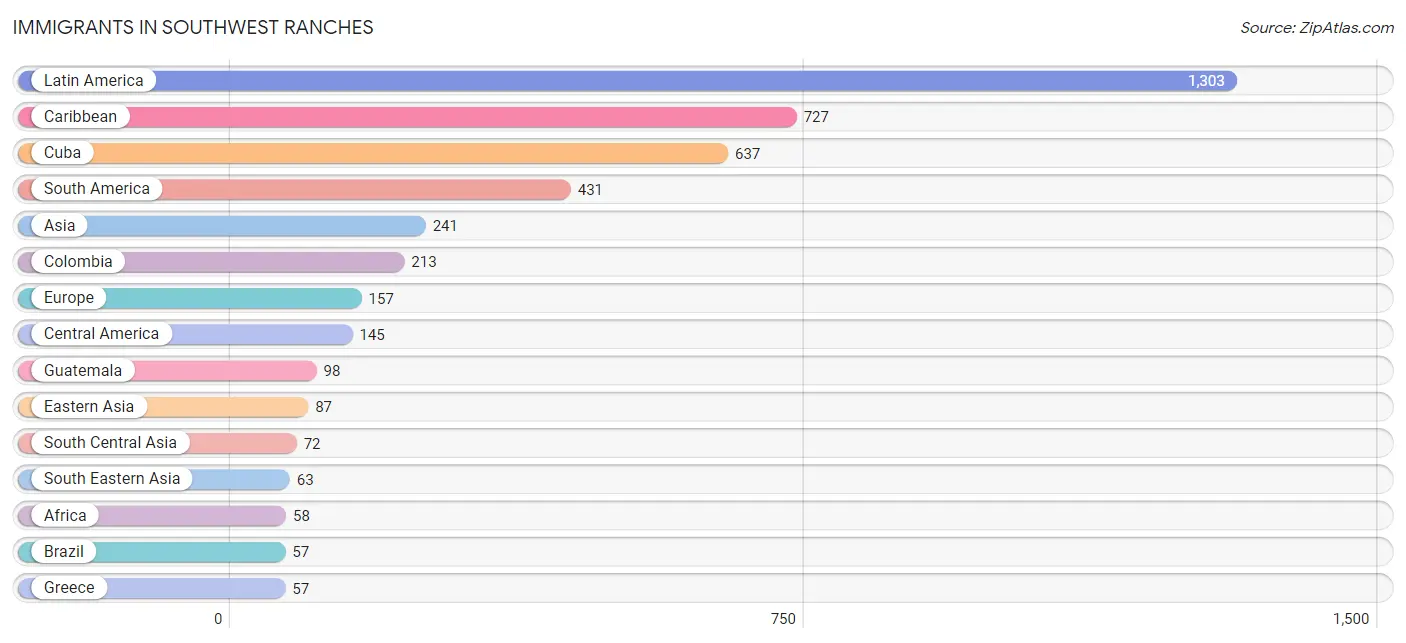
Immigrants in Southwest Ranches
The most numerous immigrant groups reported in Southwest Ranches came from Latin America (1,303 | 17.2%), Caribbean (727 | 9.6%), Cuba (637 | 8.4%), South America (431 | 5.7%), and Asia (241 | 3.2%), together accounting for 44.0% of all Southwest Ranches residents.
| Immigration Origin | # Population | % Population |
| Africa | 58 | 0.8% |
| Argentina | 2 | 0.0% |
| Asia | 241 | 3.2% |
| Austria | 7 | 0.1% |
| Brazil | 57 | 0.7% |
| Canada | 52 | 0.7% |
| Caribbean | 727 | 9.6% |
| Central America | 145 | 1.9% |
| Chile | 8 | 0.1% |
| China | 51 | 0.7% |
| Colombia | 213 | 2.8% |
| Costa Rica | 6 | 0.1% |
| Cuba | 637 | 8.4% |
| Eastern Africa | 32 | 0.4% |
| Eastern Asia | 87 | 1.1% |
| Eastern Europe | 4 | 0.1% |
| Egypt | 26 | 0.3% |
| England | 9 | 0.1% |
| Ethiopia | 32 | 0.4% |
| Europe | 157 | 2.1% |
| Germany | 34 | 0.4% |
| Greece | 57 | 0.7% |
| Guatemala | 98 | 1.3% |
| Guyana | 33 | 0.4% |
| Haiti | 24 | 0.3% |
| Hong Kong | 2 | 0.0% |
| India | 48 | 0.6% |
| Israel | 12 | 0.2% |
| Jamaica | 28 | 0.4% |
| Korea | 36 | 0.5% |
| Latin America | 1,303 | 17.2% |
| Malaysia | 27 | 0.4% |
| Mexico | 33 | 0.4% |
| Nicaragua | 8 | 0.1% |
| Northern Africa | 26 | 0.3% |
| Northern Europe | 55 | 0.7% |
| Pakistan | 24 | 0.3% |
| Peru | 57 | 0.7% |
| Philippines | 36 | 0.5% |
| Russia | 4 | 0.1% |
| South America | 431 | 5.7% |
| South Central Asia | 72 | 0.9% |
| South Eastern Asia | 63 | 0.8% |
| Southern Europe | 57 | 0.7% |
| Trinidad and Tobago | 38 | 0.5% |
| Uruguay | 14 | 0.2% |
| Venezuela | 47 | 0.6% |
| Western Asia | 12 | 0.2% |
| Western Europe | 41 | 0.5% | View All 49 Rows |
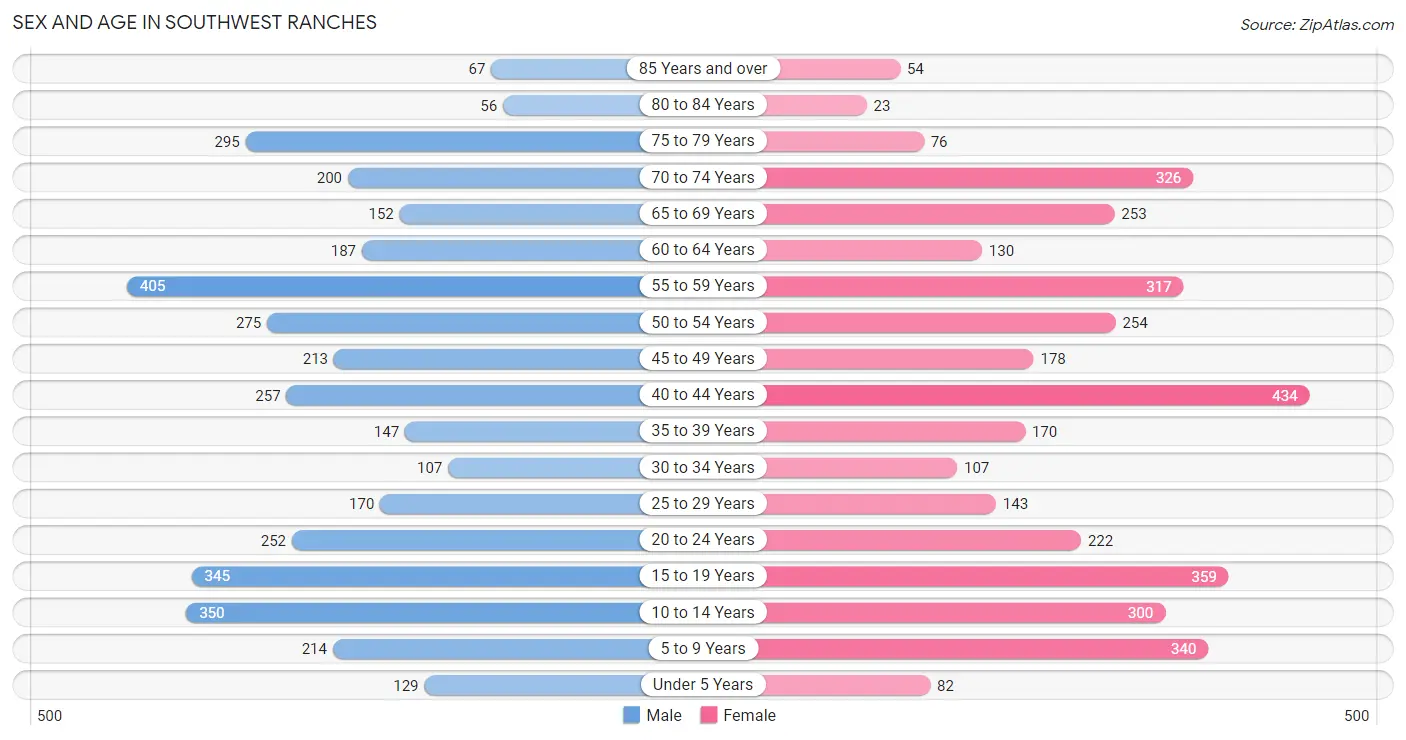
Sex and Age in Southwest Ranches
Sex and Age in Southwest Ranches
The most populous age groups in Southwest Ranches are 55 to 59 Years (405 | 10.6%) for men and 40 to 44 Years (434 | 11.5%) for women.
| Age Bracket | Male | Female |
| Under 5 Years | 129 (3.4%) | 82 (2.2%) |
| 5 to 9 Years | 214 (5.6%) | 340 (9.0%) |
| 10 to 14 Years | 350 (9.2%) | 300 (8.0%) |
| 15 to 19 Years | 345 (9.0%) | 359 (9.5%) |
| 20 to 24 Years | 252 (6.6%) | 222 (5.9%) |
| 25 to 29 Years | 170 (4.4%) | 143 (3.8%) |
| 30 to 34 Years | 107 (2.8%) | 107 (2.8%) |
| 35 to 39 Years | 147 (3.8%) | 170 (4.5%) |
| 40 to 44 Years | 257 (6.7%) | 434 (11.5%) |
| 45 to 49 Years | 213 (5.6%) | 178 (4.7%) |
| 50 to 54 Years | 275 (7.2%) | 254 (6.7%) |
| 55 to 59 Years | 405 (10.6%) | 317 (8.4%) |
| 60 to 64 Years | 187 (4.9%) | 130 (3.5%) |
| 65 to 69 Years | 152 (4.0%) | 253 (6.7%) |
| 70 to 74 Years | 200 (5.2%) | 326 (8.6%) |
| 75 to 79 Years | 295 (7.7%) | 76 (2.0%) |
| 80 to 84 Years | 56 (1.5%) | 23 (0.6%) |
| 85 Years and over | 67 (1.8%) | 54 (1.4%) |
| Total | 3,821 (100.0%) | 3,768 (100.0%) |
Families and Households in Southwest Ranches
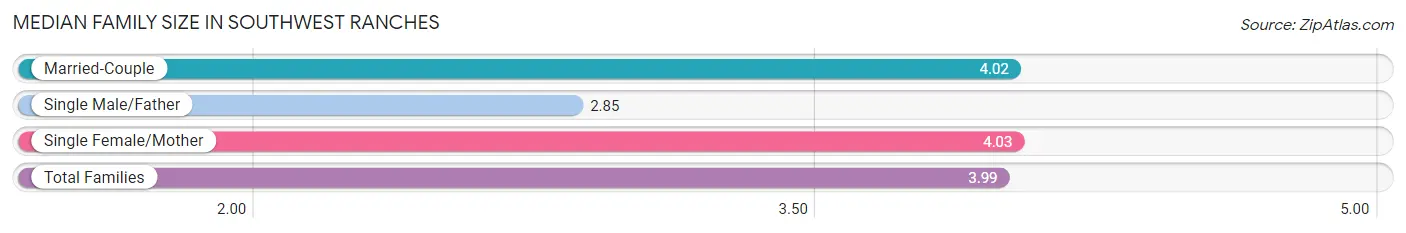
Median Family Size in Southwest Ranches
The median family size in Southwest Ranches is 3.99 persons per family, with single female/mother families (116 | 6.7%) accounting for the largest median family size of 4.03 persons per family. On the other hand, single male/father families (46 | 2.6%) represent the smallest median family size with 2.85 persons per family.
| Family Type | # Families | Family Size |
| Married-Couple | 1,583 (90.7%) | 4.02 |
| Single Male/Father | 46 (2.6%) | 2.85 |
| Single Female/Mother | 116 (6.7%) | 4.03 |
| Total Families | 1,745 (100.0%) | 3.99 |
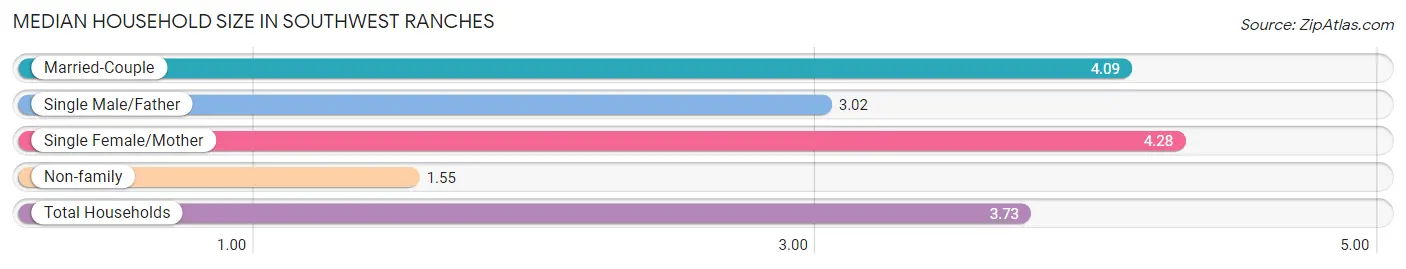
Median Household Size in Southwest Ranches
The median household size in Southwest Ranches is 3.73 persons per household, with single female/mother households (116 | 5.7%) accounting for the largest median household size of 4.28 persons per household. non-family households (279 | 13.8%) represent the smallest median household size with 1.55 persons per household.
| Household Type | # Households | Household Size |
| Married-Couple | 1,583 (78.2%) | 4.09 |
| Single Male/Father | 46 (2.3%) | 3.02 |
| Single Female/Mother | 116 (5.7%) | 4.28 |
| Non-family | 279 (13.8%) | 1.55 |
| Total Households | 2,024 (100.0%) | 3.73 |
Household Size by Marriage Status in Southwest Ranches
Out of a total of 2,024 households in Southwest Ranches, 1,745 (86.2%) are family households, while 279 (13.8%) are nonfamily households. The most numerous type of family households are 2-person households, comprising 666, and the most common type of nonfamily households are 1-person households, comprising 202.
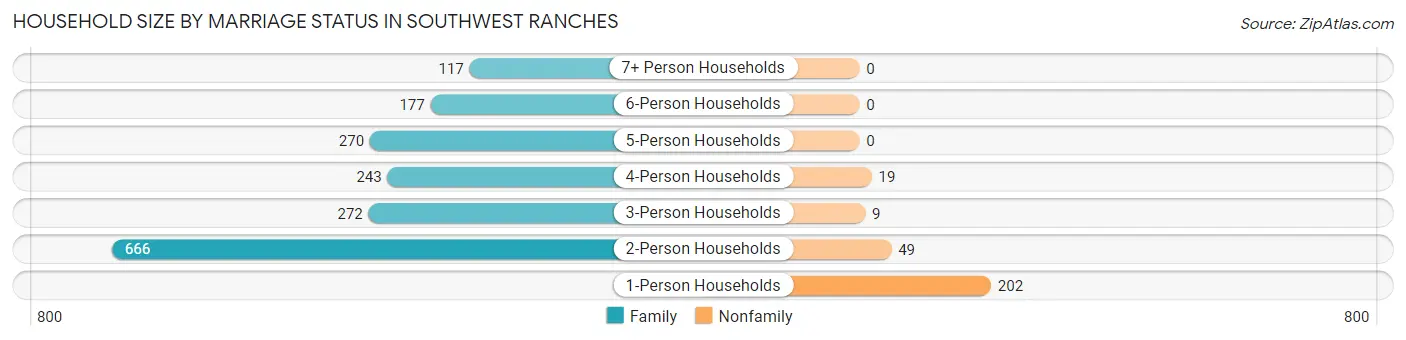
| Household Size | Family Households | Nonfamily Households |
| 1-Person Households | - | 202 (10.0%) |
| 2-Person Households | 666 (32.9%) | 49 (2.4%) |
| 3-Person Households | 272 (13.4%) | 9 (0.4%) |
| 4-Person Households | 243 (12.0%) | 19 (0.9%) |
| 5-Person Households | 270 (13.3%) | 0 (0.0%) |
| 6-Person Households | 177 (8.7%) | 0 (0.0%) |
| 7+ Person Households | 117 (5.8%) | 0 (0.0%) |
| Total | 1,745 (86.2%) | 279 (13.8%) |
Female Fertility in Southwest Ranches
Fertility by Age in Southwest Ranches
Average fertility rate in Southwest Ranches is 6.0 births per 1,000 women. Women in the age bracket of 35 to 50 years have the highest fertility rate with 12.0 births per 1,000 women. Women in the age bracket of 35 to 50 years acount for 100.0% of all women with births.
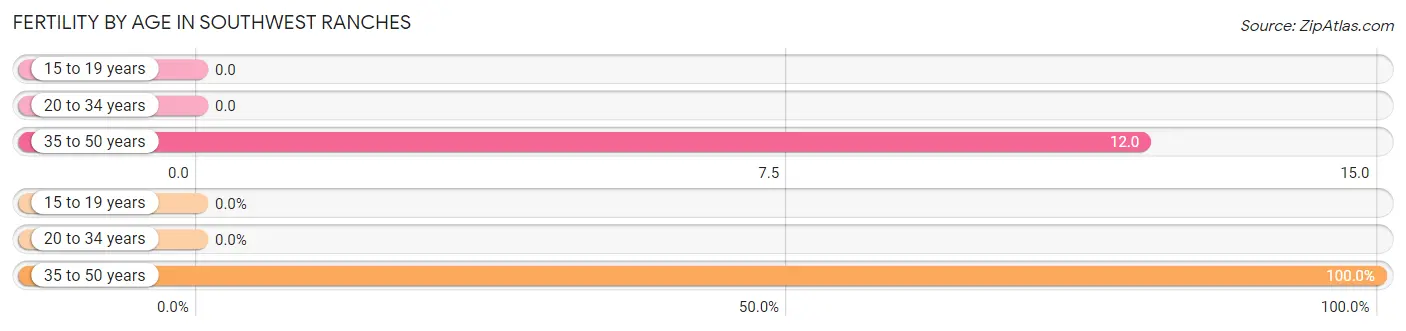
| Age Bracket | Women with Births | Births / 1,000 Women |
| 15 to 19 years | 0 (0.0%) | 0.0 |
| 20 to 34 years | 0 (0.0%) | 0.0 |
| 35 to 50 years | 10 (100.0%) | 12.0 |
| Total | 10 (100.0%) | 6.0 |
Fertility by Age by Marriage Status in Southwest Ranches
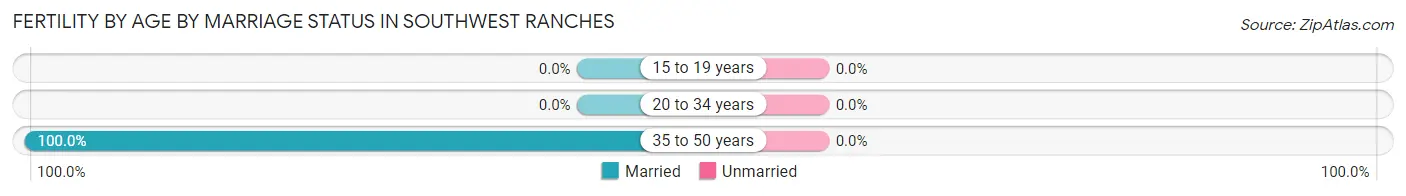
| Age Bracket | Married | Unmarried |
| 15 to 19 years | 0 (0.0%) | 0 (0.0%) |
| 20 to 34 years | 0 (0.0%) | 0 (0.0%) |
| 35 to 50 years | 10 (100.0%) | 0 (0.0%) |
| Total | 10 (100.0%) | 0 (0.0%) |
Fertility by Education in Southwest Ranches
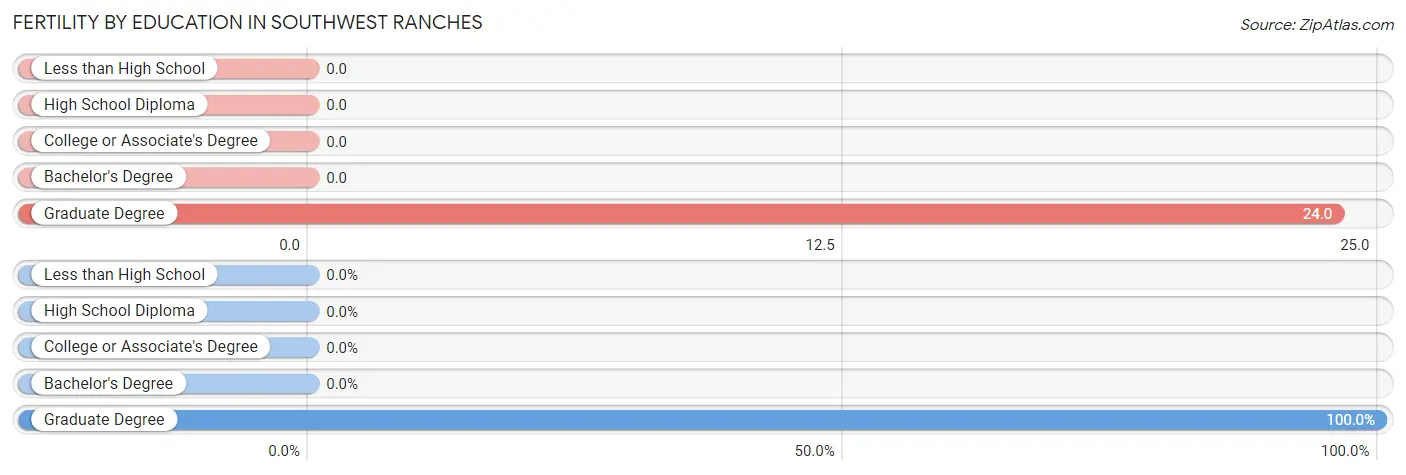
| Educational Attainment | Women with Births | Births / 1,000 Women |
| Less than High School | 0 (0.0%) | 0.0 |
| High School Diploma | 0 (0.0%) | 0.0 |
| College or Associate's Degree | 0 (0.0%) | 0.0 |
| Bachelor's Degree | 0 (0.0%) | 0.0 |
| Graduate Degree | 10 (100.0%) | 24.0 |
| Total | 10 (100.0%) | 6.0 |
Fertility by Education by Marriage Status in Southwest Ranches
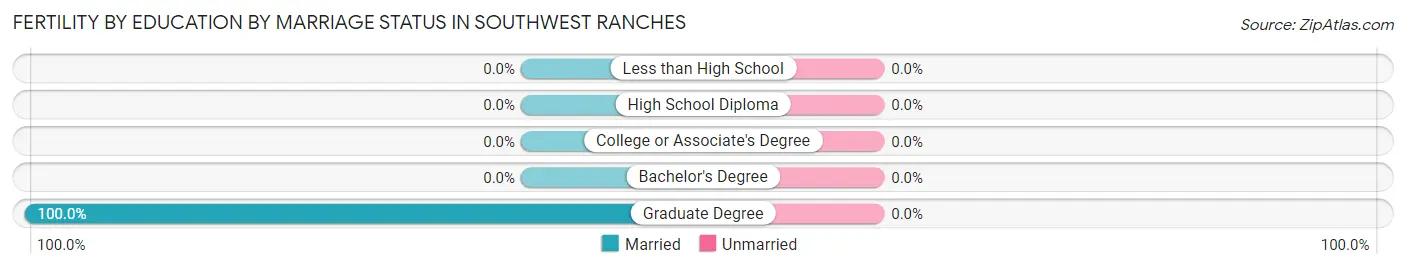
| Educational Attainment | Married | Unmarried |
| Less than High School | 0 (0.0%) | 0 (0.0%) |
| High School Diploma | 0 (0.0%) | 0 (0.0%) |
| College or Associate's Degree | 0 (0.0%) | 0 (0.0%) |
| Bachelor's Degree | 0 (0.0%) | 0 (0.0%) |
| Graduate Degree | 10 (100.0%) | 0 (0.0%) |
| Total | 10 (100.0%) | 0 (0.0%) |
Employment Characteristics in Southwest Ranches
Employment by Class of Employer in Southwest Ranches
Among the 3,738 employed individuals in Southwest Ranches, private company employees (2,167 | 58.0%), self-employed (incorporated) (953 | 25.5%), and local government employees (230 | 6.1%) make up the most common classes of employment.
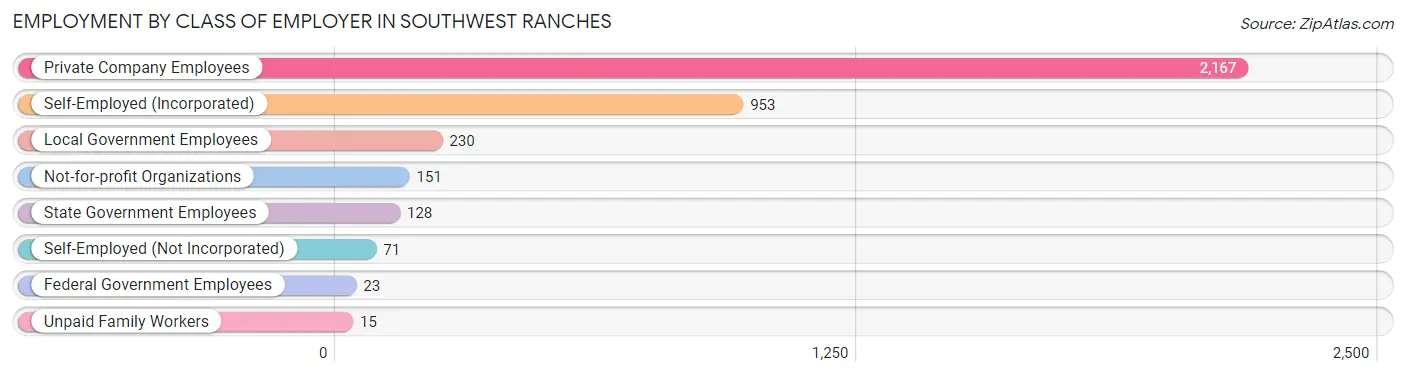
| Employer Class | # Employees | % Employees |
| Private Company Employees | 2,167 | 58.0% |
| Self-Employed (Incorporated) | 953 | 25.5% |
| Self-Employed (Not Incorporated) | 71 | 1.9% |
| Not-for-profit Organizations | 151 | 4.0% |
| Local Government Employees | 230 | 6.1% |
| State Government Employees | 128 | 3.4% |
| Federal Government Employees | 23 | 0.6% |
| Unpaid Family Workers | 15 | 0.4% |
| Total | 3,738 | 100.0% |
Employment Status by Age in Southwest Ranches
According to the labor force statistics for Southwest Ranches, out of the total population over 16 years of age (6,086), 62.7% or 3,816 individuals are in the labor force, with 1.6% or 61 of them unemployed. The age group with the highest labor force participation rate is 30 to 34 years, with 93.5% or 200 individuals in the labor force. Within the labor force, the 16 to 19 years age range has the highest percentage of unemployed individuals, with 16.3% or 38 of them being unemployed.
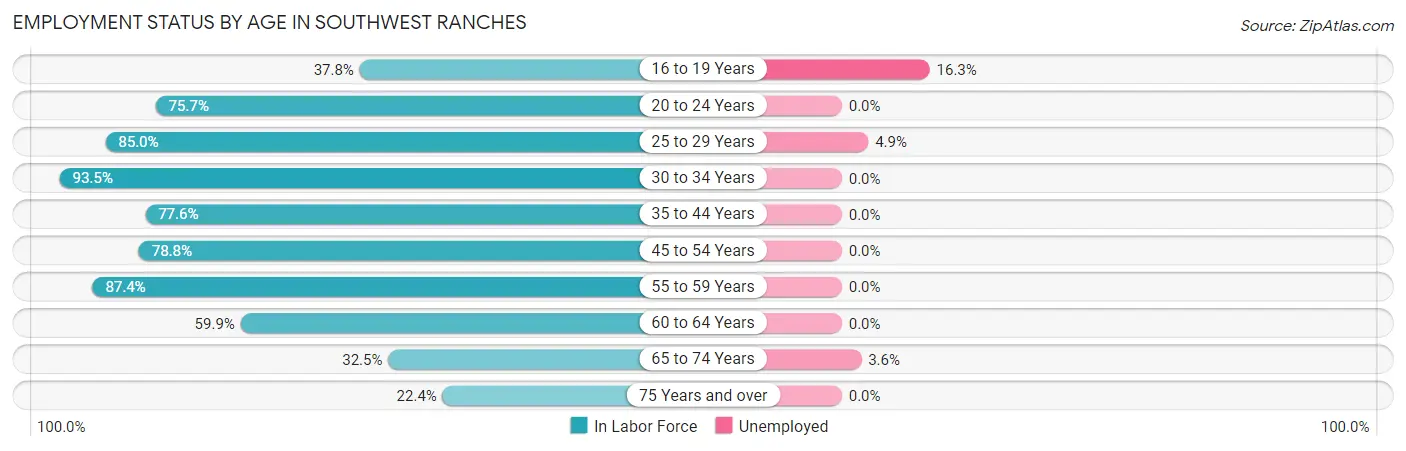
| Age Bracket | In Labor Force | Unemployed |
| 16 to 19 Years | 233 (37.8%) | 38 (16.3%) |
| 20 to 24 Years | 359 (75.7%) | 0 (0.0%) |
| 25 to 29 Years | 266 (85.0%) | 13 (4.9%) |
| 30 to 34 Years | 200 (93.5%) | 0 (0.0%) |
| 35 to 44 Years | 782 (77.6%) | 0 (0.0%) |
| 45 to 54 Years | 725 (78.8%) | 0 (0.0%) |
| 55 to 59 Years | 631 (87.4%) | 0 (0.0%) |
| 60 to 64 Years | 190 (59.9%) | 0 (0.0%) |
| 65 to 74 Years | 303 (32.5%) | 11 (3.6%) |
| 75 Years and over | 128 (22.4%) | 0 (0.0%) |
| Total | 3,816 (62.7%) | 61 (1.6%) |
Employment Status by Educational Attainment in Southwest Ranches
According to labor force statistics for Southwest Ranches, 80.0% of individuals (2,795) out of the total population between 25 and 64 years of age (3,494) are in the labor force, with 0.5% or 14 of them being unemployed. The group with the highest labor force participation rate are those with the educational attainment of bachelor's degree or higher, with 85.9% or 1,613 individuals in the labor force. Within the labor force, individuals with bachelor's degree or higher education have the highest percentage of unemployment, with 0.8% or 13 of them being unemployed.
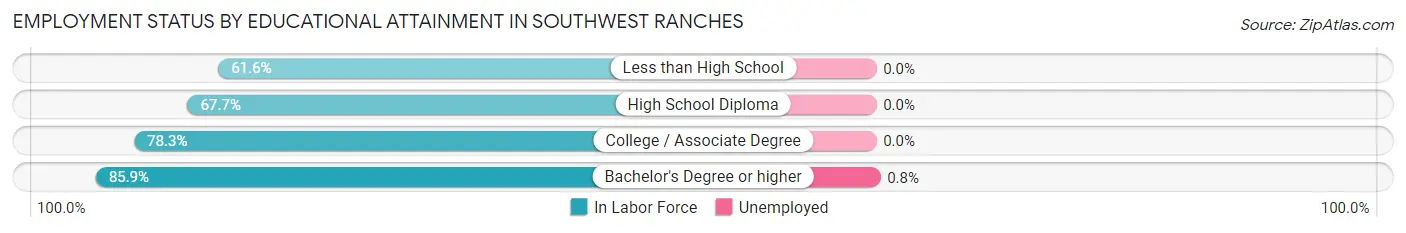
| Educational Attainment | In Labor Force | Unemployed |
| Less than High School | 122 (61.6%) | 0 (0.0%) |
| High School Diploma | 329 (67.7%) | 0 (0.0%) |
| College / Associate Degree | 730 (78.3%) | 0 (0.0%) |
| Bachelor's Degree or higher | 1,613 (85.9%) | 15 (0.8%) |
| Total | 2,795 (80.0%) | 17 (0.5%) |
Employment Occupations by Sex in Southwest Ranches
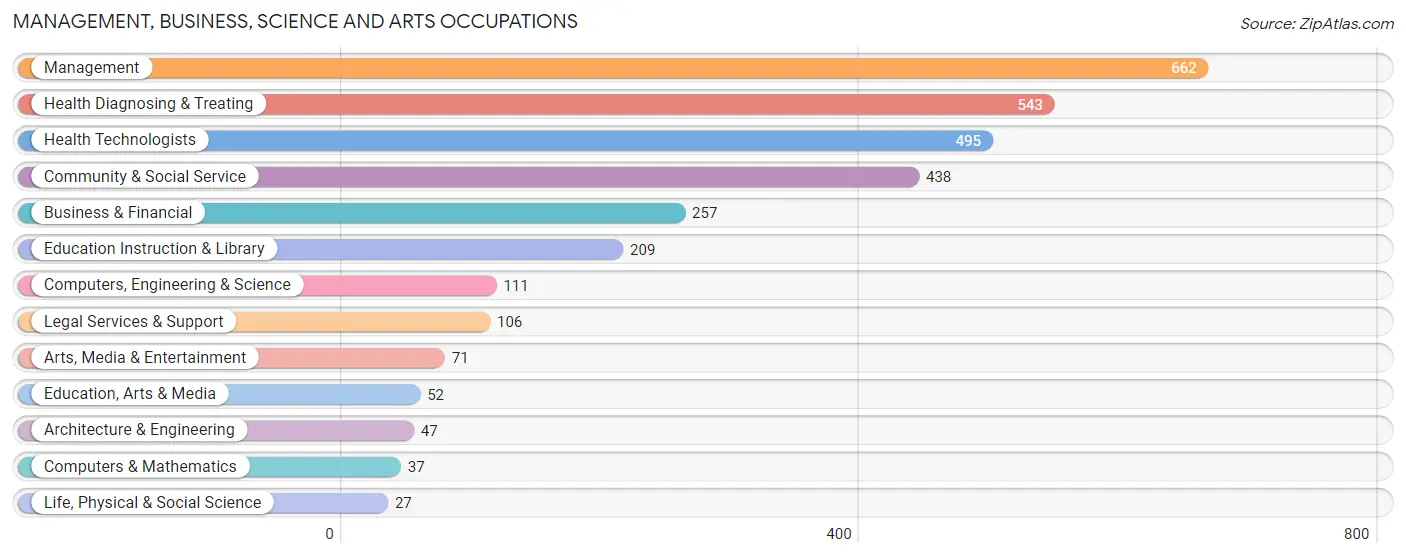
Management, Business, Science and Arts Occupations
The most common Management, Business, Science and Arts occupations in Southwest Ranches are Management (662 | 17.6%), Health Diagnosing & Treating (543 | 14.5%), Health Technologists (495 | 13.2%), Community & Social Service (438 | 11.7%), and Business & Financial (257 | 6.8%).
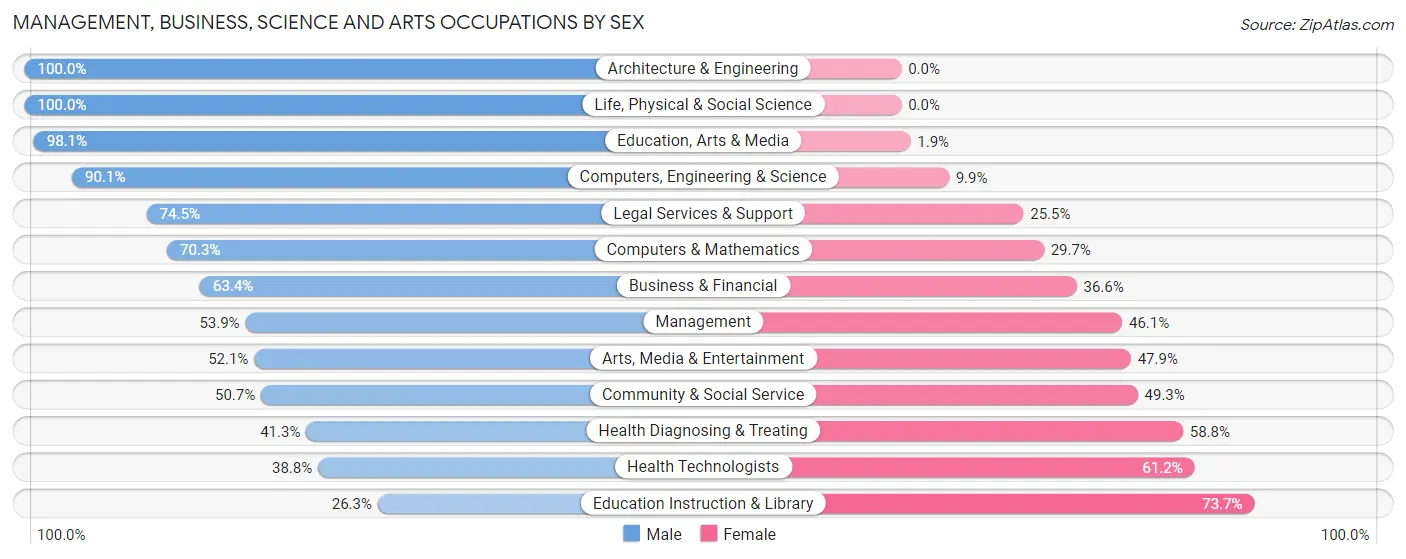
Management, Business, Science and Arts Occupations by Sex
Within the Management, Business, Science and Arts occupations in Southwest Ranches, the most male-oriented occupations are Architecture & Engineering (100.0%), Life, Physical & Social Science (100.0%), and Education, Arts & Media (98.1%), while the most female-oriented occupations are Education Instruction & Library (73.7%), Health Technologists (61.2%), and Health Diagnosing & Treating (58.8%).
| Occupation | Male | Female |
| Management | 357 (53.9%) | 305 (46.1%) |
| Business & Financial | 163 (63.4%) | 94 (36.6%) |
| Computers, Engineering & Science | 100 (90.1%) | 11 (9.9%) |
| Computers & Mathematics | 26 (70.3%) | 11 (29.7%) |
| Architecture & Engineering | 47 (100.0%) | 0 (0.0%) |
| Life, Physical & Social Science | 27 (100.0%) | 0 (0.0%) |
| Community & Social Service | 222 (50.7%) | 216 (49.3%) |
| Education, Arts & Media | 51 (98.1%) | 1 (1.9%) |
| Legal Services & Support | 79 (74.5%) | 27 (25.5%) |
| Education Instruction & Library | 55 (26.3%) | 154 (73.7%) |
| Arts, Media & Entertainment | 37 (52.1%) | 34 (47.9%) |
| Health Diagnosing & Treating | 224 (41.2%) | 319 (58.8%) |
| Health Technologists | 192 (38.8%) | 303 (61.2%) |
| Total (Category) | 1,066 (53.0%) | 945 (47.0%) |
| Total (Overall) | 2,083 (55.5%) | 1,672 (44.5%) |
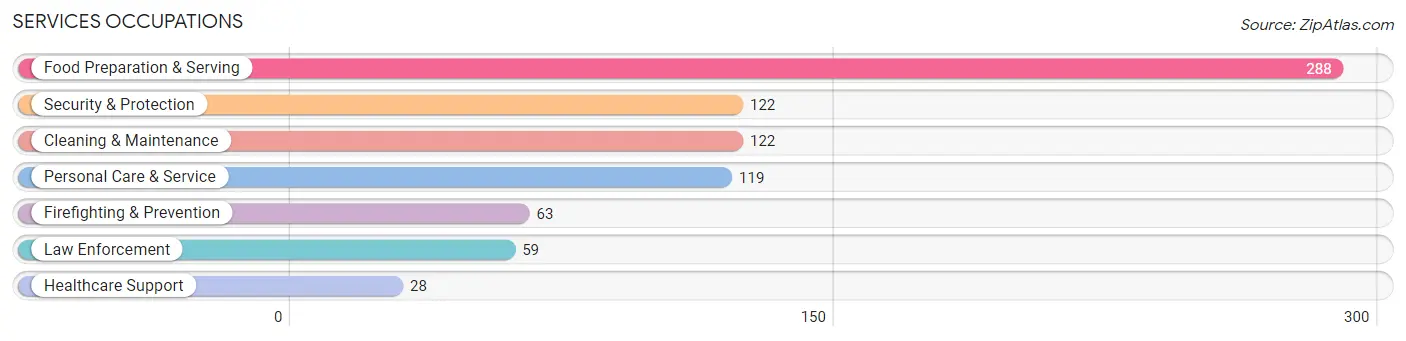
Services Occupations
The most common Services occupations in Southwest Ranches are Food Preparation & Serving (288 | 7.7%), Security & Protection (122 | 3.3%), Cleaning & Maintenance (122 | 3.3%), Personal Care & Service (119 | 3.2%), and Firefighting & Prevention (63 | 1.7%).
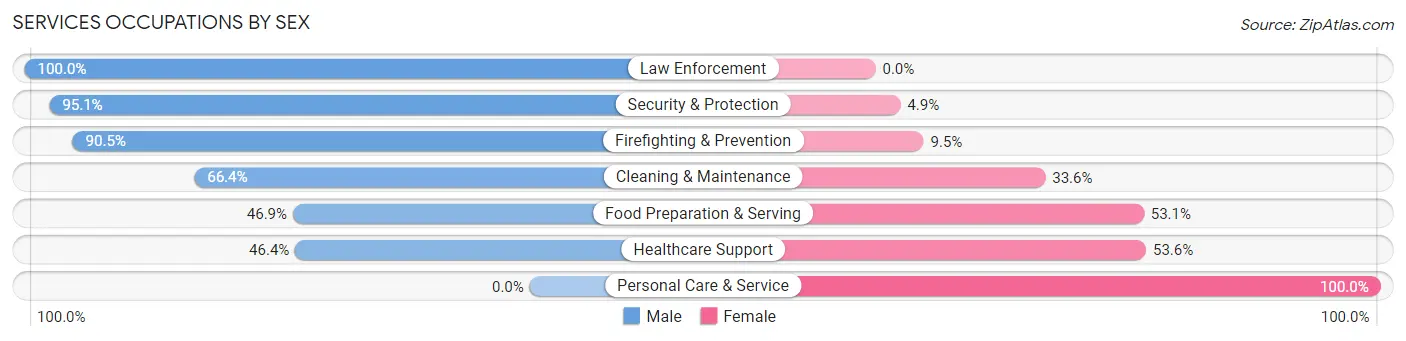
Services Occupations by Sex
Within the Services occupations in Southwest Ranches, the most male-oriented occupations are Law Enforcement (100.0%), Security & Protection (95.1%), and Firefighting & Prevention (90.5%), while the most female-oriented occupations are Personal Care & Service (100.0%), Healthcare Support (53.6%), and Food Preparation & Serving (53.1%).
| Occupation | Male | Female |
| Healthcare Support | 13 (46.4%) | 15 (53.6%) |
| Security & Protection | 116 (95.1%) | 6 (4.9%) |
| Firefighting & Prevention | 57 (90.5%) | 6 (9.5%) |
| Law Enforcement | 59 (100.0%) | 0 (0.0%) |
| Food Preparation & Serving | 135 (46.9%) | 153 (53.1%) |
| Cleaning & Maintenance | 81 (66.4%) | 41 (33.6%) |
| Personal Care & Service | 0 (0.0%) | 119 (100.0%) |
| Total (Category) | 345 (50.8%) | 334 (49.2%) |
| Total (Overall) | 2,083 (55.5%) | 1,672 (44.5%) |
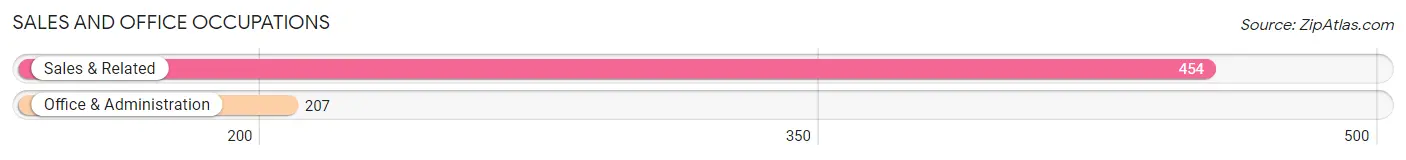
Sales and Office Occupations
The most common Sales and Office occupations in Southwest Ranches are Sales & Related (454 | 12.1%), and Office & Administration (207 | 5.5%).
Sales and Office Occupations by Sex
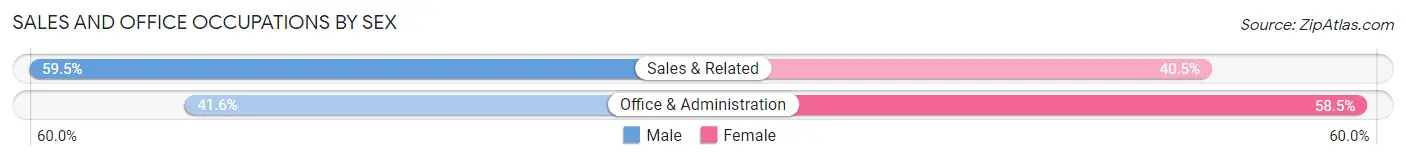
| Occupation | Male | Female |
| Sales & Related | 270 (59.5%) | 184 (40.5%) |
| Office & Administration | 86 (41.5%) | 121 (58.5%) |
| Total (Category) | 356 (53.9%) | 305 (46.1%) |
| Total (Overall) | 2,083 (55.5%) | 1,672 (44.5%) |
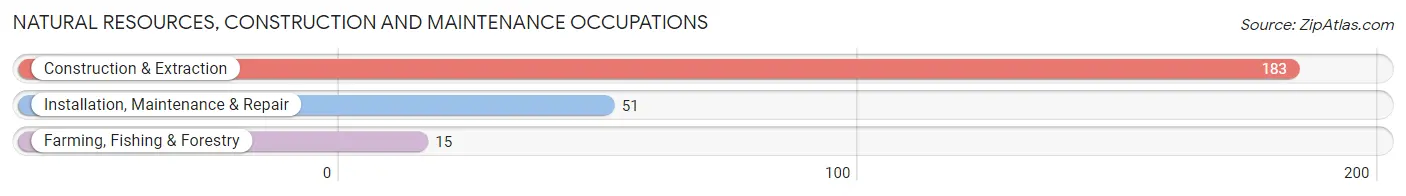
Natural Resources, Construction and Maintenance Occupations
The most common Natural Resources, Construction and Maintenance occupations in Southwest Ranches are Construction & Extraction (183 | 4.9%), Installation, Maintenance & Repair (51 | 1.4%), and Farming, Fishing & Forestry (15 | 0.4%).
Natural Resources, Construction and Maintenance Occupations by Sex
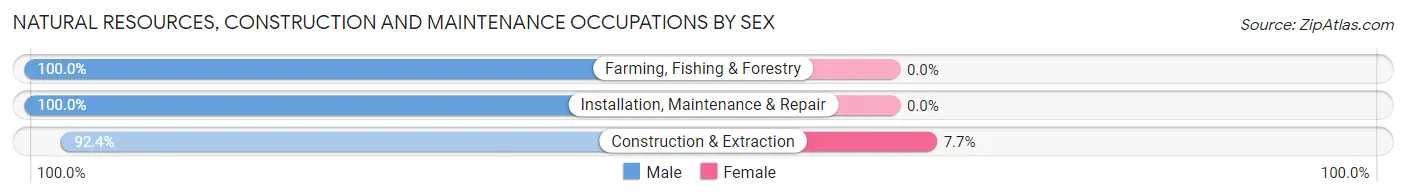
| Occupation | Male | Female |
| Farming, Fishing & Forestry | 15 (100.0%) | 0 (0.0%) |
| Construction & Extraction | 169 (92.3%) | 14 (7.6%) |
| Installation, Maintenance & Repair | 51 (100.0%) | 0 (0.0%) |
| Total (Category) | 235 (94.4%) | 14 (5.6%) |
| Total (Overall) | 2,083 (55.5%) | 1,672 (44.5%) |
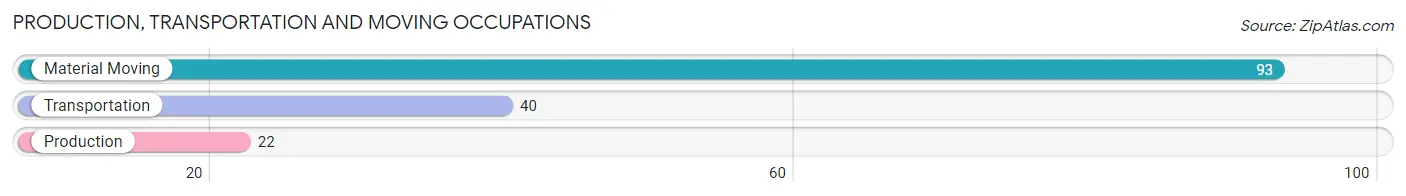
Production, Transportation and Moving Occupations
The most common Production, Transportation and Moving occupations in Southwest Ranches are Material Moving (93 | 2.5%), Transportation (40 | 1.1%), and Production (22 | 0.6%).
Production, Transportation and Moving Occupations by Sex
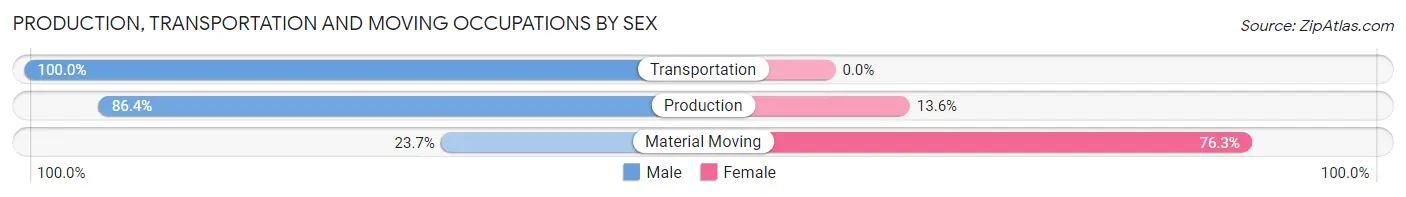
| Occupation | Male | Female |
| Production | 19 (86.4%) | 3 (13.6%) |
| Transportation | 40 (100.0%) | 0 (0.0%) |
| Material Moving | 22 (23.7%) | 71 (76.3%) |
| Total (Category) | 81 (52.3%) | 74 (47.7%) |
| Total (Overall) | 2,083 (55.5%) | 1,672 (44.5%) |
Employment Industries by Sex in Southwest Ranches
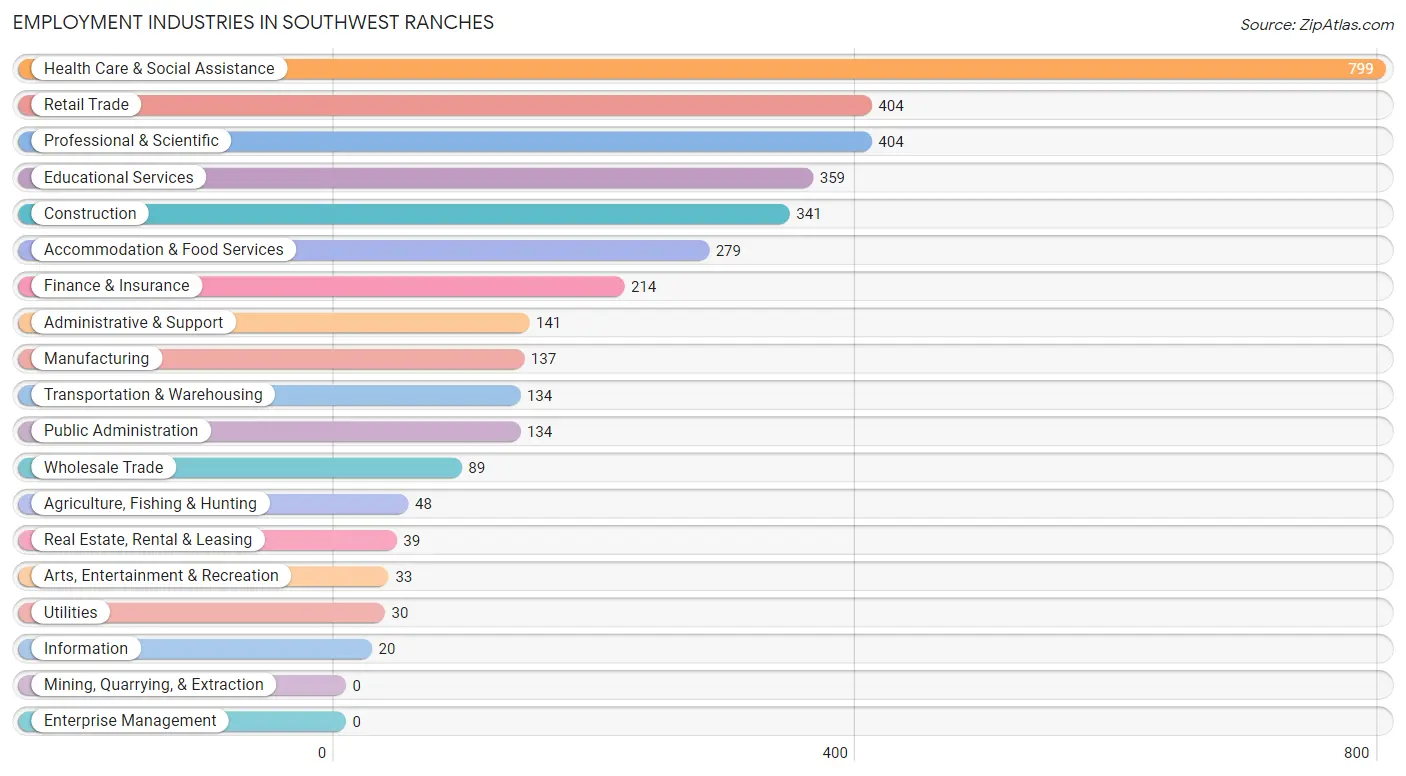
Employment Industries in Southwest Ranches
The major employment industries in Southwest Ranches include Health Care & Social Assistance (799 | 21.3%), Retail Trade (404 | 10.8%), Professional & Scientific (404 | 10.8%), Educational Services (359 | 9.6%), and Construction (341 | 9.1%).
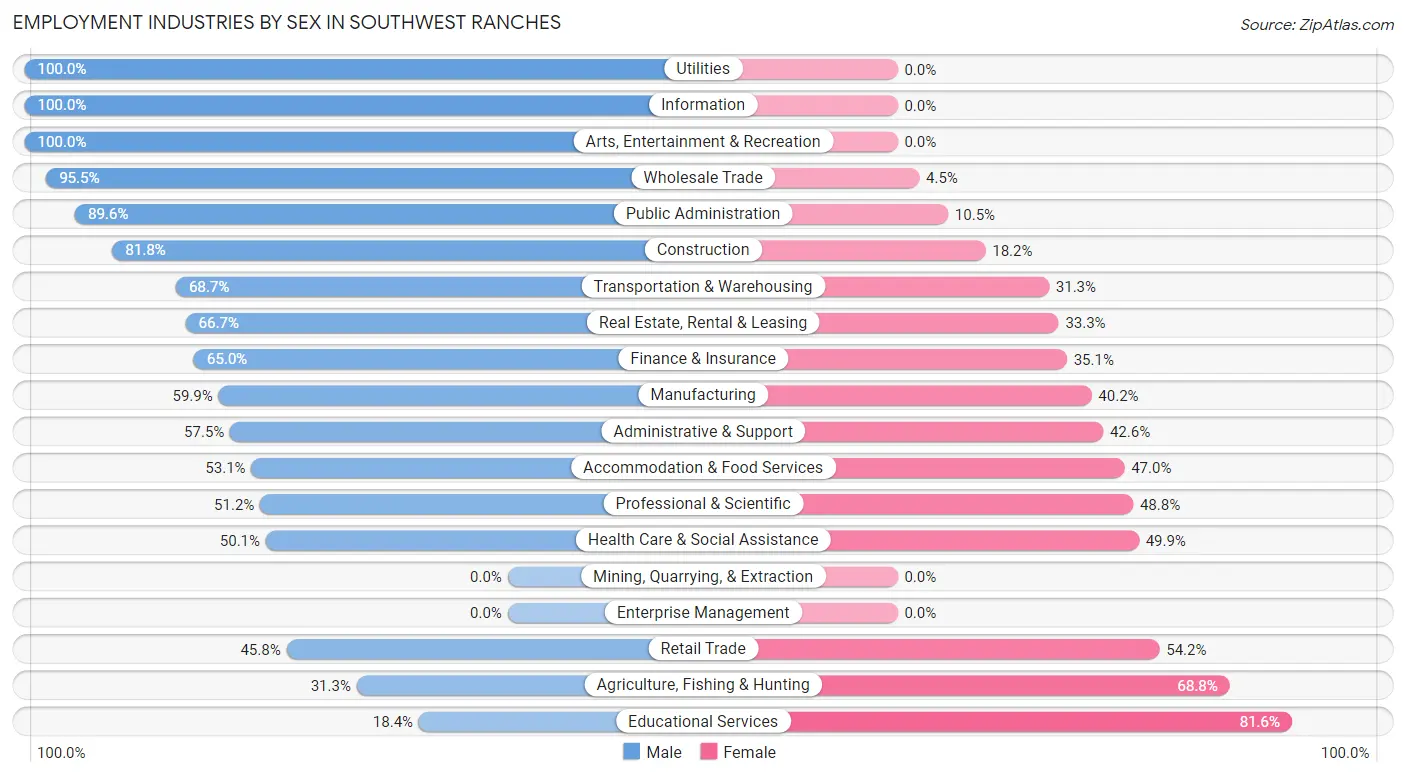
Employment Industries by Sex in Southwest Ranches
The Southwest Ranches industries that see more men than women are Utilities (100.0%), Information (100.0%), and Arts, Entertainment & Recreation (100.0%), whereas the industries that tend to have a higher number of women are Educational Services (81.6%), Agriculture, Fishing & Hunting (68.8%), and Retail Trade (54.2%).
| Industry | Male | Female |
| Agriculture, Fishing & Hunting | 15 (31.2%) | 33 (68.8%) |
| Mining, Quarrying, & Extraction | 0 (0.0%) | 0 (0.0%) |
| Construction | 279 (81.8%) | 62 (18.2%) |
| Manufacturing | 82 (59.9%) | 55 (40.2%) |
| Wholesale Trade | 85 (95.5%) | 4 (4.5%) |
| Retail Trade | 185 (45.8%) | 219 (54.2%) |
| Transportation & Warehousing | 92 (68.7%) | 42 (31.3%) |
| Utilities | 30 (100.0%) | 0 (0.0%) |
| Information | 20 (100.0%) | 0 (0.0%) |
| Finance & Insurance | 139 (64.9%) | 75 (35.0%) |
| Real Estate, Rental & Leasing | 26 (66.7%) | 13 (33.3%) |
| Professional & Scientific | 207 (51.2%) | 197 (48.8%) |
| Enterprise Management | 0 (0.0%) | 0 (0.0%) |
| Administrative & Support | 81 (57.5%) | 60 (42.5%) |
| Educational Services | 66 (18.4%) | 293 (81.6%) |
| Health Care & Social Assistance | 400 (50.1%) | 399 (49.9%) |
| Arts, Entertainment & Recreation | 33 (100.0%) | 0 (0.0%) |
| Accommodation & Food Services | 148 (53.0%) | 131 (46.9%) |
| Public Administration | 120 (89.5%) | 14 (10.4%) |
| Total | 2,083 (55.5%) | 1,672 (44.5%) |
Education in Southwest Ranches
School Enrollment in Southwest Ranches
The most common levels of schooling among the 2,479 students in Southwest Ranches are high school (578 | 23.3%), elementary school (559 | 22.6%), and college / undergraduate (539 | 21.7%).
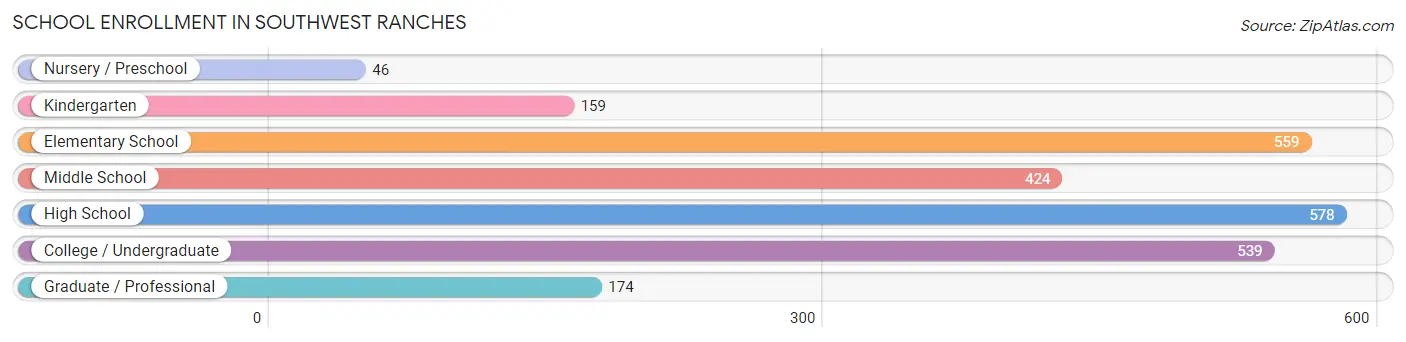
| School Level | # Students | % Students |
| Nursery / Preschool | 46 | 1.9% |
| Kindergarten | 159 | 6.4% |
| Elementary School | 559 | 22.6% |
| Middle School | 424 | 17.1% |
| High School | 578 | 23.3% |
| College / Undergraduate | 539 | 21.7% |
| Graduate / Professional | 174 | 7.0% |
| Total | 2,479 | 100.0% |
School Enrollment by Age by Funding Source in Southwest Ranches
Out of a total of 2,479 students who are enrolled in schools in Southwest Ranches, 548 (22.1%) attend a private institution, while the remaining 1,931 (77.9%) are enrolled in public schools. The age group of 35 years and over has the highest likelihood of being enrolled in private schools, with 157 (100.0% in the age bracket) enrolled. Conversely, the age group of 10 to 14 year olds has the lowest likelihood of being enrolled in a private school, with 602 (93.8% in the age bracket) attending a public institution.
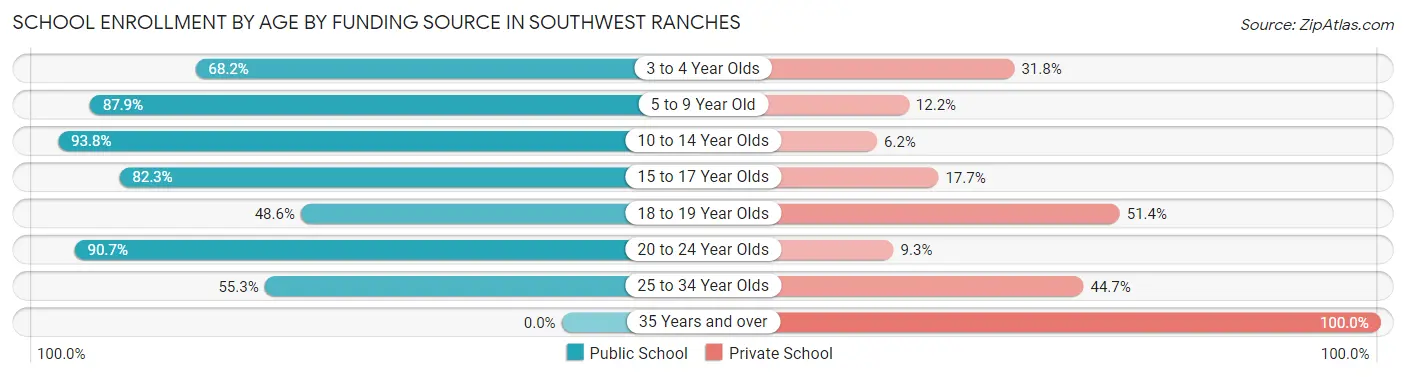
| Age Bracket | Public School | Private School |
| 3 to 4 Year Olds | 75 (68.2%) | 35 (31.8%) |
| 5 to 9 Year Old | 477 (87.8%) | 66 (12.1%) |
| 10 to 14 Year Olds | 602 (93.8%) | 40 (6.2%) |
| 15 to 17 Year Olds | 331 (82.3%) | 71 (17.7%) |
| 18 to 19 Year Olds | 119 (48.6%) | 126 (51.4%) |
| 20 to 24 Year Olds | 302 (90.7%) | 31 (9.3%) |
| 25 to 34 Year Olds | 26 (55.3%) | 21 (44.7%) |
| 35 Years and over | 0 (0.0%) | 157 (100.0%) |
| Total | 1,931 (77.9%) | 548 (22.1%) |
Educational Attainment by Field of Study in Southwest Ranches
Business (721 | 28.3%), science & technology (376 | 14.8%), education (360 | 14.1%), bio, nature & agricultural (196 | 7.7%), and engineering (160 | 6.3%) are the most common fields of study among 2,546 individuals in Southwest Ranches who have obtained a bachelor's degree or higher.
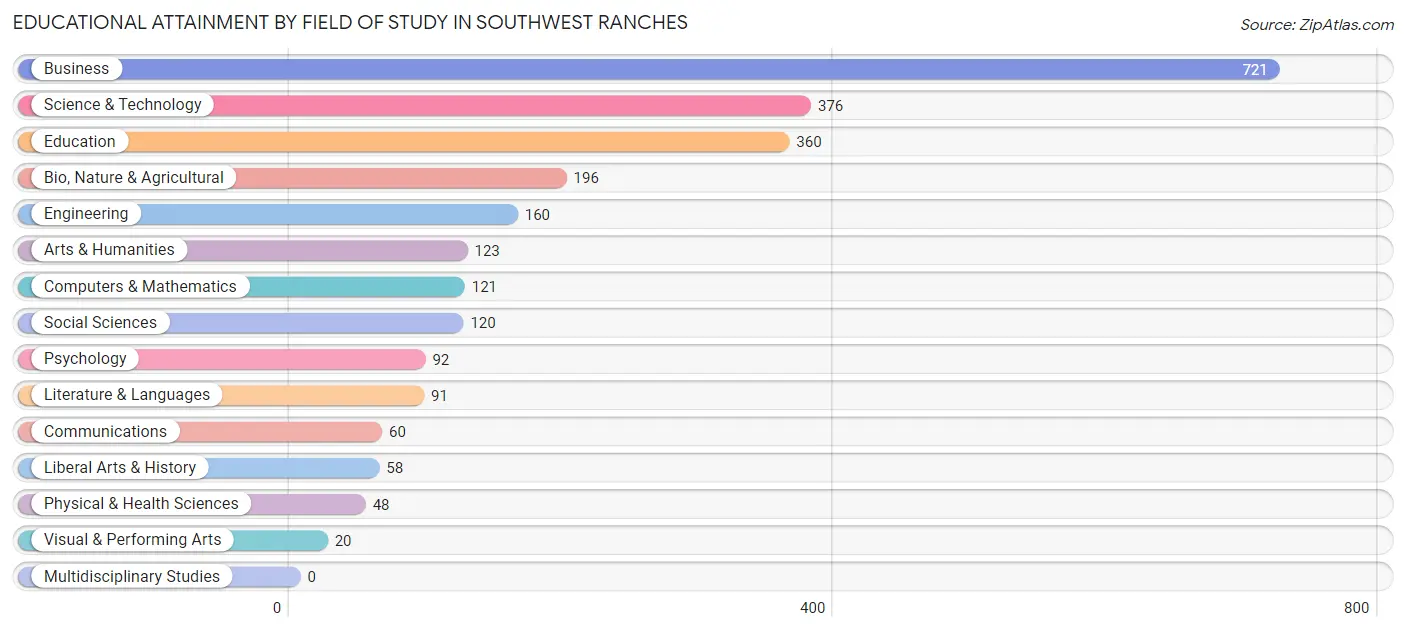
| Field of Study | # Graduates | % Graduates |
| Computers & Mathematics | 121 | 4.8% |
| Bio, Nature & Agricultural | 196 | 7.7% |
| Physical & Health Sciences | 48 | 1.9% |
| Psychology | 92 | 3.6% |
| Social Sciences | 120 | 4.7% |
| Engineering | 160 | 6.3% |
| Multidisciplinary Studies | 0 | 0.0% |
| Science & Technology | 376 | 14.8% |
| Business | 721 | 28.3% |
| Education | 360 | 14.1% |
| Literature & Languages | 91 | 3.6% |
| Liberal Arts & History | 58 | 2.3% |
| Visual & Performing Arts | 20 | 0.8% |
| Communications | 60 | 2.4% |
| Arts & Humanities | 123 | 4.8% |
| Total | 2,546 | 100.0% |
Transportation & Commute in Southwest Ranches
Vehicle Availability by Sex in Southwest Ranches
The most prevalent vehicle ownership categories in Southwest Ranches are males with 4 vehicles (546, accounting for 26.4%) and females with 4 vehicles (374, making up 32.8%).
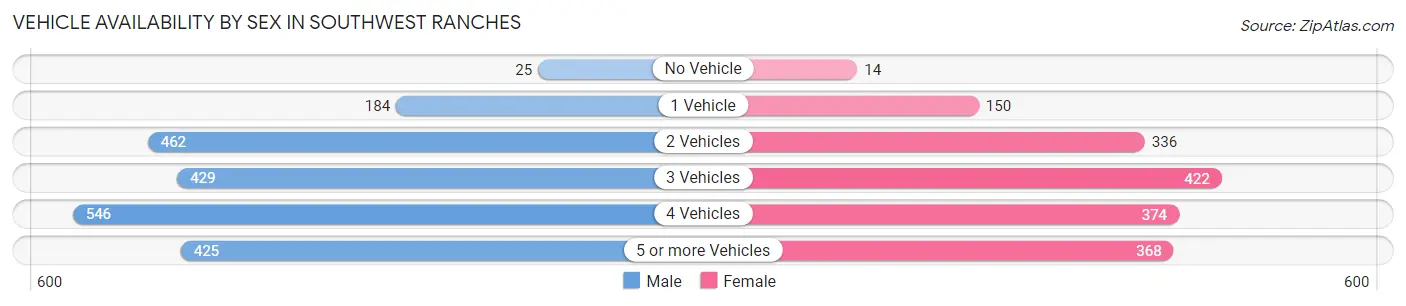
| Vehicles Available | Male | Female |
| No Vehicle | 25 (1.2%) | 14 (0.8%) |
| 1 Vehicle | 184 (8.9%) | 150 (9.0%) |
| 2 Vehicles | 462 (22.3%) | 336 (20.2%) |
| 3 Vehicles | 429 (20.7%) | 422 (25.4%) |
| 4 Vehicles | 546 (26.4%) | 374 (22.5%) |
| 5 or more Vehicles | 425 (20.5%) | 368 (22.1%) |
| Total | 2,071 (100.0%) | 1,664 (100.0%) |
Commute Time in Southwest Ranches
The most frequently occuring commute durations in Southwest Ranches are 20 to 24 minutes (886 commuters, 27.2%), 30 to 34 minutes (603 commuters, 18.5%), and 15 to 19 minutes (402 commuters, 12.3%).
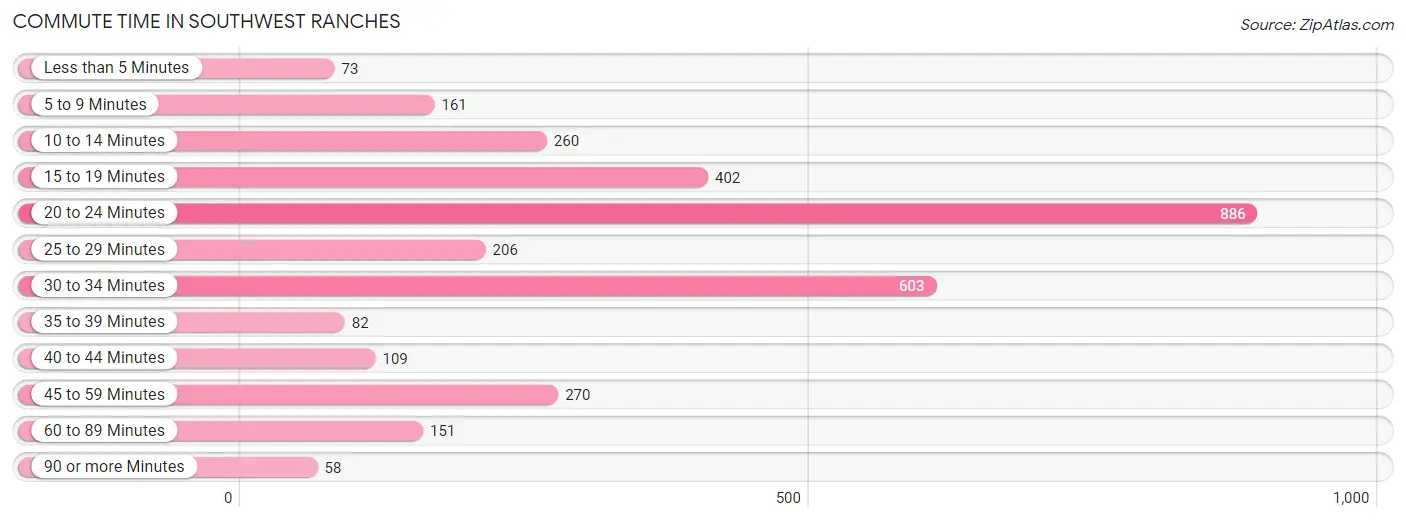
| Commute Time | # Commuters | % Commuters |
| Less than 5 Minutes | 73 | 2.2% |
| 5 to 9 Minutes | 161 | 4.9% |
| 10 to 14 Minutes | 260 | 8.0% |
| 15 to 19 Minutes | 402 | 12.3% |
| 20 to 24 Minutes | 886 | 27.2% |
| 25 to 29 Minutes | 206 | 6.3% |
| 30 to 34 Minutes | 603 | 18.5% |
| 35 to 39 Minutes | 82 | 2.5% |
| 40 to 44 Minutes | 109 | 3.3% |
| 45 to 59 Minutes | 270 | 8.3% |
| 60 to 89 Minutes | 151 | 4.6% |
| 90 or more Minutes | 58 | 1.8% |
Commute Time by Sex in Southwest Ranches
The most common commute times in Southwest Ranches are 20 to 24 minutes (507 commuters, 27.2%) for males and 20 to 24 minutes (379 commuters, 27.1%) for females.
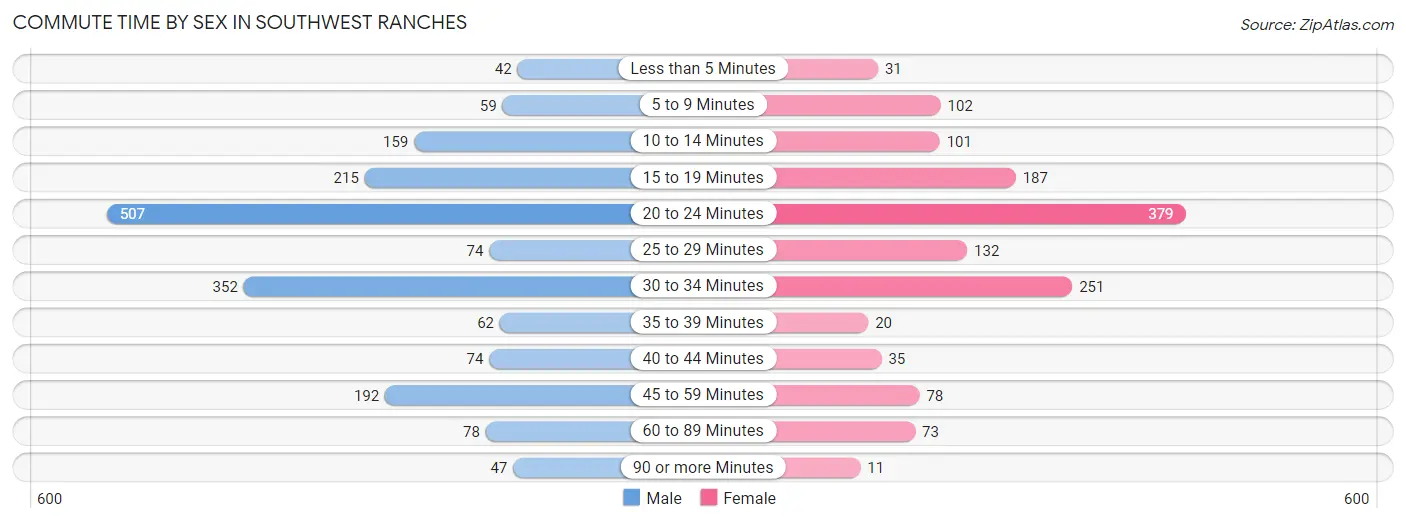
| Commute Time | Male | Female |
| Less than 5 Minutes | 42 (2.3%) | 31 (2.2%) |
| 5 to 9 Minutes | 59 (3.2%) | 102 (7.3%) |
| 10 to 14 Minutes | 159 (8.5%) | 101 (7.2%) |
| 15 to 19 Minutes | 215 (11.6%) | 187 (13.4%) |
| 20 to 24 Minutes | 507 (27.2%) | 379 (27.1%) |
| 25 to 29 Minutes | 74 (4.0%) | 132 (9.4%) |
| 30 to 34 Minutes | 352 (18.9%) | 251 (17.9%) |
| 35 to 39 Minutes | 62 (3.3%) | 20 (1.4%) |
| 40 to 44 Minutes | 74 (4.0%) | 35 (2.5%) |
| 45 to 59 Minutes | 192 (10.3%) | 78 (5.6%) |
| 60 to 89 Minutes | 78 (4.2%) | 73 (5.2%) |
| 90 or more Minutes | 47 (2.5%) | 11 (0.8%) |
Time of Departure to Work by Sex in Southwest Ranches
The most frequent times of departure to work in Southwest Ranches are 6:00 AM to 6:29 AM (310, 16.7%) for males and 7:00 AM to 7:29 AM (279, 19.9%) for females.
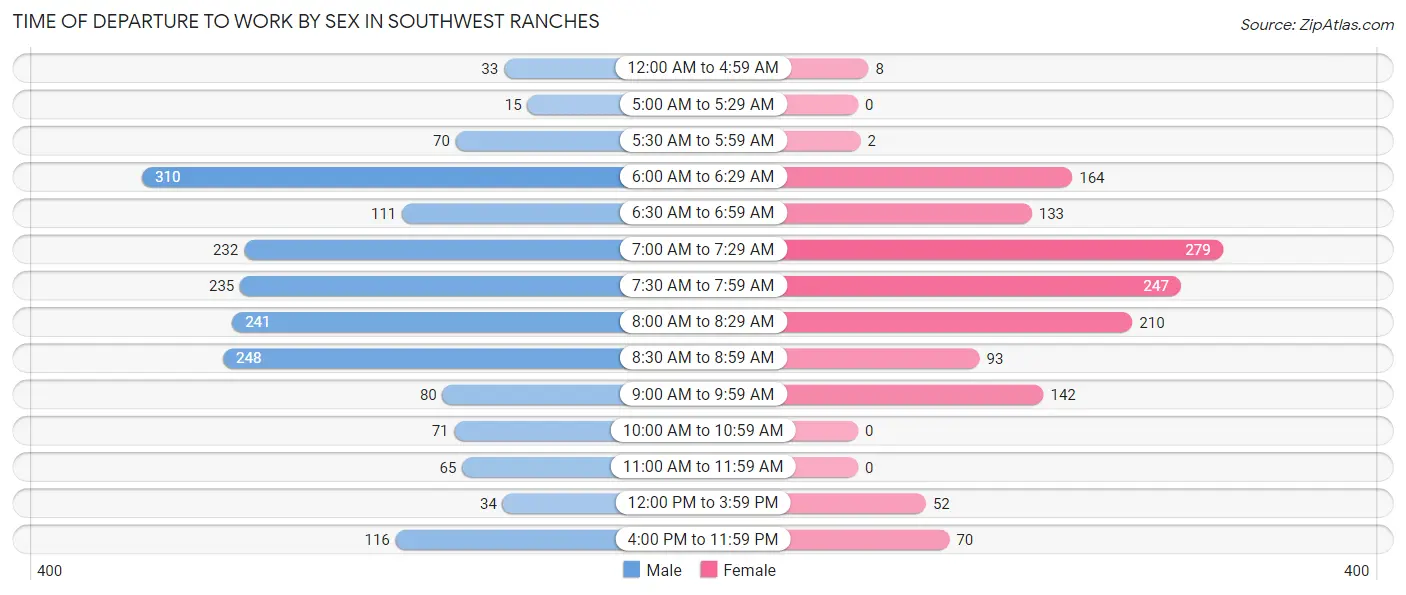
| Time of Departure | Male | Female |
| 12:00 AM to 4:59 AM | 33 (1.8%) | 8 (0.6%) |
| 5:00 AM to 5:29 AM | 15 (0.8%) | 0 (0.0%) |
| 5:30 AM to 5:59 AM | 70 (3.8%) | 2 (0.1%) |
| 6:00 AM to 6:29 AM | 310 (16.7%) | 164 (11.7%) |
| 6:30 AM to 6:59 AM | 111 (6.0%) | 133 (9.5%) |
| 7:00 AM to 7:29 AM | 232 (12.5%) | 279 (19.9%) |
| 7:30 AM to 7:59 AM | 235 (12.6%) | 247 (17.6%) |
| 8:00 AM to 8:29 AM | 241 (13.0%) | 210 (15.0%) |
| 8:30 AM to 8:59 AM | 248 (13.3%) | 93 (6.6%) |
| 9:00 AM to 9:59 AM | 80 (4.3%) | 142 (10.1%) |
| 10:00 AM to 10:59 AM | 71 (3.8%) | 0 (0.0%) |
| 11:00 AM to 11:59 AM | 65 (3.5%) | 0 (0.0%) |
| 12:00 PM to 3:59 PM | 34 (1.8%) | 52 (3.7%) |
| 4:00 PM to 11:59 PM | 116 (6.2%) | 70 (5.0%) |
| Total | 1,861 (100.0%) | 1,400 (100.0%) |
Housing Occupancy in Southwest Ranches
Occupancy by Ownership in Southwest Ranches
Of the total 2,024 dwellings in Southwest Ranches, owner-occupied units account for 1,966 (97.1%), while renter-occupied units make up 58 (2.9%).
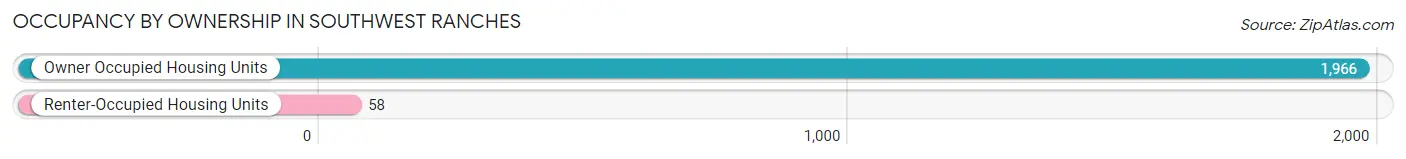
| Occupancy | # Housing Units | % Housing Units |
| Owner Occupied Housing Units | 1,966 | 97.1% |
| Renter-Occupied Housing Units | 58 | 2.9% |
| Total Occupied Housing Units | 2,024 | 100.0% |
Occupancy by Household Size in Southwest Ranches
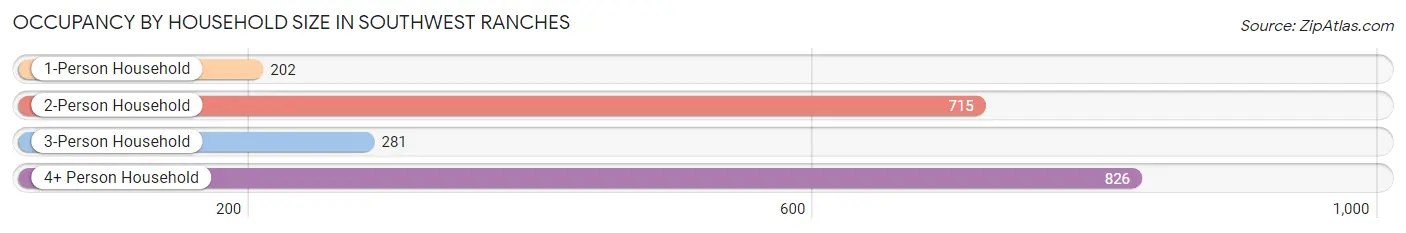
| Household Size | # Housing Units | % Housing Units |
| 1-Person Household | 202 | 10.0% |
| 2-Person Household | 715 | 35.3% |
| 3-Person Household | 281 | 13.9% |
| 4+ Person Household | 826 | 40.8% |
| Total Housing Units | 2,024 | 100.0% |
Occupancy by Ownership by Household Size in Southwest Ranches
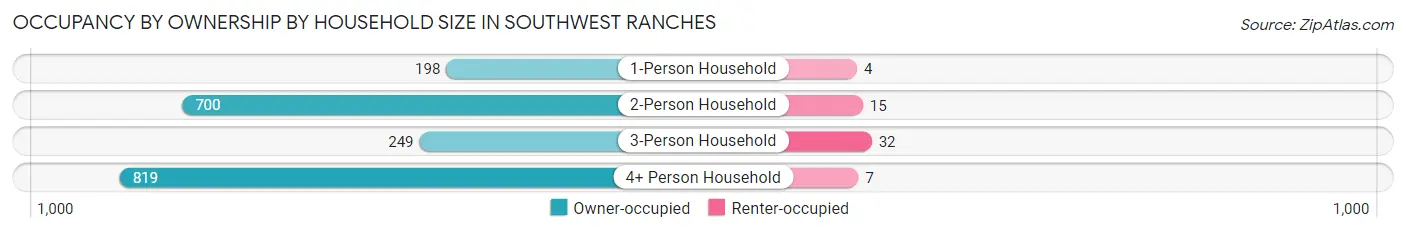
| Household Size | Owner-occupied | Renter-occupied |
| 1-Person Household | 198 (98.0%) | 4 (2.0%) |
| 2-Person Household | 700 (97.9%) | 15 (2.1%) |
| 3-Person Household | 249 (88.6%) | 32 (11.4%) |
| 4+ Person Household | 819 (99.2%) | 7 (0.9%) |
| Total Housing Units | 1,966 (97.1%) | 58 (2.9%) |
Occupancy by Educational Attainment in Southwest Ranches
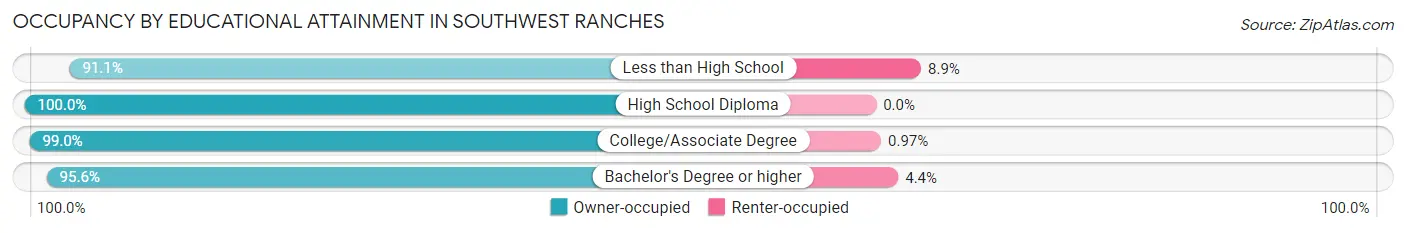
| Household Size | Owner-occupied | Renter-occupied |
| Less than High School | 92 (91.1%) | 9 (8.9%) |
| High School Diploma | 246 (100.0%) | 0 (0.0%) |
| College/Associate Degree | 711 (99.0%) | 7 (1.0%) |
| Bachelor's Degree or higher | 917 (95.6%) | 42 (4.4%) |
Occupancy by Age of Householder in Southwest Ranches
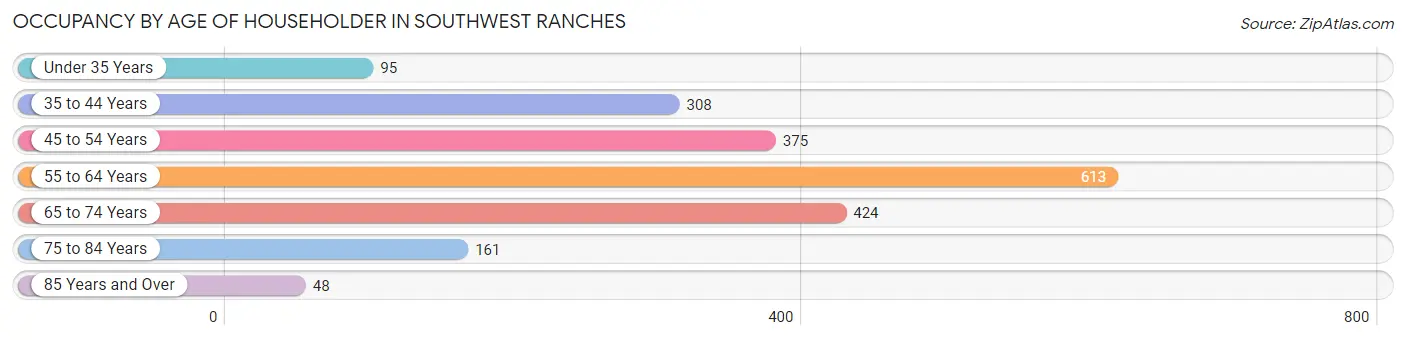
| Age Bracket | # Households | % Households |
| Under 35 Years | 95 | 4.7% |
| 35 to 44 Years | 308 | 15.2% |
| 45 to 54 Years | 375 | 18.5% |
| 55 to 64 Years | 613 | 30.3% |
| 65 to 74 Years | 424 | 20.9% |
| 75 to 84 Years | 161 | 8.0% |
| 85 Years and Over | 48 | 2.4% |
| Total | 2,024 | 100.0% |
Housing Finances in Southwest Ranches
Median Income by Occupancy in Southwest Ranches
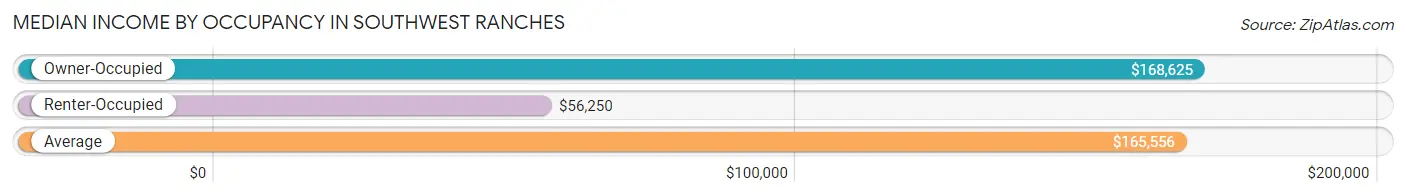
| Occupancy Type | # Households | Median Income |
| Owner-Occupied | 1,966 (97.1%) | $168,625 |
| Renter-Occupied | 58 (2.9%) | $56,250 |
| Average | 2,024 (100.0%) | $165,556 |
Occupancy by Householder Income Bracket in Southwest Ranches
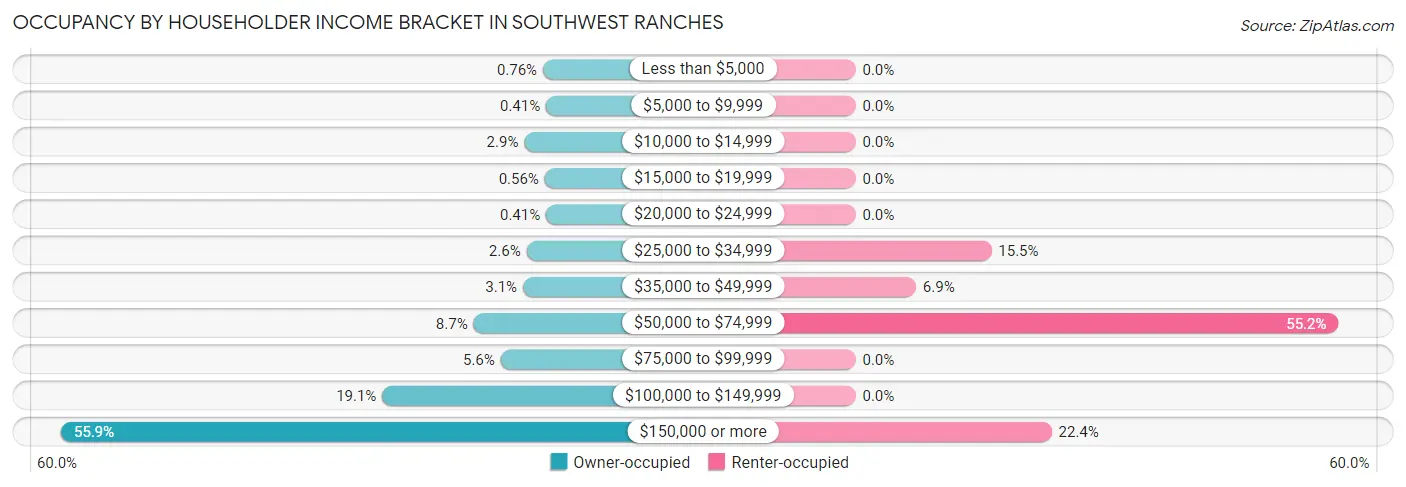
| Income Bracket | Owner-occupied | Renter-occupied |
| Less than $5,000 | 15 (0.8%) | 0 (0.0%) |
| $5,000 to $9,999 | 8 (0.4%) | 0 (0.0%) |
| $10,000 to $14,999 | 57 (2.9%) | 0 (0.0%) |
| $15,000 to $19,999 | 11 (0.6%) | 0 (0.0%) |
| $20,000 to $24,999 | 8 (0.4%) | 0 (0.0%) |
| $25,000 to $34,999 | 52 (2.6%) | 9 (15.5%) |
| $35,000 to $49,999 | 60 (3.0%) | 4 (6.9%) |
| $50,000 to $74,999 | 171 (8.7%) | 32 (55.2%) |
| $75,000 to $99,999 | 110 (5.6%) | 0 (0.0%) |
| $100,000 to $149,999 | 376 (19.1%) | 0 (0.0%) |
| $150,000 or more | 1,098 (55.8%) | 13 (22.4%) |
| Total | 1,966 (100.0%) | 58 (100.0%) |
Monthly Housing Cost Tiers in Southwest Ranches
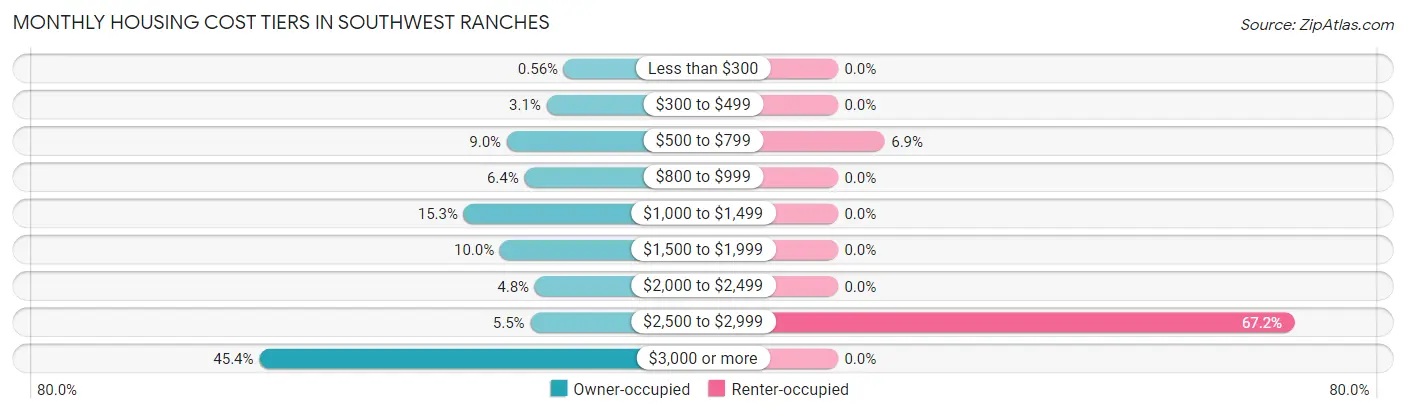
| Monthly Cost | Owner-occupied | Renter-occupied |
| Less than $300 | 11 (0.6%) | 0 (0.0%) |
| $300 to $499 | 61 (3.1%) | 0 (0.0%) |
| $500 to $799 | 176 (8.9%) | 4 (6.9%) |
| $800 to $999 | 125 (6.4%) | 0 (0.0%) |
| $1,000 to $1,499 | 301 (15.3%) | 0 (0.0%) |
| $1,500 to $1,999 | 196 (10.0%) | 0 (0.0%) |
| $2,000 to $2,499 | 95 (4.8%) | 0 (0.0%) |
| $2,500 to $2,999 | 108 (5.5%) | 39 (67.2%) |
| $3,000 or more | 893 (45.4%) | 0 (0.0%) |
| Total | 1,966 (100.0%) | 58 (100.0%) |
Physical Housing Characteristics in Southwest Ranches
Housing Structures in Southwest Ranches
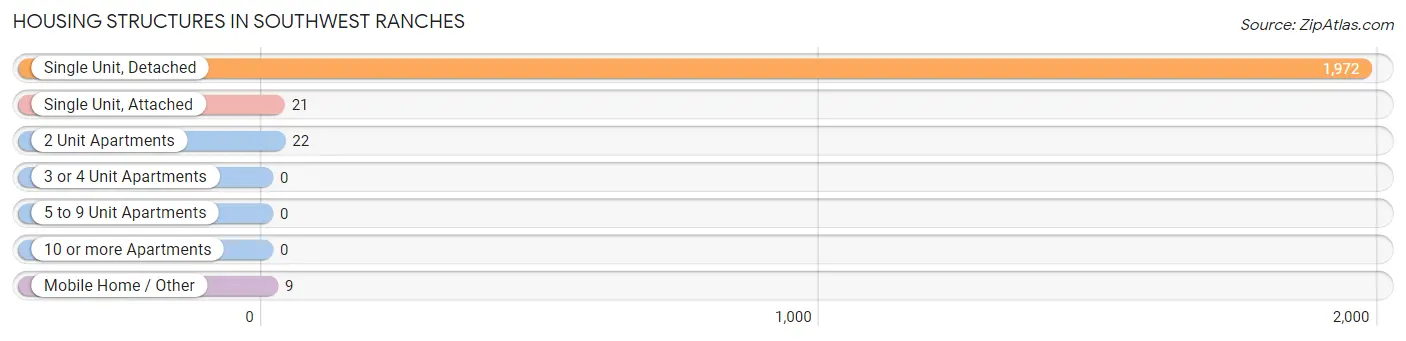
| Structure Type | # Housing Units | % Housing Units |
| Single Unit, Detached | 1,972 | 97.4% |
| Single Unit, Attached | 21 | 1.0% |
| 2 Unit Apartments | 22 | 1.1% |
| 3 or 4 Unit Apartments | 0 | 0.0% |
| 5 to 9 Unit Apartments | 0 | 0.0% |
| 10 or more Apartments | 0 | 0.0% |
| Mobile Home / Other | 9 | 0.4% |
| Total | 2,024 | 100.0% |
Housing Structures by Occupancy in Southwest Ranches
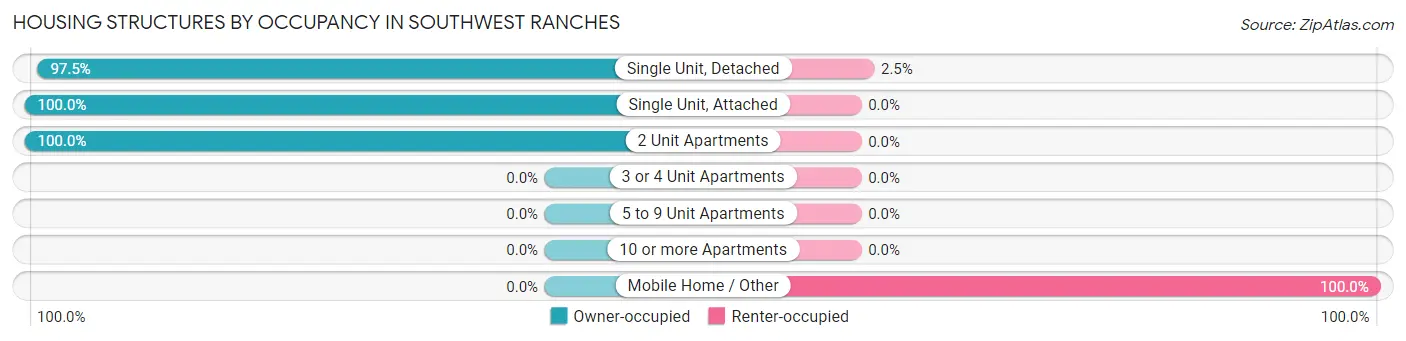
| Structure Type | Owner-occupied | Renter-occupied |
| Single Unit, Detached | 1,923 (97.5%) | 49 (2.5%) |
| Single Unit, Attached | 21 (100.0%) | 0 (0.0%) |
| 2 Unit Apartments | 22 (100.0%) | 0 (0.0%) |
| 3 or 4 Unit Apartments | 0 (0.0%) | 0 (0.0%) |
| 5 to 9 Unit Apartments | 0 (0.0%) | 0 (0.0%) |
| 10 or more Apartments | 0 (0.0%) | 0 (0.0%) |
| Mobile Home / Other | 0 (0.0%) | 9 (100.0%) |
| Total | 1,966 (97.1%) | 58 (2.9%) |
Housing Structures by Number of Rooms in Southwest Ranches
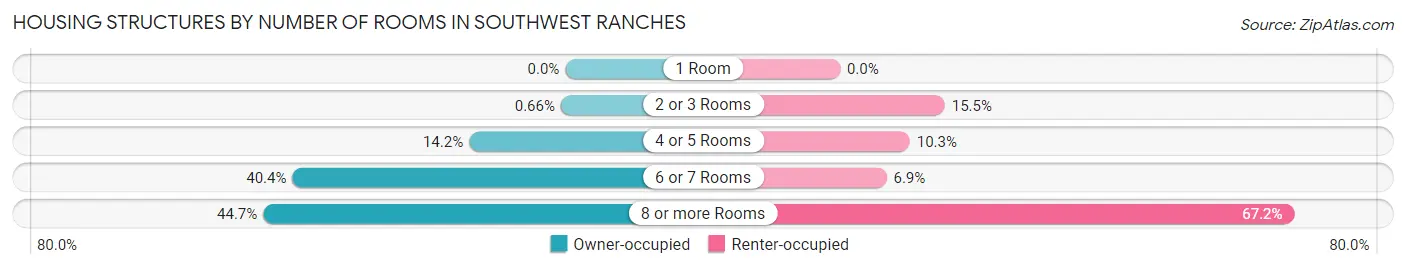
| Number of Rooms | Owner-occupied | Renter-occupied |
| 1 Room | 0 (0.0%) | 0 (0.0%) |
| 2 or 3 Rooms | 13 (0.7%) | 9 (15.5%) |
| 4 or 5 Rooms | 280 (14.2%) | 6 (10.3%) |
| 6 or 7 Rooms | 794 (40.4%) | 4 (6.9%) |
| 8 or more Rooms | 879 (44.7%) | 39 (67.2%) |
| Total | 1,966 (100.0%) | 58 (100.0%) |
Housing Structure by Heating Type in Southwest Ranches
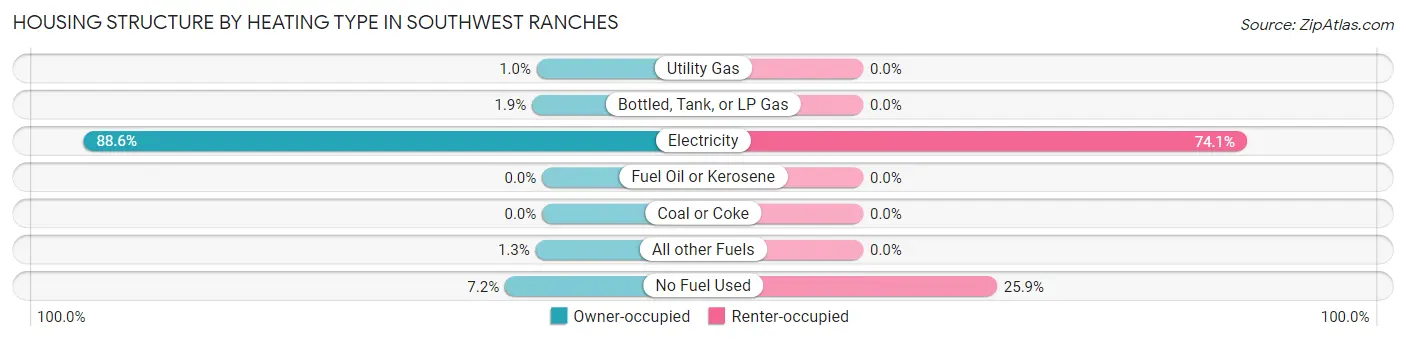
| Heating Type | Owner-occupied | Renter-occupied |
| Utility Gas | 20 (1.0%) | 0 (0.0%) |
| Bottled, Tank, or LP Gas | 38 (1.9%) | 0 (0.0%) |
| Electricity | 1,742 (88.6%) | 43 (74.1%) |
| Fuel Oil or Kerosene | 0 (0.0%) | 0 (0.0%) |
| Coal or Coke | 0 (0.0%) | 0 (0.0%) |
| All other Fuels | 25 (1.3%) | 0 (0.0%) |
| No Fuel Used | 141 (7.2%) | 15 (25.9%) |
| Total | 1,966 (100.0%) | 58 (100.0%) |
Household Vehicle Usage in Southwest Ranches
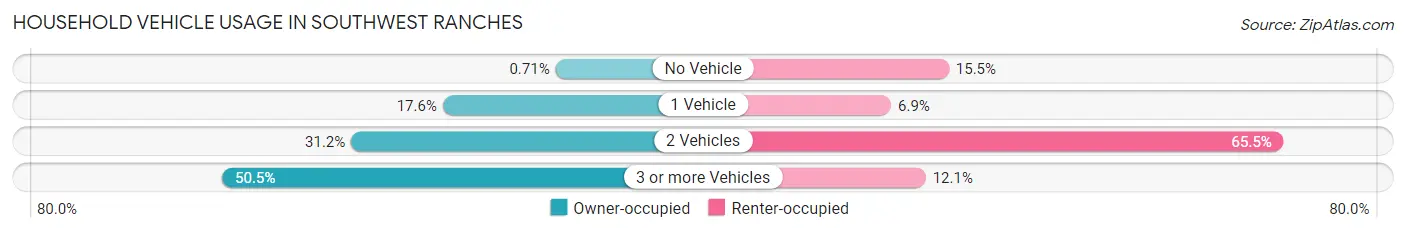
| Vehicles per Household | Owner-occupied | Renter-occupied |
| No Vehicle | 14 (0.7%) | 9 (15.5%) |
| 1 Vehicle | 345 (17.5%) | 4 (6.9%) |
| 2 Vehicles | 614 (31.2%) | 38 (65.5%) |
| 3 or more Vehicles | 993 (50.5%) | 7 (12.1%) |
| Total | 1,966 (100.0%) | 58 (100.0%) |
Real Estate & Mortgages in Southwest Ranches
Real Estate and Mortgage Overview in Southwest Ranches
| Characteristic | Without Mortgage | With Mortgage |
| Housing Units | 747 | 1,219 |
| Median Property Value | $741,600 | $800,700 |
| Median Household Income | $131,546 | $817 |
| Monthly Housing Costs | $1,061 | $871 |
| Real Estate Taxes | $6,473 | $25 |
Property Value by Mortgage Status in Southwest Ranches
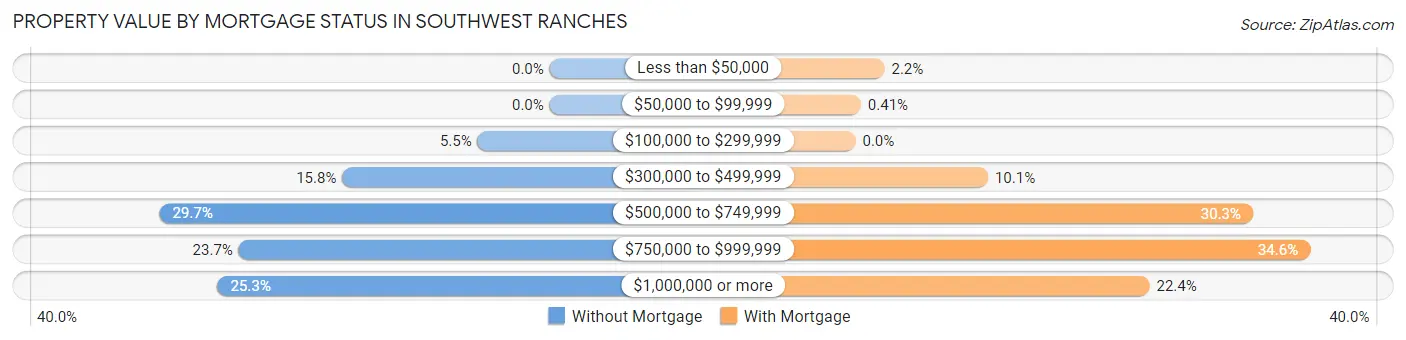
| Property Value | Without Mortgage | With Mortgage |
| Less than $50,000 | 0 (0.0%) | 27 (2.2%) |
| $50,000 to $99,999 | 0 (0.0%) | 5 (0.4%) |
| $100,000 to $299,999 | 41 (5.5%) | 0 (0.0%) |
| $300,000 to $499,999 | 118 (15.8%) | 123 (10.1%) |
| $500,000 to $749,999 | 222 (29.7%) | 369 (30.3%) |
| $750,000 to $999,999 | 177 (23.7%) | 422 (34.6%) |
| $1,000,000 or more | 189 (25.3%) | 273 (22.4%) |
| Total | 747 (100.0%) | 1,219 (100.0%) |
Household Income by Mortgage Status in Southwest Ranches
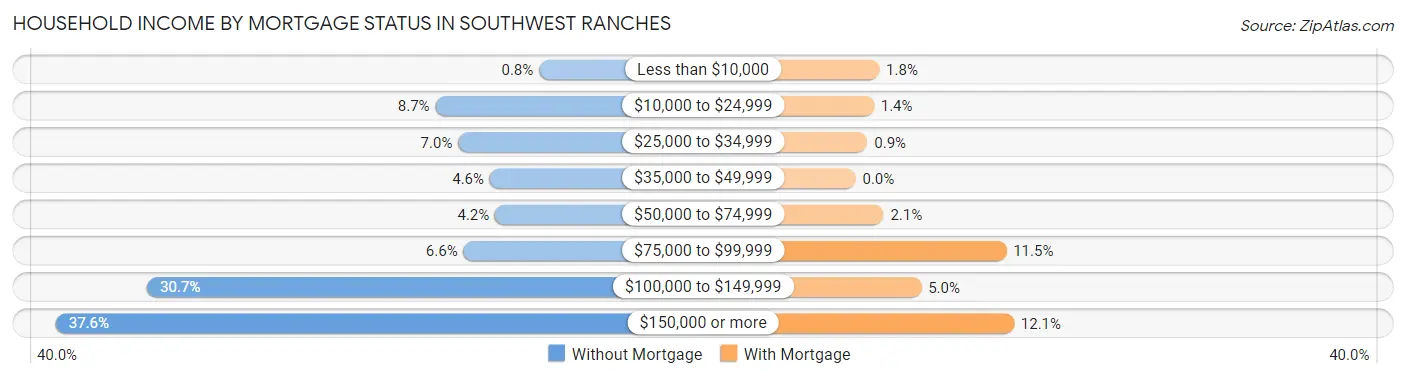
| Household Income | Without Mortgage | With Mortgage |
| Less than $10,000 | 6 (0.8%) | 22 (1.8%) |
| $10,000 to $24,999 | 65 (8.7%) | 17 (1.4%) |
| $25,000 to $34,999 | 52 (7.0%) | 11 (0.9%) |
| $35,000 to $49,999 | 34 (4.5%) | 0 (0.0%) |
| $50,000 to $74,999 | 31 (4.2%) | 26 (2.1%) |
| $75,000 to $99,999 | 49 (6.6%) | 140 (11.5%) |
| $100,000 to $149,999 | 229 (30.7%) | 61 (5.0%) |
| $150,000 or more | 281 (37.6%) | 147 (12.1%) |
| Total | 747 (100.0%) | 1,219 (100.0%) |
Property Value to Household Income Ratio in Southwest Ranches
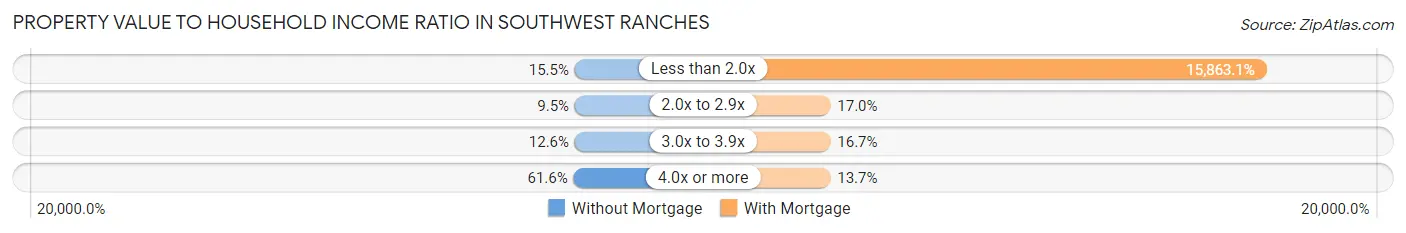
| Value-to-Income Ratio | Without Mortgage | With Mortgage |
| Less than 2.0x | 116 (15.5%) | 193,371 (15,863.1%) |
| 2.0x to 2.9x | 71 (9.5%) | 207 (17.0%) |
| 3.0x to 3.9x | 94 (12.6%) | 204 (16.7%) |
| 4.0x or more | 460 (61.6%) | 167 (13.7%) |
| Total | 747 (100.0%) | 1,219 (100.0%) |
Real Estate Taxes by Mortgage Status in Southwest Ranches
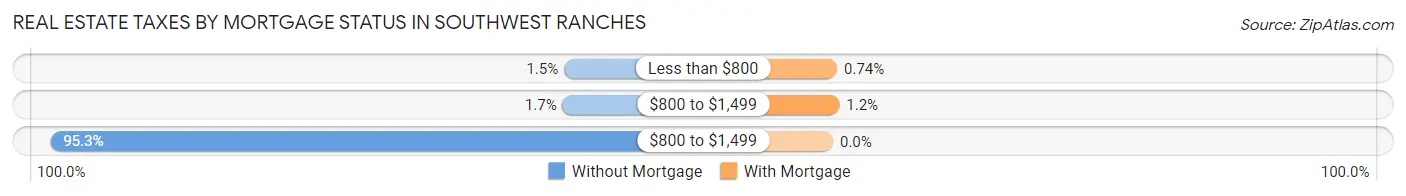
| Property Taxes | Without Mortgage | With Mortgage |
| Less than $800 | 11 (1.5%) | 9 (0.7%) |
| $800 to $1,499 | 13 (1.7%) | 14 (1.1%) |
| $800 to $1,499 | 712 (95.3%) | 0 (0.0%) |
| Total | 747 (100.0%) | 1,219 (100.0%) |
Health & Disability in Southwest Ranches
Health Insurance Coverage by Age in Southwest Ranches
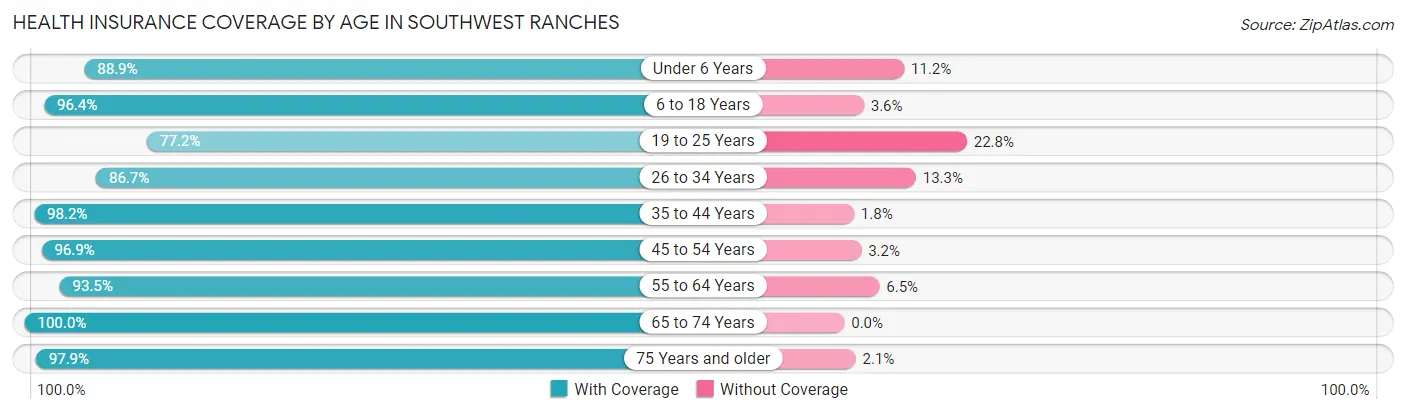
| Age Bracket | With Coverage | Without Coverage |
| Under 6 Years | 271 (88.8%) | 34 (11.2%) |
| 6 to 18 Years | 1,647 (96.4%) | 62 (3.6%) |
| 19 to 25 Years | 483 (77.2%) | 143 (22.8%) |
| 26 to 34 Years | 416 (86.7%) | 64 (13.3%) |
| 35 to 44 Years | 990 (98.2%) | 18 (1.8%) |
| 45 to 54 Years | 891 (96.9%) | 29 (3.2%) |
| 55 to 64 Years | 971 (93.5%) | 68 (6.5%) |
| 65 to 74 Years | 931 (100.0%) | 0 (0.0%) |
| 75 Years and older | 556 (97.9%) | 12 (2.1%) |
| Total | 7,156 (94.3%) | 430 (5.7%) |
Health Insurance Coverage by Citizenship Status in Southwest Ranches
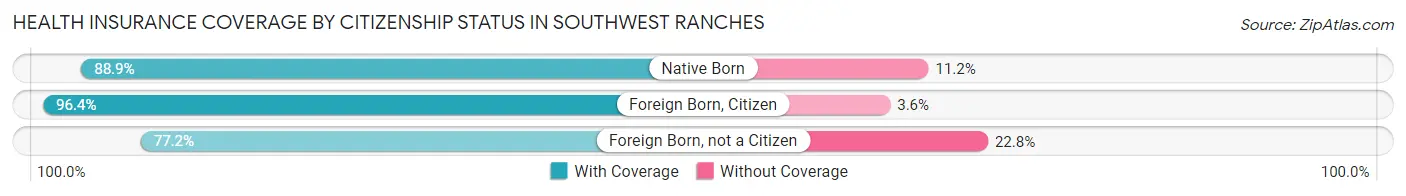
| Citizenship Status | With Coverage | Without Coverage |
| Native Born | 271 (88.8%) | 34 (11.2%) |
| Foreign Born, Citizen | 1,647 (96.4%) | 62 (3.6%) |
| Foreign Born, not a Citizen | 483 (77.2%) | 143 (22.8%) |
Health Insurance Coverage by Household Income in Southwest Ranches
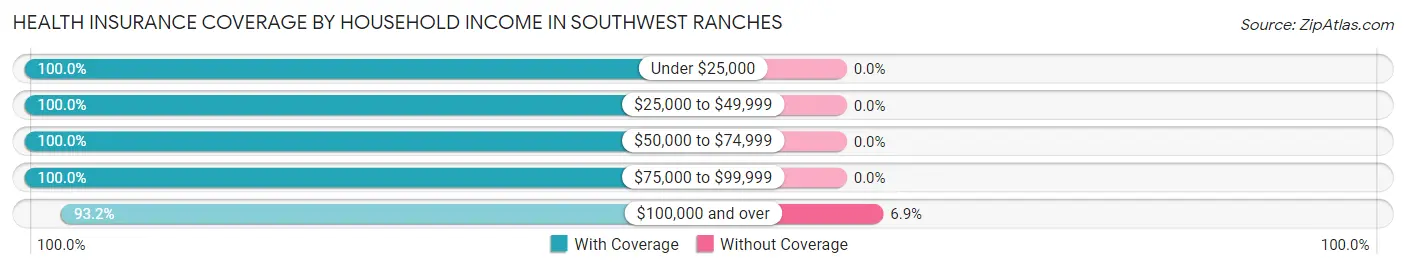
| Household Income | With Coverage | Without Coverage |
| Under $25,000 | 165 (100.0%) | 0 (0.0%) |
| $25,000 to $49,999 | 205 (100.0%) | 0 (0.0%) |
| $50,000 to $74,999 | 624 (100.0%) | 0 (0.0%) |
| $75,000 to $99,999 | 344 (100.0%) | 0 (0.0%) |
| $100,000 and over | 5,783 (93.1%) | 425 (6.9%) |
Public vs Private Health Insurance Coverage by Age in Southwest Ranches
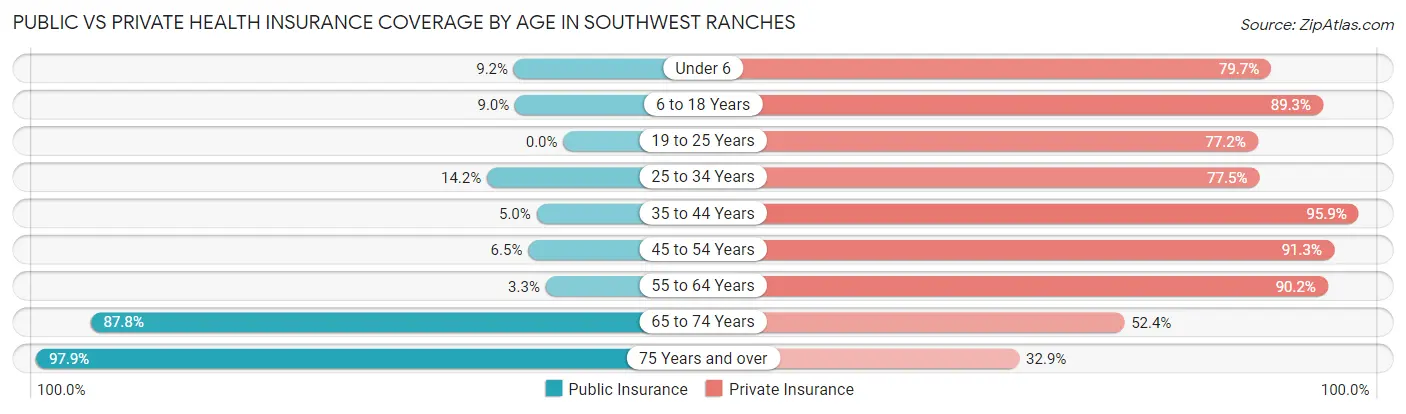
| Age Bracket | Public Insurance | Private Insurance |
| Under 6 | 28 (9.2%) | 243 (79.7%) |
| 6 to 18 Years | 153 (8.9%) | 1,526 (89.3%) |
| 19 to 25 Years | 0 (0.0%) | 483 (77.2%) |
| 25 to 34 Years | 68 (14.2%) | 372 (77.5%) |
| 35 to 44 Years | 50 (5.0%) | 967 (95.9%) |
| 45 to 54 Years | 60 (6.5%) | 840 (91.3%) |
| 55 to 64 Years | 34 (3.3%) | 937 (90.2%) |
| 65 to 74 Years | 817 (87.8%) | 488 (52.4%) |
| 75 Years and over | 556 (97.9%) | 187 (32.9%) |
| Total | 1,766 (23.3%) | 6,043 (79.7%) |
Disability Status by Sex by Age in Southwest Ranches
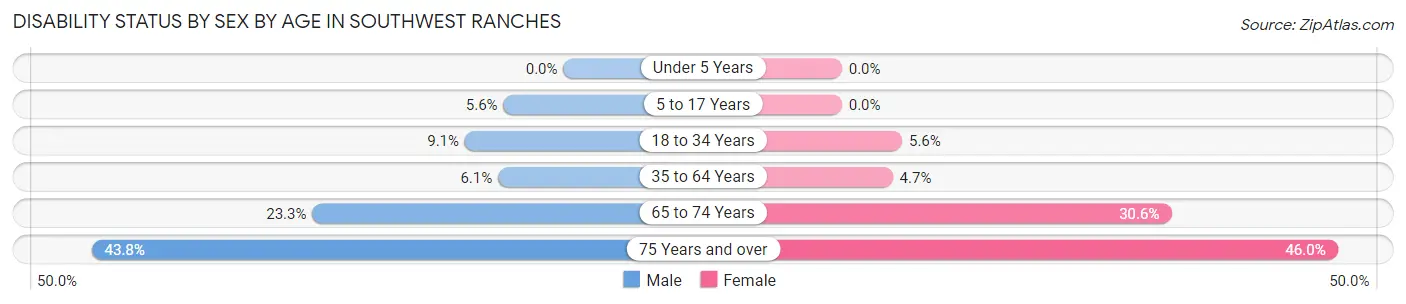
| Age Bracket | Male | Female |
| Under 5 Years | 0 (0.0%) | 0 (0.0%) |
| 5 to 17 Years | 41 (5.6%) | 0 (0.0%) |
| 18 to 34 Years | 64 (9.1%) | 31 (5.6%) |
| 35 to 64 Years | 90 (6.1%) | 70 (4.7%) |
| 65 to 74 Years | 82 (23.3%) | 177 (30.6%) |
| 75 Years and over | 183 (43.8%) | 69 (46.0%) |
Disability Class by Sex by Age in Southwest Ranches
Disability Class: Hearing Difficulty
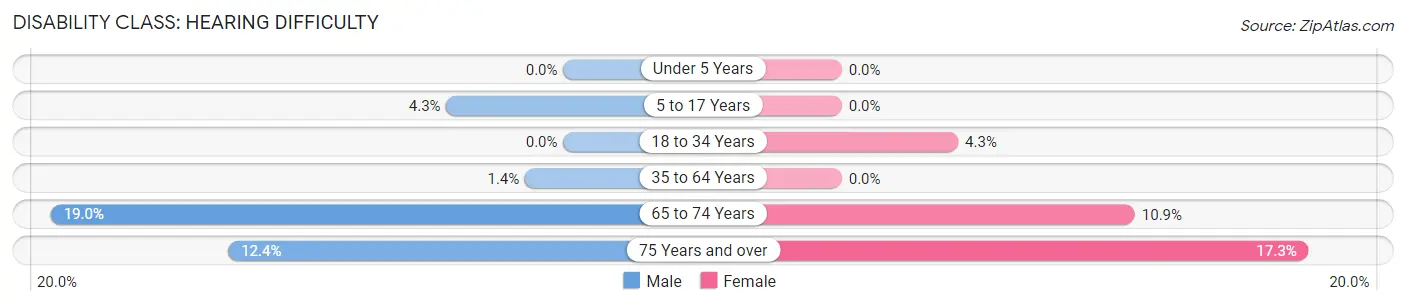
| Age Bracket | Male | Female |
| Under 5 Years | 0 (0.0%) | 0 (0.0%) |
| 5 to 17 Years | 32 (4.3%) | 0 (0.0%) |
| 18 to 34 Years | 0 (0.0%) | 24 (4.3%) |
| 35 to 64 Years | 21 (1.4%) | 0 (0.0%) |
| 65 to 74 Years | 67 (19.0%) | 63 (10.9%) |
| 75 Years and over | 52 (12.4%) | 26 (17.3%) |
Disability Class: Vision Difficulty
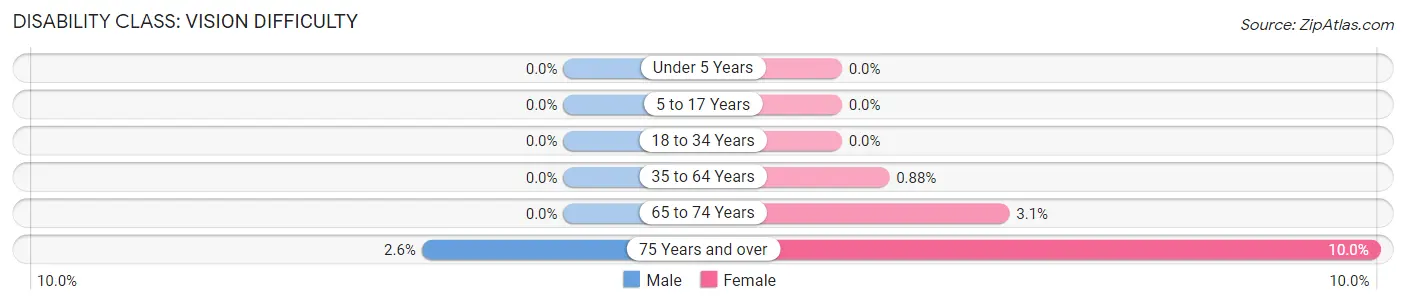
| Age Bracket | Male | Female |
| Under 5 Years | 0 (0.0%) | 0 (0.0%) |
| 5 to 17 Years | 0 (0.0%) | 0 (0.0%) |
| 18 to 34 Years | 0 (0.0%) | 0 (0.0%) |
| 35 to 64 Years | 0 (0.0%) | 13 (0.9%) |
| 65 to 74 Years | 0 (0.0%) | 18 (3.1%) |
| 75 Years and over | 11 (2.6%) | 15 (10.0%) |
Disability Class: Cognitive Difficulty
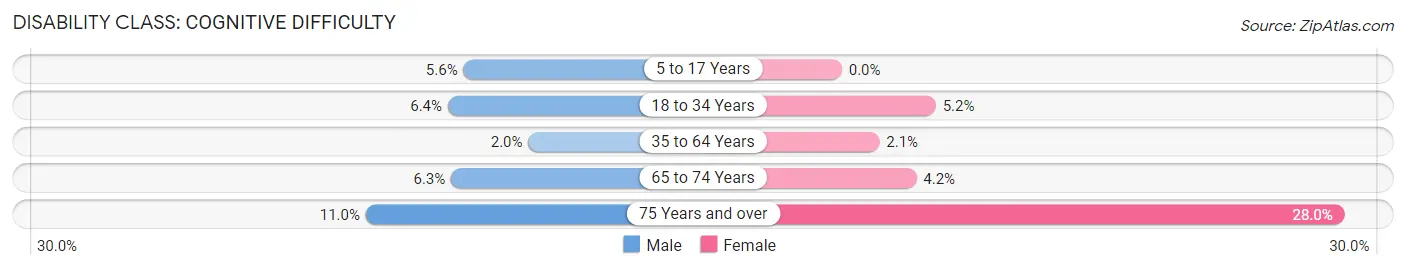
| Age Bracket | Male | Female |
| 5 to 17 Years | 41 (5.6%) | 0 (0.0%) |
| 18 to 34 Years | 45 (6.4%) | 29 (5.2%) |
| 35 to 64 Years | 29 (1.9%) | 31 (2.1%) |
| 65 to 74 Years | 22 (6.2%) | 24 (4.2%) |
| 75 Years and over | 46 (11.0%) | 42 (28.0%) |
Disability Class: Ambulatory Difficulty
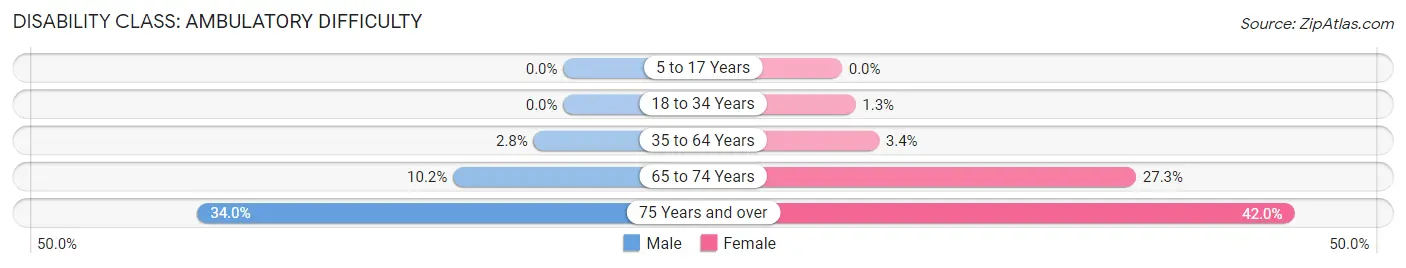
| Age Bracket | Male | Female |
| 5 to 17 Years | 0 (0.0%) | 0 (0.0%) |
| 18 to 34 Years | 0 (0.0%) | 7 (1.3%) |
| 35 to 64 Years | 41 (2.8%) | 51 (3.4%) |
| 65 to 74 Years | 36 (10.2%) | 158 (27.3%) |
| 75 Years and over | 142 (34.0%) | 63 (42.0%) |
Disability Class: Self-Care Difficulty
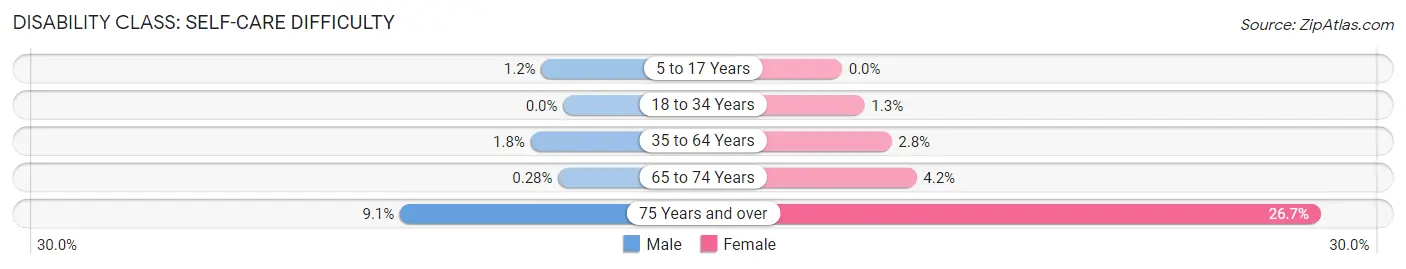
| Age Bracket | Male | Female |
| 5 to 17 Years | 9 (1.2%) | 0 (0.0%) |
| 18 to 34 Years | 0 (0.0%) | 7 (1.3%) |
| 35 to 64 Years | 27 (1.8%) | 41 (2.8%) |
| 65 to 74 Years | 1 (0.3%) | 24 (4.2%) |
| 75 Years and over | 38 (9.1%) | 40 (26.7%) |
Technology Access in Southwest Ranches
Computing Device Access in Southwest Ranches
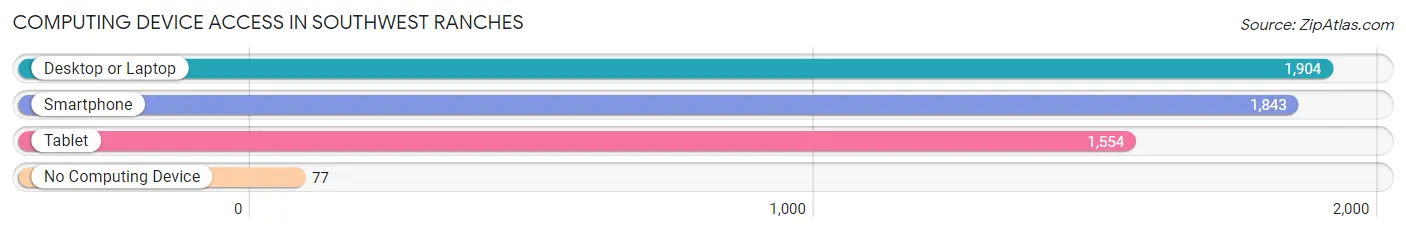
| Device Type | # Households | % Households |
| Desktop or Laptop | 1,904 | 94.1% |
| Smartphone | 1,843 | 91.1% |
| Tablet | 1,554 | 76.8% |
| No Computing Device | 77 | 3.8% |
| Total | 2,024 | 100.0% |
Internet Access in Southwest Ranches
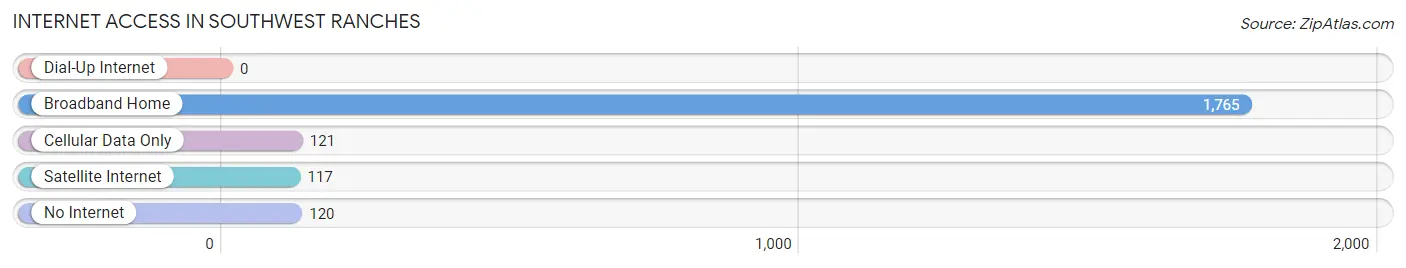
| Internet Type | # Households | % Households |
| Dial-Up Internet | 0 | 0.0% |
| Broadband Home | 1,765 | 87.2% |
| Cellular Data Only | 121 | 6.0% |
| Satellite Internet | 117 | 5.8% |
| No Internet | 120 | 5.9% |
| Total | 2,024 | 100.0% |
Southwest Ranches Summary
Southwest Ranches is a town located in Broward County, Florida, United States. It is located on the western edge of the Everglades, and is bordered by the cities of Pembroke Pines, Davie, and Miramar. The town was incorporated in 2000, and is home to a population of approximately 8,000 people.
History
The area that is now Southwest Ranches was originally inhabited by the Tequesta Indians, who lived in the area for thousands of years before the arrival of Europeans. The first Europeans to settle in the area were the Seminole Indians, who arrived in the late 1700s. The Seminoles were eventually forced out of the area by the United States government in the early 1800s.
In the late 1800s, the area was settled by homesteaders, who established small farms and ranches. The area was known as Sunshine Ranches, and was home to a variety of crops, including tomatoes, beans, and citrus. The area was also home to a variety of livestock, including cattle, horses, and pigs.
In the early 1900s, the area began to be developed as a residential community. The first subdivision was established in 1925, and the area was eventually incorporated as the Town of Southwest Ranches in 2000.
Geography
Southwest Ranches is located in Broward County, Florida, and is bordered by the cities of Pembroke Pines, Davie, and Miramar. The town is located on the western edge of the Everglades, and is home to a variety of wildlife, including alligators, snakes, and birds. The town is also home to a variety of plant life, including cypress trees, sawgrass, and wildflowers.
The town is located approximately 25 miles from downtown Fort Lauderdale, and is accessible via Interstate 75 and the Florida Turnpike. The town is also served by the Broward County Transit bus system.
Economy
The economy of Southwest Ranches is largely based on agriculture and tourism. The town is home to a variety of farms and ranches, which produce a variety of crops, including tomatoes, beans, and citrus. The town is also home to a variety of tourist attractions, including the Everglades Holiday Park, which offers airboat rides and wildlife shows.
The town is also home to a variety of businesses, including restaurants, retail stores, and professional services. The town is also home to a variety of manufacturing and industrial businesses, including a concrete plant and a metal fabrication plant.
Demographics
As of the 2010 census, the population of Southwest Ranches was 8,000. The racial makeup of the town was 79.3% White, 8.3% African American, 0.3% Native American, 4.3% Asian, and 7.7% from other races. The median household income was $76,000, and the median home value was $400,000.
The town is served by the Broward County Public Schools system, and is home to a variety of private schools, including the American Heritage School and the Sagemont School. The town is also home to a variety of churches, including the First Baptist Church of Southwest Ranches and the Church of Jesus Christ of Latter-day Saints.
Common Questions
What is Per Capita Income in Southwest Ranches?
Per Capita income in Southwest Ranches is $65,046.
What is the Median Family Income in Southwest Ranches?
Median Family Income in Southwest Ranches is $190,273.
What is the Median Household income in Southwest Ranches?
Median Household Income in Southwest Ranches is $165,556.
What is Income or Wage Gap in Southwest Ranches?
Income or Wage Gap in Southwest Ranches is 33.3%.
Women in Southwest Ranches earn 66.7 cents for every dollar earned by a man.
What is Inequality or Gini Index in Southwest Ranches?
Inequality or Gini Index in Southwest Ranches is 0.46.
What is the Total Population of Southwest Ranches?
Total Population of Southwest Ranches is 7,589.
What is the Total Male Population of Southwest Ranches?
Total Male Population of Southwest Ranches is 3,821.
What is the Total Female Population of Southwest Ranches?
Total Female Population of Southwest Ranches is 3,768.
What is the Ratio of Males per 100 Females in Southwest Ranches?
There are 101.41 Males per 100 Females in Southwest Ranches.
What is the Ratio of Females per 100 Males in Southwest Ranches?
There are 98.61 Females per 100 Males in Southwest Ranches.
What is the Median Population Age in Southwest Ranches?
Median Population Age in Southwest Ranches is 41.6 Years.
What is the Average Family Size in Southwest Ranches
Average Family Size in Southwest Ranches is 4.0 People.
What is the Average Household Size in Southwest Ranches
Average Household Size in Southwest Ranches is 3.7 People.
How Large is the Labor Force in Southwest Ranches?
There are 3,816 People in the Labor Forcein in Southwest Ranches.
What is the Percentage of People in the Labor Force in Southwest Ranches?
62.7% of People are in the Labor Force in Southwest Ranches.
What is the Unemployment Rate in Southwest Ranches?
Unemployment Rate in Southwest Ranches is 1.6%.