Taylor Creek, FL Map & Demographics
Taylor Creek Map
Taylor Creek Overview
$27,721
PER CAPITA INCOME
$45,986
AVG FAMILY INCOME
$41,538
AVG HOUSEHOLD INCOME
11.6%
WAGE / INCOME GAP [ % ]
88.4¢/ $1
WAGE / INCOME GAP [ $ ]
0.51
INEQUALITY / GINI INDEX
4,566
TOTAL POPULATION
2,477
MALE POPULATION
2,089
FEMALE POPULATION
118.57
MALES / 100 FEMALES
84.34
FEMALES / 100 MALES
54.5
MEDIAN AGE
2.6
AVG FAMILY SIZE
2.2
AVG HOUSEHOLD SIZE
1,616
LABOR FORCE [ PEOPLE ]
43.7%
PERCENT IN LABOR FORCE
10.4%
UNEMPLOYMENT RATE
Income in Taylor Creek
Income Overview in Taylor Creek
Per Capita Income in Taylor Creek is $27,721, while median incomes of families and households are $45,986 and $41,538 respectively.
| Characteristic | Number | Measure |
| Per Capita Income | 4,566 | $27,721 |
| Median Family Income | 1,175 | $45,986 |
| Mean Family Income | 1,175 | $55,516 |
| Median Household Income | 2,048 | $41,538 |
| Mean Household Income | 2,048 | $59,618 |
| Income Deficit | 1,175 | $0 |
| Wage / Income Gap (%) | 4,566 | 11.57% |
| Wage / Income Gap ($) | 4,566 | 88.43¢ per $1 |
| Gini / Inequality Index | 4,566 | 0.51 |
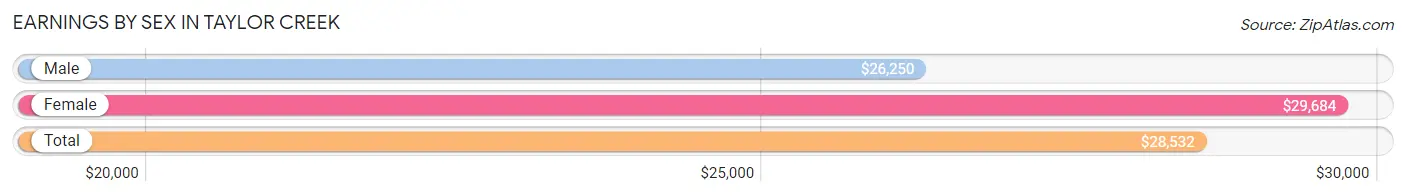
Earnings by Sex in Taylor Creek
Average Earnings in Taylor Creek are $28,532, $26,250 for men and $29,684 for women, a difference of 11.6%.
| Sex | Number | Average Earnings |
| Male | 989 (57.3%) | $26,250 |
| Female | 738 (42.7%) | $29,684 |
| Total | 1,727 (100.0%) | $28,532 |
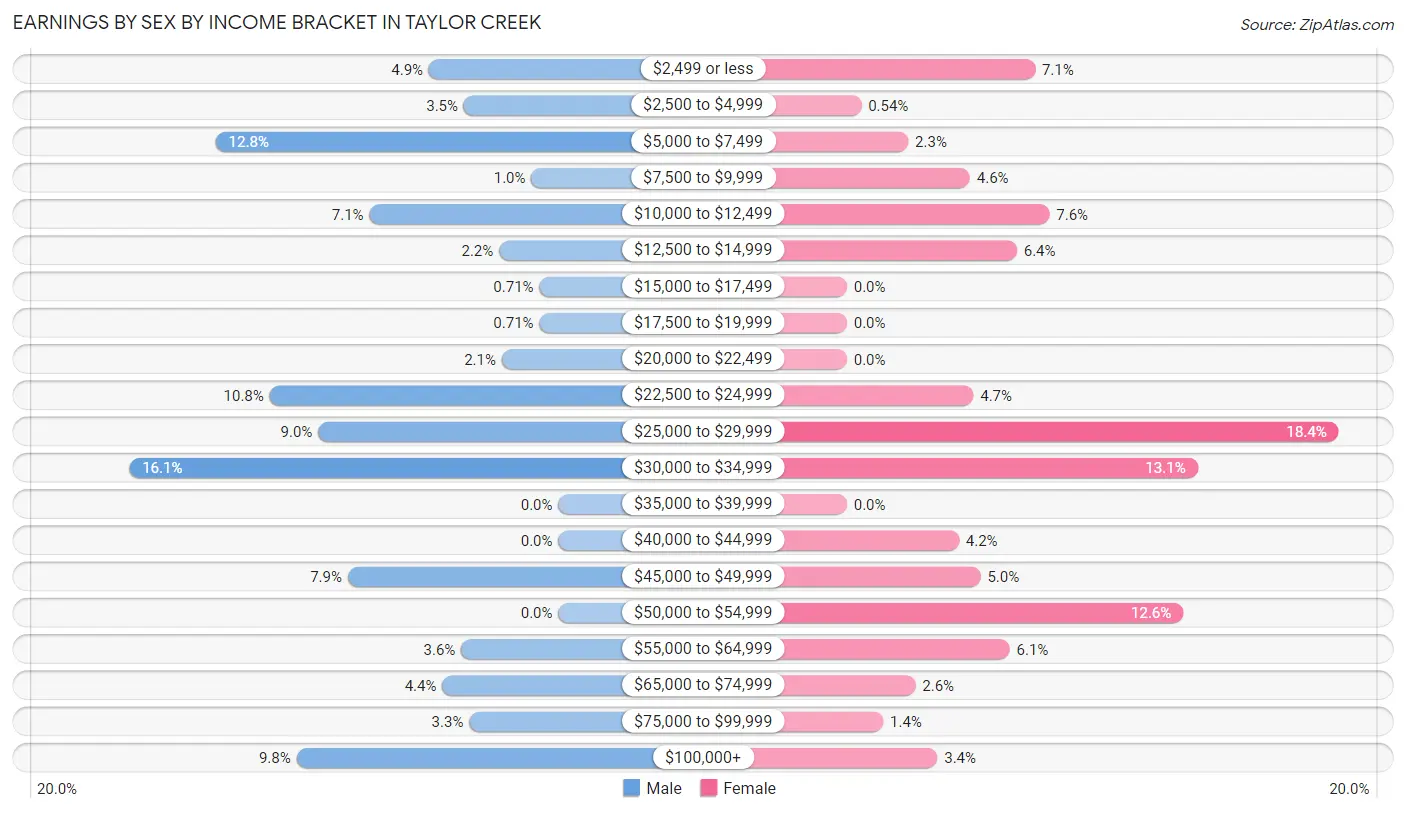
Earnings by Sex by Income Bracket in Taylor Creek
The most common earnings brackets in Taylor Creek are $30,000 to $34,999 for men (159 | 16.1%) and $25,000 to $29,999 for women (136 | 18.4%).
| Income | Male | Female |
| $2,499 or less | 48 (4.9%) | 52 (7.0%) |
| $2,500 to $4,999 | 35 (3.5%) | 4 (0.5%) |
| $5,000 to $7,499 | 127 (12.8%) | 17 (2.3%) |
| $7,500 to $9,999 | 10 (1.0%) | 34 (4.6%) |
| $10,000 to $12,499 | 70 (7.1%) | 56 (7.6%) |
| $12,500 to $14,999 | 22 (2.2%) | 47 (6.4%) |
| $15,000 to $17,499 | 7 (0.7%) | 0 (0.0%) |
| $17,500 to $19,999 | 7 (0.7%) | 0 (0.0%) |
| $20,000 to $22,499 | 21 (2.1%) | 0 (0.0%) |
| $22,500 to $24,999 | 107 (10.8%) | 35 (4.7%) |
| $25,000 to $29,999 | 89 (9.0%) | 136 (18.4%) |
| $30,000 to $34,999 | 159 (16.1%) | 97 (13.1%) |
| $35,000 to $39,999 | 0 (0.0%) | 0 (0.0%) |
| $40,000 to $44,999 | 0 (0.0%) | 31 (4.2%) |
| $45,000 to $49,999 | 78 (7.9%) | 37 (5.0%) |
| $50,000 to $54,999 | 0 (0.0%) | 93 (12.6%) |
| $55,000 to $64,999 | 36 (3.6%) | 45 (6.1%) |
| $65,000 to $74,999 | 43 (4.3%) | 19 (2.6%) |
| $75,000 to $99,999 | 33 (3.3%) | 10 (1.4%) |
| $100,000+ | 97 (9.8%) | 25 (3.4%) |
| Total | 989 (100.0%) | 738 (100.0%) |
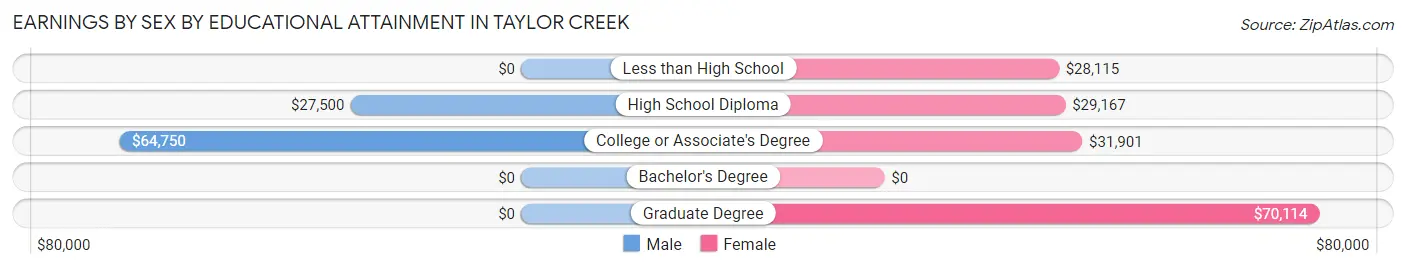
Earnings by Sex by Educational Attainment in Taylor Creek
Average earnings in Taylor Creek are $32,995 for men and $30,019 for women, a difference of 9.0%. Men with an educational attainment of college or associate's degree enjoy the highest average annual earnings of $64,750, while those with high school diploma education earn the least with $27,500. Women with an educational attainment of graduate degree earn the most with the average annual earnings of $70,114, while those with less than high school education have the smallest earnings of $28,115.
| Educational Attainment | Male Income | Female Income |
| Less than High School | - | - |
| High School Diploma | $27,500 | $29,167 |
| College or Associate's Degree | $64,750 | $31,901 |
| Bachelor's Degree | - | - |
| Graduate Degree | - | - |
| Total | $32,995 | $30,019 |
Family Income in Taylor Creek
Family Income Brackets in Taylor Creek
According to the Taylor Creek family income data, there are 323 families falling into the $25,000 to $34,999 income range, which is the most common income bracket and makes up 27.5% of all families. Conversely, the $200,000+ income bracket is the least frequent group with only 7 families (0.6%) belonging to this category.
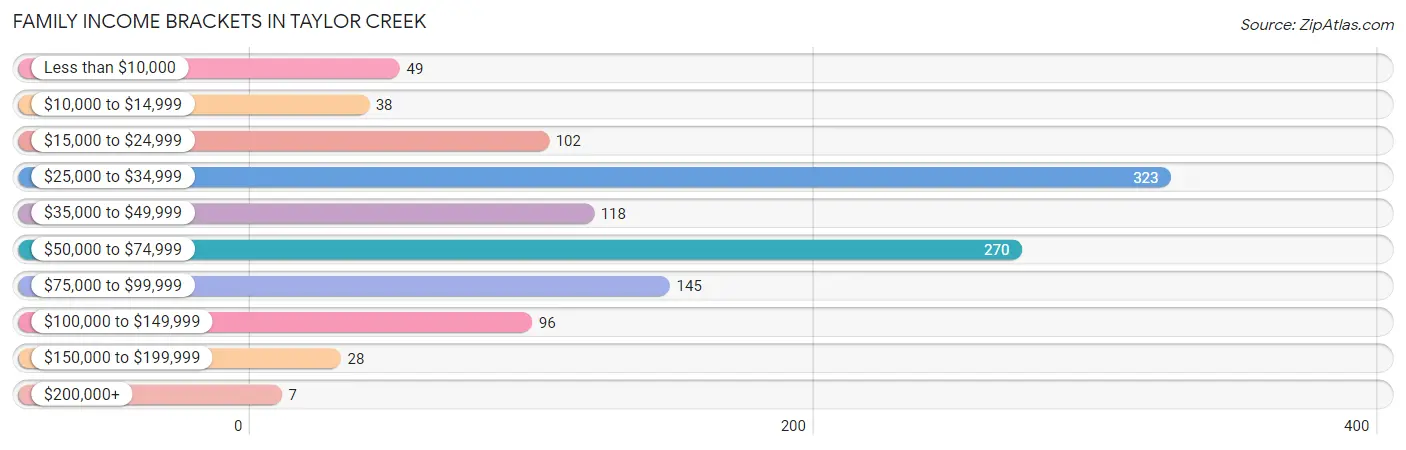
| Income Bracket | # Families | % Families |
| Less than $10,000 | 49 | 4.2% |
| $10,000 to $14,999 | 38 | 3.2% |
| $15,000 to $24,999 | 102 | 8.7% |
| $25,000 to $34,999 | 323 | 27.5% |
| $35,000 to $49,999 | 118 | 10.0% |
| $50,000 to $74,999 | 270 | 23.0% |
| $75,000 to $99,999 | 145 | 12.3% |
| $100,000 to $149,999 | 96 | 8.2% |
| $150,000 to $199,999 | 28 | 2.4% |
| $200,000+ | 7 | 0.6% |
Family Income by Famaliy Size in Taylor Creek
4-person families (163 | 13.9%) account for the highest median family income in Taylor Creek with $57,101 per family, while 2-person families (837 | 71.2%) have the highest median income of $18,958 per family member.
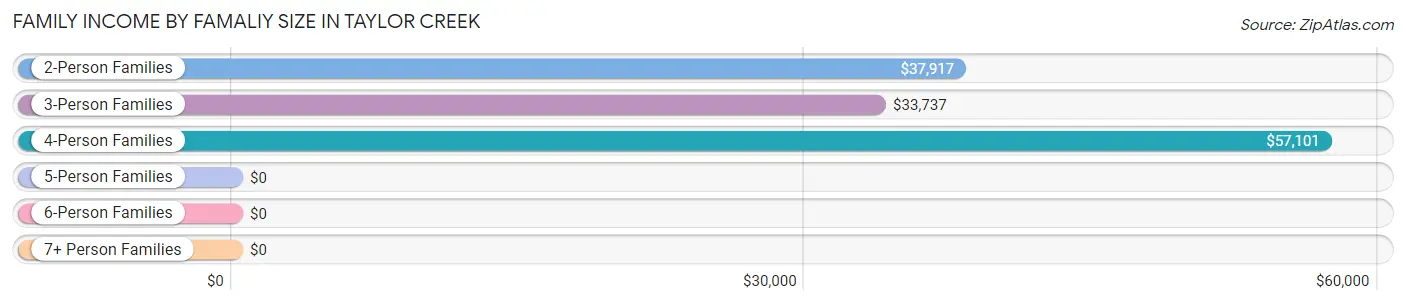
| Income Bracket | # Families | Median Income |
| 2-Person Families | 837 (71.2%) | $37,917 |
| 3-Person Families | 148 (12.6%) | $33,737 |
| 4-Person Families | 163 (13.9%) | $57,101 |
| 5-Person Families | 20 (1.7%) | $0 |
| 6-Person Families | 7 (0.6%) | $0 |
| 7+ Person Families | 0 (0.0%) | $0 |
| Total | 1,175 (100.0%) | $45,986 |
Family Income by Number of Earners in Taylor Creek
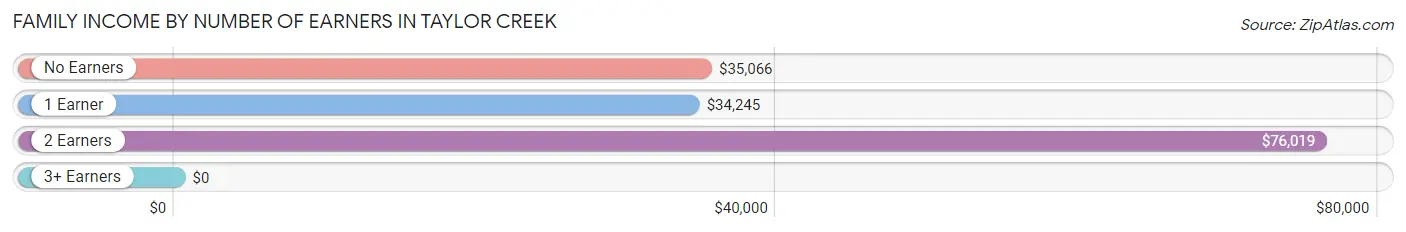
| Number of Earners | # Families | Median Income |
| No Earners | 466 (39.7%) | $35,066 |
| 1 Earner | 420 (35.7%) | $34,245 |
| 2 Earners | 255 (21.7%) | $76,019 |
| 3+ Earners | 34 (2.9%) | $0 |
| Total | 1,175 (100.0%) | $45,986 |
Household Income in Taylor Creek
Household Income Brackets in Taylor Creek
With 428 households falling in the category, the $35,000 to $49,999 income range is the most frequent in Taylor Creek, accounting for 20.9% of all households. In contrast, only 18 households (0.9%) fall into the $200,000+ income bracket, making it the least populous group.
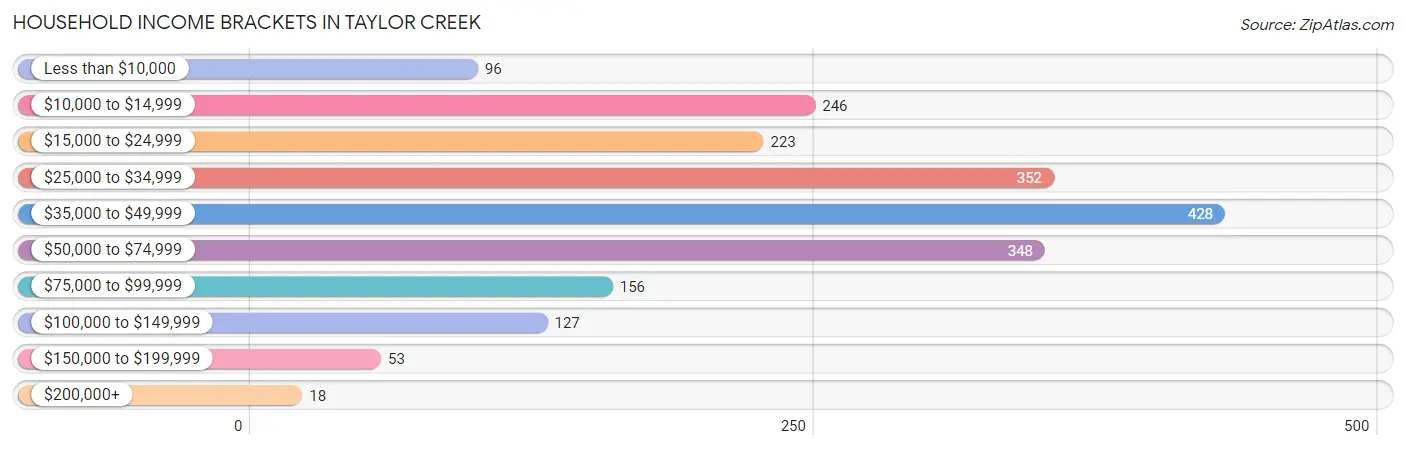
| Income Bracket | # Households | % Households |
| Less than $10,000 | 96 | 4.7% |
| $10,000 to $14,999 | 246 | 12.0% |
| $15,000 to $24,999 | 223 | 10.9% |
| $25,000 to $34,999 | 352 | 17.2% |
| $35,000 to $49,999 | 428 | 20.9% |
| $50,000 to $74,999 | 348 | 17.0% |
| $75,000 to $99,999 | 156 | 7.6% |
| $100,000 to $149,999 | 127 | 6.2% |
| $150,000 to $199,999 | 53 | 2.6% |
| $200,000+ | 18 | 0.9% |
Household Income by Householder Age in Taylor Creek
The median household income in Taylor Creek is $41,538, with the highest median household income of $48,620 found in the 25 to 44 years age bracket for the primary householder. A total of 483 households (23.6%) fall into this category. Meanwhile, the 15 to 24 years age bracket for the primary householder has the lowest median household income of $0, with 46 households (2.2%) in this group.
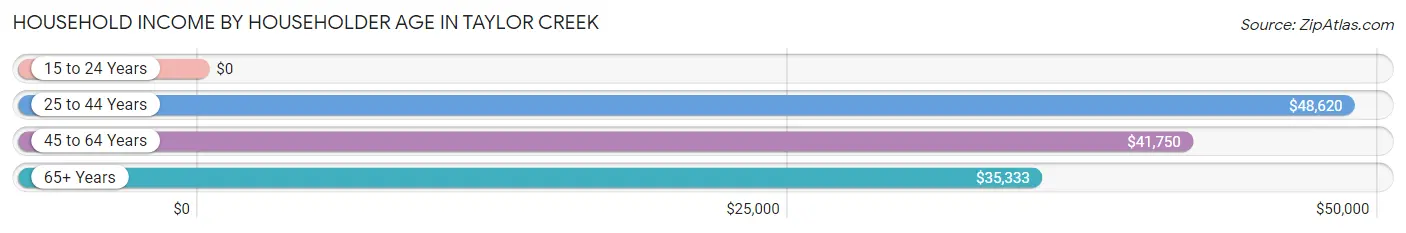
| Income Bracket | # Households | Median Income |
| 15 to 24 Years | 46 (2.2%) | $0 |
| 25 to 44 Years | 483 (23.6%) | $48,620 |
| 45 to 64 Years | 613 (29.9%) | $41,750 |
| 65+ Years | 906 (44.2%) | $35,333 |
| Total | 2,048 (100.0%) | $41,538 |
Poverty in Taylor Creek
Income Below Poverty by Sex and Age in Taylor Creek
With 18.8% poverty level for males and 19.7% for females among the residents of Taylor Creek, 16 and 17 year old males and 18 to 24 year old females are the most vulnerable to poverty, with 106 males (88.3%) and 25 females (100.0%) in their respective age groups living below the poverty level.
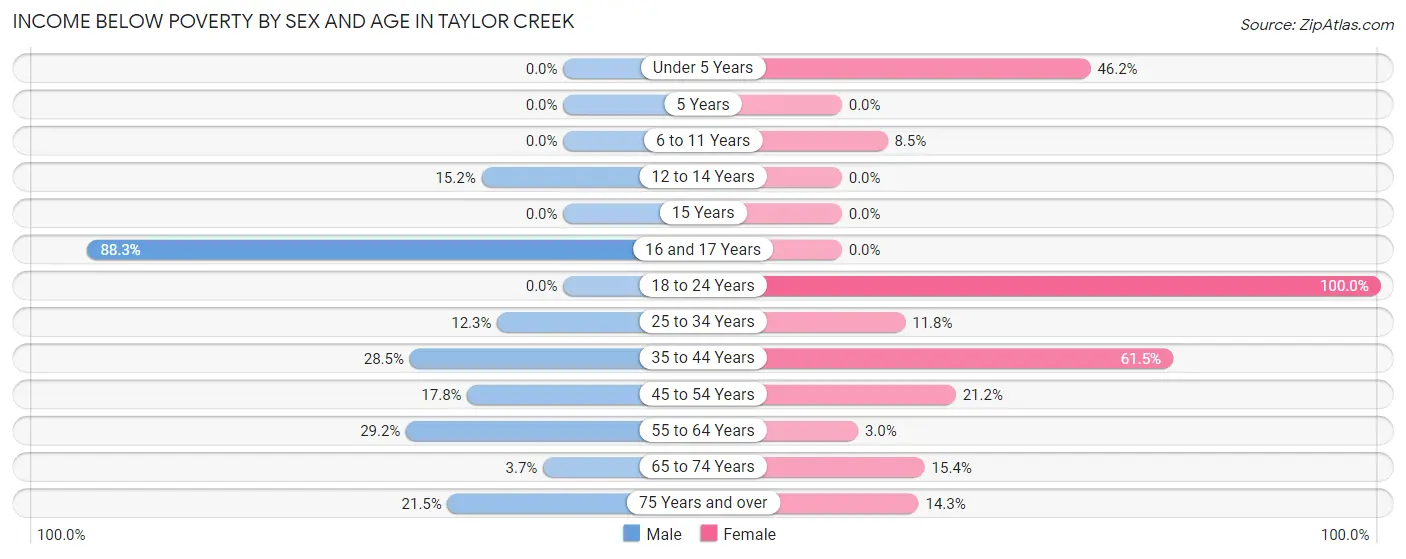
| Age Bracket | Male | Female |
| Under 5 Years | 0 (0.0%) | 36 (46.2%) |
| 5 Years | 0 (0.0%) | 0 (0.0%) |
| 6 to 11 Years | 0 (0.0%) | 20 (8.5%) |
| 12 to 14 Years | 12 (15.2%) | 0 (0.0%) |
| 15 Years | 0 (0.0%) | 0 (0.0%) |
| 16 and 17 Years | 106 (88.3%) | 0 (0.0%) |
| 18 to 24 Years | 0 (0.0%) | 25 (100.0%) |
| 25 to 34 Years | 32 (12.3%) | 27 (11.8%) |
| 35 to 44 Years | 59 (28.5%) | 169 (61.5%) |
| 45 to 54 Years | 39 (17.8%) | 11 (21.1%) |
| 55 to 64 Years | 119 (29.2%) | 11 (3.0%) |
| 65 to 74 Years | 16 (3.7%) | 58 (15.4%) |
| 75 Years and over | 61 (21.5%) | 54 (14.2%) |
| Total | 444 (18.8%) | 411 (19.7%) |
Income Above Poverty by Sex and Age in Taylor Creek
According to the poverty statistics in Taylor Creek, males aged under 5 years and females aged 5 years are the age groups that are most secure financially, with 100.0% of males and 100.0% of females in these age groups living above the poverty line.
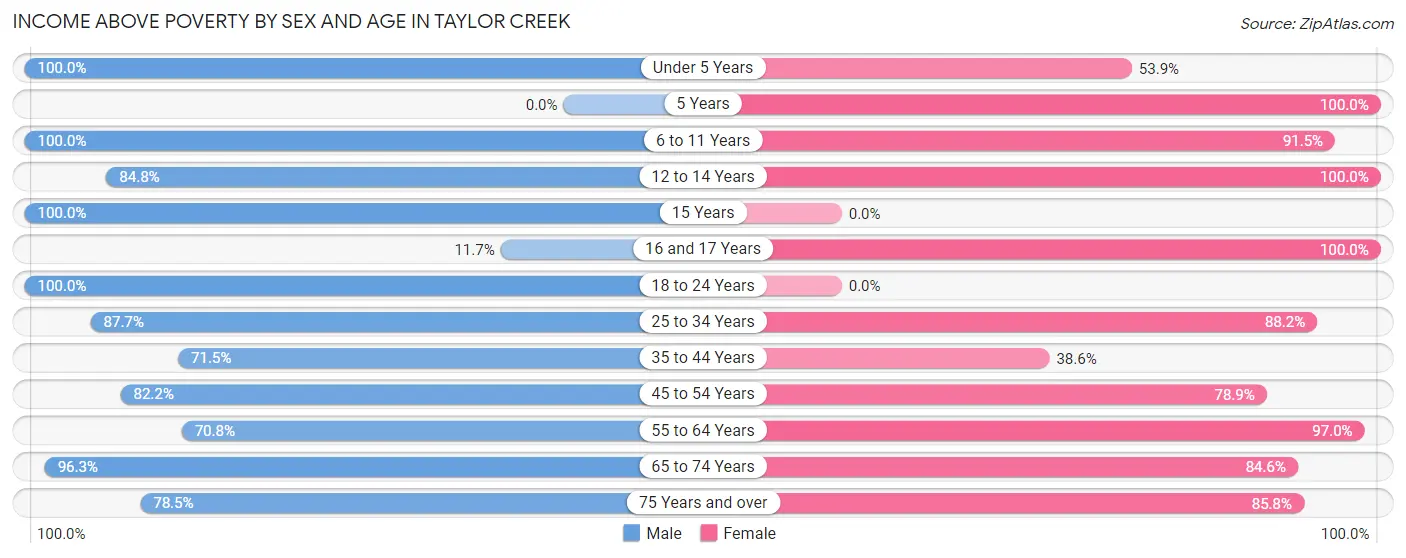
| Age Bracket | Male | Female |
| Under 5 Years | 90 (100.0%) | 42 (53.8%) |
| 5 Years | 0 (0.0%) | 43 (100.0%) |
| 6 to 11 Years | 172 (100.0%) | 216 (91.5%) |
| 12 to 14 Years | 67 (84.8%) | 15 (100.0%) |
| 15 Years | 39 (100.0%) | 0 (0.0%) |
| 16 and 17 Years | 14 (11.7%) | 13 (100.0%) |
| 18 to 24 Years | 54 (100.0%) | 0 (0.0%) |
| 25 to 34 Years | 229 (87.7%) | 202 (88.2%) |
| 35 to 44 Years | 148 (71.5%) | 106 (38.6%) |
| 45 to 54 Years | 180 (82.2%) | 41 (78.8%) |
| 55 to 64 Years | 289 (70.8%) | 356 (97.0%) |
| 65 to 74 Years | 412 (96.3%) | 319 (84.6%) |
| 75 Years and over | 223 (78.5%) | 325 (85.8%) |
| Total | 1,917 (81.2%) | 1,678 (80.3%) |
Income Below Poverty Among Married-Couple Families in Taylor Creek
The poverty statistics for married-couple families in Taylor Creek show that 5.1% or 39 of the total 757 families live below the poverty line. Families with 1 or 2 children have the highest poverty rate of 5.9%, comprising of 9 families. On the other hand, families with 3 or 4 children have the lowest poverty rate of 0.0%, which includes 0 families.
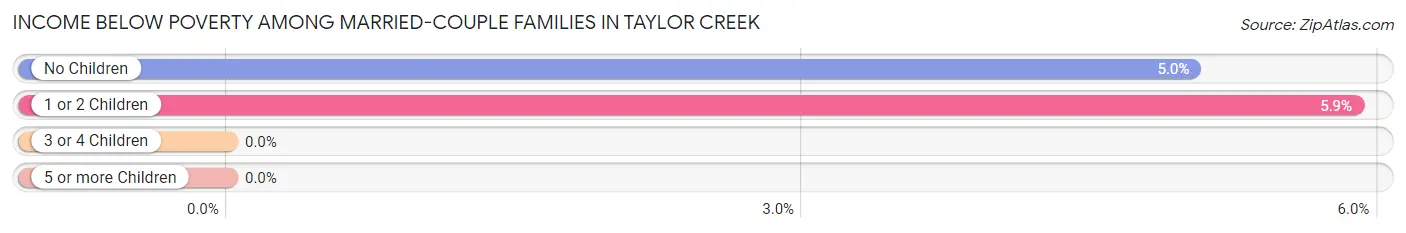
| Children | Above Poverty | Below Poverty |
| No Children | 567 (95.0%) | 30 (5.0%) |
| 1 or 2 Children | 144 (94.1%) | 9 (5.9%) |
| 3 or 4 Children | 7 (100.0%) | 0 (0.0%) |
| 5 or more Children | 0 (0.0%) | 0 (0.0%) |
| Total | 718 (94.9%) | 39 (5.1%) |
Income Below Poverty Among Single-Parent Households in Taylor Creek
According to the poverty data in Taylor Creek, 13.2% or 38 single-father households and 28.5% or 37 single-mother households are living below the poverty line. Among single-father households, those with no children have the highest poverty rate, with 38 households (29.5%) experiencing poverty. Likewise, among single-mother households, those with 1 or 2 children have the highest poverty rate, with 25 households (55.6%) falling below the poverty line.
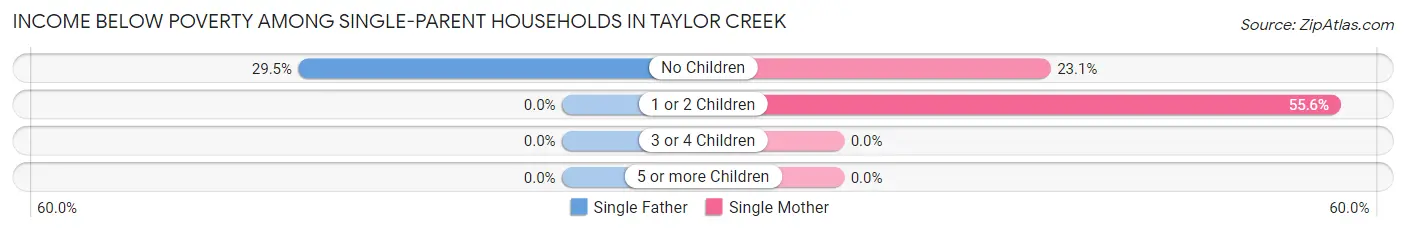
| Children | Single Father | Single Mother |
| No Children | 38 (29.5%) | 12 (23.1%) |
| 1 or 2 Children | 0 (0.0%) | 25 (55.6%) |
| 3 or 4 Children | 0 (0.0%) | 0 (0.0%) |
| 5 or more Children | 0 (0.0%) | 0 (0.0%) |
| Total | 38 (13.2%) | 37 (28.5%) |
Income Below Poverty Among Married-Couple vs Single-Parent Households in Taylor Creek
The poverty data for Taylor Creek shows that 39 of the married-couple family households (5.1%) and 75 of the single-parent households (17.9%) are living below the poverty level. Within the married-couple family households, those with 1 or 2 children have the highest poverty rate, with 9 households (5.9%) falling below the poverty line. Among the single-parent households, those with no children have the highest poverty rate, with 50 household (27.6%) living below poverty.
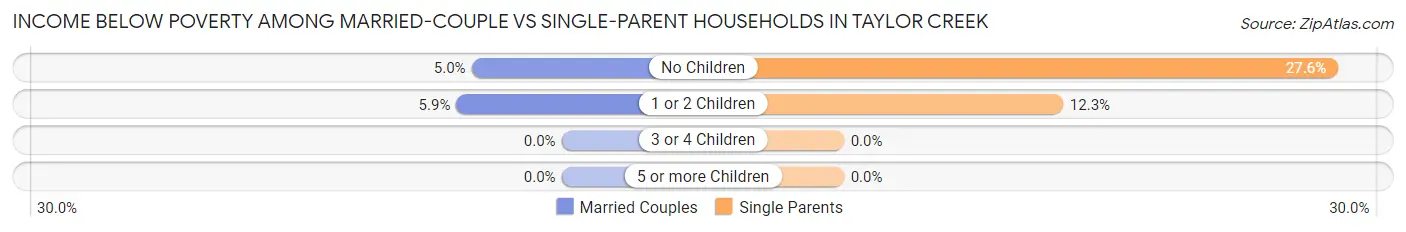
| Children | Married-Couple Families | Single-Parent Households |
| No Children | 30 (5.0%) | 50 (27.6%) |
| 1 or 2 Children | 9 (5.9%) | 25 (12.2%) |
| 3 or 4 Children | 0 (0.0%) | 0 (0.0%) |
| 5 or more Children | 0 (0.0%) | 0 (0.0%) |
| Total | 39 (5.1%) | 75 (17.9%) |
Race in Taylor Creek
The most populous races in Taylor Creek are White / Caucasian (3,808 | 83.4%), Hispanic or Latino (1,333 | 29.2%), and Two or more Races (418 | 9.1%).
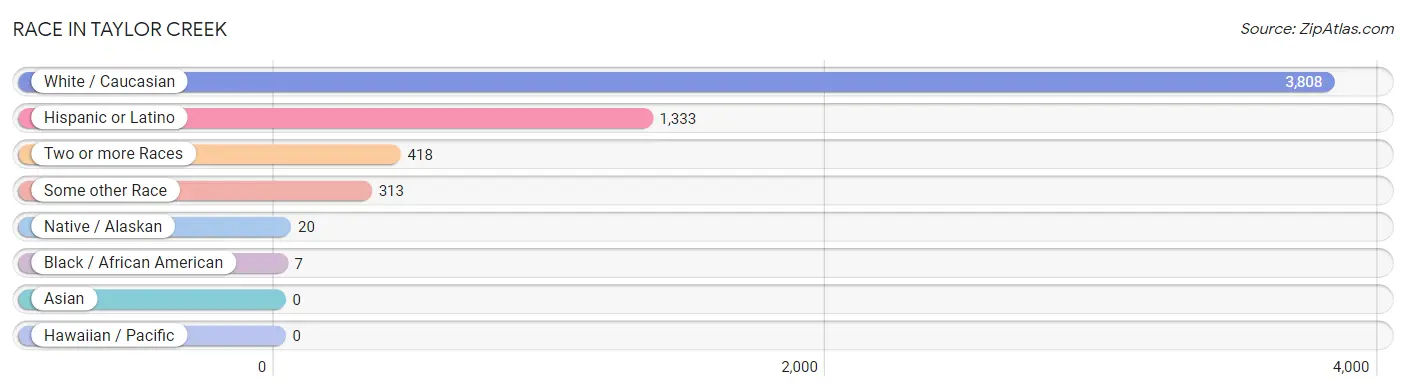
| Race | # Population | % Population |
| Asian | 0 | 0.0% |
| Black / African American | 7 | 0.2% |
| Hawaiian / Pacific | 0 | 0.0% |
| Hispanic or Latino | 1,333 | 29.2% |
| Native / Alaskan | 20 | 0.4% |
| White / Caucasian | 3,808 | 83.4% |
| Two or more Races | 418 | 9.1% |
| Some other Race | 313 | 6.9% |
| Total | 4,566 | 100.0% |
Ancestry in Taylor Creek
The most populous ancestries reported in Taylor Creek are Mexican (1,054 | 23.1%), Irish (603 | 13.2%), German (493 | 10.8%), English (353 | 7.7%), and American (311 | 6.8%), together accounting for 61.6% of all Taylor Creek residents.
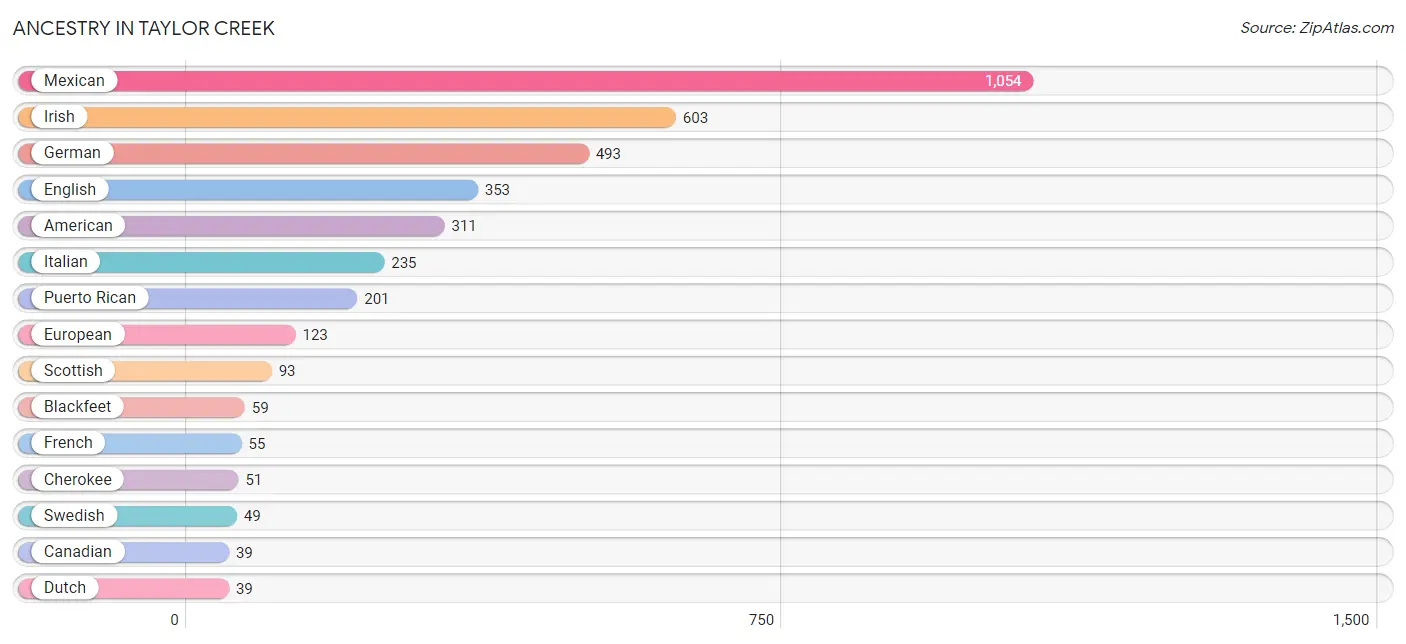
| Ancestry | # Population | % Population |
| American | 311 | 6.8% |
| Arab | 10 | 0.2% |
| Austrian | 19 | 0.4% |
| Basque | 14 | 0.3% |
| Blackfeet | 59 | 1.3% |
| British | 18 | 0.4% |
| Canadian | 39 | 0.9% |
| Cherokee | 51 | 1.1% |
| Cuban | 35 | 0.8% |
| Danish | 17 | 0.4% |
| Dominican | 38 | 0.8% |
| Dutch | 39 | 0.9% |
| Eastern European | 18 | 0.4% |
| English | 353 | 7.7% |
| European | 123 | 2.7% |
| French | 55 | 1.2% |
| French Canadian | 8 | 0.2% |
| German | 493 | 10.8% |
| Irish | 603 | 13.2% |
| Italian | 235 | 5.1% |
| Lebanese | 10 | 0.2% |
| Mexican | 1,054 | 23.1% |
| Norwegian | 8 | 0.2% |
| Polish | 17 | 0.4% |
| Puerto Rican | 201 | 4.4% |
| Romanian | 11 | 0.2% |
| Russian | 12 | 0.3% |
| Scotch-Irish | 39 | 0.9% |
| Scottish | 93 | 2.0% |
| Spanish | 5 | 0.1% |
| Swedish | 49 | 1.1% |
| Swiss | 8 | 0.2% |
| Trinidadian and Tobagonian | 7 | 0.2% | View All 33 Rows |
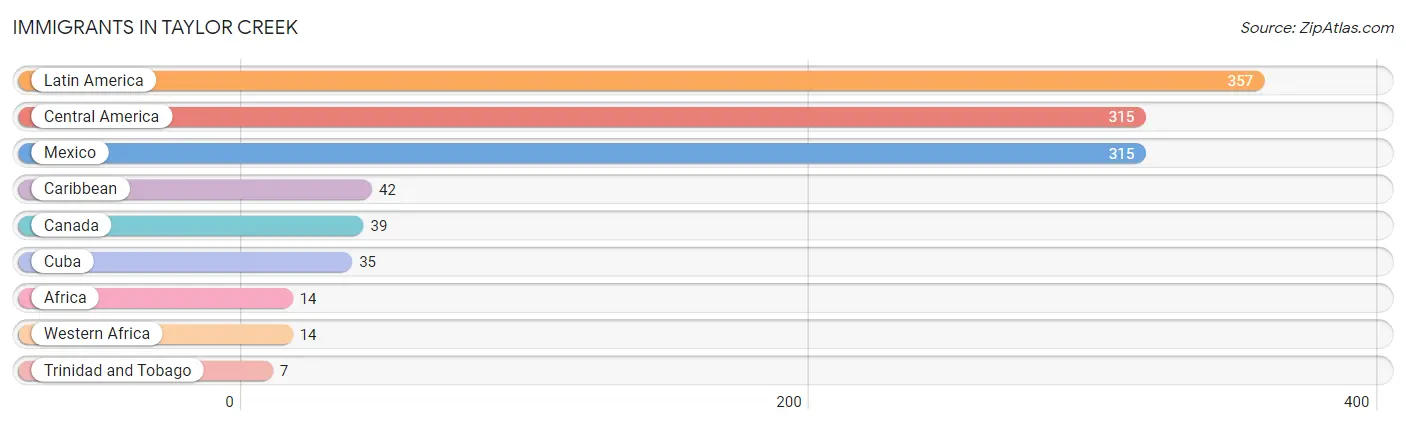
Immigrants in Taylor Creek
The most numerous immigrant groups reported in Taylor Creek came from Latin America (357 | 7.8%), Central America (315 | 6.9%), Mexico (315 | 6.9%), Caribbean (42 | 0.9%), and Canada (39 | 0.9%), together accounting for 23.4% of all Taylor Creek residents.
| Immigration Origin | # Population | % Population |
| Africa | 14 | 0.3% |
| Canada | 39 | 0.9% |
| Caribbean | 42 | 0.9% |
| Central America | 315 | 6.9% |
| Cuba | 35 | 0.8% |
| Latin America | 357 | 7.8% |
| Mexico | 315 | 6.9% |
| Trinidad and Tobago | 7 | 0.2% |
| Western Africa | 14 | 0.3% | View All 9 Rows |
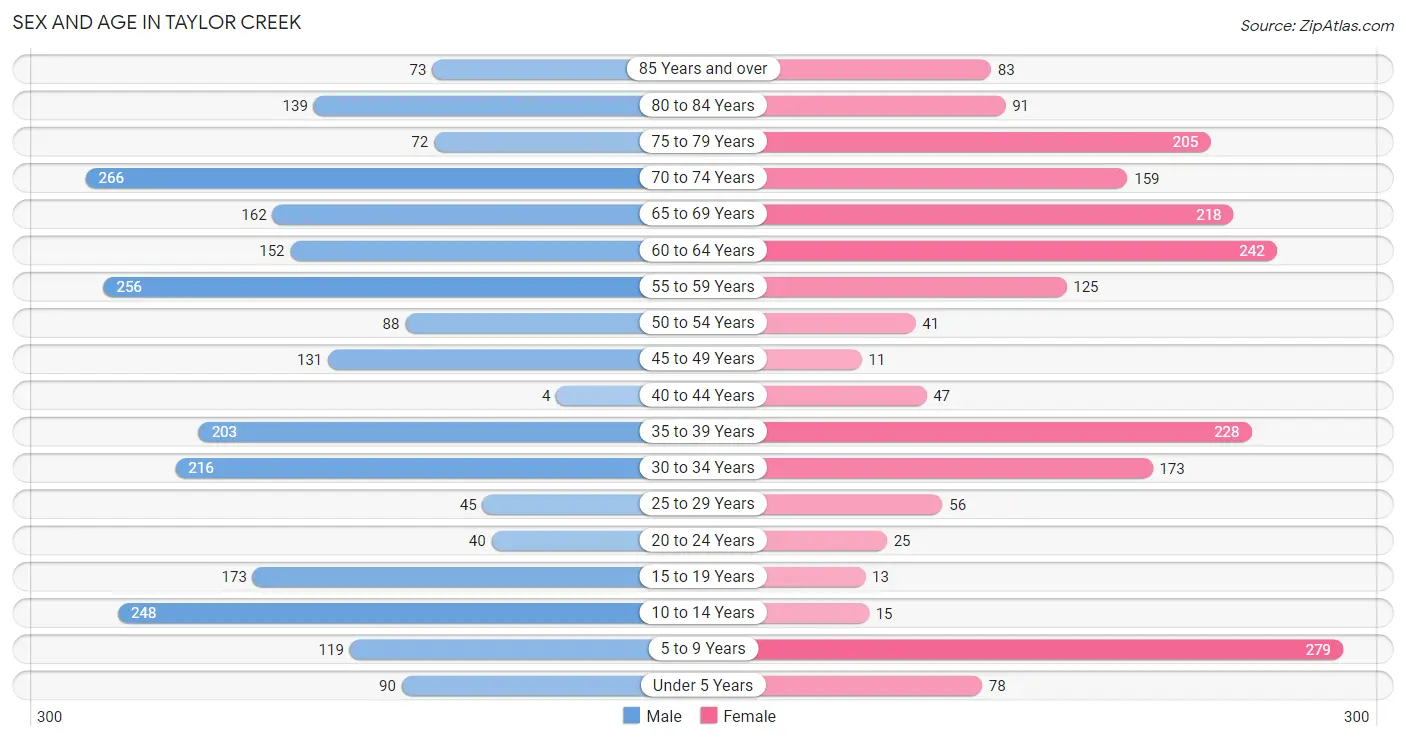
Sex and Age in Taylor Creek
Sex and Age in Taylor Creek
The most populous age groups in Taylor Creek are 70 to 74 Years (266 | 10.7%) for men and 5 to 9 Years (279 | 13.4%) for women.
| Age Bracket | Male | Female |
| Under 5 Years | 90 (3.6%) | 78 (3.7%) |
| 5 to 9 Years | 119 (4.8%) | 279 (13.4%) |
| 10 to 14 Years | 248 (10.0%) | 15 (0.7%) |
| 15 to 19 Years | 173 (7.0%) | 13 (0.6%) |
| 20 to 24 Years | 40 (1.6%) | 25 (1.2%) |
| 25 to 29 Years | 45 (1.8%) | 56 (2.7%) |
| 30 to 34 Years | 216 (8.7%) | 173 (8.3%) |
| 35 to 39 Years | 203 (8.2%) | 228 (10.9%) |
| 40 to 44 Years | 4 (0.2%) | 47 (2.2%) |
| 45 to 49 Years | 131 (5.3%) | 11 (0.5%) |
| 50 to 54 Years | 88 (3.5%) | 41 (2.0%) |
| 55 to 59 Years | 256 (10.3%) | 125 (6.0%) |
| 60 to 64 Years | 152 (6.1%) | 242 (11.6%) |
| 65 to 69 Years | 162 (6.5%) | 218 (10.4%) |
| 70 to 74 Years | 266 (10.7%) | 159 (7.6%) |
| 75 to 79 Years | 72 (2.9%) | 205 (9.8%) |
| 80 to 84 Years | 139 (5.6%) | 91 (4.4%) |
| 85 Years and over | 73 (2.9%) | 83 (4.0%) |
| Total | 2,477 (100.0%) | 2,089 (100.0%) |
Families and Households in Taylor Creek
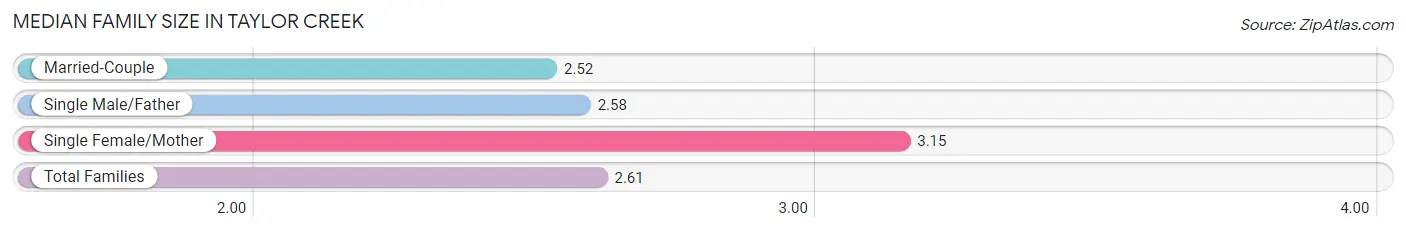
Median Family Size in Taylor Creek
The median family size in Taylor Creek is 2.61 persons per family, with single female/mother families (130 | 11.1%) accounting for the largest median family size of 3.15 persons per family. On the other hand, married-couple families (757 | 64.4%) represent the smallest median family size with 2.52 persons per family.
| Family Type | # Families | Family Size |
| Married-Couple | 757 (64.4%) | 2.52 |
| Single Male/Father | 288 (24.5%) | 2.58 |
| Single Female/Mother | 130 (11.1%) | 3.15 |
| Total Families | 1,175 (100.0%) | 2.61 |
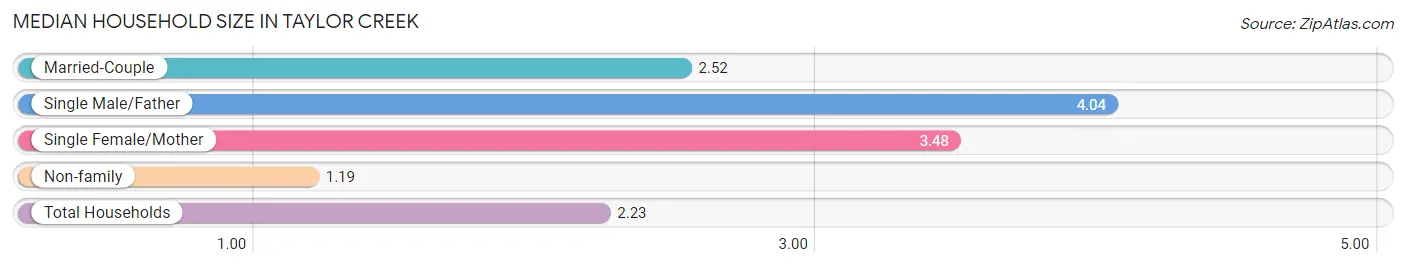
Median Household Size in Taylor Creek
The median household size in Taylor Creek is 2.23 persons per household, with single male/father households (288 | 14.1%) accounting for the largest median household size of 4.04 persons per household. non-family households (873 | 42.6%) represent the smallest median household size with 1.19 persons per household.
| Household Type | # Households | Household Size |
| Married-Couple | 757 (37.0%) | 2.52 |
| Single Male/Father | 288 (14.1%) | 4.04 |
| Single Female/Mother | 130 (6.4%) | 3.48 |
| Non-family | 873 (42.6%) | 1.19 |
| Total Households | 2,048 (100.0%) | 2.23 |
Household Size by Marriage Status in Taylor Creek
Out of a total of 2,048 households in Taylor Creek, 1,175 (57.4%) are family households, while 873 (42.6%) are nonfamily households. The most numerous type of family households are 2-person households, comprising 699, and the most common type of nonfamily households are 1-person households, comprising 753.
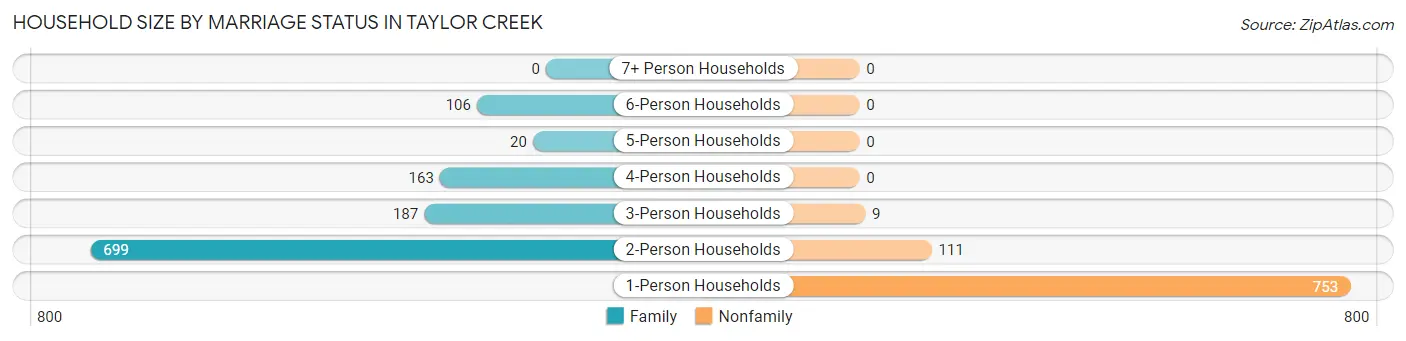
| Household Size | Family Households | Nonfamily Households |
| 1-Person Households | - | 753 (36.8%) |
| 2-Person Households | 699 (34.1%) | 111 (5.4%) |
| 3-Person Households | 187 (9.1%) | 9 (0.4%) |
| 4-Person Households | 163 (8.0%) | 0 (0.0%) |
| 5-Person Households | 20 (1.0%) | 0 (0.0%) |
| 6-Person Households | 106 (5.2%) | 0 (0.0%) |
| 7+ Person Households | 0 (0.0%) | 0 (0.0%) |
| Total | 1,175 (57.4%) | 873 (42.6%) |
Female Fertility in Taylor Creek
Fertility by Age in Taylor Creek
Average fertility rate in Taylor Creek is 38.0 births per 1,000 women. Women in the age bracket of 35 to 50 years have the highest fertility rate with 73.0 births per 1,000 women. Women in the age bracket of 35 to 50 years acount for 100.0% of all women with births.
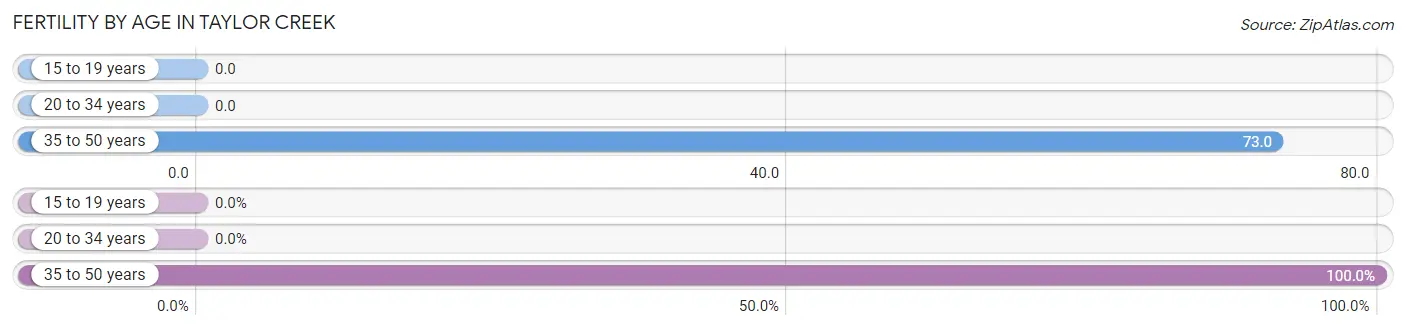
| Age Bracket | Women with Births | Births / 1,000 Women |
| 15 to 19 years | 0 (0.0%) | 0.0 |
| 20 to 34 years | 0 (0.0%) | 0.0 |
| 35 to 50 years | 21 (100.0%) | 73.0 |
| Total | 21 (100.0%) | 38.0 |
Fertility by Age by Marriage Status in Taylor Creek
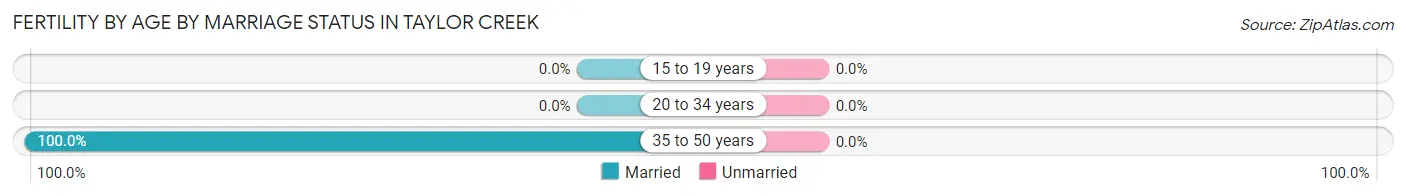
| Age Bracket | Married | Unmarried |
| 15 to 19 years | 0 (0.0%) | 0 (0.0%) |
| 20 to 34 years | 0 (0.0%) | 0 (0.0%) |
| 35 to 50 years | 21 (100.0%) | 0 (0.0%) |
| Total | 21 (100.0%) | 0 (0.0%) |
Fertility by Education in Taylor Creek
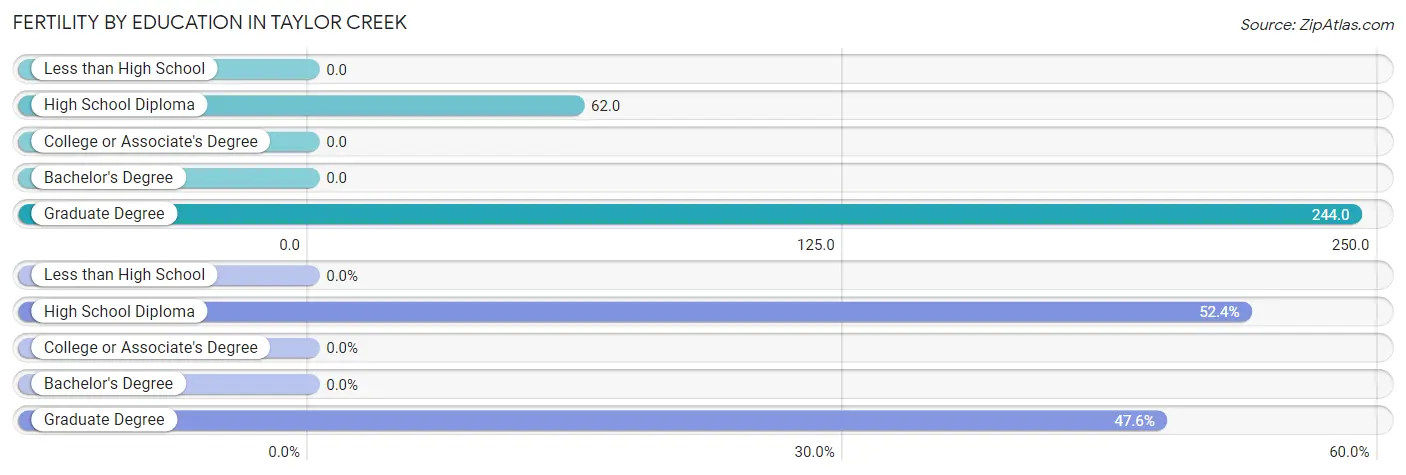
| Educational Attainment | Women with Births | Births / 1,000 Women |
| Less than High School | 0 (0.0%) | 0.0 |
| High School Diploma | 11 (52.4%) | 62.0 |
| College or Associate's Degree | 0 (0.0%) | 0.0 |
| Bachelor's Degree | 0 (0.0%) | 0.0 |
| Graduate Degree | 10 (47.6%) | 244.0 |
| Total | 21 (100.0%) | 38.0 |
Fertility by Education by Marriage Status in Taylor Creek
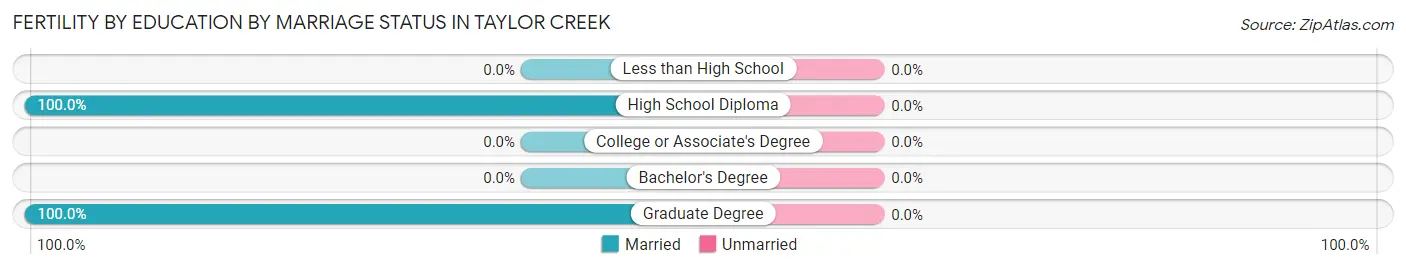
| Educational Attainment | Married | Unmarried |
| Less than High School | 0 (0.0%) | 0 (0.0%) |
| High School Diploma | 11 (100.0%) | 0 (0.0%) |
| College or Associate's Degree | 0 (0.0%) | 0 (0.0%) |
| Bachelor's Degree | 0 (0.0%) | 0 (0.0%) |
| Graduate Degree | 10 (100.0%) | 0 (0.0%) |
| Total | 21 (100.0%) | 0 (0.0%) |
Employment Characteristics in Taylor Creek
Employment by Class of Employer in Taylor Creek
Among the 1,448 employed individuals in Taylor Creek, private company employees (892 | 61.6%), local government employees (162 | 11.2%), and self-employed (not incorporated) (106 | 7.3%) make up the most common classes of employment.
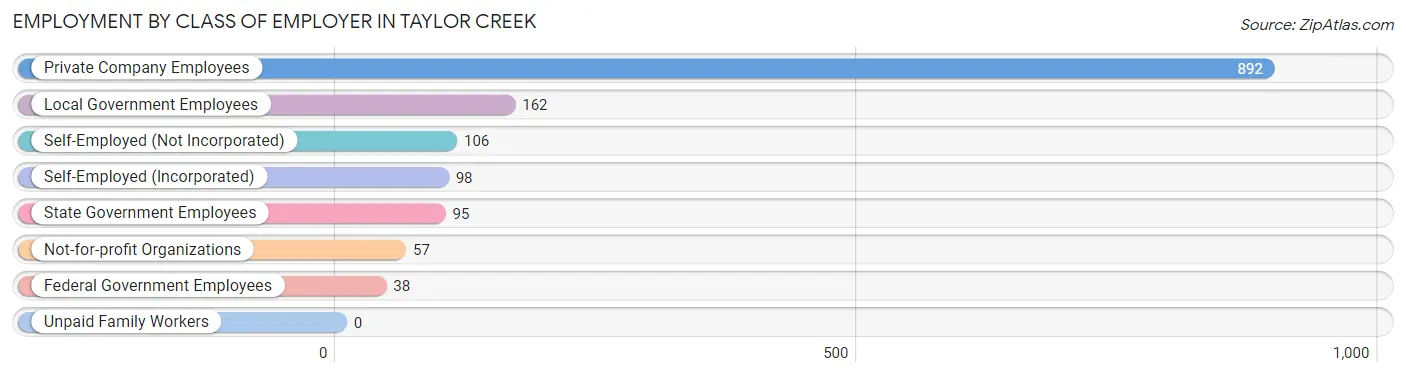
| Employer Class | # Employees | % Employees |
| Private Company Employees | 892 | 61.6% |
| Self-Employed (Incorporated) | 98 | 6.8% |
| Self-Employed (Not Incorporated) | 106 | 7.3% |
| Not-for-profit Organizations | 57 | 3.9% |
| Local Government Employees | 162 | 11.2% |
| State Government Employees | 95 | 6.6% |
| Federal Government Employees | 38 | 2.6% |
| Unpaid Family Workers | 0 | 0.0% |
| Total | 1,448 | 100.0% |
Employment Status by Age in Taylor Creek
According to the labor force statistics for Taylor Creek, out of the total population over 16 years of age (3,698), 43.7% or 1,616 individuals are in the labor force, with 10.4% or 168 of them unemployed. The age group with the highest labor force participation rate is 20 to 24 years, with 100.0% or 65 individuals in the labor force. Within the labor force, the 45 to 54 years age range has the highest percentage of unemployed individuals, with 27.2% or 59 of them being unemployed.
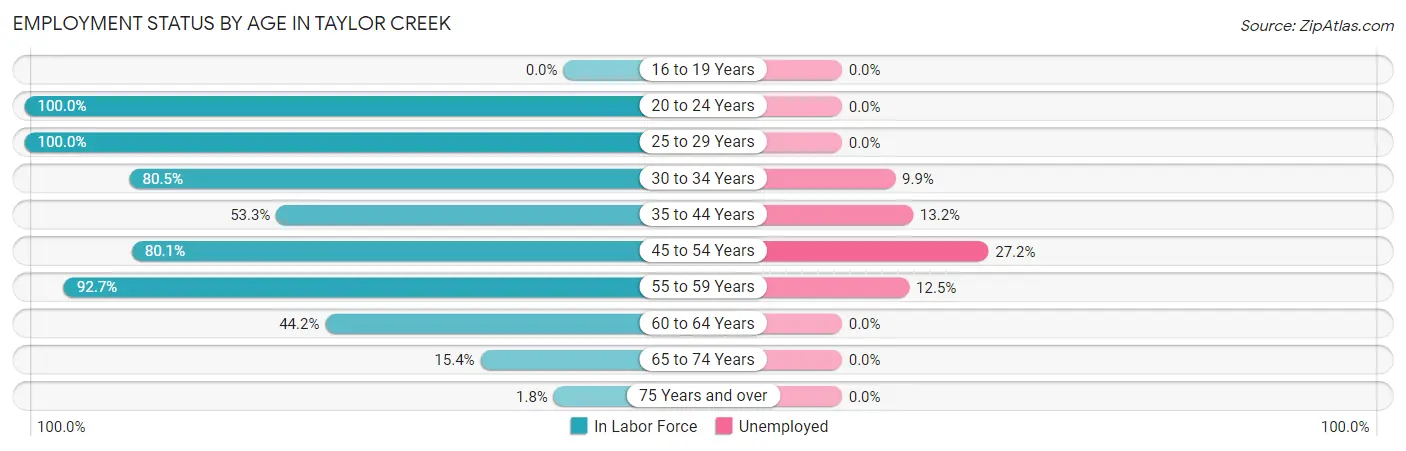
| Age Bracket | In Labor Force | Unemployed |
| 16 to 19 Years | 0 (0.0%) | 0 (0.0%) |
| 20 to 24 Years | 65 (100.0%) | 0 (0.0%) |
| 25 to 29 Years | 101 (100.0%) | 0 (0.0%) |
| 30 to 34 Years | 313 (80.5%) | 31 (9.9%) |
| 35 to 44 Years | 257 (53.3%) | 34 (13.2%) |
| 45 to 54 Years | 217 (80.1%) | 59 (27.2%) |
| 55 to 59 Years | 353 (92.7%) | 44 (12.5%) |
| 60 to 64 Years | 174 (44.2%) | 0 (0.0%) |
| 65 to 74 Years | 124 (15.4%) | 0 (0.0%) |
| 75 Years and over | 12 (1.8%) | 0 (0.0%) |
| Total | 1,616 (43.7%) | 168 (10.4%) |
Employment Status by Educational Attainment in Taylor Creek
According to labor force statistics for Taylor Creek, 70.1% of individuals (1,415) out of the total population between 25 and 64 years of age (2,018) are in the labor force, with 11.9% or 168 of them being unemployed. The group with the highest labor force participation rate are those with the educational attainment of bachelor's degree or higher, with 92.7% or 242 individuals in the labor force. Within the labor force, individuals with college / associate degree education have the highest percentage of unemployment, with 19.1% or 62 of them being unemployed.
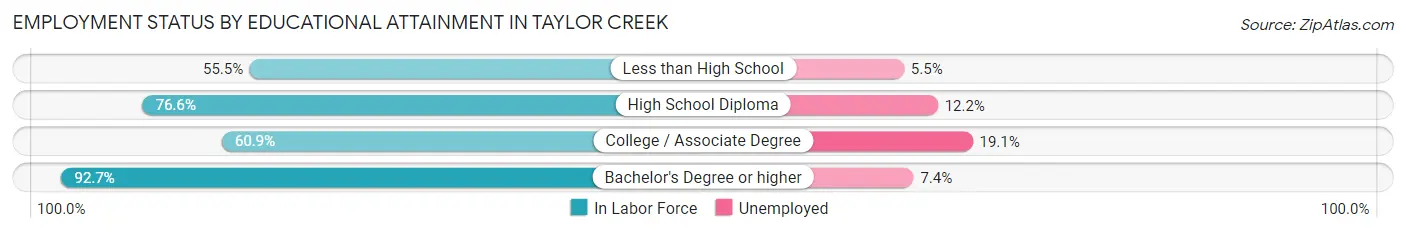
| Educational Attainment | In Labor Force | Unemployed |
| Less than High School | 236 (55.5%) | 23 (5.5%) |
| High School Diploma | 613 (76.6%) | 98 (12.2%) |
| College / Associate Degree | 324 (60.9%) | 102 (19.1%) |
| Bachelor's Degree or higher | 242 (92.7%) | 19 (7.4%) |
| Total | 1,415 (70.1%) | 240 (11.9%) |
Employment Occupations by Sex in Taylor Creek
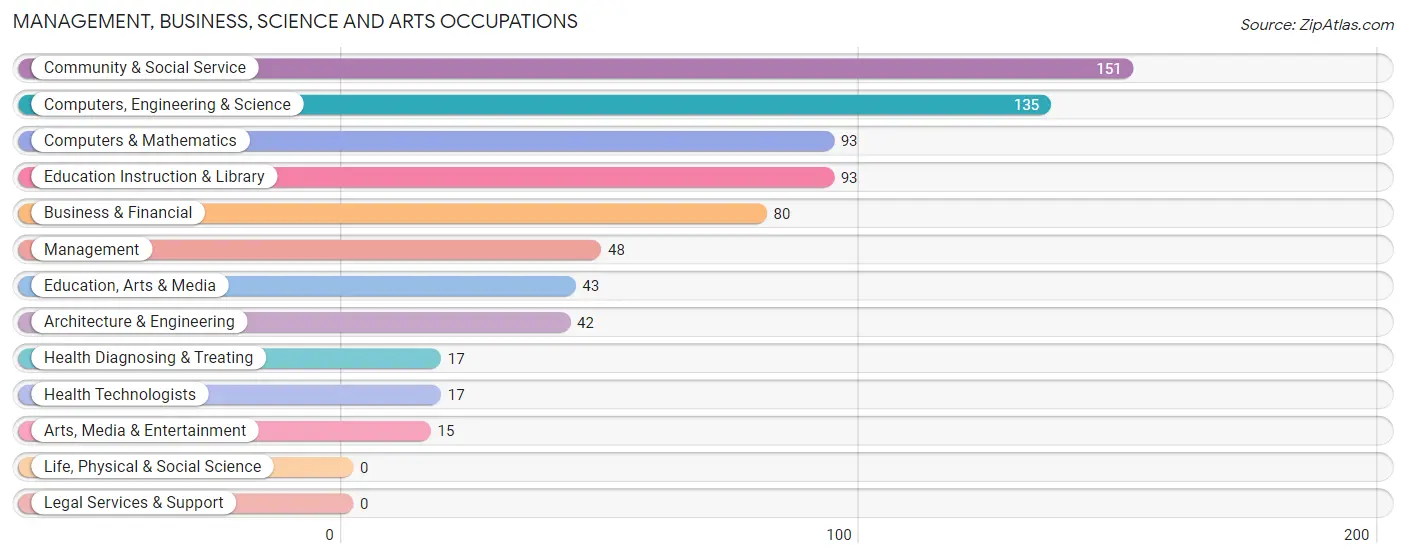
Management, Business, Science and Arts Occupations
The most common Management, Business, Science and Arts occupations in Taylor Creek are Community & Social Service (151 | 10.4%), Computers, Engineering & Science (135 | 9.3%), Computers & Mathematics (93 | 6.4%), Education Instruction & Library (93 | 6.4%), and Business & Financial (80 | 5.5%).
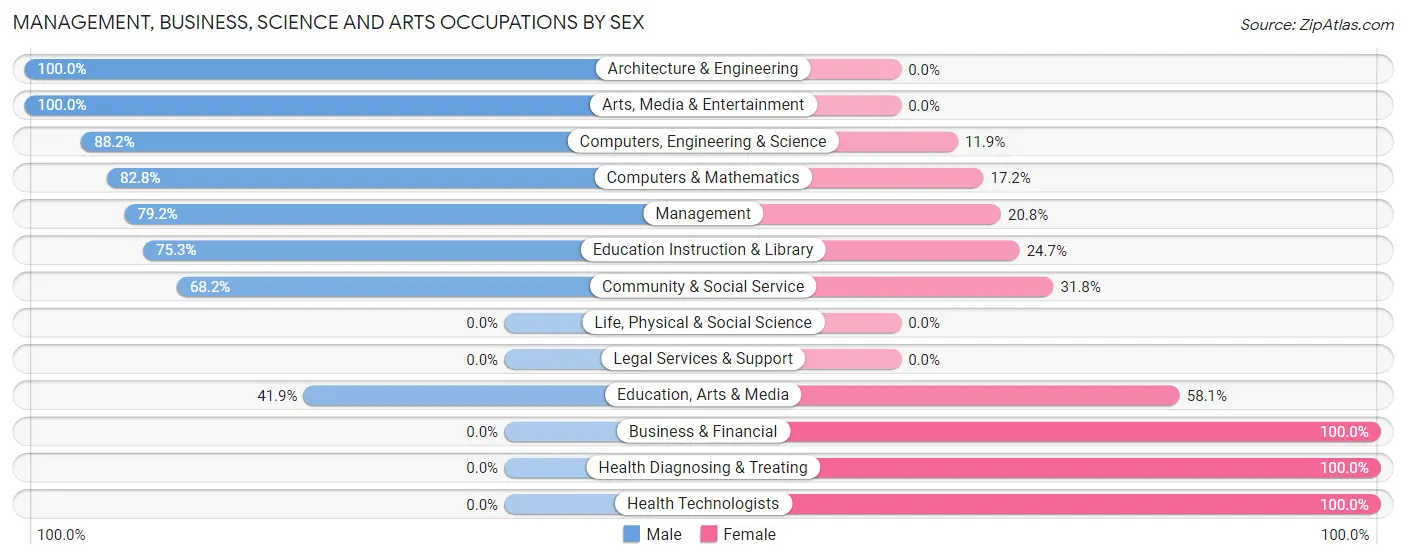
Management, Business, Science and Arts Occupations by Sex
Within the Management, Business, Science and Arts occupations in Taylor Creek, the most male-oriented occupations are Architecture & Engineering (100.0%), Arts, Media & Entertainment (100.0%), and Computers, Engineering & Science (88.1%), while the most female-oriented occupations are Business & Financial (100.0%), Health Diagnosing & Treating (100.0%), and Health Technologists (100.0%).
| Occupation | Male | Female |
| Management | 38 (79.2%) | 10 (20.8%) |
| Business & Financial | 0 (0.0%) | 80 (100.0%) |
| Computers, Engineering & Science | 119 (88.1%) | 16 (11.8%) |
| Computers & Mathematics | 77 (82.8%) | 16 (17.2%) |
| Architecture & Engineering | 42 (100.0%) | 0 (0.0%) |
| Life, Physical & Social Science | 0 (0.0%) | 0 (0.0%) |
| Community & Social Service | 103 (68.2%) | 48 (31.8%) |
| Education, Arts & Media | 18 (41.9%) | 25 (58.1%) |
| Legal Services & Support | 0 (0.0%) | 0 (0.0%) |
| Education Instruction & Library | 70 (75.3%) | 23 (24.7%) |
| Arts, Media & Entertainment | 15 (100.0%) | 0 (0.0%) |
| Health Diagnosing & Treating | 0 (0.0%) | 17 (100.0%) |
| Health Technologists | 0 (0.0%) | 17 (100.0%) |
| Total (Category) | 260 (60.3%) | 171 (39.7%) |
| Total (Overall) | 793 (54.8%) | 655 (45.2%) |
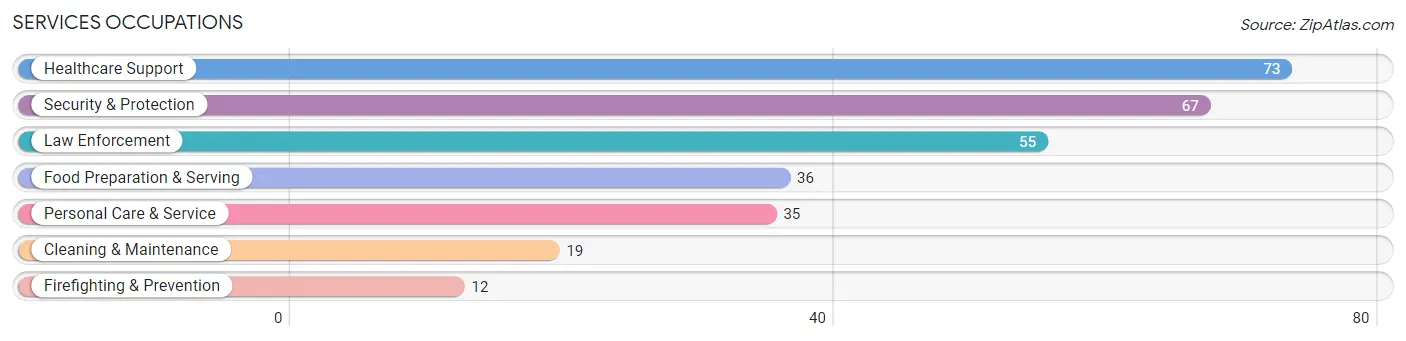
Services Occupations
The most common Services occupations in Taylor Creek are Healthcare Support (73 | 5.0%), Security & Protection (67 | 4.6%), Law Enforcement (55 | 3.8%), Food Preparation & Serving (36 | 2.5%), and Personal Care & Service (35 | 2.4%).
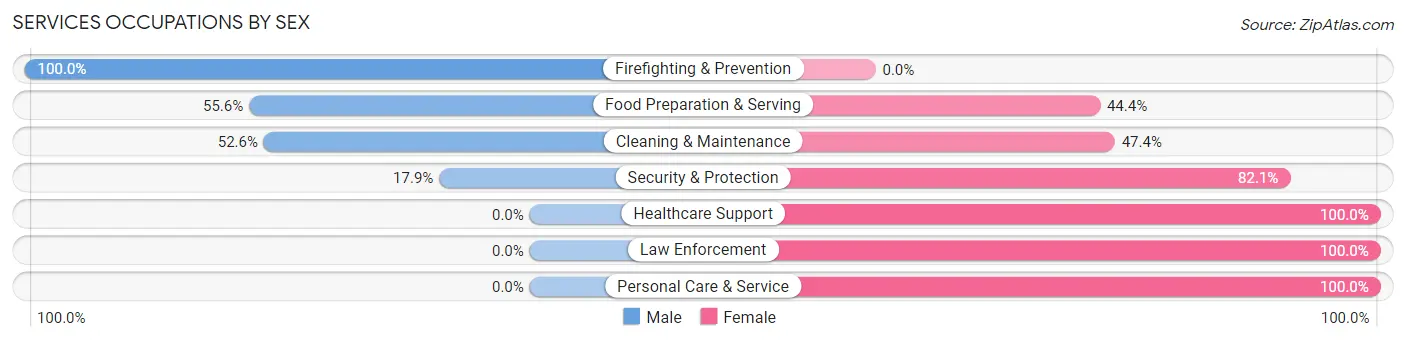
Services Occupations by Sex
Within the Services occupations in Taylor Creek, the most male-oriented occupations are Firefighting & Prevention (100.0%), Food Preparation & Serving (55.6%), and Cleaning & Maintenance (52.6%), while the most female-oriented occupations are Healthcare Support (100.0%), Law Enforcement (100.0%), and Personal Care & Service (100.0%).
| Occupation | Male | Female |
| Healthcare Support | 0 (0.0%) | 73 (100.0%) |
| Security & Protection | 12 (17.9%) | 55 (82.1%) |
| Firefighting & Prevention | 12 (100.0%) | 0 (0.0%) |
| Law Enforcement | 0 (0.0%) | 55 (100.0%) |
| Food Preparation & Serving | 20 (55.6%) | 16 (44.4%) |
| Cleaning & Maintenance | 10 (52.6%) | 9 (47.4%) |
| Personal Care & Service | 0 (0.0%) | 35 (100.0%) |
| Total (Category) | 42 (18.3%) | 188 (81.7%) |
| Total (Overall) | 793 (54.8%) | 655 (45.2%) |
Sales and Office Occupations
The most common Sales and Office occupations in Taylor Creek are Sales & Related (168 | 11.6%), and Office & Administration (128 | 8.8%).
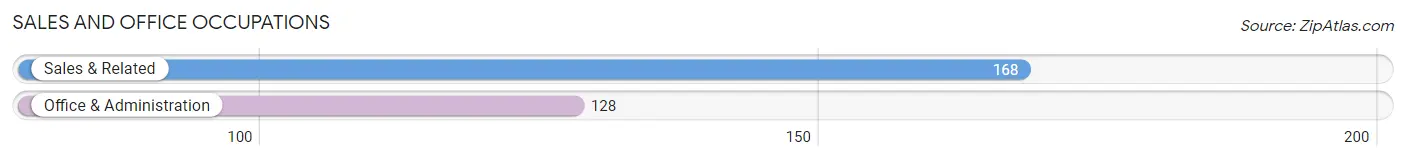
Sales and Office Occupations by Sex

| Occupation | Male | Female |
| Sales & Related | 50 (29.8%) | 118 (70.2%) |
| Office & Administration | 22 (17.2%) | 106 (82.8%) |
| Total (Category) | 72 (24.3%) | 224 (75.7%) |
| Total (Overall) | 793 (54.8%) | 655 (45.2%) |
Natural Resources, Construction and Maintenance Occupations
The most common Natural Resources, Construction and Maintenance occupations in Taylor Creek are Farming, Fishing & Forestry (191 | 13.2%), Construction & Extraction (83 | 5.7%), and Installation, Maintenance & Repair (66 | 4.6%).
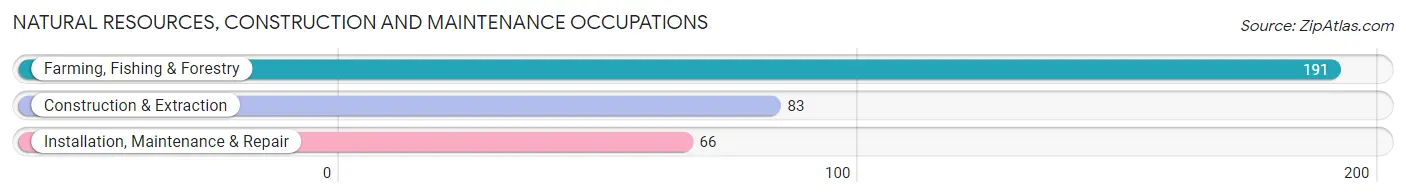
Natural Resources, Construction and Maintenance Occupations by Sex
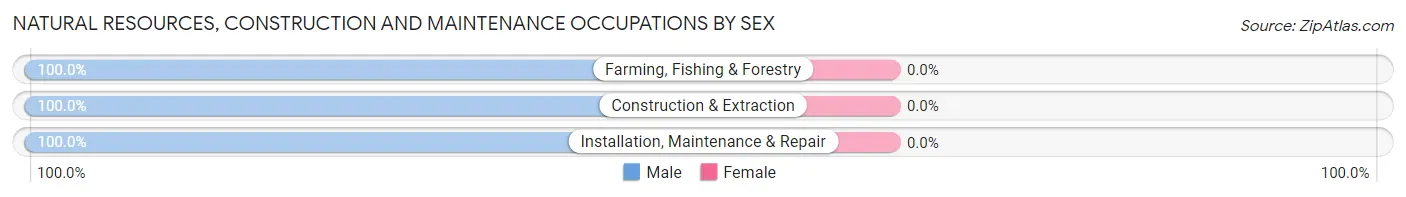
| Occupation | Male | Female |
| Farming, Fishing & Forestry | 191 (100.0%) | 0 (0.0%) |
| Construction & Extraction | 83 (100.0%) | 0 (0.0%) |
| Installation, Maintenance & Repair | 66 (100.0%) | 0 (0.0%) |
| Total (Category) | 340 (100.0%) | 0 (0.0%) |
| Total (Overall) | 793 (54.8%) | 655 (45.2%) |
Production, Transportation and Moving Occupations
The most common Production, Transportation and Moving occupations in Taylor Creek are Production (94 | 6.5%), Transportation (36 | 2.5%), and Material Moving (21 | 1.5%).
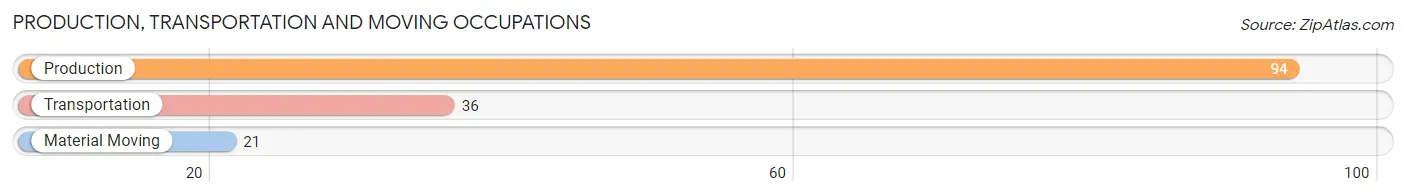
Production, Transportation and Moving Occupations by Sex
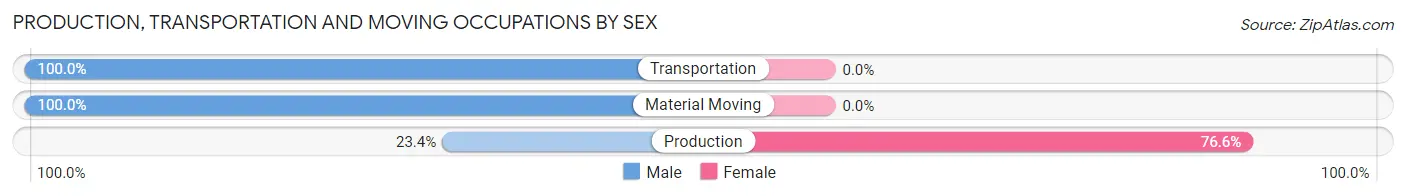
| Occupation | Male | Female |
| Production | 22 (23.4%) | 72 (76.6%) |
| Transportation | 36 (100.0%) | 0 (0.0%) |
| Material Moving | 21 (100.0%) | 0 (0.0%) |
| Total (Category) | 79 (52.3%) | 72 (47.7%) |
| Total (Overall) | 793 (54.8%) | 655 (45.2%) |
Employment Industries by Sex in Taylor Creek
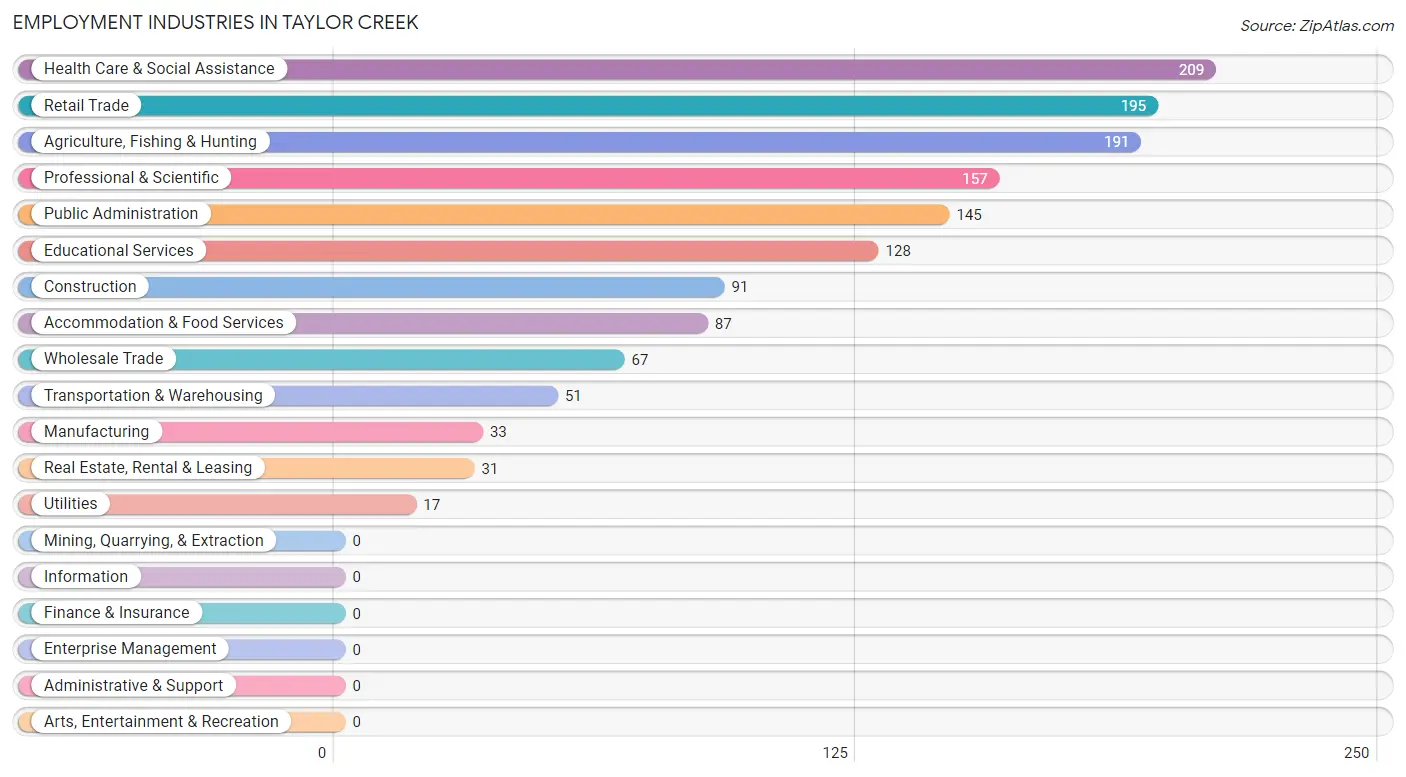
Employment Industries in Taylor Creek
The major employment industries in Taylor Creek include Health Care & Social Assistance (209 | 14.4%), Retail Trade (195 | 13.5%), Agriculture, Fishing & Hunting (191 | 13.2%), Professional & Scientific (157 | 10.8%), and Public Administration (145 | 10.0%).
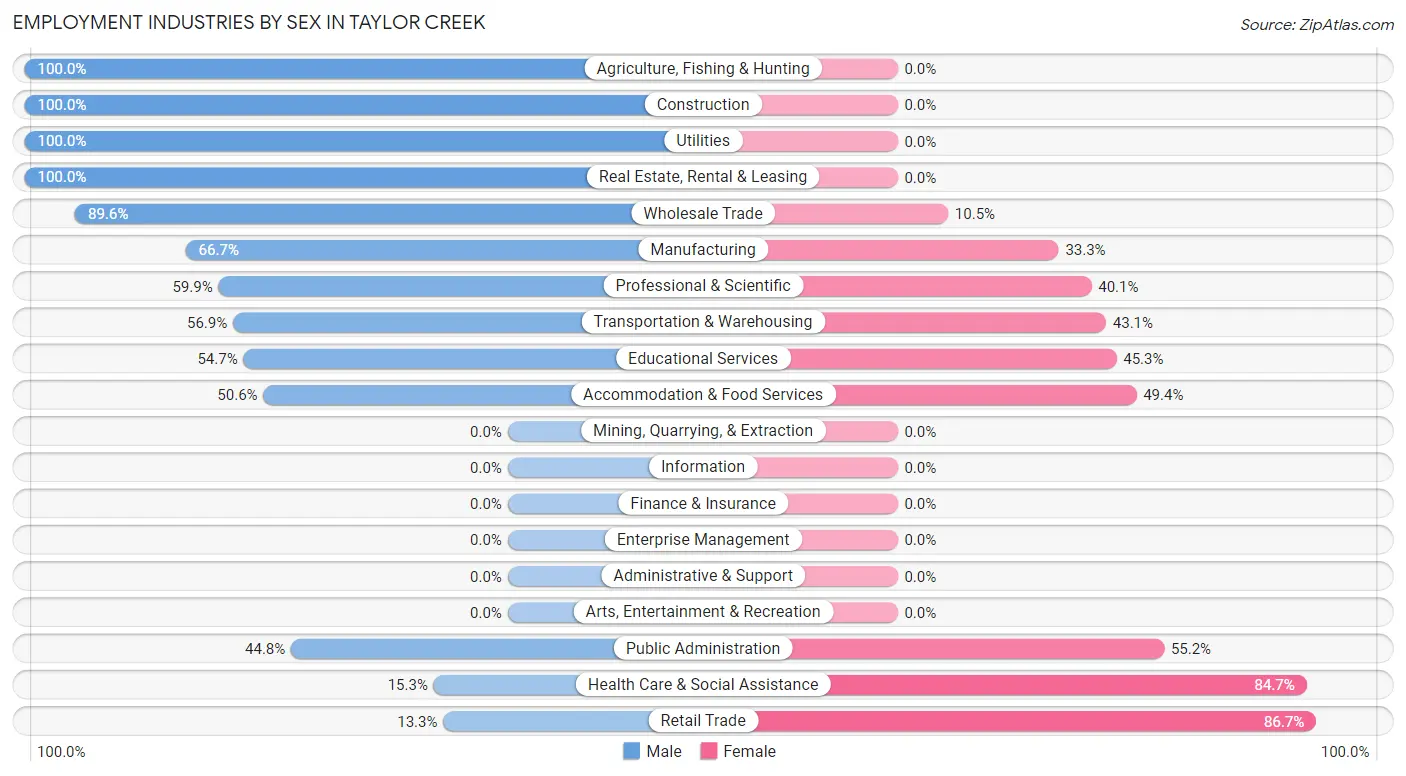
Employment Industries by Sex in Taylor Creek
The Taylor Creek industries that see more men than women are Agriculture, Fishing & Hunting (100.0%), Construction (100.0%), and Utilities (100.0%), whereas the industries that tend to have a higher number of women are Retail Trade (86.7%), Health Care & Social Assistance (84.7%), and Public Administration (55.2%).
| Industry | Male | Female |
| Agriculture, Fishing & Hunting | 191 (100.0%) | 0 (0.0%) |
| Mining, Quarrying, & Extraction | 0 (0.0%) | 0 (0.0%) |
| Construction | 91 (100.0%) | 0 (0.0%) |
| Manufacturing | 22 (66.7%) | 11 (33.3%) |
| Wholesale Trade | 60 (89.5%) | 7 (10.4%) |
| Retail Trade | 26 (13.3%) | 169 (86.7%) |
| Transportation & Warehousing | 29 (56.9%) | 22 (43.1%) |
| Utilities | 17 (100.0%) | 0 (0.0%) |
| Information | 0 (0.0%) | 0 (0.0%) |
| Finance & Insurance | 0 (0.0%) | 0 (0.0%) |
| Real Estate, Rental & Leasing | 31 (100.0%) | 0 (0.0%) |
| Professional & Scientific | 94 (59.9%) | 63 (40.1%) |
| Enterprise Management | 0 (0.0%) | 0 (0.0%) |
| Administrative & Support | 0 (0.0%) | 0 (0.0%) |
| Educational Services | 70 (54.7%) | 58 (45.3%) |
| Health Care & Social Assistance | 32 (15.3%) | 177 (84.7%) |
| Arts, Entertainment & Recreation | 0 (0.0%) | 0 (0.0%) |
| Accommodation & Food Services | 44 (50.6%) | 43 (49.4%) |
| Public Administration | 65 (44.8%) | 80 (55.2%) |
| Total | 793 (54.8%) | 655 (45.2%) |
Education in Taylor Creek
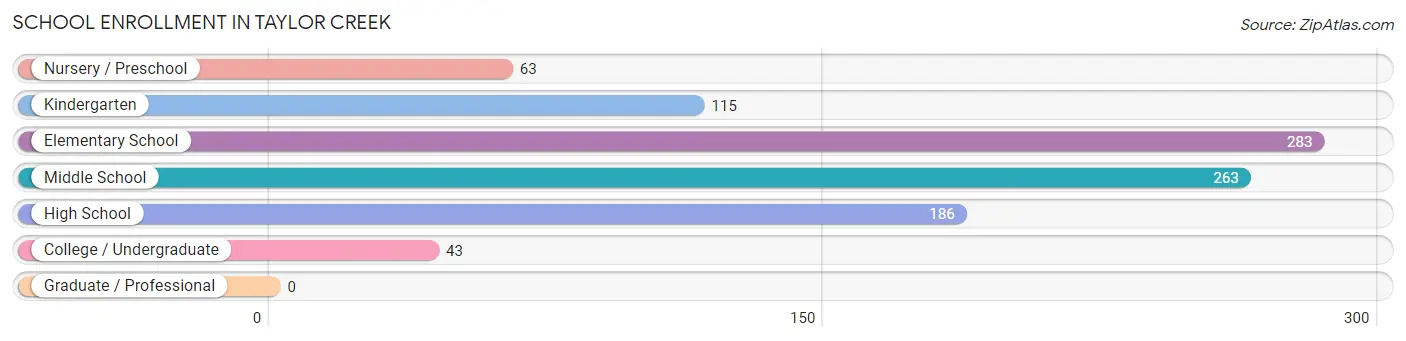
School Enrollment in Taylor Creek
The most common levels of schooling among the 953 students in Taylor Creek are elementary school (283 | 29.7%), middle school (263 | 27.6%), and high school (186 | 19.5%).
| School Level | # Students | % Students |
| Nursery / Preschool | 63 | 6.6% |
| Kindergarten | 115 | 12.1% |
| Elementary School | 283 | 29.7% |
| Middle School | 263 | 27.6% |
| High School | 186 | 19.5% |
| College / Undergraduate | 43 | 4.5% |
| Graduate / Professional | 0 | 0.0% |
| Total | 953 | 100.0% |
School Enrollment by Age by Funding Source in Taylor Creek
Out of a total of 953 students who are enrolled in schools in Taylor Creek, 35 (3.7%) attend a private institution, while the remaining 918 (96.3%) are enrolled in public schools. The age group of 25 to 34 year olds has the highest likelihood of being enrolled in private schools, with 17 (47.2% in the age bracket) enrolled. Conversely, the age group of 5 to 9 year old has the lowest likelihood of being enrolled in a private school, with 398 (100.0% in the age bracket) attending a public institution.
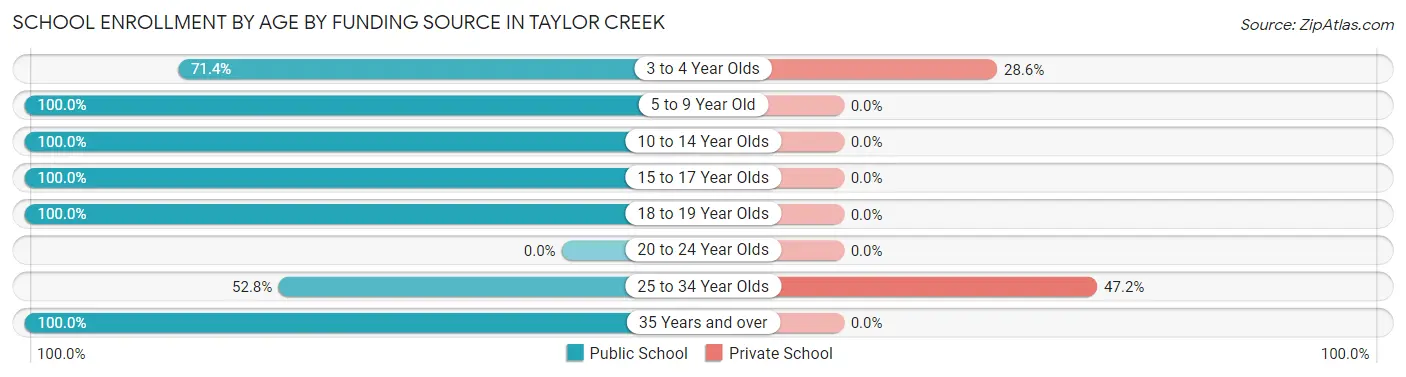
| Age Bracket | Public School | Private School |
| 3 to 4 Year Olds | 45 (71.4%) | 18 (28.6%) |
| 5 to 9 Year Old | 398 (100.0%) | 0 (0.0%) |
| 10 to 14 Year Olds | 263 (100.0%) | 0 (0.0%) |
| 15 to 17 Year Olds | 172 (100.0%) | 0 (0.0%) |
| 18 to 19 Year Olds | 14 (100.0%) | 0 (0.0%) |
| 20 to 24 Year Olds | 0 (0.0%) | 0 (0.0%) |
| 25 to 34 Year Olds | 19 (52.8%) | 17 (47.2%) |
| 35 Years and over | 7 (100.0%) | 0 (0.0%) |
| Total | 918 (96.3%) | 35 (3.7%) |
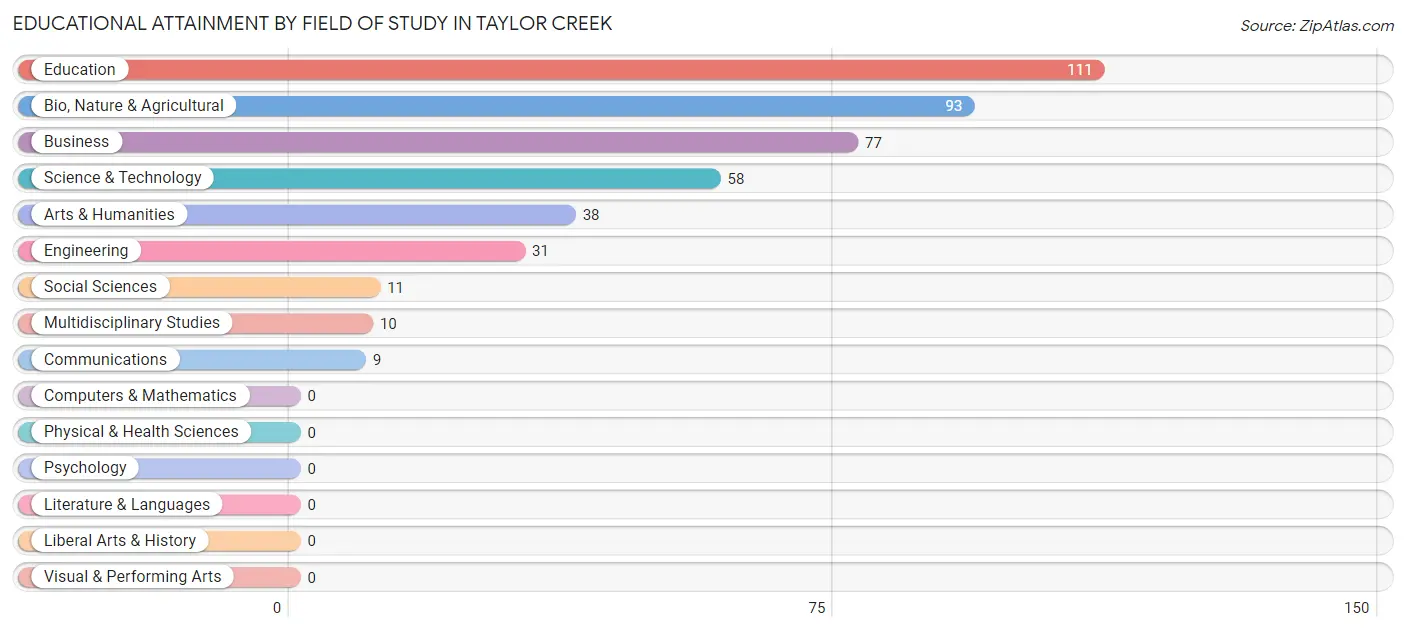
Educational Attainment by Field of Study in Taylor Creek
Education (111 | 25.3%), bio, nature & agricultural (93 | 21.2%), business (77 | 17.6%), science & technology (58 | 13.2%), and arts & humanities (38 | 8.7%) are the most common fields of study among 438 individuals in Taylor Creek who have obtained a bachelor's degree or higher.
| Field of Study | # Graduates | % Graduates |
| Computers & Mathematics | 0 | 0.0% |
| Bio, Nature & Agricultural | 93 | 21.2% |
| Physical & Health Sciences | 0 | 0.0% |
| Psychology | 0 | 0.0% |
| Social Sciences | 11 | 2.5% |
| Engineering | 31 | 7.1% |
| Multidisciplinary Studies | 10 | 2.3% |
| Science & Technology | 58 | 13.2% |
| Business | 77 | 17.6% |
| Education | 111 | 25.3% |
| Literature & Languages | 0 | 0.0% |
| Liberal Arts & History | 0 | 0.0% |
| Visual & Performing Arts | 0 | 0.0% |
| Communications | 9 | 2.1% |
| Arts & Humanities | 38 | 8.7% |
| Total | 438 | 100.0% |
Transportation & Commute in Taylor Creek
Vehicle Availability by Sex in Taylor Creek
The most prevalent vehicle ownership categories in Taylor Creek are males with 1 vehicle (317, accounting for 40.0%) and females with 1 vehicle (115, making up 48.4%).
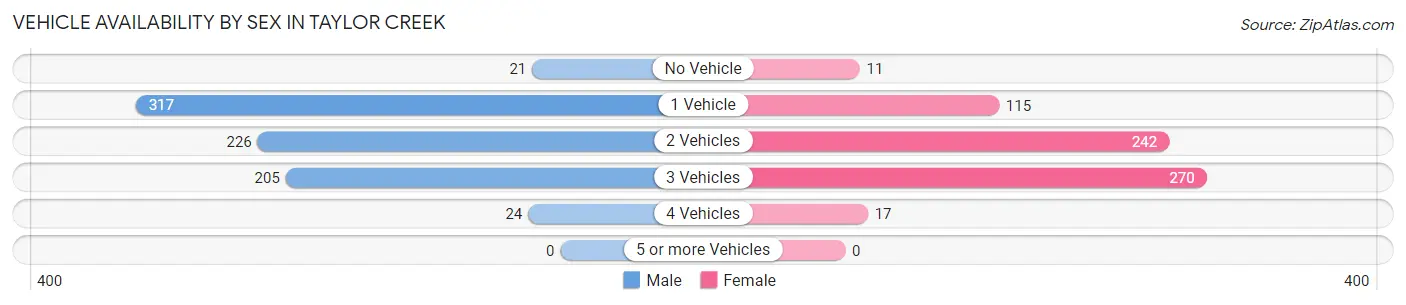
| Vehicles Available | Male | Female |
| No Vehicle | 21 (2.6%) | 11 (1.7%) |
| 1 Vehicle | 317 (40.0%) | 115 (17.6%) |
| 2 Vehicles | 226 (28.5%) | 242 (36.9%) |
| 3 Vehicles | 205 (25.9%) | 270 (41.2%) |
| 4 Vehicles | 24 (3.0%) | 17 (2.6%) |
| 5 or more Vehicles | 0 (0.0%) | 0 (0.0%) |
| Total | 793 (100.0%) | 655 (100.0%) |
Commute Time in Taylor Creek
The most frequently occuring commute durations in Taylor Creek are 10 to 14 minutes (292 commuters, 20.3%), 15 to 19 minutes (192 commuters, 13.3%), and 25 to 29 minutes (175 commuters, 12.1%).
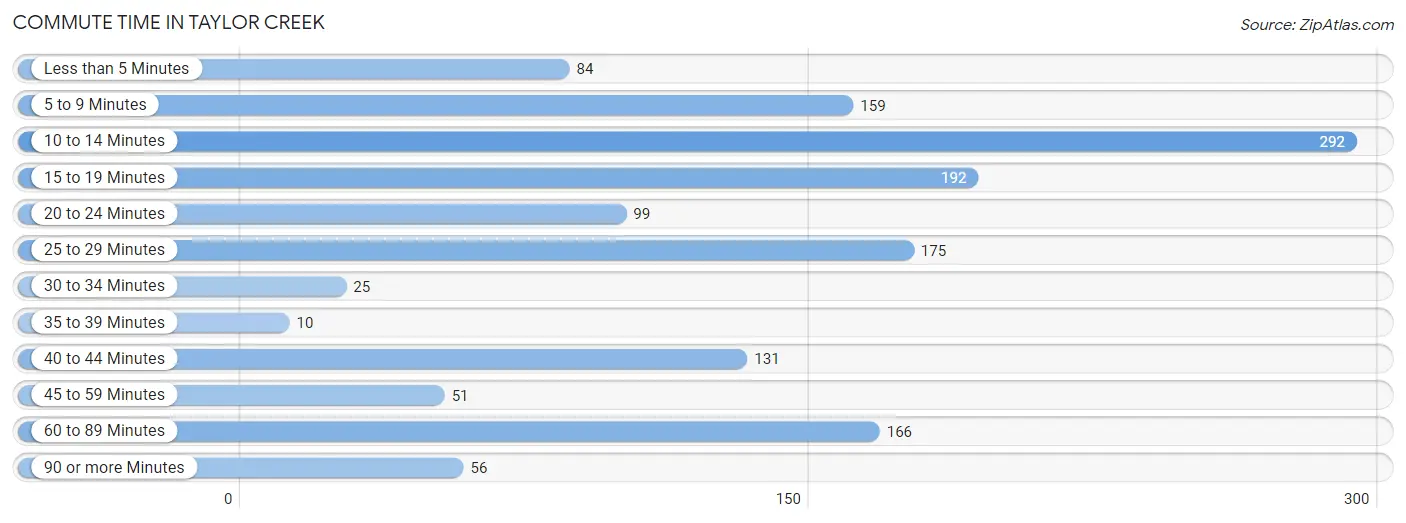
| Commute Time | # Commuters | % Commuters |
| Less than 5 Minutes | 84 | 5.8% |
| 5 to 9 Minutes | 159 | 11.0% |
| 10 to 14 Minutes | 292 | 20.3% |
| 15 to 19 Minutes | 192 | 13.3% |
| 20 to 24 Minutes | 99 | 6.9% |
| 25 to 29 Minutes | 175 | 12.1% |
| 30 to 34 Minutes | 25 | 1.7% |
| 35 to 39 Minutes | 10 | 0.7% |
| 40 to 44 Minutes | 131 | 9.1% |
| 45 to 59 Minutes | 51 | 3.5% |
| 60 to 89 Minutes | 166 | 11.5% |
| 90 or more Minutes | 56 | 3.9% |
Commute Time by Sex in Taylor Creek
The most common commute times in Taylor Creek are 25 to 29 minutes (159 commuters, 20.1%) for males and 10 to 14 minutes (230 commuters, 35.5%) for females.
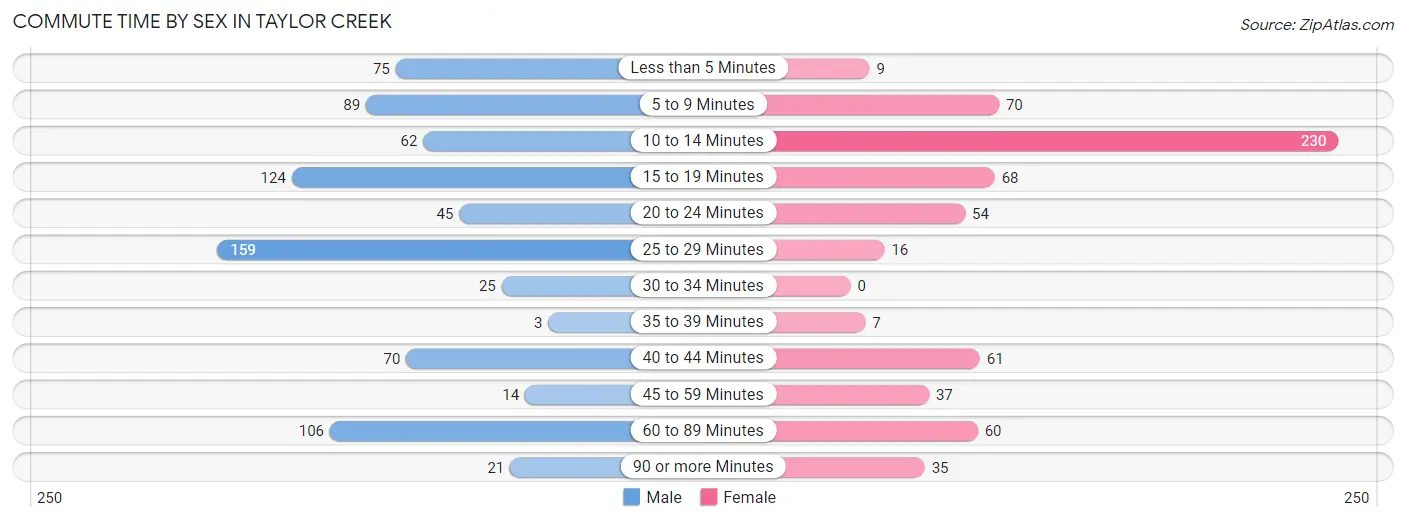
| Commute Time | Male | Female |
| Less than 5 Minutes | 75 (9.5%) | 9 (1.4%) |
| 5 to 9 Minutes | 89 (11.2%) | 70 (10.8%) |
| 10 to 14 Minutes | 62 (7.8%) | 230 (35.5%) |
| 15 to 19 Minutes | 124 (15.6%) | 68 (10.5%) |
| 20 to 24 Minutes | 45 (5.7%) | 54 (8.4%) |
| 25 to 29 Minutes | 159 (20.1%) | 16 (2.5%) |
| 30 to 34 Minutes | 25 (3.2%) | 0 (0.0%) |
| 35 to 39 Minutes | 3 (0.4%) | 7 (1.1%) |
| 40 to 44 Minutes | 70 (8.8%) | 61 (9.4%) |
| 45 to 59 Minutes | 14 (1.8%) | 37 (5.7%) |
| 60 to 89 Minutes | 106 (13.4%) | 60 (9.3%) |
| 90 or more Minutes | 21 (2.6%) | 35 (5.4%) |
Time of Departure to Work by Sex in Taylor Creek
The most frequent times of departure to work in Taylor Creek are 7:00 AM to 7:29 AM (132, 16.7%) for males and 8:00 AM to 8:29 AM (102, 15.8%) for females.
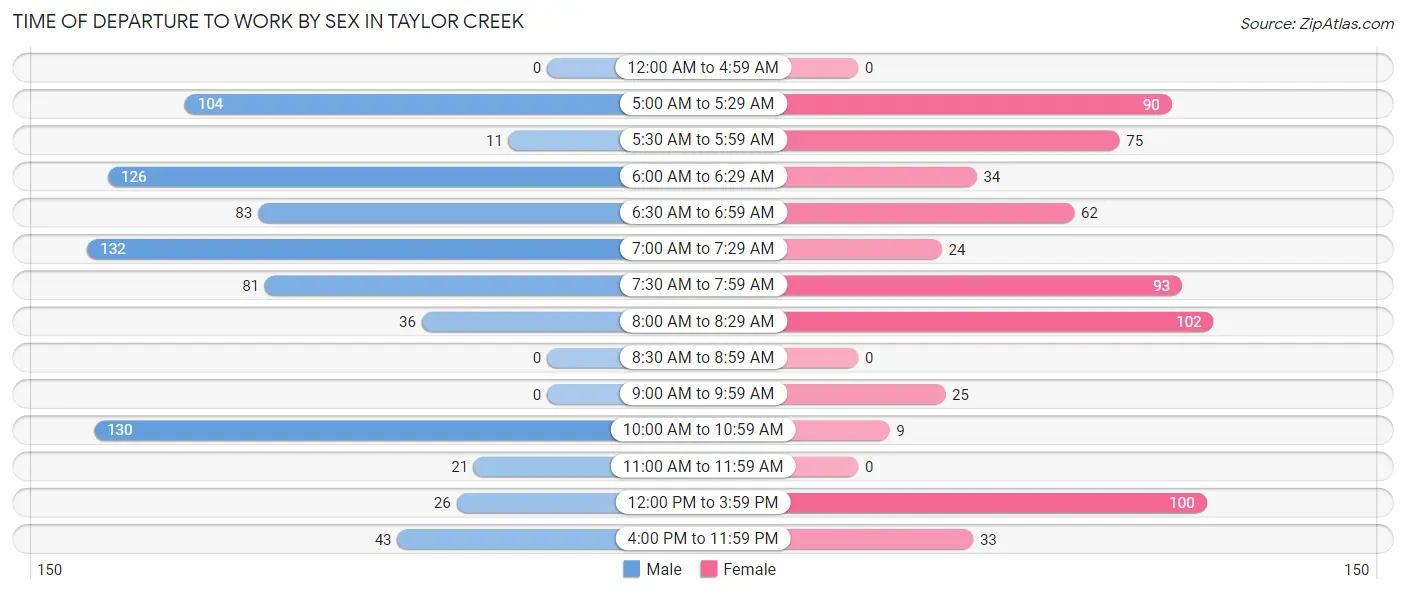
| Time of Departure | Male | Female |
| 12:00 AM to 4:59 AM | 0 (0.0%) | 0 (0.0%) |
| 5:00 AM to 5:29 AM | 104 (13.1%) | 90 (13.9%) |
| 5:30 AM to 5:59 AM | 11 (1.4%) | 75 (11.6%) |
| 6:00 AM to 6:29 AM | 126 (15.9%) | 34 (5.3%) |
| 6:30 AM to 6:59 AM | 83 (10.5%) | 62 (9.6%) |
| 7:00 AM to 7:29 AM | 132 (16.7%) | 24 (3.7%) |
| 7:30 AM to 7:59 AM | 81 (10.2%) | 93 (14.4%) |
| 8:00 AM to 8:29 AM | 36 (4.5%) | 102 (15.8%) |
| 8:30 AM to 8:59 AM | 0 (0.0%) | 0 (0.0%) |
| 9:00 AM to 9:59 AM | 0 (0.0%) | 25 (3.9%) |
| 10:00 AM to 10:59 AM | 130 (16.4%) | 9 (1.4%) |
| 11:00 AM to 11:59 AM | 21 (2.6%) | 0 (0.0%) |
| 12:00 PM to 3:59 PM | 26 (3.3%) | 100 (15.5%) |
| 4:00 PM to 11:59 PM | 43 (5.4%) | 33 (5.1%) |
| Total | 793 (100.0%) | 647 (100.0%) |
Housing Occupancy in Taylor Creek
Occupancy by Ownership in Taylor Creek
Of the total 2,048 dwellings in Taylor Creek, owner-occupied units account for 1,497 (73.1%), while renter-occupied units make up 551 (26.9%).
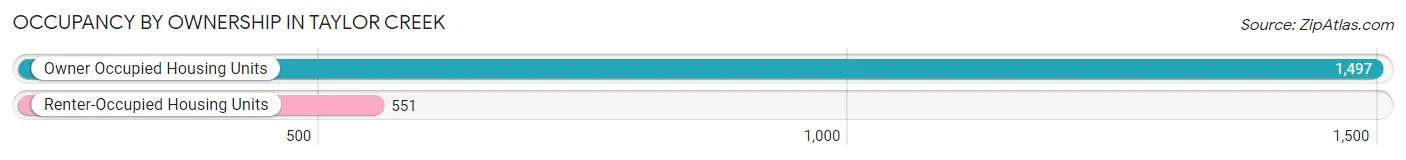
| Occupancy | # Housing Units | % Housing Units |
| Owner Occupied Housing Units | 1,497 | 73.1% |
| Renter-Occupied Housing Units | 551 | 26.9% |
| Total Occupied Housing Units | 2,048 | 100.0% |
Occupancy by Household Size in Taylor Creek
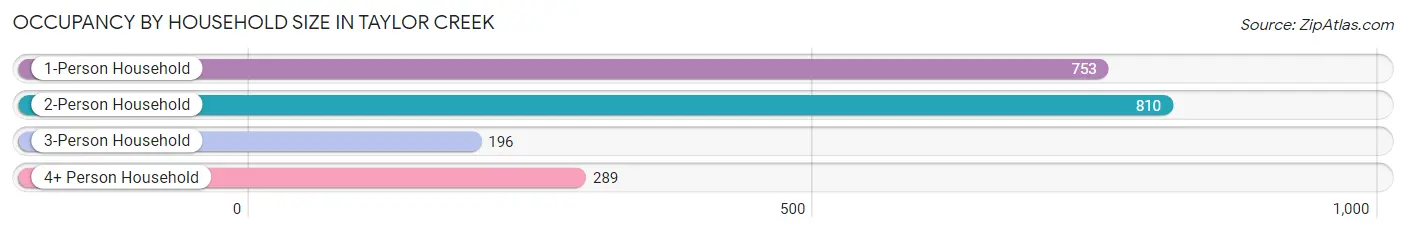
| Household Size | # Housing Units | % Housing Units |
| 1-Person Household | 753 | 36.8% |
| 2-Person Household | 810 | 39.6% |
| 3-Person Household | 196 | 9.6% |
| 4+ Person Household | 289 | 14.1% |
| Total Housing Units | 2,048 | 100.0% |
Occupancy by Ownership by Household Size in Taylor Creek
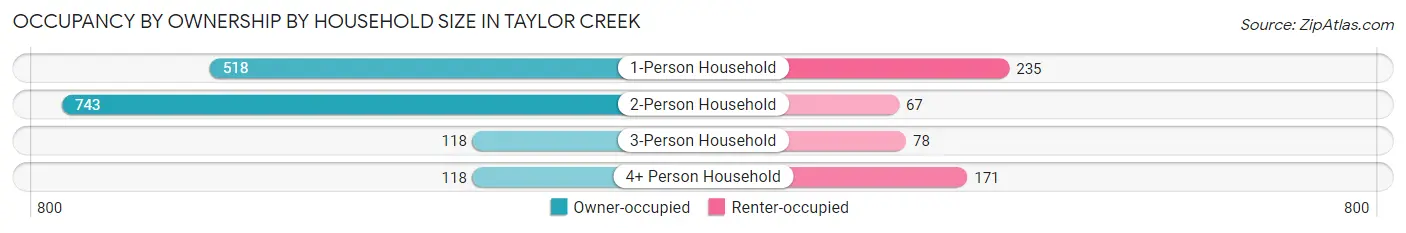
| Household Size | Owner-occupied | Renter-occupied |
| 1-Person Household | 518 (68.8%) | 235 (31.2%) |
| 2-Person Household | 743 (91.7%) | 67 (8.3%) |
| 3-Person Household | 118 (60.2%) | 78 (39.8%) |
| 4+ Person Household | 118 (40.8%) | 171 (59.2%) |
| Total Housing Units | 1,497 (73.1%) | 551 (26.9%) |
Occupancy by Educational Attainment in Taylor Creek
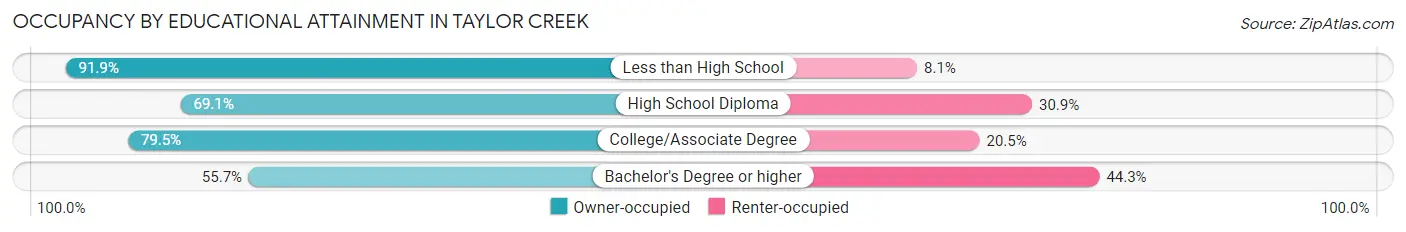
| Household Size | Owner-occupied | Renter-occupied |
| Less than High School | 215 (91.9%) | 19 (8.1%) |
| High School Diploma | 664 (69.1%) | 297 (30.9%) |
| College/Associate Degree | 477 (79.5%) | 123 (20.5%) |
| Bachelor's Degree or higher | 141 (55.7%) | 112 (44.3%) |
Occupancy by Age of Householder in Taylor Creek
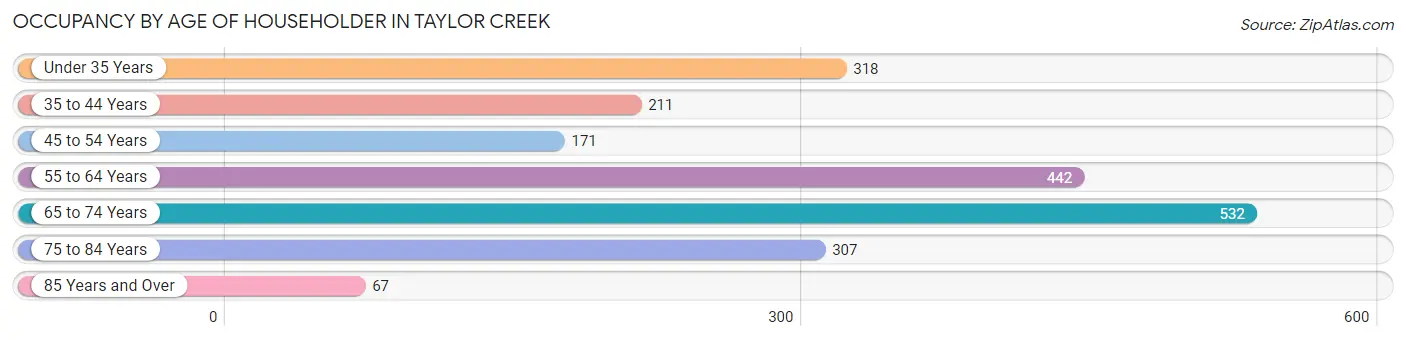
| Age Bracket | # Households | % Households |
| Under 35 Years | 318 | 15.5% |
| 35 to 44 Years | 211 | 10.3% |
| 45 to 54 Years | 171 | 8.4% |
| 55 to 64 Years | 442 | 21.6% |
| 65 to 74 Years | 532 | 26.0% |
| 75 to 84 Years | 307 | 15.0% |
| 85 Years and Over | 67 | 3.3% |
| Total | 2,048 | 100.0% |
Housing Finances in Taylor Creek
Median Income by Occupancy in Taylor Creek
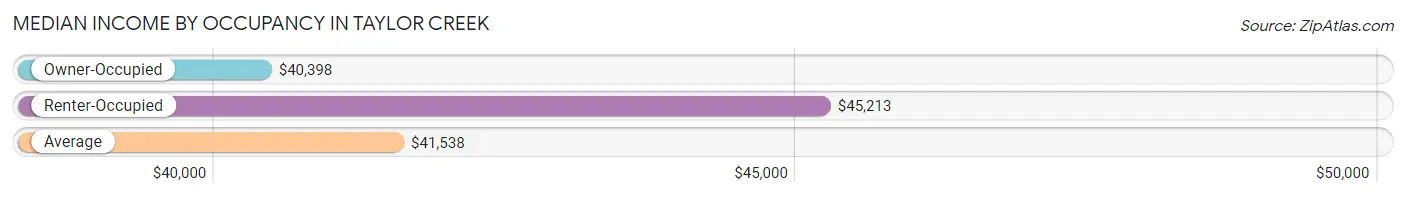
| Occupancy Type | # Households | Median Income |
| Owner-Occupied | 1,497 (73.1%) | $40,398 |
| Renter-Occupied | 551 (26.9%) | $45,213 |
| Average | 2,048 (100.0%) | $41,538 |
Occupancy by Householder Income Bracket in Taylor Creek
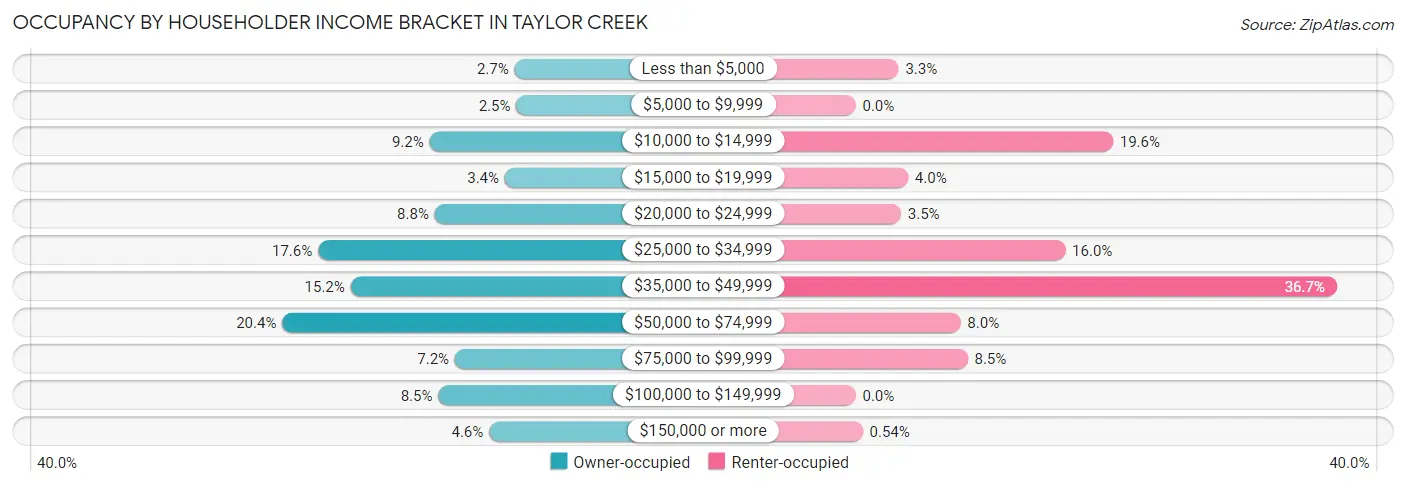
| Income Bracket | Owner-occupied | Renter-occupied |
| Less than $5,000 | 40 (2.7%) | 18 (3.3%) |
| $5,000 to $9,999 | 38 (2.5%) | 0 (0.0%) |
| $10,000 to $14,999 | 137 (9.1%) | 108 (19.6%) |
| $15,000 to $19,999 | 51 (3.4%) | 22 (4.0%) |
| $20,000 to $24,999 | 131 (8.7%) | 19 (3.5%) |
| $25,000 to $34,999 | 264 (17.6%) | 88 (16.0%) |
| $35,000 to $49,999 | 227 (15.2%) | 202 (36.7%) |
| $50,000 to $74,999 | 305 (20.4%) | 44 (8.0%) |
| $75,000 to $99,999 | 108 (7.2%) | 47 (8.5%) |
| $100,000 to $149,999 | 127 (8.5%) | 0 (0.0%) |
| $150,000 or more | 69 (4.6%) | 3 (0.5%) |
| Total | 1,497 (100.0%) | 551 (100.0%) |
Monthly Housing Cost Tiers in Taylor Creek
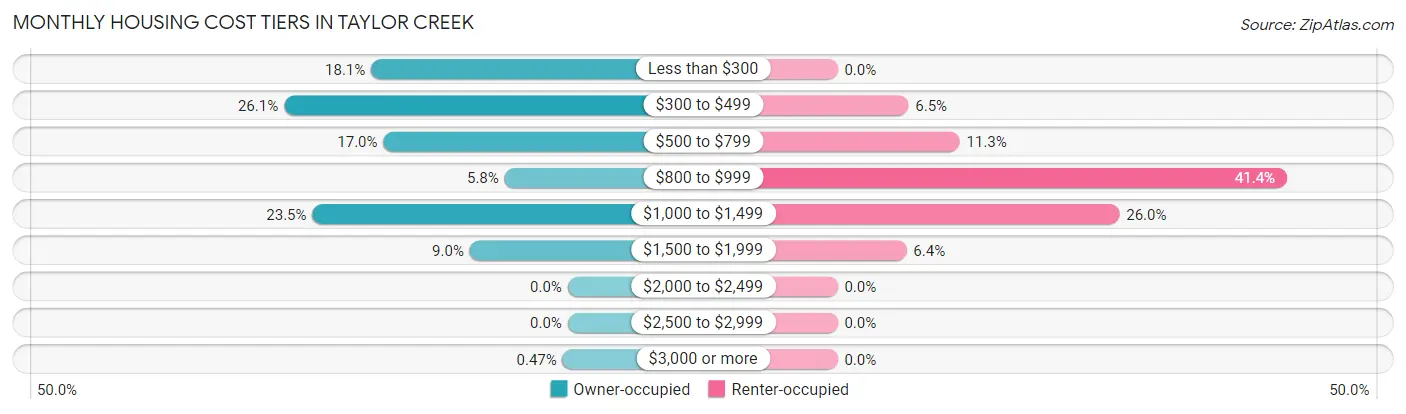
| Monthly Cost | Owner-occupied | Renter-occupied |
| Less than $300 | 271 (18.1%) | 0 (0.0%) |
| $300 to $499 | 391 (26.1%) | 36 (6.5%) |
| $500 to $799 | 254 (17.0%) | 62 (11.3%) |
| $800 to $999 | 87 (5.8%) | 228 (41.4%) |
| $1,000 to $1,499 | 352 (23.5%) | 143 (26.0%) |
| $1,500 to $1,999 | 135 (9.0%) | 35 (6.4%) |
| $2,000 to $2,499 | 0 (0.0%) | 0 (0.0%) |
| $2,500 to $2,999 | 0 (0.0%) | 0 (0.0%) |
| $3,000 or more | 7 (0.5%) | 0 (0.0%) |
| Total | 1,497 (100.0%) | 551 (100.0%) |
Physical Housing Characteristics in Taylor Creek
Housing Structures in Taylor Creek
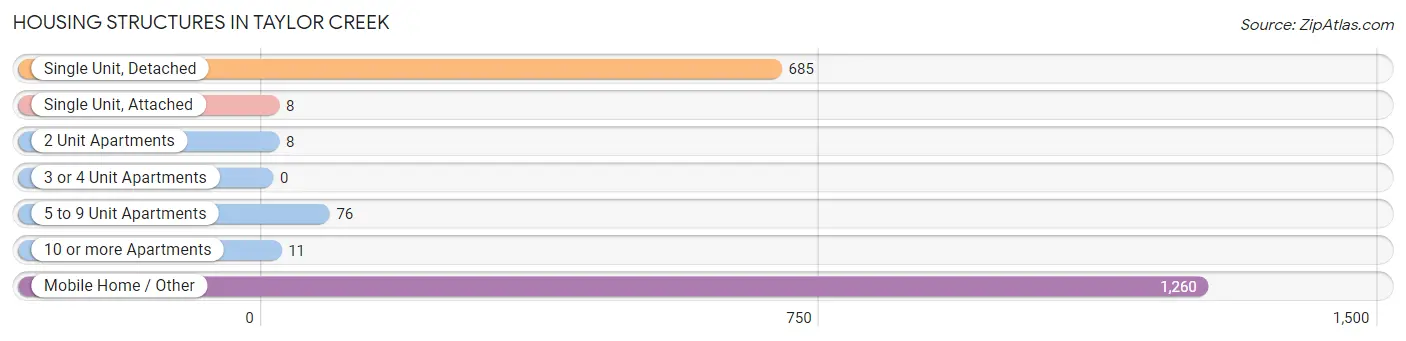
| Structure Type | # Housing Units | % Housing Units |
| Single Unit, Detached | 685 | 33.5% |
| Single Unit, Attached | 8 | 0.4% |
| 2 Unit Apartments | 8 | 0.4% |
| 3 or 4 Unit Apartments | 0 | 0.0% |
| 5 to 9 Unit Apartments | 76 | 3.7% |
| 10 or more Apartments | 11 | 0.5% |
| Mobile Home / Other | 1,260 | 61.5% |
| Total | 2,048 | 100.0% |
Housing Structures by Occupancy in Taylor Creek
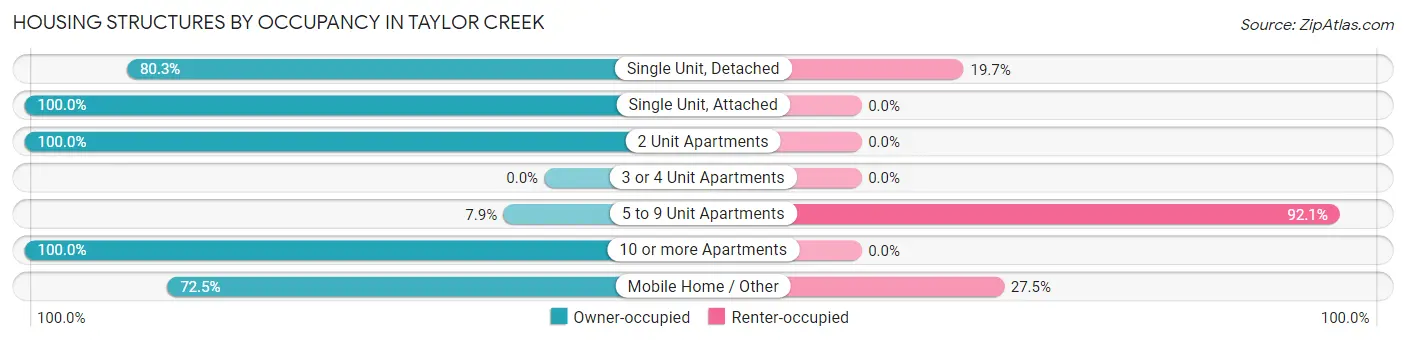
| Structure Type | Owner-occupied | Renter-occupied |
| Single Unit, Detached | 550 (80.3%) | 135 (19.7%) |
| Single Unit, Attached | 8 (100.0%) | 0 (0.0%) |
| 2 Unit Apartments | 8 (100.0%) | 0 (0.0%) |
| 3 or 4 Unit Apartments | 0 (0.0%) | 0 (0.0%) |
| 5 to 9 Unit Apartments | 6 (7.9%) | 70 (92.1%) |
| 10 or more Apartments | 11 (100.0%) | 0 (0.0%) |
| Mobile Home / Other | 914 (72.5%) | 346 (27.5%) |
| Total | 1,497 (73.1%) | 551 (26.9%) |
Housing Structures by Number of Rooms in Taylor Creek
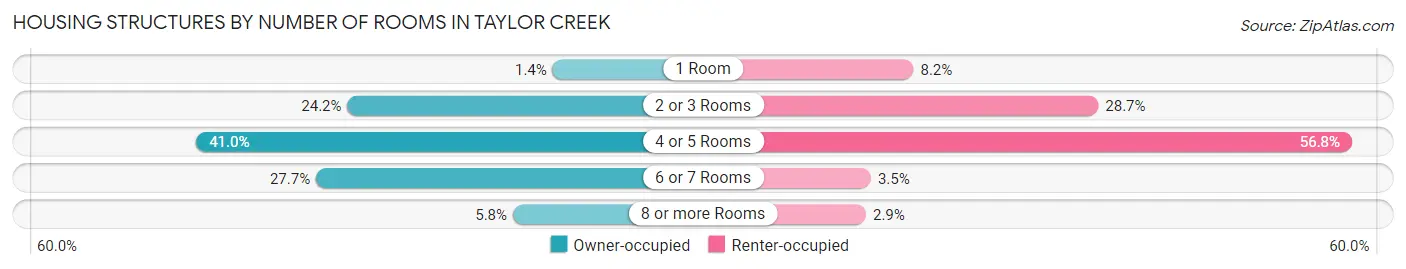
| Number of Rooms | Owner-occupied | Renter-occupied |
| 1 Room | 21 (1.4%) | 45 (8.2%) |
| 2 or 3 Rooms | 362 (24.2%) | 158 (28.7%) |
| 4 or 5 Rooms | 613 (40.9%) | 313 (56.8%) |
| 6 or 7 Rooms | 414 (27.7%) | 19 (3.5%) |
| 8 or more Rooms | 87 (5.8%) | 16 (2.9%) |
| Total | 1,497 (100.0%) | 551 (100.0%) |
Housing Structure by Heating Type in Taylor Creek
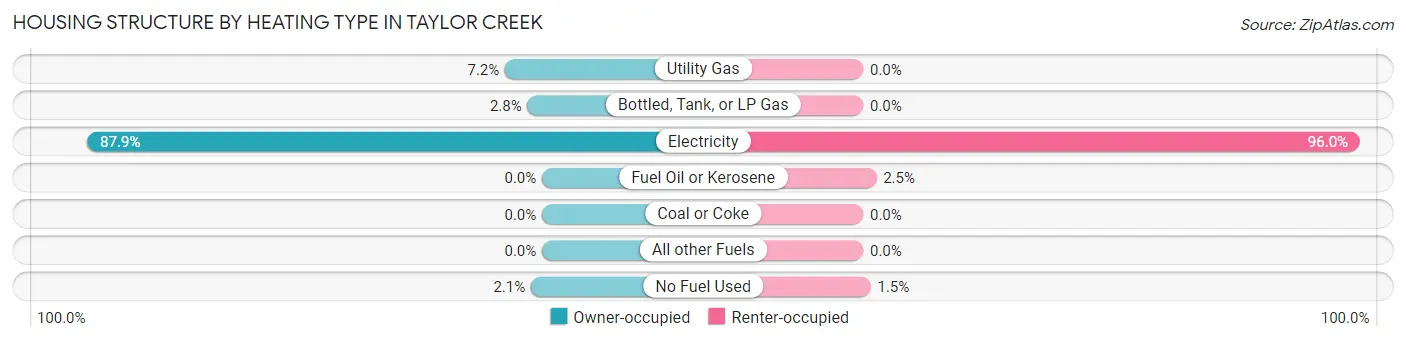
| Heating Type | Owner-occupied | Renter-occupied |
| Utility Gas | 107 (7.1%) | 0 (0.0%) |
| Bottled, Tank, or LP Gas | 42 (2.8%) | 0 (0.0%) |
| Electricity | 1,316 (87.9%) | 529 (96.0%) |
| Fuel Oil or Kerosene | 0 (0.0%) | 14 (2.5%) |
| Coal or Coke | 0 (0.0%) | 0 (0.0%) |
| All other Fuels | 0 (0.0%) | 0 (0.0%) |
| No Fuel Used | 32 (2.1%) | 8 (1.5%) |
| Total | 1,497 (100.0%) | 551 (100.0%) |
Household Vehicle Usage in Taylor Creek
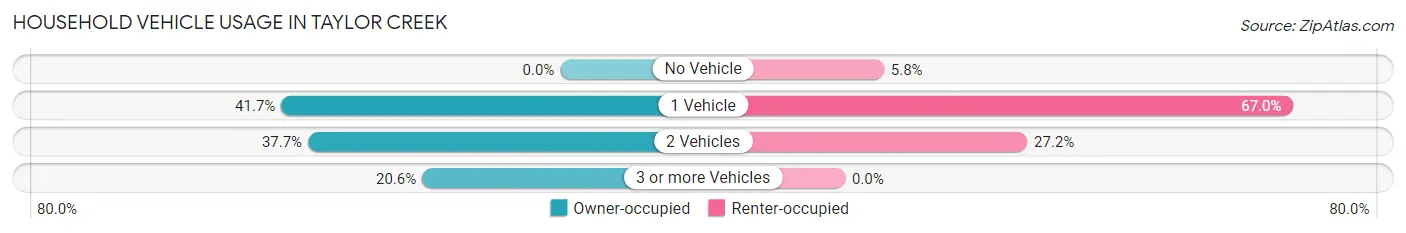
| Vehicles per Household | Owner-occupied | Renter-occupied |
| No Vehicle | 0 (0.0%) | 32 (5.8%) |
| 1 Vehicle | 624 (41.7%) | 369 (67.0%) |
| 2 Vehicles | 564 (37.7%) | 150 (27.2%) |
| 3 or more Vehicles | 309 (20.6%) | 0 (0.0%) |
| Total | 1,497 (100.0%) | 551 (100.0%) |
Real Estate & Mortgages in Taylor Creek
Real Estate and Mortgage Overview in Taylor Creek
| Characteristic | Without Mortgage | With Mortgage |
| Housing Units | 920 | 577 |
| Median Property Value | $101,100 | $159,900 |
| Median Household Income | $32,577 | $45 |
| Monthly Housing Costs | $341 | $7 |
| Real Estate Taxes | $941 | $11 |
Property Value by Mortgage Status in Taylor Creek
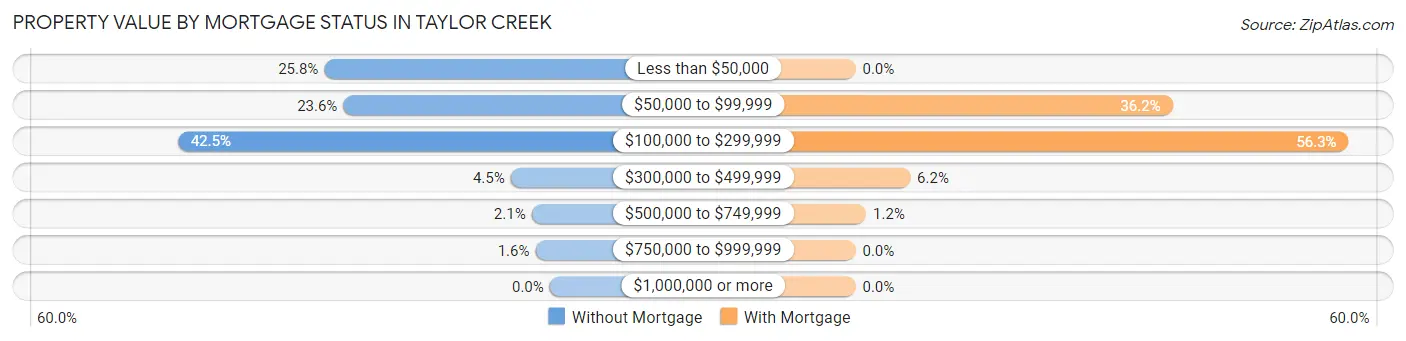
| Property Value | Without Mortgage | With Mortgage |
| Less than $50,000 | 237 (25.8%) | 0 (0.0%) |
| $50,000 to $99,999 | 217 (23.6%) | 209 (36.2%) |
| $100,000 to $299,999 | 391 (42.5%) | 325 (56.3%) |
| $300,000 to $499,999 | 41 (4.5%) | 36 (6.2%) |
| $500,000 to $749,999 | 19 (2.1%) | 7 (1.2%) |
| $750,000 to $999,999 | 15 (1.6%) | 0 (0.0%) |
| $1,000,000 or more | 0 (0.0%) | 0 (0.0%) |
| Total | 920 (100.0%) | 577 (100.0%) |
Household Income by Mortgage Status in Taylor Creek
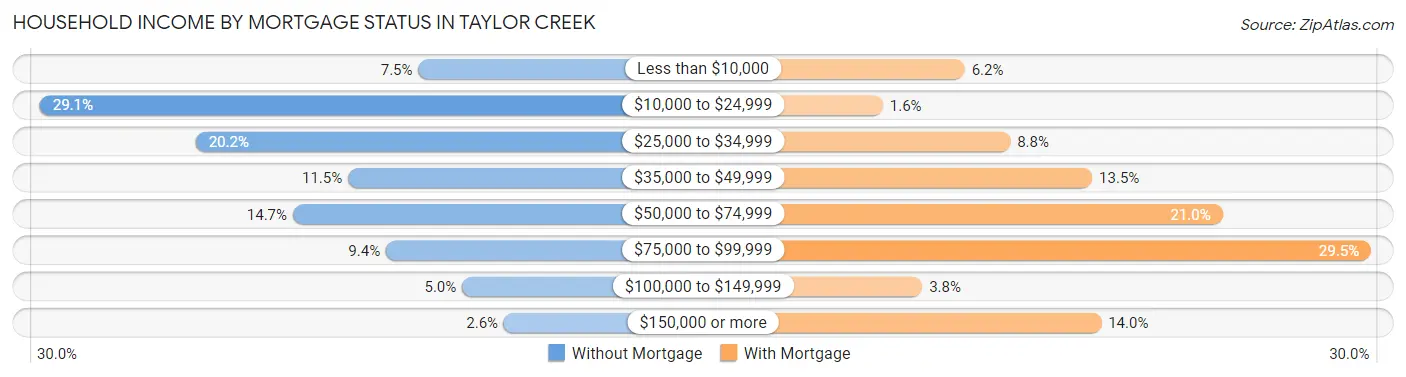
| Household Income | Without Mortgage | With Mortgage |
| Less than $10,000 | 69 (7.5%) | 36 (6.2%) |
| $10,000 to $24,999 | 268 (29.1%) | 9 (1.6%) |
| $25,000 to $34,999 | 186 (20.2%) | 51 (8.8%) |
| $35,000 to $49,999 | 106 (11.5%) | 78 (13.5%) |
| $50,000 to $74,999 | 135 (14.7%) | 121 (21.0%) |
| $75,000 to $99,999 | 86 (9.3%) | 170 (29.5%) |
| $100,000 to $149,999 | 46 (5.0%) | 22 (3.8%) |
| $150,000 or more | 24 (2.6%) | 81 (14.0%) |
| Total | 920 (100.0%) | 577 (100.0%) |
Property Value to Household Income Ratio in Taylor Creek
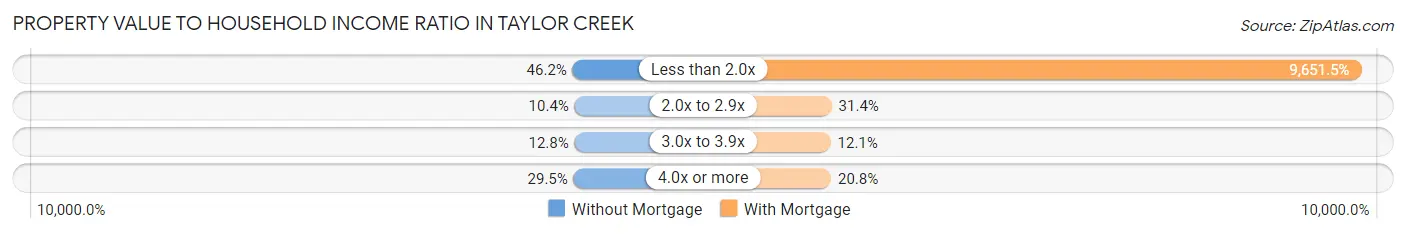
| Value-to-Income Ratio | Without Mortgage | With Mortgage |
| Less than 2.0x | 425 (46.2%) | 55,689 (9,651.5%) |
| 2.0x to 2.9x | 96 (10.4%) | 181 (31.4%) |
| 3.0x to 3.9x | 118 (12.8%) | 70 (12.1%) |
| 4.0x or more | 271 (29.5%) | 120 (20.8%) |
| Total | 920 (100.0%) | 577 (100.0%) |
Real Estate Taxes by Mortgage Status in Taylor Creek
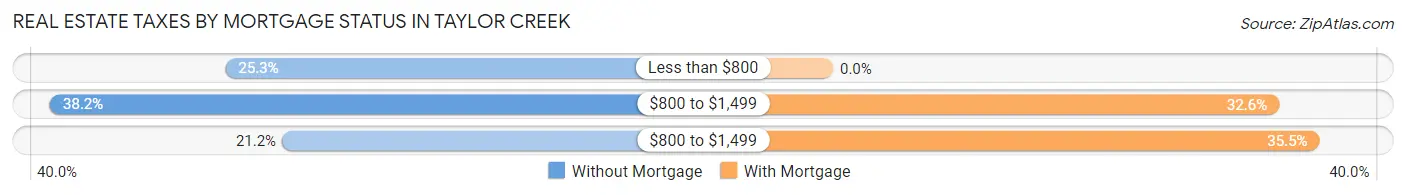
| Property Taxes | Without Mortgage | With Mortgage |
| Less than $800 | 233 (25.3%) | 0 (0.0%) |
| $800 to $1,499 | 351 (38.2%) | 188 (32.6%) |
| $800 to $1,499 | 195 (21.2%) | 205 (35.5%) |
| Total | 920 (100.0%) | 577 (100.0%) |
Health & Disability in Taylor Creek
Health Insurance Coverage by Age in Taylor Creek
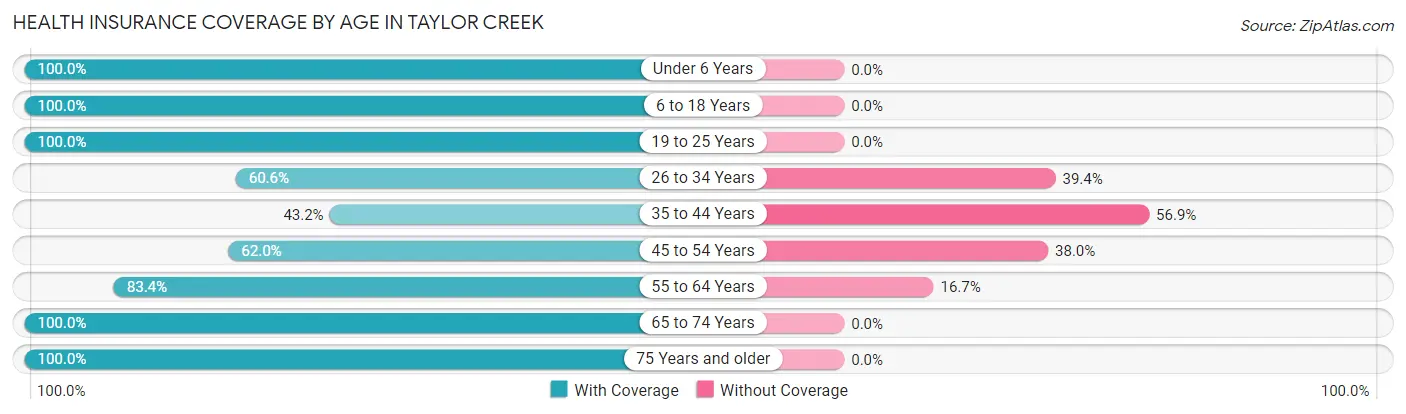
| Age Bracket | With Coverage | Without Coverage |
| Under 6 Years | 211 (100.0%) | 0 (0.0%) |
| 6 to 18 Years | 804 (100.0%) | 0 (0.0%) |
| 19 to 25 Years | 65 (100.0%) | 0 (0.0%) |
| 26 to 34 Years | 297 (60.6%) | 193 (39.4%) |
| 35 to 44 Years | 208 (43.1%) | 274 (56.9%) |
| 45 to 54 Years | 168 (62.0%) | 103 (38.0%) |
| 55 to 64 Years | 646 (83.4%) | 129 (16.7%) |
| 65 to 74 Years | 805 (100.0%) | 0 (0.0%) |
| 75 Years and older | 663 (100.0%) | 0 (0.0%) |
| Total | 3,867 (84.7%) | 699 (15.3%) |
Health Insurance Coverage by Citizenship Status in Taylor Creek
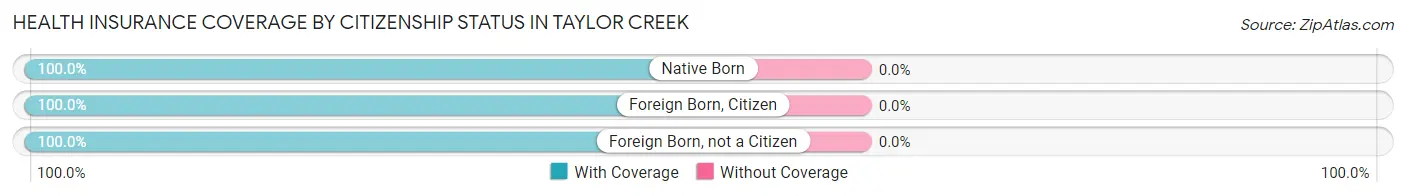
| Citizenship Status | With Coverage | Without Coverage |
| Native Born | 211 (100.0%) | 0 (0.0%) |
| Foreign Born, Citizen | 804 (100.0%) | 0 (0.0%) |
| Foreign Born, not a Citizen | 65 (100.0%) | 0 (0.0%) |
Health Insurance Coverage by Household Income in Taylor Creek
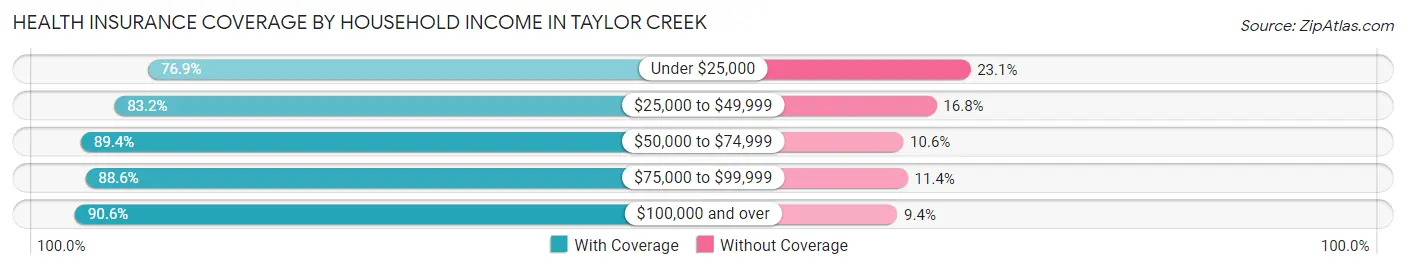
| Household Income | With Coverage | Without Coverage |
| Under $25,000 | 668 (76.9%) | 201 (23.1%) |
| $25,000 to $49,999 | 1,457 (83.2%) | 294 (16.8%) |
| $50,000 to $74,999 | 906 (89.4%) | 107 (10.6%) |
| $75,000 to $99,999 | 404 (88.6%) | 52 (11.4%) |
| $100,000 and over | 432 (90.6%) | 45 (9.4%) |
Public vs Private Health Insurance Coverage by Age in Taylor Creek
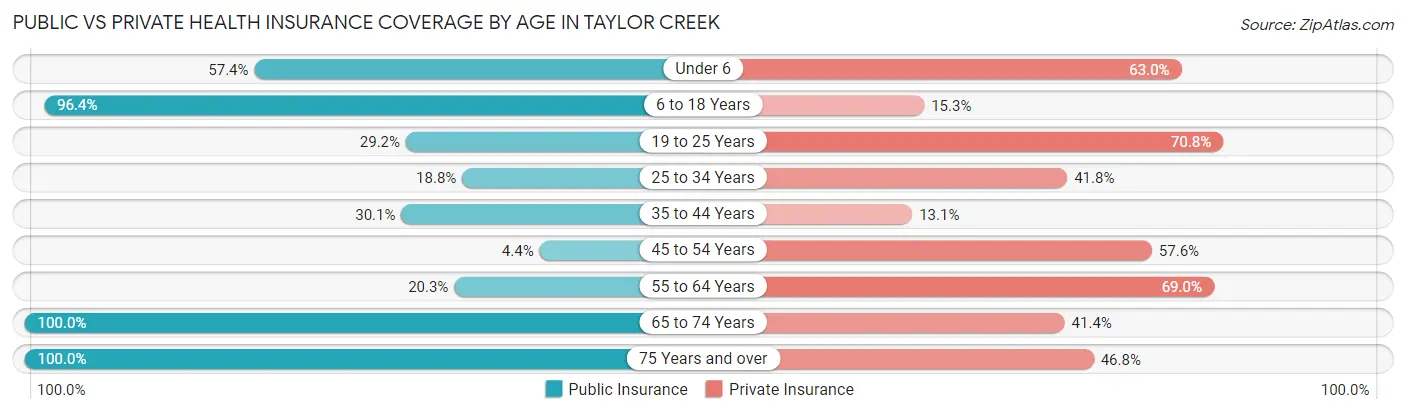
| Age Bracket | Public Insurance | Private Insurance |
| Under 6 | 121 (57.4%) | 133 (63.0%) |
| 6 to 18 Years | 775 (96.4%) | 123 (15.3%) |
| 19 to 25 Years | 19 (29.2%) | 46 (70.8%) |
| 25 to 34 Years | 92 (18.8%) | 205 (41.8%) |
| 35 to 44 Years | 145 (30.1%) | 63 (13.1%) |
| 45 to 54 Years | 12 (4.4%) | 156 (57.6%) |
| 55 to 64 Years | 157 (20.3%) | 535 (69.0%) |
| 65 to 74 Years | 805 (100.0%) | 333 (41.4%) |
| 75 Years and over | 663 (100.0%) | 310 (46.8%) |
| Total | 2,789 (61.1%) | 1,904 (41.7%) |
Disability Status by Sex by Age in Taylor Creek
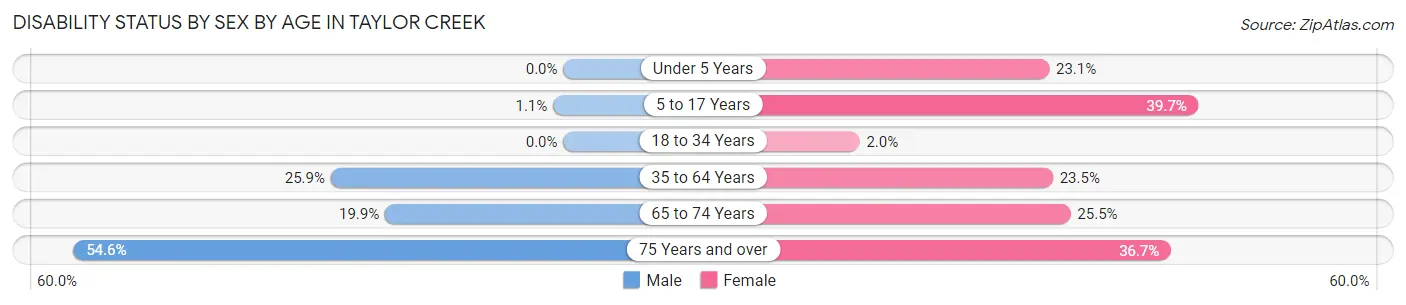
| Age Bracket | Male | Female |
| Under 5 Years | 0 (0.0%) | 18 (23.1%) |
| 5 to 17 Years | 6 (1.1%) | 122 (39.7%) |
| 18 to 34 Years | 0 (0.0%) | 5 (2.0%) |
| 35 to 64 Years | 216 (25.9%) | 163 (23.5%) |
| 65 to 74 Years | 85 (19.9%) | 96 (25.5%) |
| 75 Years and over | 155 (54.6%) | 139 (36.7%) |
Disability Class by Sex by Age in Taylor Creek
Disability Class: Hearing Difficulty
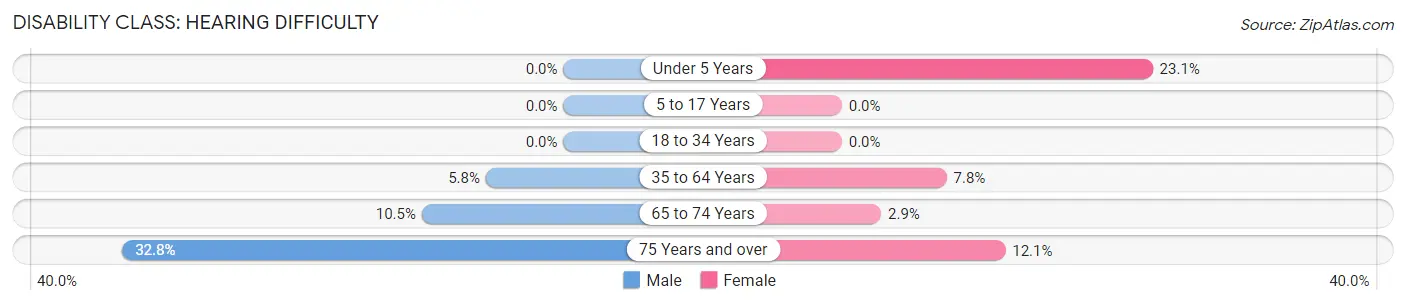
| Age Bracket | Male | Female |
| Under 5 Years | 0 (0.0%) | 18 (23.1%) |
| 5 to 17 Years | 0 (0.0%) | 0 (0.0%) |
| 18 to 34 Years | 0 (0.0%) | 0 (0.0%) |
| 35 to 64 Years | 48 (5.8%) | 54 (7.8%) |
| 65 to 74 Years | 45 (10.5%) | 11 (2.9%) |
| 75 Years and over | 93 (32.8%) | 46 (12.1%) |
Disability Class: Vision Difficulty
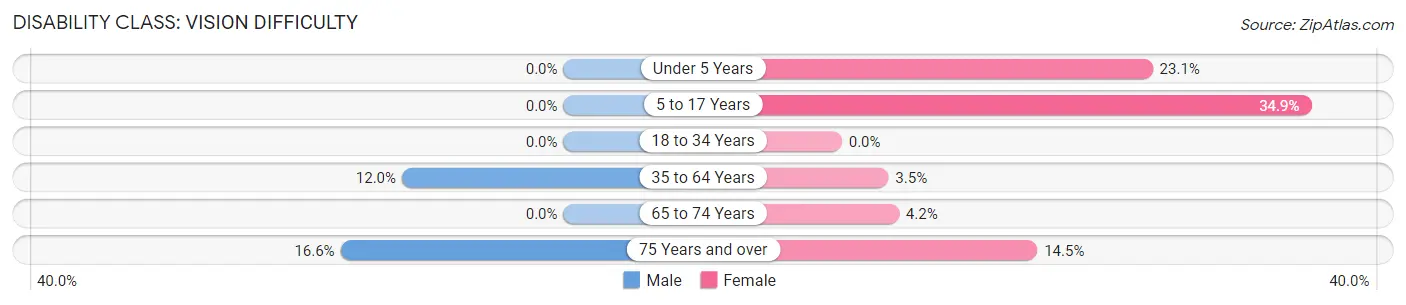
| Age Bracket | Male | Female |
| Under 5 Years | 0 (0.0%) | 18 (23.1%) |
| 5 to 17 Years | 0 (0.0%) | 107 (34.8%) |
| 18 to 34 Years | 0 (0.0%) | 0 (0.0%) |
| 35 to 64 Years | 100 (12.0%) | 24 (3.5%) |
| 65 to 74 Years | 0 (0.0%) | 16 (4.2%) |
| 75 Years and over | 47 (16.6%) | 55 (14.5%) |
Disability Class: Cognitive Difficulty
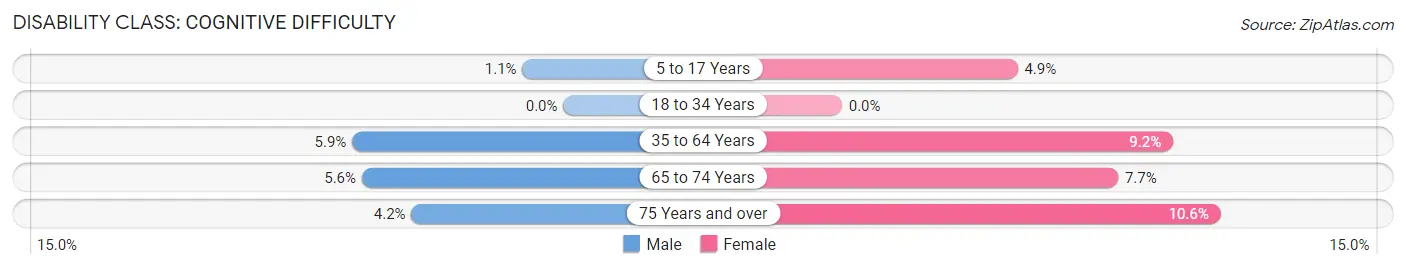
| Age Bracket | Male | Female |
| 5 to 17 Years | 6 (1.1%) | 15 (4.9%) |
| 18 to 34 Years | 0 (0.0%) | 0 (0.0%) |
| 35 to 64 Years | 49 (5.9%) | 64 (9.2%) |
| 65 to 74 Years | 24 (5.6%) | 29 (7.7%) |
| 75 Years and over | 12 (4.2%) | 40 (10.5%) |
Disability Class: Ambulatory Difficulty
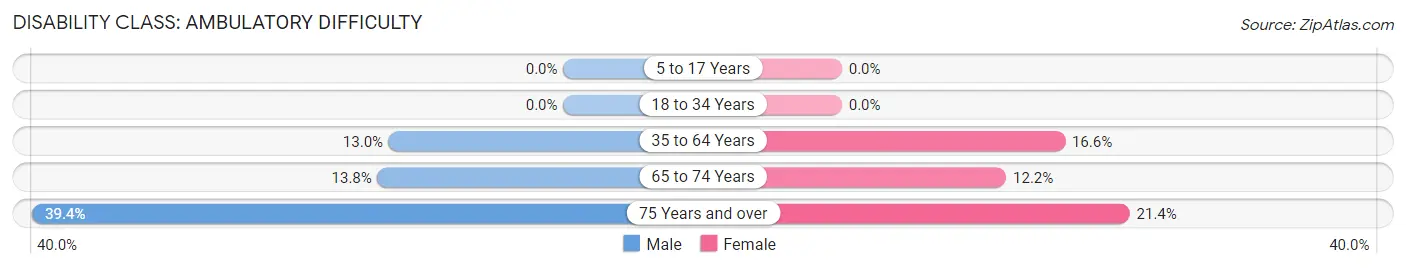
| Age Bracket | Male | Female |
| 5 to 17 Years | 0 (0.0%) | 0 (0.0%) |
| 18 to 34 Years | 0 (0.0%) | 0 (0.0%) |
| 35 to 64 Years | 108 (13.0%) | 115 (16.6%) |
| 65 to 74 Years | 59 (13.8%) | 46 (12.2%) |
| 75 Years and over | 112 (39.4%) | 81 (21.4%) |
Disability Class: Self-Care Difficulty
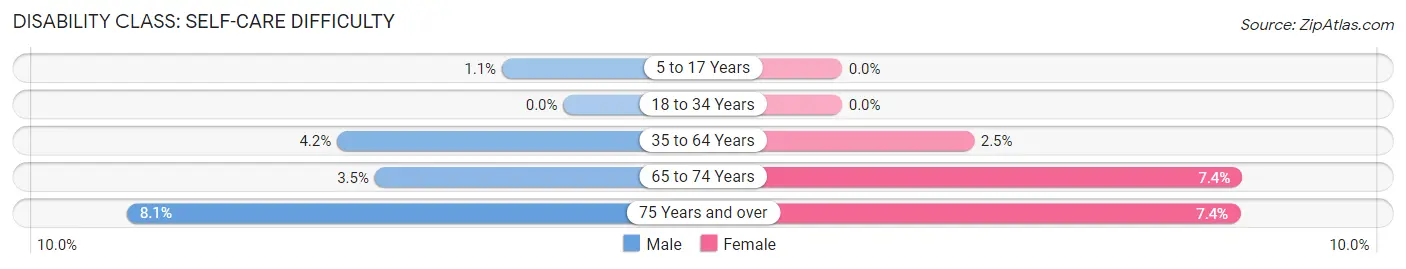
| Age Bracket | Male | Female |
| 5 to 17 Years | 6 (1.1%) | 0 (0.0%) |
| 18 to 34 Years | 0 (0.0%) | 0 (0.0%) |
| 35 to 64 Years | 35 (4.2%) | 17 (2.5%) |
| 65 to 74 Years | 15 (3.5%) | 28 (7.4%) |
| 75 Years and over | 23 (8.1%) | 28 (7.4%) |
Technology Access in Taylor Creek
Computing Device Access in Taylor Creek
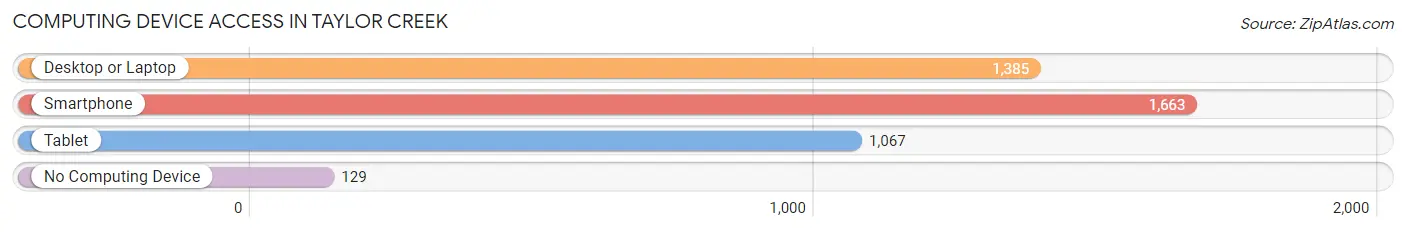
| Device Type | # Households | % Households |
| Desktop or Laptop | 1,385 | 67.6% |
| Smartphone | 1,663 | 81.2% |
| Tablet | 1,067 | 52.1% |
| No Computing Device | 129 | 6.3% |
| Total | 2,048 | 100.0% |
Internet Access in Taylor Creek
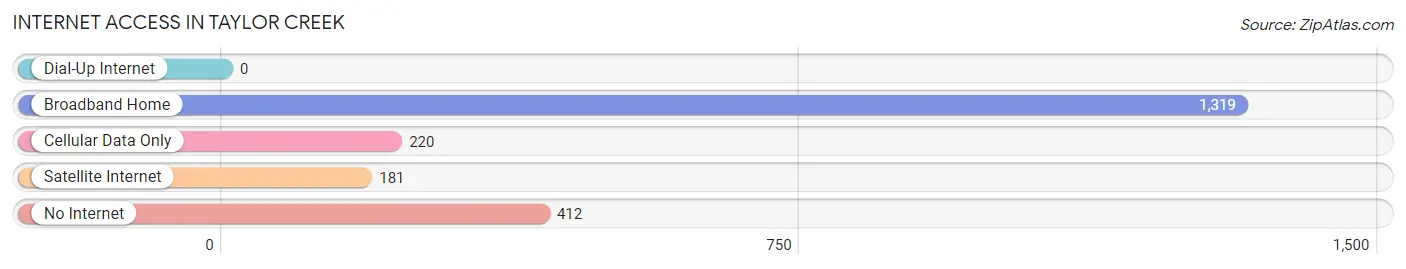
| Internet Type | # Households | % Households |
| Dial-Up Internet | 0 | 0.0% |
| Broadband Home | 1,319 | 64.4% |
| Cellular Data Only | 220 | 10.7% |
| Satellite Internet | 181 | 8.8% |
| No Internet | 412 | 20.1% |
| Total | 2,048 | 100.0% |
Taylor Creek Summary
Taylor Creek is a small unincorporated community located in the state of Florida, in the United States. It is situated in the northern part of the state, in Levy County, and is part of the Gainesville Metropolitan Statistical Area. The community is located on the banks of the Taylor Creek, a tributary of the Suwannee River.
History
The area that is now Taylor Creek was first settled in the late 19th century by settlers from the nearby town of Bronson. The settlers were attracted to the area by the abundance of timber and the potential for farming. The community was originally known as Taylor's Creek, named after the creek that runs through the area. The name was eventually shortened to Taylor Creek.
In the early 20th century, the community began to grow and develop. A post office was established in the area in 1910, and a school was built in 1912. The school was later replaced by a larger school in the 1950s.
In the late 20th century, the community began to decline as the timber industry declined and the population began to move away. The post office closed in the 1990s, and the school closed in the 2000s.
Geography
Taylor Creek is located in Levy County, in the northern part of the state of Florida. It is situated on the banks of the Taylor Creek, a tributary of the Suwannee River. The community is located about 25 miles south of Gainesville, and about 50 miles west of Jacksonville.
The area is mostly rural, with a few small farms and timber operations. The terrain is mostly flat, with some rolling hills. The climate is subtropical, with hot, humid summers and mild winters.
Economy
The economy of Taylor Creek is largely based on agriculture and timber. The area is home to several small farms, which produce a variety of crops, including corn, soybeans, and cotton. The timber industry is also important to the local economy, with several timber operations in the area.
In addition to agriculture and timber, the community is also home to several small businesses, including a convenience store, a gas station, and a restaurant.
Demographics
As of the 2010 census, the population of Taylor Creek was 1,093. The racial makeup of the community was 94.3% White, 2.2% African American, 0.7% Native American, 0.3% Asian, 0.1% Pacific Islander, and 2.4% from other races. The median household income was $30,938, and the median family income was $37,813.
Conclusion
Taylor Creek is a small unincorporated community located in Levy County, Florida. It is situated on the banks of the Taylor Creek, a tributary of the Suwannee River. The community was first settled in the late 19th century, and has since developed into a rural area with a largely agricultural and timber-based economy. The population of Taylor Creek is 1,093, and the median household income is $30,938.
Common Questions
What is Per Capita Income in Taylor Creek?
Per Capita income in Taylor Creek is $27,721.
What is the Median Family Income in Taylor Creek?
Median Family Income in Taylor Creek is $45,986.
What is the Median Household income in Taylor Creek?
Median Household Income in Taylor Creek is $41,538.
What is Income or Wage Gap in Taylor Creek?
Income or Wage Gap in Taylor Creek is 11.6%.
Women in Taylor Creek earn 88.4 cents for every dollar earned by a man.
What is Inequality or Gini Index in Taylor Creek?
Inequality or Gini Index in Taylor Creek is 0.51.
What is the Total Population of Taylor Creek?
Total Population of Taylor Creek is 4,566.
What is the Total Male Population of Taylor Creek?
Total Male Population of Taylor Creek is 2,477.
What is the Total Female Population of Taylor Creek?
Total Female Population of Taylor Creek is 2,089.
What is the Ratio of Males per 100 Females in Taylor Creek?
There are 118.57 Males per 100 Females in Taylor Creek.
What is the Ratio of Females per 100 Males in Taylor Creek?
There are 84.34 Females per 100 Males in Taylor Creek.
What is the Median Population Age in Taylor Creek?
Median Population Age in Taylor Creek is 54.5 Years.
What is the Average Family Size in Taylor Creek
Average Family Size in Taylor Creek is 2.6 People.
What is the Average Household Size in Taylor Creek
Average Household Size in Taylor Creek is 2.2 People.
How Large is the Labor Force in Taylor Creek?
There are 1,616 People in the Labor Forcein in Taylor Creek.
What is the Percentage of People in the Labor Force in Taylor Creek?
43.7% of People are in the Labor Force in Taylor Creek.
What is the Unemployment Rate in Taylor Creek?
Unemployment Rate in Taylor Creek is 10.4%.