Venice, FL Map & Demographics
Venice Map
Venice Overview
$71,275
PER CAPITA INCOME
$98,812
AVG FAMILY INCOME
$68,843
AVG HOUSEHOLD INCOME
50.1%
WAGE / INCOME GAP [ % ]
49.9¢/ $1
WAGE / INCOME GAP [ $ ]
0.61
INEQUALITY / GINI INDEX
25,710
TOTAL POPULATION
11,457
MALE POPULATION
14,253
FEMALE POPULATION
80.38
MALES / 100 FEMALES
124.40
FEMALES / 100 MALES
68.8
MEDIAN AGE
2.3
AVG FAMILY SIZE
1.8
AVG HOUSEHOLD SIZE
7,545
LABOR FORCE [ PEOPLE ]
30.7%
PERCENT IN LABOR FORCE
4.0%
UNEMPLOYMENT RATE
Venice Area Codes
Income in Venice
Income Overview in Venice
Per Capita Income in Venice is $71,275, while median incomes of families and households are $98,812 and $68,843 respectively.
| Characteristic | Number | Measure |
| Per Capita Income | 25,710 | $71,275 |
| Median Family Income | 7,312 | $98,812 |
| Mean Family Income | 7,312 | $142,227 |
| Median Household Income | 13,840 | $68,843 |
| Mean Household Income | 13,840 | $132,664 |
| Income Deficit | 7,312 | $0 |
| Wage / Income Gap (%) | 25,710 | 50.14% |
| Wage / Income Gap ($) | 25,710 | 49.86¢ per $1 |
| Gini / Inequality Index | 25,710 | 0.61 |
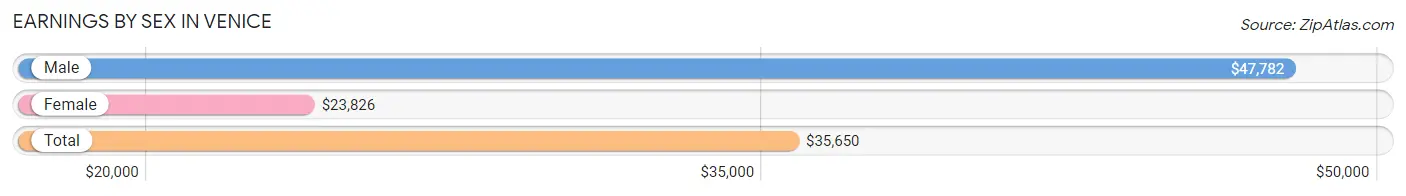
Earnings by Sex in Venice
Average Earnings in Venice are $35,650, $47,782 for men and $23,826 for women, a difference of 50.1%.
| Sex | Number | Average Earnings |
| Male | 4,055 (49.2%) | $47,782 |
| Female | 4,185 (50.8%) | $23,826 |
| Total | 8,240 (100.0%) | $35,650 |
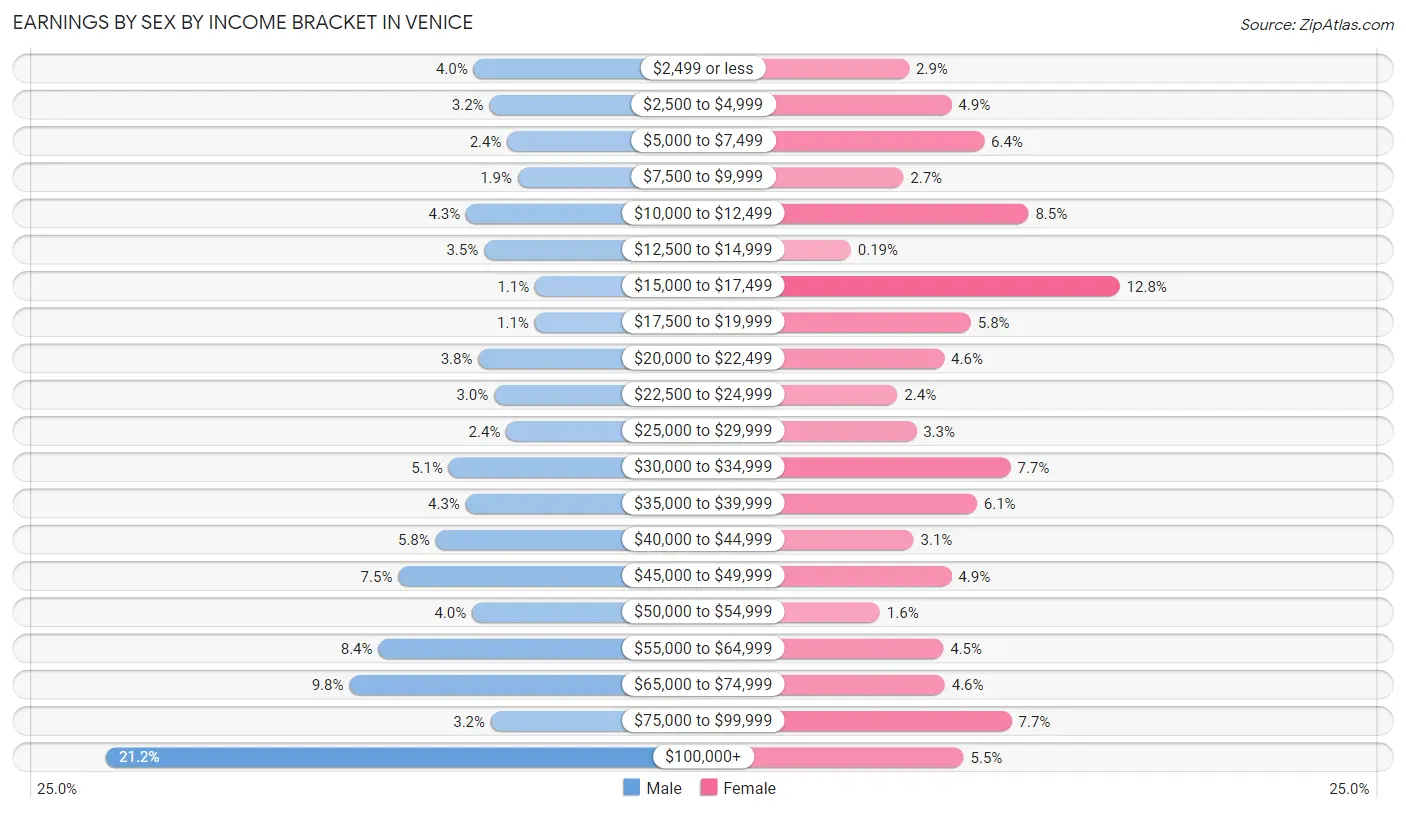
Earnings by Sex by Income Bracket in Venice
The most common earnings brackets in Venice are $100,000+ for men (859 | 21.2%) and $15,000 to $17,499 for women (535 | 12.8%).
| Income | Male | Female |
| $2,499 or less | 161 (4.0%) | 122 (2.9%) |
| $2,500 to $4,999 | 131 (3.2%) | 205 (4.9%) |
| $5,000 to $7,499 | 97 (2.4%) | 269 (6.4%) |
| $7,500 to $9,999 | 77 (1.9%) | 111 (2.6%) |
| $10,000 to $12,499 | 175 (4.3%) | 356 (8.5%) |
| $12,500 to $14,999 | 141 (3.5%) | 8 (0.2%) |
| $15,000 to $17,499 | 44 (1.1%) | 535 (12.8%) |
| $17,500 to $19,999 | 45 (1.1%) | 243 (5.8%) |
| $20,000 to $22,499 | 152 (3.7%) | 191 (4.6%) |
| $22,500 to $24,999 | 122 (3.0%) | 99 (2.4%) |
| $25,000 to $29,999 | 99 (2.4%) | 136 (3.3%) |
| $30,000 to $34,999 | 208 (5.1%) | 321 (7.7%) |
| $35,000 to $39,999 | 176 (4.3%) | 255 (6.1%) |
| $40,000 to $44,999 | 233 (5.8%) | 131 (3.1%) |
| $45,000 to $49,999 | 304 (7.5%) | 205 (4.9%) |
| $50,000 to $54,999 | 164 (4.0%) | 65 (1.5%) |
| $55,000 to $64,999 | 342 (8.4%) | 189 (4.5%) |
| $65,000 to $74,999 | 397 (9.8%) | 192 (4.6%) |
| $75,000 to $99,999 | 128 (3.2%) | 323 (7.7%) |
| $100,000+ | 859 (21.2%) | 229 (5.5%) |
| Total | 4,055 (100.0%) | 4,185 (100.0%) |
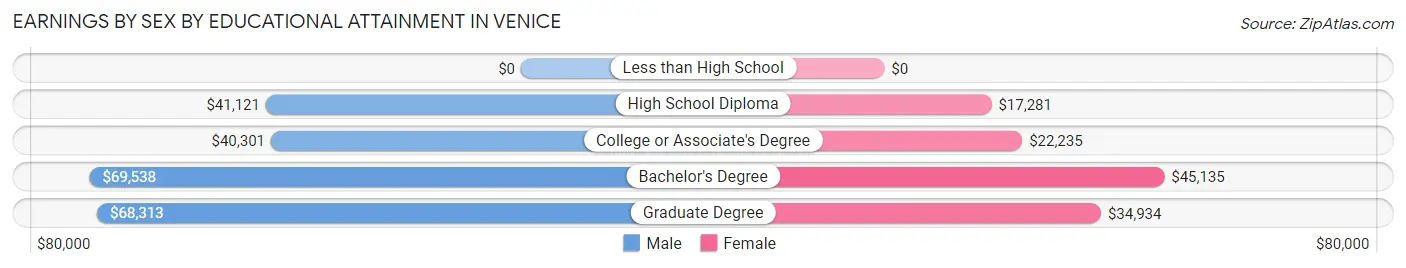
Earnings by Sex by Educational Attainment in Venice
Average earnings in Venice are $52,813 for men and $24,924 for women, a difference of 52.8%. Men with an educational attainment of bachelor's degree enjoy the highest average annual earnings of $69,538, while those with college or associate's degree education earn the least with $40,301. Women with an educational attainment of bachelor's degree earn the most with the average annual earnings of $45,135, while those with high school diploma education have the smallest earnings of $17,281.
| Educational Attainment | Male Income | Female Income |
| Less than High School | - | - |
| High School Diploma | $41,121 | $17,281 |
| College or Associate's Degree | $40,301 | $22,235 |
| Bachelor's Degree | $69,538 | $45,135 |
| Graduate Degree | $68,313 | $34,934 |
| Total | $52,813 | $24,924 |
Family Income in Venice
Family Income Brackets in Venice
According to the Venice family income data, there are 1,689 families falling into the $100,000 to $149,999 income range, which is the most common income bracket and makes up 23.1% of all families. Conversely, the $10,000 to $14,999 income bracket is the least frequent group with only 37 families (0.5%) belonging to this category.
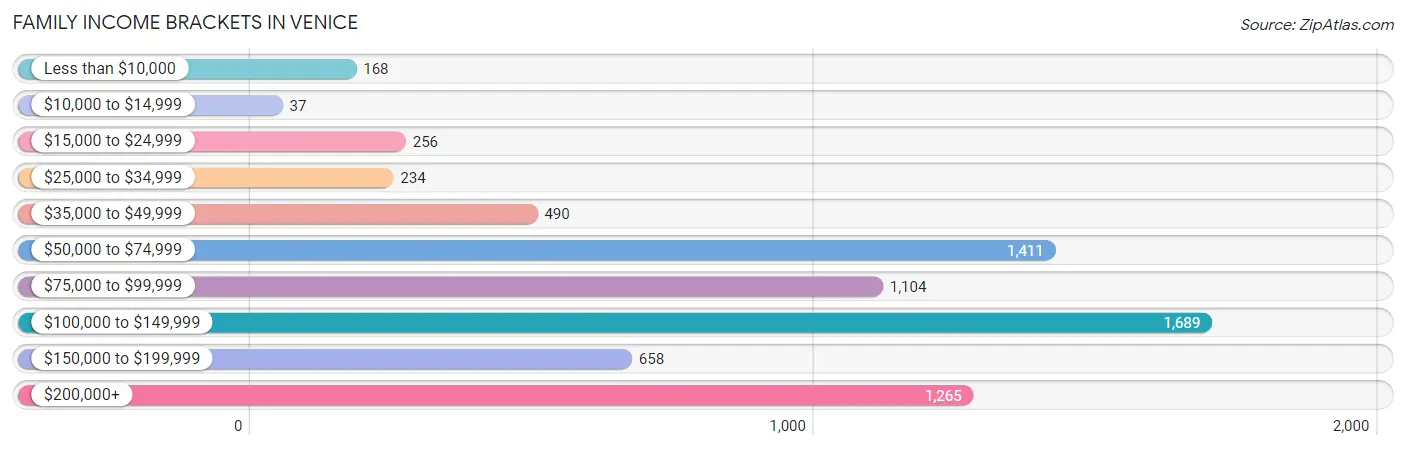
| Income Bracket | # Families | % Families |
| Less than $10,000 | 168 | 2.3% |
| $10,000 to $14,999 | 37 | 0.5% |
| $15,000 to $24,999 | 256 | 3.5% |
| $25,000 to $34,999 | 234 | 3.2% |
| $35,000 to $49,999 | 490 | 6.7% |
| $50,000 to $74,999 | 1,411 | 19.3% |
| $75,000 to $99,999 | 1,104 | 15.1% |
| $100,000 to $149,999 | 1,689 | 23.1% |
| $150,000 to $199,999 | 658 | 9.0% |
| $200,000+ | 1,265 | 17.3% |
Family Income by Famaliy Size in Venice
5-person families (175 | 2.4%) account for the highest median family income in Venice with $161,458 per family, while 2-person families (6,035 | 82.5%) have the highest median income of $48,266 per family member.
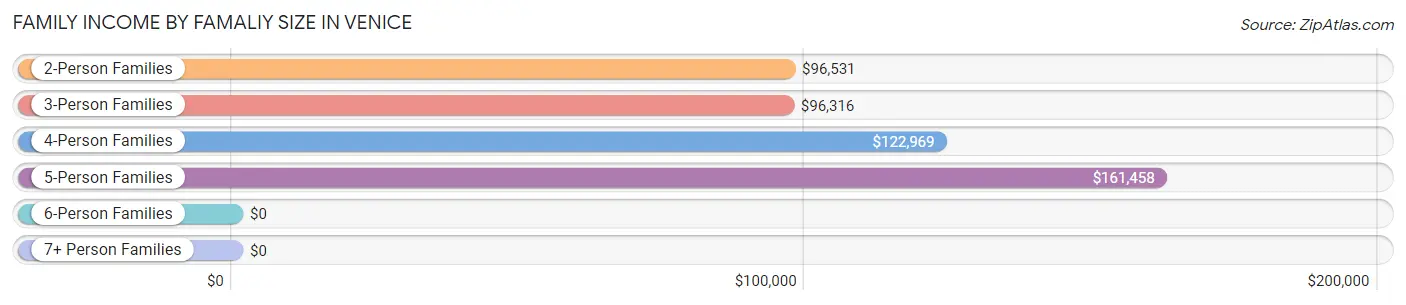
| Income Bracket | # Families | Median Income |
| 2-Person Families | 6,035 (82.5%) | $96,531 |
| 3-Person Families | 686 (9.4%) | $96,316 |
| 4-Person Families | 397 (5.4%) | $122,969 |
| 5-Person Families | 175 (2.4%) | $161,458 |
| 6-Person Families | 19 (0.3%) | $0 |
| 7+ Person Families | 0 (0.0%) | $0 |
| Total | 7,312 (100.0%) | $98,812 |
Family Income by Number of Earners in Venice
The median family income in Venice is $98,812, with families comprising 3+ earners (216) having the highest median family income of $161,167, while families with no earners (3,975) have the lowest median family income of $92,274, accounting for 2.9% and 54.4% of families, respectively.
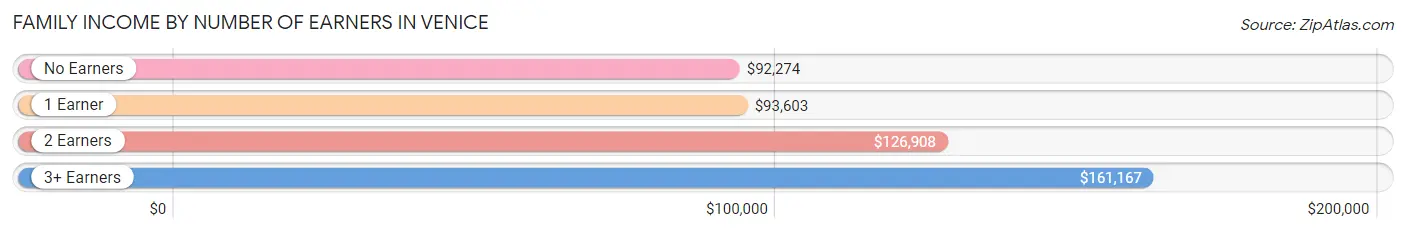
| Number of Earners | # Families | Median Income |
| No Earners | 3,975 (54.4%) | $92,274 |
| 1 Earner | 1,882 (25.7%) | $93,603 |
| 2 Earners | 1,239 (16.9%) | $126,908 |
| 3+ Earners | 216 (2.9%) | $161,167 |
| Total | 7,312 (100.0%) | $98,812 |
Household Income in Venice
Household Income Brackets in Venice
With 2,464 households falling in the category, the $50,000 to $74,999 income range is the most frequent in Venice, accounting for 17.8% of all households. In contrast, only 498 households (3.6%) fall into the $10,000 to $14,999 income bracket, making it the least populous group.
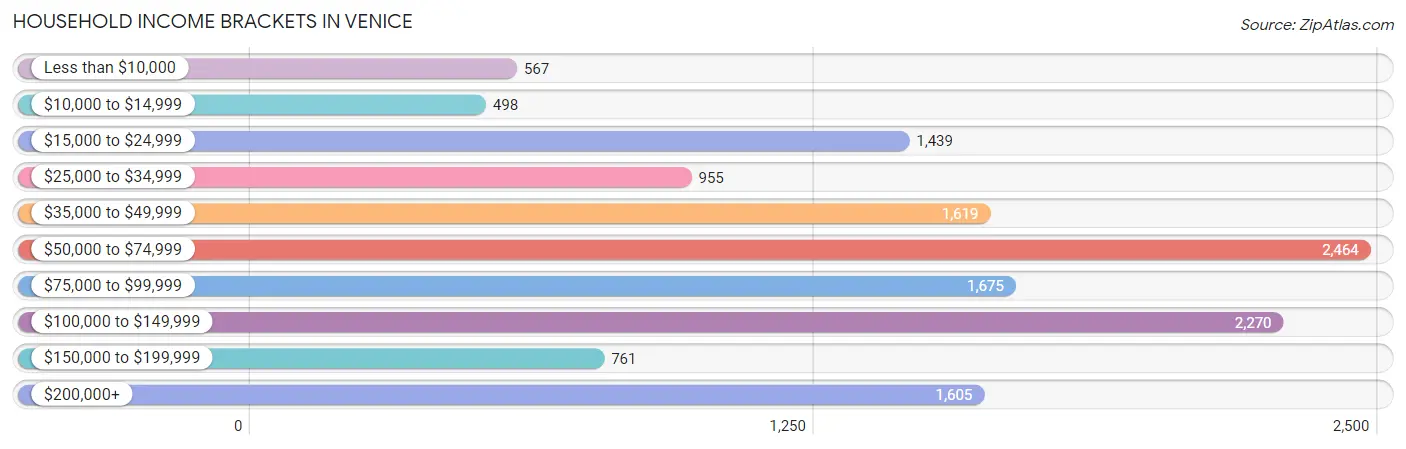
| Income Bracket | # Households | % Households |
| Less than $10,000 | 567 | 4.1% |
| $10,000 to $14,999 | 498 | 3.6% |
| $15,000 to $24,999 | 1,439 | 10.4% |
| $25,000 to $34,999 | 955 | 6.9% |
| $35,000 to $49,999 | 1,619 | 11.7% |
| $50,000 to $74,999 | 2,464 | 17.8% |
| $75,000 to $99,999 | 1,675 | 12.1% |
| $100,000 to $149,999 | 2,270 | 16.4% |
| $150,000 to $199,999 | 761 | 5.5% |
| $200,000+ | 1,605 | 11.6% |
Household Income by Householder Age in Venice
The median household income in Venice is $68,843, with the highest median household income of $90,000 found in the 45 to 64 years age bracket for the primary householder. A total of 3,270 households (23.6%) fall into this category. Meanwhile, the 65+ years age bracket for the primary householder has the lowest median household income of $63,706, with 9,589 households (69.3%) in this group.
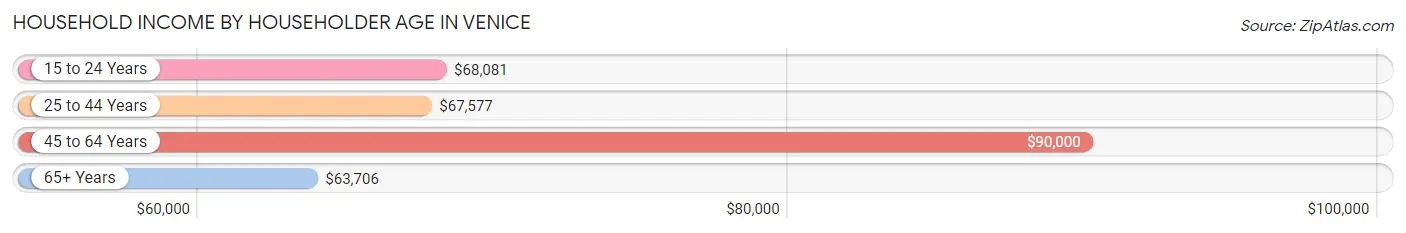
| Income Bracket | # Households | Median Income |
| 15 to 24 Years | 187 (1.3%) | $68,081 |
| 25 to 44 Years | 794 (5.7%) | $67,577 |
| 45 to 64 Years | 3,270 (23.6%) | $90,000 |
| 65+ Years | 9,589 (69.3%) | $63,706 |
| Total | 13,840 (100.0%) | $68,843 |
Poverty in Venice
Income Below Poverty by Sex and Age in Venice
With 6.7% poverty level for males and 8.2% for females among the residents of Venice, 5 year old males and 55 to 64 year old females are the most vulnerable to poverty, with 10 males (37.0%) and 238 females (11.7%) in their respective age groups living below the poverty level.
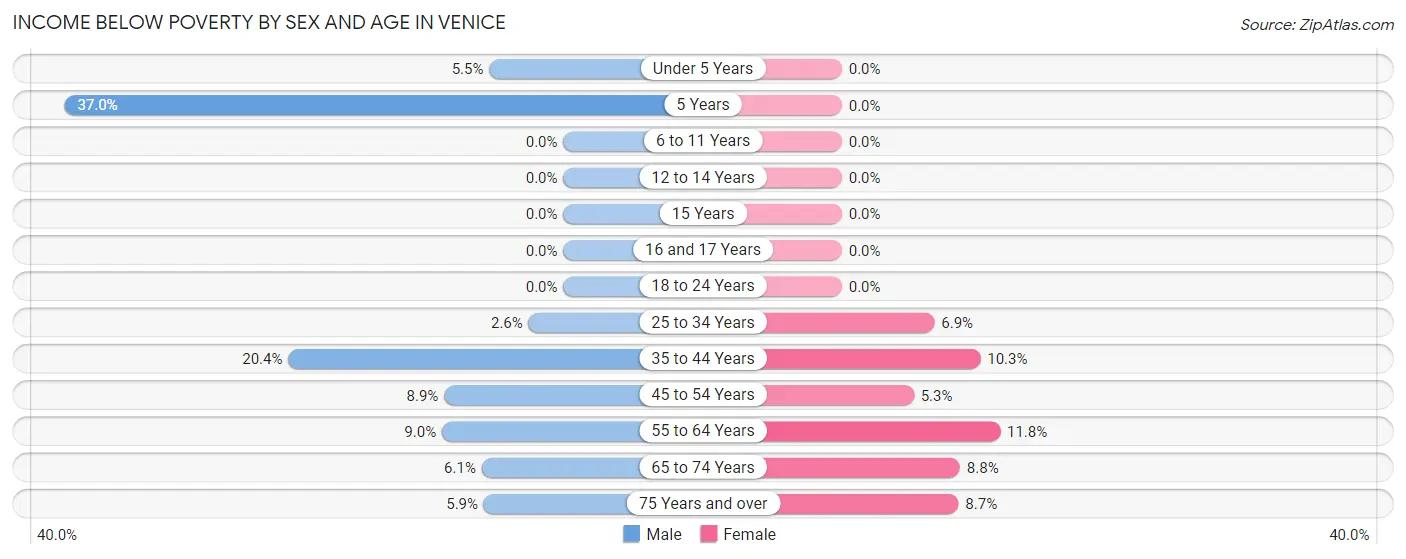
| Age Bracket | Male | Female |
| Under 5 Years | 11 (5.5%) | 0 (0.0%) |
| 5 Years | 10 (37.0%) | 0 (0.0%) |
| 6 to 11 Years | 0 (0.0%) | 0 (0.0%) |
| 12 to 14 Years | 0 (0.0%) | 0 (0.0%) |
| 15 Years | 0 (0.0%) | 0 (0.0%) |
| 16 and 17 Years | 0 (0.0%) | 0 (0.0%) |
| 18 to 24 Years | 0 (0.0%) | 0 (0.0%) |
| 25 to 34 Years | 14 (2.6%) | 36 (6.9%) |
| 35 to 44 Years | 97 (20.4%) | 56 (10.3%) |
| 45 to 54 Years | 73 (8.8%) | 49 (5.3%) |
| 55 to 64 Years | 160 (9.0%) | 238 (11.7%) |
| 65 to 74 Years | 175 (6.1%) | 396 (8.8%) |
| 75 Years and over | 216 (5.9%) | 352 (8.7%) |
| Total | 756 (6.7%) | 1,127 (8.2%) |
Income Above Poverty by Sex and Age in Venice
According to the poverty statistics in Venice, males aged 6 to 11 years and females aged under 5 years are the age groups that are most secure financially, with 100.0% of males and 100.0% of females in these age groups living above the poverty line.
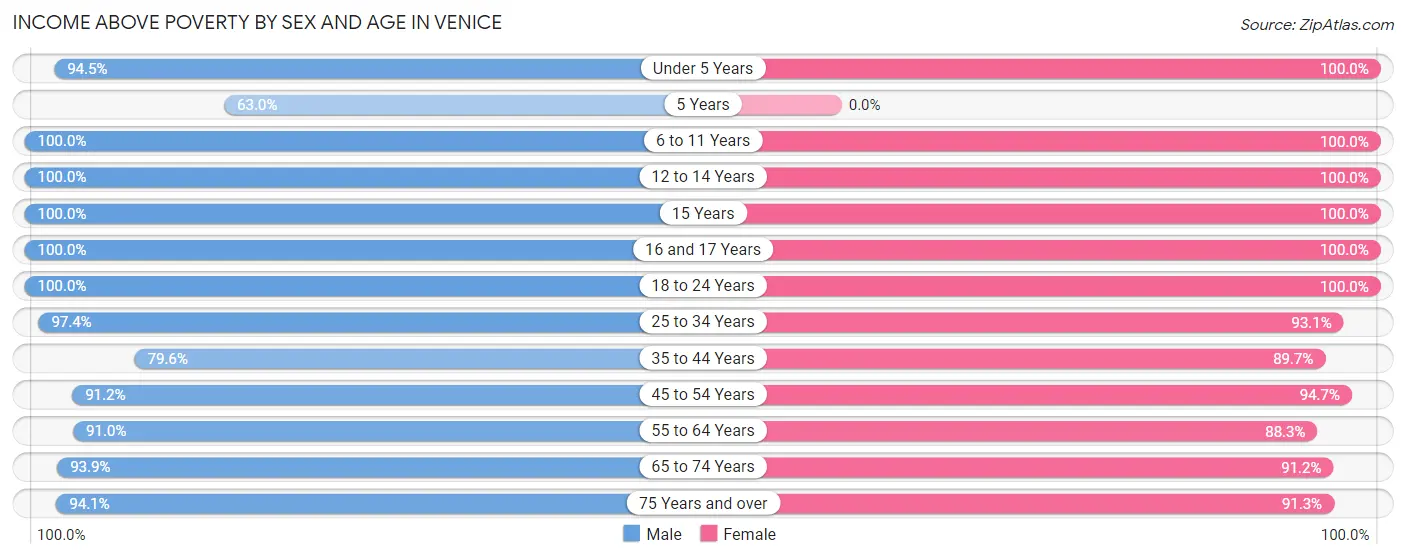
| Age Bracket | Male | Female |
| Under 5 Years | 189 (94.5%) | 149 (100.0%) |
| 5 Years | 17 (63.0%) | 0 (0.0%) |
| 6 to 11 Years | 165 (100.0%) | 258 (100.0%) |
| 12 to 14 Years | 119 (100.0%) | 143 (100.0%) |
| 15 Years | 26 (100.0%) | 48 (100.0%) |
| 16 and 17 Years | 90 (100.0%) | 153 (100.0%) |
| 18 to 24 Years | 463 (100.0%) | 381 (100.0%) |
| 25 to 34 Years | 528 (97.4%) | 488 (93.1%) |
| 35 to 44 Years | 378 (79.6%) | 489 (89.7%) |
| 45 to 54 Years | 752 (91.1%) | 868 (94.7%) |
| 55 to 64 Years | 1,615 (91.0%) | 1,787 (88.2%) |
| 65 to 74 Years | 2,713 (93.9%) | 4,117 (91.2%) |
| 75 Years and over | 3,448 (94.1%) | 3,713 (91.3%) |
| Total | 10,503 (93.3%) | 12,594 (91.8%) |
Income Below Poverty Among Married-Couple Families in Venice
The poverty statistics for married-couple families in Venice show that 4.0% or 263 of the total 6,570 families live below the poverty line. Families with no children have the highest poverty rate of 4.4%, comprising of 263 families. On the other hand, families with 1 or 2 children have the lowest poverty rate of 0.0%, which includes 0 families.
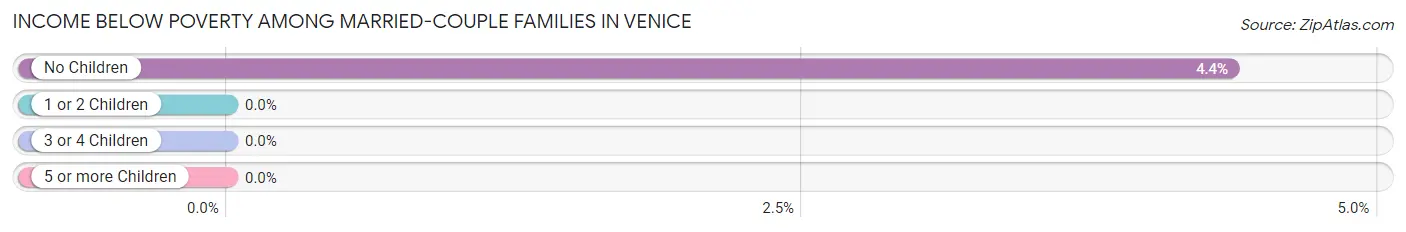
| Children | Above Poverty | Below Poverty |
| No Children | 5,766 (95.6%) | 263 (4.4%) |
| 1 or 2 Children | 525 (100.0%) | 0 (0.0%) |
| 3 or 4 Children | 16 (100.0%) | 0 (0.0%) |
| 5 or more Children | 0 (0.0%) | 0 (0.0%) |
| Total | 6,307 (96.0%) | 263 (4.0%) |
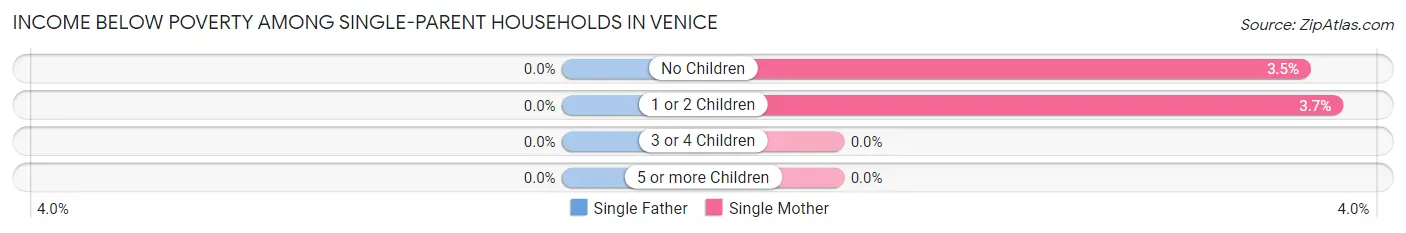
Income Below Poverty Among Single-Parent Households in Venice
| Children | Single Father | Single Mother |
| No Children | 0 (0.0%) | 10 (3.5%) |
| 1 or 2 Children | 0 (0.0%) | 9 (3.7%) |
| 3 or 4 Children | 0 (0.0%) | 0 (0.0%) |
| 5 or more Children | 0 (0.0%) | 0 (0.0%) |
| Total | 0 (0.0%) | 19 (3.6%) |
Income Below Poverty Among Married-Couple vs Single-Parent Households in Venice
The poverty data for Venice shows that 263 of the married-couple family households (4.0%) and 19 of the single-parent households (2.6%) are living below the poverty level. Within the married-couple family households, those with no children have the highest poverty rate, with 263 households (4.4%) falling below the poverty line. Among the single-parent households, those with no children have the highest poverty rate, with 10 household (2.7%) living below poverty.
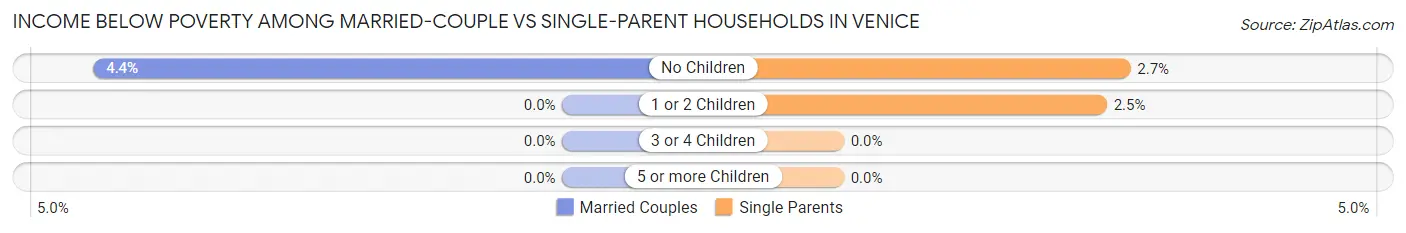
| Children | Married-Couple Families | Single-Parent Households |
| No Children | 263 (4.4%) | 10 (2.7%) |
| 1 or 2 Children | 0 (0.0%) | 9 (2.5%) |
| 3 or 4 Children | 0 (0.0%) | 0 (0.0%) |
| 5 or more Children | 0 (0.0%) | 0 (0.0%) |
| Total | 263 (4.0%) | 19 (2.6%) |
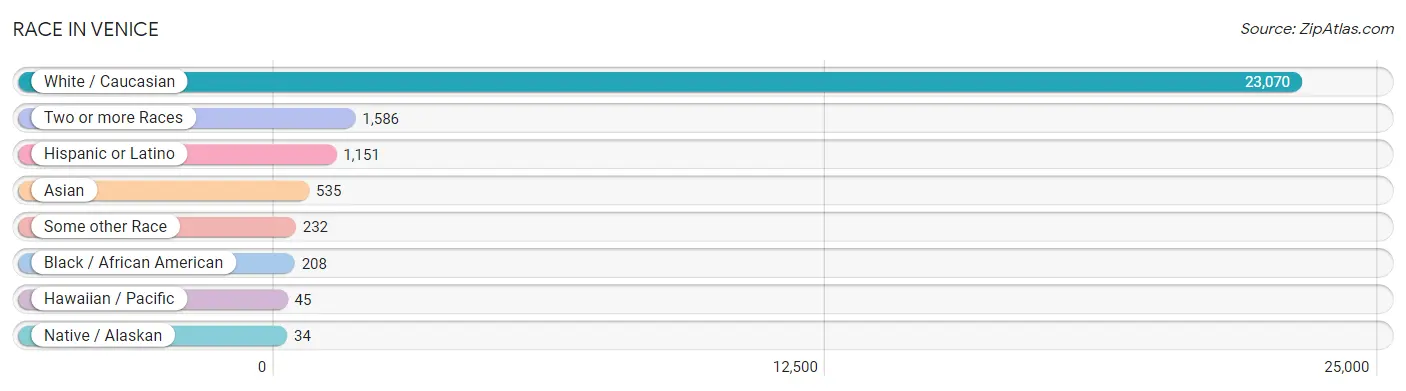
Race in Venice
The most populous races in Venice are White / Caucasian (23,070 | 89.7%), Two or more Races (1,586 | 6.2%), and Hispanic or Latino (1,151 | 4.5%).
| Race | # Population | % Population |
| Asian | 535 | 2.1% |
| Black / African American | 208 | 0.8% |
| Hawaiian / Pacific | 45 | 0.2% |
| Hispanic or Latino | 1,151 | 4.5% |
| Native / Alaskan | 34 | 0.1% |
| White / Caucasian | 23,070 | 89.7% |
| Two or more Races | 1,586 | 6.2% |
| Some other Race | 232 | 0.9% |
| Total | 25,710 | 100.0% |
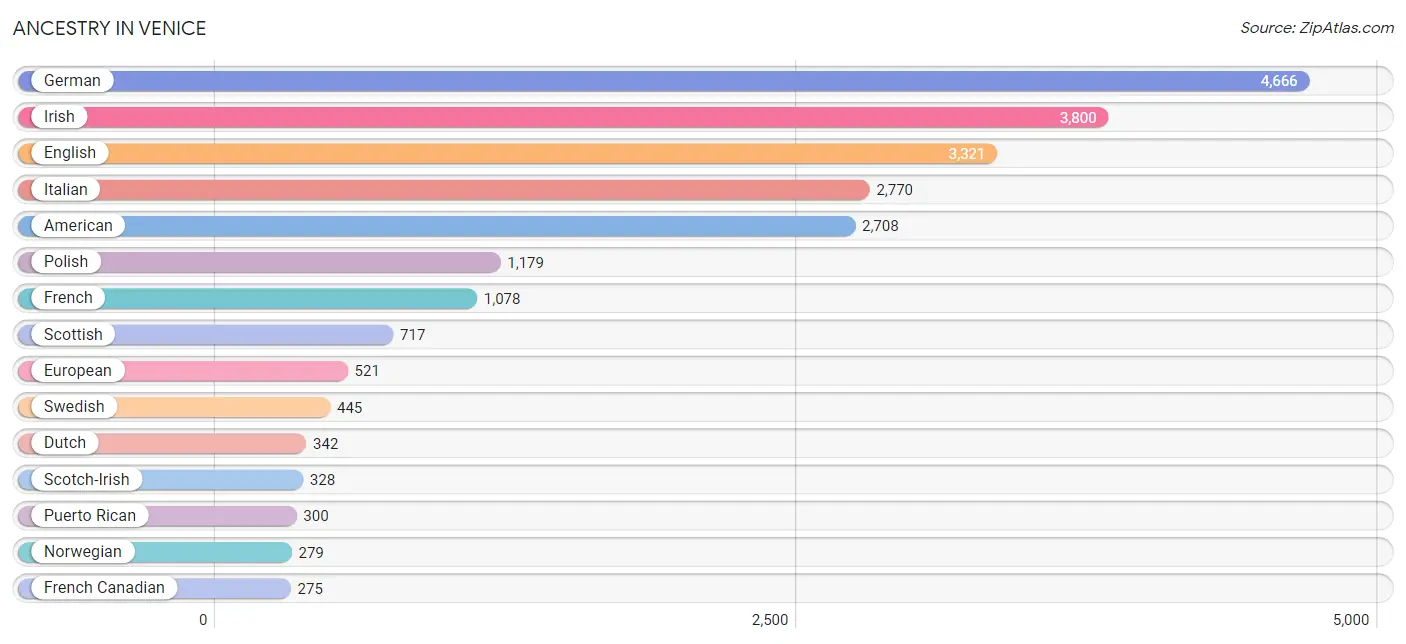
Ancestry in Venice
The most populous ancestries reported in Venice are German (4,666 | 18.1%), Irish (3,800 | 14.8%), English (3,321 | 12.9%), Italian (2,770 | 10.8%), and American (2,708 | 10.5%), together accounting for 67.1% of all Venice residents.
| Ancestry | # Population | % Population |
| African | 1 | 0.0% |
| Albanian | 18 | 0.1% |
| American | 2,708 | 10.5% |
| Arab | 86 | 0.3% |
| Armenian | 35 | 0.1% |
| Austrian | 96 | 0.4% |
| Belgian | 118 | 0.5% |
| Bhutanese | 34 | 0.1% |
| Blackfeet | 17 | 0.1% |
| Brazilian | 32 | 0.1% |
| British | 184 | 0.7% |
| Bulgarian | 25 | 0.1% |
| Burmese | 8 | 0.0% |
| Canadian | 208 | 0.8% |
| Carpatho Rusyn | 61 | 0.2% |
| Celtic | 26 | 0.1% |
| Central American | 132 | 0.5% |
| Cherokee | 59 | 0.2% |
| Chilean | 9 | 0.0% |
| Choctaw | 12 | 0.1% |
| Colombian | 30 | 0.1% |
| Croatian | 34 | 0.1% |
| Cuban | 264 | 1.0% |
| Czech | 182 | 0.7% |
| Czechoslovakian | 24 | 0.1% |
| Danish | 23 | 0.1% |
| Dominican | 9 | 0.0% |
| Dutch | 342 | 1.3% |
| Eastern European | 98 | 0.4% |
| English | 3,321 | 12.9% |
| Estonian | 24 | 0.1% |
| European | 521 | 2.0% |
| Finnish | 115 | 0.4% |
| French | 1,078 | 4.2% |
| French Canadian | 275 | 1.1% |
| German | 4,666 | 18.1% |
| Greek | 46 | 0.2% |
| Guamanian / Chamorro | 16 | 0.1% |
| Guatemalan | 12 | 0.1% |
| Haitian | 80 | 0.3% |
| Honduran | 12 | 0.1% |
| Hungarian | 246 | 1.0% |
| Indian (Asian) | 103 | 0.4% |
| Iranian | 126 | 0.5% |
| Irish | 3,800 | 14.8% |
| Iroquois | 4 | 0.0% |
| Italian | 2,770 | 10.8% |
| Korean | 273 | 1.1% |
| Laotian | 9 | 0.0% |
| Latvian | 60 | 0.2% |
| Lebanese | 55 | 0.2% |
| Lithuanian | 23 | 0.1% |
| Mexican | 212 | 0.8% |
| Mexican American Indian | 9 | 0.0% |
| Native Hawaiian | 29 | 0.1% |
| Nigerian | 38 | 0.2% |
| Northern European | 34 | 0.1% |
| Norwegian | 279 | 1.1% |
| Pakistani | 127 | 0.5% |
| Palestinian | 25 | 0.1% |
| Pennsylvania German | 7 | 0.0% |
| Polish | 1,179 | 4.6% |
| Portuguese | 65 | 0.3% |
| Potawatomi | 26 | 0.1% |
| Puerto Rican | 300 | 1.2% |
| Romanian | 114 | 0.4% |
| Russian | 186 | 0.7% |
| Salvadoran | 108 | 0.4% |
| Scandinavian | 19 | 0.1% |
| Scotch-Irish | 328 | 1.3% |
| Scottish | 717 | 2.8% |
| Serbian | 56 | 0.2% |
| Slovak | 168 | 0.6% |
| South African | 73 | 0.3% |
| South American | 39 | 0.2% |
| Spaniard | 141 | 0.5% |
| Spanish | 38 | 0.2% |
| Sri Lankan | 6 | 0.0% |
| Subsaharan African | 112 | 0.4% |
| Swedish | 445 | 1.7% |
| Swiss | 53 | 0.2% |
| Syrian | 6 | 0.0% |
| Thai | 117 | 0.5% |
| Ukrainian | 118 | 0.5% |
| Welsh | 84 | 0.3% | View All 85 Rows |
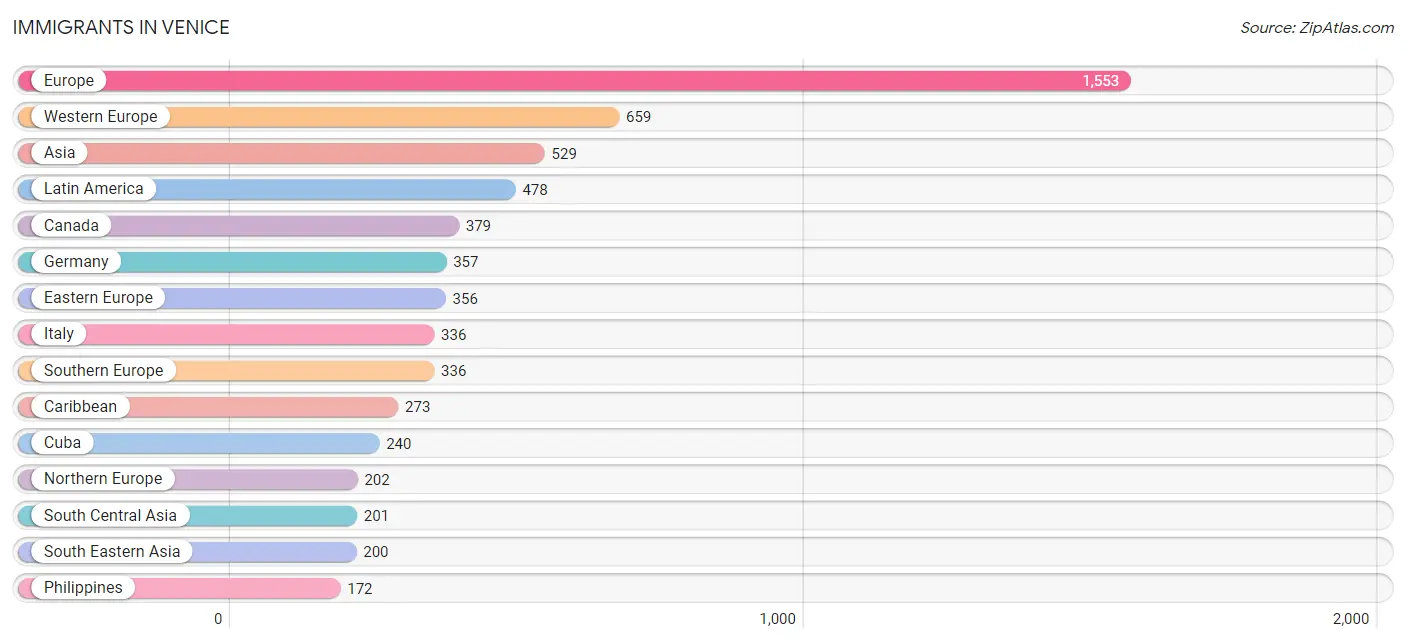
Immigrants in Venice
The most numerous immigrant groups reported in Venice came from Europe (1,553 | 6.0%), Western Europe (659 | 2.6%), Asia (529 | 2.1%), Latin America (478 | 1.9%), and Canada (379 | 1.5%), together accounting for 14.0% of all Venice residents.
| Immigration Origin | # Population | % Population |
| Africa | 79 | 0.3% |
| Asia | 529 | 2.1% |
| Austria | 105 | 0.4% |
| Belgium | 19 | 0.1% |
| Bosnia and Herzegovina | 34 | 0.1% |
| Brazil | 10 | 0.0% |
| Canada | 379 | 1.5% |
| Caribbean | 273 | 1.1% |
| Central America | 156 | 0.6% |
| Chile | 9 | 0.0% |
| China | 95 | 0.4% |
| Colombia | 30 | 0.1% |
| Cuba | 240 | 0.9% |
| Czechoslovakia | 38 | 0.2% |
| Eastern Asia | 103 | 0.4% |
| Eastern Europe | 356 | 1.4% |
| El Salvador | 88 | 0.3% |
| England | 79 | 0.3% |
| Europe | 1,553 | 6.0% |
| France | 79 | 0.3% |
| Germany | 357 | 1.4% |
| Guatemala | 12 | 0.1% |
| Haiti | 28 | 0.1% |
| Hong Kong | 14 | 0.1% |
| Hungary | 23 | 0.1% |
| India | 117 | 0.5% |
| Indonesia | 9 | 0.0% |
| Iran | 43 | 0.2% |
| Ireland | 11 | 0.0% |
| Israel | 25 | 0.1% |
| Italy | 336 | 1.3% |
| Korea | 8 | 0.0% |
| Latin America | 478 | 1.9% |
| Lithuania | 4 | 0.0% |
| Mexico | 56 | 0.2% |
| Moldova | 43 | 0.2% |
| Netherlands | 87 | 0.3% |
| Northern Europe | 202 | 0.8% |
| Norway | 13 | 0.1% |
| Pakistan | 41 | 0.2% |
| Philippines | 172 | 0.7% |
| Poland | 15 | 0.1% |
| Romania | 31 | 0.1% |
| Russia | 47 | 0.2% |
| Scotland | 9 | 0.0% |
| South Africa | 79 | 0.3% |
| South America | 49 | 0.2% |
| South Central Asia | 201 | 0.8% |
| South Eastern Asia | 200 | 0.8% |
| Southern Europe | 336 | 1.3% |
| Sweden | 14 | 0.1% |
| Switzerland | 12 | 0.1% |
| Taiwan | 13 | 0.1% |
| Thailand | 13 | 0.1% |
| Trinidad and Tobago | 5 | 0.0% |
| Ukraine | 97 | 0.4% |
| Vietnam | 6 | 0.0% |
| Western Asia | 25 | 0.1% |
| Western Europe | 659 | 2.6% | View All 59 Rows |
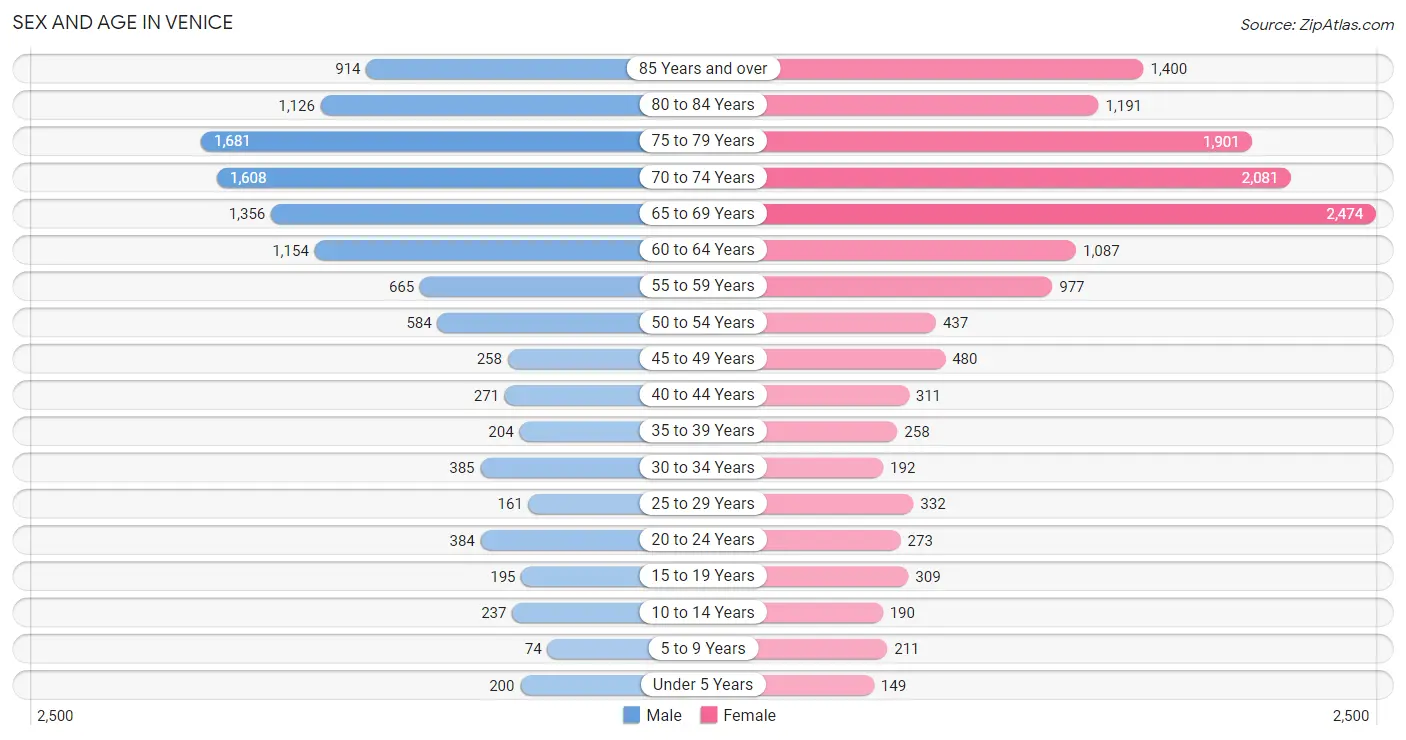
Sex and Age in Venice
Sex and Age in Venice
The most populous age groups in Venice are 75 to 79 Years (1,681 | 14.7%) for men and 65 to 69 Years (2,474 | 17.4%) for women.
| Age Bracket | Male | Female |
| Under 5 Years | 200 (1.8%) | 149 (1.1%) |
| 5 to 9 Years | 74 (0.6%) | 211 (1.5%) |
| 10 to 14 Years | 237 (2.1%) | 190 (1.3%) |
| 15 to 19 Years | 195 (1.7%) | 309 (2.2%) |
| 20 to 24 Years | 384 (3.4%) | 273 (1.9%) |
| 25 to 29 Years | 161 (1.4%) | 332 (2.3%) |
| 30 to 34 Years | 385 (3.4%) | 192 (1.3%) |
| 35 to 39 Years | 204 (1.8%) | 258 (1.8%) |
| 40 to 44 Years | 271 (2.4%) | 311 (2.2%) |
| 45 to 49 Years | 258 (2.2%) | 480 (3.4%) |
| 50 to 54 Years | 584 (5.1%) | 437 (3.1%) |
| 55 to 59 Years | 665 (5.8%) | 977 (6.9%) |
| 60 to 64 Years | 1,154 (10.1%) | 1,087 (7.6%) |
| 65 to 69 Years | 1,356 (11.8%) | 2,474 (17.4%) |
| 70 to 74 Years | 1,608 (14.0%) | 2,081 (14.6%) |
| 75 to 79 Years | 1,681 (14.7%) | 1,901 (13.3%) |
| 80 to 84 Years | 1,126 (9.8%) | 1,191 (8.4%) |
| 85 Years and over | 914 (8.0%) | 1,400 (9.8%) |
| Total | 11,457 (100.0%) | 14,253 (100.0%) |
Families and Households in Venice
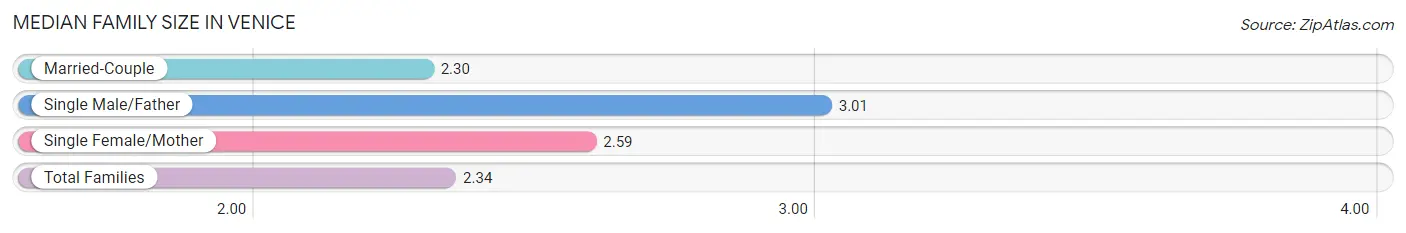
Median Family Size in Venice
The median family size in Venice is 2.34 persons per family, with single male/father families (213 | 2.9%) accounting for the largest median family size of 3.01 persons per family. On the other hand, married-couple families (6,570 | 89.8%) represent the smallest median family size with 2.30 persons per family.
| Family Type | # Families | Family Size |
| Married-Couple | 6,570 (89.8%) | 2.30 |
| Single Male/Father | 213 (2.9%) | 3.01 |
| Single Female/Mother | 529 (7.2%) | 2.59 |
| Total Families | 7,312 (100.0%) | 2.34 |
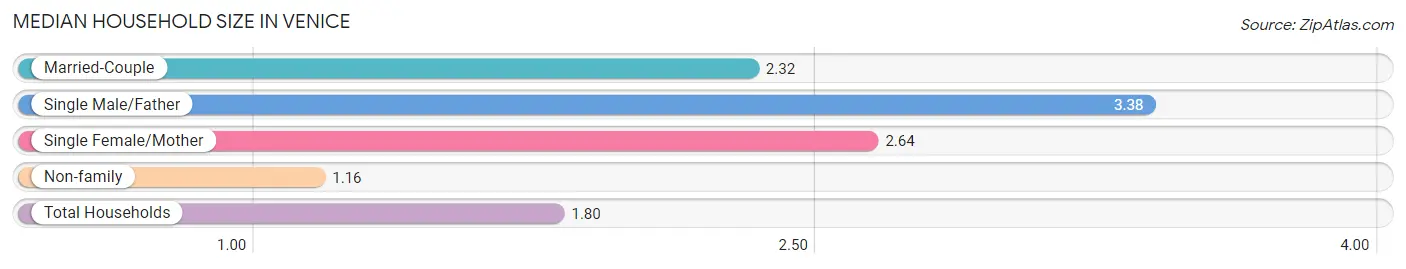
Median Household Size in Venice
The median household size in Venice is 1.80 persons per household, with single male/father households (213 | 1.5%) accounting for the largest median household size of 3.38 persons per household. non-family households (6,528 | 47.2%) represent the smallest median household size with 1.16 persons per household.
| Household Type | # Households | Household Size |
| Married-Couple | 6,570 (47.5%) | 2.32 |
| Single Male/Father | 213 (1.5%) | 3.38 |
| Single Female/Mother | 529 (3.8%) | 2.64 |
| Non-family | 6,528 (47.2%) | 1.16 |
| Total Households | 13,840 (100.0%) | 1.80 |
Household Size by Marriage Status in Venice
Out of a total of 13,840 households in Venice, 7,312 (52.8%) are family households, while 6,528 (47.2%) are nonfamily households. The most numerous type of family households are 2-person households, comprising 5,953, and the most common type of nonfamily households are 1-person households, comprising 5,469.
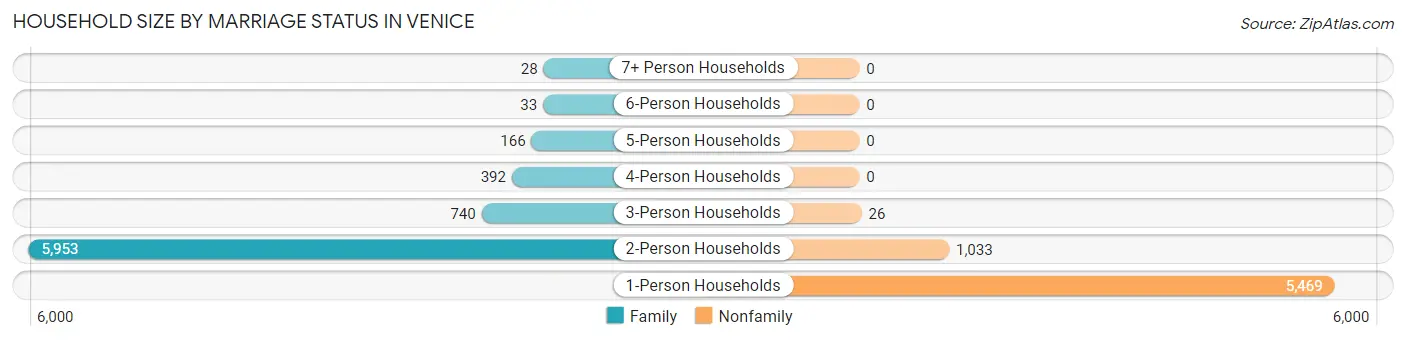
| Household Size | Family Households | Nonfamily Households |
| 1-Person Households | - | 5,469 (39.5%) |
| 2-Person Households | 5,953 (43.0%) | 1,033 (7.5%) |
| 3-Person Households | 740 (5.3%) | 26 (0.2%) |
| 4-Person Households | 392 (2.8%) | 0 (0.0%) |
| 5-Person Households | 166 (1.2%) | 0 (0.0%) |
| 6-Person Households | 33 (0.2%) | 0 (0.0%) |
| 7+ Person Households | 28 (0.2%) | 0 (0.0%) |
| Total | 7,312 (52.8%) | 6,528 (47.2%) |
Female Fertility in Venice
Fertility by Age in Venice
Average fertility rate in Venice is 35.0 births per 1,000 women. Women in the age bracket of 20 to 34 years have the highest fertility rate with 60.0 births per 1,000 women. Women in the age bracket of 20 to 34 years acount for 63.2% of all women with births.
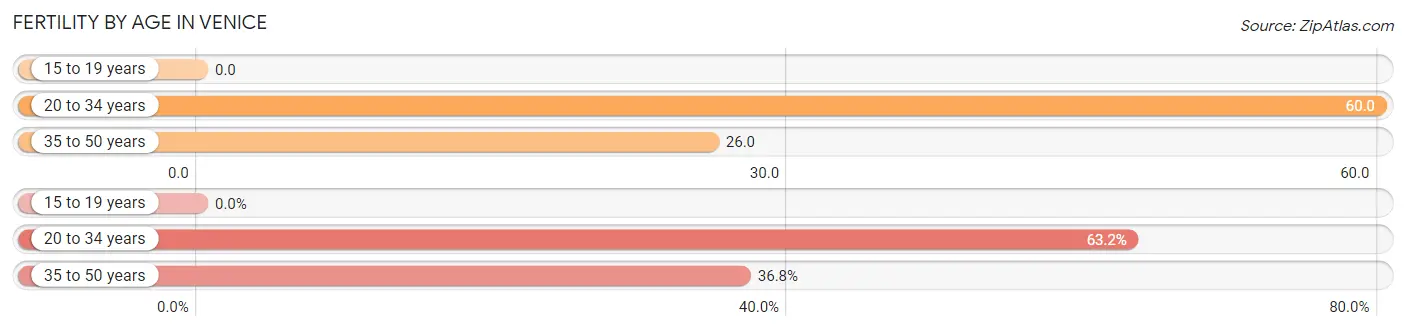
| Age Bracket | Women with Births | Births / 1,000 Women |
| 15 to 19 years | 0 (0.0%) | 0.0 |
| 20 to 34 years | 48 (63.2%) | 60.0 |
| 35 to 50 years | 28 (36.8%) | 26.0 |
| Total | 76 (100.0%) | 35.0 |
Fertility by Age by Marriage Status in Venice
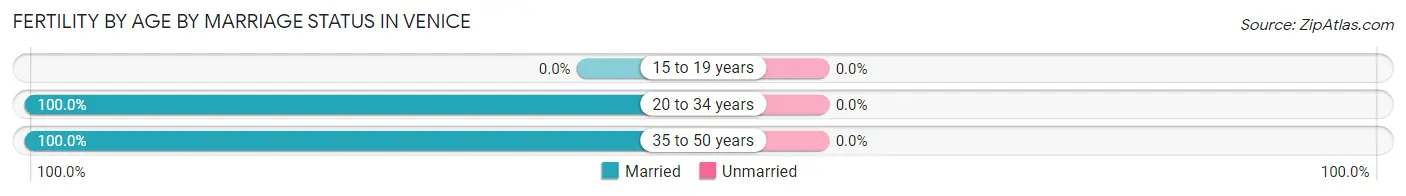
| Age Bracket | Married | Unmarried |
| 15 to 19 years | 0 (0.0%) | 0 (0.0%) |
| 20 to 34 years | 48 (100.0%) | 0 (0.0%) |
| 35 to 50 years | 28 (100.0%) | 0 (0.0%) |
| Total | 76 (100.0%) | 0 (0.0%) |
Fertility by Education in Venice
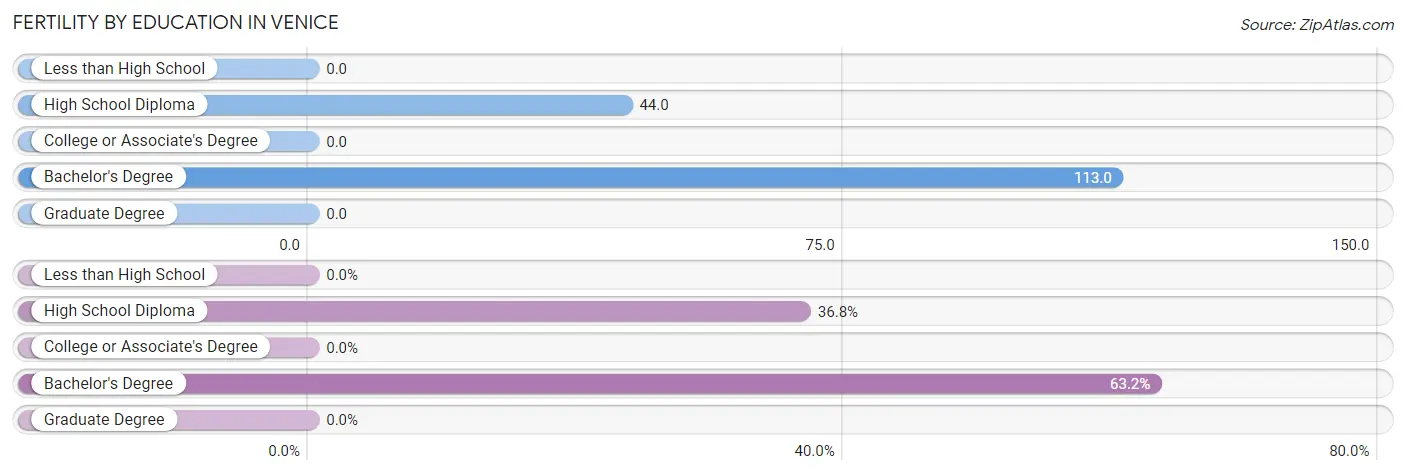
| Educational Attainment | Women with Births | Births / 1,000 Women |
| Less than High School | 0 (0.0%) | 0.0 |
| High School Diploma | 28 (36.8%) | 44.0 |
| College or Associate's Degree | 0 (0.0%) | 0.0 |
| Bachelor's Degree | 48 (63.2%) | 113.0 |
| Graduate Degree | 0 (0.0%) | 0.0 |
| Total | 76 (100.0%) | 35.0 |
Fertility by Education by Marriage Status in Venice
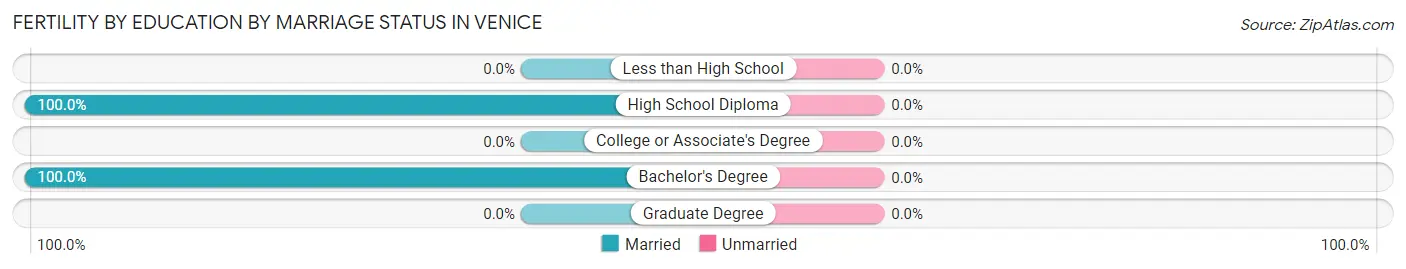
| Educational Attainment | Married | Unmarried |
| Less than High School | 0 (0.0%) | 0 (0.0%) |
| High School Diploma | 28 (100.0%) | 0 (0.0%) |
| College or Associate's Degree | 0 (0.0%) | 0 (0.0%) |
| Bachelor's Degree | 48 (100.0%) | 0 (0.0%) |
| Graduate Degree | 0 (0.0%) | 0 (0.0%) |
| Total | 76 (100.0%) | 0 (0.0%) |
Employment Characteristics in Venice
Employment by Class of Employer in Venice
Among the 7,110 employed individuals in Venice, private company employees (4,545 | 63.9%), self-employed (incorporated) (945 | 13.3%), and not-for-profit organizations (811 | 11.4%) make up the most common classes of employment.
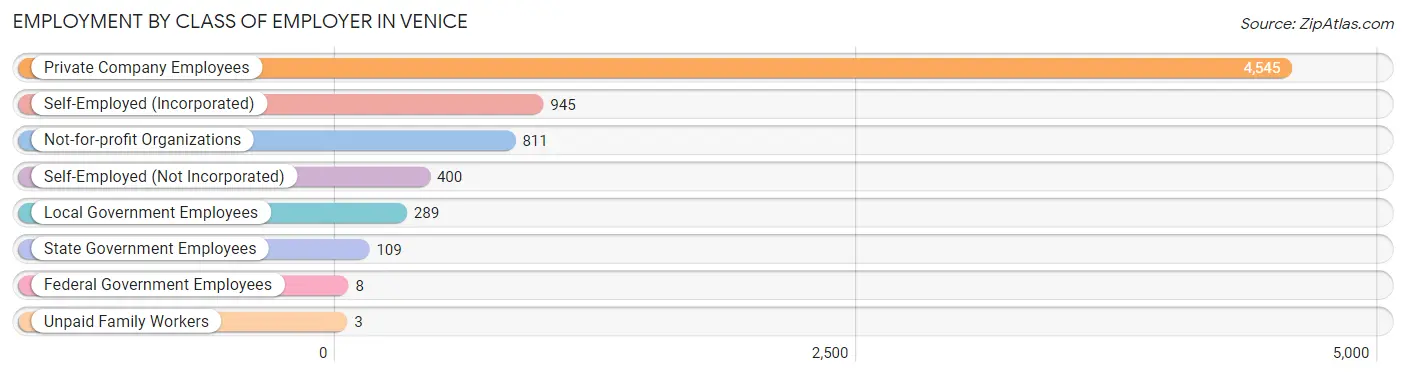
| Employer Class | # Employees | % Employees |
| Private Company Employees | 4,545 | 63.9% |
| Self-Employed (Incorporated) | 945 | 13.3% |
| Self-Employed (Not Incorporated) | 400 | 5.6% |
| Not-for-profit Organizations | 811 | 11.4% |
| Local Government Employees | 289 | 4.1% |
| State Government Employees | 109 | 1.5% |
| Federal Government Employees | 8 | 0.1% |
| Unpaid Family Workers | 3 | 0.0% |
| Total | 7,110 | 100.0% |
Employment Status by Age in Venice
According to the labor force statistics for Venice, out of the total population over 16 years of age (24,575), 30.7% or 7,545 individuals are in the labor force, with 4.0% or 302 of them unemployed. The age group with the highest labor force participation rate is 30 to 34 years, with 94.1% or 543 individuals in the labor force. Within the labor force, the 45 to 54 years age range has the highest percentage of unemployed individuals, with 5.9% or 79 of them being unemployed.
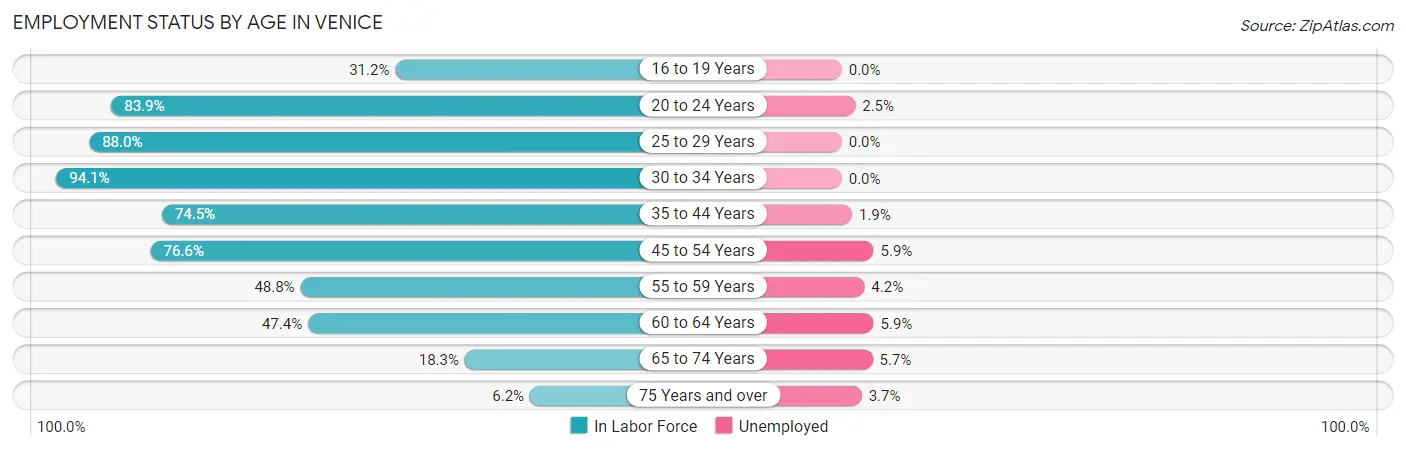
| Age Bracket | In Labor Force | Unemployed |
| 16 to 19 Years | 134 (31.2%) | 0 (0.0%) |
| 20 to 24 Years | 551 (83.9%) | 14 (2.5%) |
| 25 to 29 Years | 434 (88.0%) | 0 (0.0%) |
| 30 to 34 Years | 543 (94.1%) | 0 (0.0%) |
| 35 to 44 Years | 778 (74.5%) | 15 (1.9%) |
| 45 to 54 Years | 1,347 (76.6%) | 79 (5.9%) |
| 55 to 59 Years | 801 (48.8%) | 34 (4.2%) |
| 60 to 64 Years | 1,062 (47.4%) | 63 (5.9%) |
| 65 to 74 Years | 1,376 (18.3%) | 78 (5.7%) |
| 75 Years and over | 509 (6.2%) | 19 (3.7%) |
| Total | 7,545 (30.7%) | 302 (4.0%) |
Employment Status by Educational Attainment in Venice
According to labor force statistics for Venice, 64.0% of individuals (4,964) out of the total population between 25 and 64 years of age (7,756) are in the labor force, with 3.8% or 189 of them being unemployed. The group with the highest labor force participation rate are those with the educational attainment of bachelor's degree or higher, with 68.3% or 1,989 individuals in the labor force. Within the labor force, individuals with college / associate degree education have the highest percentage of unemployment, with 7.7% or 123 of them being unemployed.
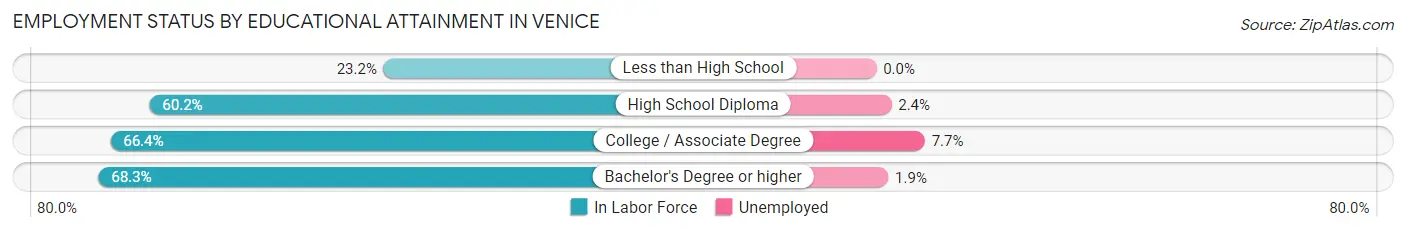
| Educational Attainment | In Labor Force | Unemployed |
| Less than High School | 54 (23.2%) | 0 (0.0%) |
| High School Diploma | 1,333 (60.2%) | 53 (2.4%) |
| College / Associate Degree | 1,592 (66.4%) | 185 (7.7%) |
| Bachelor's Degree or higher | 1,989 (68.3%) | 55 (1.9%) |
| Total | 4,964 (64.0%) | 295 (3.8%) |
Employment Occupations by Sex in Venice
Management, Business, Science and Arts Occupations
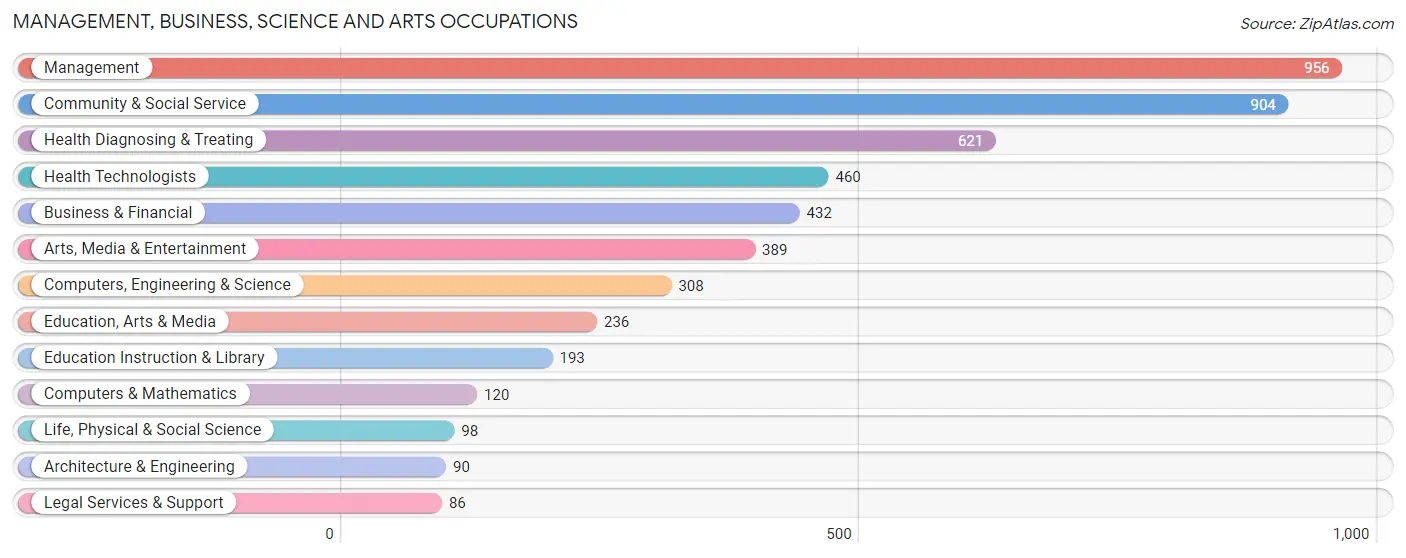
The most common Management, Business, Science and Arts occupations in Venice are Management (956 | 13.2%), Community & Social Service (904 | 12.5%), Health Diagnosing & Treating (621 | 8.6%), Health Technologists (460 | 6.4%), and Business & Financial (432 | 6.0%).
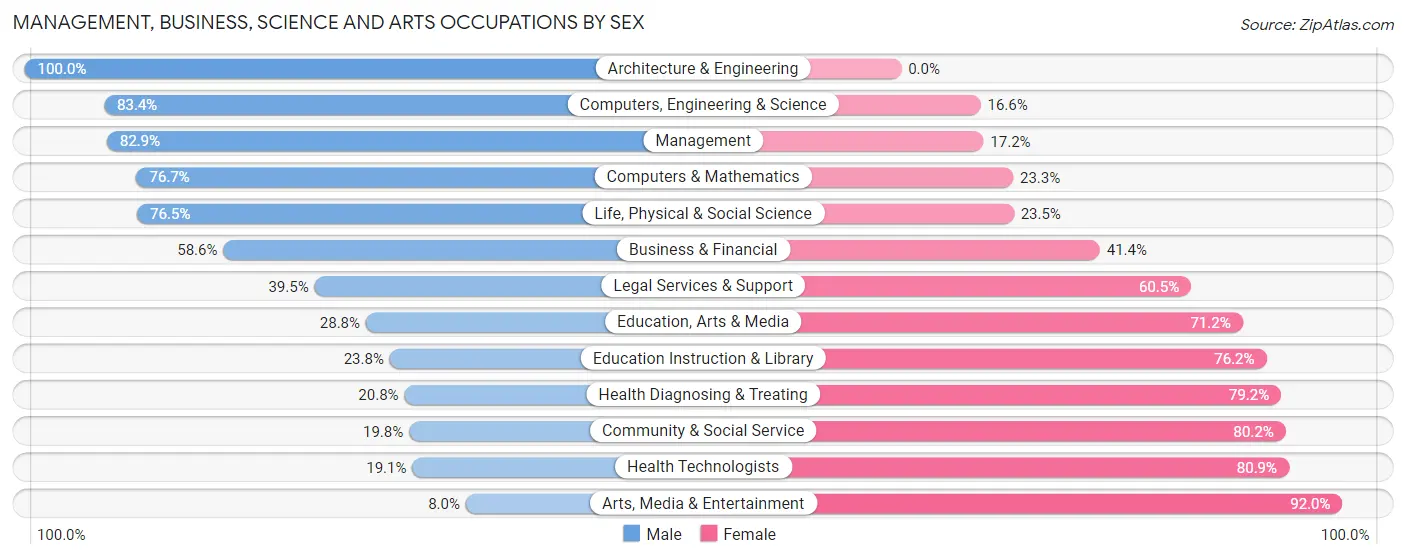
Management, Business, Science and Arts Occupations by Sex
Within the Management, Business, Science and Arts occupations in Venice, the most male-oriented occupations are Architecture & Engineering (100.0%), Computers, Engineering & Science (83.4%), and Management (82.9%), while the most female-oriented occupations are Arts, Media & Entertainment (92.0%), Health Technologists (80.9%), and Community & Social Service (80.2%).
| Occupation | Male | Female |
| Management | 792 (82.9%) | 164 (17.2%) |
| Business & Financial | 253 (58.6%) | 179 (41.4%) |
| Computers, Engineering & Science | 257 (83.4%) | 51 (16.6%) |
| Computers & Mathematics | 92 (76.7%) | 28 (23.3%) |
| Architecture & Engineering | 90 (100.0%) | 0 (0.0%) |
| Life, Physical & Social Science | 75 (76.5%) | 23 (23.5%) |
| Community & Social Service | 179 (19.8%) | 725 (80.2%) |
| Education, Arts & Media | 68 (28.8%) | 168 (71.2%) |
| Legal Services & Support | 34 (39.5%) | 52 (60.5%) |
| Education Instruction & Library | 46 (23.8%) | 147 (76.2%) |
| Arts, Media & Entertainment | 31 (8.0%) | 358 (92.0%) |
| Health Diagnosing & Treating | 129 (20.8%) | 492 (79.2%) |
| Health Technologists | 88 (19.1%) | 372 (80.9%) |
| Total (Category) | 1,610 (50.0%) | 1,611 (50.0%) |
| Total (Overall) | 3,591 (49.6%) | 3,651 (50.4%) |
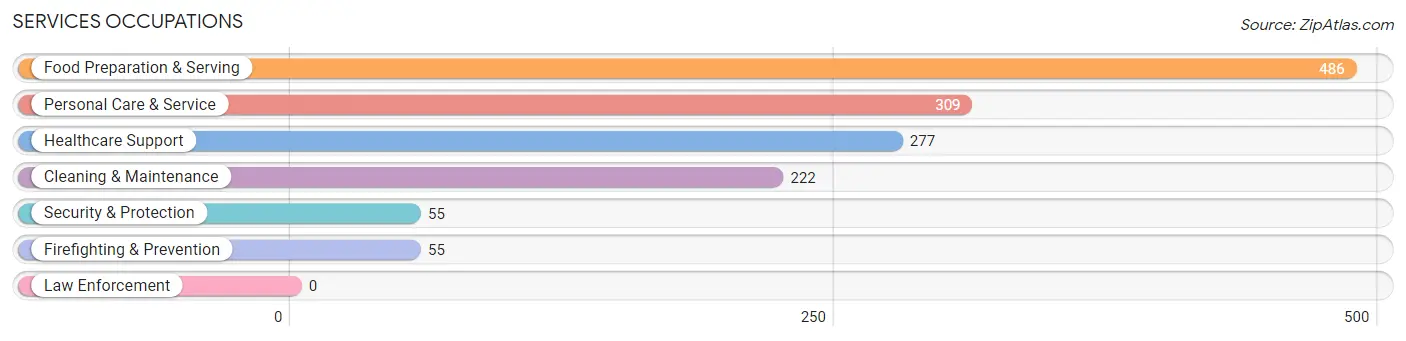
Services Occupations
The most common Services occupations in Venice are Food Preparation & Serving (486 | 6.7%), Personal Care & Service (309 | 4.3%), Healthcare Support (277 | 3.8%), Cleaning & Maintenance (222 | 3.1%), and Security & Protection (55 | 0.8%).
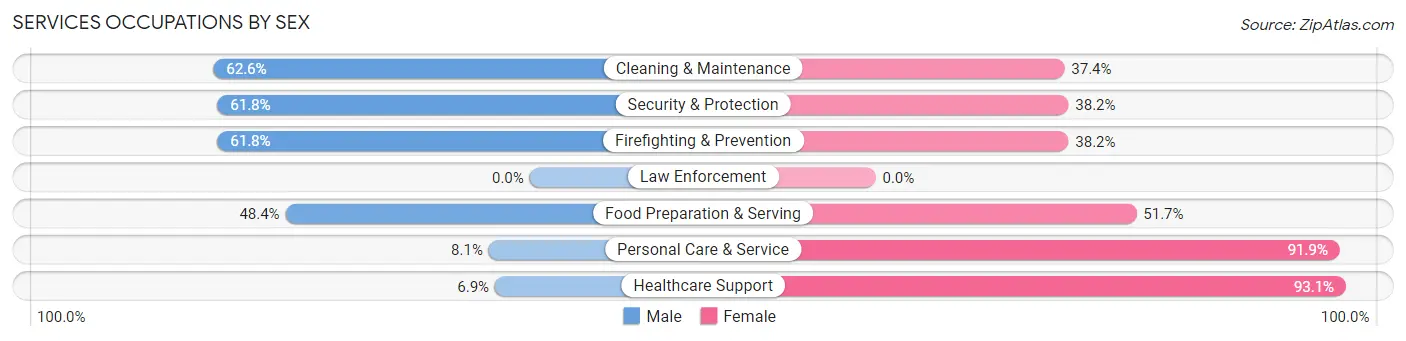
Services Occupations by Sex
Within the Services occupations in Venice, the most male-oriented occupations are Cleaning & Maintenance (62.6%), Security & Protection (61.8%), and Firefighting & Prevention (61.8%), while the most female-oriented occupations are Healthcare Support (93.1%), Personal Care & Service (91.9%), and Food Preparation & Serving (51.6%).
| Occupation | Male | Female |
| Healthcare Support | 19 (6.9%) | 258 (93.1%) |
| Security & Protection | 34 (61.8%) | 21 (38.2%) |
| Firefighting & Prevention | 34 (61.8%) | 21 (38.2%) |
| Law Enforcement | 0 (0.0%) | 0 (0.0%) |
| Food Preparation & Serving | 235 (48.3%) | 251 (51.6%) |
| Cleaning & Maintenance | 139 (62.6%) | 83 (37.4%) |
| Personal Care & Service | 25 (8.1%) | 284 (91.9%) |
| Total (Category) | 452 (33.5%) | 897 (66.5%) |
| Total (Overall) | 3,591 (49.6%) | 3,651 (50.4%) |
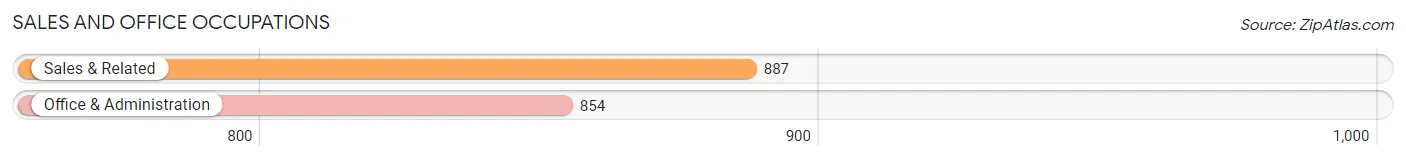
Sales and Office Occupations
The most common Sales and Office occupations in Venice are Sales & Related (887 | 12.2%), and Office & Administration (854 | 11.8%).
Sales and Office Occupations by Sex
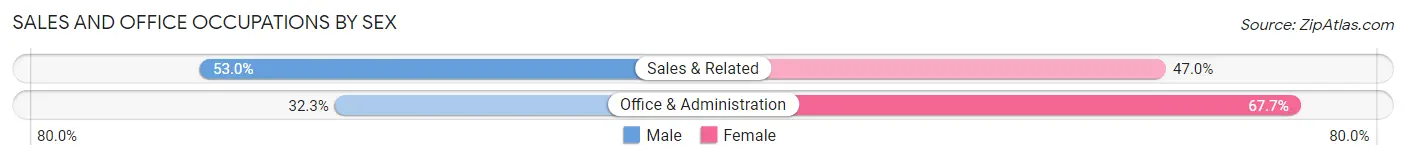
| Occupation | Male | Female |
| Sales & Related | 470 (53.0%) | 417 (47.0%) |
| Office & Administration | 276 (32.3%) | 578 (67.7%) |
| Total (Category) | 746 (42.8%) | 995 (57.2%) |
| Total (Overall) | 3,591 (49.6%) | 3,651 (50.4%) |
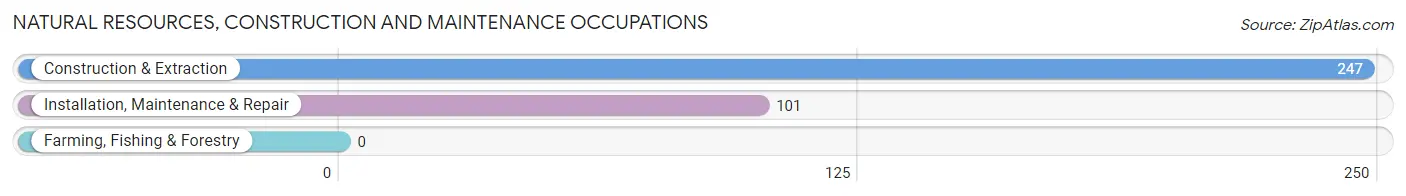
Natural Resources, Construction and Maintenance Occupations
The most common Natural Resources, Construction and Maintenance occupations in Venice are Construction & Extraction (247 | 3.4%), and Installation, Maintenance & Repair (101 | 1.4%).
Natural Resources, Construction and Maintenance Occupations by Sex
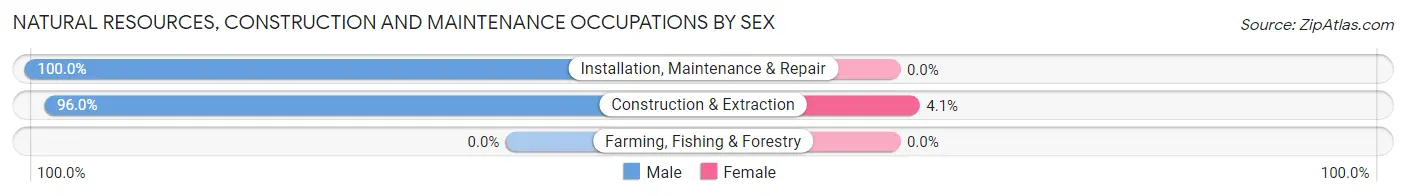
| Occupation | Male | Female |
| Farming, Fishing & Forestry | 0 (0.0%) | 0 (0.0%) |
| Construction & Extraction | 237 (96.0%) | 10 (4.1%) |
| Installation, Maintenance & Repair | 101 (100.0%) | 0 (0.0%) |
| Total (Category) | 338 (97.1%) | 10 (2.9%) |
| Total (Overall) | 3,591 (49.6%) | 3,651 (50.4%) |
Production, Transportation and Moving Occupations
The most common Production, Transportation and Moving occupations in Venice are Production (280 | 3.9%), Material Moving (191 | 2.6%), and Transportation (112 | 1.5%).
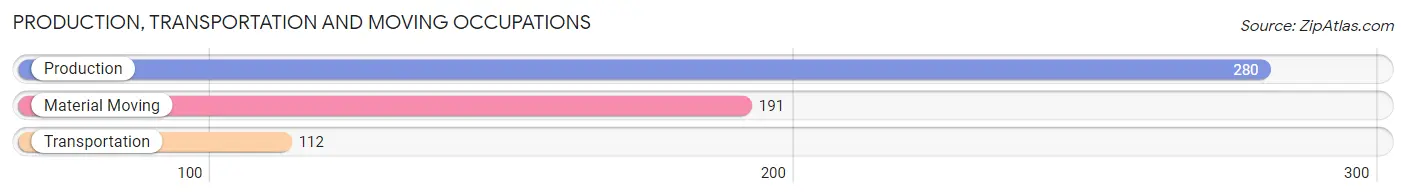
Production, Transportation and Moving Occupations by Sex
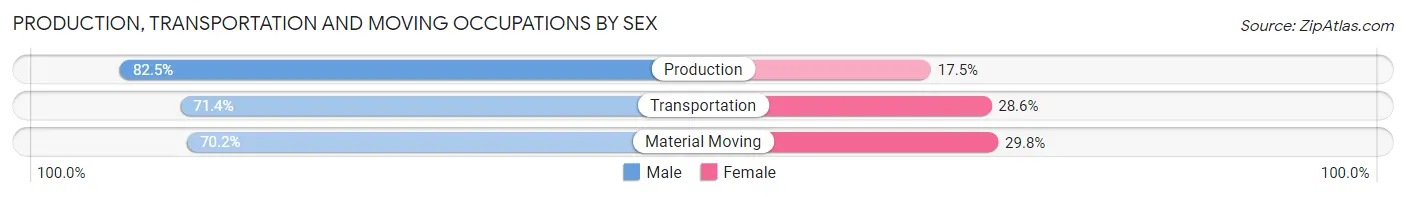
| Occupation | Male | Female |
| Production | 231 (82.5%) | 49 (17.5%) |
| Transportation | 80 (71.4%) | 32 (28.6%) |
| Material Moving | 134 (70.2%) | 57 (29.8%) |
| Total (Category) | 445 (76.3%) | 138 (23.7%) |
| Total (Overall) | 3,591 (49.6%) | 3,651 (50.4%) |
Employment Industries by Sex in Venice
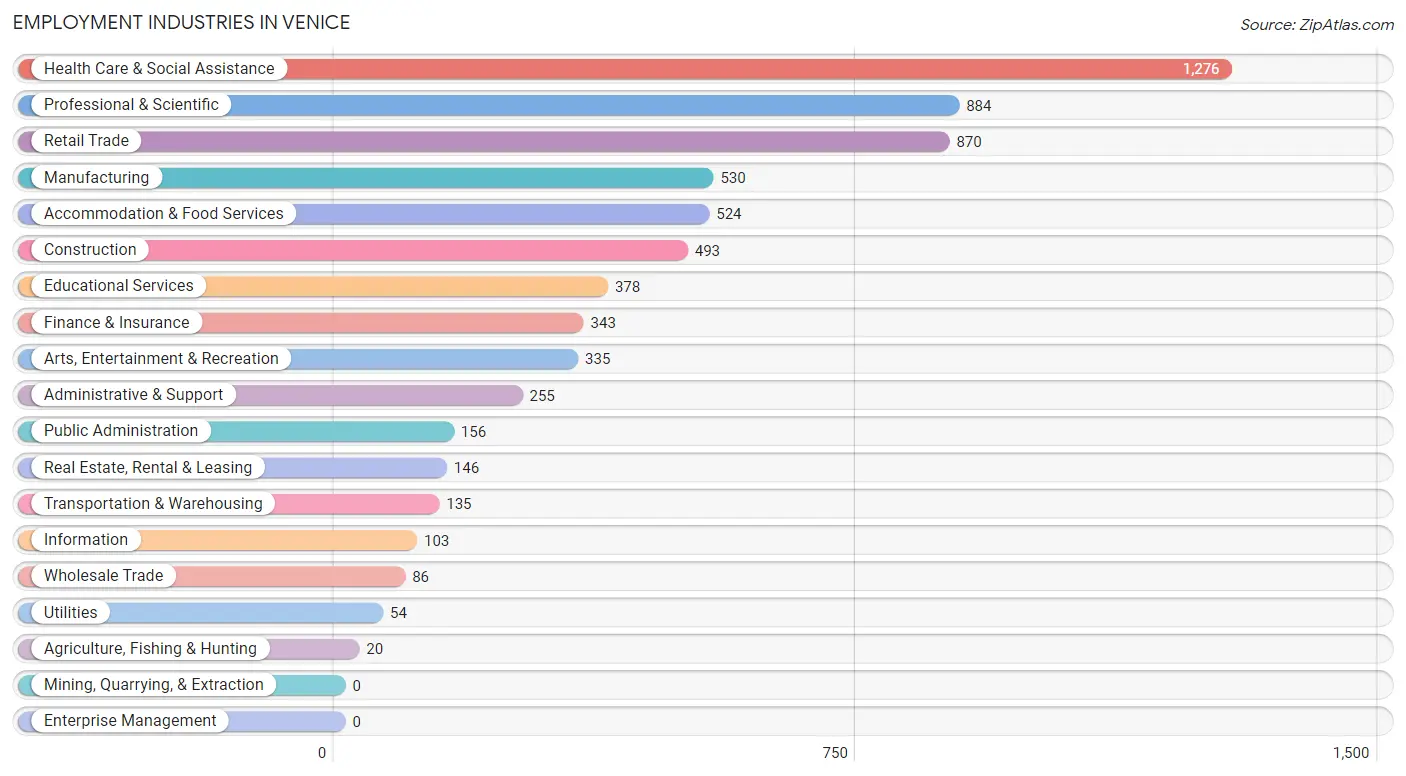
Employment Industries in Venice
The major employment industries in Venice include Health Care & Social Assistance (1,276 | 17.6%), Professional & Scientific (884 | 12.2%), Retail Trade (870 | 12.0%), Manufacturing (530 | 7.3%), and Accommodation & Food Services (524 | 7.2%).
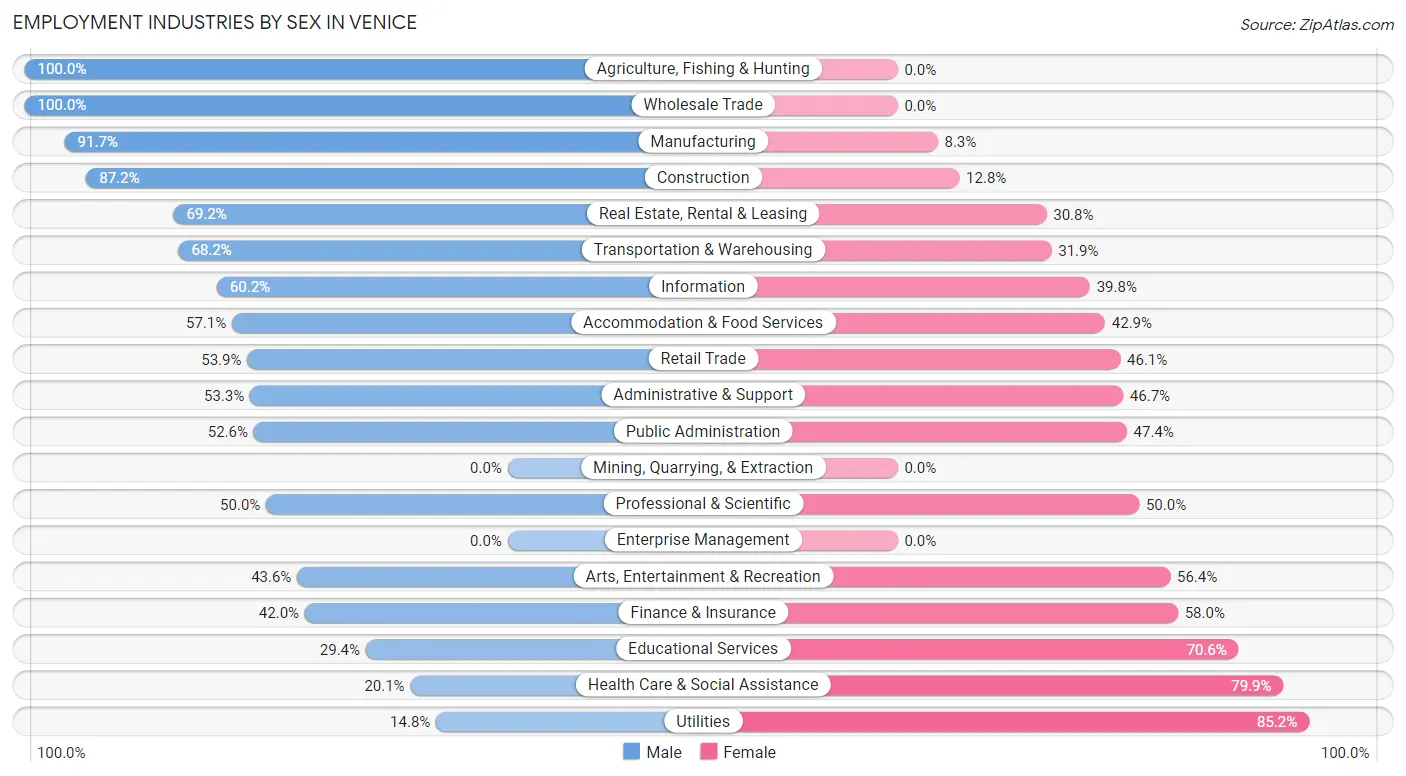
Employment Industries by Sex in Venice
The Venice industries that see more men than women are Agriculture, Fishing & Hunting (100.0%), Wholesale Trade (100.0%), and Manufacturing (91.7%), whereas the industries that tend to have a higher number of women are Utilities (85.2%), Health Care & Social Assistance (79.9%), and Educational Services (70.6%).
| Industry | Male | Female |
| Agriculture, Fishing & Hunting | 20 (100.0%) | 0 (0.0%) |
| Mining, Quarrying, & Extraction | 0 (0.0%) | 0 (0.0%) |
| Construction | 430 (87.2%) | 63 (12.8%) |
| Manufacturing | 486 (91.7%) | 44 (8.3%) |
| Wholesale Trade | 86 (100.0%) | 0 (0.0%) |
| Retail Trade | 469 (53.9%) | 401 (46.1%) |
| Transportation & Warehousing | 92 (68.1%) | 43 (31.9%) |
| Utilities | 8 (14.8%) | 46 (85.2%) |
| Information | 62 (60.2%) | 41 (39.8%) |
| Finance & Insurance | 144 (42.0%) | 199 (58.0%) |
| Real Estate, Rental & Leasing | 101 (69.2%) | 45 (30.8%) |
| Professional & Scientific | 442 (50.0%) | 442 (50.0%) |
| Enterprise Management | 0 (0.0%) | 0 (0.0%) |
| Administrative & Support | 136 (53.3%) | 119 (46.7%) |
| Educational Services | 111 (29.4%) | 267 (70.6%) |
| Health Care & Social Assistance | 257 (20.1%) | 1,019 (79.9%) |
| Arts, Entertainment & Recreation | 146 (43.6%) | 189 (56.4%) |
| Accommodation & Food Services | 299 (57.1%) | 225 (42.9%) |
| Public Administration | 82 (52.6%) | 74 (47.4%) |
| Total | 3,591 (49.6%) | 3,651 (50.4%) |
Education in Venice
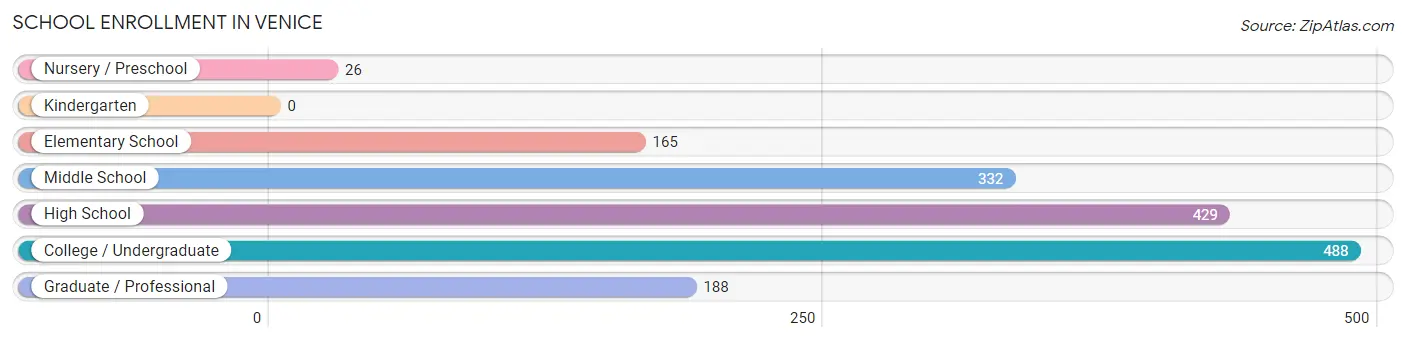
School Enrollment in Venice
The most common levels of schooling among the 1,628 students in Venice are college / undergraduate (488 | 30.0%), high school (429 | 26.4%), and middle school (332 | 20.4%).
| School Level | # Students | % Students |
| Nursery / Preschool | 26 | 1.6% |
| Kindergarten | 0 | 0.0% |
| Elementary School | 165 | 10.1% |
| Middle School | 332 | 20.4% |
| High School | 429 | 26.4% |
| College / Undergraduate | 488 | 30.0% |
| Graduate / Professional | 188 | 11.6% |
| Total | 1,628 | 100.0% |
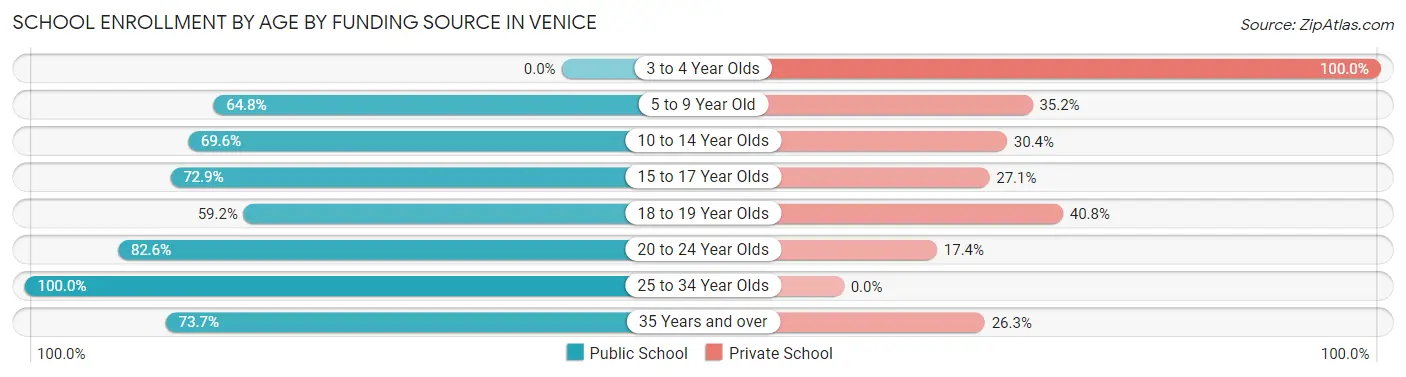
School Enrollment by Age by Funding Source in Venice
Out of a total of 1,628 students who are enrolled in schools in Venice, 431 (26.5%) attend a private institution, while the remaining 1,197 (73.5%) are enrolled in public schools. The age group of 3 to 4 year olds has the highest likelihood of being enrolled in private schools, with 9 (100.0% in the age bracket) enrolled. Conversely, the age group of 25 to 34 year olds has the lowest likelihood of being enrolled in a private school, with 123 (100.0% in the age bracket) attending a public institution.
| Age Bracket | Public School | Private School |
| 3 to 4 Year Olds | 0 (0.0%) | 9 (100.0%) |
| 5 to 9 Year Old | 118 (64.8%) | 64 (35.2%) |
| 10 to 14 Year Olds | 293 (69.6%) | 128 (30.4%) |
| 15 to 17 Year Olds | 231 (72.9%) | 86 (27.1%) |
| 18 to 19 Year Olds | 58 (59.2%) | 40 (40.8%) |
| 20 to 24 Year Olds | 200 (82.6%) | 42 (17.4%) |
| 25 to 34 Year Olds | 123 (100.0%) | 0 (0.0%) |
| 35 Years and over | 174 (73.7%) | 62 (26.3%) |
| Total | 1,197 (73.5%) | 431 (26.5%) |
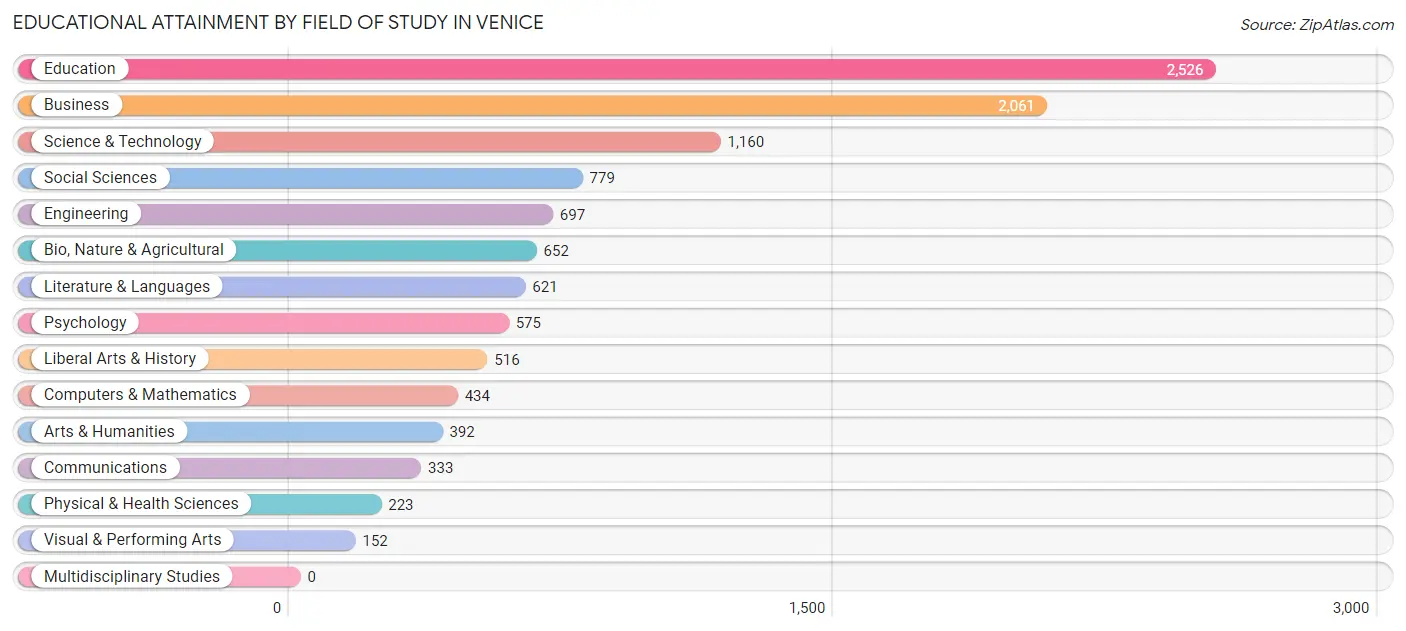
Educational Attainment by Field of Study in Venice
Education (2,526 | 22.7%), business (2,061 | 18.5%), science & technology (1,160 | 10.4%), social sciences (779 | 7.0%), and engineering (697 | 6.3%) are the most common fields of study among 11,121 individuals in Venice who have obtained a bachelor's degree or higher.
| Field of Study | # Graduates | % Graduates |
| Computers & Mathematics | 434 | 3.9% |
| Bio, Nature & Agricultural | 652 | 5.9% |
| Physical & Health Sciences | 223 | 2.0% |
| Psychology | 575 | 5.2% |
| Social Sciences | 779 | 7.0% |
| Engineering | 697 | 6.3% |
| Multidisciplinary Studies | 0 | 0.0% |
| Science & Technology | 1,160 | 10.4% |
| Business | 2,061 | 18.5% |
| Education | 2,526 | 22.7% |
| Literature & Languages | 621 | 5.6% |
| Liberal Arts & History | 516 | 4.6% |
| Visual & Performing Arts | 152 | 1.4% |
| Communications | 333 | 3.0% |
| Arts & Humanities | 392 | 3.5% |
| Total | 11,121 | 100.0% |
Transportation & Commute in Venice
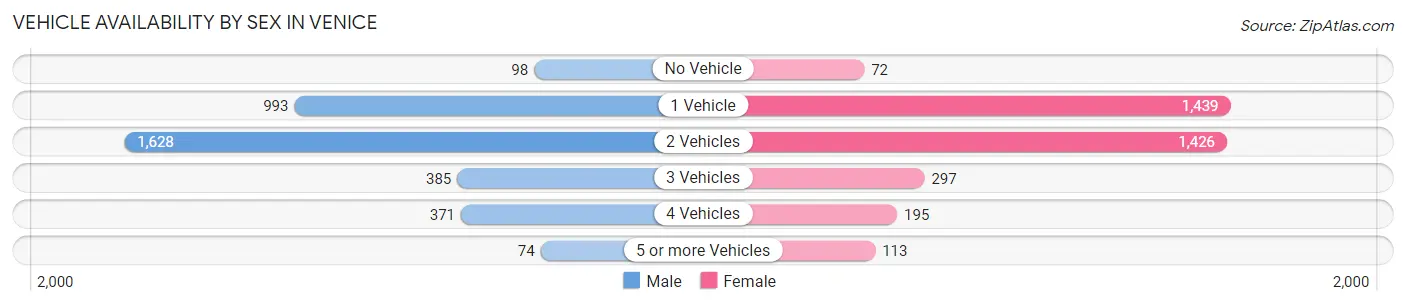
Vehicle Availability by Sex in Venice
The most prevalent vehicle ownership categories in Venice are males with 2 vehicles (1,628, accounting for 45.9%) and females with 2 vehicles (1,426, making up 46.0%).
| Vehicles Available | Male | Female |
| No Vehicle | 98 (2.8%) | 72 (2.0%) |
| 1 Vehicle | 993 (28.0%) | 1,439 (40.6%) |
| 2 Vehicles | 1,628 (45.9%) | 1,426 (40.3%) |
| 3 Vehicles | 385 (10.8%) | 297 (8.4%) |
| 4 Vehicles | 371 (10.4%) | 195 (5.5%) |
| 5 or more Vehicles | 74 (2.1%) | 113 (3.2%) |
| Total | 3,549 (100.0%) | 3,542 (100.0%) |
Commute Time in Venice
The most frequently occuring commute durations in Venice are 20 to 24 minutes (1,330 commuters, 23.6%), 10 to 14 minutes (1,020 commuters, 18.1%), and 15 to 19 minutes (750 commuters, 13.3%).
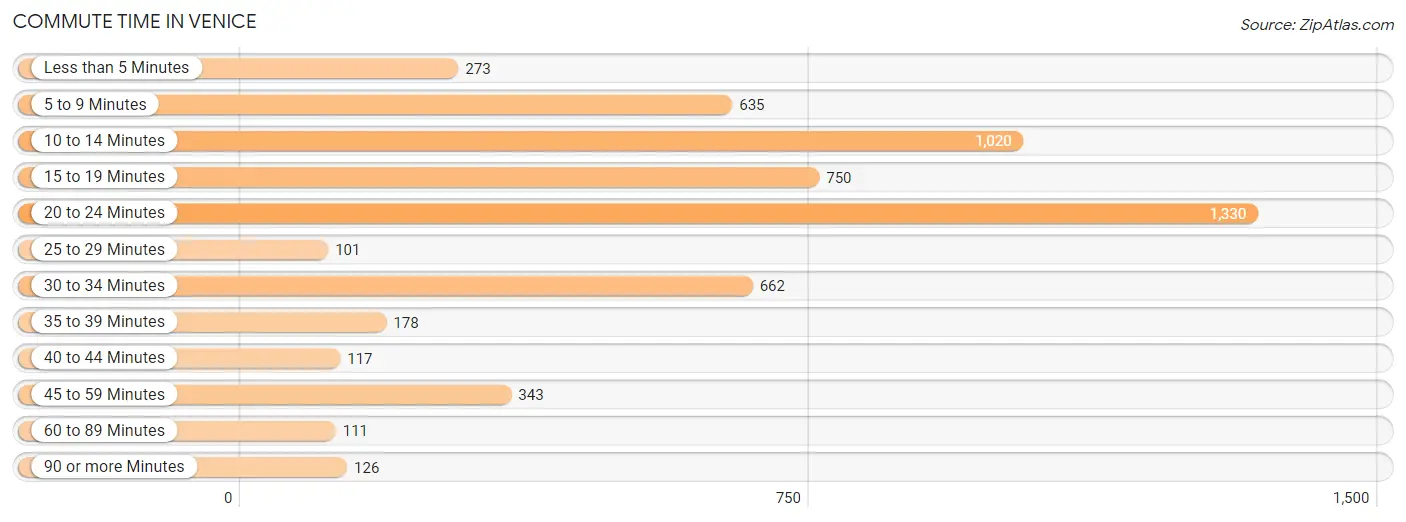
| Commute Time | # Commuters | % Commuters |
| Less than 5 Minutes | 273 | 4.8% |
| 5 to 9 Minutes | 635 | 11.3% |
| 10 to 14 Minutes | 1,020 | 18.1% |
| 15 to 19 Minutes | 750 | 13.3% |
| 20 to 24 Minutes | 1,330 | 23.6% |
| 25 to 29 Minutes | 101 | 1.8% |
| 30 to 34 Minutes | 662 | 11.7% |
| 35 to 39 Minutes | 178 | 3.2% |
| 40 to 44 Minutes | 117 | 2.1% |
| 45 to 59 Minutes | 343 | 6.1% |
| 60 to 89 Minutes | 111 | 2.0% |
| 90 or more Minutes | 126 | 2.2% |
Commute Time by Sex in Venice
The most common commute times in Venice are 15 to 19 minutes (521 commuters, 19.9%) for males and 20 to 24 minutes (885 commuters, 29.2%) for females.
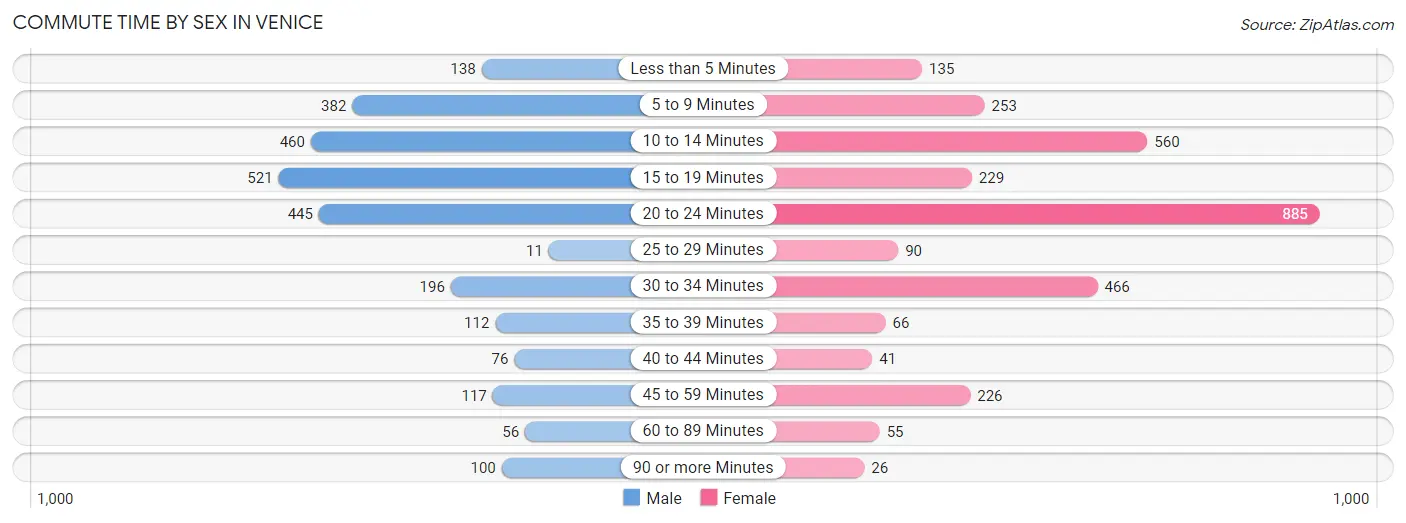
| Commute Time | Male | Female |
| Less than 5 Minutes | 138 (5.3%) | 135 (4.4%) |
| 5 to 9 Minutes | 382 (14.6%) | 253 (8.3%) |
| 10 to 14 Minutes | 460 (17.6%) | 560 (18.5%) |
| 15 to 19 Minutes | 521 (19.9%) | 229 (7.5%) |
| 20 to 24 Minutes | 445 (17.0%) | 885 (29.2%) |
| 25 to 29 Minutes | 11 (0.4%) | 90 (3.0%) |
| 30 to 34 Minutes | 196 (7.5%) | 466 (15.4%) |
| 35 to 39 Minutes | 112 (4.3%) | 66 (2.2%) |
| 40 to 44 Minutes | 76 (2.9%) | 41 (1.3%) |
| 45 to 59 Minutes | 117 (4.5%) | 226 (7.4%) |
| 60 to 89 Minutes | 56 (2.1%) | 55 (1.8%) |
| 90 or more Minutes | 100 (3.8%) | 26 (0.9%) |
Time of Departure to Work by Sex in Venice
The most frequent times of departure to work in Venice are 9:00 AM to 9:59 AM (378, 14.5%) for males and 7:30 AM to 7:59 AM (644, 21.2%) for females.
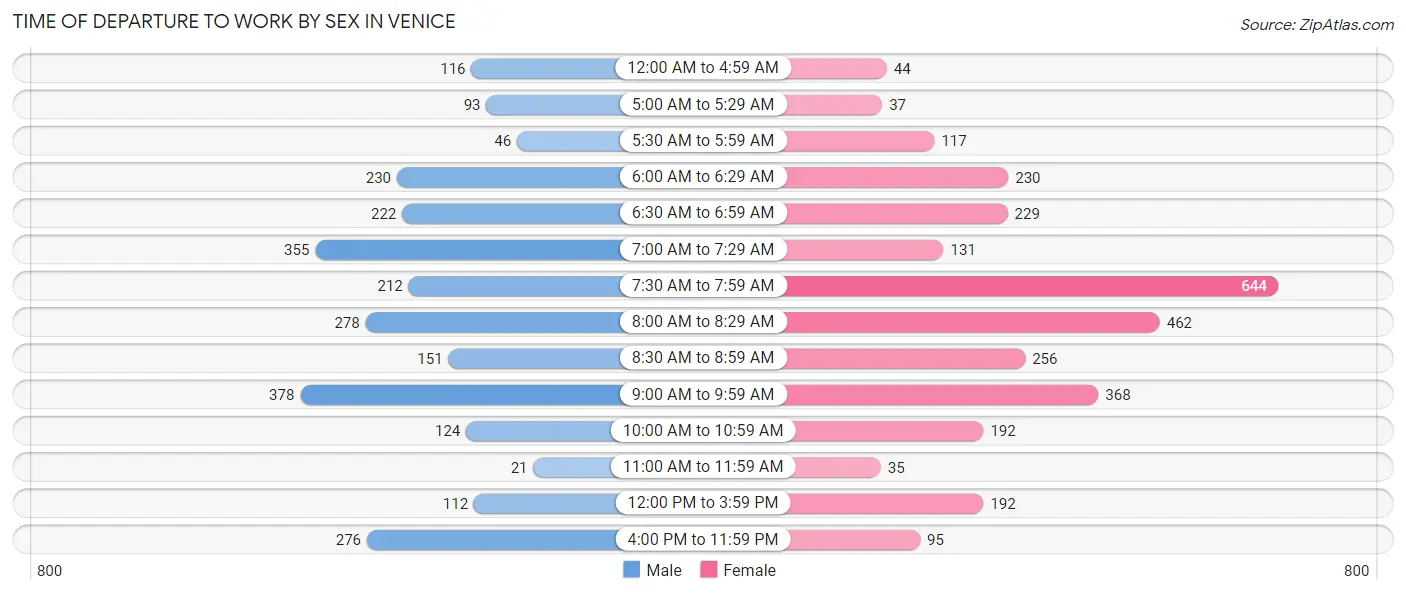
| Time of Departure | Male | Female |
| 12:00 AM to 4:59 AM | 116 (4.4%) | 44 (1.5%) |
| 5:00 AM to 5:29 AM | 93 (3.6%) | 37 (1.2%) |
| 5:30 AM to 5:59 AM | 46 (1.8%) | 117 (3.9%) |
| 6:00 AM to 6:29 AM | 230 (8.8%) | 230 (7.6%) |
| 6:30 AM to 6:59 AM | 222 (8.5%) | 229 (7.5%) |
| 7:00 AM to 7:29 AM | 355 (13.6%) | 131 (4.3%) |
| 7:30 AM to 7:59 AM | 212 (8.1%) | 644 (21.2%) |
| 8:00 AM to 8:29 AM | 278 (10.6%) | 462 (15.2%) |
| 8:30 AM to 8:59 AM | 151 (5.8%) | 256 (8.4%) |
| 9:00 AM to 9:59 AM | 378 (14.5%) | 368 (12.1%) |
| 10:00 AM to 10:59 AM | 124 (4.7%) | 192 (6.3%) |
| 11:00 AM to 11:59 AM | 21 (0.8%) | 35 (1.1%) |
| 12:00 PM to 3:59 PM | 112 (4.3%) | 192 (6.3%) |
| 4:00 PM to 11:59 PM | 276 (10.6%) | 95 (3.1%) |
| Total | 2,614 (100.0%) | 3,032 (100.0%) |
Housing Occupancy in Venice
Occupancy by Ownership in Venice
Of the total 13,840 dwellings in Venice, owner-occupied units account for 10,907 (78.8%), while renter-occupied units make up 2,933 (21.2%).
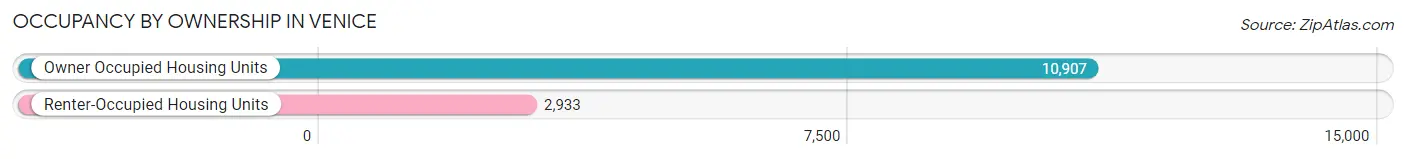
| Occupancy | # Housing Units | % Housing Units |
| Owner Occupied Housing Units | 10,907 | 78.8% |
| Renter-Occupied Housing Units | 2,933 | 21.2% |
| Total Occupied Housing Units | 13,840 | 100.0% |
Occupancy by Household Size in Venice
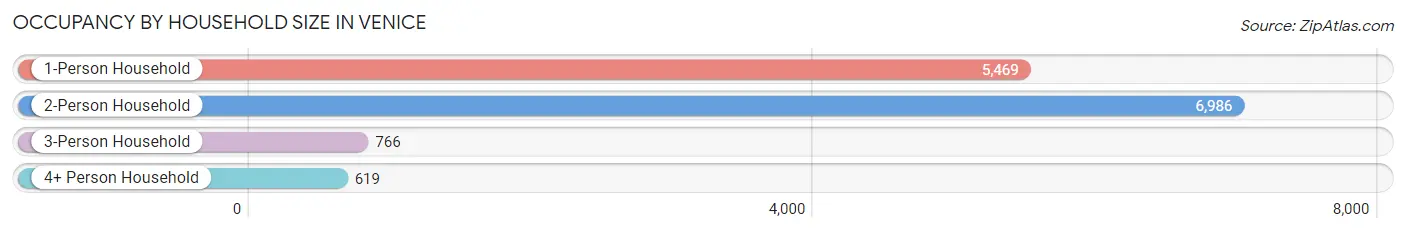
| Household Size | # Housing Units | % Housing Units |
| 1-Person Household | 5,469 | 39.5% |
| 2-Person Household | 6,986 | 50.5% |
| 3-Person Household | 766 | 5.5% |
| 4+ Person Household | 619 | 4.5% |
| Total Housing Units | 13,840 | 100.0% |
Occupancy by Ownership by Household Size in Venice
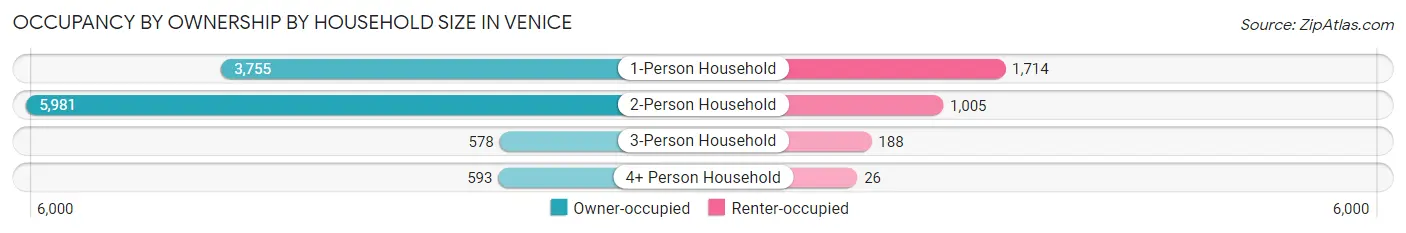
| Household Size | Owner-occupied | Renter-occupied |
| 1-Person Household | 3,755 (68.7%) | 1,714 (31.3%) |
| 2-Person Household | 5,981 (85.6%) | 1,005 (14.4%) |
| 3-Person Household | 578 (75.5%) | 188 (24.5%) |
| 4+ Person Household | 593 (95.8%) | 26 (4.2%) |
| Total Housing Units | 10,907 (78.8%) | 2,933 (21.2%) |
Occupancy by Educational Attainment in Venice
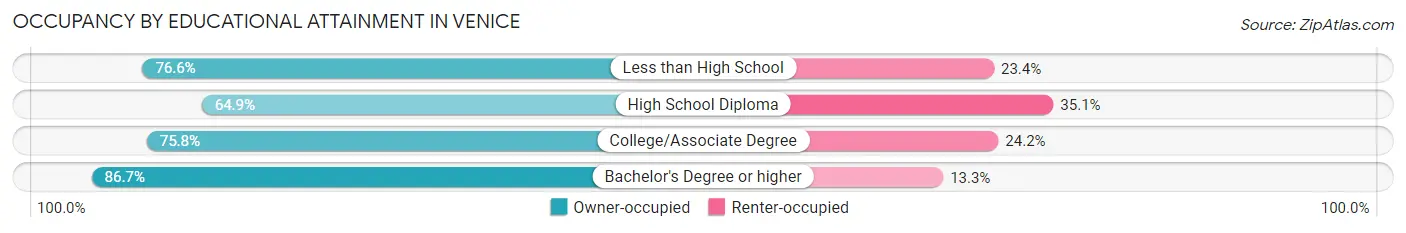
| Household Size | Owner-occupied | Renter-occupied |
| Less than High School | 223 (76.6%) | 68 (23.4%) |
| High School Diploma | 1,896 (64.9%) | 1,027 (35.1%) |
| College/Associate Degree | 2,948 (75.8%) | 943 (24.2%) |
| Bachelor's Degree or higher | 5,840 (86.7%) | 895 (13.3%) |
Occupancy by Age of Householder in Venice
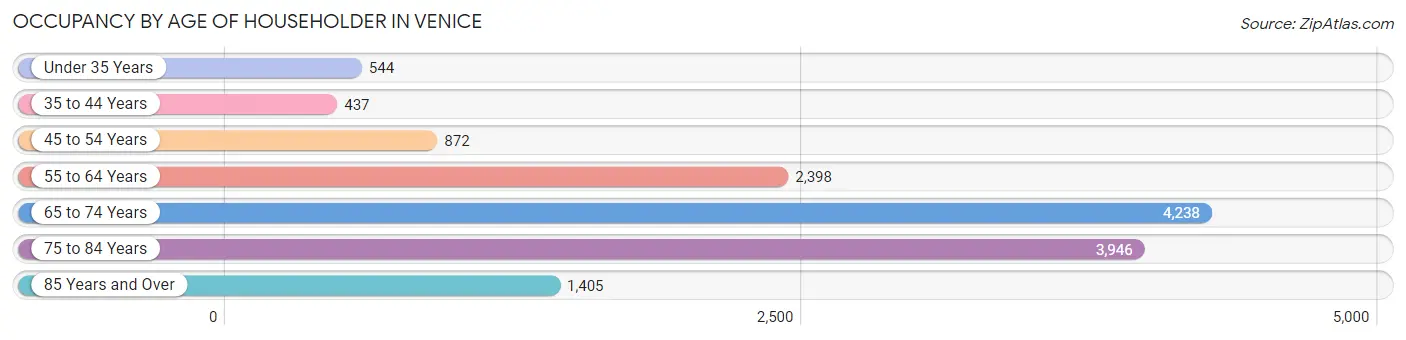
| Age Bracket | # Households | % Households |
| Under 35 Years | 544 | 3.9% |
| 35 to 44 Years | 437 | 3.2% |
| 45 to 54 Years | 872 | 6.3% |
| 55 to 64 Years | 2,398 | 17.3% |
| 65 to 74 Years | 4,238 | 30.6% |
| 75 to 84 Years | 3,946 | 28.5% |
| 85 Years and Over | 1,405 | 10.2% |
| Total | 13,840 | 100.0% |
Housing Finances in Venice
Median Income by Occupancy in Venice
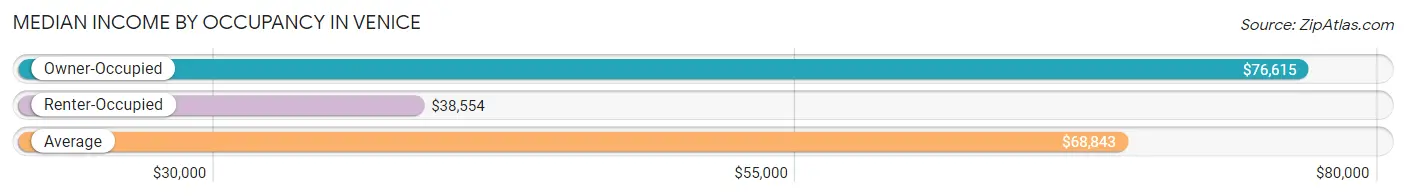
| Occupancy Type | # Households | Median Income |
| Owner-Occupied | 10,907 (78.8%) | $76,615 |
| Renter-Occupied | 2,933 (21.2%) | $38,554 |
| Average | 13,840 (100.0%) | $68,843 |
Occupancy by Householder Income Bracket in Venice
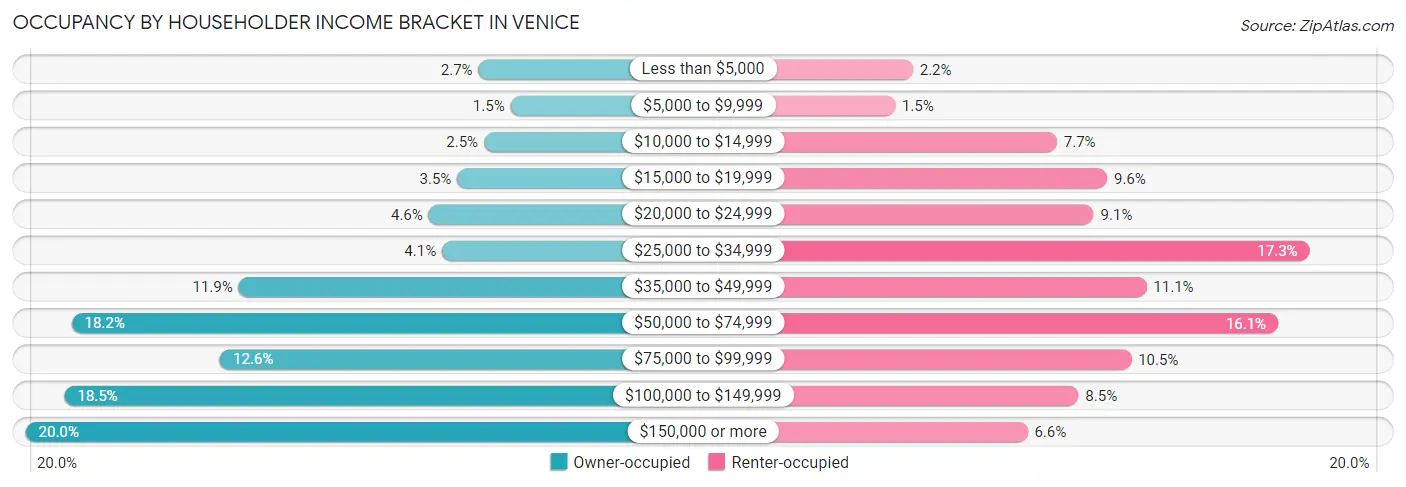
| Income Bracket | Owner-occupied | Renter-occupied |
| Less than $5,000 | 296 (2.7%) | 64 (2.2%) |
| $5,000 to $9,999 | 163 (1.5%) | 44 (1.5%) |
| $10,000 to $14,999 | 273 (2.5%) | 225 (7.7%) |
| $15,000 to $19,999 | 384 (3.5%) | 281 (9.6%) |
| $20,000 to $24,999 | 503 (4.6%) | 266 (9.1%) |
| $25,000 to $34,999 | 447 (4.1%) | 507 (17.3%) |
| $35,000 to $49,999 | 1,293 (11.8%) | 325 (11.1%) |
| $50,000 to $74,999 | 1,986 (18.2%) | 472 (16.1%) |
| $75,000 to $99,999 | 1,369 (12.6%) | 308 (10.5%) |
| $100,000 to $149,999 | 2,016 (18.5%) | 249 (8.5%) |
| $150,000 or more | 2,177 (20.0%) | 192 (6.6%) |
| Total | 10,907 (100.0%) | 2,933 (100.0%) |
Monthly Housing Cost Tiers in Venice
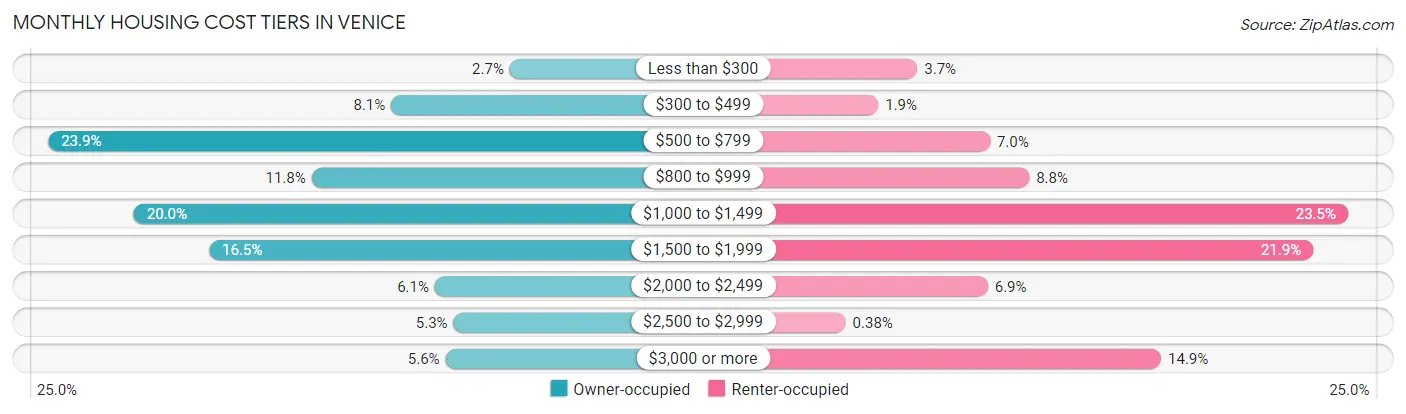
| Monthly Cost | Owner-occupied | Renter-occupied |
| Less than $300 | 291 (2.7%) | 108 (3.7%) |
| $300 to $499 | 887 (8.1%) | 55 (1.9%) |
| $500 to $799 | 2,608 (23.9%) | 206 (7.0%) |
| $800 to $999 | 1,286 (11.8%) | 259 (8.8%) |
| $1,000 to $1,499 | 2,178 (20.0%) | 689 (23.5%) |
| $1,500 to $1,999 | 1,801 (16.5%) | 642 (21.9%) |
| $2,000 to $2,499 | 668 (6.1%) | 203 (6.9%) |
| $2,500 to $2,999 | 574 (5.3%) | 11 (0.4%) |
| $3,000 or more | 614 (5.6%) | 437 (14.9%) |
| Total | 10,907 (100.0%) | 2,933 (100.0%) |
Physical Housing Characteristics in Venice
Housing Structures in Venice
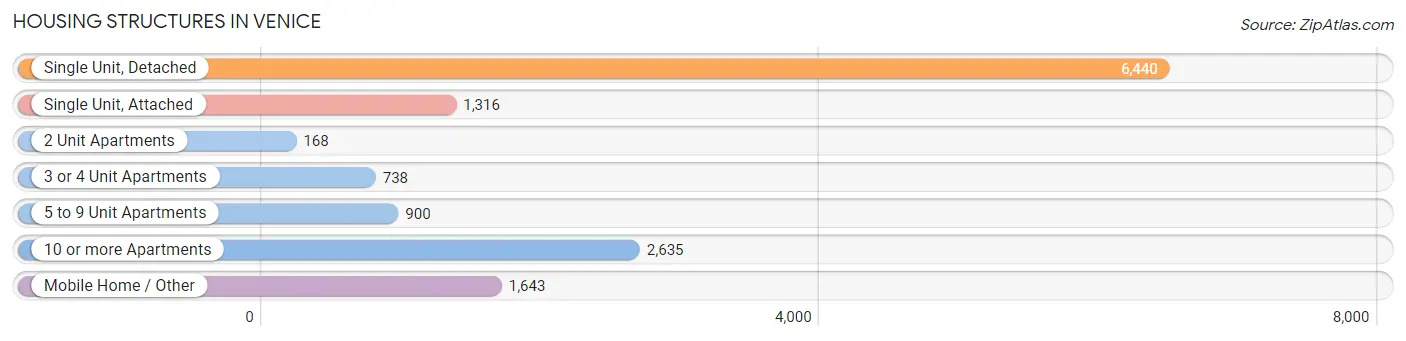
| Structure Type | # Housing Units | % Housing Units |
| Single Unit, Detached | 6,440 | 46.5% |
| Single Unit, Attached | 1,316 | 9.5% |
| 2 Unit Apartments | 168 | 1.2% |
| 3 or 4 Unit Apartments | 738 | 5.3% |
| 5 to 9 Unit Apartments | 900 | 6.5% |
| 10 or more Apartments | 2,635 | 19.0% |
| Mobile Home / Other | 1,643 | 11.9% |
| Total | 13,840 | 100.0% |
Housing Structures by Occupancy in Venice
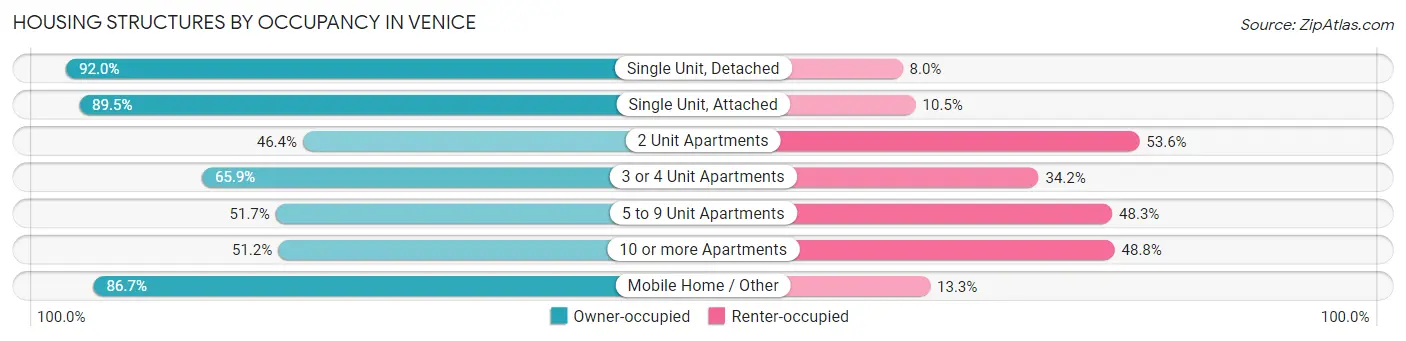
| Structure Type | Owner-occupied | Renter-occupied |
| Single Unit, Detached | 5,926 (92.0%) | 514 (8.0%) |
| Single Unit, Attached | 1,178 (89.5%) | 138 (10.5%) |
| 2 Unit Apartments | 78 (46.4%) | 90 (53.6%) |
| 3 or 4 Unit Apartments | 486 (65.8%) | 252 (34.2%) |
| 5 to 9 Unit Apartments | 465 (51.7%) | 435 (48.3%) |
| 10 or more Apartments | 1,349 (51.2%) | 1,286 (48.8%) |
| Mobile Home / Other | 1,425 (86.7%) | 218 (13.3%) |
| Total | 10,907 (78.8%) | 2,933 (21.2%) |
Housing Structures by Number of Rooms in Venice
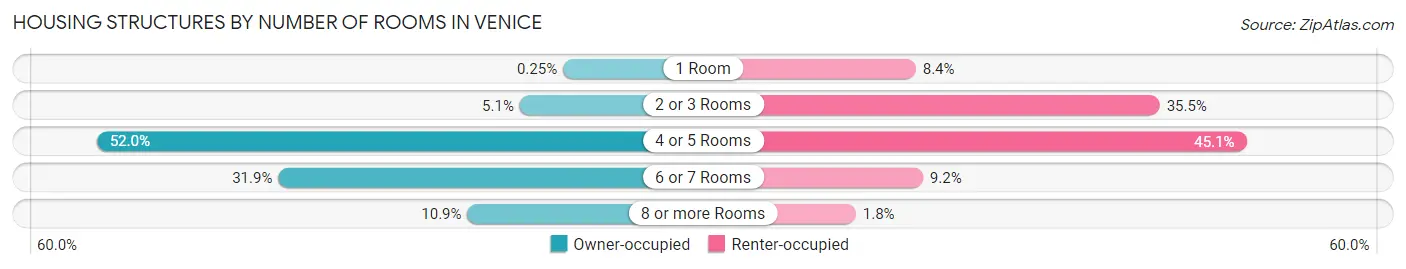
| Number of Rooms | Owner-occupied | Renter-occupied |
| 1 Room | 27 (0.3%) | 247 (8.4%) |
| 2 or 3 Rooms | 551 (5.1%) | 1,041 (35.5%) |
| 4 or 5 Rooms | 5,671 (52.0%) | 1,323 (45.1%) |
| 6 or 7 Rooms | 3,474 (31.9%) | 270 (9.2%) |
| 8 or more Rooms | 1,184 (10.9%) | 52 (1.8%) |
| Total | 10,907 (100.0%) | 2,933 (100.0%) |
Housing Structure by Heating Type in Venice
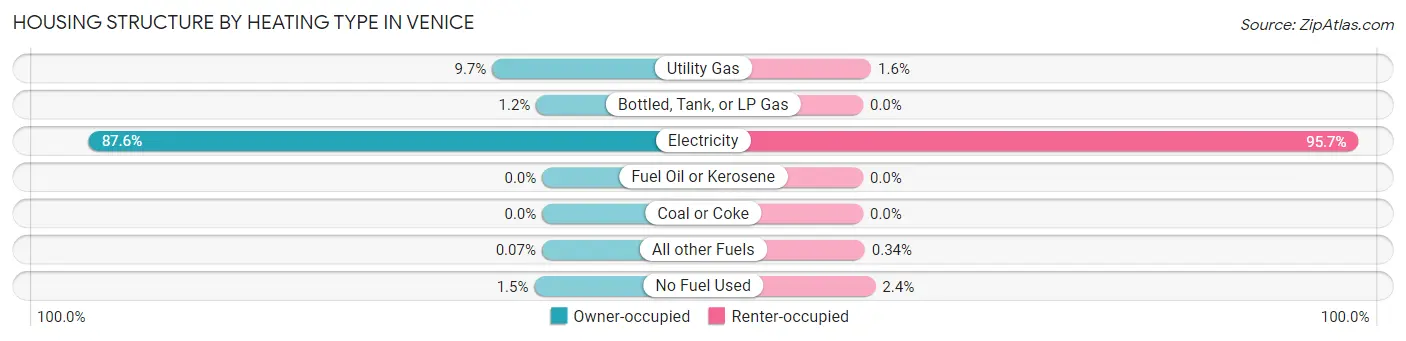
| Heating Type | Owner-occupied | Renter-occupied |
| Utility Gas | 1,054 (9.7%) | 46 (1.6%) |
| Bottled, Tank, or LP Gas | 125 (1.1%) | 0 (0.0%) |
| Electricity | 9,555 (87.6%) | 2,807 (95.7%) |
| Fuel Oil or Kerosene | 0 (0.0%) | 0 (0.0%) |
| Coal or Coke | 0 (0.0%) | 0 (0.0%) |
| All other Fuels | 8 (0.1%) | 10 (0.3%) |
| No Fuel Used | 165 (1.5%) | 70 (2.4%) |
| Total | 10,907 (100.0%) | 2,933 (100.0%) |
Household Vehicle Usage in Venice
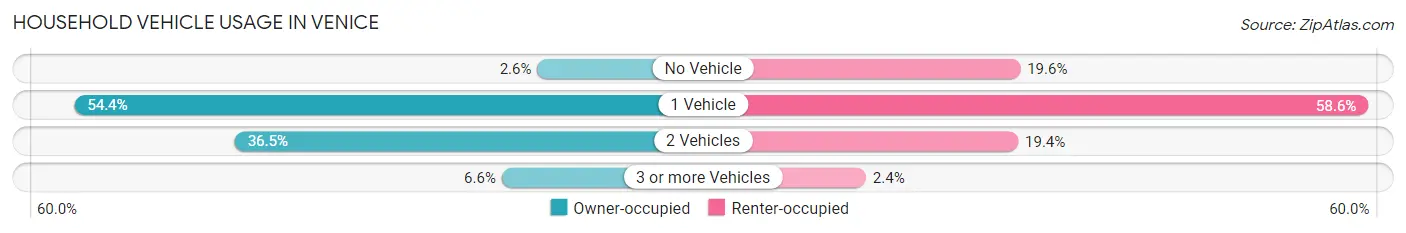
| Vehicles per Household | Owner-occupied | Renter-occupied |
| No Vehicle | 280 (2.6%) | 576 (19.6%) |
| 1 Vehicle | 5,936 (54.4%) | 1,719 (58.6%) |
| 2 Vehicles | 3,977 (36.5%) | 569 (19.4%) |
| 3 or more Vehicles | 714 (6.6%) | 69 (2.4%) |
| Total | 10,907 (100.0%) | 2,933 (100.0%) |
Real Estate & Mortgages in Venice
Real Estate and Mortgage Overview in Venice
| Characteristic | Without Mortgage | With Mortgage |
| Housing Units | 7,052 | 3,855 |
| Median Property Value | $335,400 | $358,100 |
| Median Household Income | $69,375 | $1,002 |
| Monthly Housing Costs | $787 | $546 |
| Real Estate Taxes | $2,897 | $14 |
Property Value by Mortgage Status in Venice
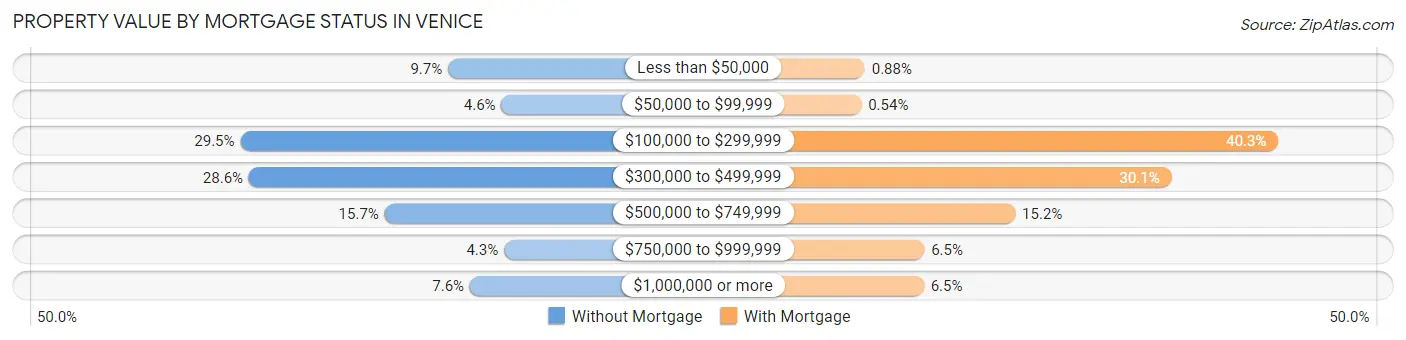
| Property Value | Without Mortgage | With Mortgage |
| Less than $50,000 | 682 (9.7%) | 34 (0.9%) |
| $50,000 to $99,999 | 324 (4.6%) | 21 (0.5%) |
| $100,000 to $299,999 | 2,077 (29.4%) | 1,552 (40.3%) |
| $300,000 to $499,999 | 2,020 (28.6%) | 1,160 (30.1%) |
| $500,000 to $749,999 | 1,108 (15.7%) | 586 (15.2%) |
| $750,000 to $999,999 | 306 (4.3%) | 252 (6.5%) |
| $1,000,000 or more | 535 (7.6%) | 250 (6.5%) |
| Total | 7,052 (100.0%) | 3,855 (100.0%) |
Household Income by Mortgage Status in Venice
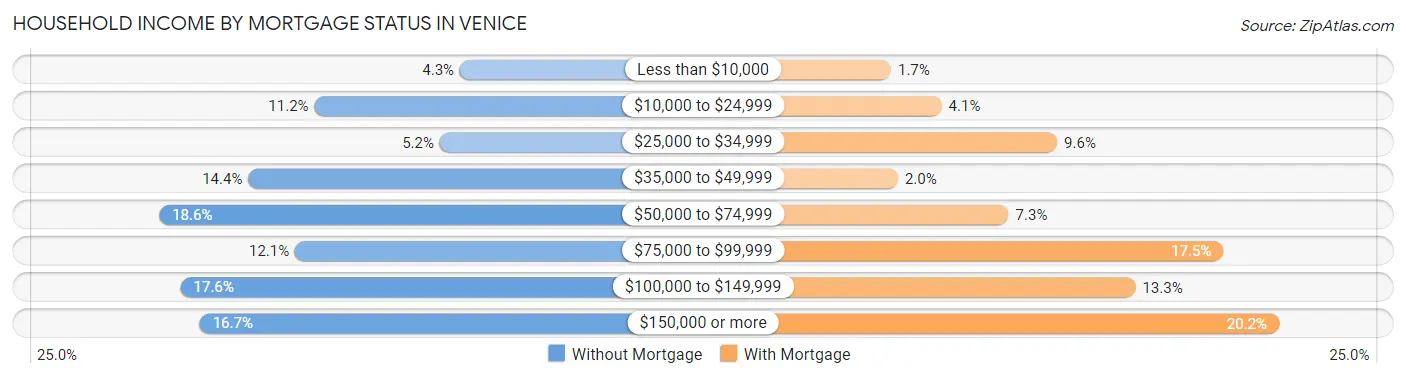
| Household Income | Without Mortgage | With Mortgage |
| Less than $10,000 | 301 (4.3%) | 65 (1.7%) |
| $10,000 to $24,999 | 790 (11.2%) | 158 (4.1%) |
| $25,000 to $34,999 | 369 (5.2%) | 370 (9.6%) |
| $35,000 to $49,999 | 1,012 (14.3%) | 78 (2.0%) |
| $50,000 to $74,999 | 1,311 (18.6%) | 281 (7.3%) |
| $75,000 to $99,999 | 855 (12.1%) | 675 (17.5%) |
| $100,000 to $149,999 | 1,239 (17.6%) | 514 (13.3%) |
| $150,000 or more | 1,175 (16.7%) | 777 (20.2%) |
| Total | 7,052 (100.0%) | 3,855 (100.0%) |
Property Value to Household Income Ratio in Venice
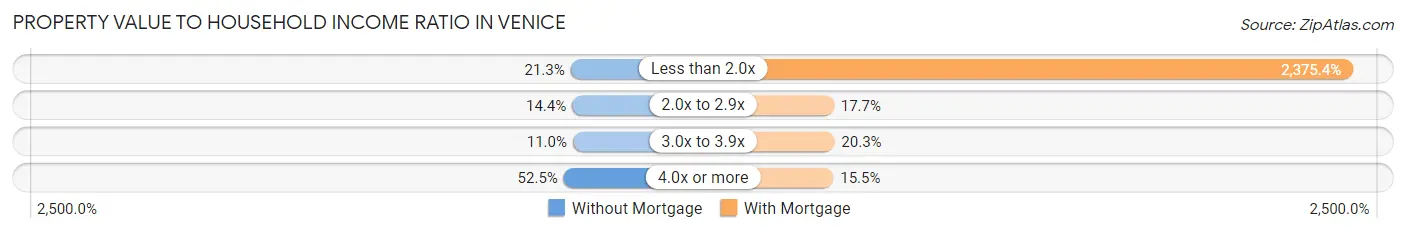
| Value-to-Income Ratio | Without Mortgage | With Mortgage |
| Less than 2.0x | 1,504 (21.3%) | 91,573 (2,375.4%) |
| 2.0x to 2.9x | 1,012 (14.3%) | 682 (17.7%) |
| 3.0x to 3.9x | 772 (11.0%) | 783 (20.3%) |
| 4.0x or more | 3,699 (52.4%) | 598 (15.5%) |
| Total | 7,052 (100.0%) | 3,855 (100.0%) |
Real Estate Taxes by Mortgage Status in Venice
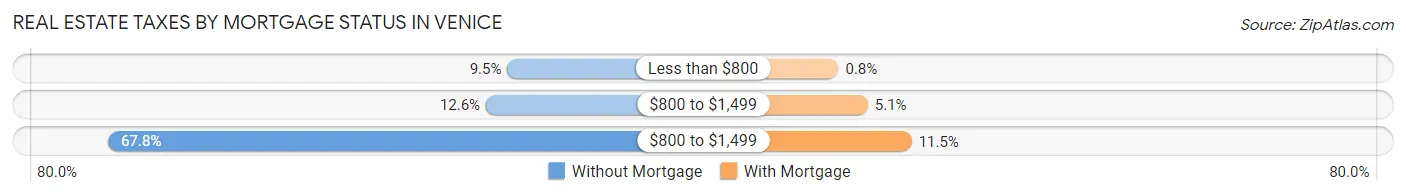
| Property Taxes | Without Mortgage | With Mortgage |
| Less than $800 | 668 (9.5%) | 31 (0.8%) |
| $800 to $1,499 | 888 (12.6%) | 196 (5.1%) |
| $800 to $1,499 | 4,782 (67.8%) | 443 (11.5%) |
| Total | 7,052 (100.0%) | 3,855 (100.0%) |
Health & Disability in Venice
Health Insurance Coverage by Age in Venice
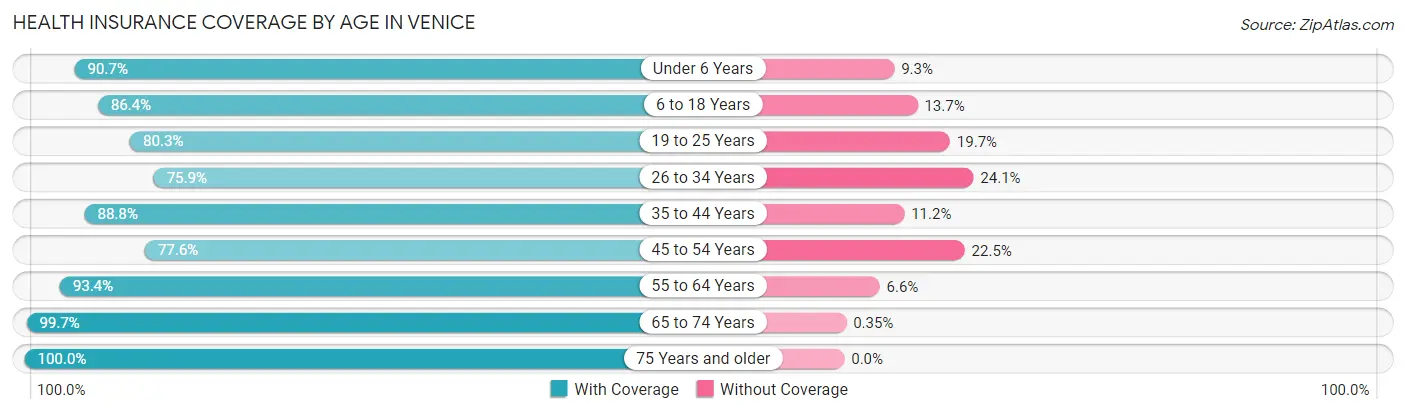
| Age Bracket | With Coverage | Without Coverage |
| Under 6 Years | 341 (90.7%) | 35 (9.3%) |
| 6 to 18 Years | 898 (86.4%) | 142 (13.7%) |
| 19 to 25 Years | 673 (80.3%) | 165 (19.7%) |
| 26 to 34 Years | 785 (75.9%) | 249 (24.1%) |
| 35 to 44 Years | 906 (88.8%) | 114 (11.2%) |
| 45 to 54 Years | 1,351 (77.5%) | 391 (22.5%) |
| 55 to 64 Years | 3,550 (93.4%) | 250 (6.6%) |
| 65 to 74 Years | 7,375 (99.7%) | 26 (0.4%) |
| 75 Years and older | 7,729 (100.0%) | 0 (0.0%) |
| Total | 23,608 (94.5%) | 1,372 (5.5%) |
Health Insurance Coverage by Citizenship Status in Venice
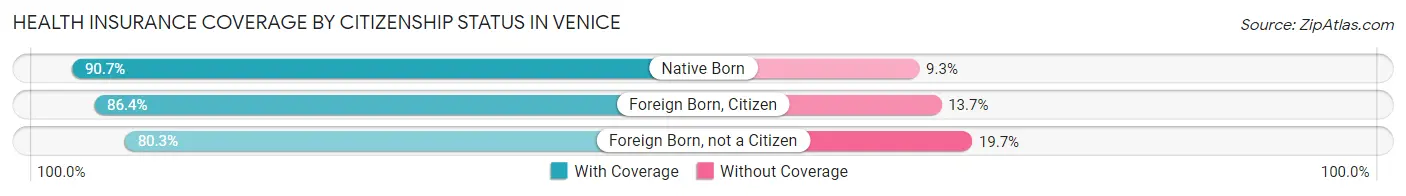
| Citizenship Status | With Coverage | Without Coverage |
| Native Born | 341 (90.7%) | 35 (9.3%) |
| Foreign Born, Citizen | 898 (86.4%) | 142 (13.7%) |
| Foreign Born, not a Citizen | 673 (80.3%) | 165 (19.7%) |
Health Insurance Coverage by Household Income in Venice
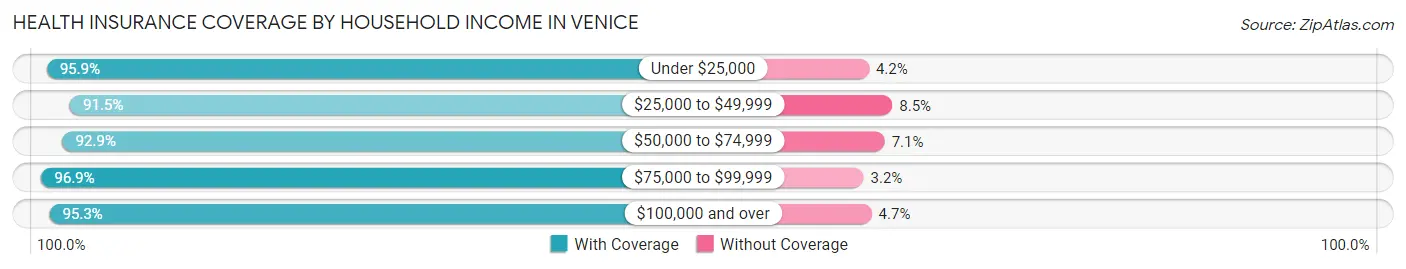
| Household Income | With Coverage | Without Coverage |
| Under $25,000 | 2,930 (95.9%) | 127 (4.2%) |
| $25,000 to $49,999 | 3,293 (91.5%) | 307 (8.5%) |
| $50,000 to $74,999 | 4,095 (92.9%) | 313 (7.1%) |
| $75,000 to $99,999 | 3,232 (96.9%) | 105 (3.2%) |
| $100,000 and over | 10,020 (95.3%) | 490 (4.7%) |
Public vs Private Health Insurance Coverage by Age in Venice
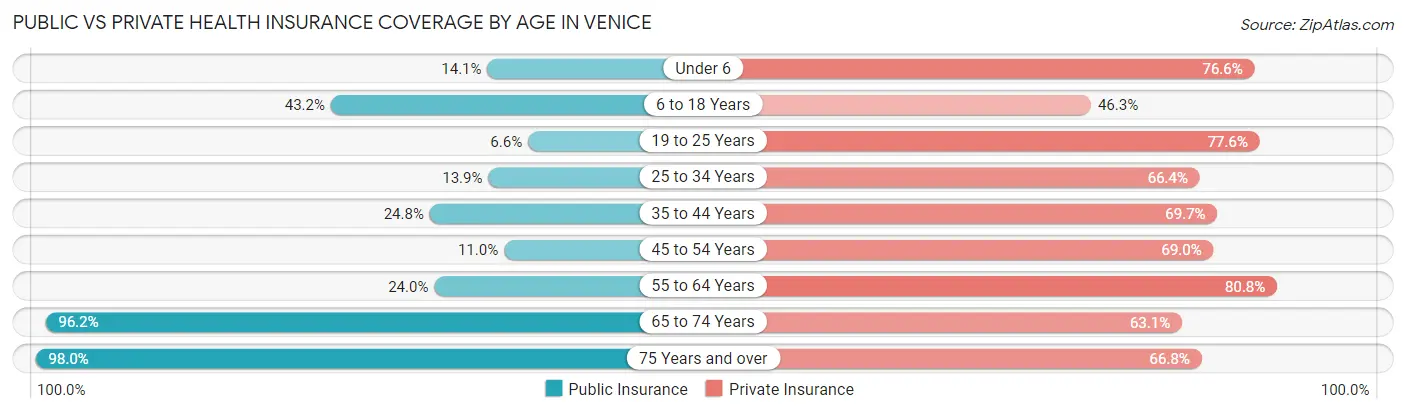
| Age Bracket | Public Insurance | Private Insurance |
| Under 6 | 53 (14.1%) | 288 (76.6%) |
| 6 to 18 Years | 449 (43.2%) | 481 (46.3%) |
| 19 to 25 Years | 55 (6.6%) | 650 (77.6%) |
| 25 to 34 Years | 144 (13.9%) | 687 (66.4%) |
| 35 to 44 Years | 253 (24.8%) | 711 (69.7%) |
| 45 to 54 Years | 192 (11.0%) | 1,202 (69.0%) |
| 55 to 64 Years | 911 (24.0%) | 3,070 (80.8%) |
| 65 to 74 Years | 7,116 (96.2%) | 4,673 (63.1%) |
| 75 Years and over | 7,574 (98.0%) | 5,162 (66.8%) |
| Total | 16,747 (67.0%) | 16,924 (67.7%) |
Disability Status by Sex by Age in Venice
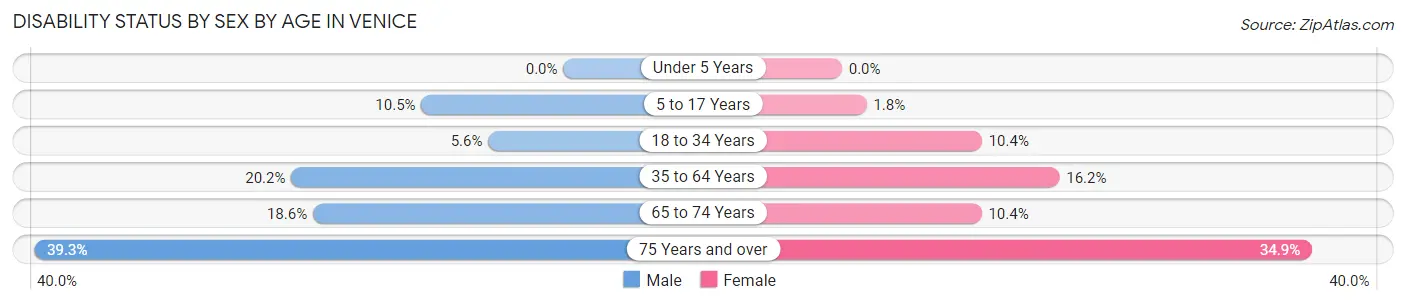
| Age Bracket | Male | Female |
| Under 5 Years | 0 (0.0%) | 0 (0.0%) |
| 5 to 17 Years | 45 (10.5%) | 11 (1.8%) |
| 18 to 34 Years | 56 (5.6%) | 94 (10.4%) |
| 35 to 64 Years | 621 (20.2%) | 563 (16.2%) |
| 65 to 74 Years | 537 (18.6%) | 468 (10.4%) |
| 75 Years and over | 1,440 (39.3%) | 1,419 (34.9%) |
Disability Class by Sex by Age in Venice
Disability Class: Hearing Difficulty
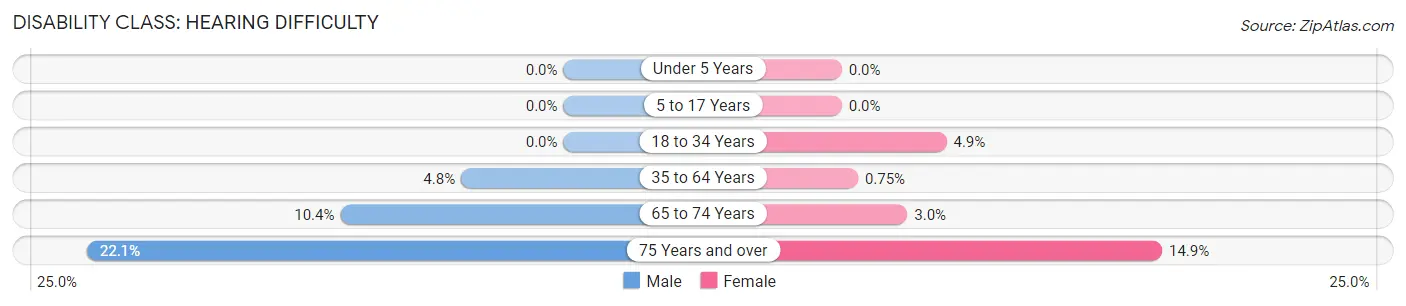
| Age Bracket | Male | Female |
| Under 5 Years | 0 (0.0%) | 0 (0.0%) |
| 5 to 17 Years | 0 (0.0%) | 0 (0.0%) |
| 18 to 34 Years | 0 (0.0%) | 44 (4.9%) |
| 35 to 64 Years | 146 (4.8%) | 26 (0.7%) |
| 65 to 74 Years | 299 (10.3%) | 137 (3.0%) |
| 75 Years and over | 810 (22.1%) | 604 (14.9%) |
Disability Class: Vision Difficulty
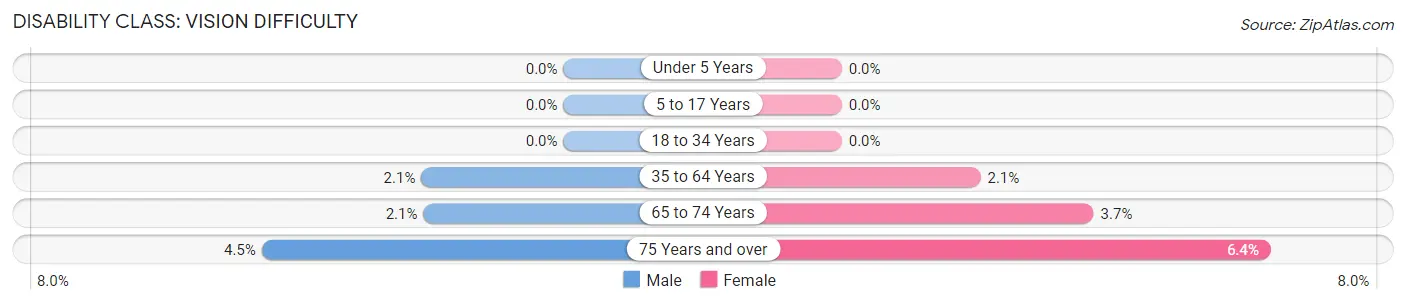
| Age Bracket | Male | Female |
| Under 5 Years | 0 (0.0%) | 0 (0.0%) |
| 5 to 17 Years | 0 (0.0%) | 0 (0.0%) |
| 18 to 34 Years | 0 (0.0%) | 0 (0.0%) |
| 35 to 64 Years | 65 (2.1%) | 72 (2.1%) |
| 65 to 74 Years | 60 (2.1%) | 169 (3.7%) |
| 75 Years and over | 164 (4.5%) | 259 (6.4%) |
Disability Class: Cognitive Difficulty
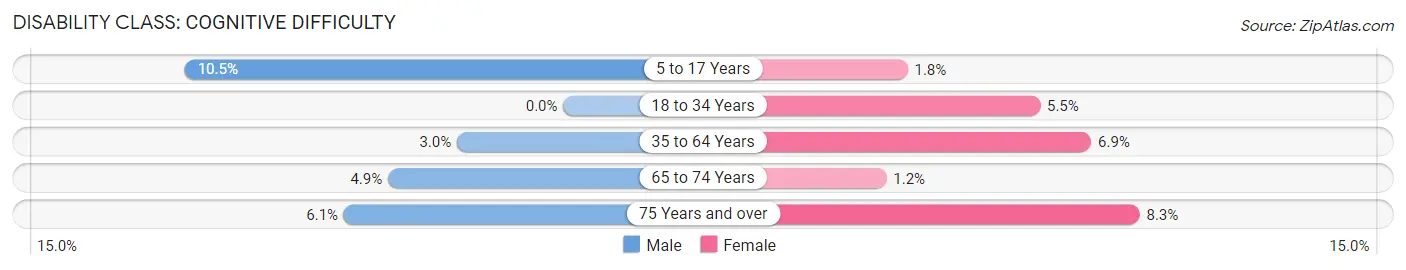
| Age Bracket | Male | Female |
| 5 to 17 Years | 45 (10.5%) | 11 (1.8%) |
| 18 to 34 Years | 0 (0.0%) | 50 (5.5%) |
| 35 to 64 Years | 91 (3.0%) | 242 (6.9%) |
| 65 to 74 Years | 141 (4.9%) | 56 (1.2%) |
| 75 Years and over | 224 (6.1%) | 337 (8.3%) |
Disability Class: Ambulatory Difficulty
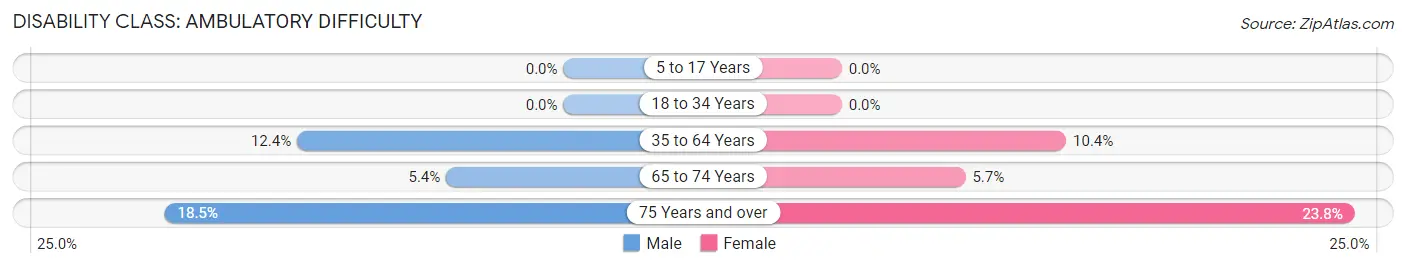
| Age Bracket | Male | Female |
| 5 to 17 Years | 0 (0.0%) | 0 (0.0%) |
| 18 to 34 Years | 0 (0.0%) | 0 (0.0%) |
| 35 to 64 Years | 380 (12.4%) | 363 (10.4%) |
| 65 to 74 Years | 157 (5.4%) | 259 (5.7%) |
| 75 Years and over | 678 (18.5%) | 967 (23.8%) |
Disability Class: Self-Care Difficulty
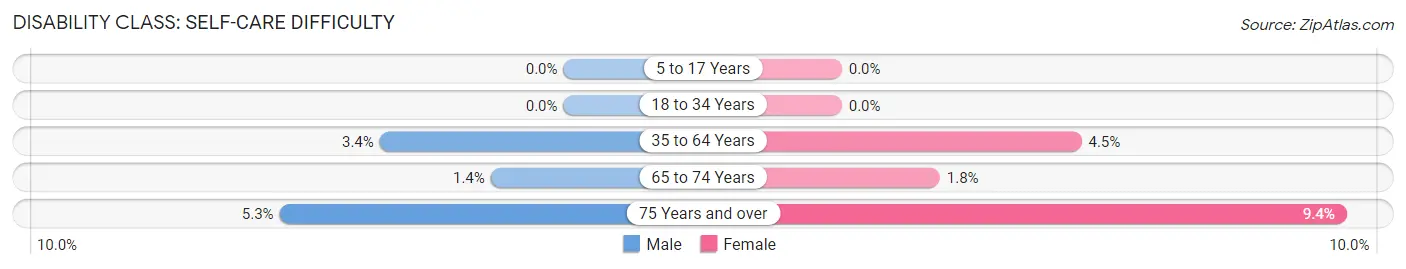
| Age Bracket | Male | Female |
| 5 to 17 Years | 0 (0.0%) | 0 (0.0%) |
| 18 to 34 Years | 0 (0.0%) | 0 (0.0%) |
| 35 to 64 Years | 105 (3.4%) | 155 (4.4%) |
| 65 to 74 Years | 39 (1.3%) | 82 (1.8%) |
| 75 Years and over | 193 (5.3%) | 381 (9.4%) |
Technology Access in Venice
Computing Device Access in Venice
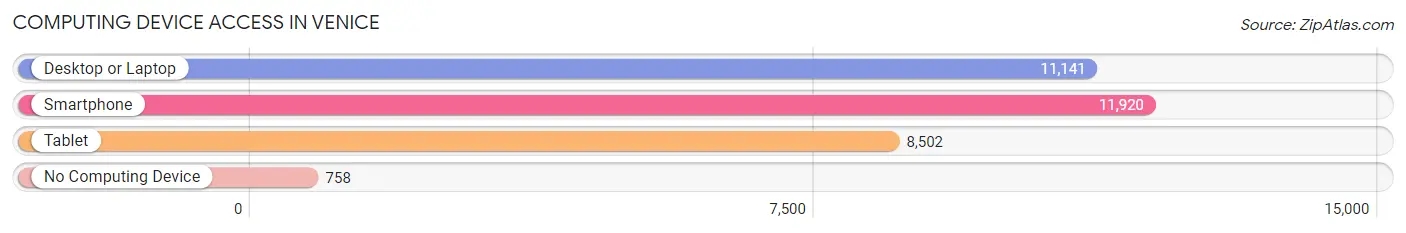
| Device Type | # Households | % Households |
| Desktop or Laptop | 11,141 | 80.5% |
| Smartphone | 11,920 | 86.1% |
| Tablet | 8,502 | 61.4% |
| No Computing Device | 758 | 5.5% |
| Total | 13,840 | 100.0% |
Internet Access in Venice
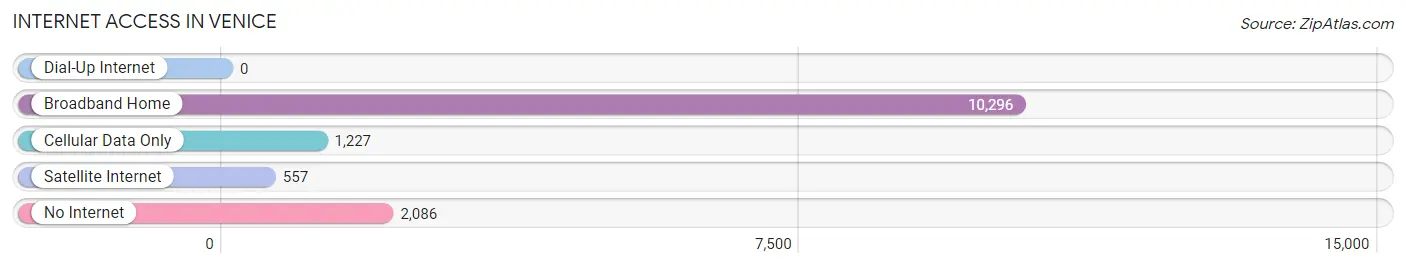
| Internet Type | # Households | % Households |
| Dial-Up Internet | 0 | 0.0% |
| Broadband Home | 10,296 | 74.4% |
| Cellular Data Only | 1,227 | 8.9% |
| Satellite Internet | 557 | 4.0% |
| No Internet | 2,086 | 15.1% |
| Total | 13,840 | 100.0% |
Venice Summary
Venice, Florida is a city located in Sarasota County, on the Gulf Coast of Florida. It is known for its beautiful beaches, its vibrant downtown area, and its unique history.
Geography
Venice is located on the Gulf Coast of Florida, about halfway between Tampa and Fort Myers. It is bordered by the Gulf of Mexico to the west, the Myakka River to the east, and the city of Sarasota to the north. The city covers an area of approximately 15 square miles, and is home to a population of approximately 22,000 people.
The city is divided into two distinct areas: the island of Venice, which is located on the Gulf of Mexico, and the mainland, which is located on the Myakka River. The island of Venice is connected to the mainland by two bridges, the Venice Avenue Bridge and the Circus Bridge. The city is also home to several parks, including the Venice Beach Park, the Venice Fishing Pier, and the Venice Municipal Airport.
History
The area that is now Venice was first inhabited by the Calusa Indians, who lived in the area for thousands of years before the arrival of Europeans. The first Europeans to settle in the area were Spanish explorers, who arrived in the late 1500s. The area was then claimed by the United States in 1821, and was later incorporated as a city in 1927.
The city was named after Venice, Italy, due to its canals and waterways. The city was originally developed as a resort town, and was home to several large hotels and resorts. The city was also home to a large fishing industry, and was known for its production of mullet, shrimp, and other seafood.
Economy
The economy of Venice is largely based on tourism, with the city’s beaches and downtown area being popular destinations for visitors. The city is also home to several large businesses, including the Venice Regional Medical Center, the Venice Yacht Club, and the Venice Airport.
The city is also home to several manufacturing companies, including the Venice Boat Works, which produces boats and other marine vessels. The city is also home to several retail stores, restaurants, and other businesses.
Demographics
As of the 2010 census, the population of Venice was 22,000. The city is predominantly white, with approximately 85% of the population being white. The city is also home to a large Hispanic population, with approximately 10% of the population being Hispanic. The city is also home to a small African American population, with approximately 3% of the population being African American.
The median household income in Venice is approximately $50,000, and the median home value is approximately $200,000. The city is also home to a large number of retirees, with approximately 25% of the population being over the age of 65.
Conclusion
Venice, Florida is a beautiful city located on the Gulf Coast of Florida. It is known for its beautiful beaches, its vibrant downtown area, and its unique history. The city is home to a diverse population, and its economy is largely based on tourism and manufacturing. The city is also home to several large businesses, and is a popular destination for retirees.
Common Questions
What is Per Capita Income in Venice?
Per Capita income in Venice is $71,275.
What is the Median Family Income in Venice?
Median Family Income in Venice is $98,812.
What is the Median Household income in Venice?
Median Household Income in Venice is $68,843.
What is Income or Wage Gap in Venice?
Income or Wage Gap in Venice is 50.1%.
Women in Venice earn 49.9 cents for every dollar earned by a man.
What is Inequality or Gini Index in Venice?
Inequality or Gini Index in Venice is 0.61.
What is the Total Population of Venice?
Total Population of Venice is 25,710.
What is the Total Male Population of Venice?
Total Male Population of Venice is 11,457.
What is the Total Female Population of Venice?
Total Female Population of Venice is 14,253.
What is the Ratio of Males per 100 Females in Venice?
There are 80.38 Males per 100 Females in Venice.
What is the Ratio of Females per 100 Males in Venice?
There are 124.40 Females per 100 Males in Venice.
What is the Median Population Age in Venice?
Median Population Age in Venice is 68.8 Years.
What is the Average Family Size in Venice
Average Family Size in Venice is 2.3 People.
What is the Average Household Size in Venice
Average Household Size in Venice is 1.8 People.
How Large is the Labor Force in Venice?
There are 7,545 People in the Labor Forcein in Venice.
What is the Percentage of People in the Labor Force in Venice?
30.7% of People are in the Labor Force in Venice.
What is the Unemployment Rate in Venice?
Unemployment Rate in Venice is 4.0%.