Ensley, FL Map & Demographics
Ensley Map
Ensley Overview
$31,494
PER CAPITA INCOME
$64,825
AVG FAMILY INCOME
$57,232
AVG HOUSEHOLD INCOME
32.5%
WAGE / INCOME GAP [ % ]
67.5¢/ $1
WAGE / INCOME GAP [ $ ]
$8,236
FAMILY INCOME DEFICIT
0.41
INEQUALITY / GINI INDEX
22,148
TOTAL POPULATION
11,054
MALE POPULATION
11,094
FEMALE POPULATION
99.64
MALES / 100 FEMALES
100.36
FEMALES / 100 MALES
38.2
MEDIAN AGE
2.9
AVG FAMILY SIZE
2.2
AVG HOUSEHOLD SIZE
11,777
LABOR FORCE [ PEOPLE ]
64.0%
PERCENT IN LABOR FORCE
6.0%
UNEMPLOYMENT RATE
Income in Ensley
Income Overview in Ensley
Per Capita Income in Ensley is $31,494, while median incomes of families and households are $64,825 and $57,232 respectively.
| Characteristic | Number | Measure |
| Per Capita Income | 22,148 | $31,494 |
| Median Family Income | 5,841 | $64,825 |
| Mean Family Income | 5,841 | $81,752 |
| Median Household Income | 9,780 | $57,232 |
| Mean Household Income | 9,780 | $71,614 |
| Income Deficit | 5,841 | $8,236 |
| Wage / Income Gap (%) | 22,148 | 32.47% |
| Wage / Income Gap ($) | 22,148 | 67.53¢ per $1 |
| Gini / Inequality Index | 22,148 | 0.41 |
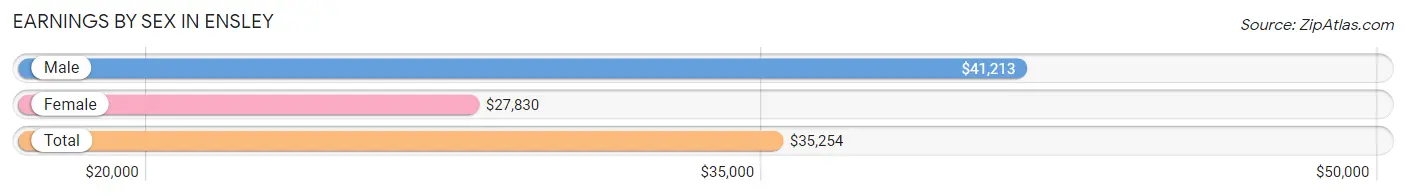
Earnings by Sex in Ensley
Average Earnings in Ensley are $35,254, $41,213 for men and $27,830 for women, a difference of 32.5%.
| Sex | Number | Average Earnings |
| Male | 6,839 (55.4%) | $41,213 |
| Female | 5,513 (44.6%) | $27,830 |
| Total | 12,352 (100.0%) | $35,254 |
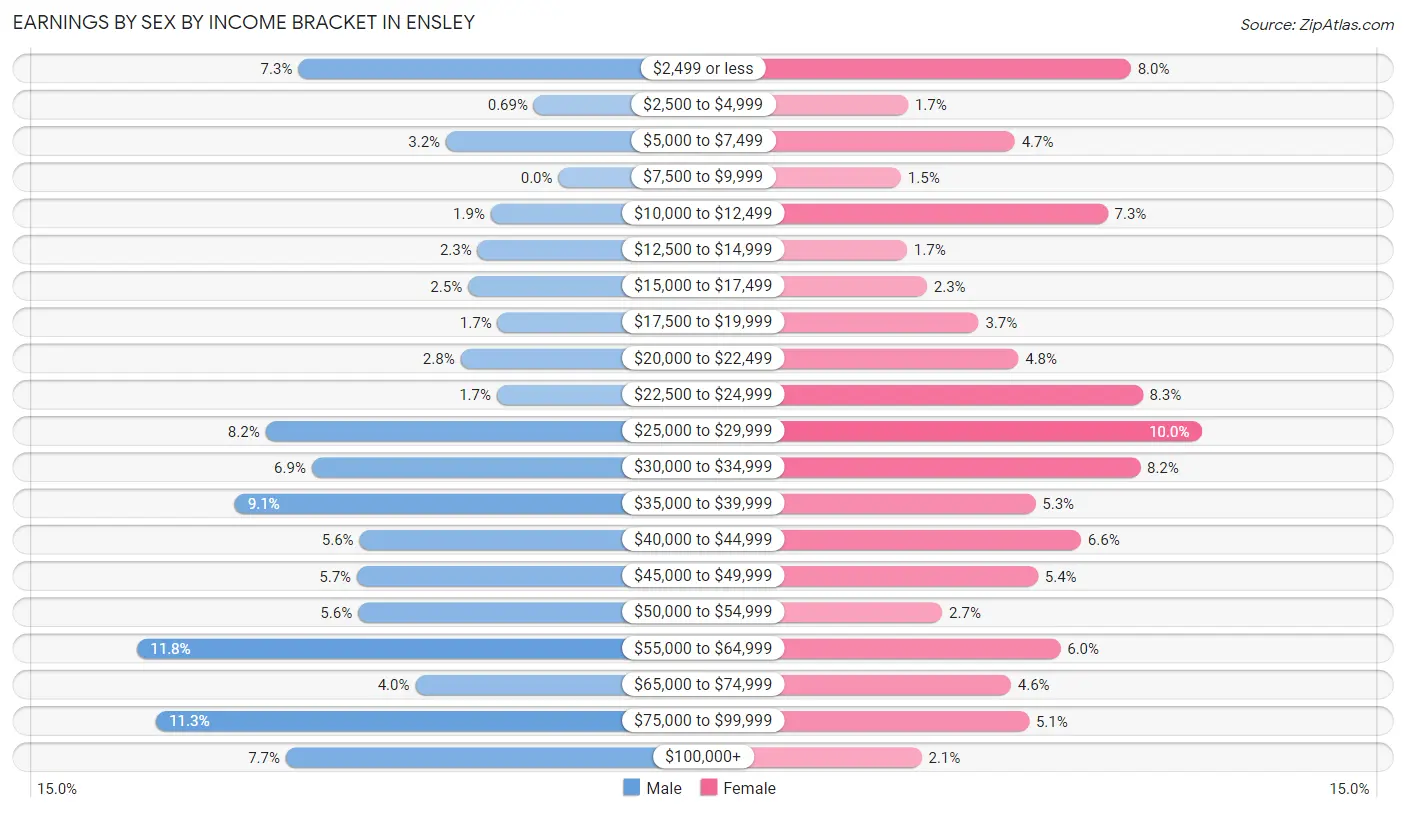
Earnings by Sex by Income Bracket in Ensley
The most common earnings brackets in Ensley are $55,000 to $64,999 for men (809 | 11.8%) and $25,000 to $29,999 for women (549 | 10.0%).
| Income | Male | Female |
| $2,499 or less | 500 (7.3%) | 440 (8.0%) |
| $2,500 to $4,999 | 47 (0.7%) | 95 (1.7%) |
| $5,000 to $7,499 | 216 (3.2%) | 260 (4.7%) |
| $7,500 to $9,999 | 0 (0.0%) | 84 (1.5%) |
| $10,000 to $12,499 | 130 (1.9%) | 404 (7.3%) |
| $12,500 to $14,999 | 155 (2.3%) | 93 (1.7%) |
| $15,000 to $17,499 | 174 (2.5%) | 124 (2.2%) |
| $17,500 to $19,999 | 117 (1.7%) | 204 (3.7%) |
| $20,000 to $22,499 | 188 (2.8%) | 266 (4.8%) |
| $22,500 to $24,999 | 118 (1.7%) | 458 (8.3%) |
| $25,000 to $29,999 | 563 (8.2%) | 549 (10.0%) |
| $30,000 to $34,999 | 474 (6.9%) | 454 (8.2%) |
| $35,000 to $39,999 | 622 (9.1%) | 292 (5.3%) |
| $40,000 to $44,999 | 382 (5.6%) | 363 (6.6%) |
| $45,000 to $49,999 | 387 (5.7%) | 296 (5.4%) |
| $50,000 to $54,999 | 385 (5.6%) | 148 (2.7%) |
| $55,000 to $64,999 | 809 (11.8%) | 331 (6.0%) |
| $65,000 to $74,999 | 275 (4.0%) | 254 (4.6%) |
| $75,000 to $99,999 | 773 (11.3%) | 282 (5.1%) |
| $100,000+ | 524 (7.7%) | 116 (2.1%) |
| Total | 6,839 (100.0%) | 5,513 (100.0%) |
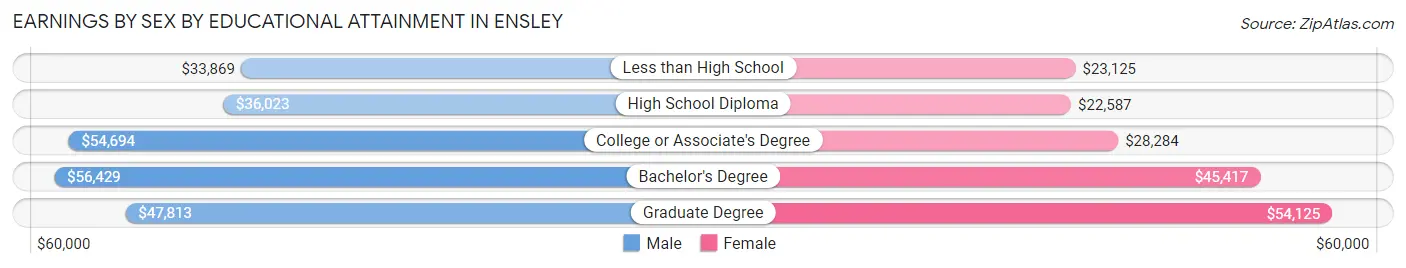
Earnings by Sex by Educational Attainment in Ensley
Average earnings in Ensley are $45,290 for men and $28,513 for women, a difference of 37.0%. Men with an educational attainment of bachelor's degree enjoy the highest average annual earnings of $56,429, while those with less than high school education earn the least with $33,869. Women with an educational attainment of graduate degree earn the most with the average annual earnings of $54,125, while those with high school diploma education have the smallest earnings of $22,587.
| Educational Attainment | Male Income | Female Income |
| Less than High School | $33,869 | $23,125 |
| High School Diploma | $36,023 | $22,587 |
| College or Associate's Degree | $54,694 | $28,284 |
| Bachelor's Degree | $56,429 | $45,417 |
| Graduate Degree | $47,813 | $54,125 |
| Total | $45,290 | $28,513 |
Family Income in Ensley
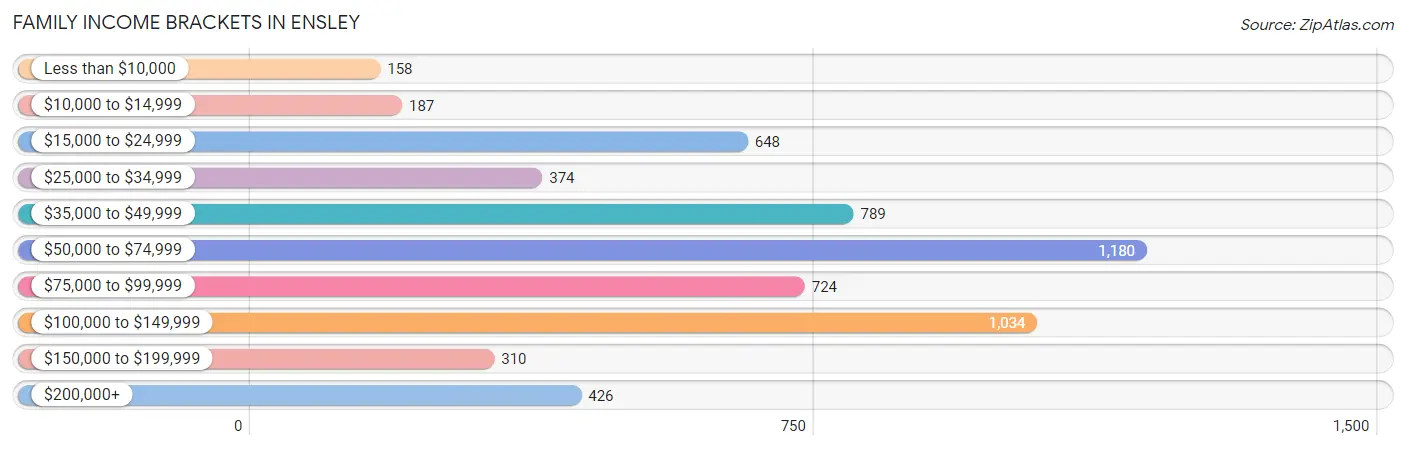
Family Income Brackets in Ensley
According to the Ensley family income data, there are 1,180 families falling into the $50,000 to $74,999 income range, which is the most common income bracket and makes up 20.2% of all families. Conversely, the less than $10,000 income bracket is the least frequent group with only 158 families (2.7%) belonging to this category.
| Income Bracket | # Families | % Families |
| Less than $10,000 | 158 | 2.7% |
| $10,000 to $14,999 | 187 | 3.2% |
| $15,000 to $24,999 | 648 | 11.1% |
| $25,000 to $34,999 | 374 | 6.4% |
| $35,000 to $49,999 | 789 | 13.5% |
| $50,000 to $74,999 | 1,180 | 20.2% |
| $75,000 to $99,999 | 724 | 12.4% |
| $100,000 to $149,999 | 1,034 | 17.7% |
| $150,000 to $199,999 | 310 | 5.3% |
| $200,000+ | 426 | 7.3% |
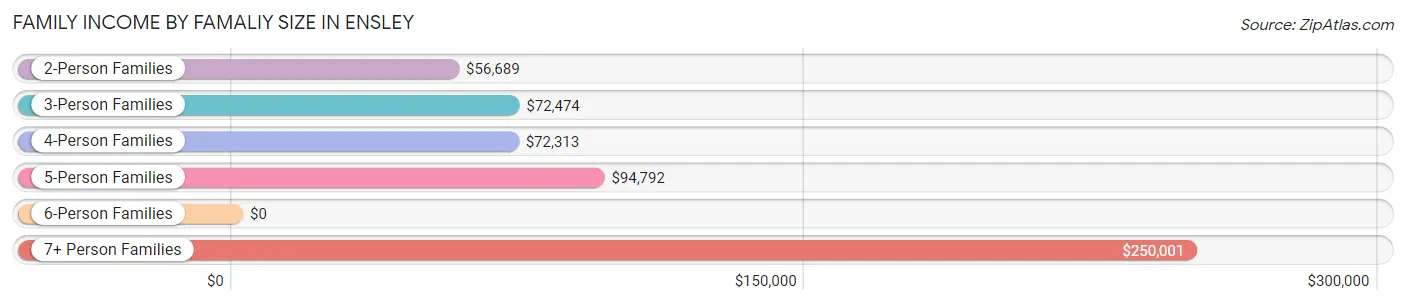
Family Income by Famaliy Size in Ensley
7+ person families (93 | 1.6%) account for the highest median family income in Ensley with $250,001 per family, while 7+ person families (93 | 1.6%) have the highest median income of $35,714 per family member.
| Income Bracket | # Families | Median Income |
| 2-Person Families | 3,245 (55.6%) | $56,689 |
| 3-Person Families | 1,103 (18.9%) | $72,474 |
| 4-Person Families | 1,060 (18.1%) | $72,313 |
| 5-Person Families | 317 (5.4%) | $94,792 |
| 6-Person Families | 23 (0.4%) | $0 |
| 7+ Person Families | 93 (1.6%) | $250,001 |
| Total | 5,841 (100.0%) | $64,825 |
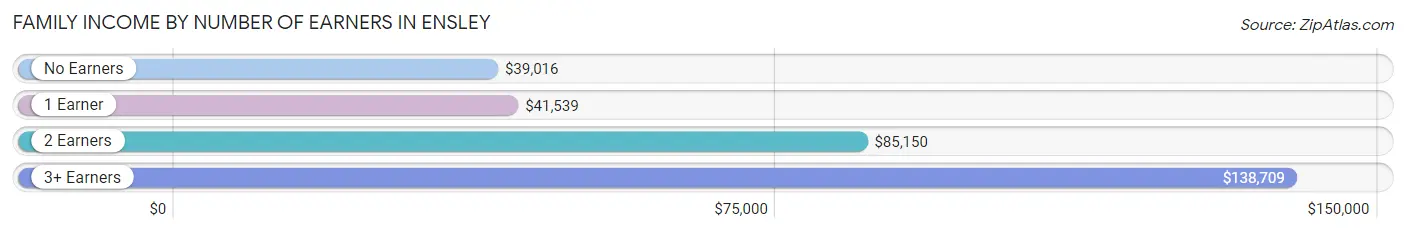
Family Income by Number of Earners in Ensley
The median family income in Ensley is $64,825, with families comprising 3+ earners (729) having the highest median family income of $138,709, while families with no earners (1,078) have the lowest median family income of $39,016, accounting for 12.5% and 18.5% of families, respectively.
| Number of Earners | # Families | Median Income |
| No Earners | 1,078 (18.5%) | $39,016 |
| 1 Earner | 1,945 (33.3%) | $41,539 |
| 2 Earners | 2,089 (35.8%) | $85,150 |
| 3+ Earners | 729 (12.5%) | $138,709 |
| Total | 5,841 (100.0%) | $64,825 |
Household Income in Ensley
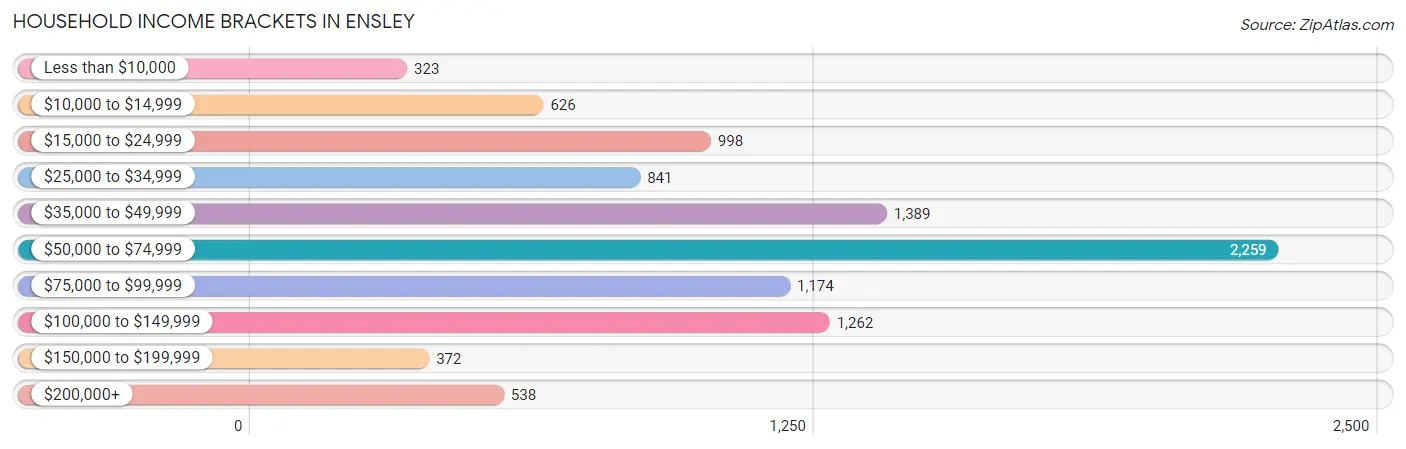
Household Income Brackets in Ensley
With 2,259 households falling in the category, the $50,000 to $74,999 income range is the most frequent in Ensley, accounting for 23.1% of all households. In contrast, only 323 households (3.3%) fall into the less than $10,000 income bracket, making it the least populous group.
| Income Bracket | # Households | % Households |
| Less than $10,000 | 323 | 3.3% |
| $10,000 to $14,999 | 626 | 6.4% |
| $15,000 to $24,999 | 998 | 10.2% |
| $25,000 to $34,999 | 841 | 8.6% |
| $35,000 to $49,999 | 1,389 | 14.2% |
| $50,000 to $74,999 | 2,259 | 23.1% |
| $75,000 to $99,999 | 1,174 | 12.0% |
| $100,000 to $149,999 | 1,262 | 12.9% |
| $150,000 to $199,999 | 372 | 3.8% |
| $200,000+ | 538 | 5.5% |
Household Income by Householder Age in Ensley
The median household income in Ensley is $57,232, with the highest median household income of $68,636 found in the 15 to 24 years age bracket for the primary householder. A total of 464 households (4.7%) fall into this category. Meanwhile, the 65+ years age bracket for the primary householder has the lowest median household income of $53,070, with 2,497 households (25.5%) in this group.
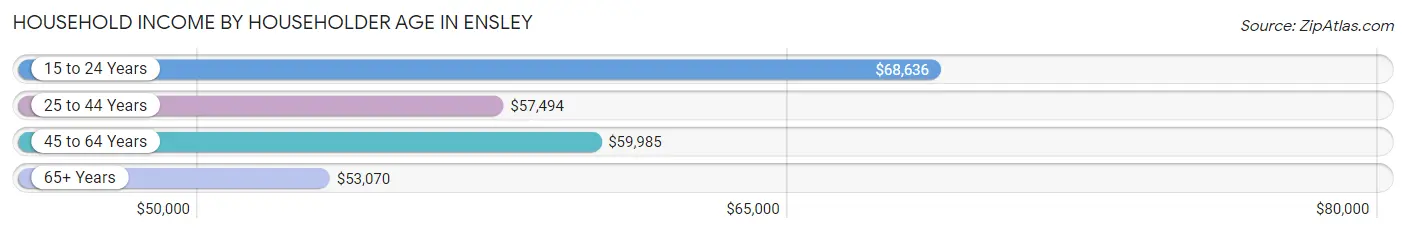
| Income Bracket | # Households | Median Income |
| 15 to 24 Years | 464 (4.7%) | $68,636 |
| 25 to 44 Years | 3,825 (39.1%) | $57,494 |
| 45 to 64 Years | 2,994 (30.6%) | $59,985 |
| 65+ Years | 2,497 (25.5%) | $53,070 |
| Total | 9,780 (100.0%) | $57,232 |
Poverty in Ensley
Income Below Poverty by Sex and Age in Ensley
With 10.5% poverty level for males and 21.2% for females among the residents of Ensley, 5 year old males and 16 and 17 year old females are the most vulnerable to poverty, with 72 males (35.3%) and 113 females (79.0%) in their respective age groups living below the poverty level.
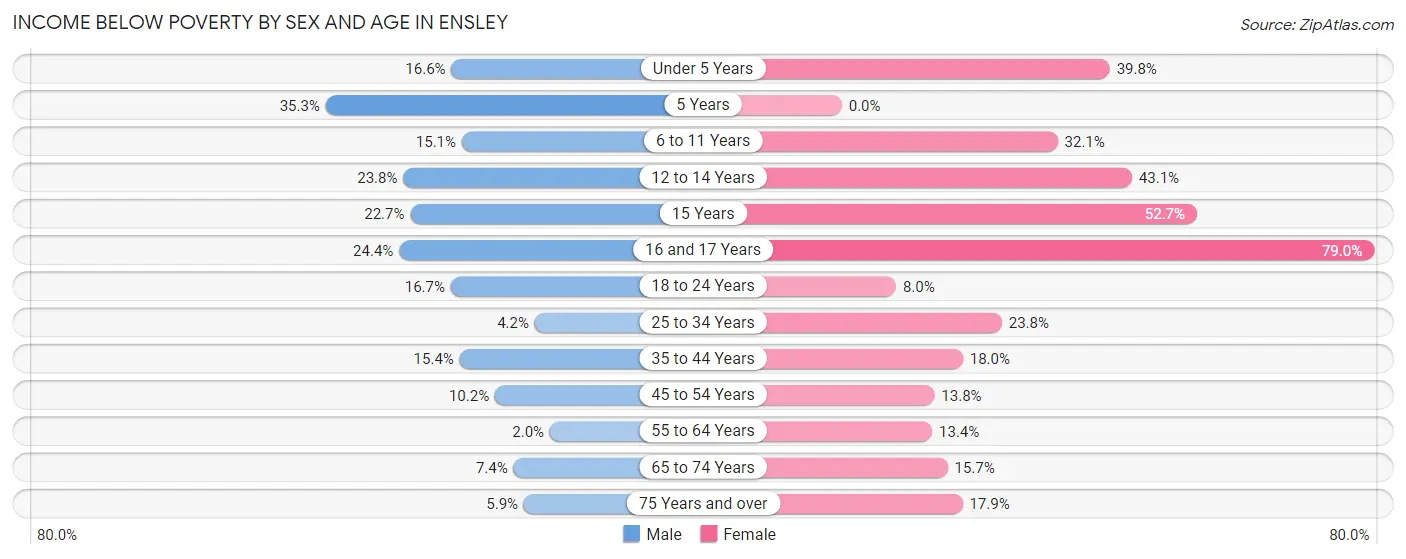
| Age Bracket | Male | Female |
| Under 5 Years | 64 (16.6%) | 181 (39.8%) |
| 5 Years | 72 (35.3%) | 0 (0.0%) |
| 6 to 11 Years | 85 (15.1%) | 317 (32.1%) |
| 12 to 14 Years | 92 (23.8%) | 137 (43.1%) |
| 15 Years | 15 (22.7%) | 97 (52.7%) |
| 16 and 17 Years | 109 (24.4%) | 113 (79.0%) |
| 18 to 24 Years | 142 (16.7%) | 62 (8.0%) |
| 25 to 34 Years | 92 (4.2%) | 495 (23.8%) |
| 35 to 44 Years | 201 (15.4%) | 221 (18.0%) |
| 45 to 54 Years | 129 (10.2%) | 139 (13.8%) |
| 55 to 64 Years | 33 (2.0%) | 223 (13.4%) |
| 65 to 74 Years | 80 (7.4%) | 189 (15.7%) |
| 75 Years and over | 30 (5.9%) | 174 (17.9%) |
| Total | 1,144 (10.5%) | 2,348 (21.2%) |
Income Above Poverty by Sex and Age in Ensley
According to the poverty statistics in Ensley, males aged 55 to 64 years and females aged 5 years are the age groups that are most secure financially, with 98.0% of males and 100.0% of females in these age groups living above the poverty line.
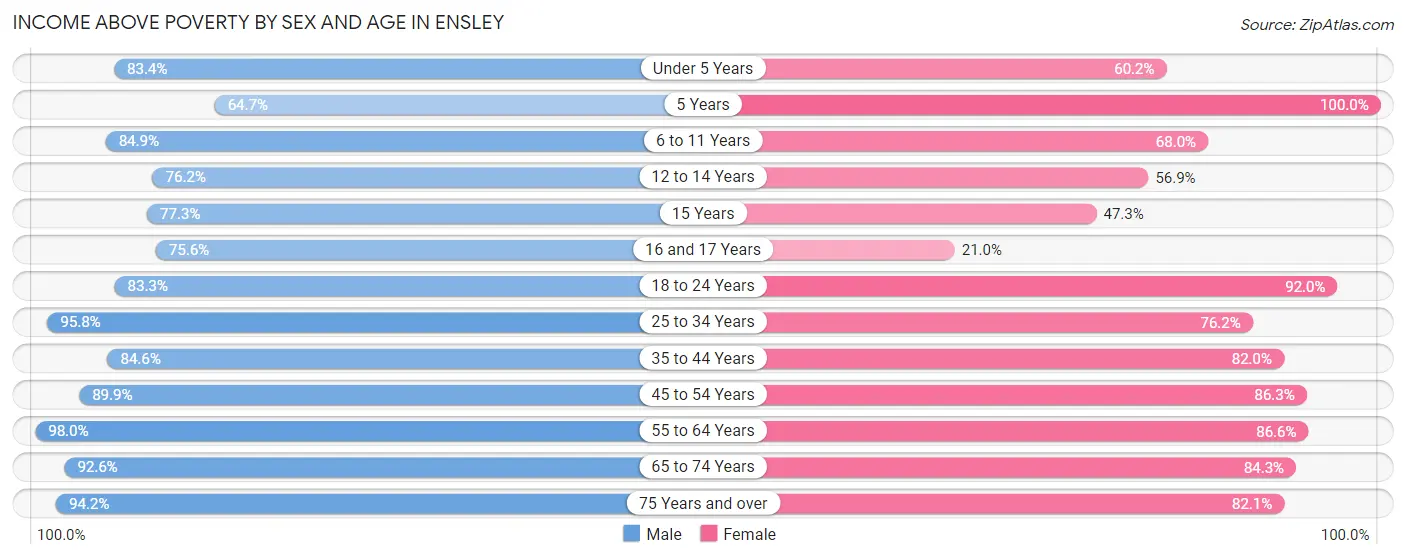
| Age Bracket | Male | Female |
| Under 5 Years | 321 (83.4%) | 274 (60.2%) |
| 5 Years | 132 (64.7%) | 55 (100.0%) |
| 6 to 11 Years | 479 (84.9%) | 672 (67.9%) |
| 12 to 14 Years | 295 (76.2%) | 181 (56.9%) |
| 15 Years | 51 (77.3%) | 87 (47.3%) |
| 16 and 17 Years | 338 (75.6%) | 30 (21.0%) |
| 18 to 24 Years | 708 (83.3%) | 709 (92.0%) |
| 25 to 34 Years | 2,079 (95.8%) | 1,588 (76.2%) |
| 35 to 44 Years | 1,104 (84.6%) | 1,009 (82.0%) |
| 45 to 54 Years | 1,142 (89.8%) | 872 (86.3%) |
| 55 to 64 Years | 1,626 (98.0%) | 1,440 (86.6%) |
| 65 to 74 Years | 1,001 (92.6%) | 1,014 (84.3%) |
| 75 Years and over | 483 (94.2%) | 797 (82.1%) |
| Total | 9,759 (89.5%) | 8,728 (78.8%) |
Income Below Poverty Among Married-Couple Families in Ensley
The poverty statistics for married-couple families in Ensley show that 4.8% or 174 of the total 3,606 families live below the poverty line. Families with 3 or 4 children have the highest poverty rate of 40.9%, comprising of 27 families. On the other hand, families with 5 or more children have the lowest poverty rate of 0.0%, which includes 0 families.
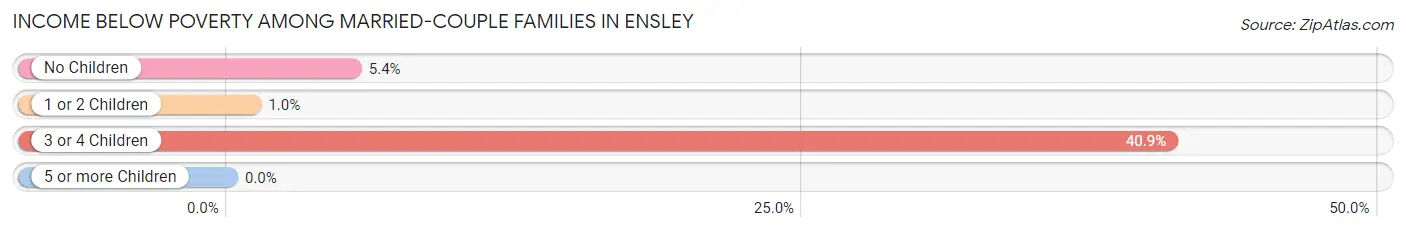
| Children | Above Poverty | Below Poverty |
| No Children | 2,405 (94.6%) | 137 (5.4%) |
| 1 or 2 Children | 969 (99.0%) | 10 (1.0%) |
| 3 or 4 Children | 39 (59.1%) | 27 (40.9%) |
| 5 or more Children | 19 (100.0%) | 0 (0.0%) |
| Total | 3,432 (95.2%) | 174 (4.8%) |
Income Below Poverty Among Single-Parent Households in Ensley
According to the poverty data in Ensley, 17.7% or 117 single-father households and 29.5% or 465 single-mother households are living below the poverty line. Among single-father households, those with 1 or 2 children have the highest poverty rate, with 117 households (44.0%) experiencing poverty. Likewise, among single-mother households, those with 5 or more children have the highest poverty rate, with 10 households (100.0%) falling below the poverty line.
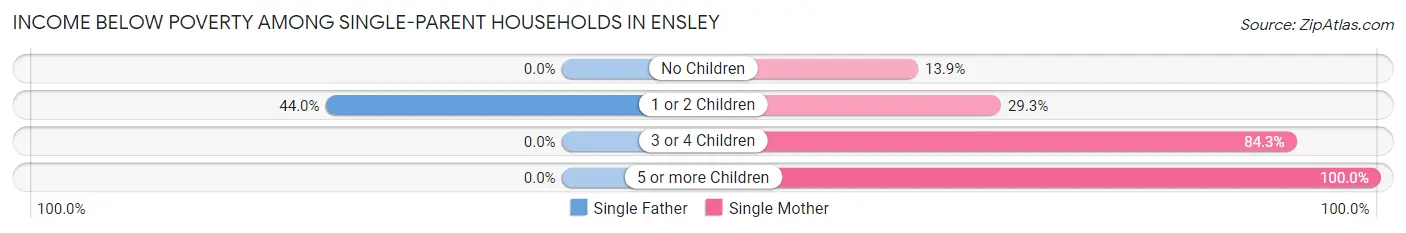
| Children | Single Father | Single Mother |
| No Children | 0 (0.0%) | 79 (13.9%) |
| 1 or 2 Children | 117 (44.0%) | 247 (29.3%) |
| 3 or 4 Children | 0 (0.0%) | 129 (84.3%) |
| 5 or more Children | 0 (0.0%) | 10 (100.0%) |
| Total | 117 (17.7%) | 465 (29.5%) |
Income Below Poverty Among Married-Couple vs Single-Parent Households in Ensley
The poverty data for Ensley shows that 174 of the married-couple family households (4.8%) and 582 of the single-parent households (26.0%) are living below the poverty level. Within the married-couple family households, those with 3 or 4 children have the highest poverty rate, with 27 households (40.9%) falling below the poverty line. Among the single-parent households, those with 5 or more children have the highest poverty rate, with 10 household (100.0%) living below poverty.
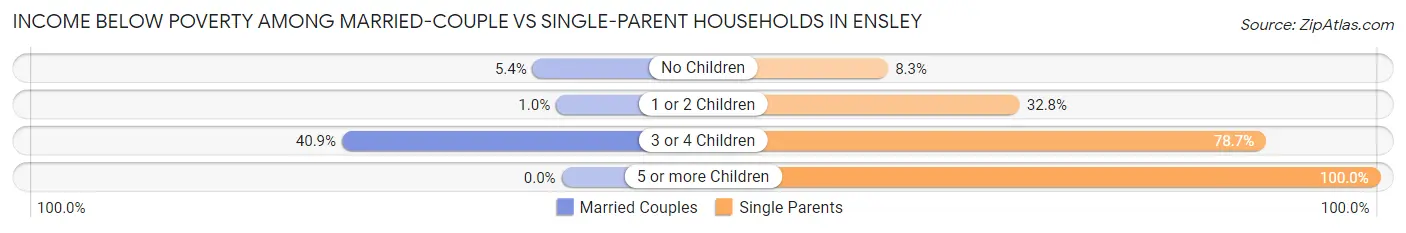
| Children | Married-Couple Families | Single-Parent Households |
| No Children | 137 (5.4%) | 79 (8.3%) |
| 1 or 2 Children | 10 (1.0%) | 364 (32.8%) |
| 3 or 4 Children | 27 (40.9%) | 129 (78.7%) |
| 5 or more Children | 0 (0.0%) | 10 (100.0%) |
| Total | 174 (4.8%) | 582 (26.0%) |
Race in Ensley
The most populous races in Ensley are White / Caucasian (12,355 | 55.8%), Black / African American (6,188 | 27.9%), and Hispanic or Latino (1,833 | 8.3%).
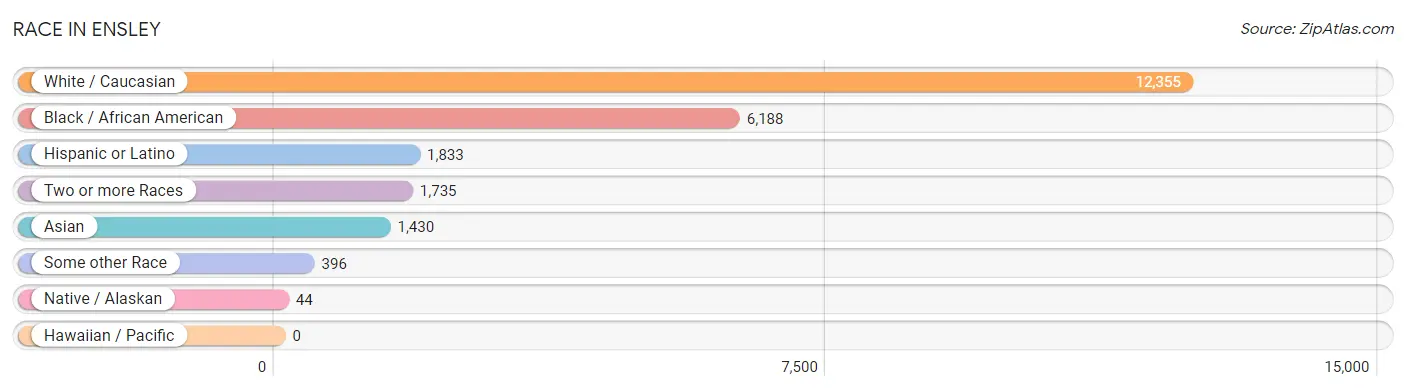
| Race | # Population | % Population |
| Asian | 1,430 | 6.5% |
| Black / African American | 6,188 | 27.9% |
| Hawaiian / Pacific | 0 | 0.0% |
| Hispanic or Latino | 1,833 | 8.3% |
| Native / Alaskan | 44 | 0.2% |
| White / Caucasian | 12,355 | 55.8% |
| Two or more Races | 1,735 | 7.8% |
| Some other Race | 396 | 1.8% |
| Total | 22,148 | 100.0% |
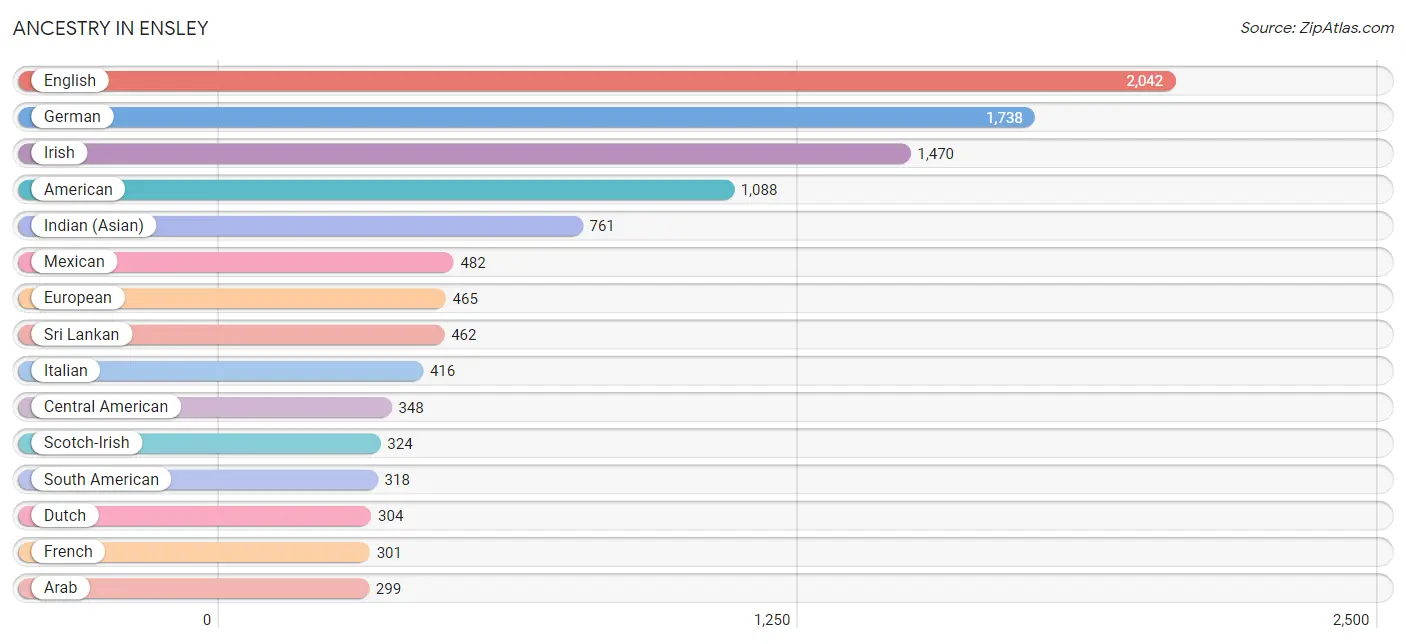
Ancestry in Ensley
The most populous ancestries reported in Ensley are English (2,042 | 9.2%), German (1,738 | 7.9%), Irish (1,470 | 6.6%), American (1,088 | 4.9%), and Indian (Asian) (761 | 3.4%), together accounting for 32.1% of all Ensley residents.
| Ancestry | # Population | % Population |
| African | 142 | 0.6% |
| American | 1,088 | 4.9% |
| Arab | 299 | 1.3% |
| Argentinean | 1 | 0.0% |
| Austrian | 56 | 0.3% |
| Bhutanese | 90 | 0.4% |
| Blackfeet | 26 | 0.1% |
| Brazilian | 21 | 0.1% |
| British | 44 | 0.2% |
| Burmese | 140 | 0.6% |
| Canadian | 196 | 0.9% |
| Central American | 348 | 1.6% |
| Cherokee | 8 | 0.0% |
| Choctaw | 34 | 0.2% |
| Colombian | 139 | 0.6% |
| Creek | 61 | 0.3% |
| Croatian | 22 | 0.1% |
| Cuban | 25 | 0.1% |
| Czech | 17 | 0.1% |
| Czechoslovakian | 29 | 0.1% |
| Dominican | 74 | 0.3% |
| Dutch | 304 | 1.4% |
| Eastern European | 146 | 0.7% |
| Ecuadorian | 15 | 0.1% |
| English | 2,042 | 9.2% |
| European | 465 | 2.1% |
| Finnish | 10 | 0.1% |
| French | 301 | 1.4% |
| French American Indian | 7 | 0.0% |
| French Canadian | 97 | 0.4% |
| German | 1,738 | 7.9% |
| Greek | 202 | 0.9% |
| Honduran | 147 | 0.7% |
| Hungarian | 63 | 0.3% |
| Indian (Asian) | 761 | 3.4% |
| Irish | 1,470 | 6.6% |
| Italian | 416 | 1.9% |
| Jamaican | 54 | 0.2% |
| Korean | 292 | 1.3% |
| Lebanese | 50 | 0.2% |
| Mexican | 482 | 2.2% |
| Native Hawaiian | 169 | 0.8% |
| Nicaraguan | 24 | 0.1% |
| Northern European | 39 | 0.2% |
| Norwegian | 61 | 0.3% |
| Pakistani | 23 | 0.1% |
| Panamanian | 57 | 0.3% |
| Polish | 108 | 0.5% |
| Portuguese | 101 | 0.5% |
| Puerto Rican | 217 | 1.0% |
| Romanian | 50 | 0.2% |
| Russian | 103 | 0.5% |
| Salvadoran | 120 | 0.5% |
| Scandinavian | 15 | 0.1% |
| Scotch-Irish | 324 | 1.5% |
| Scottish | 258 | 1.2% |
| Seminole | 50 | 0.2% |
| Slavic | 18 | 0.1% |
| Slovak | 47 | 0.2% |
| South American | 318 | 1.4% |
| Spaniard | 44 | 0.2% |
| Spanish | 140 | 0.6% |
| Sri Lankan | 462 | 2.1% |
| Subsaharan African | 142 | 0.6% |
| Swedish | 100 | 0.4% |
| Swiss | 15 | 0.1% |
| Syrian | 56 | 0.3% |
| Thai | 56 | 0.3% |
| Ukrainian | 13 | 0.1% |
| Venezuelan | 163 | 0.7% |
| Welsh | 242 | 1.1% |
| Yugoslavian | 46 | 0.2% | View All 72 Rows |
Immigrants in Ensley
The most numerous immigrant groups reported in Ensley came from Asia (1,329 | 6.0%), Eastern Asia (741 | 3.4%), Latin America (707 | 3.2%), China (599 | 2.7%), and South Eastern Asia (560 | 2.5%), together accounting for 17.8% of all Ensley residents.
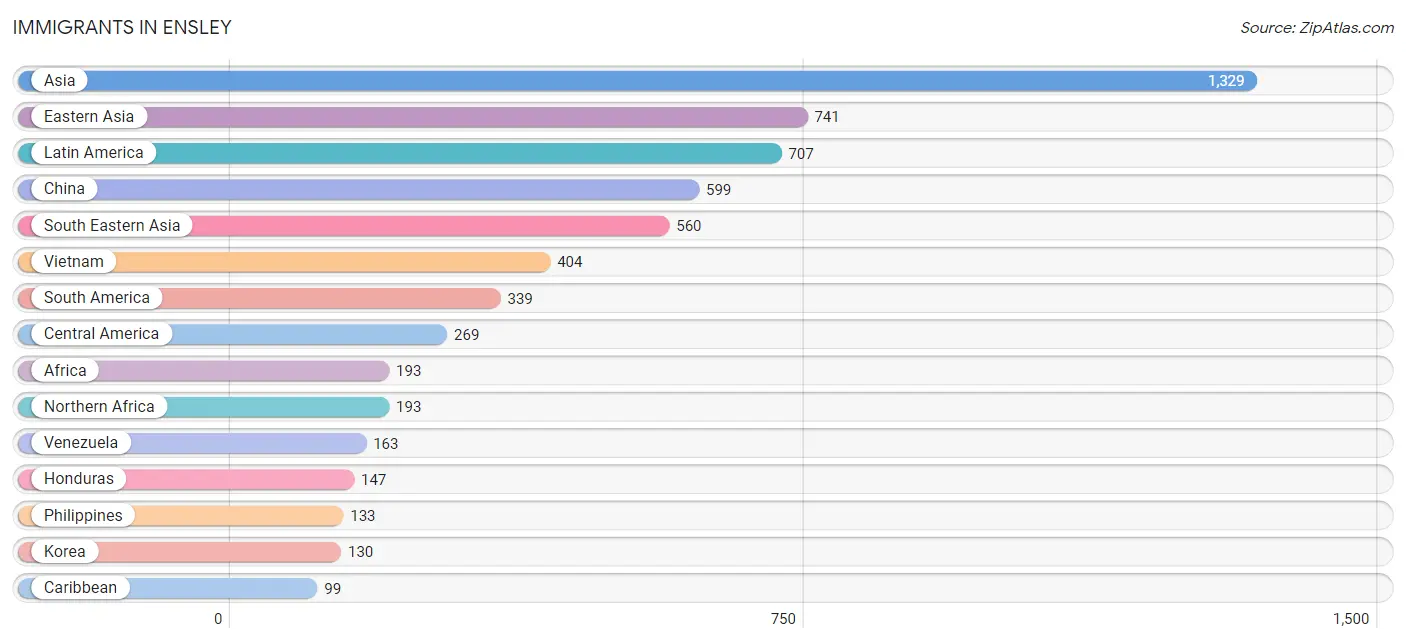
| Immigration Origin | # Population | % Population |
| Africa | 193 | 0.9% |
| Asia | 1,329 | 6.0% |
| Brazil | 53 | 0.2% |
| Canada | 62 | 0.3% |
| Caribbean | 99 | 0.4% |
| Central America | 269 | 1.2% |
| China | 599 | 2.7% |
| Colombia | 68 | 0.3% |
| Cuba | 87 | 0.4% |
| Eastern Asia | 741 | 3.4% |
| Eastern Europe | 42 | 0.2% |
| Ecuador | 15 | 0.1% |
| El Salvador | 48 | 0.2% |
| Europe | 88 | 0.4% |
| Germany | 2 | 0.0% |
| Honduras | 147 | 0.7% |
| Jamaica | 12 | 0.1% |
| Japan | 12 | 0.1% |
| Kazakhstan | 28 | 0.1% |
| Korea | 130 | 0.6% |
| Latin America | 707 | 3.2% |
| Mexico | 74 | 0.3% |
| Northern Africa | 193 | 0.9% |
| Northern Europe | 34 | 0.2% |
| Peru | 40 | 0.2% |
| Philippines | 133 | 0.6% |
| Scotland | 34 | 0.2% |
| South America | 339 | 1.5% |
| South Central Asia | 28 | 0.1% |
| South Eastern Asia | 560 | 2.5% |
| Southern Europe | 10 | 0.1% |
| Spain | 10 | 0.1% |
| Thailand | 23 | 0.1% |
| Ukraine | 42 | 0.2% |
| Venezuela | 163 | 0.7% |
| Vietnam | 404 | 1.8% |
| Western Europe | 2 | 0.0% | View All 37 Rows |
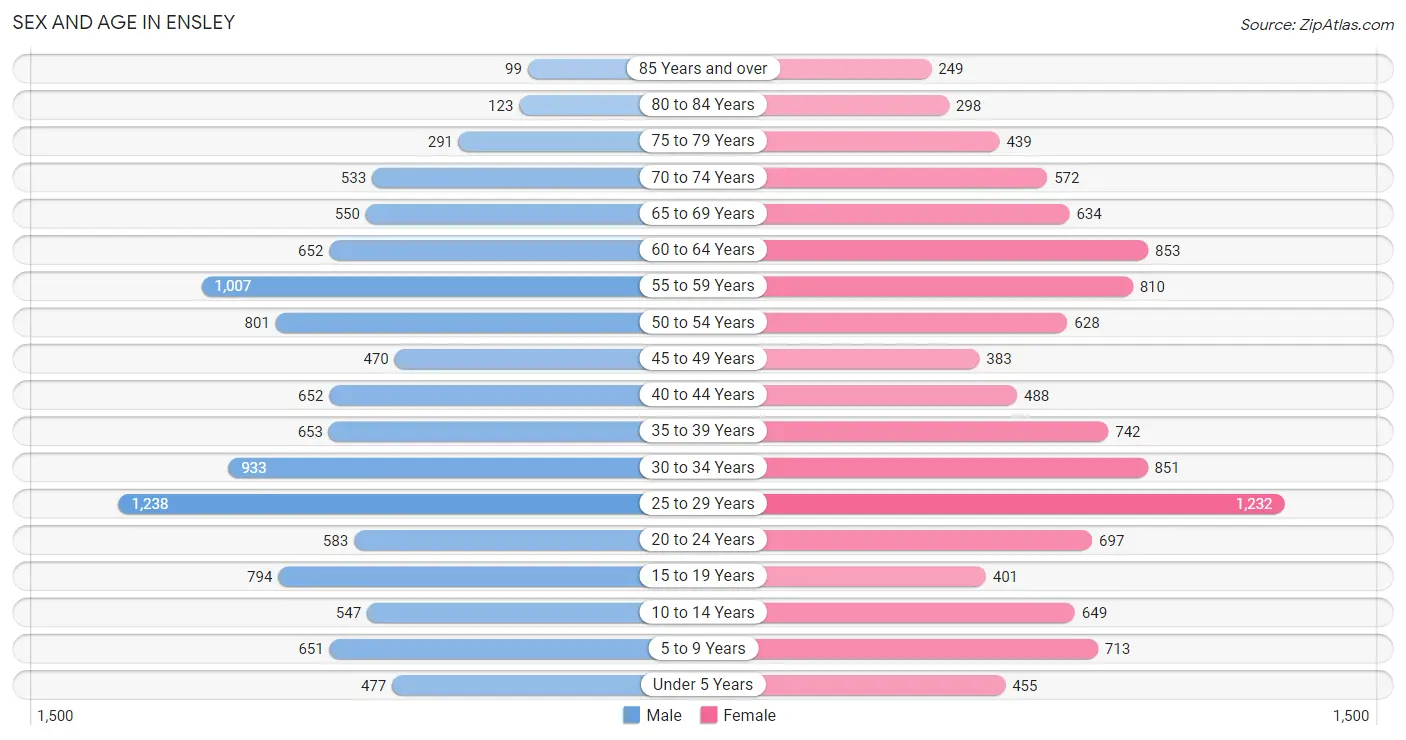
Sex and Age in Ensley
Sex and Age in Ensley
The most populous age groups in Ensley are 25 to 29 Years (1,238 | 11.2%) for men and 25 to 29 Years (1,232 | 11.1%) for women.
| Age Bracket | Male | Female |
| Under 5 Years | 477 (4.3%) | 455 (4.1%) |
| 5 to 9 Years | 651 (5.9%) | 713 (6.4%) |
| 10 to 14 Years | 547 (5.0%) | 649 (5.9%) |
| 15 to 19 Years | 794 (7.2%) | 401 (3.6%) |
| 20 to 24 Years | 583 (5.3%) | 697 (6.3%) |
| 25 to 29 Years | 1,238 (11.2%) | 1,232 (11.1%) |
| 30 to 34 Years | 933 (8.4%) | 851 (7.7%) |
| 35 to 39 Years | 653 (5.9%) | 742 (6.7%) |
| 40 to 44 Years | 652 (5.9%) | 488 (4.4%) |
| 45 to 49 Years | 470 (4.3%) | 383 (3.5%) |
| 50 to 54 Years | 801 (7.2%) | 628 (5.7%) |
| 55 to 59 Years | 1,007 (9.1%) | 810 (7.3%) |
| 60 to 64 Years | 652 (5.9%) | 853 (7.7%) |
| 65 to 69 Years | 550 (5.0%) | 634 (5.7%) |
| 70 to 74 Years | 533 (4.8%) | 572 (5.2%) |
| 75 to 79 Years | 291 (2.6%) | 439 (4.0%) |
| 80 to 84 Years | 123 (1.1%) | 298 (2.7%) |
| 85 Years and over | 99 (0.9%) | 249 (2.2%) |
| Total | 11,054 (100.0%) | 11,094 (100.0%) |
Families and Households in Ensley
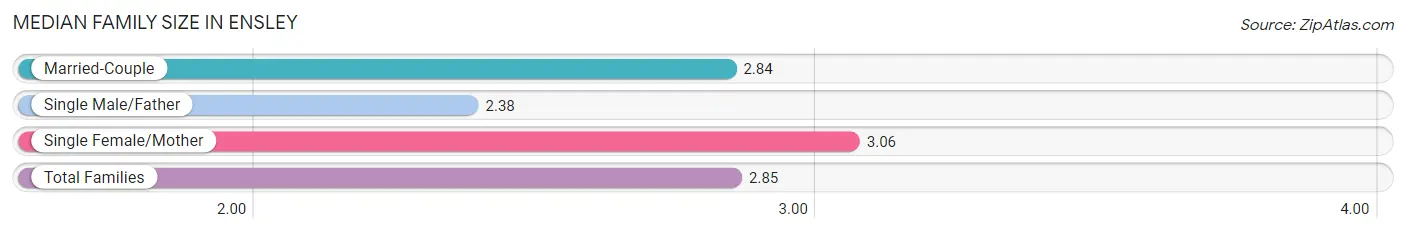
Median Family Size in Ensley
The median family size in Ensley is 2.85 persons per family, with single female/mother families (1,576 | 27.0%) accounting for the largest median family size of 3.06 persons per family. On the other hand, single male/father families (659 | 11.3%) represent the smallest median family size with 2.38 persons per family.
| Family Type | # Families | Family Size |
| Married-Couple | 3,606 (61.7%) | 2.84 |
| Single Male/Father | 659 (11.3%) | 2.38 |
| Single Female/Mother | 1,576 (27.0%) | 3.06 |
| Total Families | 5,841 (100.0%) | 2.85 |
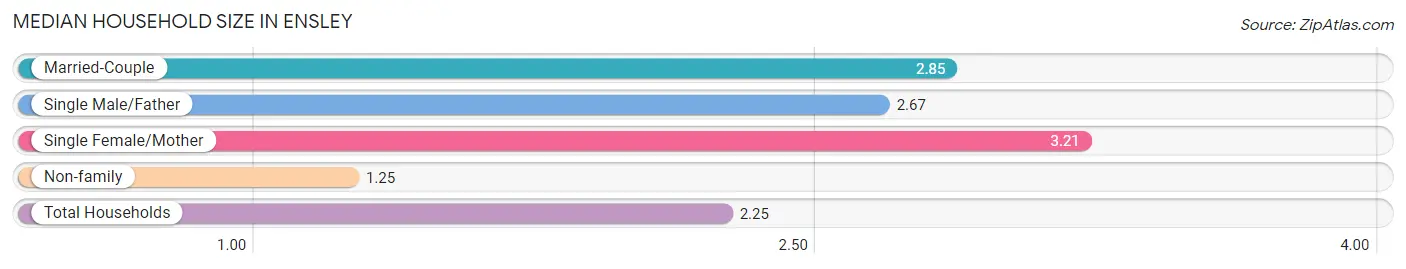
Median Household Size in Ensley
The median household size in Ensley is 2.25 persons per household, with single female/mother households (1,576 | 16.1%) accounting for the largest median household size of 3.21 persons per household. non-family households (3,939 | 40.3%) represent the smallest median household size with 1.25 persons per household.
| Household Type | # Households | Household Size |
| Married-Couple | 3,606 (36.9%) | 2.85 |
| Single Male/Father | 659 (6.7%) | 2.67 |
| Single Female/Mother | 1,576 (16.1%) | 3.21 |
| Non-family | 3,939 (40.3%) | 1.25 |
| Total Households | 9,780 (100.0%) | 2.25 |
Household Size by Marriage Status in Ensley
Out of a total of 9,780 households in Ensley, 5,841 (59.7%) are family households, while 3,939 (40.3%) are nonfamily households. The most numerous type of family households are 2-person households, comprising 3,002, and the most common type of nonfamily households are 1-person households, comprising 3,085.
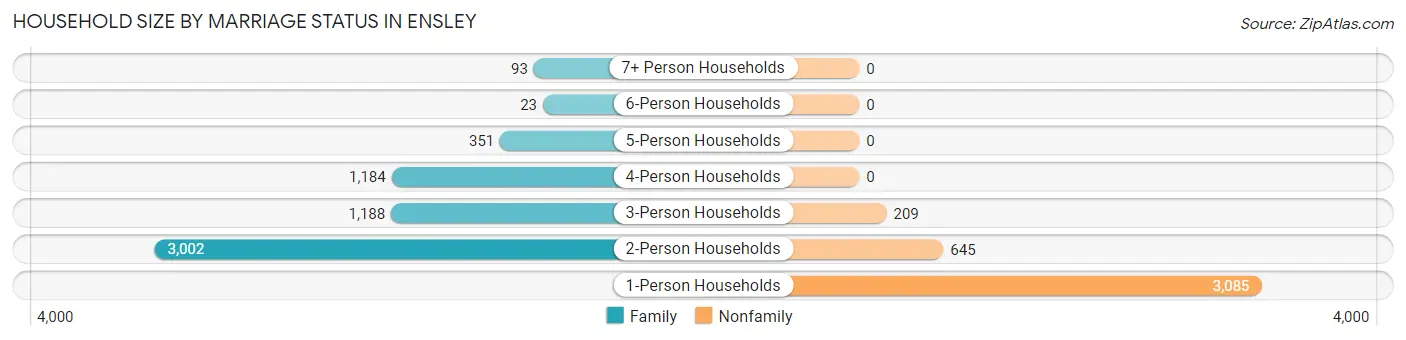
| Household Size | Family Households | Nonfamily Households |
| 1-Person Households | - | 3,085 (31.5%) |
| 2-Person Households | 3,002 (30.7%) | 645 (6.6%) |
| 3-Person Households | 1,188 (12.1%) | 209 (2.1%) |
| 4-Person Households | 1,184 (12.1%) | 0 (0.0%) |
| 5-Person Households | 351 (3.6%) | 0 (0.0%) |
| 6-Person Households | 23 (0.2%) | 0 (0.0%) |
| 7+ Person Households | 93 (0.9%) | 0 (0.0%) |
| Total | 5,841 (59.7%) | 3,939 (40.3%) |
Female Fertility in Ensley
Fertility by Age in Ensley
Average fertility rate in Ensley is 47.0 births per 1,000 women. Women in the age bracket of 20 to 34 years have the highest fertility rate with 68.0 births per 1,000 women. Women in the age bracket of 20 to 34 years acount for 82.3% of all women with births.
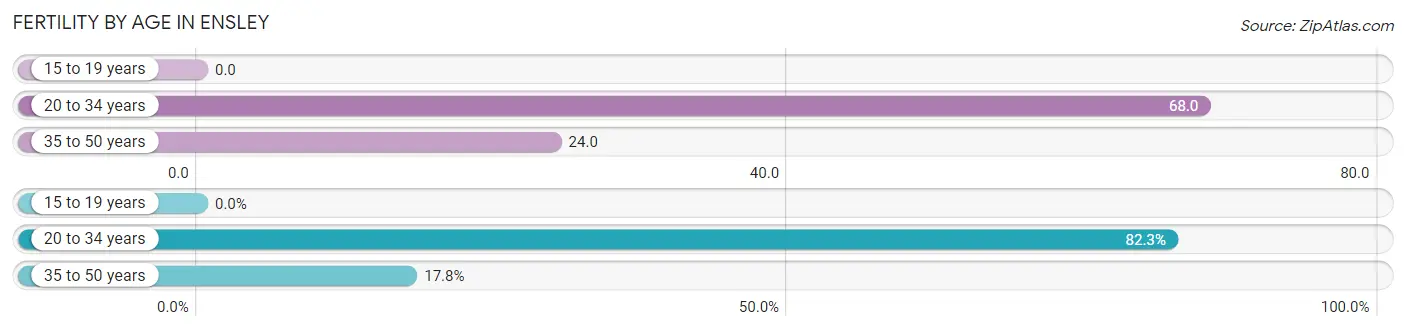
| Age Bracket | Women with Births | Births / 1,000 Women |
| 15 to 19 years | 0 (0.0%) | 0.0 |
| 20 to 34 years | 190 (82.3%) | 68.0 |
| 35 to 50 years | 41 (17.7%) | 24.0 |
| Total | 231 (100.0%) | 47.0 |
Fertility by Age by Marriage Status in Ensley
63.2% of women with births (231) in Ensley are married. The highest percentage of unmarried women with births falls into 35 to 50 years age bracket with 100.0% of them unmarried at the time of birth, while the lowest percentage of unmarried women with births belong to 20 to 34 years age bracket with 23.2% of them unmarried.
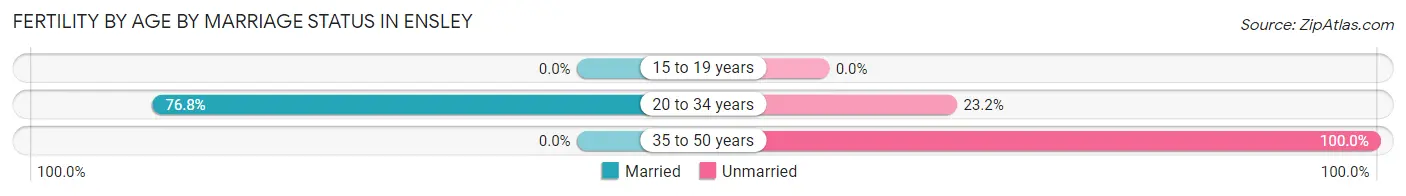
| Age Bracket | Married | Unmarried |
| 15 to 19 years | 0 (0.0%) | 0 (0.0%) |
| 20 to 34 years | 146 (76.8%) | 44 (23.2%) |
| 35 to 50 years | 0 (0.0%) | 41 (100.0%) |
| Total | 146 (63.2%) | 85 (36.8%) |
Fertility by Education in Ensley
Average fertility rate in Ensley is 47.0 births per 1,000 women. Women with the education attainment of graduate degree have the highest fertility rate of 76.0 births per 1,000 women, while women with the education attainment of bachelor's degree have the lowest fertility at 18.0 births per 1,000 women. Women with the education attainment of college or associate's degree represent 64.9% of all women with births.
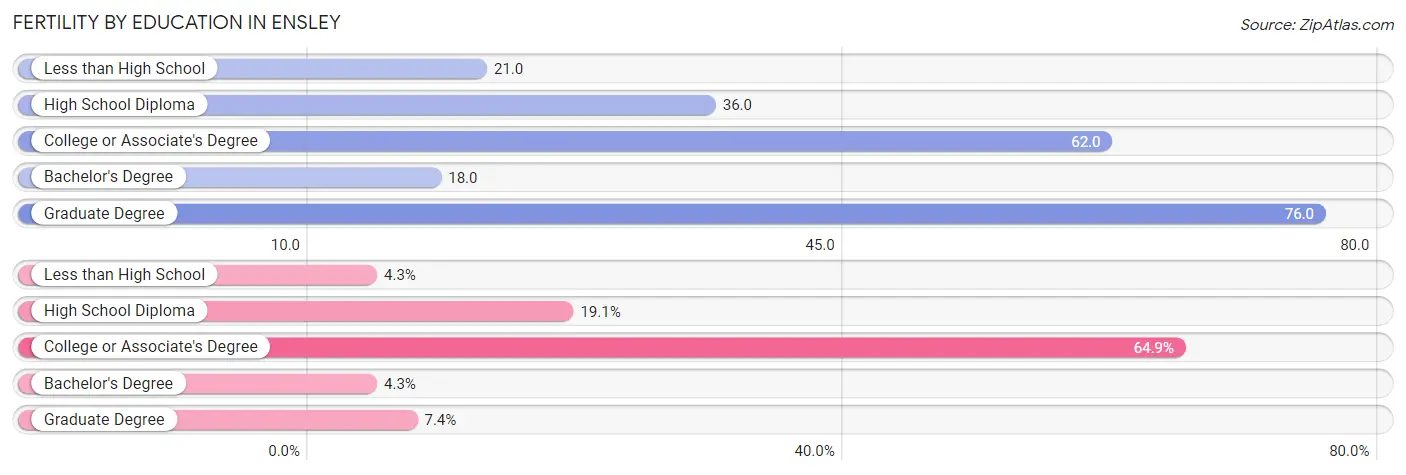
| Educational Attainment | Women with Births | Births / 1,000 Women |
| Less than High School | 10 (4.3%) | 21.0 |
| High School Diploma | 44 (19.1%) | 36.0 |
| College or Associate's Degree | 150 (64.9%) | 62.0 |
| Bachelor's Degree | 10 (4.3%) | 18.0 |
| Graduate Degree | 17 (7.4%) | 76.0 |
| Total | 231 (100.0%) | 47.0 |
Fertility by Education by Marriage Status in Ensley
36.8% of women with births in Ensley are unmarried. Women with the educational attainment of bachelor's degree are most likely to be married with 100.0% of them married at childbirth, while women with the educational attainment of less than high school are least likely to be married with 100.0% of them unmarried at childbirth.
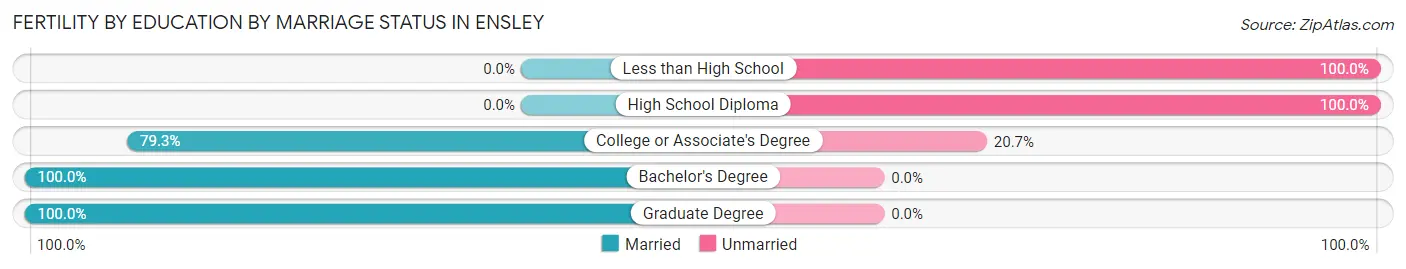
| Educational Attainment | Married | Unmarried |
| Less than High School | 0 (0.0%) | 10 (100.0%) |
| High School Diploma | 0 (0.0%) | 44 (100.0%) |
| College or Associate's Degree | 119 (79.3%) | 31 (20.7%) |
| Bachelor's Degree | 10 (100.0%) | 0 (0.0%) |
| Graduate Degree | 17 (100.0%) | 0 (0.0%) |
| Total | 146 (63.2%) | 85 (36.8%) |
Employment Characteristics in Ensley
Employment by Class of Employer in Ensley
Among the 10,800 employed individuals in Ensley, private company employees (7,330 | 67.9%), not-for-profit organizations (845 | 7.8%), and federal government employees (692 | 6.4%) make up the most common classes of employment.
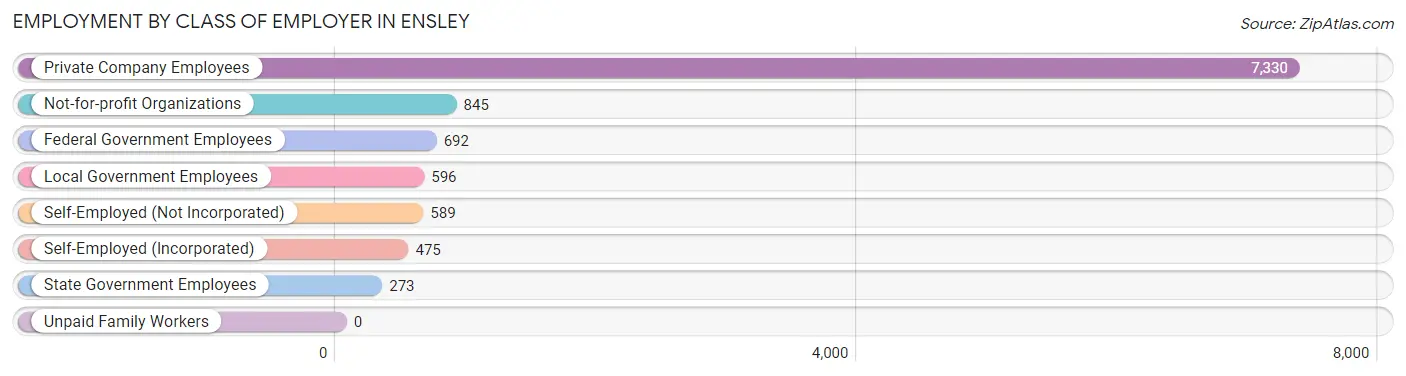
| Employer Class | # Employees | % Employees |
| Private Company Employees | 7,330 | 67.9% |
| Self-Employed (Incorporated) | 475 | 4.4% |
| Self-Employed (Not Incorporated) | 589 | 5.4% |
| Not-for-profit Organizations | 845 | 7.8% |
| Local Government Employees | 596 | 5.5% |
| State Government Employees | 273 | 2.5% |
| Federal Government Employees | 692 | 6.4% |
| Unpaid Family Workers | 0 | 0.0% |
| Total | 10,800 | 100.0% |
Employment Status by Age in Ensley
According to the labor force statistics for Ensley, out of the total population over 16 years of age (18,401), 64.0% or 11,777 individuals are in the labor force, with 6.0% or 707 of them unemployed. The age group with the highest labor force participation rate is 25 to 29 years, with 91.5% or 2,260 individuals in the labor force. Within the labor force, the 16 to 19 years age range has the highest percentage of unemployed individuals, with 23.2% or 101 of them being unemployed.
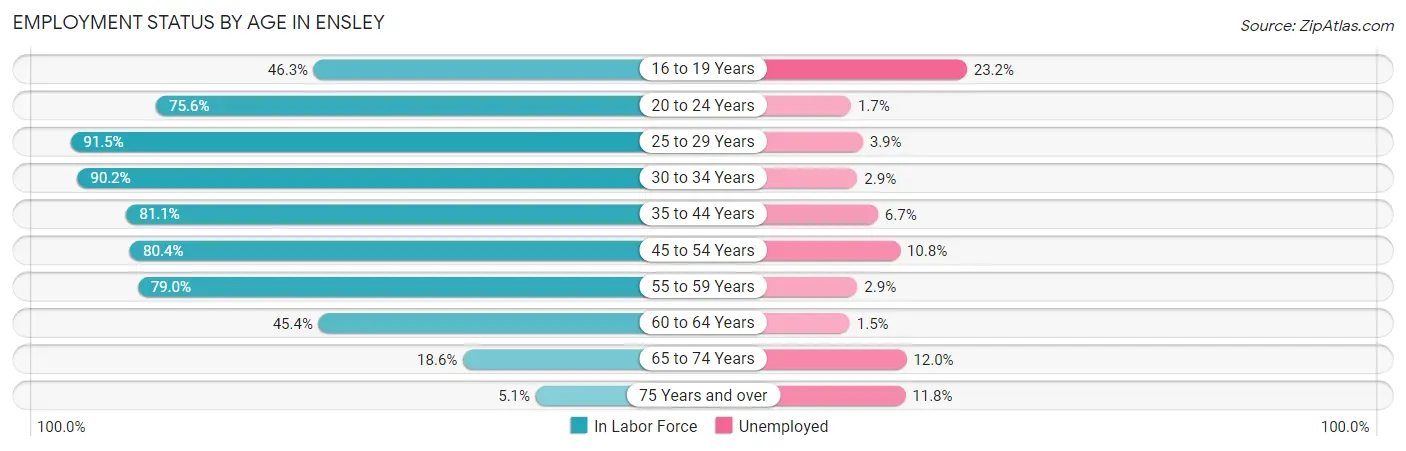
| Age Bracket | In Labor Force | Unemployed |
| 16 to 19 Years | 435 (46.3%) | 101 (23.2%) |
| 20 to 24 Years | 968 (75.6%) | 16 (1.7%) |
| 25 to 29 Years | 2,260 (91.5%) | 88 (3.9%) |
| 30 to 34 Years | 1,609 (90.2%) | 47 (2.9%) |
| 35 to 44 Years | 2,056 (81.1%) | 138 (6.7%) |
| 45 to 54 Years | 1,835 (80.4%) | 198 (10.8%) |
| 55 to 59 Years | 1,435 (79.0%) | 42 (2.9%) |
| 60 to 64 Years | 683 (45.4%) | 10 (1.5%) |
| 65 to 74 Years | 426 (18.6%) | 51 (12.0%) |
| 75 Years and over | 76 (5.1%) | 9 (11.8%) |
| Total | 11,777 (64.0%) | 707 (6.0%) |
Employment Status by Educational Attainment in Ensley
According to labor force statistics for Ensley, 79.7% of individuals (9,877) out of the total population between 25 and 64 years of age (12,393) are in the labor force, with 5.3% or 523 of them being unemployed. The group with the highest labor force participation rate are those with the educational attainment of college / associate degree, with 88.9% or 4,433 individuals in the labor force. Within the labor force, individuals with less than high school education have the highest percentage of unemployment, with 16.3% or 118 of them being unemployed.
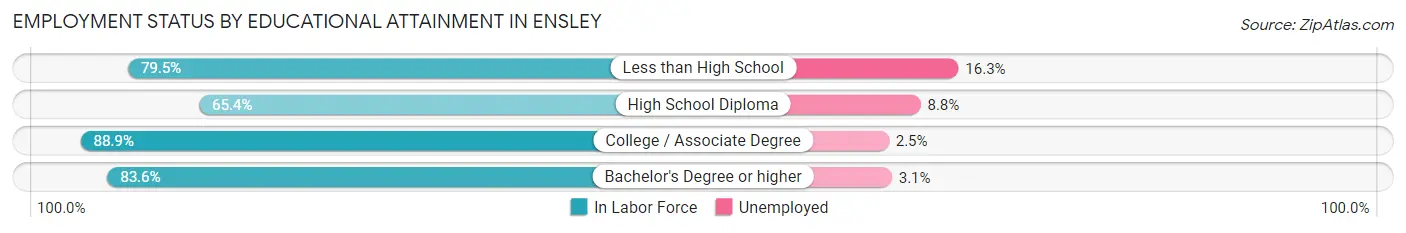
| Educational Attainment | In Labor Force | Unemployed |
| Less than High School | 723 (79.5%) | 148 (16.3%) |
| High School Diploma | 2,558 (65.4%) | 344 (8.8%) |
| College / Associate Degree | 4,433 (88.9%) | 125 (2.5%) |
| Bachelor's Degree or higher | 2,160 (83.6%) | 80 (3.1%) |
| Total | 9,877 (79.7%) | 657 (5.3%) |
Employment Occupations by Sex in Ensley
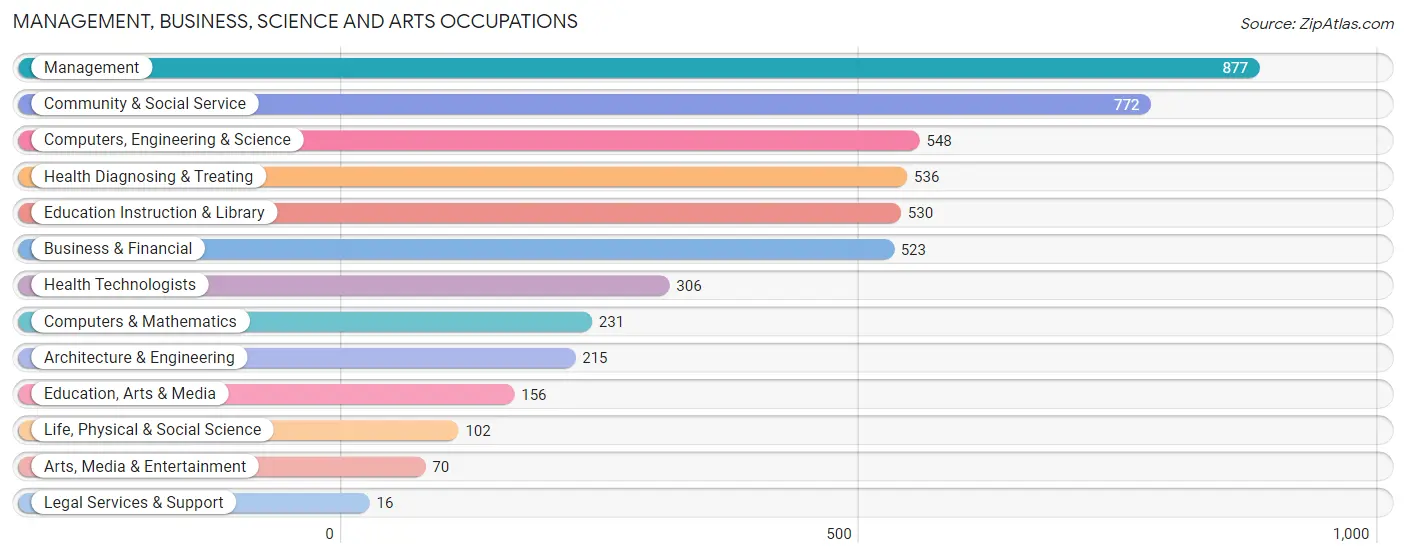
Management, Business, Science and Arts Occupations
The most common Management, Business, Science and Arts occupations in Ensley are Management (877 | 8.0%), Community & Social Service (772 | 7.1%), Computers, Engineering & Science (548 | 5.0%), Health Diagnosing & Treating (536 | 4.9%), and Education Instruction & Library (530 | 4.9%).
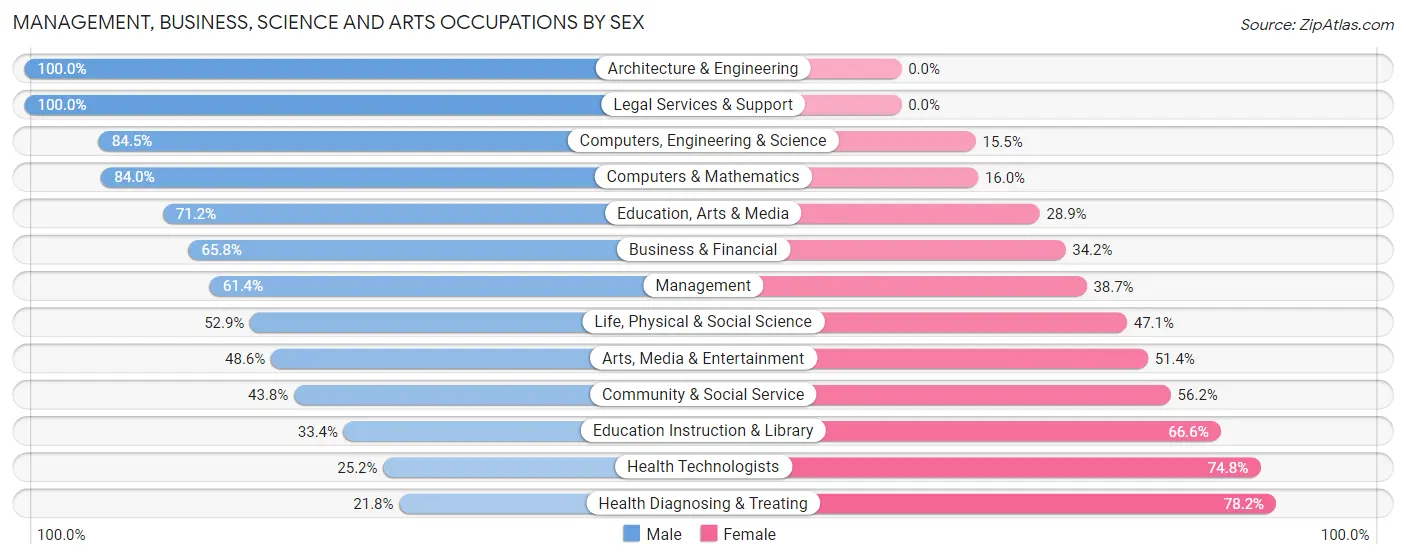
Management, Business, Science and Arts Occupations by Sex
Within the Management, Business, Science and Arts occupations in Ensley, the most male-oriented occupations are Architecture & Engineering (100.0%), Legal Services & Support (100.0%), and Computers, Engineering & Science (84.5%), while the most female-oriented occupations are Health Diagnosing & Treating (78.2%), Health Technologists (74.8%), and Education Instruction & Library (66.6%).
| Occupation | Male | Female |
| Management | 538 (61.4%) | 339 (38.7%) |
| Business & Financial | 344 (65.8%) | 179 (34.2%) |
| Computers, Engineering & Science | 463 (84.5%) | 85 (15.5%) |
| Computers & Mathematics | 194 (84.0%) | 37 (16.0%) |
| Architecture & Engineering | 215 (100.0%) | 0 (0.0%) |
| Life, Physical & Social Science | 54 (52.9%) | 48 (47.1%) |
| Community & Social Service | 338 (43.8%) | 434 (56.2%) |
| Education, Arts & Media | 111 (71.2%) | 45 (28.8%) |
| Legal Services & Support | 16 (100.0%) | 0 (0.0%) |
| Education Instruction & Library | 177 (33.4%) | 353 (66.6%) |
| Arts, Media & Entertainment | 34 (48.6%) | 36 (51.4%) |
| Health Diagnosing & Treating | 117 (21.8%) | 419 (78.2%) |
| Health Technologists | 77 (25.2%) | 229 (74.8%) |
| Total (Category) | 1,800 (55.3%) | 1,456 (44.7%) |
| Total (Overall) | 6,036 (55.2%) | 4,897 (44.8%) |
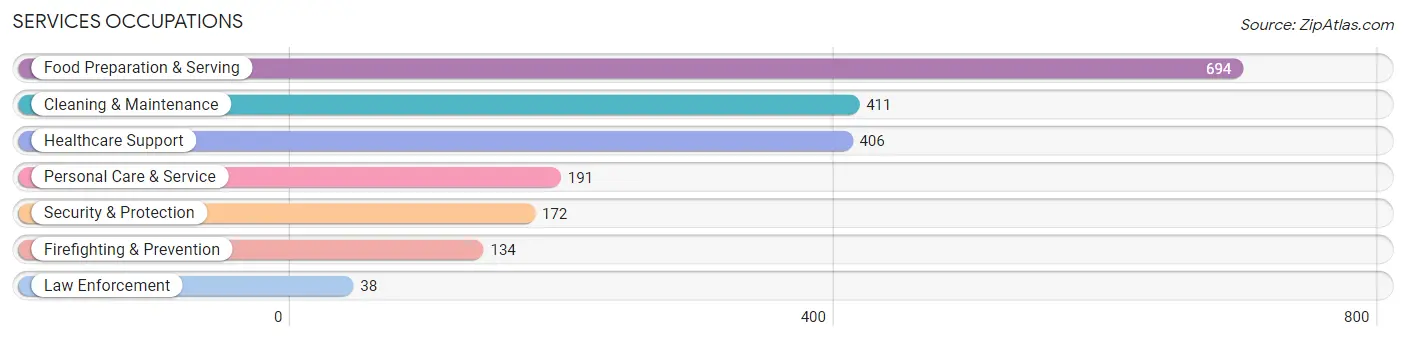
Services Occupations
The most common Services occupations in Ensley are Food Preparation & Serving (694 | 6.4%), Cleaning & Maintenance (411 | 3.8%), Healthcare Support (406 | 3.7%), Personal Care & Service (191 | 1.8%), and Security & Protection (172 | 1.6%).
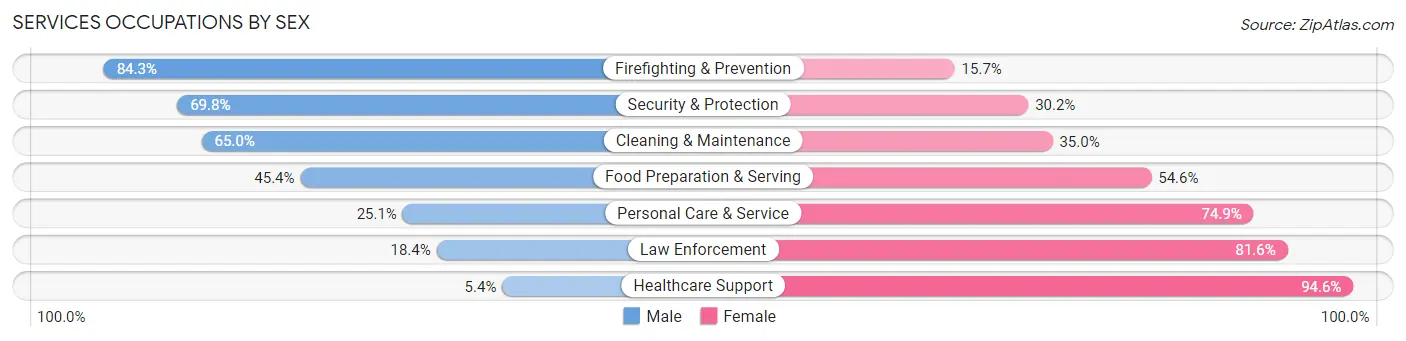
Services Occupations by Sex
Within the Services occupations in Ensley, the most male-oriented occupations are Firefighting & Prevention (84.3%), Security & Protection (69.8%), and Cleaning & Maintenance (65.0%), while the most female-oriented occupations are Healthcare Support (94.6%), Law Enforcement (81.6%), and Personal Care & Service (74.9%).
| Occupation | Male | Female |
| Healthcare Support | 22 (5.4%) | 384 (94.6%) |
| Security & Protection | 120 (69.8%) | 52 (30.2%) |
| Firefighting & Prevention | 113 (84.3%) | 21 (15.7%) |
| Law Enforcement | 7 (18.4%) | 31 (81.6%) |
| Food Preparation & Serving | 315 (45.4%) | 379 (54.6%) |
| Cleaning & Maintenance | 267 (65.0%) | 144 (35.0%) |
| Personal Care & Service | 48 (25.1%) | 143 (74.9%) |
| Total (Category) | 772 (41.2%) | 1,102 (58.8%) |
| Total (Overall) | 6,036 (55.2%) | 4,897 (44.8%) |
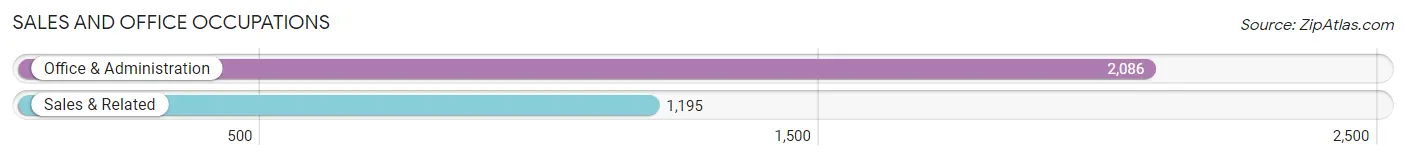
Sales and Office Occupations
The most common Sales and Office occupations in Ensley are Office & Administration (2,086 | 19.1%), and Sales & Related (1,195 | 10.9%).
Sales and Office Occupations by Sex
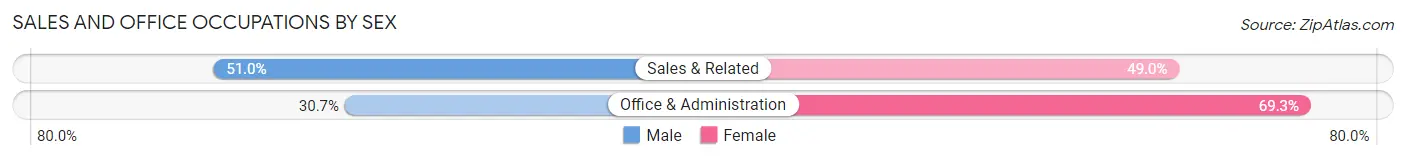
| Occupation | Male | Female |
| Sales & Related | 609 (51.0%) | 586 (49.0%) |
| Office & Administration | 641 (30.7%) | 1,445 (69.3%) |
| Total (Category) | 1,250 (38.1%) | 2,031 (61.9%) |
| Total (Overall) | 6,036 (55.2%) | 4,897 (44.8%) |
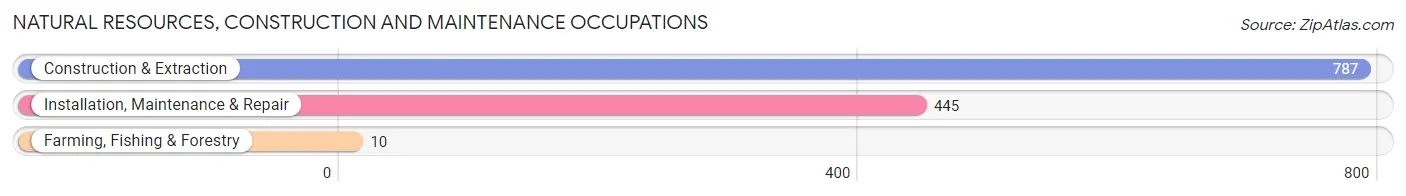
Natural Resources, Construction and Maintenance Occupations
The most common Natural Resources, Construction and Maintenance occupations in Ensley are Construction & Extraction (787 | 7.2%), Installation, Maintenance & Repair (445 | 4.1%), and Farming, Fishing & Forestry (10 | 0.1%).
Natural Resources, Construction and Maintenance Occupations by Sex
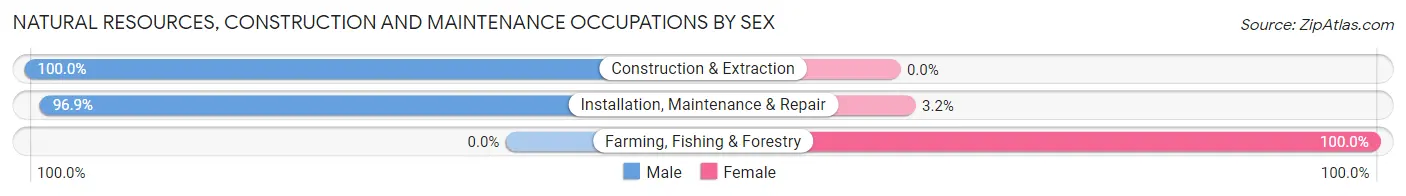
| Occupation | Male | Female |
| Farming, Fishing & Forestry | 0 (0.0%) | 10 (100.0%) |
| Construction & Extraction | 787 (100.0%) | 0 (0.0%) |
| Installation, Maintenance & Repair | 431 (96.9%) | 14 (3.2%) |
| Total (Category) | 1,218 (98.1%) | 24 (1.9%) |
| Total (Overall) | 6,036 (55.2%) | 4,897 (44.8%) |
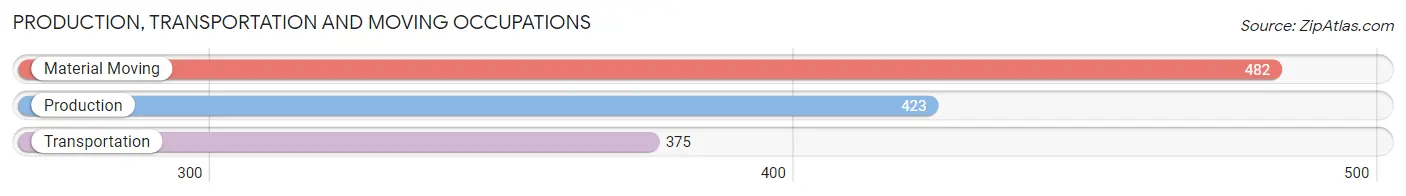
Production, Transportation and Moving Occupations
The most common Production, Transportation and Moving occupations in Ensley are Material Moving (482 | 4.4%), Production (423 | 3.9%), and Transportation (375 | 3.4%).
Production, Transportation and Moving Occupations by Sex
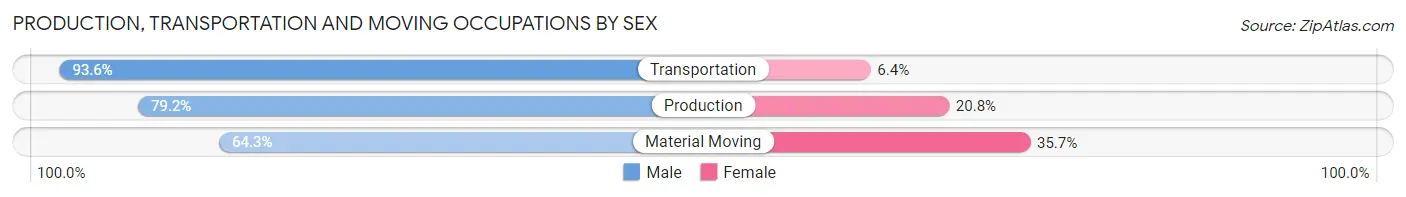
| Occupation | Male | Female |
| Production | 335 (79.2%) | 88 (20.8%) |
| Transportation | 351 (93.6%) | 24 (6.4%) |
| Material Moving | 310 (64.3%) | 172 (35.7%) |
| Total (Category) | 996 (77.8%) | 284 (22.2%) |
| Total (Overall) | 6,036 (55.2%) | 4,897 (44.8%) |
Employment Industries by Sex in Ensley
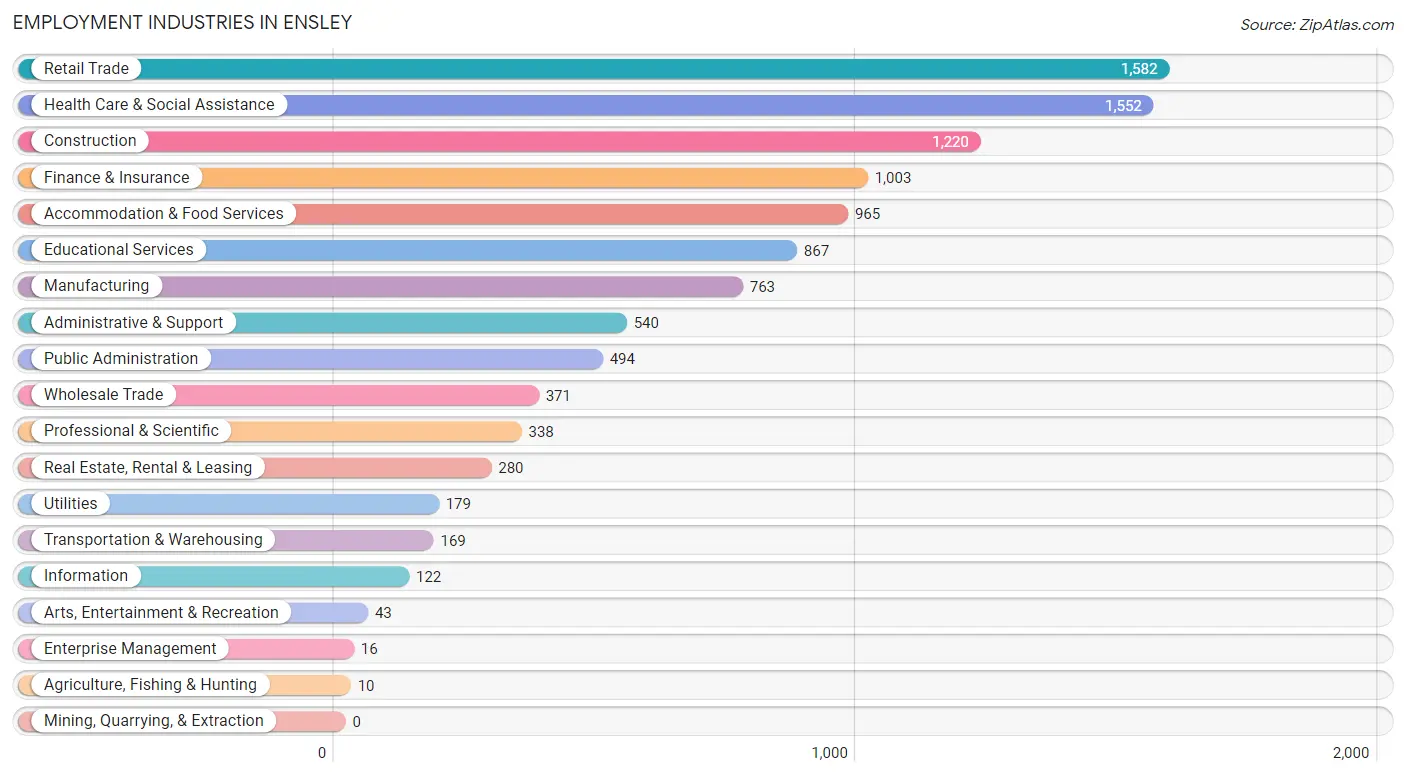
Employment Industries in Ensley
The major employment industries in Ensley include Retail Trade (1,582 | 14.5%), Health Care & Social Assistance (1,552 | 14.2%), Construction (1,220 | 11.2%), Finance & Insurance (1,003 | 9.2%), and Accommodation & Food Services (965 | 8.8%).
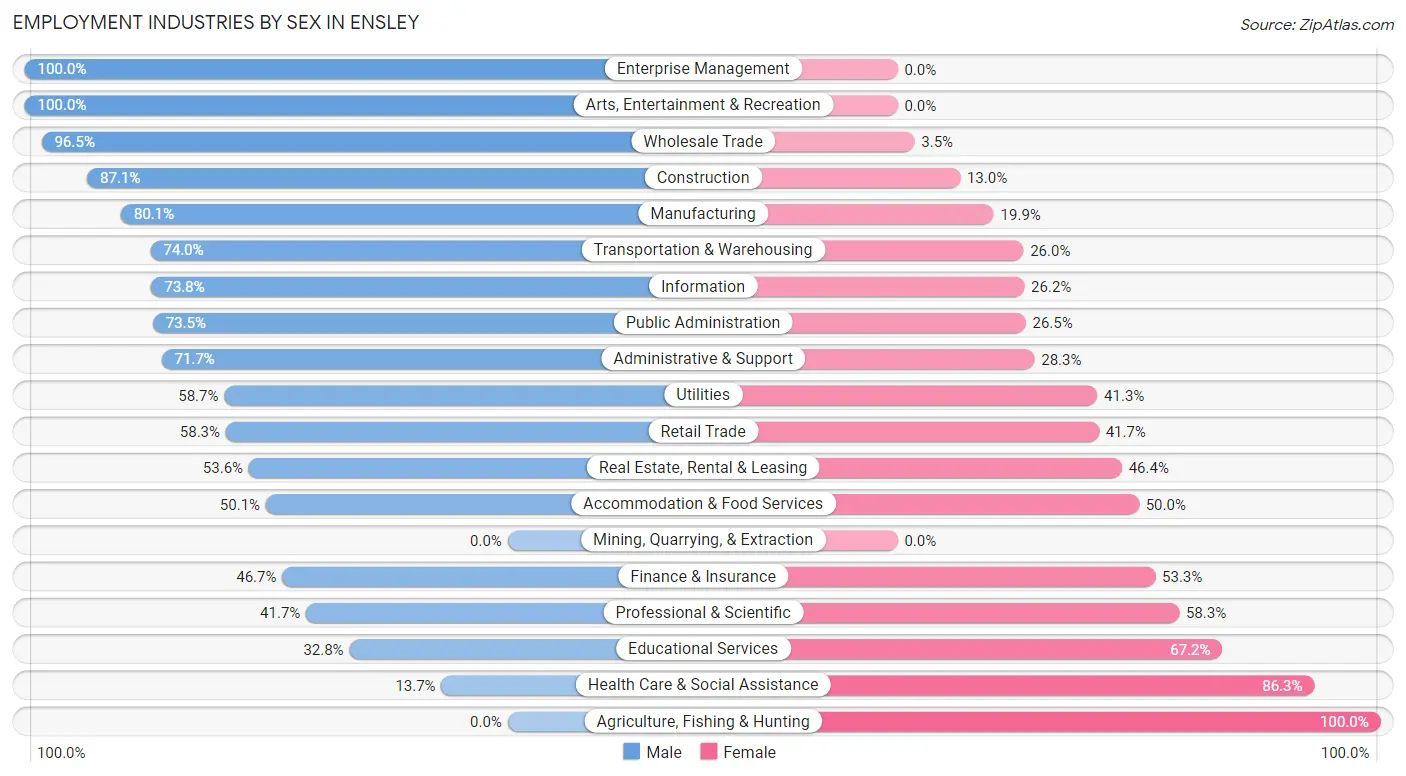
Employment Industries by Sex in Ensley
The Ensley industries that see more men than women are Enterprise Management (100.0%), Arts, Entertainment & Recreation (100.0%), and Wholesale Trade (96.5%), whereas the industries that tend to have a higher number of women are Agriculture, Fishing & Hunting (100.0%), Health Care & Social Assistance (86.3%), and Educational Services (67.2%).
| Industry | Male | Female |
| Agriculture, Fishing & Hunting | 0 (0.0%) | 10 (100.0%) |
| Mining, Quarrying, & Extraction | 0 (0.0%) | 0 (0.0%) |
| Construction | 1,062 (87.1%) | 158 (13.0%) |
| Manufacturing | 611 (80.1%) | 152 (19.9%) |
| Wholesale Trade | 358 (96.5%) | 13 (3.5%) |
| Retail Trade | 923 (58.3%) | 659 (41.7%) |
| Transportation & Warehousing | 125 (74.0%) | 44 (26.0%) |
| Utilities | 105 (58.7%) | 74 (41.3%) |
| Information | 90 (73.8%) | 32 (26.2%) |
| Finance & Insurance | 468 (46.7%) | 535 (53.3%) |
| Real Estate, Rental & Leasing | 150 (53.6%) | 130 (46.4%) |
| Professional & Scientific | 141 (41.7%) | 197 (58.3%) |
| Enterprise Management | 16 (100.0%) | 0 (0.0%) |
| Administrative & Support | 387 (71.7%) | 153 (28.3%) |
| Educational Services | 284 (32.8%) | 583 (67.2%) |
| Health Care & Social Assistance | 213 (13.7%) | 1,339 (86.3%) |
| Arts, Entertainment & Recreation | 43 (100.0%) | 0 (0.0%) |
| Accommodation & Food Services | 483 (50.0%) | 482 (49.9%) |
| Public Administration | 363 (73.5%) | 131 (26.5%) |
| Total | 6,036 (55.2%) | 4,897 (44.8%) |
Education in Ensley
School Enrollment in Ensley
The most common levels of schooling among the 4,642 students in Ensley are elementary school (1,157 | 24.9%), college / undergraduate (1,100 | 23.7%), and high school (852 | 18.3%).
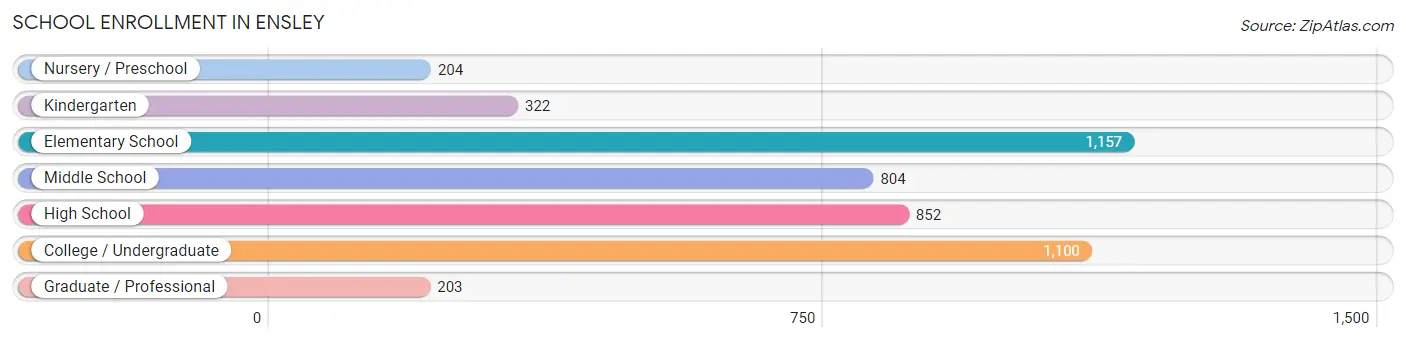
| School Level | # Students | % Students |
| Nursery / Preschool | 204 | 4.4% |
| Kindergarten | 322 | 6.9% |
| Elementary School | 1,157 | 24.9% |
| Middle School | 804 | 17.3% |
| High School | 852 | 18.3% |
| College / Undergraduate | 1,100 | 23.7% |
| Graduate / Professional | 203 | 4.4% |
| Total | 4,642 | 100.0% |
School Enrollment by Age by Funding Source in Ensley
Out of a total of 4,642 students who are enrolled in schools in Ensley, 534 (11.5%) attend a private institution, while the remaining 4,108 (88.5%) are enrolled in public schools. The age group of 3 to 4 year olds has the highest likelihood of being enrolled in private schools, with 75 (65.2% in the age bracket) enrolled. Conversely, the age group of 25 to 34 year olds has the lowest likelihood of being enrolled in a private school, with 470 (100.0% in the age bracket) attending a public institution.
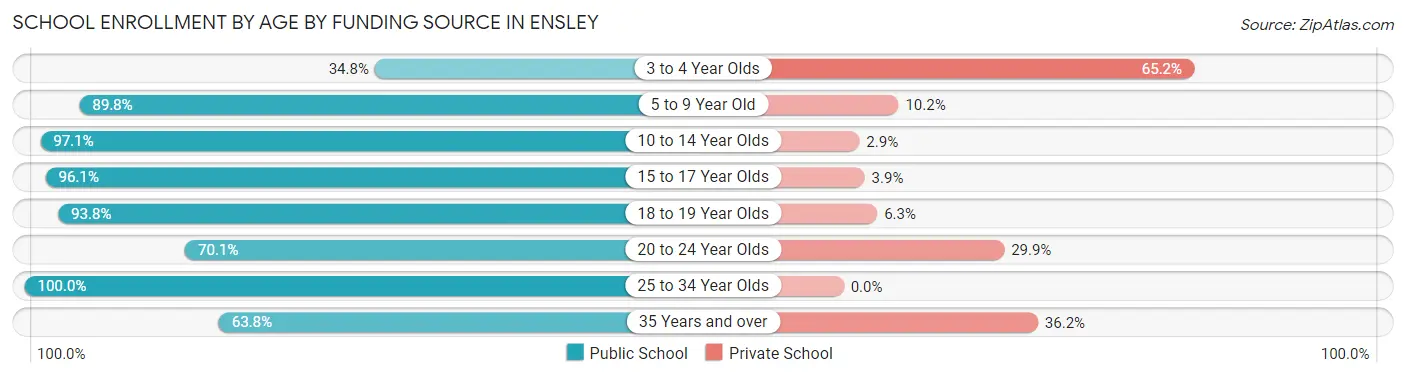
| Age Bracket | Public School | Private School |
| 3 to 4 Year Olds | 40 (34.8%) | 75 (65.2%) |
| 5 to 9 Year Old | 1,196 (89.8%) | 136 (10.2%) |
| 10 to 14 Year Olds | 1,160 (97.1%) | 35 (2.9%) |
| 15 to 17 Year Olds | 516 (96.1%) | 21 (3.9%) |
| 18 to 19 Year Olds | 210 (93.8%) | 14 (6.2%) |
| 20 to 24 Year Olds | 293 (70.1%) | 125 (29.9%) |
| 25 to 34 Year Olds | 470 (100.0%) | 0 (0.0%) |
| 35 Years and over | 224 (63.8%) | 127 (36.2%) |
| Total | 4,108 (88.5%) | 534 (11.5%) |
Educational Attainment by Field of Study in Ensley
Business (892 | 24.9%), education (434 | 12.1%), science & technology (399 | 11.1%), arts & humanities (301 | 8.4%), and social sciences (287 | 8.0%) are the most common fields of study among 3,586 individuals in Ensley who have obtained a bachelor's degree or higher.
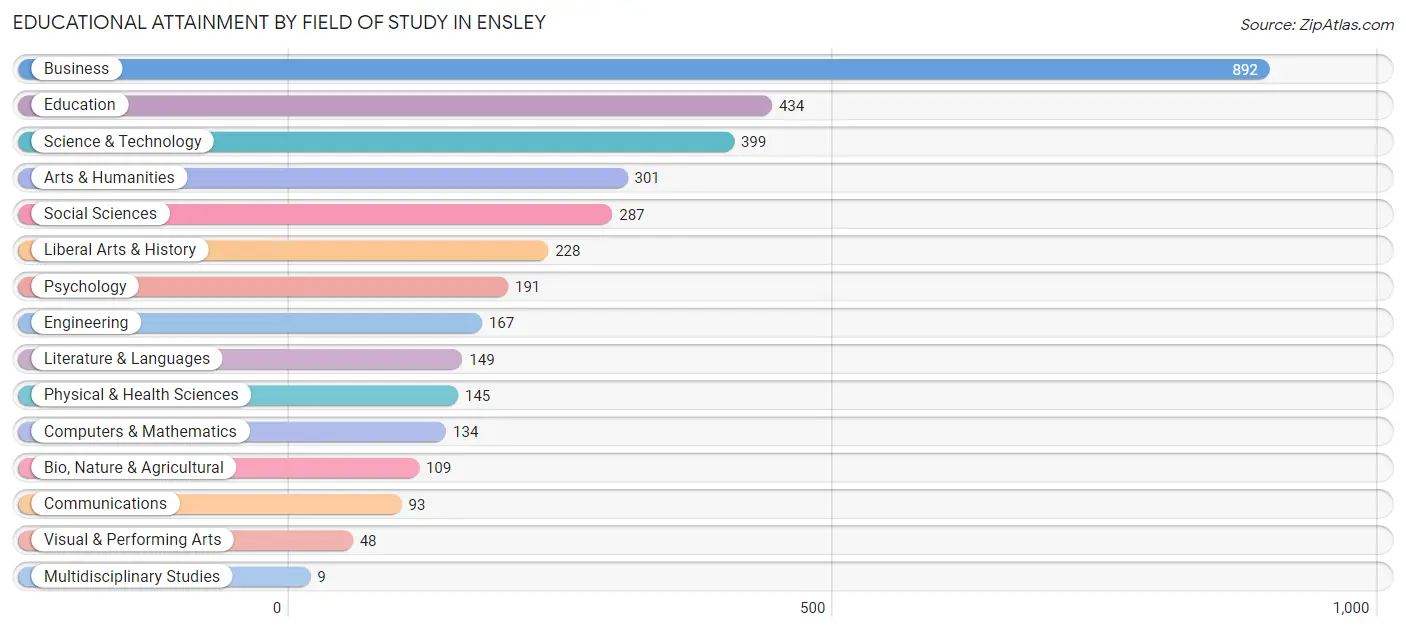
| Field of Study | # Graduates | % Graduates |
| Computers & Mathematics | 134 | 3.7% |
| Bio, Nature & Agricultural | 109 | 3.0% |
| Physical & Health Sciences | 145 | 4.0% |
| Psychology | 191 | 5.3% |
| Social Sciences | 287 | 8.0% |
| Engineering | 167 | 4.7% |
| Multidisciplinary Studies | 9 | 0.3% |
| Science & Technology | 399 | 11.1% |
| Business | 892 | 24.9% |
| Education | 434 | 12.1% |
| Literature & Languages | 149 | 4.2% |
| Liberal Arts & History | 228 | 6.4% |
| Visual & Performing Arts | 48 | 1.3% |
| Communications | 93 | 2.6% |
| Arts & Humanities | 301 | 8.4% |
| Total | 3,586 | 100.0% |
Transportation & Commute in Ensley
Vehicle Availability by Sex in Ensley
The most prevalent vehicle ownership categories in Ensley are males with 2 vehicles (2,302, accounting for 38.2%) and females with 2 vehicles (1,822, making up 48.4%).
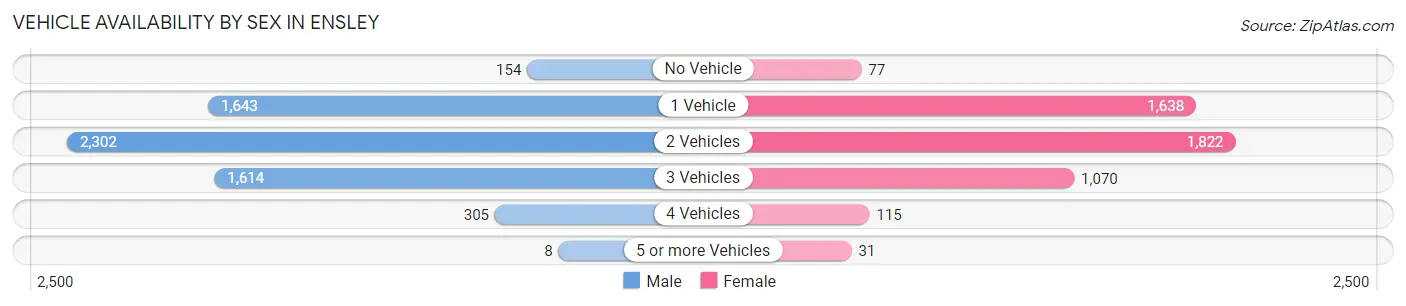
| Vehicles Available | Male | Female |
| No Vehicle | 154 (2.6%) | 77 (1.6%) |
| 1 Vehicle | 1,643 (27.3%) | 1,638 (34.5%) |
| 2 Vehicles | 2,302 (38.2%) | 1,822 (38.3%) |
| 3 Vehicles | 1,614 (26.8%) | 1,070 (22.5%) |
| 4 Vehicles | 305 (5.1%) | 115 (2.4%) |
| 5 or more Vehicles | 8 (0.1%) | 31 (0.6%) |
| Total | 6,026 (100.0%) | 4,753 (100.0%) |
Commute Time in Ensley
The most frequently occuring commute durations in Ensley are 15 to 19 minutes (2,081 commuters, 22.6%), 20 to 24 minutes (2,030 commuters, 22.0%), and 30 to 34 minutes (1,262 commuters, 13.7%).
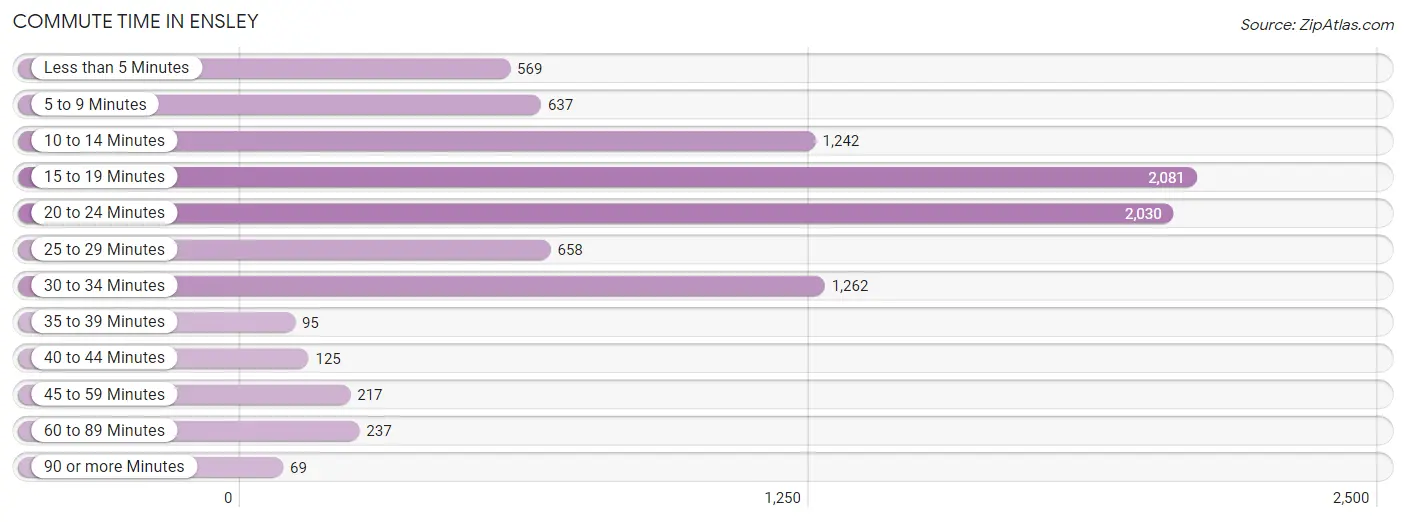
| Commute Time | # Commuters | % Commuters |
| Less than 5 Minutes | 569 | 6.2% |
| 5 to 9 Minutes | 637 | 6.9% |
| 10 to 14 Minutes | 1,242 | 13.5% |
| 15 to 19 Minutes | 2,081 | 22.6% |
| 20 to 24 Minutes | 2,030 | 22.0% |
| 25 to 29 Minutes | 658 | 7.1% |
| 30 to 34 Minutes | 1,262 | 13.7% |
| 35 to 39 Minutes | 95 | 1.0% |
| 40 to 44 Minutes | 125 | 1.4% |
| 45 to 59 Minutes | 217 | 2.4% |
| 60 to 89 Minutes | 237 | 2.6% |
| 90 or more Minutes | 69 | 0.7% |
Commute Time by Sex in Ensley
The most common commute times in Ensley are 15 to 19 minutes (1,153 commuters, 22.0%) for males and 20 to 24 minutes (1,032 commuters, 26.0%) for females.
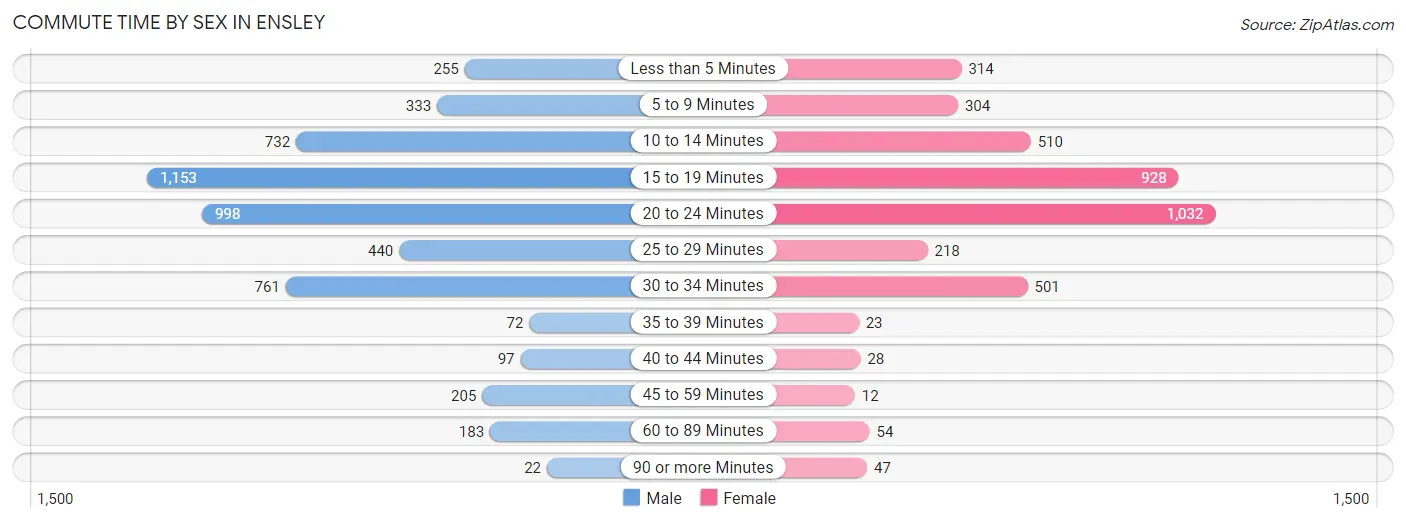
| Commute Time | Male | Female |
| Less than 5 Minutes | 255 (4.9%) | 314 (7.9%) |
| 5 to 9 Minutes | 333 (6.3%) | 304 (7.7%) |
| 10 to 14 Minutes | 732 (13.9%) | 510 (12.8%) |
| 15 to 19 Minutes | 1,153 (22.0%) | 928 (23.4%) |
| 20 to 24 Minutes | 998 (19.0%) | 1,032 (26.0%) |
| 25 to 29 Minutes | 440 (8.4%) | 218 (5.5%) |
| 30 to 34 Minutes | 761 (14.5%) | 501 (12.6%) |
| 35 to 39 Minutes | 72 (1.4%) | 23 (0.6%) |
| 40 to 44 Minutes | 97 (1.8%) | 28 (0.7%) |
| 45 to 59 Minutes | 205 (3.9%) | 12 (0.3%) |
| 60 to 89 Minutes | 183 (3.5%) | 54 (1.4%) |
| 90 or more Minutes | 22 (0.4%) | 47 (1.2%) |
Time of Departure to Work by Sex in Ensley
The most frequent times of departure to work in Ensley are 6:30 AM to 6:59 AM (787, 15.0%) for males and 7:00 AM to 7:29 AM (774, 19.5%) for females.
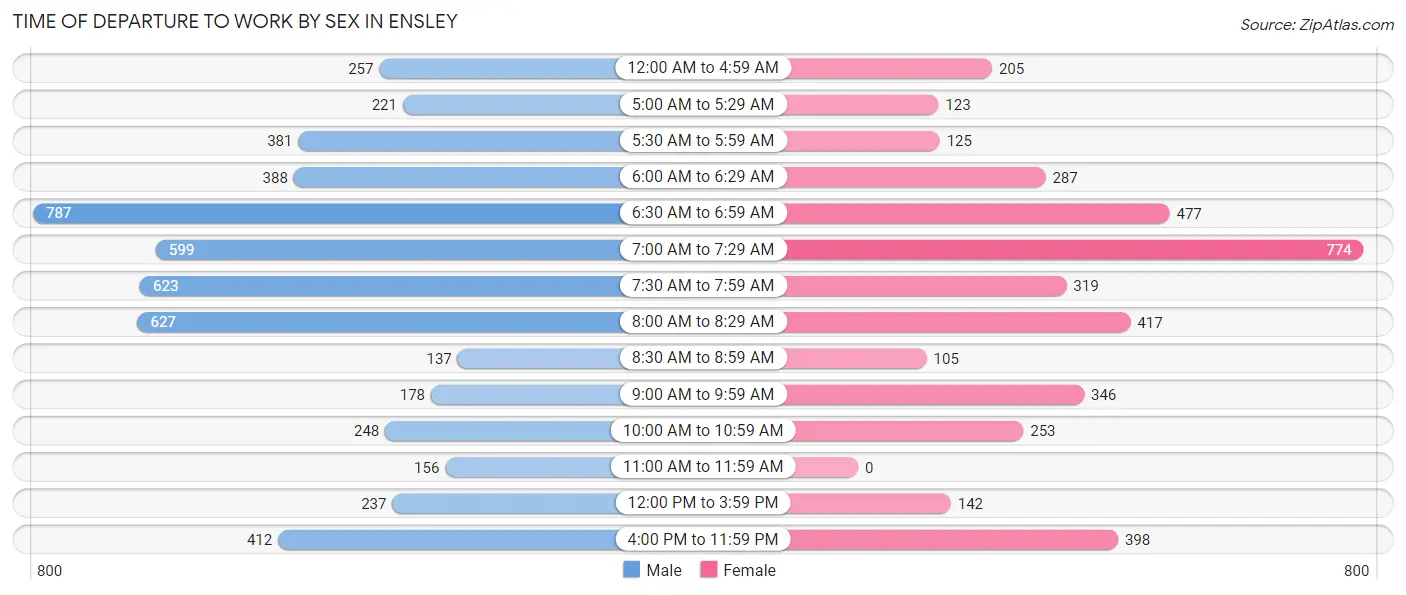
| Time of Departure | Male | Female |
| 12:00 AM to 4:59 AM | 257 (4.9%) | 205 (5.2%) |
| 5:00 AM to 5:29 AM | 221 (4.2%) | 123 (3.1%) |
| 5:30 AM to 5:59 AM | 381 (7.3%) | 125 (3.2%) |
| 6:00 AM to 6:29 AM | 388 (7.4%) | 287 (7.2%) |
| 6:30 AM to 6:59 AM | 787 (15.0%) | 477 (12.0%) |
| 7:00 AM to 7:29 AM | 599 (11.4%) | 774 (19.5%) |
| 7:30 AM to 7:59 AM | 623 (11.9%) | 319 (8.0%) |
| 8:00 AM to 8:29 AM | 627 (11.9%) | 417 (10.5%) |
| 8:30 AM to 8:59 AM | 137 (2.6%) | 105 (2.6%) |
| 9:00 AM to 9:59 AM | 178 (3.4%) | 346 (8.7%) |
| 10:00 AM to 10:59 AM | 248 (4.7%) | 253 (6.4%) |
| 11:00 AM to 11:59 AM | 156 (3.0%) | 0 (0.0%) |
| 12:00 PM to 3:59 PM | 237 (4.5%) | 142 (3.6%) |
| 4:00 PM to 11:59 PM | 412 (7.9%) | 398 (10.0%) |
| Total | 5,251 (100.0%) | 3,971 (100.0%) |
Housing Occupancy in Ensley
Occupancy by Ownership in Ensley
Of the total 9,780 dwellings in Ensley, owner-occupied units account for 5,644 (57.7%), while renter-occupied units make up 4,136 (42.3%).
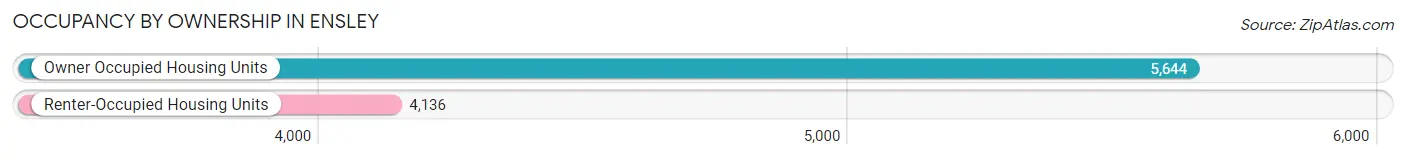
| Occupancy | # Housing Units | % Housing Units |
| Owner Occupied Housing Units | 5,644 | 57.7% |
| Renter-Occupied Housing Units | 4,136 | 42.3% |
| Total Occupied Housing Units | 9,780 | 100.0% |
Occupancy by Household Size in Ensley
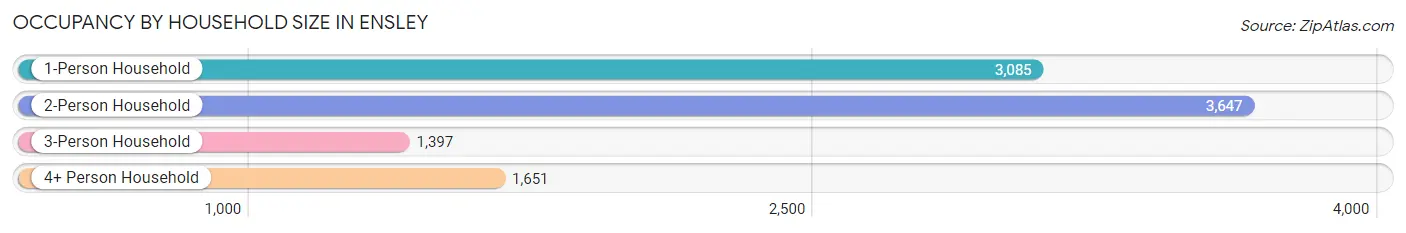
| Household Size | # Housing Units | % Housing Units |
| 1-Person Household | 3,085 | 31.5% |
| 2-Person Household | 3,647 | 37.3% |
| 3-Person Household | 1,397 | 14.3% |
| 4+ Person Household | 1,651 | 16.9% |
| Total Housing Units | 9,780 | 100.0% |
Occupancy by Ownership by Household Size in Ensley
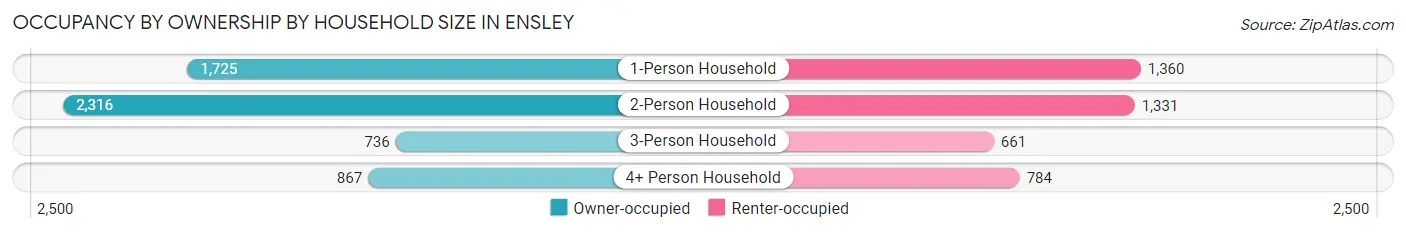
| Household Size | Owner-occupied | Renter-occupied |
| 1-Person Household | 1,725 (55.9%) | 1,360 (44.1%) |
| 2-Person Household | 2,316 (63.5%) | 1,331 (36.5%) |
| 3-Person Household | 736 (52.7%) | 661 (47.3%) |
| 4+ Person Household | 867 (52.5%) | 784 (47.5%) |
| Total Housing Units | 5,644 (57.7%) | 4,136 (42.3%) |
Occupancy by Educational Attainment in Ensley
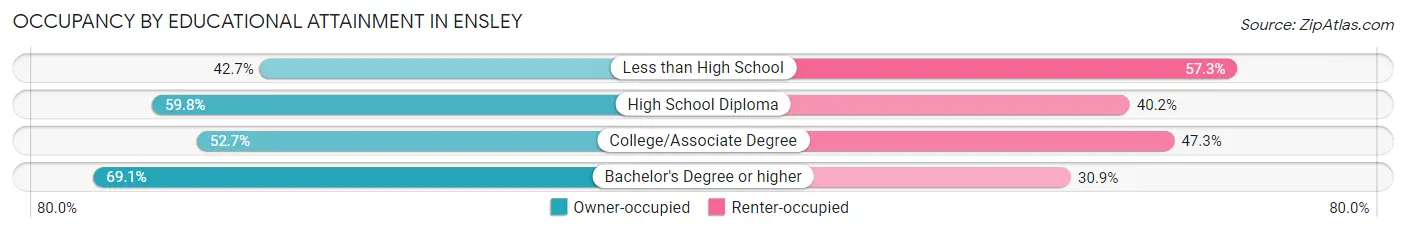
| Household Size | Owner-occupied | Renter-occupied |
| Less than High School | 323 (42.7%) | 433 (57.3%) |
| High School Diploma | 1,610 (59.8%) | 1,084 (40.2%) |
| College/Associate Degree | 2,125 (52.7%) | 1,909 (47.3%) |
| Bachelor's Degree or higher | 1,586 (69.1%) | 710 (30.9%) |
Occupancy by Age of Householder in Ensley
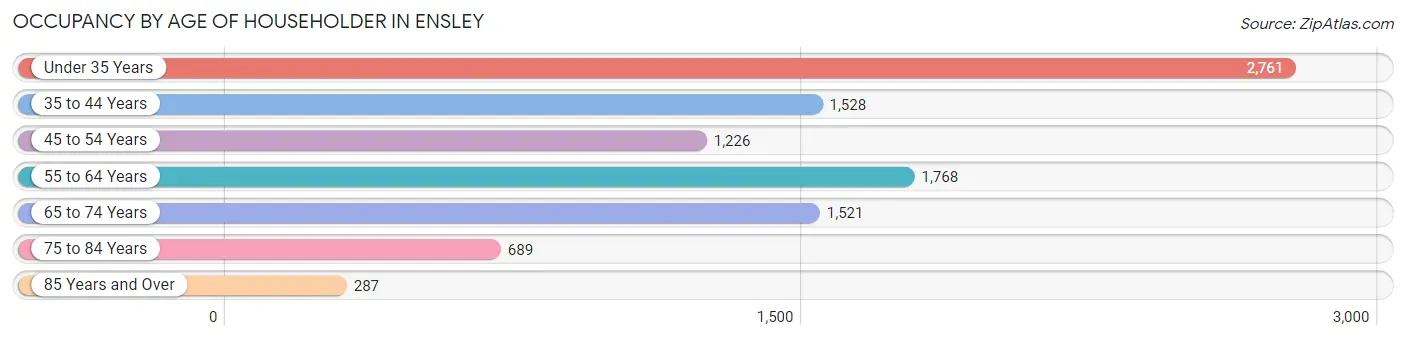
| Age Bracket | # Households | % Households |
| Under 35 Years | 2,761 | 28.2% |
| 35 to 44 Years | 1,528 | 15.6% |
| 45 to 54 Years | 1,226 | 12.5% |
| 55 to 64 Years | 1,768 | 18.1% |
| 65 to 74 Years | 1,521 | 15.5% |
| 75 to 84 Years | 689 | 7.0% |
| 85 Years and Over | 287 | 2.9% |
| Total | 9,780 | 100.0% |
Housing Finances in Ensley
Median Income by Occupancy in Ensley
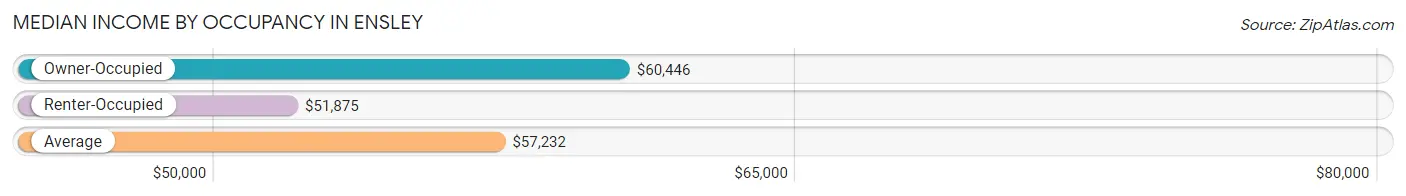
| Occupancy Type | # Households | Median Income |
| Owner-Occupied | 5,644 (57.7%) | $60,446 |
| Renter-Occupied | 4,136 (42.3%) | $51,875 |
| Average | 9,780 (100.0%) | $57,232 |
Occupancy by Householder Income Bracket in Ensley
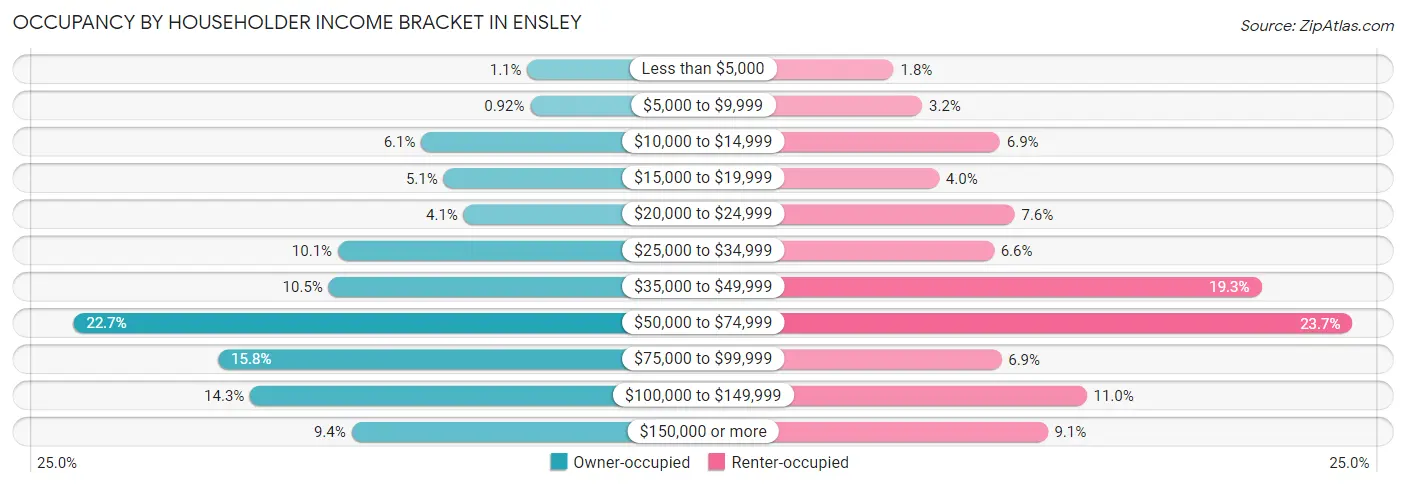
| Income Bracket | Owner-occupied | Renter-occupied |
| Less than $5,000 | 60 (1.1%) | 75 (1.8%) |
| $5,000 to $9,999 | 52 (0.9%) | 131 (3.2%) |
| $10,000 to $14,999 | 345 (6.1%) | 284 (6.9%) |
| $15,000 to $19,999 | 285 (5.1%) | 164 (4.0%) |
| $20,000 to $24,999 | 231 (4.1%) | 313 (7.6%) |
| $25,000 to $34,999 | 569 (10.1%) | 272 (6.6%) |
| $35,000 to $49,999 | 594 (10.5%) | 799 (19.3%) |
| $50,000 to $74,999 | 1,280 (22.7%) | 978 (23.6%) |
| $75,000 to $99,999 | 891 (15.8%) | 287 (6.9%) |
| $100,000 to $149,999 | 805 (14.3%) | 455 (11.0%) |
| $150,000 or more | 532 (9.4%) | 378 (9.1%) |
| Total | 5,644 (100.0%) | 4,136 (100.0%) |
Monthly Housing Cost Tiers in Ensley
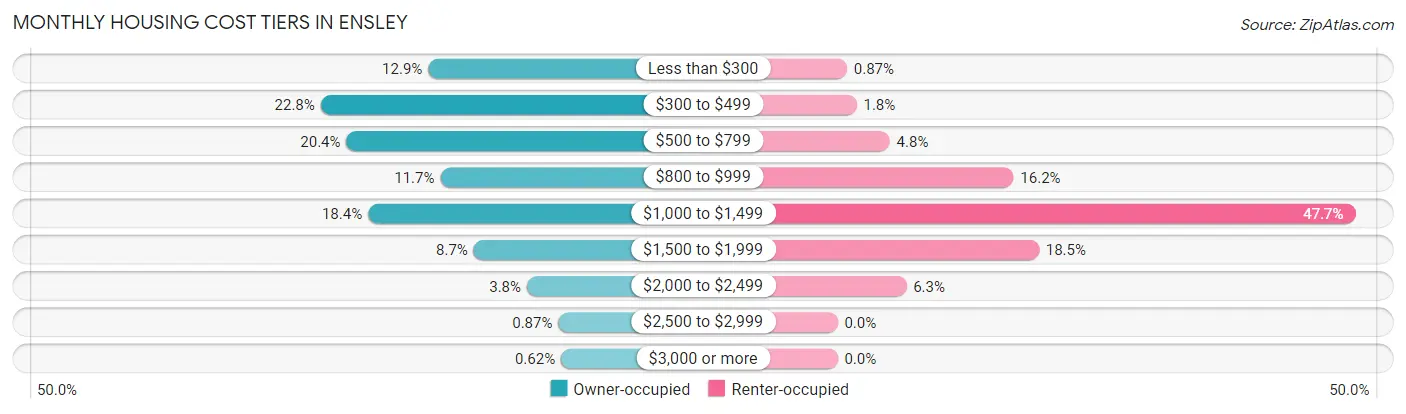
| Monthly Cost | Owner-occupied | Renter-occupied |
| Less than $300 | 725 (12.9%) | 36 (0.9%) |
| $300 to $499 | 1,284 (22.8%) | 73 (1.8%) |
| $500 to $799 | 1,150 (20.4%) | 199 (4.8%) |
| $800 to $999 | 662 (11.7%) | 670 (16.2%) |
| $1,000 to $1,499 | 1,038 (18.4%) | 1,972 (47.7%) |
| $1,500 to $1,999 | 489 (8.7%) | 767 (18.5%) |
| $2,000 to $2,499 | 212 (3.8%) | 262 (6.3%) |
| $2,500 to $2,999 | 49 (0.9%) | 0 (0.0%) |
| $3,000 or more | 35 (0.6%) | 0 (0.0%) |
| Total | 5,644 (100.0%) | 4,136 (100.0%) |
Physical Housing Characteristics in Ensley
Housing Structures in Ensley
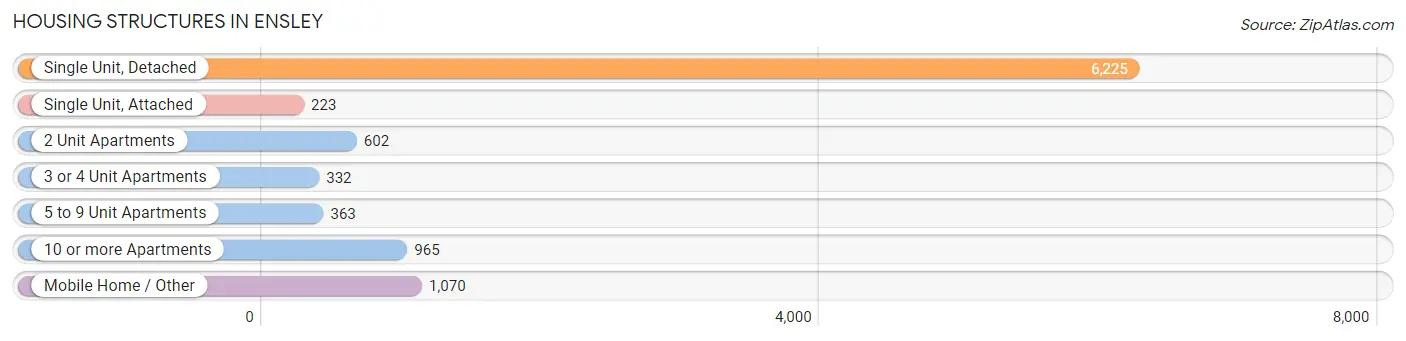
| Structure Type | # Housing Units | % Housing Units |
| Single Unit, Detached | 6,225 | 63.6% |
| Single Unit, Attached | 223 | 2.3% |
| 2 Unit Apartments | 602 | 6.2% |
| 3 or 4 Unit Apartments | 332 | 3.4% |
| 5 to 9 Unit Apartments | 363 | 3.7% |
| 10 or more Apartments | 965 | 9.9% |
| Mobile Home / Other | 1,070 | 10.9% |
| Total | 9,780 | 100.0% |
Housing Structures by Occupancy in Ensley
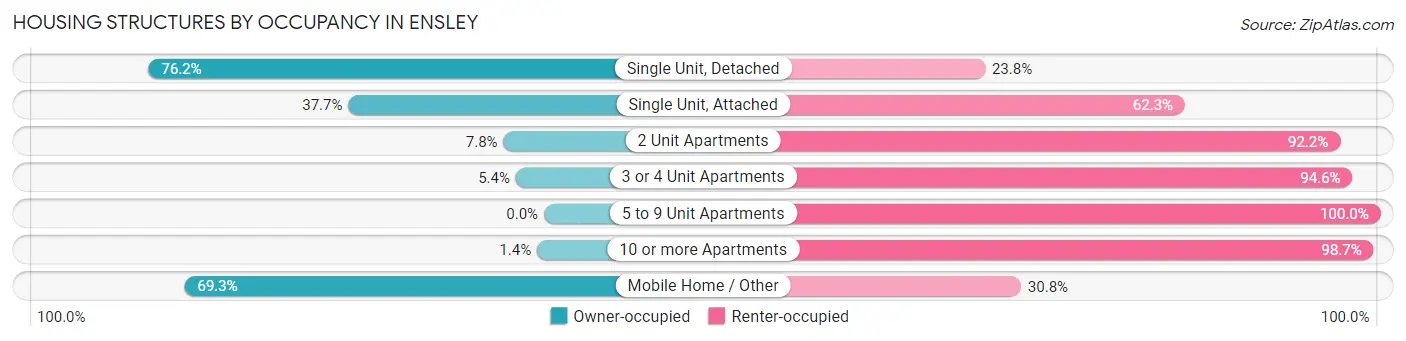
| Structure Type | Owner-occupied | Renter-occupied |
| Single Unit, Detached | 4,741 (76.2%) | 1,484 (23.8%) |
| Single Unit, Attached | 84 (37.7%) | 139 (62.3%) |
| 2 Unit Apartments | 47 (7.8%) | 555 (92.2%) |
| 3 or 4 Unit Apartments | 18 (5.4%) | 314 (94.6%) |
| 5 to 9 Unit Apartments | 0 (0.0%) | 363 (100.0%) |
| 10 or more Apartments | 13 (1.3%) | 952 (98.7%) |
| Mobile Home / Other | 741 (69.3%) | 329 (30.7%) |
| Total | 5,644 (57.7%) | 4,136 (42.3%) |
Housing Structures by Number of Rooms in Ensley
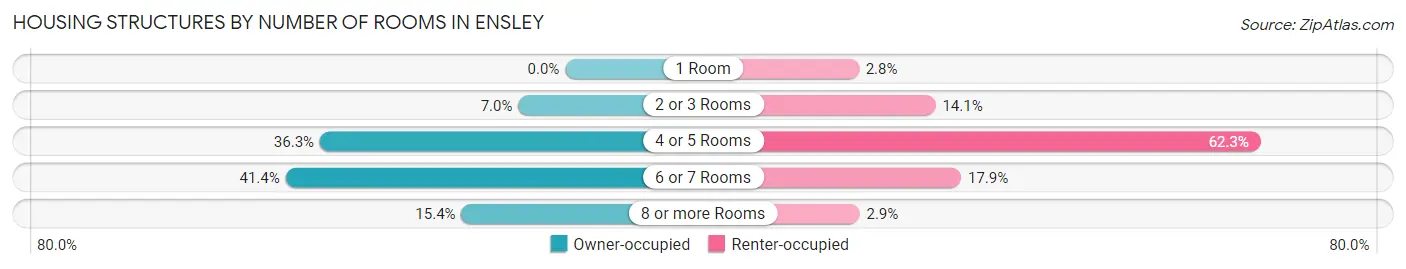
| Number of Rooms | Owner-occupied | Renter-occupied |
| 1 Room | 0 (0.0%) | 115 (2.8%) |
| 2 or 3 Rooms | 392 (7.0%) | 585 (14.1%) |
| 4 or 5 Rooms | 2,049 (36.3%) | 2,575 (62.3%) |
| 6 or 7 Rooms | 2,336 (41.4%) | 741 (17.9%) |
| 8 or more Rooms | 867 (15.4%) | 120 (2.9%) |
| Total | 5,644 (100.0%) | 4,136 (100.0%) |
Housing Structure by Heating Type in Ensley
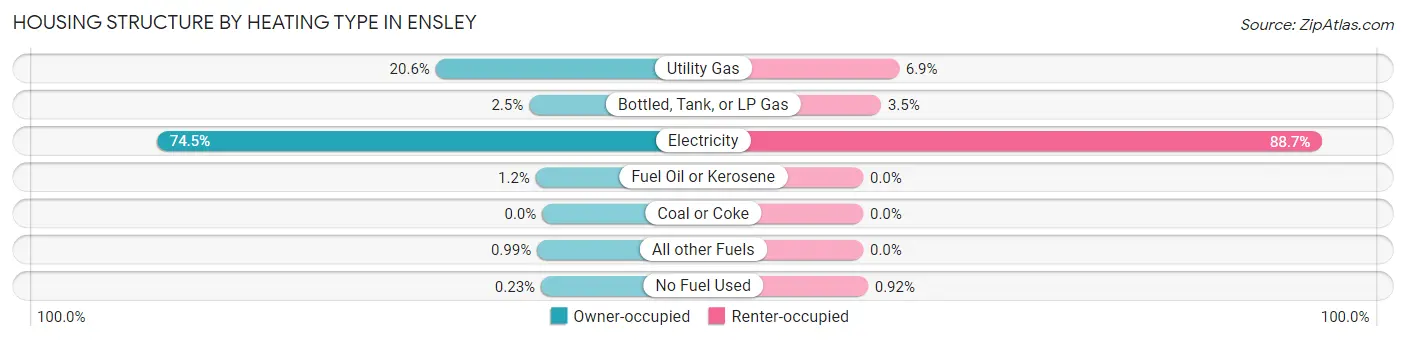
| Heating Type | Owner-occupied | Renter-occupied |
| Utility Gas | 1,161 (20.6%) | 286 (6.9%) |
| Bottled, Tank, or LP Gas | 142 (2.5%) | 143 (3.5%) |
| Electricity | 4,202 (74.5%) | 3,669 (88.7%) |
| Fuel Oil or Kerosene | 70 (1.2%) | 0 (0.0%) |
| Coal or Coke | 0 (0.0%) | 0 (0.0%) |
| All other Fuels | 56 (1.0%) | 0 (0.0%) |
| No Fuel Used | 13 (0.2%) | 38 (0.9%) |
| Total | 5,644 (100.0%) | 4,136 (100.0%) |
Household Vehicle Usage in Ensley
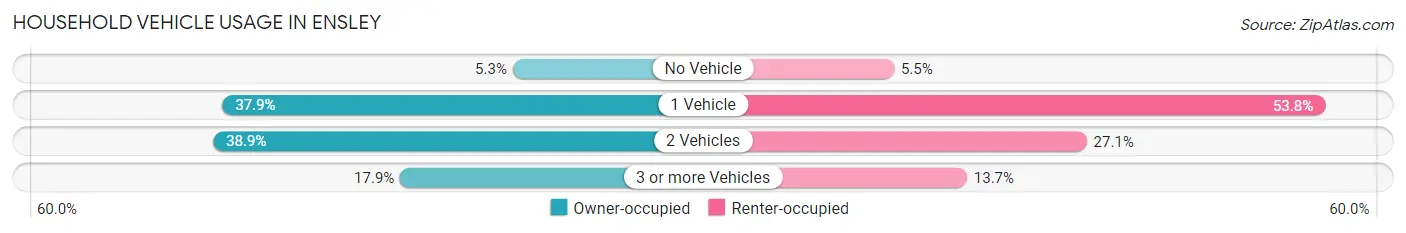
| Vehicles per Household | Owner-occupied | Renter-occupied |
| No Vehicle | 300 (5.3%) | 227 (5.5%) |
| 1 Vehicle | 2,137 (37.9%) | 2,224 (53.8%) |
| 2 Vehicles | 2,195 (38.9%) | 1,120 (27.1%) |
| 3 or more Vehicles | 1,012 (17.9%) | 565 (13.7%) |
| Total | 5,644 (100.0%) | 4,136 (100.0%) |
Real Estate & Mortgages in Ensley
Real Estate and Mortgage Overview in Ensley
| Characteristic | Without Mortgage | With Mortgage |
| Housing Units | 2,925 | 2,719 |
| Median Property Value | $135,300 | $173,000 |
| Median Household Income | $56,846 | $294 |
| Monthly Housing Costs | $405 | $35 |
| Real Estate Taxes | $975 | $265 |
Property Value by Mortgage Status in Ensley
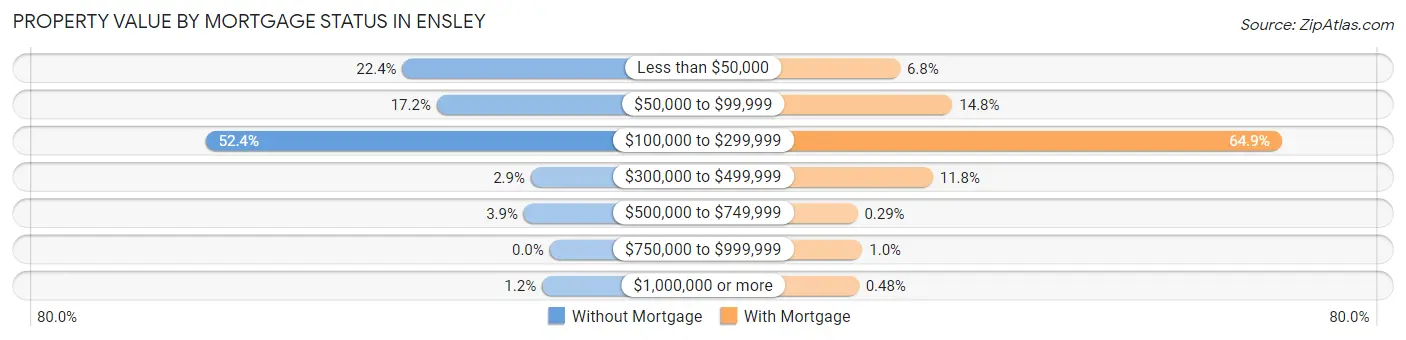
| Property Value | Without Mortgage | With Mortgage |
| Less than $50,000 | 656 (22.4%) | 184 (6.8%) |
| $50,000 to $99,999 | 503 (17.2%) | 401 (14.7%) |
| $100,000 to $299,999 | 1,533 (52.4%) | 1,765 (64.9%) |
| $300,000 to $499,999 | 84 (2.9%) | 320 (11.8%) |
| $500,000 to $749,999 | 115 (3.9%) | 8 (0.3%) |
| $750,000 to $999,999 | 0 (0.0%) | 28 (1.0%) |
| $1,000,000 or more | 34 (1.2%) | 13 (0.5%) |
| Total | 2,925 (100.0%) | 2,719 (100.0%) |
Household Income by Mortgage Status in Ensley
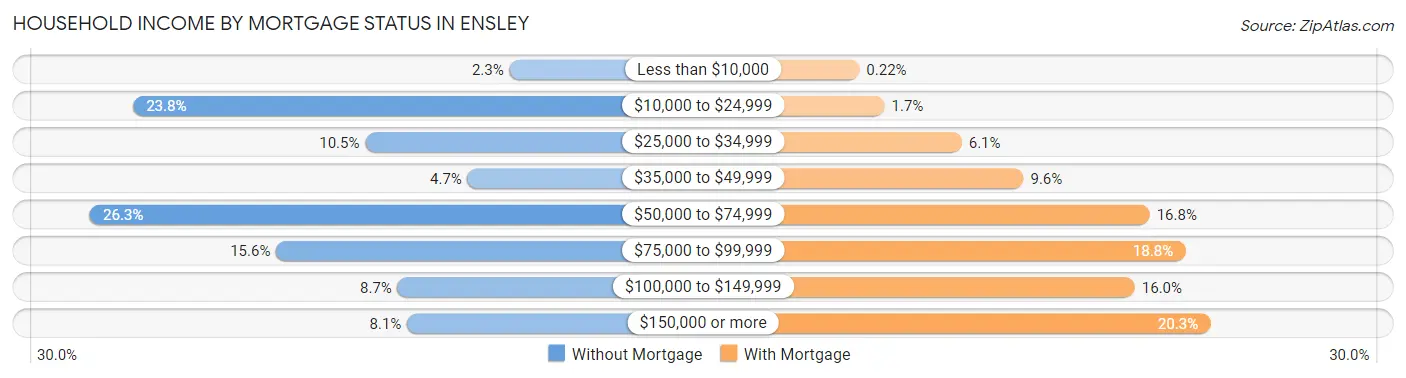
| Household Income | Without Mortgage | With Mortgage |
| Less than $10,000 | 67 (2.3%) | 6 (0.2%) |
| $10,000 to $24,999 | 696 (23.8%) | 45 (1.7%) |
| $25,000 to $34,999 | 308 (10.5%) | 165 (6.1%) |
| $35,000 to $49,999 | 137 (4.7%) | 261 (9.6%) |
| $50,000 to $74,999 | 768 (26.3%) | 457 (16.8%) |
| $75,000 to $99,999 | 457 (15.6%) | 512 (18.8%) |
| $100,000 to $149,999 | 254 (8.7%) | 434 (16.0%) |
| $150,000 or more | 238 (8.1%) | 551 (20.3%) |
| Total | 2,925 (100.0%) | 2,719 (100.0%) |
Property Value to Household Income Ratio in Ensley
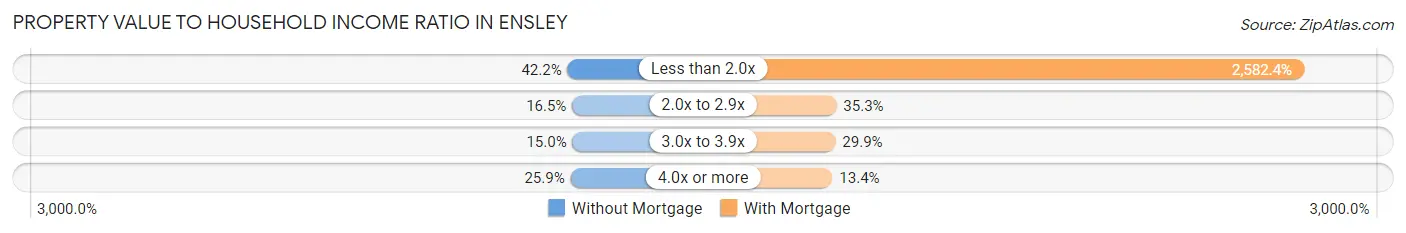
| Value-to-Income Ratio | Without Mortgage | With Mortgage |
| Less than 2.0x | 1,233 (42.1%) | 70,216 (2,582.4%) |
| 2.0x to 2.9x | 483 (16.5%) | 959 (35.3%) |
| 3.0x to 3.9x | 438 (15.0%) | 813 (29.9%) |
| 4.0x or more | 757 (25.9%) | 365 (13.4%) |
| Total | 2,925 (100.0%) | 2,719 (100.0%) |
Real Estate Taxes by Mortgage Status in Ensley
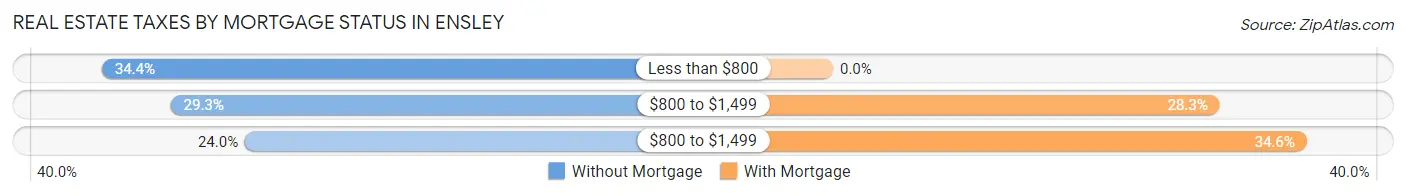
| Property Taxes | Without Mortgage | With Mortgage |
| Less than $800 | 1,005 (34.4%) | 0 (0.0%) |
| $800 to $1,499 | 858 (29.3%) | 768 (28.2%) |
| $800 to $1,499 | 701 (24.0%) | 941 (34.6%) |
| Total | 2,925 (100.0%) | 2,719 (100.0%) |
Health & Disability in Ensley
Health Insurance Coverage by Age in Ensley
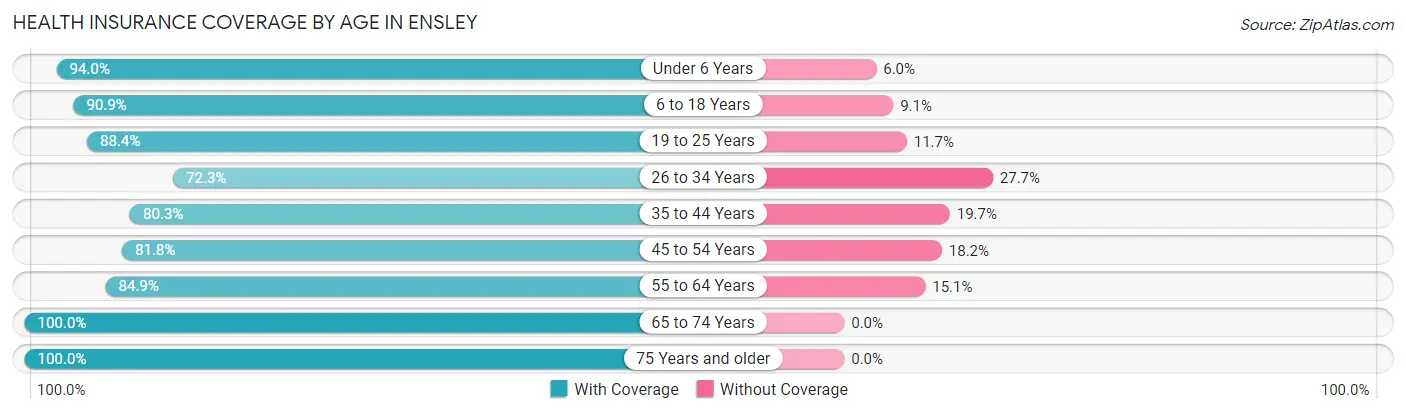
| Age Bracket | With Coverage | Without Coverage |
| Under 6 Years | 1,120 (94.0%) | 71 (6.0%) |
| 6 to 18 Years | 3,030 (90.9%) | 304 (9.1%) |
| 19 to 25 Years | 1,623 (88.3%) | 214 (11.7%) |
| 26 to 34 Years | 2,665 (72.3%) | 1,021 (27.7%) |
| 35 to 44 Years | 2,036 (80.3%) | 499 (19.7%) |
| 45 to 54 Years | 1,867 (81.8%) | 415 (18.2%) |
| 55 to 64 Years | 2,820 (84.9%) | 502 (15.1%) |
| 65 to 74 Years | 2,284 (100.0%) | 0 (0.0%) |
| 75 Years and older | 1,484 (100.0%) | 0 (0.0%) |
| Total | 18,929 (86.2%) | 3,026 (13.8%) |
Health Insurance Coverage by Citizenship Status in Ensley
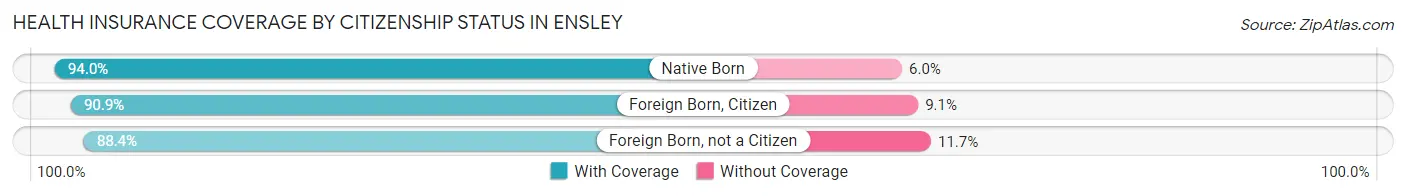
| Citizenship Status | With Coverage | Without Coverage |
| Native Born | 1,120 (94.0%) | 71 (6.0%) |
| Foreign Born, Citizen | 3,030 (90.9%) | 304 (9.1%) |
| Foreign Born, not a Citizen | 1,623 (88.3%) | 214 (11.7%) |
Health Insurance Coverage by Household Income in Ensley
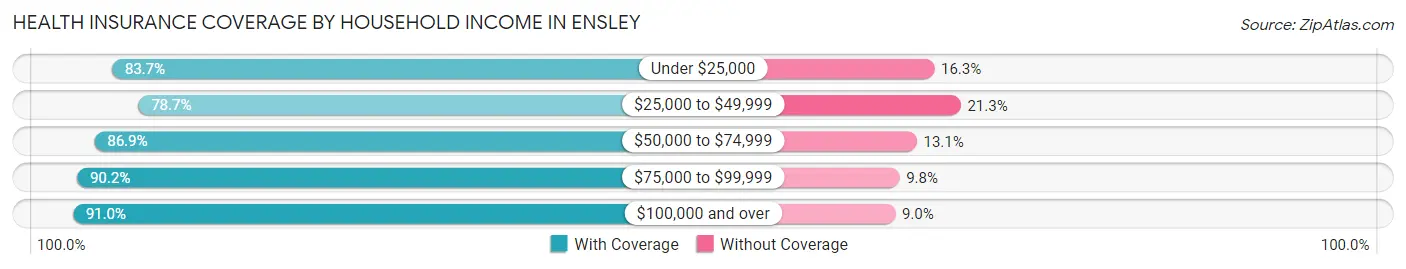
| Household Income | With Coverage | Without Coverage |
| Under $25,000 | 3,032 (83.7%) | 592 (16.3%) |
| $25,000 to $49,999 | 3,528 (78.7%) | 955 (21.3%) |
| $50,000 to $74,999 | 3,926 (86.9%) | 590 (13.1%) |
| $75,000 to $99,999 | 2,774 (90.2%) | 302 (9.8%) |
| $100,000 and over | 5,627 (91.0%) | 558 (9.0%) |
Public vs Private Health Insurance Coverage by Age in Ensley
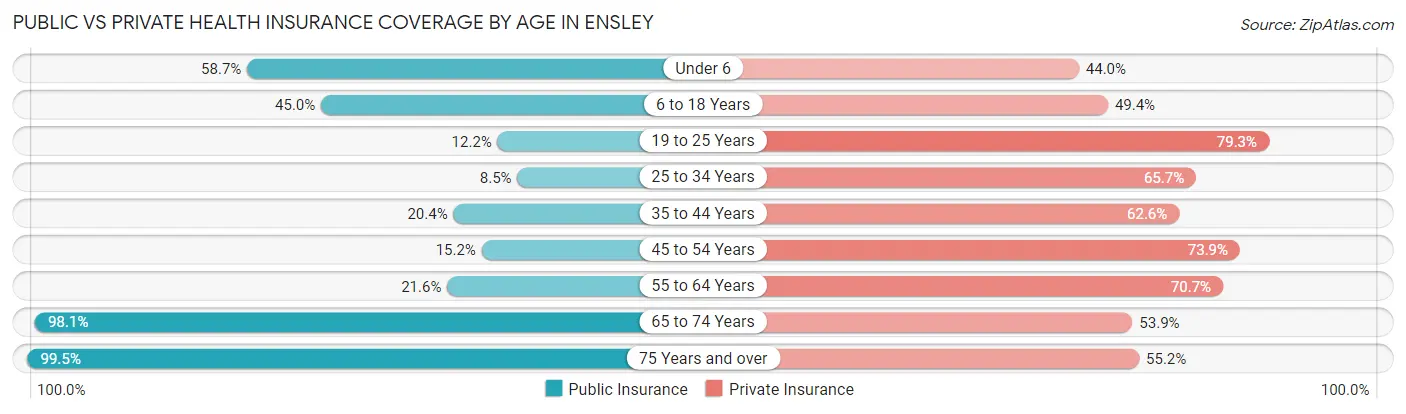
| Age Bracket | Public Insurance | Private Insurance |
| Under 6 | 699 (58.7%) | 524 (44.0%) |
| 6 to 18 Years | 1,499 (45.0%) | 1,647 (49.4%) |
| 19 to 25 Years | 224 (12.2%) | 1,456 (79.3%) |
| 25 to 34 Years | 314 (8.5%) | 2,423 (65.7%) |
| 35 to 44 Years | 517 (20.4%) | 1,587 (62.6%) |
| 45 to 54 Years | 346 (15.2%) | 1,686 (73.9%) |
| 55 to 64 Years | 716 (21.5%) | 2,350 (70.7%) |
| 65 to 74 Years | 2,240 (98.1%) | 1,232 (53.9%) |
| 75 Years and over | 1,476 (99.5%) | 819 (55.2%) |
| Total | 8,031 (36.6%) | 13,724 (62.5%) |
Disability Status by Sex by Age in Ensley
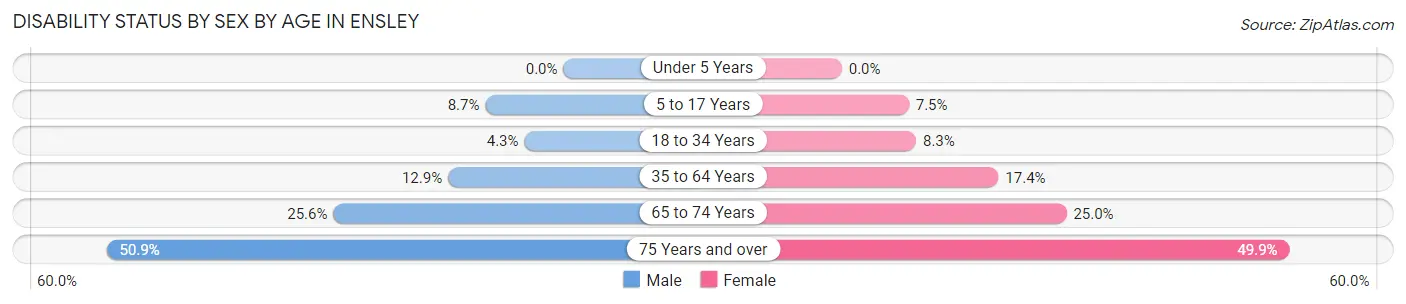
| Age Bracket | Male | Female |
| Under 5 Years | 0 (0.0%) | 0 (0.0%) |
| 5 to 17 Years | 148 (8.7%) | 126 (7.5%) |
| 18 to 34 Years | 125 (4.3%) | 235 (8.3%) |
| 35 to 64 Years | 544 (12.9%) | 681 (17.4%) |
| 65 to 74 Years | 277 (25.6%) | 301 (25.0%) |
| 75 Years and over | 261 (50.9%) | 484 (49.8%) |
Disability Class by Sex by Age in Ensley
Disability Class: Hearing Difficulty
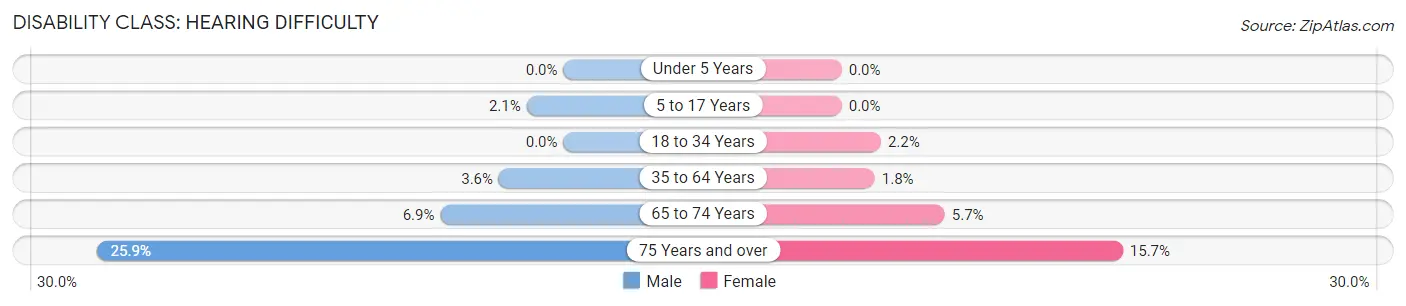
| Age Bracket | Male | Female |
| Under 5 Years | 0 (0.0%) | 0 (0.0%) |
| 5 to 17 Years | 35 (2.1%) | 0 (0.0%) |
| 18 to 34 Years | 0 (0.0%) | 62 (2.2%) |
| 35 to 64 Years | 152 (3.6%) | 72 (1.8%) |
| 65 to 74 Years | 74 (6.9%) | 69 (5.7%) |
| 75 Years and over | 133 (25.9%) | 152 (15.7%) |
Disability Class: Vision Difficulty
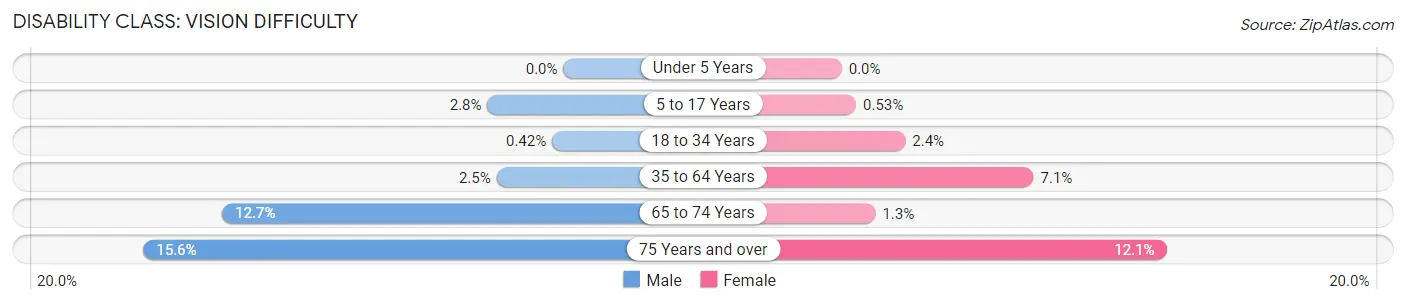
| Age Bracket | Male | Female |
| Under 5 Years | 0 (0.0%) | 0 (0.0%) |
| 5 to 17 Years | 48 (2.8%) | 9 (0.5%) |
| 18 to 34 Years | 12 (0.4%) | 67 (2.4%) |
| 35 to 64 Years | 105 (2.5%) | 278 (7.1%) |
| 65 to 74 Years | 137 (12.7%) | 15 (1.3%) |
| 75 Years and over | 80 (15.6%) | 117 (12.0%) |
Disability Class: Cognitive Difficulty
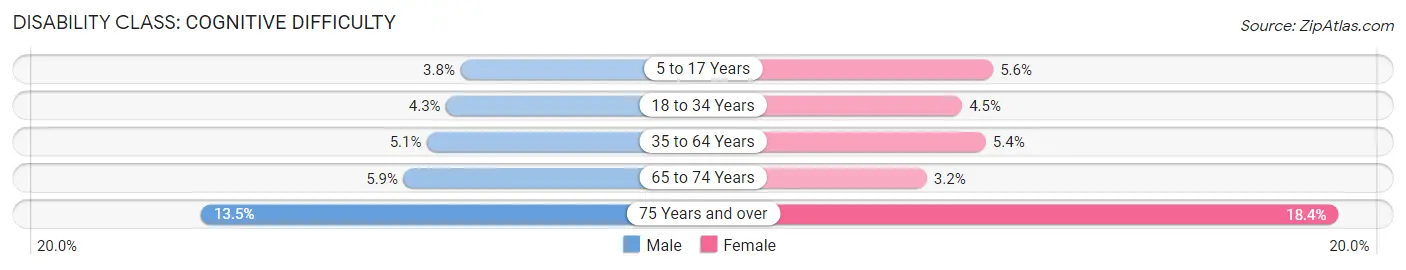
| Age Bracket | Male | Female |
| 5 to 17 Years | 65 (3.8%) | 95 (5.6%) |
| 18 to 34 Years | 125 (4.3%) | 127 (4.5%) |
| 35 to 64 Years | 214 (5.1%) | 209 (5.3%) |
| 65 to 74 Years | 64 (5.9%) | 38 (3.2%) |
| 75 Years and over | 69 (13.5%) | 179 (18.4%) |
Disability Class: Ambulatory Difficulty
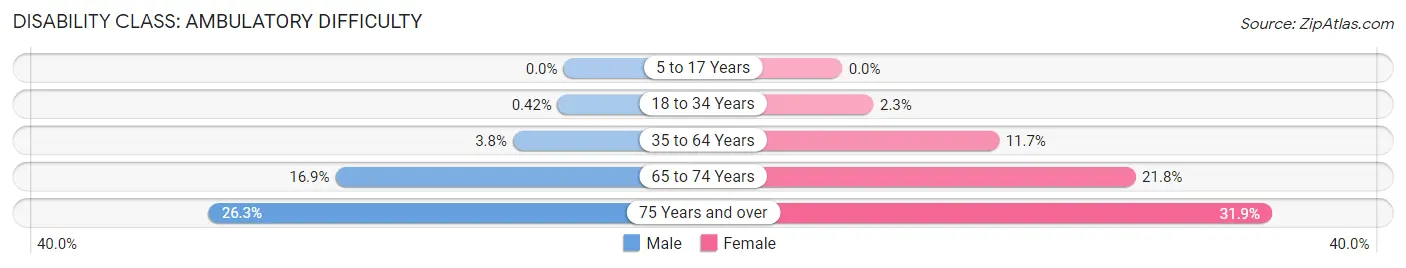
| Age Bracket | Male | Female |
| 5 to 17 Years | 0 (0.0%) | 0 (0.0%) |
| 18 to 34 Years | 12 (0.4%) | 66 (2.3%) |
| 35 to 64 Years | 159 (3.7%) | 455 (11.7%) |
| 65 to 74 Years | 183 (16.9%) | 262 (21.8%) |
| 75 Years and over | 135 (26.3%) | 310 (31.9%) |
Disability Class: Self-Care Difficulty
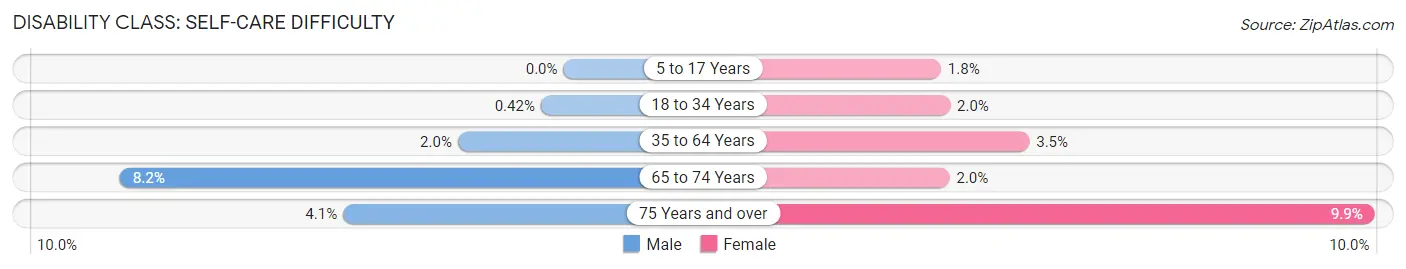
| Age Bracket | Male | Female |
| 5 to 17 Years | 0 (0.0%) | 31 (1.8%) |
| 18 to 34 Years | 12 (0.4%) | 57 (2.0%) |
| 35 to 64 Years | 83 (2.0%) | 136 (3.5%) |
| 65 to 74 Years | 89 (8.2%) | 24 (2.0%) |
| 75 Years and over | 21 (4.1%) | 96 (9.9%) |
Technology Access in Ensley
Computing Device Access in Ensley
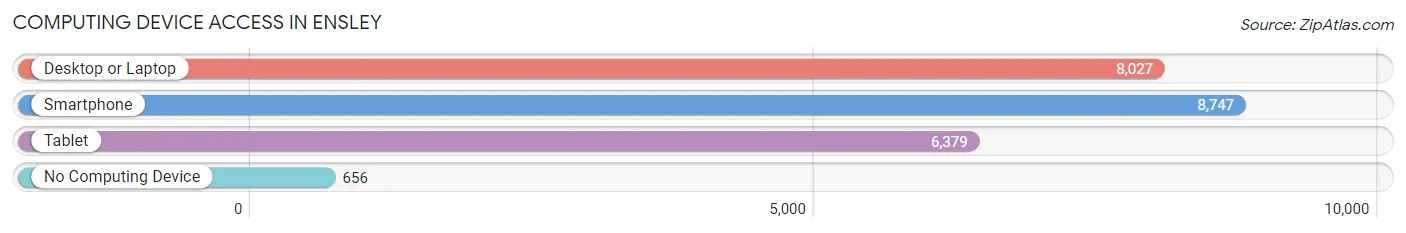
| Device Type | # Households | % Households |
| Desktop or Laptop | 8,027 | 82.1% |
| Smartphone | 8,747 | 89.4% |
| Tablet | 6,379 | 65.2% |
| No Computing Device | 656 | 6.7% |
| Total | 9,780 | 100.0% |
Internet Access in Ensley
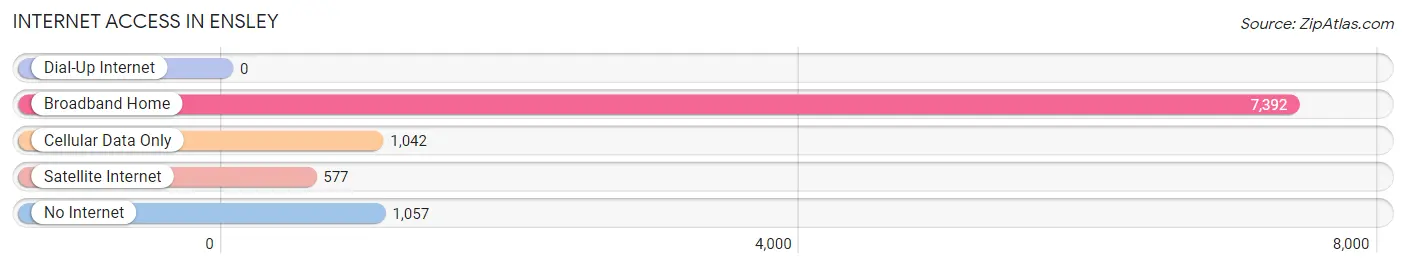
| Internet Type | # Households | % Households |
| Dial-Up Internet | 0 | 0.0% |
| Broadband Home | 7,392 | 75.6% |
| Cellular Data Only | 1,042 | 10.6% |
| Satellite Internet | 577 | 5.9% |
| No Internet | 1,057 | 10.8% |
| Total | 9,780 | 100.0% |
Ensley Summary
Ensley is a small unincorporated community located in Escambia County, Florida. It is situated on the western edge of the county, just south of the city of Pensacola. The community is bordered by the Escambia River to the north and the Blackwater River to the south. The population of Ensley was estimated to be 1,845 in 2019.
History
Ensley was first settled in the early 1800s by settlers from Georgia and Alabama. The community was named after a local family, the Ensleys, who were among the first settlers. The community was originally a farming community, with cotton and corn being the main crops. In the late 1800s, the community began to grow as the lumber industry began to expand in the area. The lumber industry provided jobs for many of the residents of Ensley, and the community began to grow.
In the early 1900s, the community began to develop further as the railroad came to the area. The railroad provided transportation for goods and people, and the community began to grow. The railroad also provided access to the nearby city of Pensacola, which allowed the residents of Ensley to access the city's services and amenities.
In the mid-1900s, the community began to decline as the lumber industry began to decline. The decline of the lumber industry caused many of the residents to move away, and the population of Ensley began to decline. In the late 1900s, the community began to experience a resurgence as the economy began to improve. The population of Ensley began to increase, and the community began to experience a period of growth.
Geography
Ensley is located in Escambia County, Florida. It is situated on the western edge of the county, just south of the city of Pensacola. The community is bordered by the Escambia River to the north and the Blackwater River to the south. The community is located in a rural area, and is surrounded by forests and wetlands. The climate in Ensley is humid subtropical, with hot summers and mild winters.
Economy
The economy of Ensley is largely based on agriculture and forestry. The community is home to several farms, which produce a variety of crops, including corn, cotton, soybeans, and peanuts. The lumber industry is also an important part of the economy, with several sawmills located in the area. The community is also home to several small businesses, including restaurants, convenience stores, and gas stations.
Demographics
The population of Ensley was estimated to be 1,845 in 2019. The racial makeup of the community is predominantly white, with African Americans making up the second largest racial group. The median household income in Ensley is $37,945, and the median home value is $117,400. The unemployment rate in the community is 5.2%, which is lower than the national average. The poverty rate in Ensley is 17.3%, which is higher than the national average.
Common Questions
What is Per Capita Income in Ensley?
Per Capita income in Ensley is $31,494.
What is the Median Family Income in Ensley?
Median Family Income in Ensley is $64,825.
What is the Median Household income in Ensley?
Median Household Income in Ensley is $57,232.
What is Income or Wage Gap in Ensley?
Income or Wage Gap in Ensley is 32.5%.
Women in Ensley earn 67.5 cents for every dollar earned by a man.
What is Family Income Deficit in Ensley?
Family Income Deficit in Ensley is $8,236.
Families that are below poverty line in Ensley earn $8,236 less on average than the poverty threshold level.
What is Inequality or Gini Index in Ensley?
Inequality or Gini Index in Ensley is 0.41.
What is the Total Population of Ensley?
Total Population of Ensley is 22,148.
What is the Total Male Population of Ensley?
Total Male Population of Ensley is 11,054.
What is the Total Female Population of Ensley?
Total Female Population of Ensley is 11,094.
What is the Ratio of Males per 100 Females in Ensley?
There are 99.64 Males per 100 Females in Ensley.
What is the Ratio of Females per 100 Males in Ensley?
There are 100.36 Females per 100 Males in Ensley.
What is the Median Population Age in Ensley?
Median Population Age in Ensley is 38.2 Years.
What is the Average Family Size in Ensley
Average Family Size in Ensley is 2.9 People.
What is the Average Household Size in Ensley
Average Household Size in Ensley is 2.2 People.
How Large is the Labor Force in Ensley?
There are 11,777 People in the Labor Forcein in Ensley.
What is the Percentage of People in the Labor Force in Ensley?
64.0% of People are in the Labor Force in Ensley.
What is the Unemployment Rate in Ensley?
Unemployment Rate in Ensley is 6.0%.