Pine Island Center, FL Map & Demographics
Pine Island Center Map
Pine Island Center Overview
$29,396
PER CAPITA INCOME
$67,679
AVG FAMILY INCOME
$55,565
AVG HOUSEHOLD INCOME
25.6%
WAGE / INCOME GAP [ % ]
74.4¢/ $1
WAGE / INCOME GAP [ $ ]
0.41
INEQUALITY / GINI INDEX
1,626
TOTAL POPULATION
761
MALE POPULATION
865
FEMALE POPULATION
87.98
MALES / 100 FEMALES
113.67
FEMALES / 100 MALES
58.2
MEDIAN AGE
3.0
AVG FAMILY SIZE
2.4
AVG HOUSEHOLD SIZE
627
LABOR FORCE [ PEOPLE ]
45.0%
PERCENT IN LABOR FORCE
1.9%
UNEMPLOYMENT RATE
Income in Pine Island Center
Income Overview in Pine Island Center
Per Capita Income in Pine Island Center is $29,396, while median incomes of families and households are $67,679 and $55,565 respectively.
| Characteristic | Number | Measure |
| Per Capita Income | 1,626 | $29,396 |
| Median Family Income | 406 | $67,679 |
| Mean Family Income | 406 | $79,199 |
| Median Household Income | 682 | $55,565 |
| Mean Household Income | 682 | $64,547 |
| Income Deficit | 406 | $0 |
| Wage / Income Gap (%) | 1,626 | 25.63% |
| Wage / Income Gap ($) | 1,626 | 74.37¢ per $1 |
| Gini / Inequality Index | 1,626 | 0.41 |
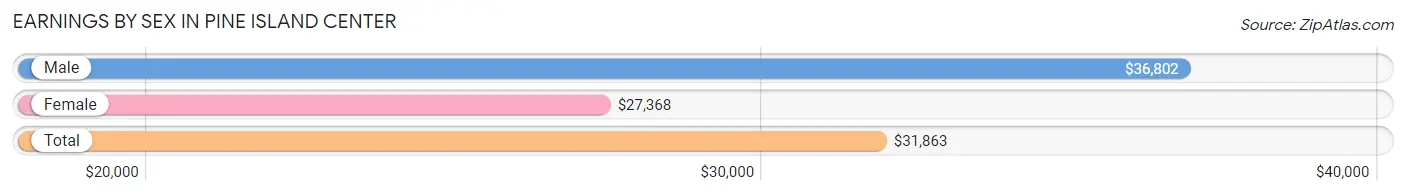
Earnings by Sex in Pine Island Center
Average Earnings in Pine Island Center are $31,863, $36,802 for men and $27,368 for women, a difference of 25.6%.
| Sex | Number | Average Earnings |
| Male | 338 (51.5%) | $36,802 |
| Female | 318 (48.5%) | $27,368 |
| Total | 656 (100.0%) | $31,863 |
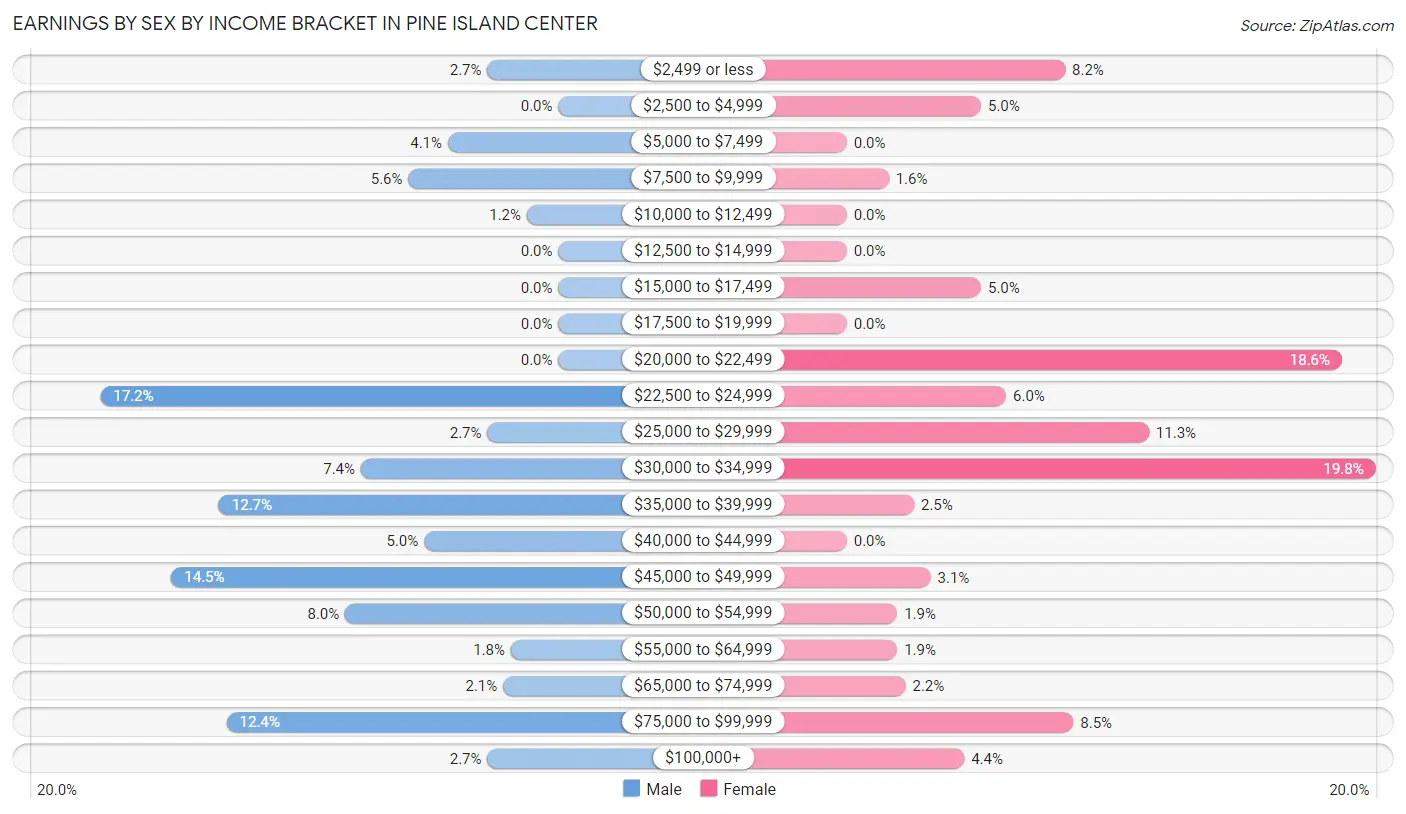
Earnings by Sex by Income Bracket in Pine Island Center
The most common earnings brackets in Pine Island Center are $22,500 to $24,999 for men (58 | 17.2%) and $30,000 to $34,999 for women (63 | 19.8%).
| Income | Male | Female |
| $2,499 or less | 9 (2.7%) | 26 (8.2%) |
| $2,500 to $4,999 | 0 (0.0%) | 16 (5.0%) |
| $5,000 to $7,499 | 14 (4.1%) | 0 (0.0%) |
| $7,500 to $9,999 | 19 (5.6%) | 5 (1.6%) |
| $10,000 to $12,499 | 4 (1.2%) | 0 (0.0%) |
| $12,500 to $14,999 | 0 (0.0%) | 0 (0.0%) |
| $15,000 to $17,499 | 0 (0.0%) | 16 (5.0%) |
| $17,500 to $19,999 | 0 (0.0%) | 0 (0.0%) |
| $20,000 to $22,499 | 0 (0.0%) | 59 (18.5%) |
| $22,500 to $24,999 | 58 (17.2%) | 19 (6.0%) |
| $25,000 to $29,999 | 9 (2.7%) | 36 (11.3%) |
| $30,000 to $34,999 | 25 (7.4%) | 63 (19.8%) |
| $35,000 to $39,999 | 43 (12.7%) | 8 (2.5%) |
| $40,000 to $44,999 | 17 (5.0%) | 0 (0.0%) |
| $45,000 to $49,999 | 49 (14.5%) | 10 (3.1%) |
| $50,000 to $54,999 | 27 (8.0%) | 6 (1.9%) |
| $55,000 to $64,999 | 6 (1.8%) | 6 (1.9%) |
| $65,000 to $74,999 | 7 (2.1%) | 7 (2.2%) |
| $75,000 to $99,999 | 42 (12.4%) | 27 (8.5%) |
| $100,000+ | 9 (2.7%) | 14 (4.4%) |
| Total | 338 (100.0%) | 318 (100.0%) |
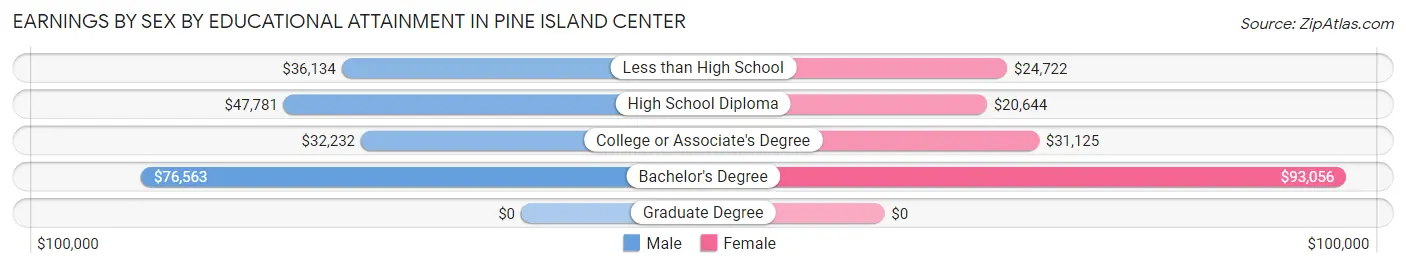
Earnings by Sex by Educational Attainment in Pine Island Center
Average earnings in Pine Island Center are $42,386 for men and $27,039 for women, a difference of 36.2%. Men with an educational attainment of bachelor's degree enjoy the highest average annual earnings of $76,563, while those with college or associate's degree education earn the least with $32,232. Women with an educational attainment of bachelor's degree earn the most with the average annual earnings of $93,056, while those with high school diploma education have the smallest earnings of $20,644.
| Educational Attainment | Male Income | Female Income |
| Less than High School | $36,134 | $24,722 |
| High School Diploma | $47,781 | $20,644 |
| College or Associate's Degree | $32,232 | $31,125 |
| Bachelor's Degree | $76,563 | $93,056 |
| Graduate Degree | - | - |
| Total | $42,386 | $27,039 |
Family Income in Pine Island Center
Family Income Brackets in Pine Island Center
According to the Pine Island Center family income data, there are 112 families falling into the $50,000 to $74,999 income range, which is the most common income bracket and makes up 27.6% of all families. Conversely, the $200,000+ income bracket is the least frequent group with only 7 families (1.7%) belonging to this category.
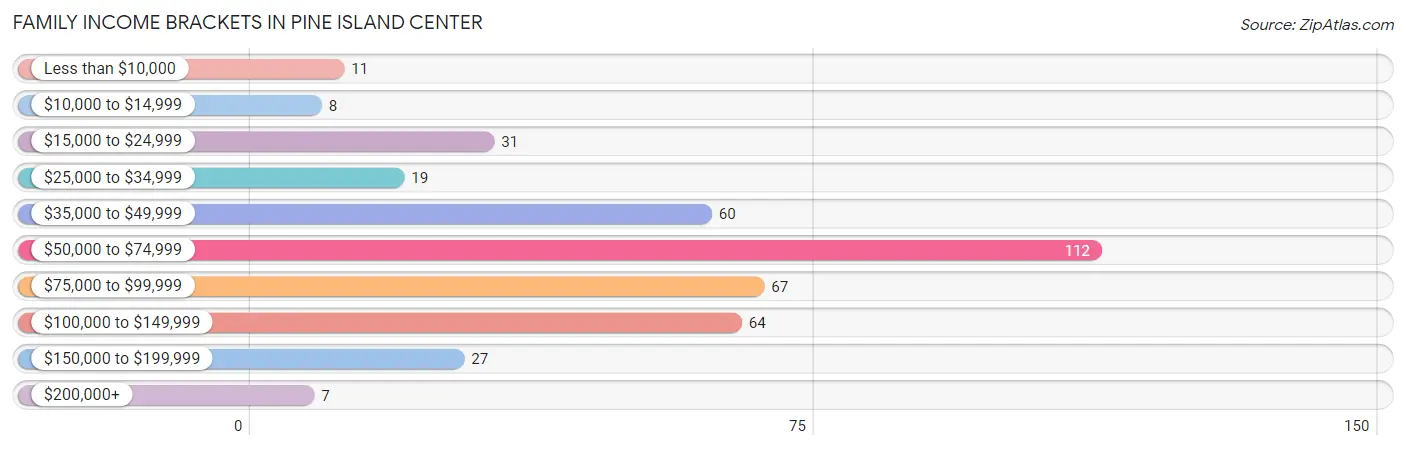
| Income Bracket | # Families | % Families |
| Less than $10,000 | 11 | 2.7% |
| $10,000 to $14,999 | 8 | 2.0% |
| $15,000 to $24,999 | 31 | 7.6% |
| $25,000 to $34,999 | 19 | 4.7% |
| $35,000 to $49,999 | 60 | 14.8% |
| $50,000 to $74,999 | 112 | 27.6% |
| $75,000 to $99,999 | 67 | 16.5% |
| $100,000 to $149,999 | 64 | 15.8% |
| $150,000 to $199,999 | 27 | 6.7% |
| $200,000+ | 7 | 1.7% |
Family Income by Famaliy Size in Pine Island Center
3-person families (64 | 15.8%) account for the highest median family income in Pine Island Center with $91,250 per family, while 2-person families (252 | 62.1%) have the highest median income of $34,196 per family member.
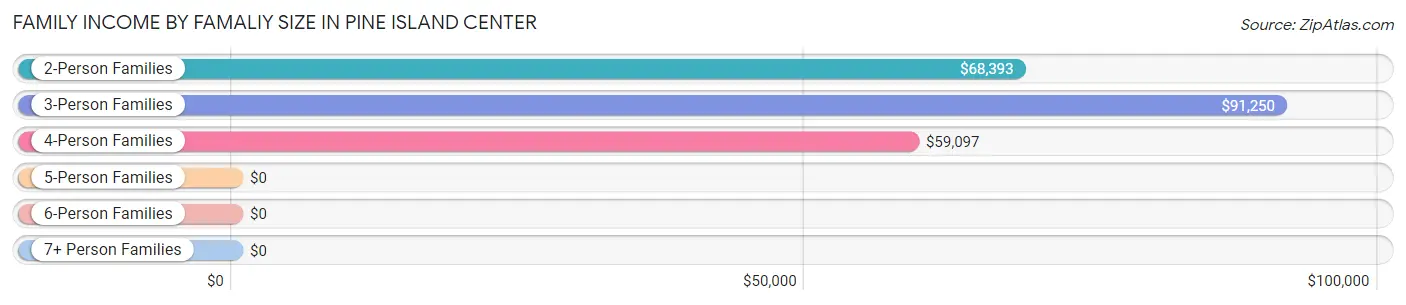
| Income Bracket | # Families | Median Income |
| 2-Person Families | 252 (62.1%) | $68,393 |
| 3-Person Families | 64 (15.8%) | $91,250 |
| 4-Person Families | 31 (7.6%) | $59,097 |
| 5-Person Families | 59 (14.5%) | $0 |
| 6-Person Families | 0 (0.0%) | $0 |
| 7+ Person Families | 0 (0.0%) | $0 |
| Total | 406 (100.0%) | $67,679 |
Family Income by Number of Earners in Pine Island Center
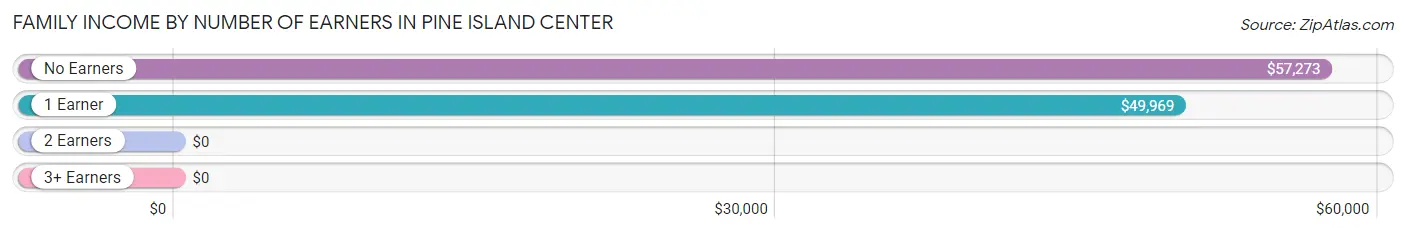
| Number of Earners | # Families | Median Income |
| No Earners | 154 (37.9%) | $57,273 |
| 1 Earner | 113 (27.8%) | $49,969 |
| 2 Earners | 118 (29.1%) | $0 |
| 3+ Earners | 21 (5.2%) | $0 |
| Total | 406 (100.0%) | $67,679 |
Household Income in Pine Island Center
Household Income Brackets in Pine Island Center
With 158 households falling in the category, the $50,000 to $74,999 income range is the most frequent in Pine Island Center, accounting for 23.2% of all households. In contrast, only 7 households (1.0%) fall into the $200,000+ income bracket, making it the least populous group.
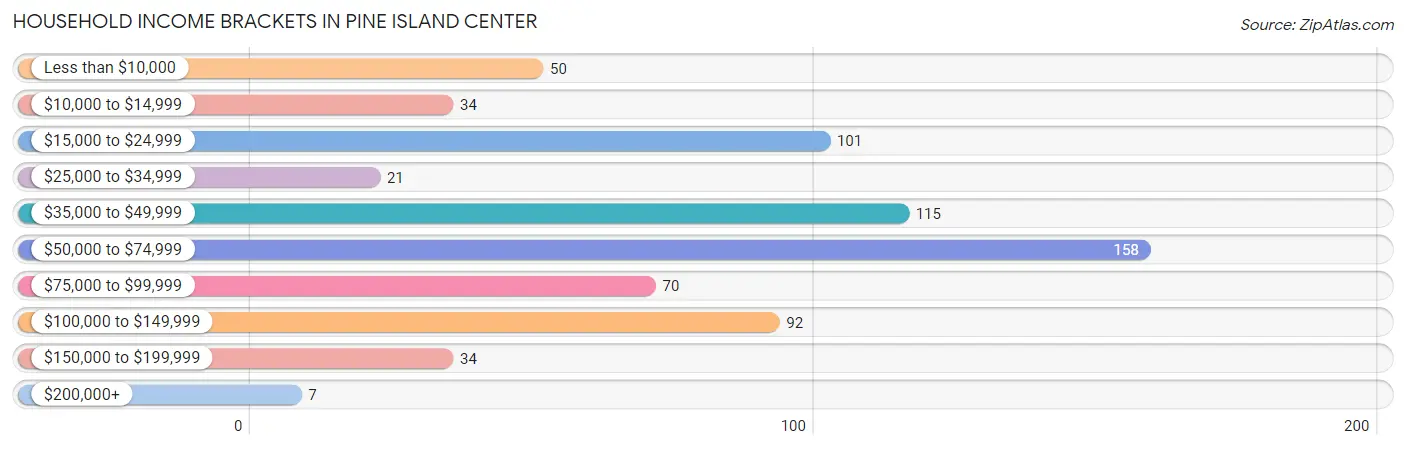
| Income Bracket | # Households | % Households |
| Less than $10,000 | 50 | 7.3% |
| $10,000 to $14,999 | 34 | 5.0% |
| $15,000 to $24,999 | 101 | 14.8% |
| $25,000 to $34,999 | 21 | 3.1% |
| $35,000 to $49,999 | 115 | 16.9% |
| $50,000 to $74,999 | 158 | 23.2% |
| $75,000 to $99,999 | 70 | 10.3% |
| $100,000 to $149,999 | 92 | 13.5% |
| $150,000 to $199,999 | 34 | 5.0% |
| $200,000+ | 7 | 1.0% |
Household Income by Householder Age in Pine Island Center
The median household income in Pine Island Center is $55,565, with the highest median household income of $59,653 found in the 25 to 44 years age bracket for the primary householder. A total of 147 households (21.5%) fall into this category. Meanwhile, the 15 to 24 years age bracket for the primary householder has the lowest median household income of $0, with 19 households (2.8%) in this group.
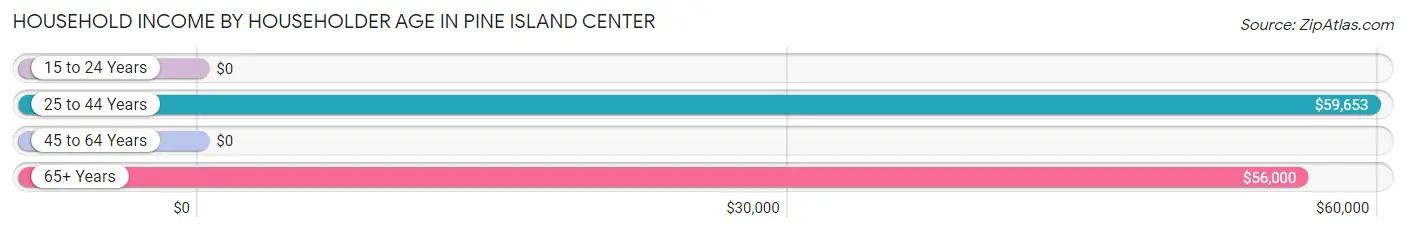
| Income Bracket | # Households | Median Income |
| 15 to 24 Years | 19 (2.8%) | $0 |
| 25 to 44 Years | 147 (21.5%) | $59,653 |
| 45 to 64 Years | 218 (32.0%) | $0 |
| 65+ Years | 298 (43.7%) | $56,000 |
| Total | 682 (100.0%) | $55,565 |
Poverty in Pine Island Center
Income Below Poverty by Sex and Age in Pine Island Center
With 11.4% poverty level for males and 15.5% for females among the residents of Pine Island Center, 35 to 44 year old males and 45 to 54 year old females are the most vulnerable to poverty, with 18 males (20.0%) and 29 females (64.4%) in their respective age groups living below the poverty level.
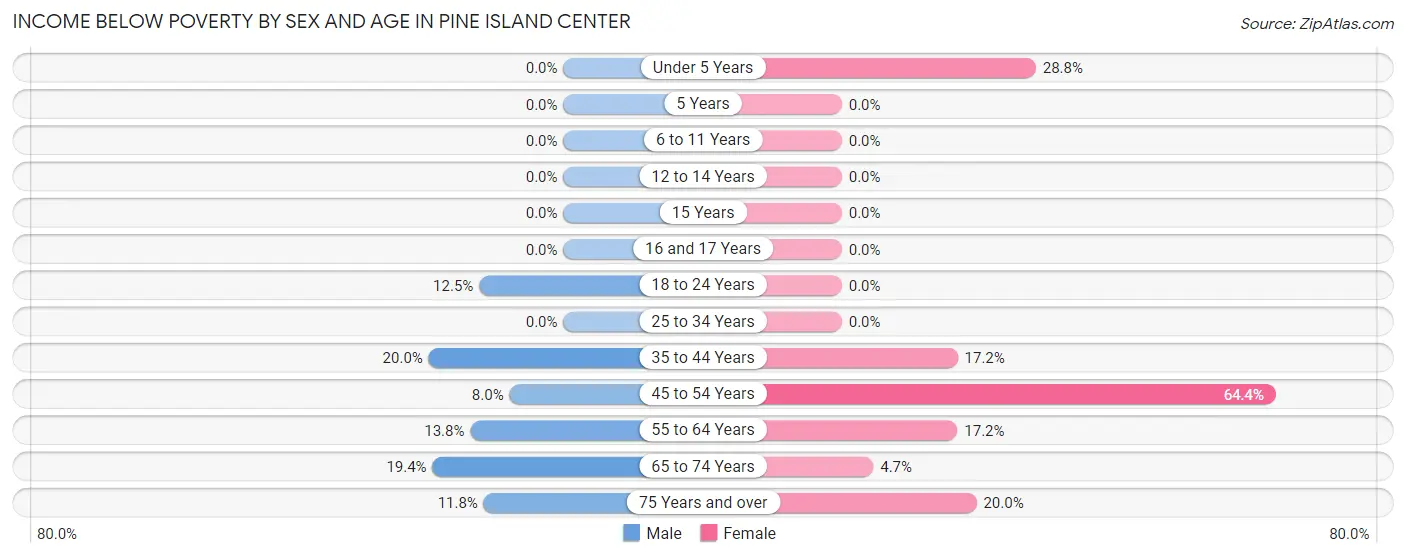
| Age Bracket | Male | Female |
| Under 5 Years | 0 (0.0%) | 17 (28.8%) |
| 5 Years | 0 (0.0%) | 0 (0.0%) |
| 6 to 11 Years | 0 (0.0%) | 0 (0.0%) |
| 12 to 14 Years | 0 (0.0%) | 0 (0.0%) |
| 15 Years | 0 (0.0%) | 0 (0.0%) |
| 16 and 17 Years | 0 (0.0%) | 0 (0.0%) |
| 18 to 24 Years | 7 (12.5%) | 0 (0.0%) |
| 25 to 34 Years | 0 (0.0%) | 0 (0.0%) |
| 35 to 44 Years | 18 (20.0%) | 16 (17.2%) |
| 45 to 54 Years | 6 (8.0%) | 29 (64.4%) |
| 55 to 64 Years | 17 (13.8%) | 35 (17.2%) |
| 65 to 74 Years | 28 (19.4%) | 8 (4.7%) |
| 75 Years and over | 11 (11.8%) | 29 (20.0%) |
| Total | 87 (11.4%) | 134 (15.5%) |
Income Above Poverty by Sex and Age in Pine Island Center
According to the poverty statistics in Pine Island Center, males aged under 5 years and females aged 6 to 11 years are the age groups that are most secure financially, with 100.0% of males and 100.0% of females in these age groups living above the poverty line.
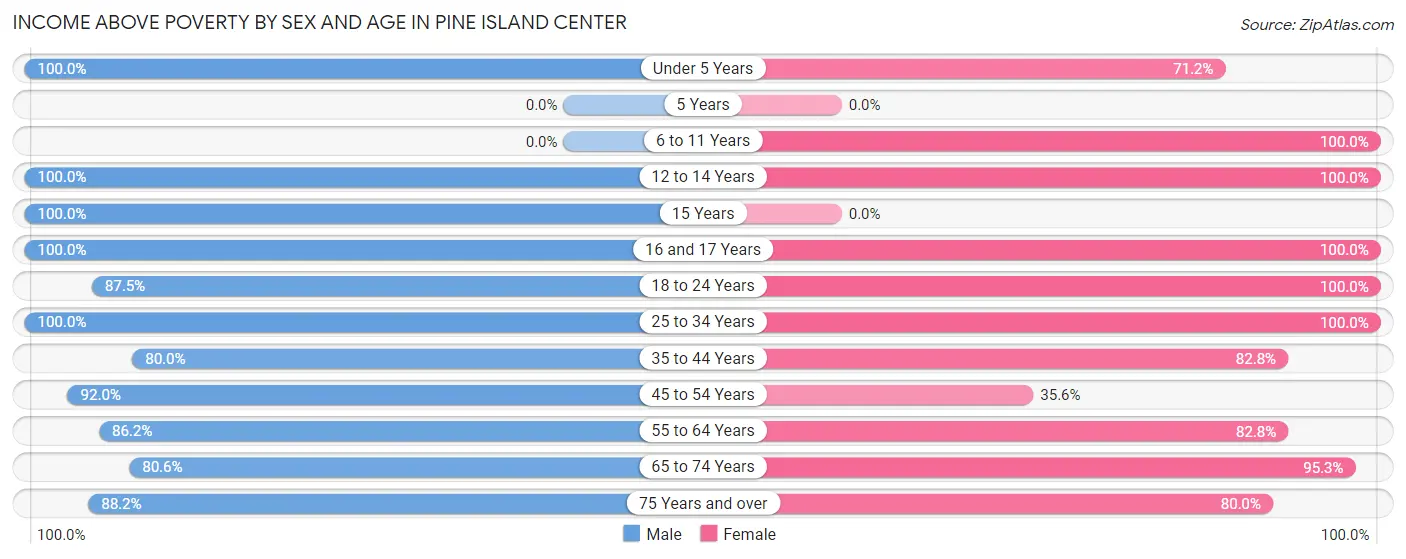
| Age Bracket | Male | Female |
| Under 5 Years | 13 (100.0%) | 42 (71.2%) |
| 5 Years | 0 (0.0%) | 0 (0.0%) |
| 6 to 11 Years | 0 (0.0%) | 28 (100.0%) |
| 12 to 14 Years | 55 (100.0%) | 28 (100.0%) |
| 15 Years | 49 (100.0%) | 0 (0.0%) |
| 16 and 17 Years | 18 (100.0%) | 6 (100.0%) |
| 18 to 24 Years | 49 (87.5%) | 45 (100.0%) |
| 25 to 34 Years | 45 (100.0%) | 41 (100.0%) |
| 35 to 44 Years | 72 (80.0%) | 77 (82.8%) |
| 45 to 54 Years | 69 (92.0%) | 16 (35.6%) |
| 55 to 64 Years | 106 (86.2%) | 169 (82.8%) |
| 65 to 74 Years | 116 (80.6%) | 163 (95.3%) |
| 75 Years and over | 82 (88.2%) | 116 (80.0%) |
| Total | 674 (88.6%) | 731 (84.5%) |
Income Below Poverty Among Married-Couple Families in Pine Island Center
The poverty statistics for married-couple families in Pine Island Center show that 9.9% or 37 of the total 374 families live below the poverty line. Families with 1 or 2 children have the highest poverty rate of 15.9%, comprising of 11 families. On the other hand, families with 3 or 4 children have the lowest poverty rate of 0.0%, which includes 0 families.
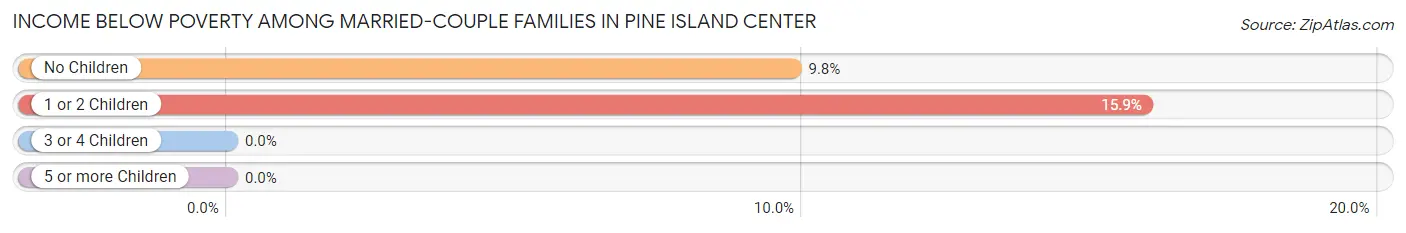
| Children | Above Poverty | Below Poverty |
| No Children | 239 (90.2%) | 26 (9.8%) |
| 1 or 2 Children | 58 (84.1%) | 11 (15.9%) |
| 3 or 4 Children | 40 (100.0%) | 0 (0.0%) |
| 5 or more Children | 0 (0.0%) | 0 (0.0%) |
| Total | 337 (90.1%) | 37 (9.9%) |
Income Below Poverty Among Single-Parent Households in Pine Island Center
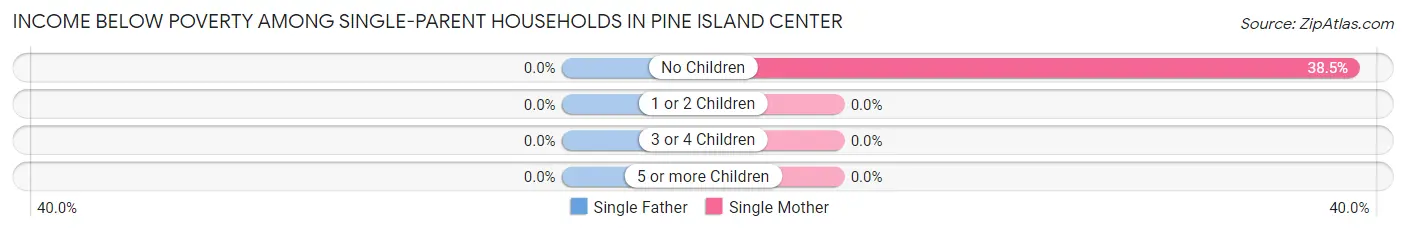
| Children | Single Father | Single Mother |
| No Children | 0 (0.0%) | 5 (38.5%) |
| 1 or 2 Children | 0 (0.0%) | 0 (0.0%) |
| 3 or 4 Children | 0 (0.0%) | 0 (0.0%) |
| 5 or more Children | 0 (0.0%) | 0 (0.0%) |
| Total | 0 (0.0%) | 5 (15.6%) |
Income Below Poverty Among Married-Couple vs Single-Parent Households in Pine Island Center
The poverty data for Pine Island Center shows that 37 of the married-couple family households (9.9%) and 5 of the single-parent households (15.6%) are living below the poverty level. Within the married-couple family households, those with 1 or 2 children have the highest poverty rate, with 11 households (15.9%) falling below the poverty line. Among the single-parent households, those with no children have the highest poverty rate, with 5 household (38.5%) living below poverty.
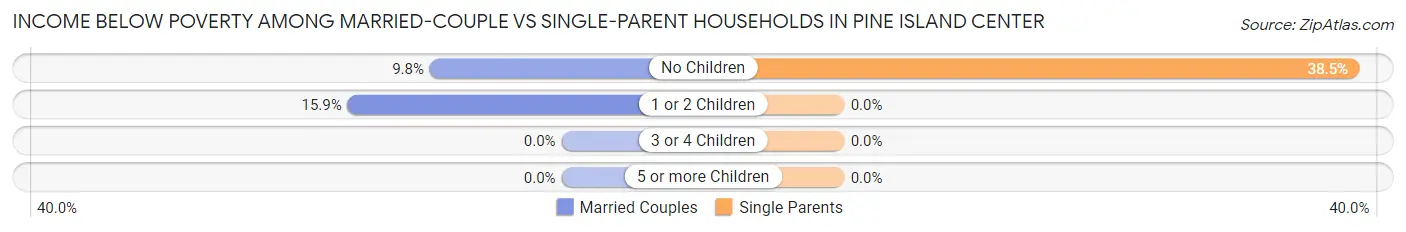
| Children | Married-Couple Families | Single-Parent Households |
| No Children | 26 (9.8%) | 5 (38.5%) |
| 1 or 2 Children | 11 (15.9%) | 0 (0.0%) |
| 3 or 4 Children | 0 (0.0%) | 0 (0.0%) |
| 5 or more Children | 0 (0.0%) | 0 (0.0%) |
| Total | 37 (9.9%) | 5 (15.6%) |
Race in Pine Island Center
The most populous races in Pine Island Center are White / Caucasian (1,391 | 85.6%), Hispanic or Latino (273 | 16.8%), and Two or more Races (207 | 12.7%).
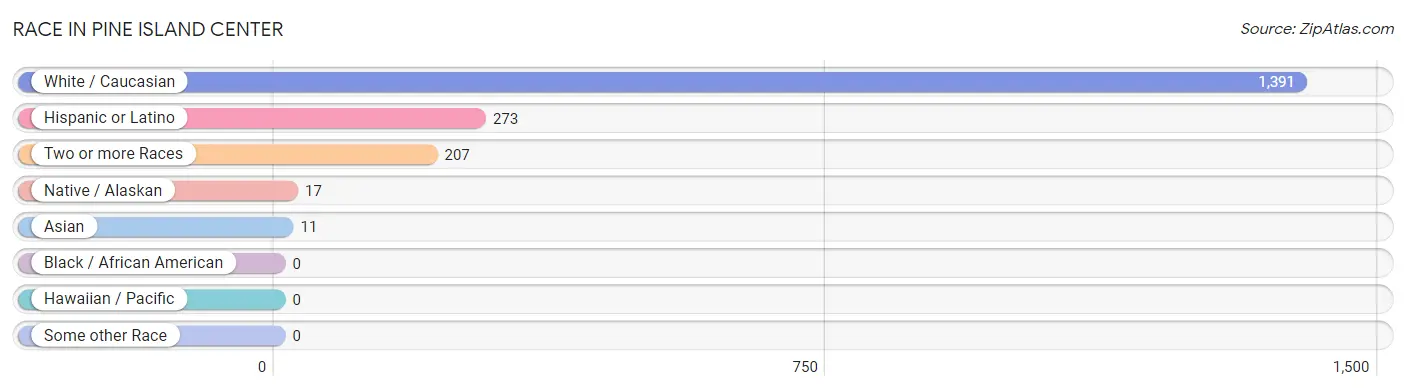
| Race | # Population | % Population |
| Asian | 11 | 0.7% |
| Black / African American | 0 | 0.0% |
| Hawaiian / Pacific | 0 | 0.0% |
| Hispanic or Latino | 273 | 16.8% |
| Native / Alaskan | 17 | 1.1% |
| White / Caucasian | 1,391 | 85.6% |
| Two or more Races | 207 | 12.7% |
| Some other Race | 0 | 0.0% |
| Total | 1,626 | 100.0% |
Ancestry in Pine Island Center
The most populous ancestries reported in Pine Island Center are German (283 | 17.4%), Irish (209 | 12.9%), Central American (185 | 11.4%), Guatemalan (185 | 11.4%), and English (143 | 8.8%), together accounting for 61.8% of all Pine Island Center residents.
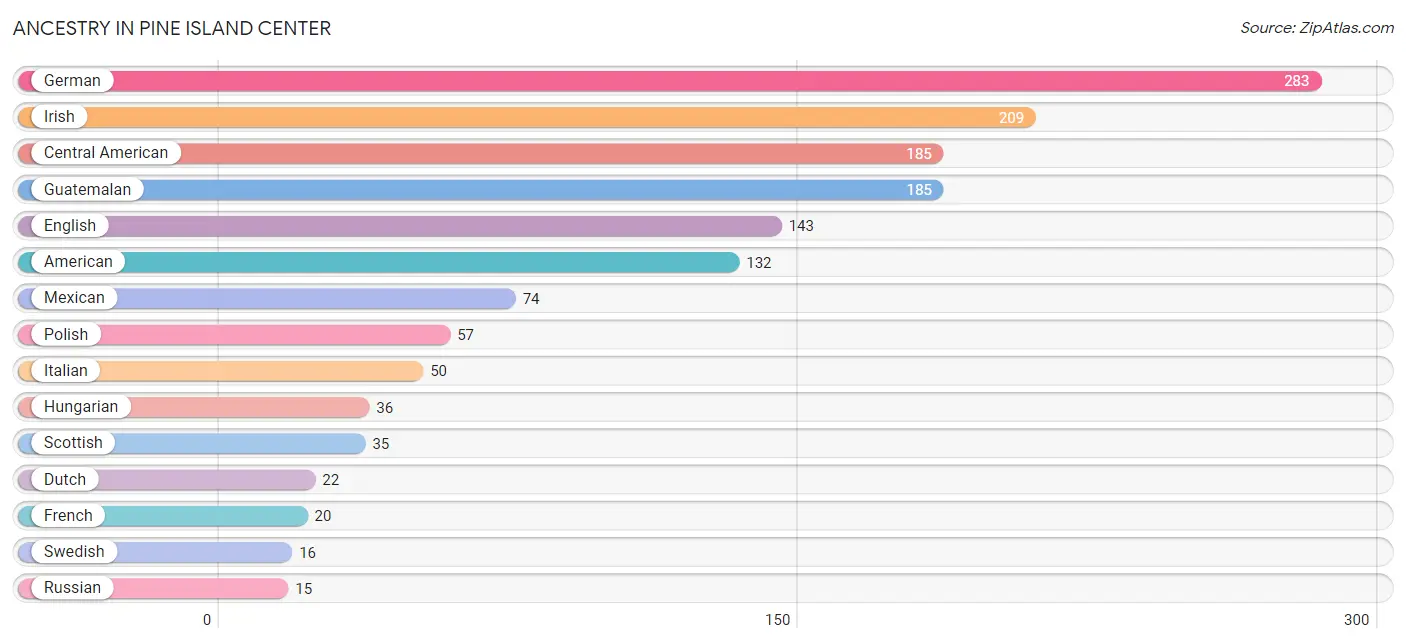
| Ancestry | # Population | % Population |
| Alaska Native | 7 | 0.4% |
| American | 132 | 8.1% |
| British | 6 | 0.4% |
| Central American | 185 | 11.4% |
| Chickasaw | 7 | 0.4% |
| Cuban | 6 | 0.4% |
| Dutch | 22 | 1.3% |
| English | 143 | 8.8% |
| European | 9 | 0.5% |
| French | 20 | 1.2% |
| German | 283 | 17.4% |
| Guatemalan | 185 | 11.4% |
| Hungarian | 36 | 2.2% |
| Irish | 209 | 12.9% |
| Italian | 50 | 3.1% |
| Korean | 11 | 0.7% |
| Mexican | 74 | 4.5% |
| Polish | 57 | 3.5% |
| Puerto Rican | 8 | 0.5% |
| Russian | 15 | 0.9% |
| Scandinavian | 11 | 0.7% |
| Scotch-Irish | 11 | 0.7% |
| Scottish | 35 | 2.1% |
| Sioux | 2 | 0.1% |
| Swedish | 16 | 1.0% |
| Thai | 7 | 0.4% |
| Welsh | 14 | 0.9% | View All 27 Rows |
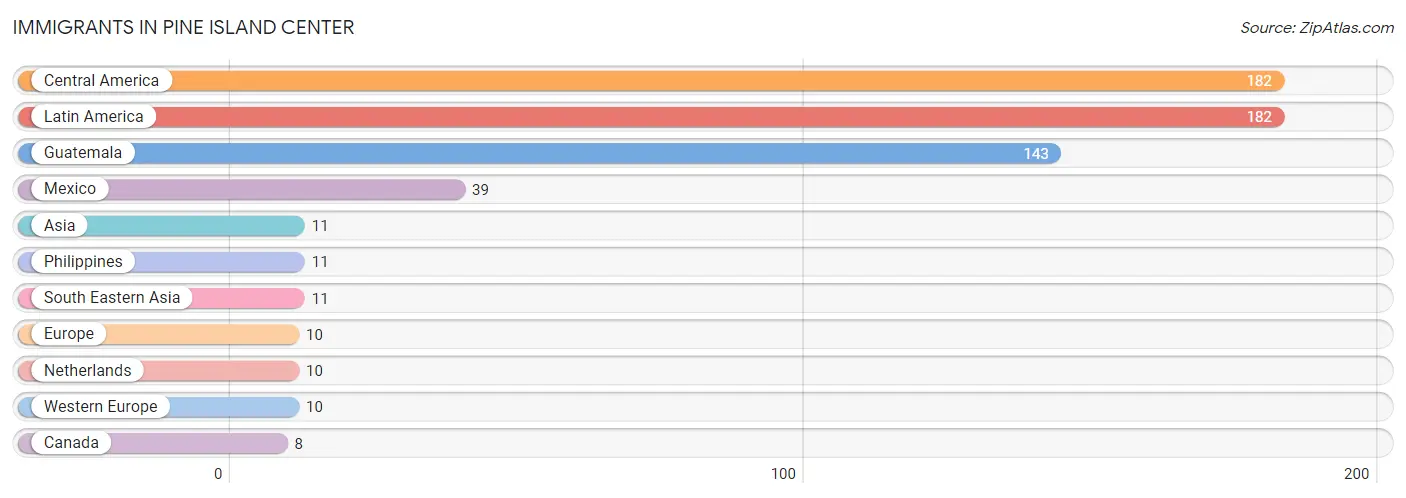
Immigrants in Pine Island Center
The most numerous immigrant groups reported in Pine Island Center came from Central America (182 | 11.2%), Latin America (182 | 11.2%), Guatemala (143 | 8.8%), Mexico (39 | 2.4%), and Asia (11 | 0.7%), together accounting for 34.2% of all Pine Island Center residents.
| Immigration Origin | # Population | % Population |
| Asia | 11 | 0.7% |
| Canada | 8 | 0.5% |
| Central America | 182 | 11.2% |
| Europe | 10 | 0.6% |
| Guatemala | 143 | 8.8% |
| Latin America | 182 | 11.2% |
| Mexico | 39 | 2.4% |
| Netherlands | 10 | 0.6% |
| Philippines | 11 | 0.7% |
| South Eastern Asia | 11 | 0.7% |
| Western Europe | 10 | 0.6% | View All 11 Rows |
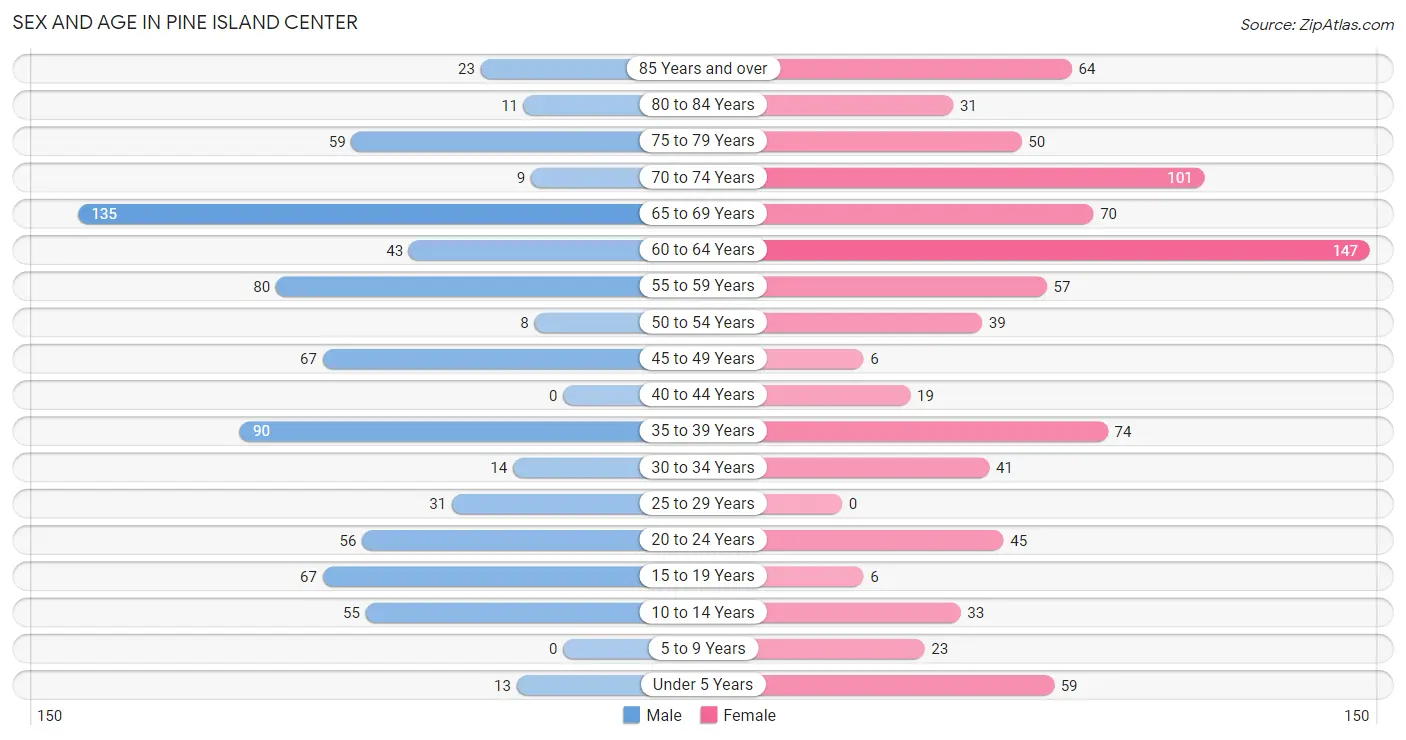
Sex and Age in Pine Island Center
Sex and Age in Pine Island Center
The most populous age groups in Pine Island Center are 65 to 69 Years (135 | 17.7%) for men and 60 to 64 Years (147 | 17.0%) for women.
| Age Bracket | Male | Female |
| Under 5 Years | 13 (1.7%) | 59 (6.8%) |
| 5 to 9 Years | 0 (0.0%) | 23 (2.7%) |
| 10 to 14 Years | 55 (7.2%) | 33 (3.8%) |
| 15 to 19 Years | 67 (8.8%) | 6 (0.7%) |
| 20 to 24 Years | 56 (7.4%) | 45 (5.2%) |
| 25 to 29 Years | 31 (4.1%) | 0 (0.0%) |
| 30 to 34 Years | 14 (1.8%) | 41 (4.7%) |
| 35 to 39 Years | 90 (11.8%) | 74 (8.6%) |
| 40 to 44 Years | 0 (0.0%) | 19 (2.2%) |
| 45 to 49 Years | 67 (8.8%) | 6 (0.7%) |
| 50 to 54 Years | 8 (1.1%) | 39 (4.5%) |
| 55 to 59 Years | 80 (10.5%) | 57 (6.6%) |
| 60 to 64 Years | 43 (5.7%) | 147 (17.0%) |
| 65 to 69 Years | 135 (17.7%) | 70 (8.1%) |
| 70 to 74 Years | 9 (1.2%) | 101 (11.7%) |
| 75 to 79 Years | 59 (7.7%) | 50 (5.8%) |
| 80 to 84 Years | 11 (1.5%) | 31 (3.6%) |
| 85 Years and over | 23 (3.0%) | 64 (7.4%) |
| Total | 761 (100.0%) | 865 (100.0%) |
Families and Households in Pine Island Center
Median Family Size in Pine Island Center
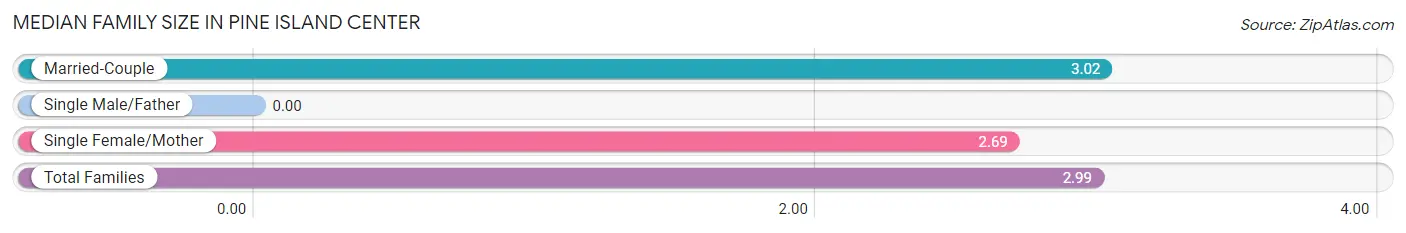
| Family Type | # Families | Family Size |
| Married-Couple | 374 (92.1%) | 3.02 |
| Single Male/Father | 0 (0.0%) | - |
| Single Female/Mother | 32 (7.9%) | 2.69 |
| Total Families | 406 (100.0%) | 2.99 |
Median Household Size in Pine Island Center
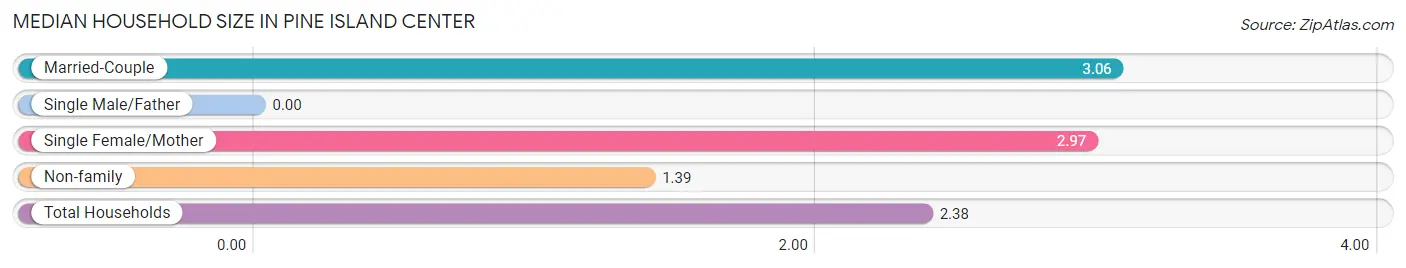
| Household Type | # Households | Household Size |
| Married-Couple | 374 (54.8%) | 3.06 |
| Single Male/Father | 0 (0.0%) | - |
| Single Female/Mother | 32 (4.7%) | 2.97 |
| Non-family | 276 (40.5%) | 1.39 |
| Total Households | 682 (100.0%) | 2.38 |
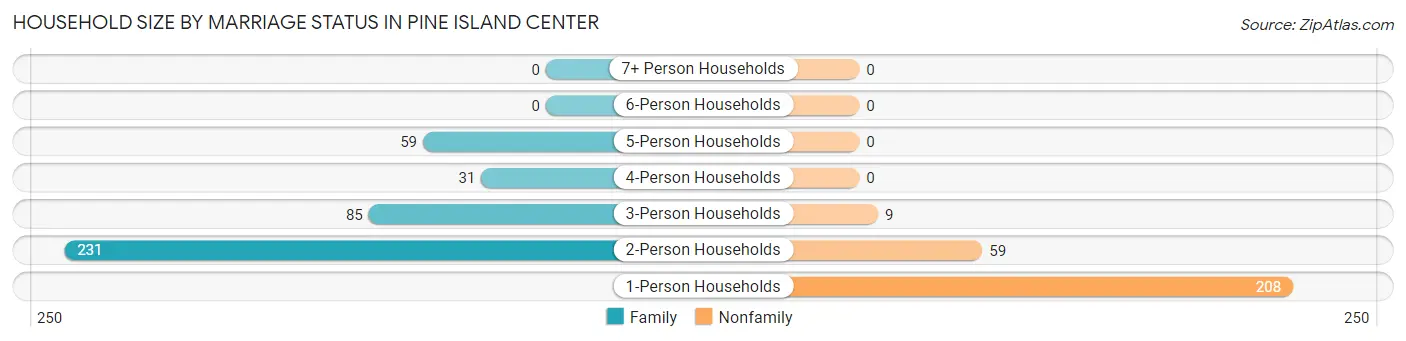
Household Size by Marriage Status in Pine Island Center
Out of a total of 682 households in Pine Island Center, 406 (59.5%) are family households, while 276 (40.5%) are nonfamily households. The most numerous type of family households are 2-person households, comprising 231, and the most common type of nonfamily households are 1-person households, comprising 208.
| Household Size | Family Households | Nonfamily Households |
| 1-Person Households | - | 208 (30.5%) |
| 2-Person Households | 231 (33.9%) | 59 (8.6%) |
| 3-Person Households | 85 (12.5%) | 9 (1.3%) |
| 4-Person Households | 31 (4.5%) | 0 (0.0%) |
| 5-Person Households | 59 (8.6%) | 0 (0.0%) |
| 6-Person Households | 0 (0.0%) | 0 (0.0%) |
| 7+ Person Households | 0 (0.0%) | 0 (0.0%) |
| Total | 406 (59.5%) | 276 (40.5%) |
Female Fertility in Pine Island Center
Fertility by Age in Pine Island Center
| Age Bracket | Women with Births | Births / 1,000 Women |
| 15 to 19 years | 0 (0.0%) | 0.0 |
| 20 to 34 years | 0 (0.0%) | 0.0 |
| 35 to 50 years | 0 (0.0%) | 0.0 |
| Total | 0 (0.0%) | 0.0 |
Fertility by Age by Marriage Status in Pine Island Center
| Age Bracket | Married | Unmarried |
| 15 to 19 years | 0 (0.0%) | 0 (0.0%) |
| 20 to 34 years | 0 (0.0%) | 0 (0.0%) |
| 35 to 50 years | 0 (0.0%) | 0 (0.0%) |
| Total | 0 (0.0%) | 0 (0.0%) |
Fertility by Education in Pine Island Center
| Educational Attainment | Women with Births | Births / 1,000 Women |
| Less than High School | 0 (0.0%) | 0.0 |
| High School Diploma | 0 (0.0%) | 0.0 |
| College or Associate's Degree | 0 (0.0%) | 0.0 |
| Bachelor's Degree | 0 (0.0%) | 0.0 |
| Graduate Degree | 0 (0.0%) | 0.0 |
| Total | 0 (0.0%) | 0.0 |
Fertility by Education by Marriage Status in Pine Island Center
| Educational Attainment | Married | Unmarried |
| Less than High School | 0 (0.0%) | 0 (0.0%) |
| High School Diploma | 0 (0.0%) | 0 (0.0%) |
| College or Associate's Degree | 0 (0.0%) | 0 (0.0%) |
| Bachelor's Degree | 0 (0.0%) | 0 (0.0%) |
| Graduate Degree | 0 (0.0%) | 0 (0.0%) |
| Total | 0 (0.0%) | 0 (0.0%) |
Employment Characteristics in Pine Island Center
Employment by Class of Employer in Pine Island Center
Among the 608 employed individuals in Pine Island Center, private company employees (341 | 56.1%), self-employed (not incorporated) (91 | 15.0%), and not-for-profit organizations (87 | 14.3%) make up the most common classes of employment.
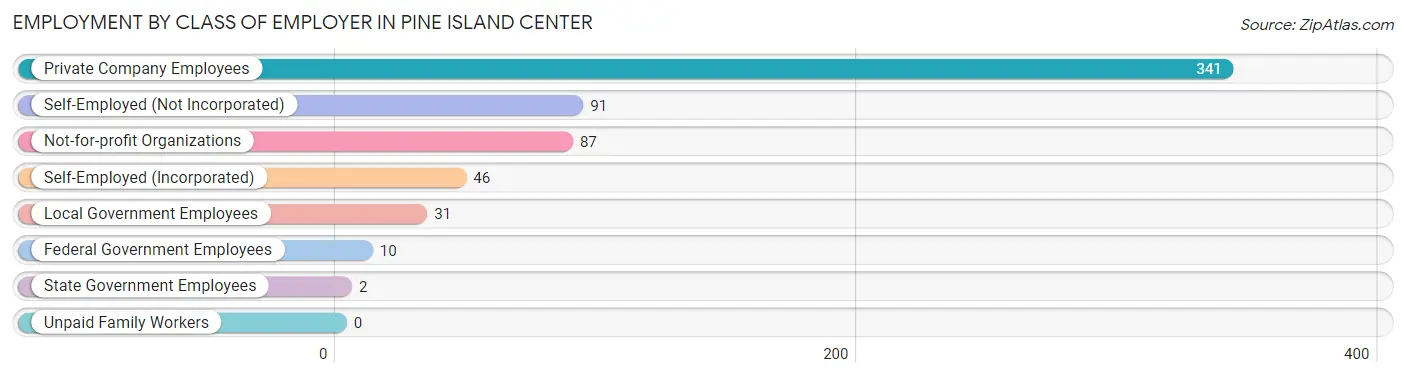
| Employer Class | # Employees | % Employees |
| Private Company Employees | 341 | 56.1% |
| Self-Employed (Incorporated) | 46 | 7.6% |
| Self-Employed (Not Incorporated) | 91 | 15.0% |
| Not-for-profit Organizations | 87 | 14.3% |
| Local Government Employees | 31 | 5.1% |
| State Government Employees | 2 | 0.3% |
| Federal Government Employees | 10 | 1.6% |
| Unpaid Family Workers | 0 | 0.0% |
| Total | 608 | 100.0% |
Employment Status by Age in Pine Island Center
According to the labor force statistics for Pine Island Center, out of the total population over 16 years of age (1,394), 45.0% or 627 individuals are in the labor force, with 1.9% or 12 of them unemployed. The age group with the highest labor force participation rate is 25 to 29 years, with 100.0% or 31 individuals in the labor force. Within the labor force, the 65 to 74 years age range has the highest percentage of unemployed individuals, with 14.3% or 8 of them being unemployed.
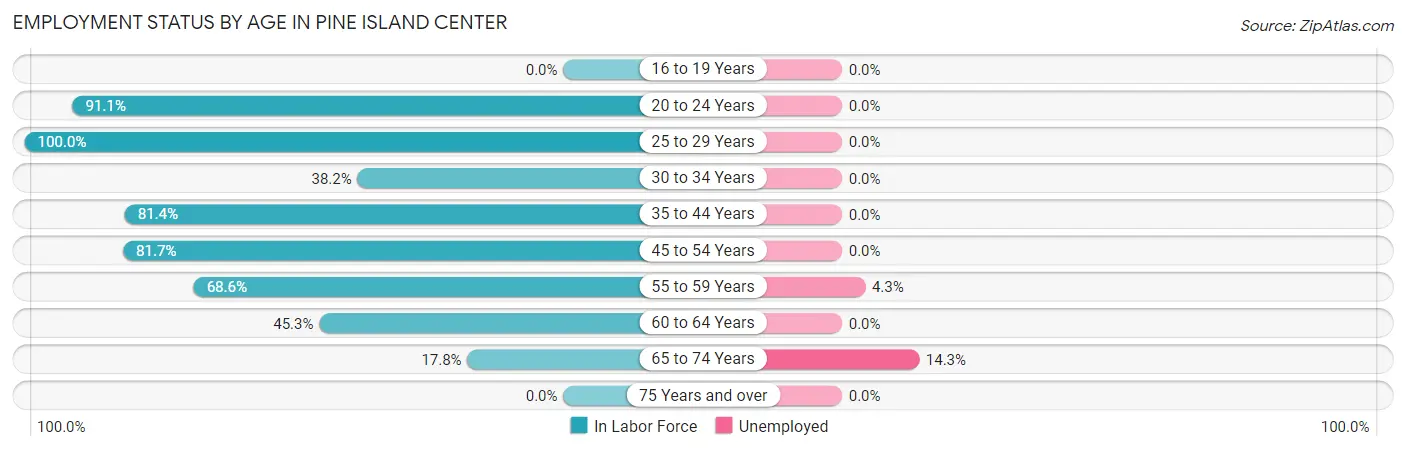
| Age Bracket | In Labor Force | Unemployed |
| 16 to 19 Years | 0 (0.0%) | 0 (0.0%) |
| 20 to 24 Years | 92 (91.1%) | 0 (0.0%) |
| 25 to 29 Years | 31 (100.0%) | 0 (0.0%) |
| 30 to 34 Years | 21 (38.2%) | 0 (0.0%) |
| 35 to 44 Years | 149 (81.4%) | 0 (0.0%) |
| 45 to 54 Years | 98 (81.7%) | 0 (0.0%) |
| 55 to 59 Years | 94 (68.6%) | 4 (4.3%) |
| 60 to 64 Years | 86 (45.3%) | 0 (0.0%) |
| 65 to 74 Years | 56 (17.8%) | 8 (14.3%) |
| 75 Years and over | 0 (0.0%) | 0 (0.0%) |
| Total | 627 (45.0%) | 12 (1.9%) |
Employment Status by Educational Attainment in Pine Island Center
According to labor force statistics for Pine Island Center, 66.9% of individuals (479) out of the total population between 25 and 64 years of age (716) are in the labor force, with 0.8% or 4 of them being unemployed. The group with the highest labor force participation rate are those with the educational attainment of bachelor's degree or higher, with 78.8% or 115 individuals in the labor force. Within the labor force, individuals with high school diploma education have the highest percentage of unemployment, with 2.4% or 4 of them being unemployed.
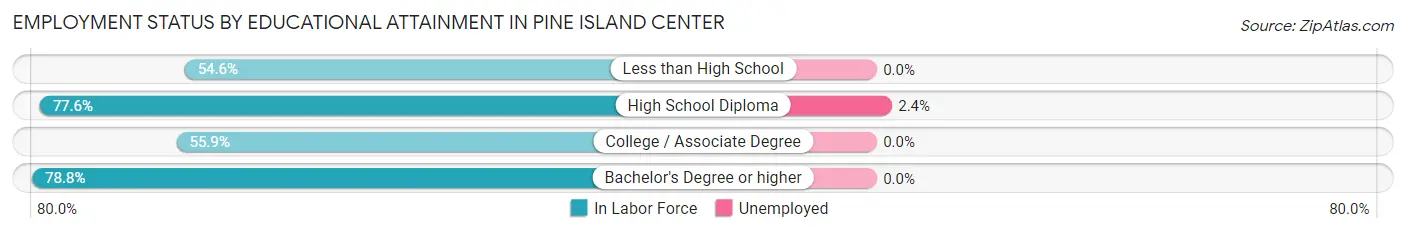
| Educational Attainment | In Labor Force | Unemployed |
| Less than High School | 89 (54.6%) | 0 (0.0%) |
| High School Diploma | 170 (77.6%) | 5 (2.4%) |
| College / Associate Degree | 105 (55.9%) | 0 (0.0%) |
| Bachelor's Degree or higher | 115 (78.8%) | 0 (0.0%) |
| Total | 479 (66.9%) | 6 (0.8%) |
Employment Occupations by Sex in Pine Island Center
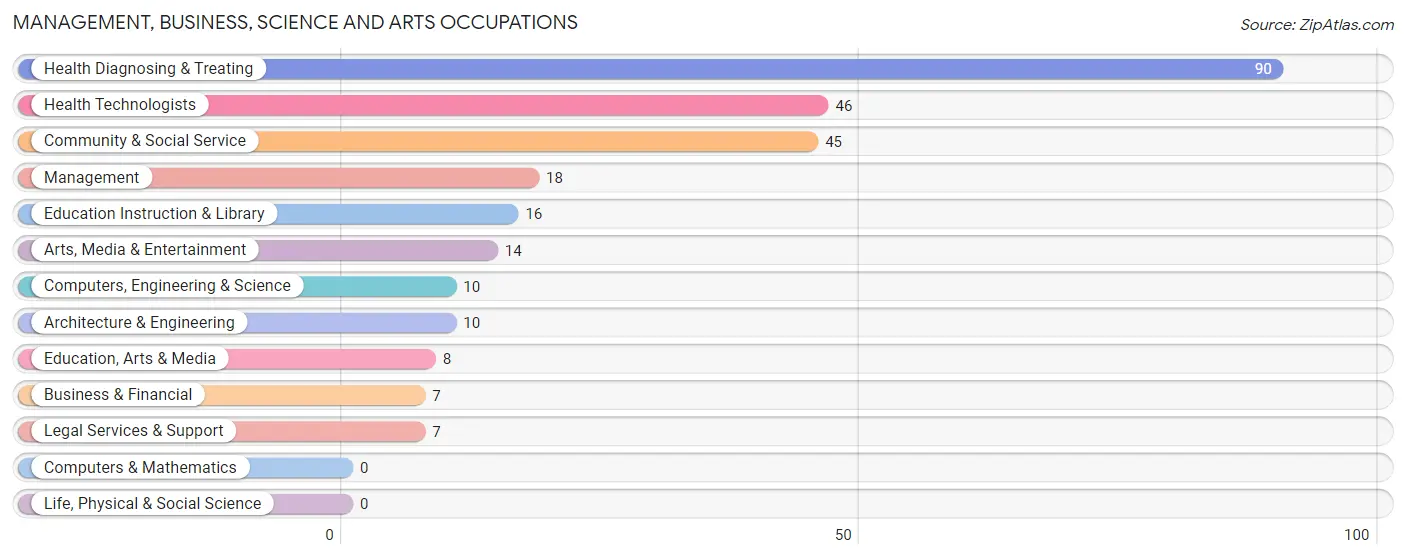
Management, Business, Science and Arts Occupations
The most common Management, Business, Science and Arts occupations in Pine Island Center are Health Diagnosing & Treating (90 | 14.6%), Health Technologists (46 | 7.5%), Community & Social Service (45 | 7.3%), Management (18 | 2.9%), and Education Instruction & Library (16 | 2.6%).
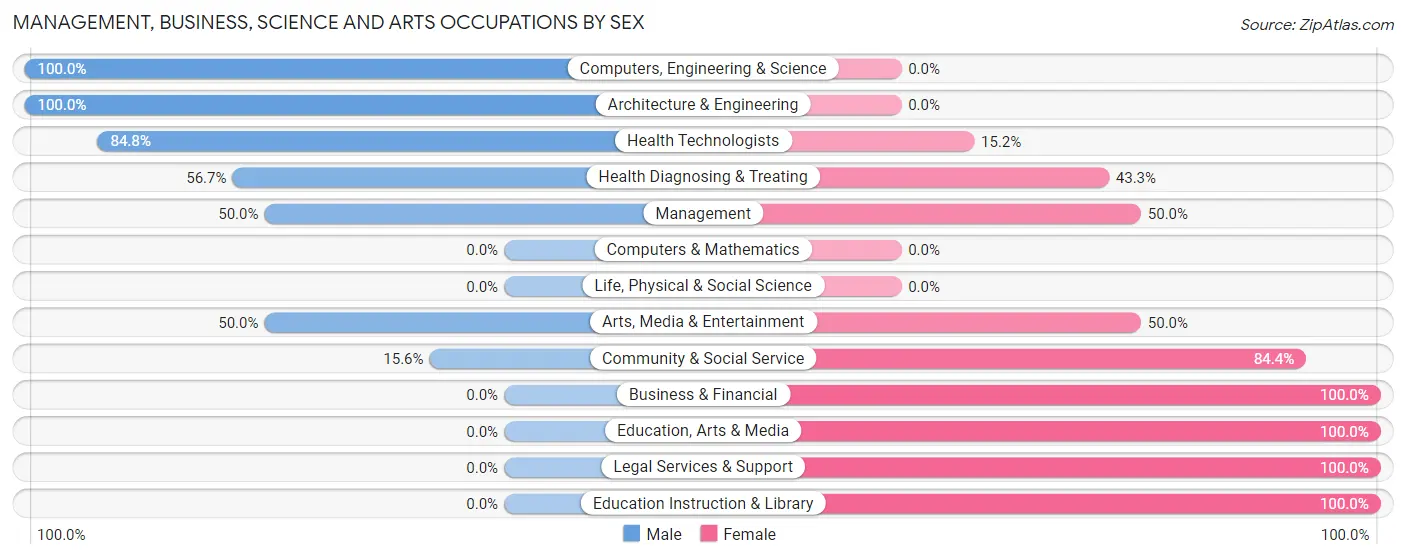
Management, Business, Science and Arts Occupations by Sex
Within the Management, Business, Science and Arts occupations in Pine Island Center, the most male-oriented occupations are Computers, Engineering & Science (100.0%), Architecture & Engineering (100.0%), and Health Technologists (84.8%), while the most female-oriented occupations are Business & Financial (100.0%), Education, Arts & Media (100.0%), and Legal Services & Support (100.0%).
| Occupation | Male | Female |
| Management | 9 (50.0%) | 9 (50.0%) |
| Business & Financial | 0 (0.0%) | 7 (100.0%) |
| Computers, Engineering & Science | 10 (100.0%) | 0 (0.0%) |
| Computers & Mathematics | 0 (0.0%) | 0 (0.0%) |
| Architecture & Engineering | 10 (100.0%) | 0 (0.0%) |
| Life, Physical & Social Science | 0 (0.0%) | 0 (0.0%) |
| Community & Social Service | 7 (15.6%) | 38 (84.4%) |
| Education, Arts & Media | 0 (0.0%) | 8 (100.0%) |
| Legal Services & Support | 0 (0.0%) | 7 (100.0%) |
| Education Instruction & Library | 0 (0.0%) | 16 (100.0%) |
| Arts, Media & Entertainment | 7 (50.0%) | 7 (50.0%) |
| Health Diagnosing & Treating | 51 (56.7%) | 39 (43.3%) |
| Health Technologists | 39 (84.8%) | 7 (15.2%) |
| Total (Category) | 77 (45.3%) | 93 (54.7%) |
| Total (Overall) | 336 (54.6%) | 279 (45.4%) |
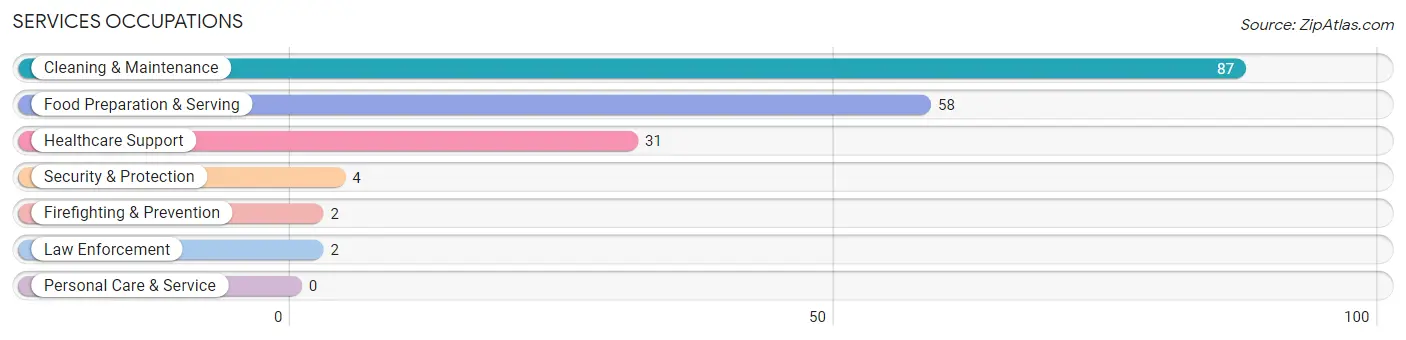
Services Occupations
The most common Services occupations in Pine Island Center are Cleaning & Maintenance (87 | 14.1%), Food Preparation & Serving (58 | 9.4%), Healthcare Support (31 | 5.0%), Security & Protection (4 | 0.6%), and Firefighting & Prevention (2 | 0.3%).
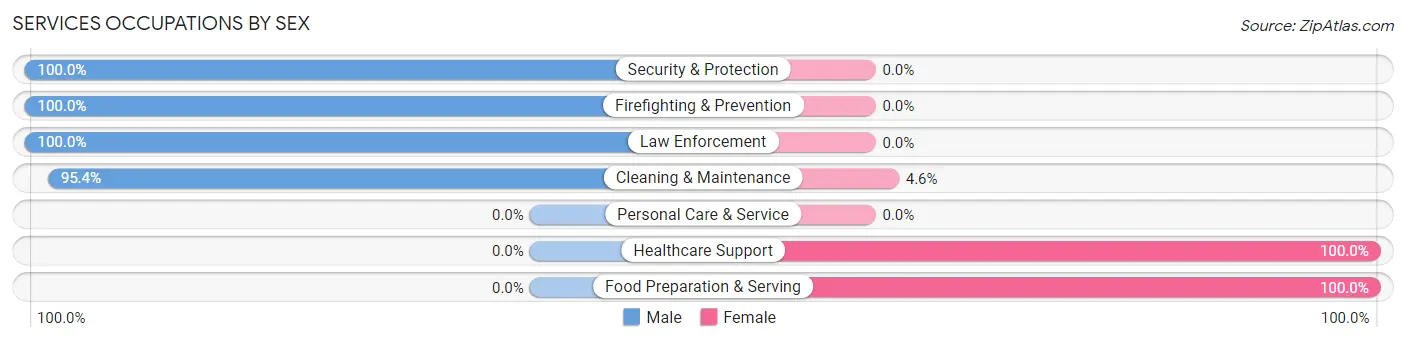
Services Occupations by Sex
Within the Services occupations in Pine Island Center, the most male-oriented occupations are Security & Protection (100.0%), Firefighting & Prevention (100.0%), and Law Enforcement (100.0%), while the most female-oriented occupations are Healthcare Support (100.0%), Food Preparation & Serving (100.0%), and Cleaning & Maintenance (4.6%).
| Occupation | Male | Female |
| Healthcare Support | 0 (0.0%) | 31 (100.0%) |
| Security & Protection | 4 (100.0%) | 0 (0.0%) |
| Firefighting & Prevention | 2 (100.0%) | 0 (0.0%) |
| Law Enforcement | 2 (100.0%) | 0 (0.0%) |
| Food Preparation & Serving | 0 (0.0%) | 58 (100.0%) |
| Cleaning & Maintenance | 83 (95.4%) | 4 (4.6%) |
| Personal Care & Service | 0 (0.0%) | 0 (0.0%) |
| Total (Category) | 87 (48.3%) | 93 (51.7%) |
| Total (Overall) | 336 (54.6%) | 279 (45.4%) |
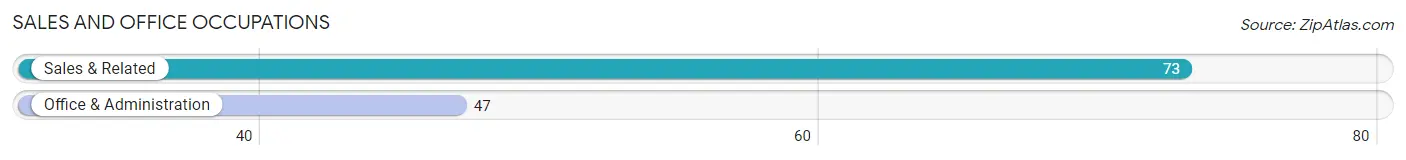
Sales and Office Occupations
The most common Sales and Office occupations in Pine Island Center are Sales & Related (73 | 11.9%), and Office & Administration (47 | 7.6%).
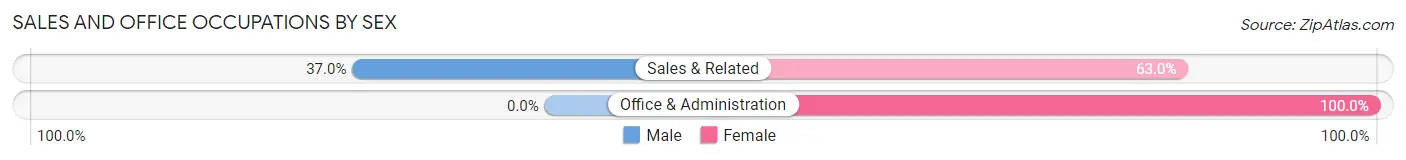
Sales and Office Occupations by Sex
| Occupation | Male | Female |
| Sales & Related | 27 (37.0%) | 46 (63.0%) |
| Office & Administration | 0 (0.0%) | 47 (100.0%) |
| Total (Category) | 27 (22.5%) | 93 (77.5%) |
| Total (Overall) | 336 (54.6%) | 279 (45.4%) |
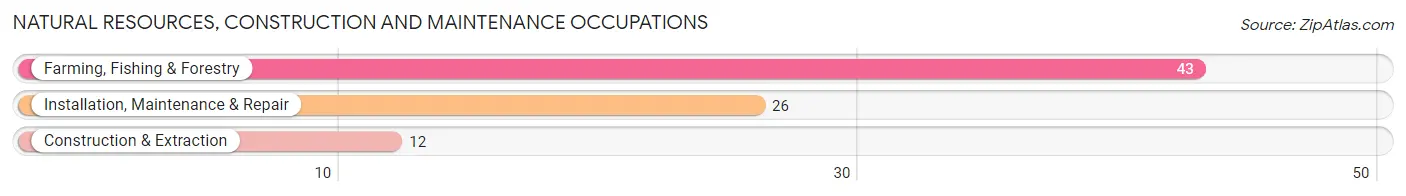
Natural Resources, Construction and Maintenance Occupations
The most common Natural Resources, Construction and Maintenance occupations in Pine Island Center are Farming, Fishing & Forestry (43 | 7.0%), Installation, Maintenance & Repair (26 | 4.2%), and Construction & Extraction (12 | 1.9%).
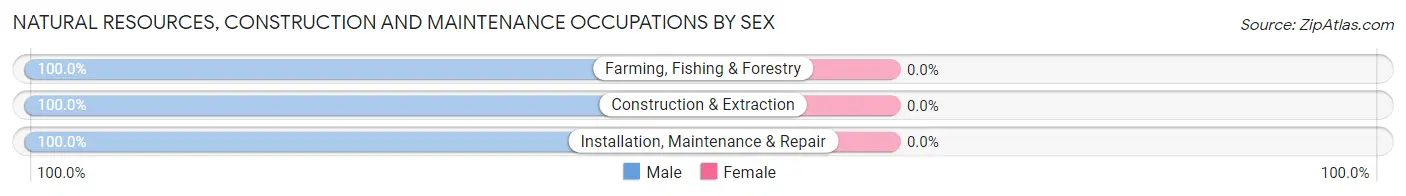
Natural Resources, Construction and Maintenance Occupations by Sex
| Occupation | Male | Female |
| Farming, Fishing & Forestry | 43 (100.0%) | 0 (0.0%) |
| Construction & Extraction | 12 (100.0%) | 0 (0.0%) |
| Installation, Maintenance & Repair | 26 (100.0%) | 0 (0.0%) |
| Total (Category) | 81 (100.0%) | 0 (0.0%) |
| Total (Overall) | 336 (54.6%) | 279 (45.4%) |
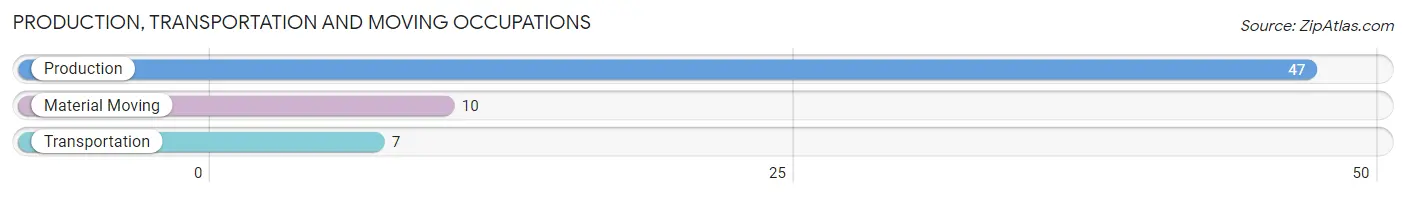
Production, Transportation and Moving Occupations
The most common Production, Transportation and Moving occupations in Pine Island Center are Production (47 | 7.6%), Material Moving (10 | 1.6%), and Transportation (7 | 1.1%).
Production, Transportation and Moving Occupations by Sex
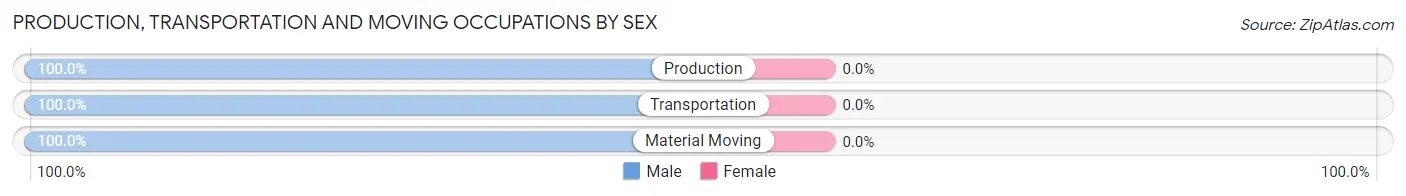
| Occupation | Male | Female |
| Production | 47 (100.0%) | 0 (0.0%) |
| Transportation | 7 (100.0%) | 0 (0.0%) |
| Material Moving | 10 (100.0%) | 0 (0.0%) |
| Total (Category) | 64 (100.0%) | 0 (0.0%) |
| Total (Overall) | 336 (54.6%) | 279 (45.4%) |
Employment Industries by Sex in Pine Island Center
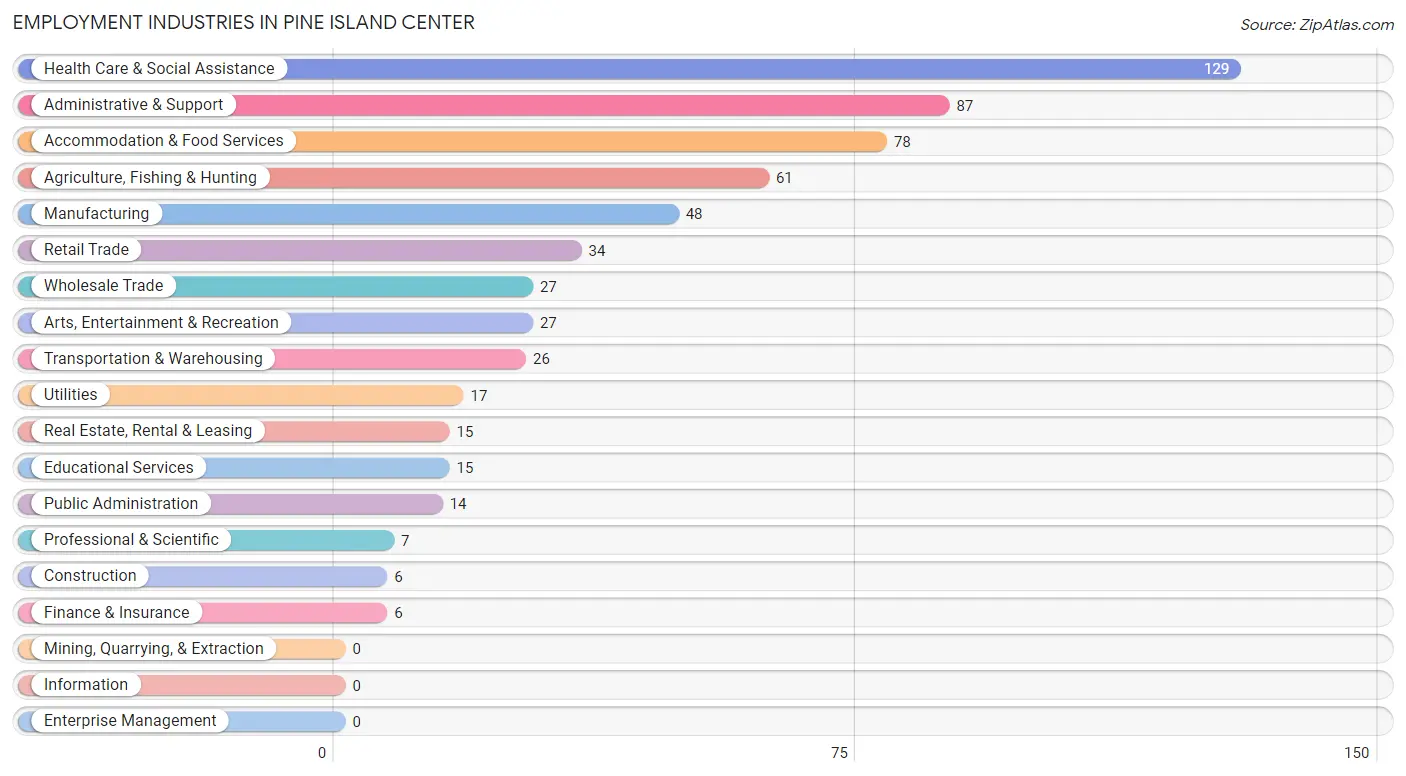
Employment Industries in Pine Island Center
The major employment industries in Pine Island Center include Health Care & Social Assistance (129 | 21.0%), Administrative & Support (87 | 14.1%), Accommodation & Food Services (78 | 12.7%), Agriculture, Fishing & Hunting (61 | 9.9%), and Manufacturing (48 | 7.8%).
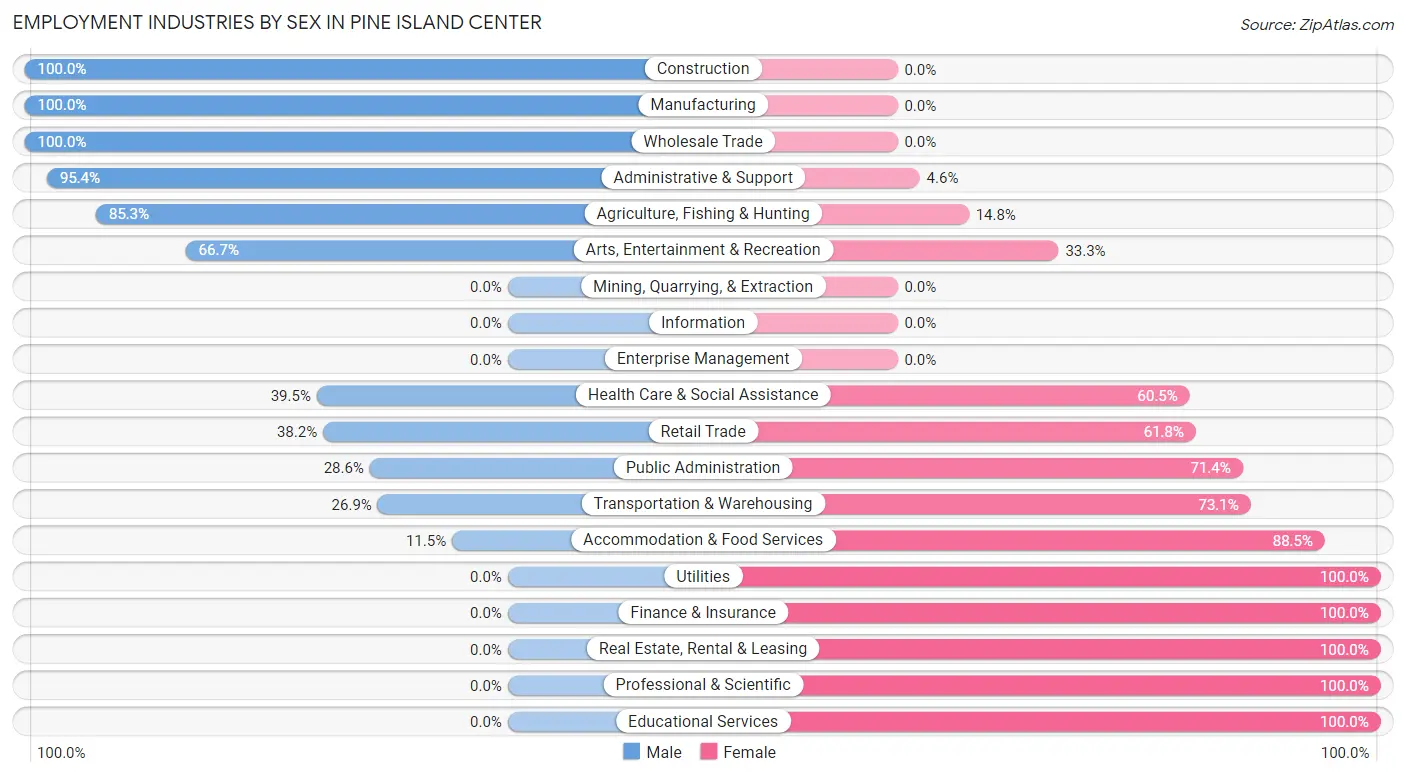
Employment Industries by Sex in Pine Island Center
The Pine Island Center industries that see more men than women are Construction (100.0%), Manufacturing (100.0%), and Wholesale Trade (100.0%), whereas the industries that tend to have a higher number of women are Utilities (100.0%), Finance & Insurance (100.0%), and Real Estate, Rental & Leasing (100.0%).
| Industry | Male | Female |
| Agriculture, Fishing & Hunting | 52 (85.3%) | 9 (14.7%) |
| Mining, Quarrying, & Extraction | 0 (0.0%) | 0 (0.0%) |
| Construction | 6 (100.0%) | 0 (0.0%) |
| Manufacturing | 48 (100.0%) | 0 (0.0%) |
| Wholesale Trade | 27 (100.0%) | 0 (0.0%) |
| Retail Trade | 13 (38.2%) | 21 (61.8%) |
| Transportation & Warehousing | 7 (26.9%) | 19 (73.1%) |
| Utilities | 0 (0.0%) | 17 (100.0%) |
| Information | 0 (0.0%) | 0 (0.0%) |
| Finance & Insurance | 0 (0.0%) | 6 (100.0%) |
| Real Estate, Rental & Leasing | 0 (0.0%) | 15 (100.0%) |
| Professional & Scientific | 0 (0.0%) | 7 (100.0%) |
| Enterprise Management | 0 (0.0%) | 0 (0.0%) |
| Administrative & Support | 83 (95.4%) | 4 (4.6%) |
| Educational Services | 0 (0.0%) | 15 (100.0%) |
| Health Care & Social Assistance | 51 (39.5%) | 78 (60.5%) |
| Arts, Entertainment & Recreation | 18 (66.7%) | 9 (33.3%) |
| Accommodation & Food Services | 9 (11.5%) | 69 (88.5%) |
| Public Administration | 4 (28.6%) | 10 (71.4%) |
| Total | 336 (54.6%) | 279 (45.4%) |
Education in Pine Island Center
School Enrollment in Pine Island Center
The most common levels of schooling among the 212 students in Pine Island Center are middle school (83 | 39.2%), high school (73 | 34.4%), and elementary school (28 | 13.2%).
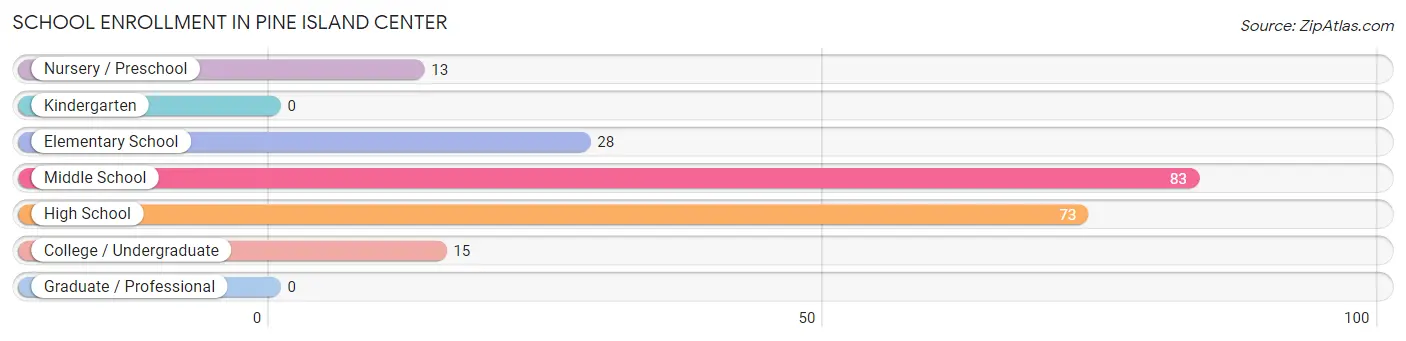
| School Level | # Students | % Students |
| Nursery / Preschool | 13 | 6.1% |
| Kindergarten | 0 | 0.0% |
| Elementary School | 28 | 13.2% |
| Middle School | 83 | 39.2% |
| High School | 73 | 34.4% |
| College / Undergraduate | 15 | 7.1% |
| Graduate / Professional | 0 | 0.0% |
| Total | 212 | 100.0% |
School Enrollment by Age by Funding Source in Pine Island Center
Out of a total of 212 students who are enrolled in schools in Pine Island Center, 44 (20.8%) attend a private institution, while the remaining 168 (79.2%) are enrolled in public schools. The age group of 3 to 4 year olds has the highest likelihood of being enrolled in private schools, with 13 (100.0% in the age bracket) enrolled. Conversely, the age group of 10 to 14 year olds has the lowest likelihood of being enrolled in a private school, with 88 (100.0% in the age bracket) attending a public institution.
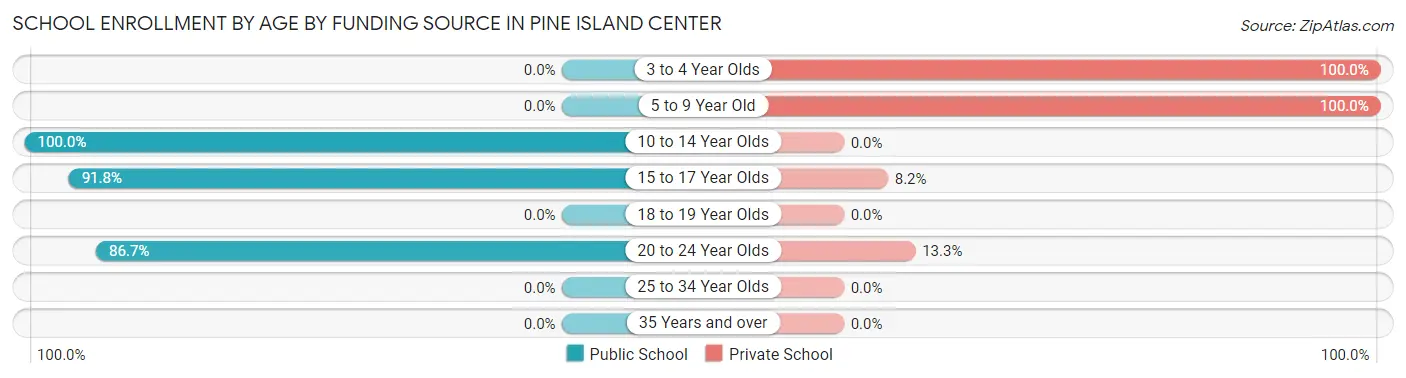
| Age Bracket | Public School | Private School |
| 3 to 4 Year Olds | 0 (0.0%) | 13 (100.0%) |
| 5 to 9 Year Old | 0 (0.0%) | 23 (100.0%) |
| 10 to 14 Year Olds | 88 (100.0%) | 0 (0.0%) |
| 15 to 17 Year Olds | 67 (91.8%) | 6 (8.2%) |
| 18 to 19 Year Olds | 0 (0.0%) | 0 (0.0%) |
| 20 to 24 Year Olds | 13 (86.7%) | 2 (13.3%) |
| 25 to 34 Year Olds | 0 (0.0%) | 0 (0.0%) |
| 35 Years and over | 0 (0.0%) | 0 (0.0%) |
| Total | 168 (79.2%) | 44 (20.8%) |
Educational Attainment by Field of Study in Pine Island Center
Education (68 | 18.5%), science & technology (63 | 17.1%), business (45 | 12.2%), social sciences (41 | 11.1%), and psychology (37 | 10.1%) are the most common fields of study among 368 individuals in Pine Island Center who have obtained a bachelor's degree or higher.
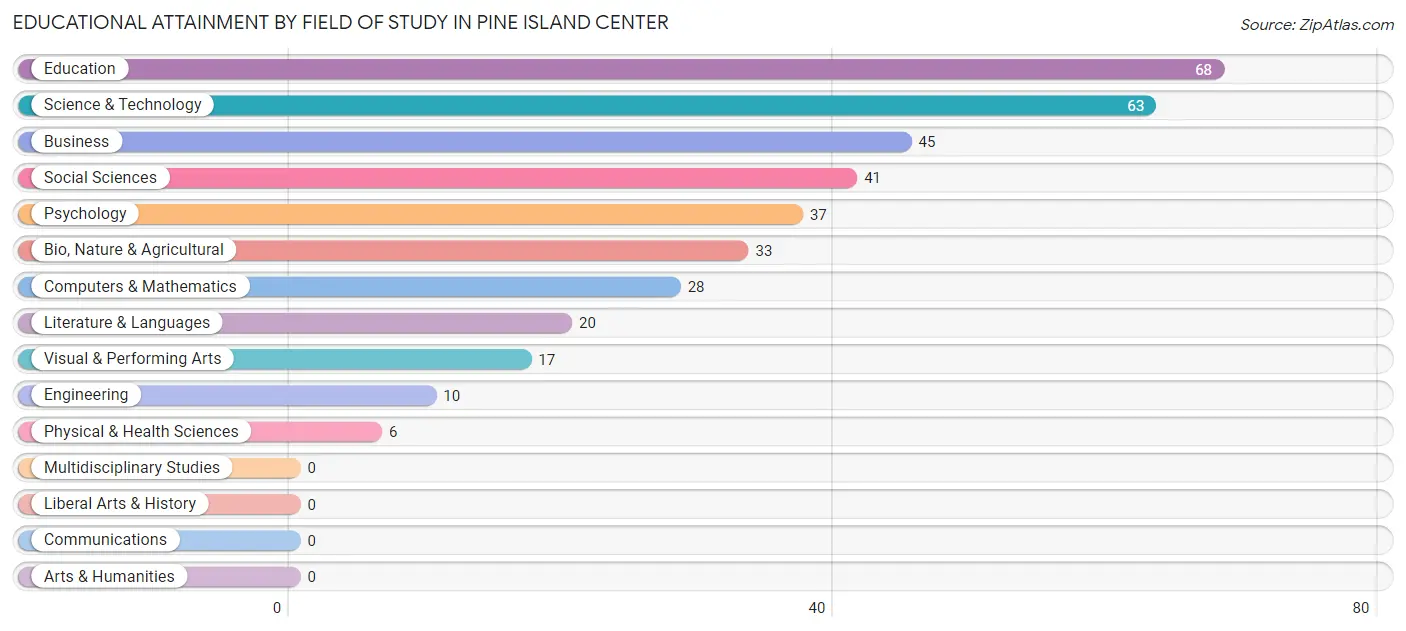
| Field of Study | # Graduates | % Graduates |
| Computers & Mathematics | 28 | 7.6% |
| Bio, Nature & Agricultural | 33 | 9.0% |
| Physical & Health Sciences | 6 | 1.6% |
| Psychology | 37 | 10.1% |
| Social Sciences | 41 | 11.1% |
| Engineering | 10 | 2.7% |
| Multidisciplinary Studies | 0 | 0.0% |
| Science & Technology | 63 | 17.1% |
| Business | 45 | 12.2% |
| Education | 68 | 18.5% |
| Literature & Languages | 20 | 5.4% |
| Liberal Arts & History | 0 | 0.0% |
| Visual & Performing Arts | 17 | 4.6% |
| Communications | 0 | 0.0% |
| Arts & Humanities | 0 | 0.0% |
| Total | 368 | 100.0% |
Transportation & Commute in Pine Island Center
Vehicle Availability by Sex in Pine Island Center
The most prevalent vehicle ownership categories in Pine Island Center are males with 3 vehicles (150, accounting for 44.6%) and females with 3 vehicles (95, making up 55.1%).
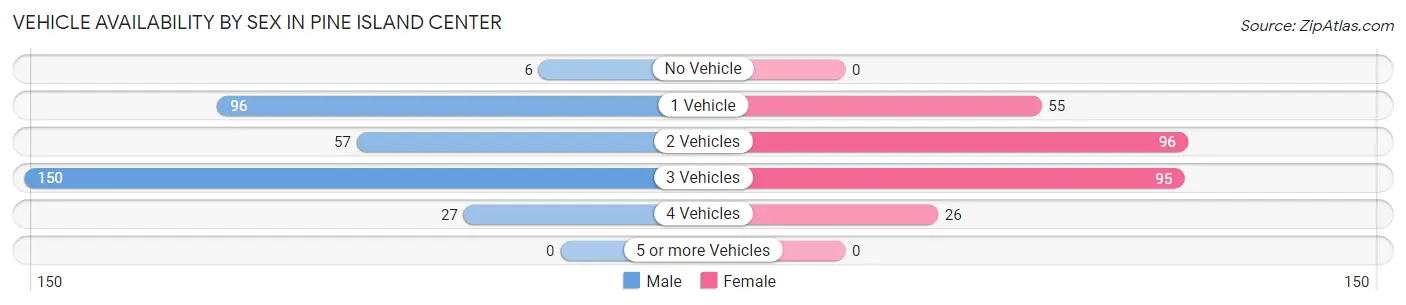
| Vehicles Available | Male | Female |
| No Vehicle | 6 (1.8%) | 0 (0.0%) |
| 1 Vehicle | 96 (28.6%) | 55 (20.2%) |
| 2 Vehicles | 57 (17.0%) | 96 (35.3%) |
| 3 Vehicles | 150 (44.6%) | 95 (34.9%) |
| 4 Vehicles | 27 (8.0%) | 26 (9.6%) |
| 5 or more Vehicles | 0 (0.0%) | 0 (0.0%) |
| Total | 336 (100.0%) | 272 (100.0%) |
Commute Time in Pine Island Center
The most frequently occuring commute durations in Pine Island Center are 30 to 34 minutes (146 commuters, 24.9%), 45 to 59 minutes (93 commuters, 15.9%), and 5 to 9 minutes (79 commuters, 13.5%).
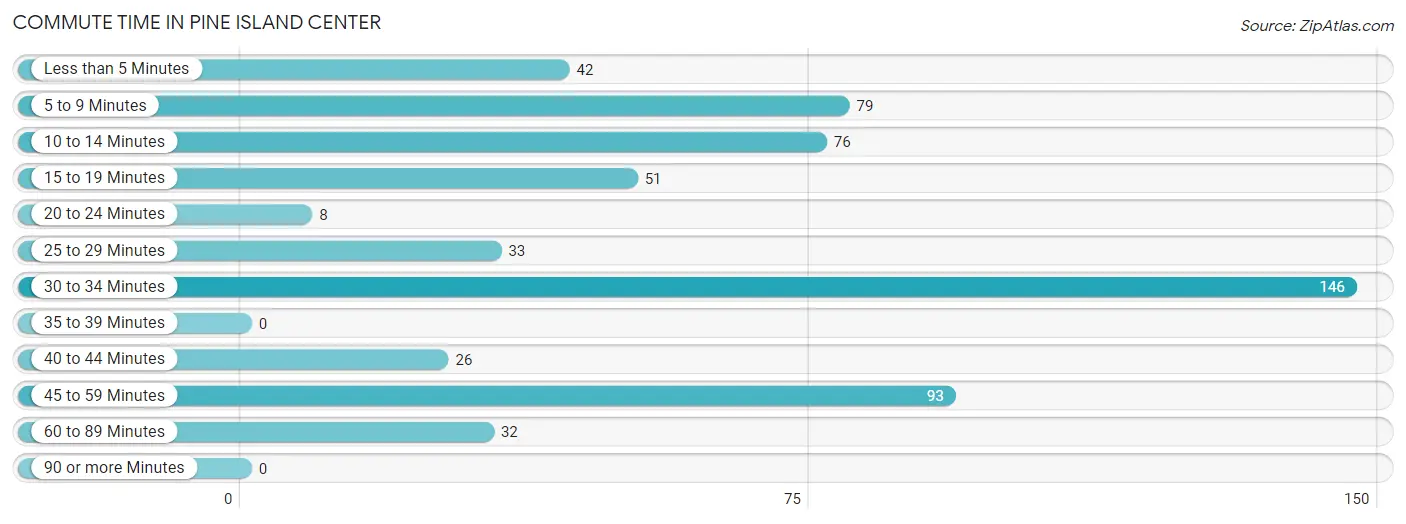
| Commute Time | # Commuters | % Commuters |
| Less than 5 Minutes | 42 | 7.2% |
| 5 to 9 Minutes | 79 | 13.5% |
| 10 to 14 Minutes | 76 | 13.0% |
| 15 to 19 Minutes | 51 | 8.7% |
| 20 to 24 Minutes | 8 | 1.4% |
| 25 to 29 Minutes | 33 | 5.6% |
| 30 to 34 Minutes | 146 | 24.9% |
| 35 to 39 Minutes | 0 | 0.0% |
| 40 to 44 Minutes | 26 | 4.4% |
| 45 to 59 Minutes | 93 | 15.9% |
| 60 to 89 Minutes | 32 | 5.5% |
| 90 or more Minutes | 0 | 0.0% |
Commute Time by Sex in Pine Island Center
The most common commute times in Pine Island Center are 30 to 34 minutes (114 commuters, 33.9%) for males and 10 to 14 minutes (50 commuters, 20.0%) for females.
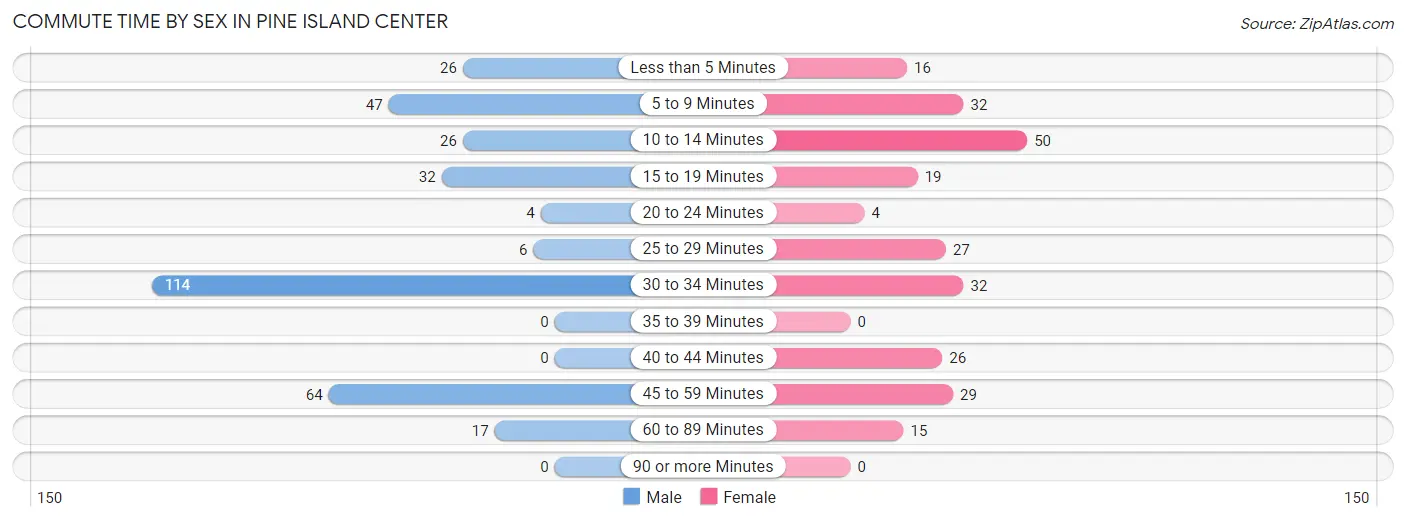
| Commute Time | Male | Female |
| Less than 5 Minutes | 26 (7.7%) | 16 (6.4%) |
| 5 to 9 Minutes | 47 (14.0%) | 32 (12.8%) |
| 10 to 14 Minutes | 26 (7.7%) | 50 (20.0%) |
| 15 to 19 Minutes | 32 (9.5%) | 19 (7.6%) |
| 20 to 24 Minutes | 4 (1.2%) | 4 (1.6%) |
| 25 to 29 Minutes | 6 (1.8%) | 27 (10.8%) |
| 30 to 34 Minutes | 114 (33.9%) | 32 (12.8%) |
| 35 to 39 Minutes | 0 (0.0%) | 0 (0.0%) |
| 40 to 44 Minutes | 0 (0.0%) | 26 (10.4%) |
| 45 to 59 Minutes | 64 (19.1%) | 29 (11.6%) |
| 60 to 89 Minutes | 17 (5.1%) | 15 (6.0%) |
| 90 or more Minutes | 0 (0.0%) | 0 (0.0%) |
Time of Departure to Work by Sex in Pine Island Center
The most frequent times of departure to work in Pine Island Center are 6:30 AM to 6:59 AM (63, 18.8%) for males and 7:00 AM to 7:29 AM (57, 22.8%) for females.
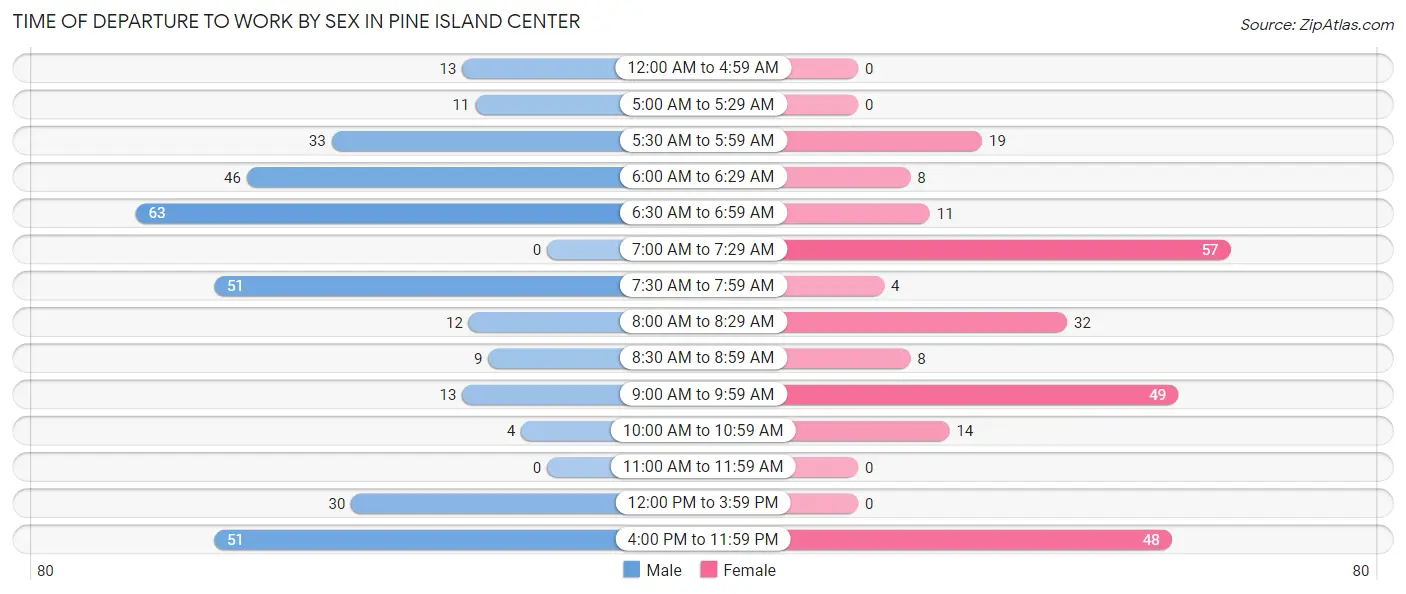
| Time of Departure | Male | Female |
| 12:00 AM to 4:59 AM | 13 (3.9%) | 0 (0.0%) |
| 5:00 AM to 5:29 AM | 11 (3.3%) | 0 (0.0%) |
| 5:30 AM to 5:59 AM | 33 (9.8%) | 19 (7.6%) |
| 6:00 AM to 6:29 AM | 46 (13.7%) | 8 (3.2%) |
| 6:30 AM to 6:59 AM | 63 (18.8%) | 11 (4.4%) |
| 7:00 AM to 7:29 AM | 0 (0.0%) | 57 (22.8%) |
| 7:30 AM to 7:59 AM | 51 (15.2%) | 4 (1.6%) |
| 8:00 AM to 8:29 AM | 12 (3.6%) | 32 (12.8%) |
| 8:30 AM to 8:59 AM | 9 (2.7%) | 8 (3.2%) |
| 9:00 AM to 9:59 AM | 13 (3.9%) | 49 (19.6%) |
| 10:00 AM to 10:59 AM | 4 (1.2%) | 14 (5.6%) |
| 11:00 AM to 11:59 AM | 0 (0.0%) | 0 (0.0%) |
| 12:00 PM to 3:59 PM | 30 (8.9%) | 0 (0.0%) |
| 4:00 PM to 11:59 PM | 51 (15.2%) | 48 (19.2%) |
| Total | 336 (100.0%) | 250 (100.0%) |
Housing Occupancy in Pine Island Center
Occupancy by Ownership in Pine Island Center
Of the total 682 dwellings in Pine Island Center, owner-occupied units account for 518 (75.9%), while renter-occupied units make up 164 (24.0%).
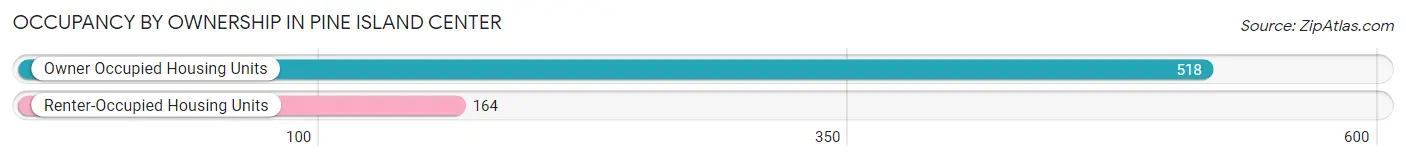
| Occupancy | # Housing Units | % Housing Units |
| Owner Occupied Housing Units | 518 | 75.9% |
| Renter-Occupied Housing Units | 164 | 24.0% |
| Total Occupied Housing Units | 682 | 100.0% |
Occupancy by Household Size in Pine Island Center
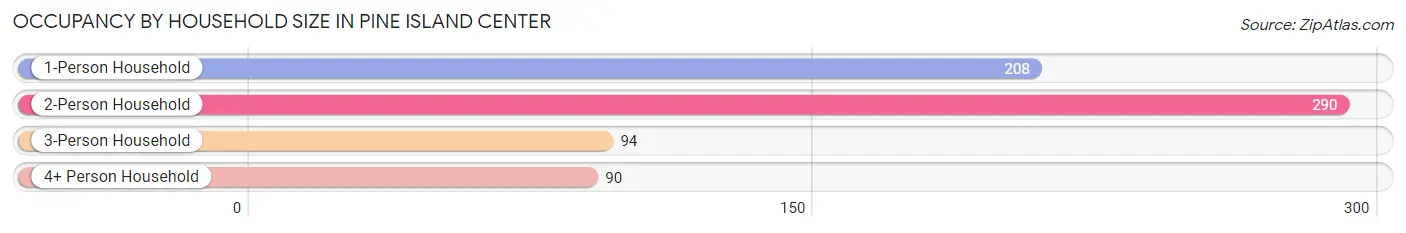
| Household Size | # Housing Units | % Housing Units |
| 1-Person Household | 208 | 30.5% |
| 2-Person Household | 290 | 42.5% |
| 3-Person Household | 94 | 13.8% |
| 4+ Person Household | 90 | 13.2% |
| Total Housing Units | 682 | 100.0% |
Occupancy by Ownership by Household Size in Pine Island Center
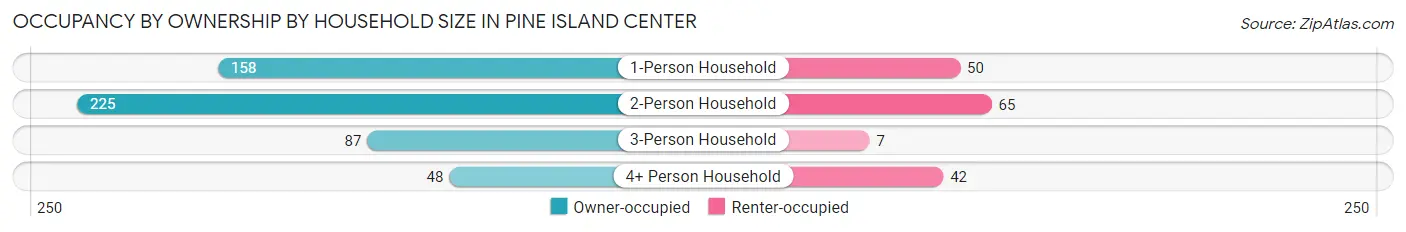
| Household Size | Owner-occupied | Renter-occupied |
| 1-Person Household | 158 (76.0%) | 50 (24.0%) |
| 2-Person Household | 225 (77.6%) | 65 (22.4%) |
| 3-Person Household | 87 (92.5%) | 7 (7.4%) |
| 4+ Person Household | 48 (53.3%) | 42 (46.7%) |
| Total Housing Units | 518 (75.9%) | 164 (24.0%) |
Occupancy by Educational Attainment in Pine Island Center
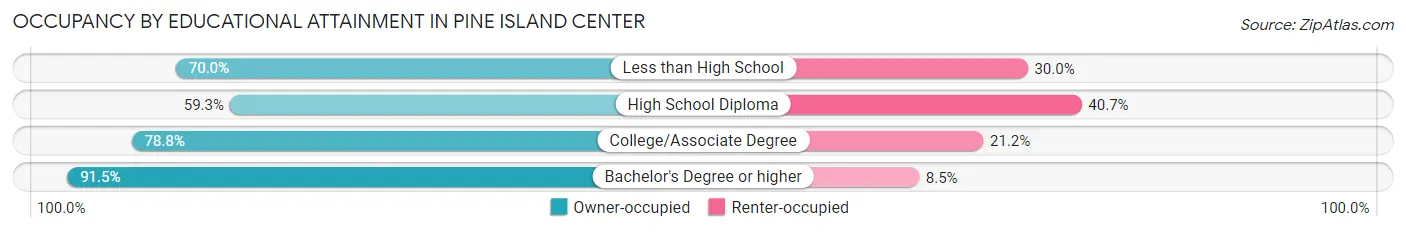
| Household Size | Owner-occupied | Renter-occupied |
| Less than High School | 42 (70.0%) | 18 (30.0%) |
| High School Diploma | 121 (59.3%) | 83 (40.7%) |
| College/Associate Degree | 171 (78.8%) | 46 (21.2%) |
| Bachelor's Degree or higher | 184 (91.5%) | 17 (8.5%) |
Occupancy by Age of Householder in Pine Island Center
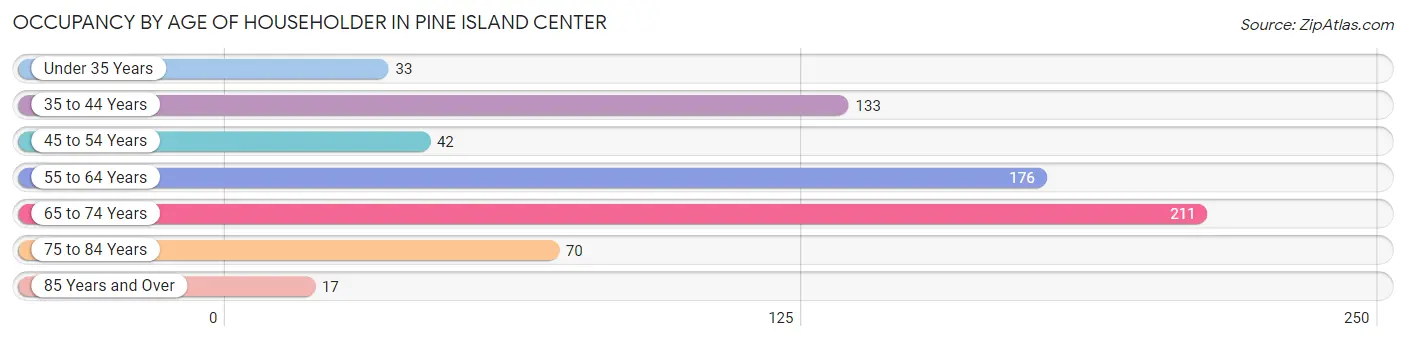
| Age Bracket | # Households | % Households |
| Under 35 Years | 33 | 4.8% |
| 35 to 44 Years | 133 | 19.5% |
| 45 to 54 Years | 42 | 6.2% |
| 55 to 64 Years | 176 | 25.8% |
| 65 to 74 Years | 211 | 30.9% |
| 75 to 84 Years | 70 | 10.3% |
| 85 Years and Over | 17 | 2.5% |
| Total | 682 | 100.0% |
Housing Finances in Pine Island Center
Median Income by Occupancy in Pine Island Center
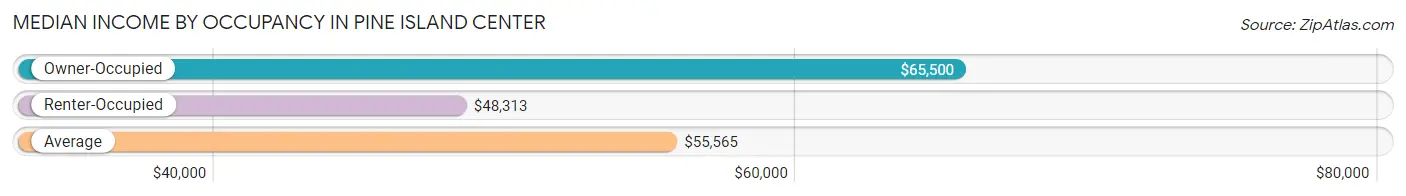
| Occupancy Type | # Households | Median Income |
| Owner-Occupied | 518 (75.9%) | $65,500 |
| Renter-Occupied | 164 (24.0%) | $48,313 |
| Average | 682 (100.0%) | $55,565 |
Occupancy by Householder Income Bracket in Pine Island Center
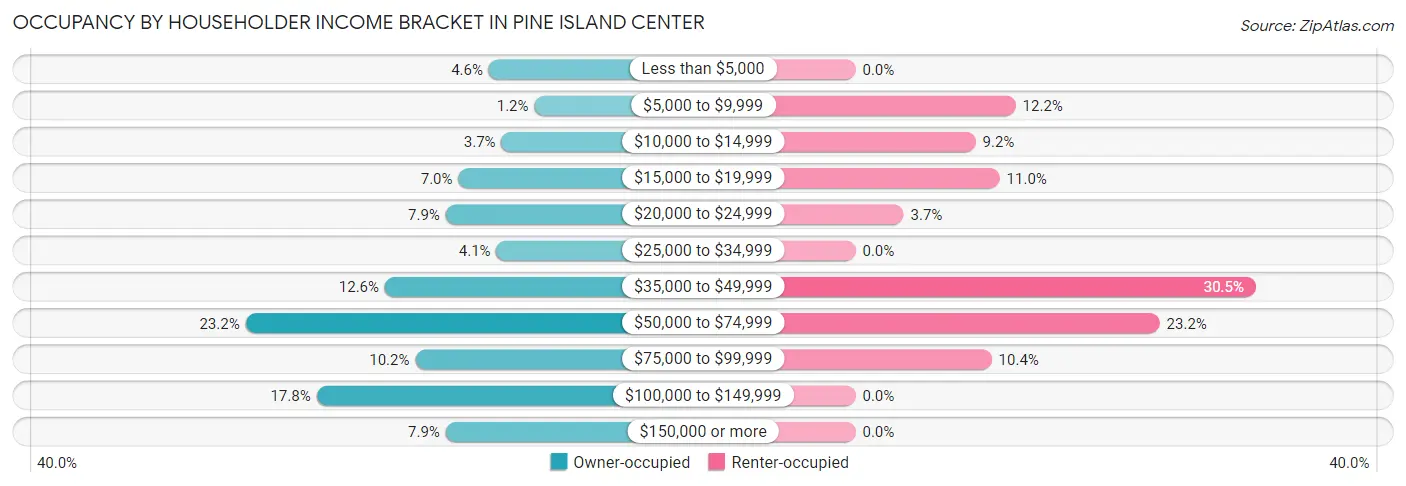
| Income Bracket | Owner-occupied | Renter-occupied |
| Less than $5,000 | 24 (4.6%) | 0 (0.0%) |
| $5,000 to $9,999 | 6 (1.2%) | 20 (12.2%) |
| $10,000 to $14,999 | 19 (3.7%) | 15 (9.1%) |
| $15,000 to $19,999 | 36 (7.0%) | 18 (11.0%) |
| $20,000 to $24,999 | 41 (7.9%) | 6 (3.7%) |
| $25,000 to $34,999 | 21 (4.1%) | 0 (0.0%) |
| $35,000 to $49,999 | 65 (12.6%) | 50 (30.5%) |
| $50,000 to $74,999 | 120 (23.2%) | 38 (23.2%) |
| $75,000 to $99,999 | 53 (10.2%) | 17 (10.4%) |
| $100,000 to $149,999 | 92 (17.8%) | 0 (0.0%) |
| $150,000 or more | 41 (7.9%) | 0 (0.0%) |
| Total | 518 (100.0%) | 164 (100.0%) |
Monthly Housing Cost Tiers in Pine Island Center
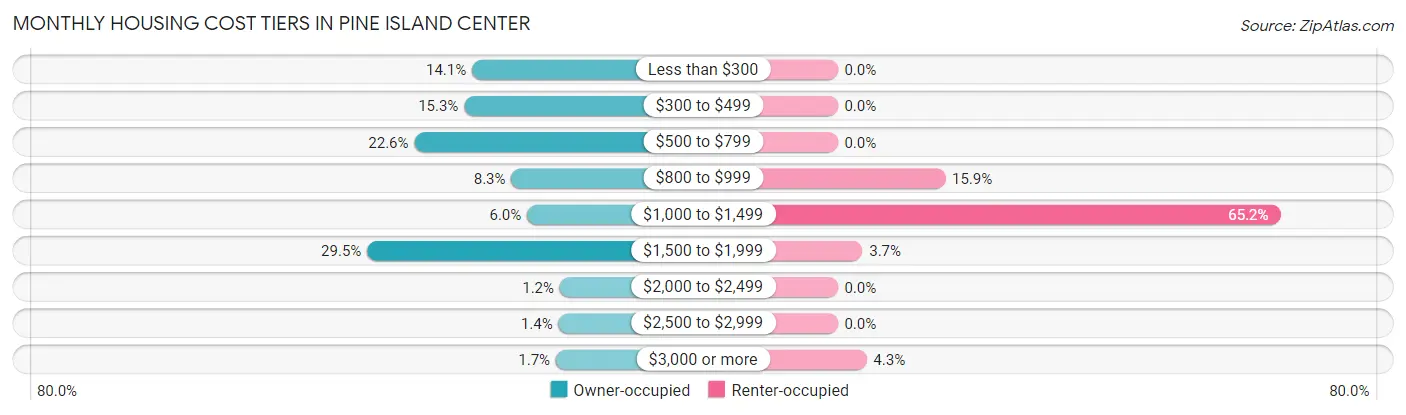
| Monthly Cost | Owner-occupied | Renter-occupied |
| Less than $300 | 73 (14.1%) | 0 (0.0%) |
| $300 to $499 | 79 (15.2%) | 0 (0.0%) |
| $500 to $799 | 117 (22.6%) | 0 (0.0%) |
| $800 to $999 | 43 (8.3%) | 26 (15.9%) |
| $1,000 to $1,499 | 31 (6.0%) | 107 (65.2%) |
| $1,500 to $1,999 | 153 (29.5%) | 6 (3.7%) |
| $2,000 to $2,499 | 6 (1.2%) | 0 (0.0%) |
| $2,500 to $2,999 | 7 (1.3%) | 0 (0.0%) |
| $3,000 or more | 9 (1.7%) | 7 (4.3%) |
| Total | 518 (100.0%) | 164 (100.0%) |
Physical Housing Characteristics in Pine Island Center
Housing Structures in Pine Island Center
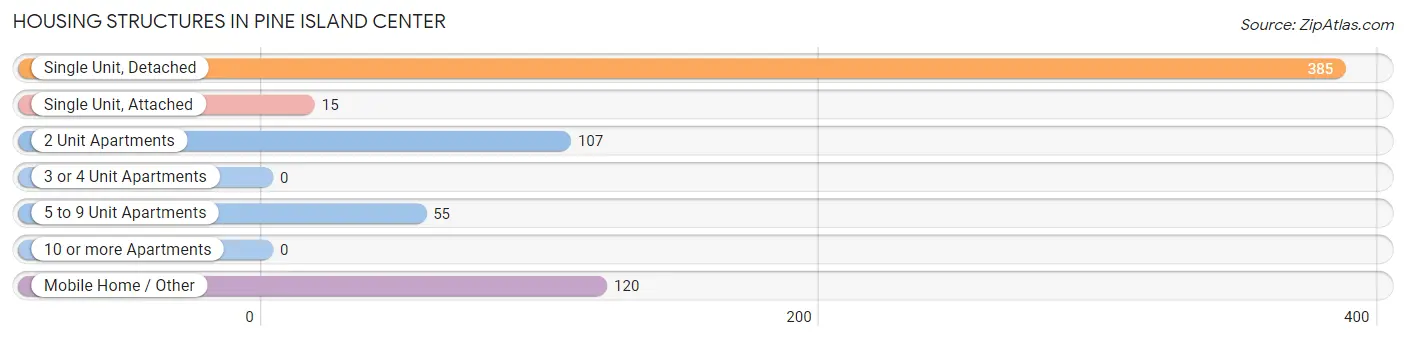
| Structure Type | # Housing Units | % Housing Units |
| Single Unit, Detached | 385 | 56.5% |
| Single Unit, Attached | 15 | 2.2% |
| 2 Unit Apartments | 107 | 15.7% |
| 3 or 4 Unit Apartments | 0 | 0.0% |
| 5 to 9 Unit Apartments | 55 | 8.1% |
| 10 or more Apartments | 0 | 0.0% |
| Mobile Home / Other | 120 | 17.6% |
| Total | 682 | 100.0% |
Housing Structures by Occupancy in Pine Island Center
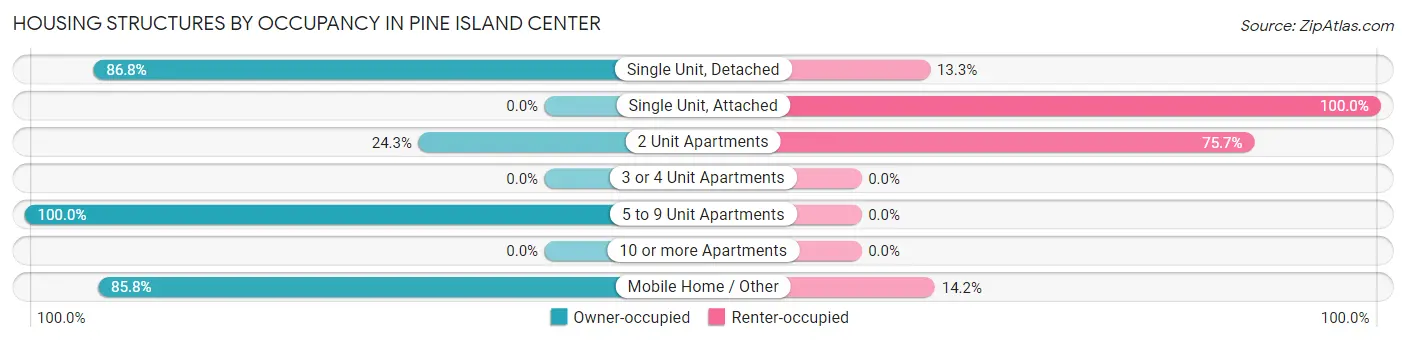
| Structure Type | Owner-occupied | Renter-occupied |
| Single Unit, Detached | 334 (86.8%) | 51 (13.3%) |
| Single Unit, Attached | 0 (0.0%) | 15 (100.0%) |
| 2 Unit Apartments | 26 (24.3%) | 81 (75.7%) |
| 3 or 4 Unit Apartments | 0 (0.0%) | 0 (0.0%) |
| 5 to 9 Unit Apartments | 55 (100.0%) | 0 (0.0%) |
| 10 or more Apartments | 0 (0.0%) | 0 (0.0%) |
| Mobile Home / Other | 103 (85.8%) | 17 (14.2%) |
| Total | 518 (75.9%) | 164 (24.0%) |
Housing Structures by Number of Rooms in Pine Island Center
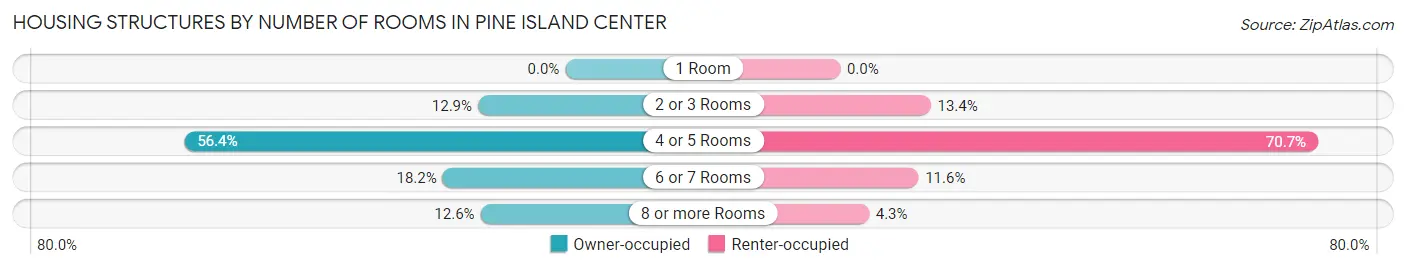
| Number of Rooms | Owner-occupied | Renter-occupied |
| 1 Room | 0 (0.0%) | 0 (0.0%) |
| 2 or 3 Rooms | 67 (12.9%) | 22 (13.4%) |
| 4 or 5 Rooms | 292 (56.4%) | 116 (70.7%) |
| 6 or 7 Rooms | 94 (18.1%) | 19 (11.6%) |
| 8 or more Rooms | 65 (12.6%) | 7 (4.3%) |
| Total | 518 (100.0%) | 164 (100.0%) |
Housing Structure by Heating Type in Pine Island Center
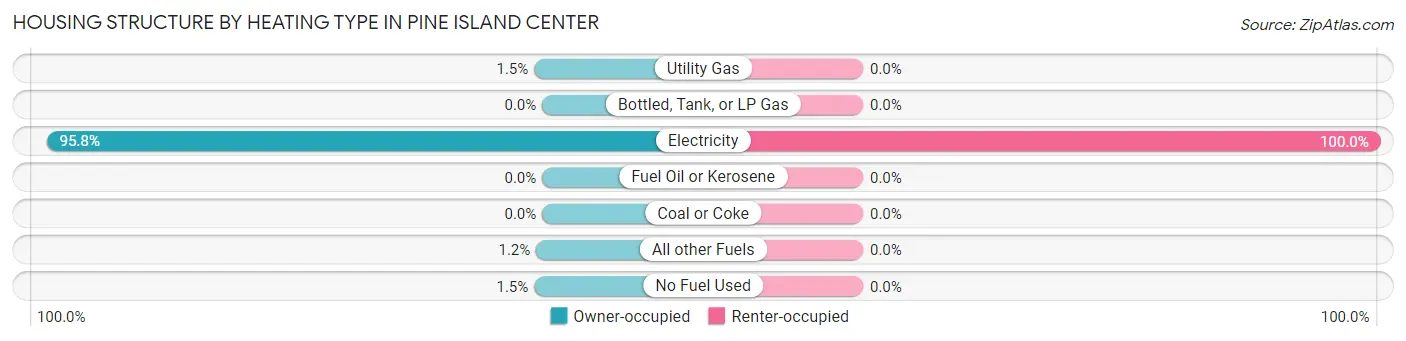
| Heating Type | Owner-occupied | Renter-occupied |
| Utility Gas | 8 (1.5%) | 0 (0.0%) |
| Bottled, Tank, or LP Gas | 0 (0.0%) | 0 (0.0%) |
| Electricity | 496 (95.8%) | 164 (100.0%) |
| Fuel Oil or Kerosene | 0 (0.0%) | 0 (0.0%) |
| Coal or Coke | 0 (0.0%) | 0 (0.0%) |
| All other Fuels | 6 (1.2%) | 0 (0.0%) |
| No Fuel Used | 8 (1.5%) | 0 (0.0%) |
| Total | 518 (100.0%) | 164 (100.0%) |
Household Vehicle Usage in Pine Island Center
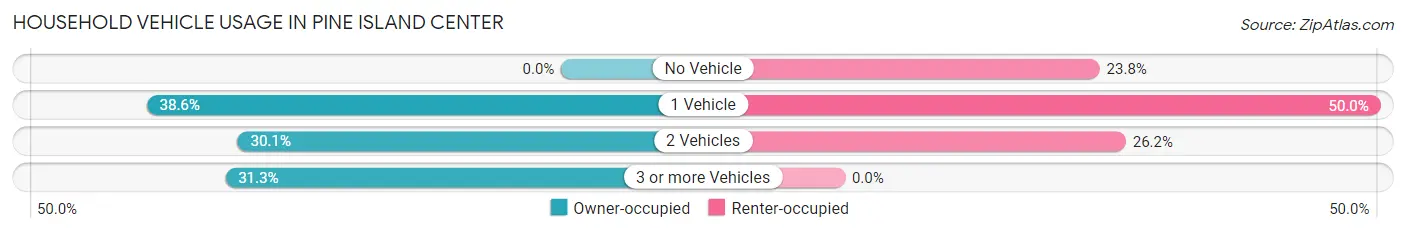
| Vehicles per Household | Owner-occupied | Renter-occupied |
| No Vehicle | 0 (0.0%) | 39 (23.8%) |
| 1 Vehicle | 200 (38.6%) | 82 (50.0%) |
| 2 Vehicles | 156 (30.1%) | 43 (26.2%) |
| 3 or more Vehicles | 162 (31.3%) | 0 (0.0%) |
| Total | 518 (100.0%) | 164 (100.0%) |
Real Estate & Mortgages in Pine Island Center
Real Estate and Mortgage Overview in Pine Island Center
| Characteristic | Without Mortgage | With Mortgage |
| Housing Units | 255 | 263 |
| Median Property Value | $225,000 | $263,700 |
| Median Household Income | $58,125 | $34 |
| Monthly Housing Costs | $571 | $9 |
| Real Estate Taxes | $1,552 | $0 |
Property Value by Mortgage Status in Pine Island Center
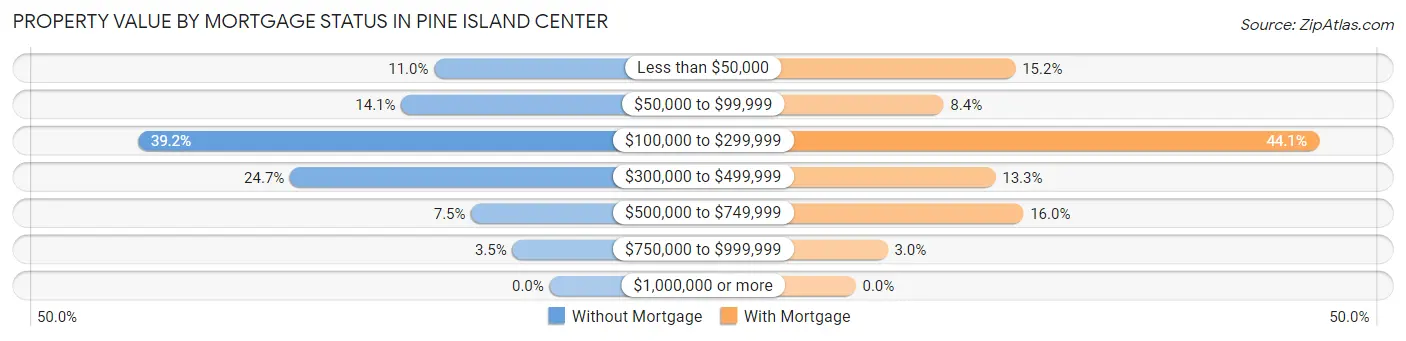
| Property Value | Without Mortgage | With Mortgage |
| Less than $50,000 | 28 (11.0%) | 40 (15.2%) |
| $50,000 to $99,999 | 36 (14.1%) | 22 (8.4%) |
| $100,000 to $299,999 | 100 (39.2%) | 116 (44.1%) |
| $300,000 to $499,999 | 63 (24.7%) | 35 (13.3%) |
| $500,000 to $749,999 | 19 (7.4%) | 42 (16.0%) |
| $750,000 to $999,999 | 9 (3.5%) | 8 (3.0%) |
| $1,000,000 or more | 0 (0.0%) | 0 (0.0%) |
| Total | 255 (100.0%) | 263 (100.0%) |
Household Income by Mortgage Status in Pine Island Center
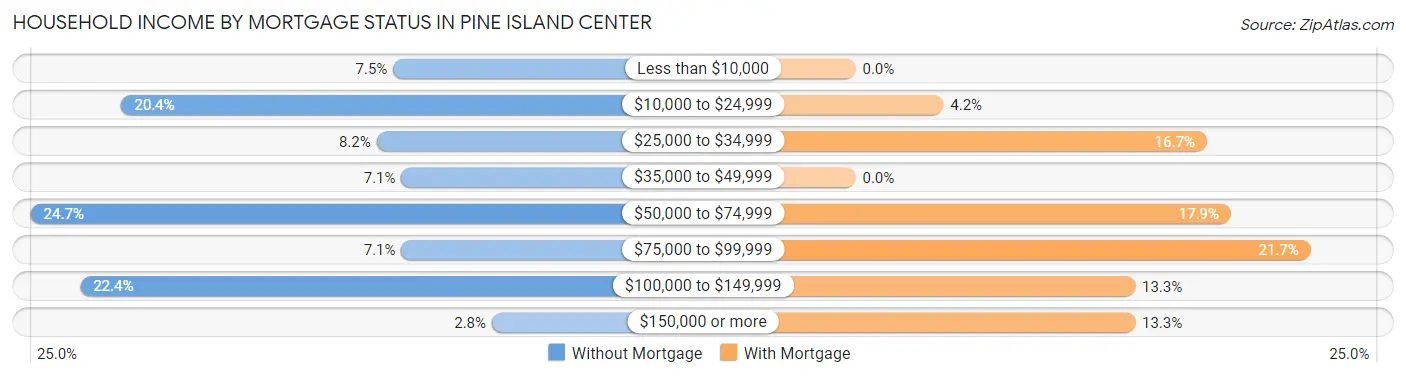
| Household Income | Without Mortgage | With Mortgage |
| Less than $10,000 | 19 (7.4%) | 0 (0.0%) |
| $10,000 to $24,999 | 52 (20.4%) | 11 (4.2%) |
| $25,000 to $34,999 | 21 (8.2%) | 44 (16.7%) |
| $35,000 to $49,999 | 18 (7.1%) | 0 (0.0%) |
| $50,000 to $74,999 | 63 (24.7%) | 47 (17.9%) |
| $75,000 to $99,999 | 18 (7.1%) | 57 (21.7%) |
| $100,000 to $149,999 | 57 (22.4%) | 35 (13.3%) |
| $150,000 or more | 7 (2.8%) | 35 (13.3%) |
| Total | 255 (100.0%) | 263 (100.0%) |
Property Value to Household Income Ratio in Pine Island Center
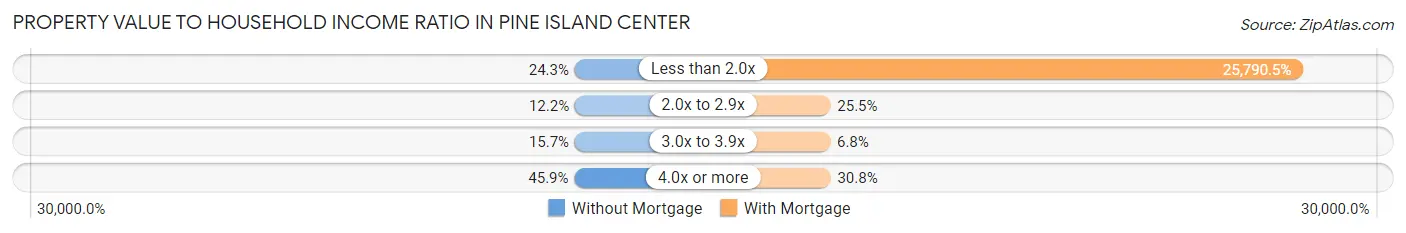
| Value-to-Income Ratio | Without Mortgage | With Mortgage |
| Less than 2.0x | 62 (24.3%) | 67,829 (25,790.5%) |
| 2.0x to 2.9x | 31 (12.2%) | 67 (25.5%) |
| 3.0x to 3.9x | 40 (15.7%) | 18 (6.8%) |
| 4.0x or more | 117 (45.9%) | 81 (30.8%) |
| Total | 255 (100.0%) | 263 (100.0%) |
Real Estate Taxes by Mortgage Status in Pine Island Center
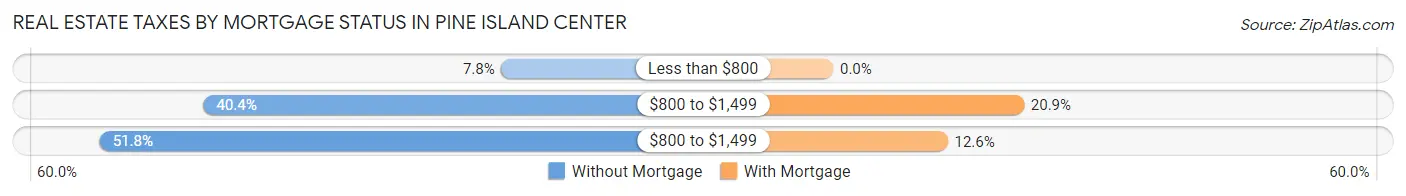
| Property Taxes | Without Mortgage | With Mortgage |
| Less than $800 | 20 (7.8%) | 0 (0.0%) |
| $800 to $1,499 | 103 (40.4%) | 55 (20.9%) |
| $800 to $1,499 | 132 (51.8%) | 33 (12.6%) |
| Total | 255 (100.0%) | 263 (100.0%) |
Health & Disability in Pine Island Center
Health Insurance Coverage by Age in Pine Island Center
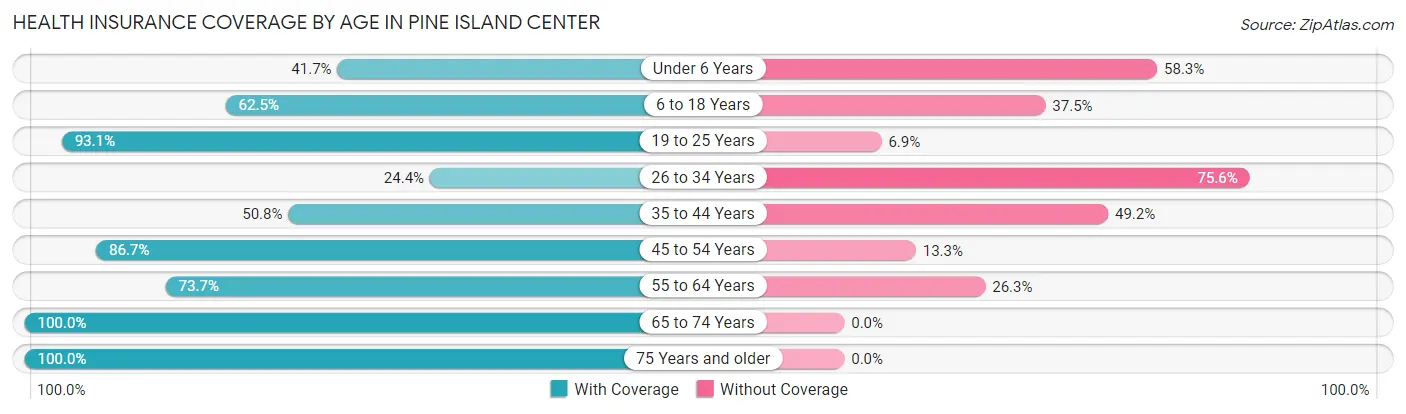
| Age Bracket | With Coverage | Without Coverage |
| Under 6 Years | 30 (41.7%) | 42 (58.3%) |
| 6 to 18 Years | 115 (62.5%) | 69 (37.5%) |
| 19 to 25 Years | 94 (93.1%) | 7 (6.9%) |
| 26 to 34 Years | 21 (24.4%) | 65 (75.6%) |
| 35 to 44 Years | 93 (50.8%) | 90 (49.2%) |
| 45 to 54 Years | 104 (86.7%) | 16 (13.3%) |
| 55 to 64 Years | 241 (73.7%) | 86 (26.3%) |
| 65 to 74 Years | 315 (100.0%) | 0 (0.0%) |
| 75 Years and older | 238 (100.0%) | 0 (0.0%) |
| Total | 1,251 (76.9%) | 375 (23.1%) |
Health Insurance Coverage by Citizenship Status in Pine Island Center
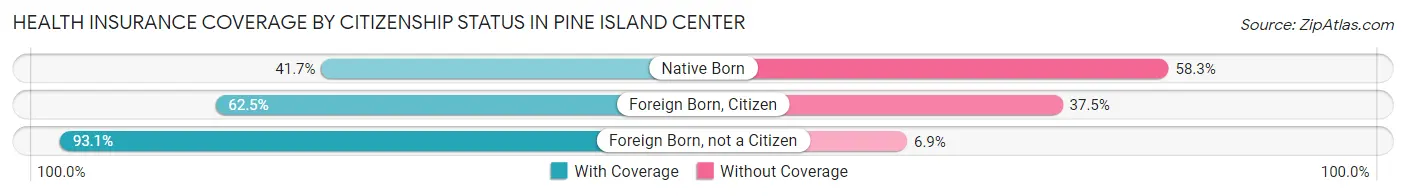
| Citizenship Status | With Coverage | Without Coverage |
| Native Born | 30 (41.7%) | 42 (58.3%) |
| Foreign Born, Citizen | 115 (62.5%) | 69 (37.5%) |
| Foreign Born, not a Citizen | 94 (93.1%) | 7 (6.9%) |
Health Insurance Coverage by Household Income in Pine Island Center
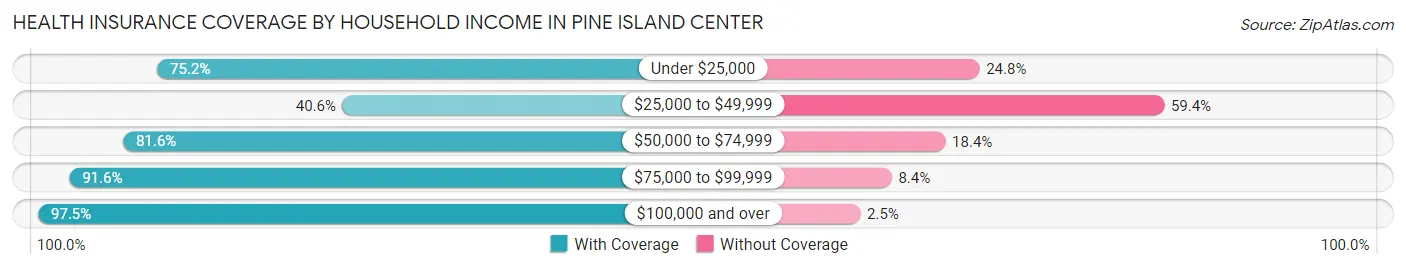
| Household Income | With Coverage | Without Coverage |
| Under $25,000 | 197 (75.2%) | 65 (24.8%) |
| $25,000 to $49,999 | 140 (40.6%) | 205 (59.4%) |
| $50,000 to $74,999 | 332 (81.6%) | 75 (18.4%) |
| $75,000 to $99,999 | 230 (91.6%) | 21 (8.4%) |
| $100,000 and over | 352 (97.5%) | 9 (2.5%) |
Public vs Private Health Insurance Coverage by Age in Pine Island Center
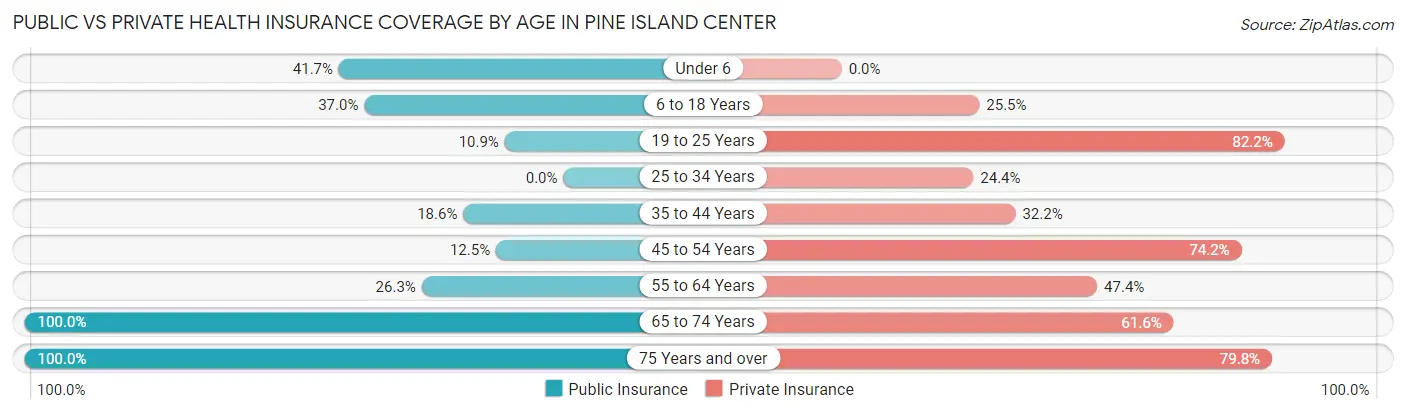
| Age Bracket | Public Insurance | Private Insurance |
| Under 6 | 30 (41.7%) | 0 (0.0%) |
| 6 to 18 Years | 68 (37.0%) | 47 (25.5%) |
| 19 to 25 Years | 11 (10.9%) | 83 (82.2%) |
| 25 to 34 Years | 0 (0.0%) | 21 (24.4%) |
| 35 to 44 Years | 34 (18.6%) | 59 (32.2%) |
| 45 to 54 Years | 15 (12.5%) | 89 (74.2%) |
| 55 to 64 Years | 86 (26.3%) | 155 (47.4%) |
| 65 to 74 Years | 315 (100.0%) | 194 (61.6%) |
| 75 Years and over | 238 (100.0%) | 190 (79.8%) |
| Total | 797 (49.0%) | 838 (51.5%) |
Disability Status by Sex by Age in Pine Island Center
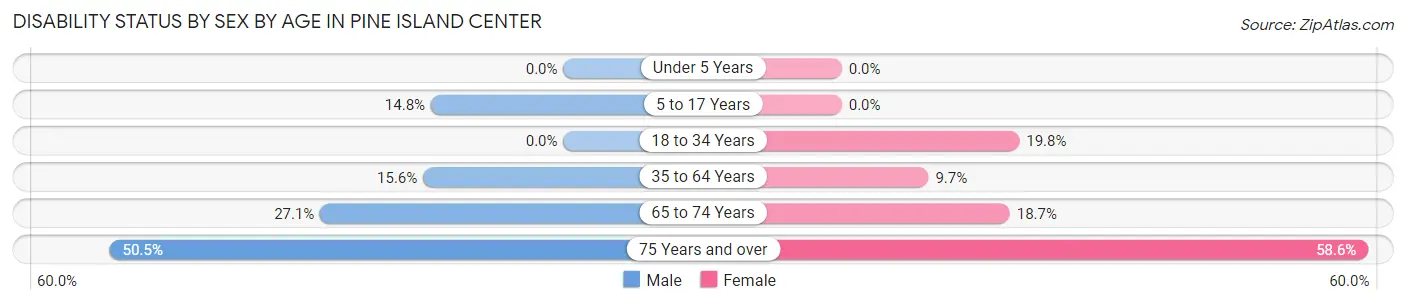
| Age Bracket | Male | Female |
| Under 5 Years | 0 (0.0%) | 0 (0.0%) |
| 5 to 17 Years | 18 (14.7%) | 0 (0.0%) |
| 18 to 34 Years | 0 (0.0%) | 17 (19.8%) |
| 35 to 64 Years | 45 (15.6%) | 33 (9.7%) |
| 65 to 74 Years | 39 (27.1%) | 32 (18.7%) |
| 75 Years and over | 47 (50.5%) | 85 (58.6%) |
Disability Class by Sex by Age in Pine Island Center
Disability Class: Hearing Difficulty
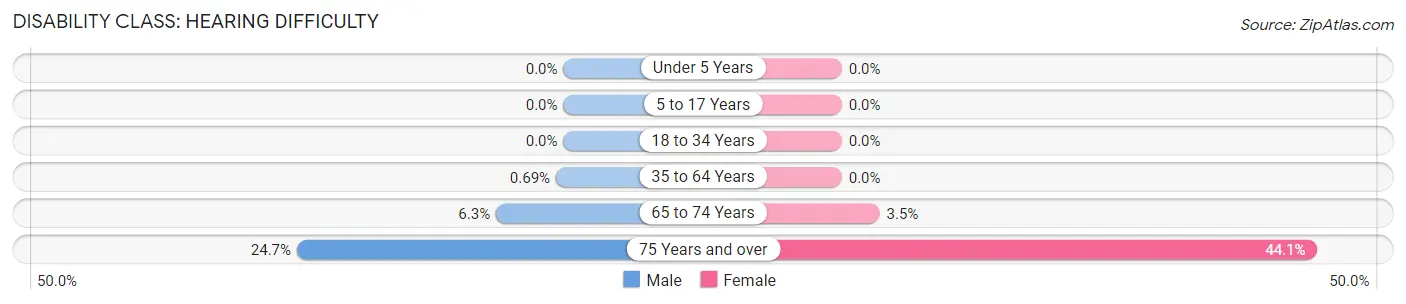
| Age Bracket | Male | Female |
| Under 5 Years | 0 (0.0%) | 0 (0.0%) |
| 5 to 17 Years | 0 (0.0%) | 0 (0.0%) |
| 18 to 34 Years | 0 (0.0%) | 0 (0.0%) |
| 35 to 64 Years | 2 (0.7%) | 0 (0.0%) |
| 65 to 74 Years | 9 (6.2%) | 6 (3.5%) |
| 75 Years and over | 23 (24.7%) | 64 (44.1%) |
Disability Class: Vision Difficulty
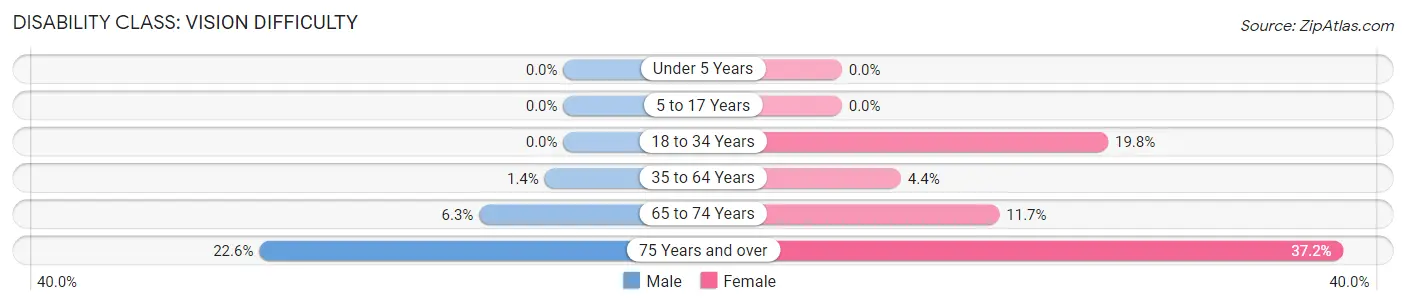
| Age Bracket | Male | Female |
| Under 5 Years | 0 (0.0%) | 0 (0.0%) |
| 5 to 17 Years | 0 (0.0%) | 0 (0.0%) |
| 18 to 34 Years | 0 (0.0%) | 17 (19.8%) |
| 35 to 64 Years | 4 (1.4%) | 15 (4.4%) |
| 65 to 74 Years | 9 (6.2%) | 20 (11.7%) |
| 75 Years and over | 21 (22.6%) | 54 (37.2%) |
Disability Class: Cognitive Difficulty
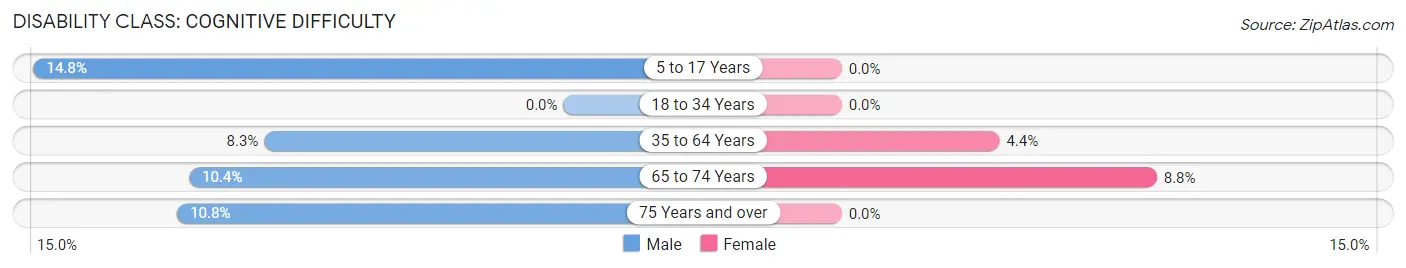
| Age Bracket | Male | Female |
| 5 to 17 Years | 18 (14.7%) | 0 (0.0%) |
| 18 to 34 Years | 0 (0.0%) | 0 (0.0%) |
| 35 to 64 Years | 24 (8.3%) | 15 (4.4%) |
| 65 to 74 Years | 15 (10.4%) | 15 (8.8%) |
| 75 Years and over | 10 (10.7%) | 0 (0.0%) |
Disability Class: Ambulatory Difficulty
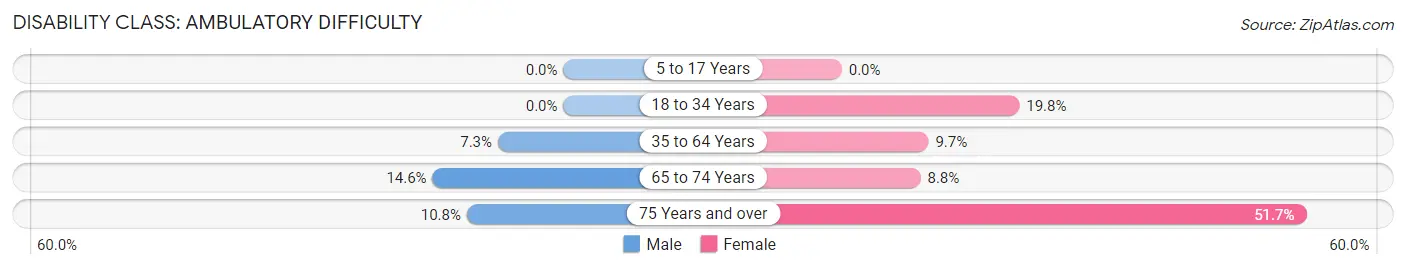
| Age Bracket | Male | Female |
| 5 to 17 Years | 0 (0.0%) | 0 (0.0%) |
| 18 to 34 Years | 0 (0.0%) | 17 (19.8%) |
| 35 to 64 Years | 21 (7.3%) | 33 (9.7%) |
| 65 to 74 Years | 21 (14.6%) | 15 (8.8%) |
| 75 Years and over | 10 (10.7%) | 75 (51.7%) |
Disability Class: Self-Care Difficulty
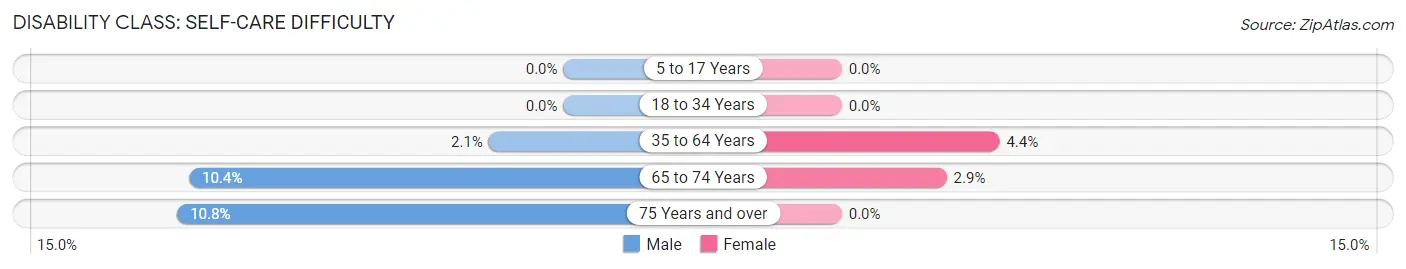
| Age Bracket | Male | Female |
| 5 to 17 Years | 0 (0.0%) | 0 (0.0%) |
| 18 to 34 Years | 0 (0.0%) | 0 (0.0%) |
| 35 to 64 Years | 6 (2.1%) | 15 (4.4%) |
| 65 to 74 Years | 15 (10.4%) | 5 (2.9%) |
| 75 Years and over | 10 (10.7%) | 0 (0.0%) |
Technology Access in Pine Island Center
Computing Device Access in Pine Island Center
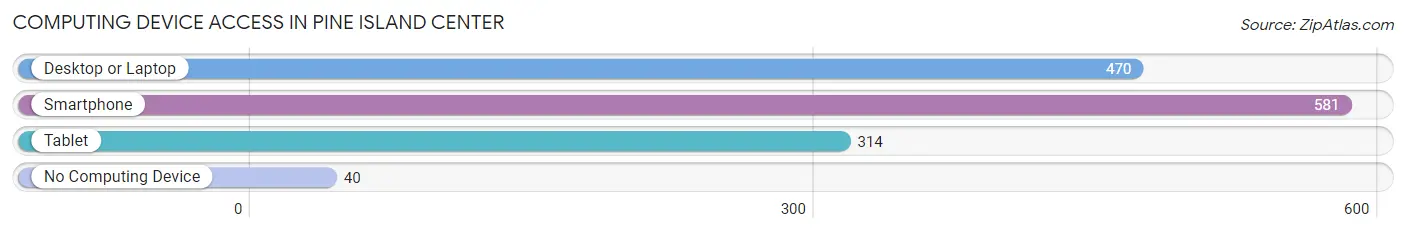
| Device Type | # Households | % Households |
| Desktop or Laptop | 470 | 68.9% |
| Smartphone | 581 | 85.2% |
| Tablet | 314 | 46.0% |
| No Computing Device | 40 | 5.9% |
| Total | 682 | 100.0% |
Internet Access in Pine Island Center
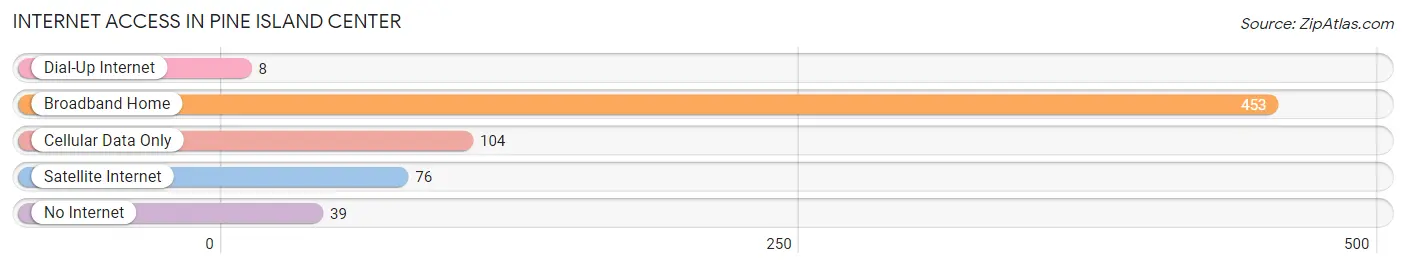
| Internet Type | # Households | % Households |
| Dial-Up Internet | 8 | 1.2% |
| Broadband Home | 453 | 66.4% |
| Cellular Data Only | 104 | 15.2% |
| Satellite Internet | 76 | 11.1% |
| No Internet | 39 | 5.7% |
| Total | 682 | 100.0% |
Pine Island Center Summary
Pine Island Center is an unincorporated community located in Lee County, Florida, United States. It is located on the northern end of Pine Island, a barrier island in the Gulf of Mexico. The community is part of the Cape Coral-Fort Myers Metropolitan Statistical Area.
History
The area now known as Pine Island Center was originally inhabited by the Calusa Indians. The Calusa were a powerful tribe that controlled much of the area from Tampa Bay to the Florida Keys. They were known for their elaborate shell mounds, which can still be seen in the area today.
The first European settlers arrived in the area in the late 19th century. The first post office was established in 1887, and the community was officially incorporated in 1895.
In the early 20th century, the area was a popular destination for fishing and hunting. The first bridge to Pine Island was built in 1921, and the area began to develop as a tourist destination.
In the 1950s, the area began to experience rapid growth as more people moved to the area. The population of Pine Island Center increased from 1,000 in 1950 to over 5,000 in 1960.
Geography
Pine Island Center is located on the northern end of Pine Island, a barrier island in the Gulf of Mexico. The island is approximately 25 miles long and 5 miles wide. It is bordered by Matlacha Pass to the north and Pine Island Sound to the south.
The area is mostly flat, with some low hills and marshes. The climate is subtropical, with hot, humid summers and mild winters.
Economy
The economy of Pine Island Center is largely based on tourism and fishing. The area is a popular destination for fishing, boating, and other outdoor activities. There are several marinas and boat ramps in the area, as well as several restaurants and bars.
The area is also home to several commercial businesses, including a grocery store, hardware store, and several other retail stores.
Demographics
As of the 2010 census, the population of Pine Island Center was 5,867. The racial makeup of the town was 94.3% White, 2.2% African American, 0.7% Native American, 0.7% Asian, 0.2% Pacific Islander, and 1.9% from other races. Hispanic or Latino of any race were 5.3% of the population.
The median household income in Pine Island Center was $45,938, and the median family income was $50,938. The per capita income was $22,938. About 8.3% of families and 10.2% of the population were below the poverty line, including 14.2% of those under age 18 and 5.2% of those age 65 or over.
Common Questions
What is Per Capita Income in Pine Island Center?
Per Capita income in Pine Island Center is $29,396.
What is the Median Family Income in Pine Island Center?
Median Family Income in Pine Island Center is $67,679.
What is the Median Household income in Pine Island Center?
Median Household Income in Pine Island Center is $55,565.
What is Income or Wage Gap in Pine Island Center?
Income or Wage Gap in Pine Island Center is 25.6%.
Women in Pine Island Center earn 74.4 cents for every dollar earned by a man.
What is Inequality or Gini Index in Pine Island Center?
Inequality or Gini Index in Pine Island Center is 0.41.
What is the Total Population of Pine Island Center?
Total Population of Pine Island Center is 1,626.
What is the Total Male Population of Pine Island Center?
Total Male Population of Pine Island Center is 761.
What is the Total Female Population of Pine Island Center?
Total Female Population of Pine Island Center is 865.
What is the Ratio of Males per 100 Females in Pine Island Center?
There are 87.98 Males per 100 Females in Pine Island Center.
What is the Ratio of Females per 100 Males in Pine Island Center?
There are 113.67 Females per 100 Males in Pine Island Center.
What is the Median Population Age in Pine Island Center?
Median Population Age in Pine Island Center is 58.2 Years.
What is the Average Family Size in Pine Island Center
Average Family Size in Pine Island Center is 3.0 People.
What is the Average Household Size in Pine Island Center
Average Household Size in Pine Island Center is 2.4 People.
How Large is the Labor Force in Pine Island Center?
There are 627 People in the Labor Forcein in Pine Island Center.
What is the Percentage of People in the Labor Force in Pine Island Center?
45.0% of People are in the Labor Force in Pine Island Center.
What is the Unemployment Rate in Pine Island Center?
Unemployment Rate in Pine Island Center is 1.9%.