Gulfport, FL Map & Demographics
Gulfport Map
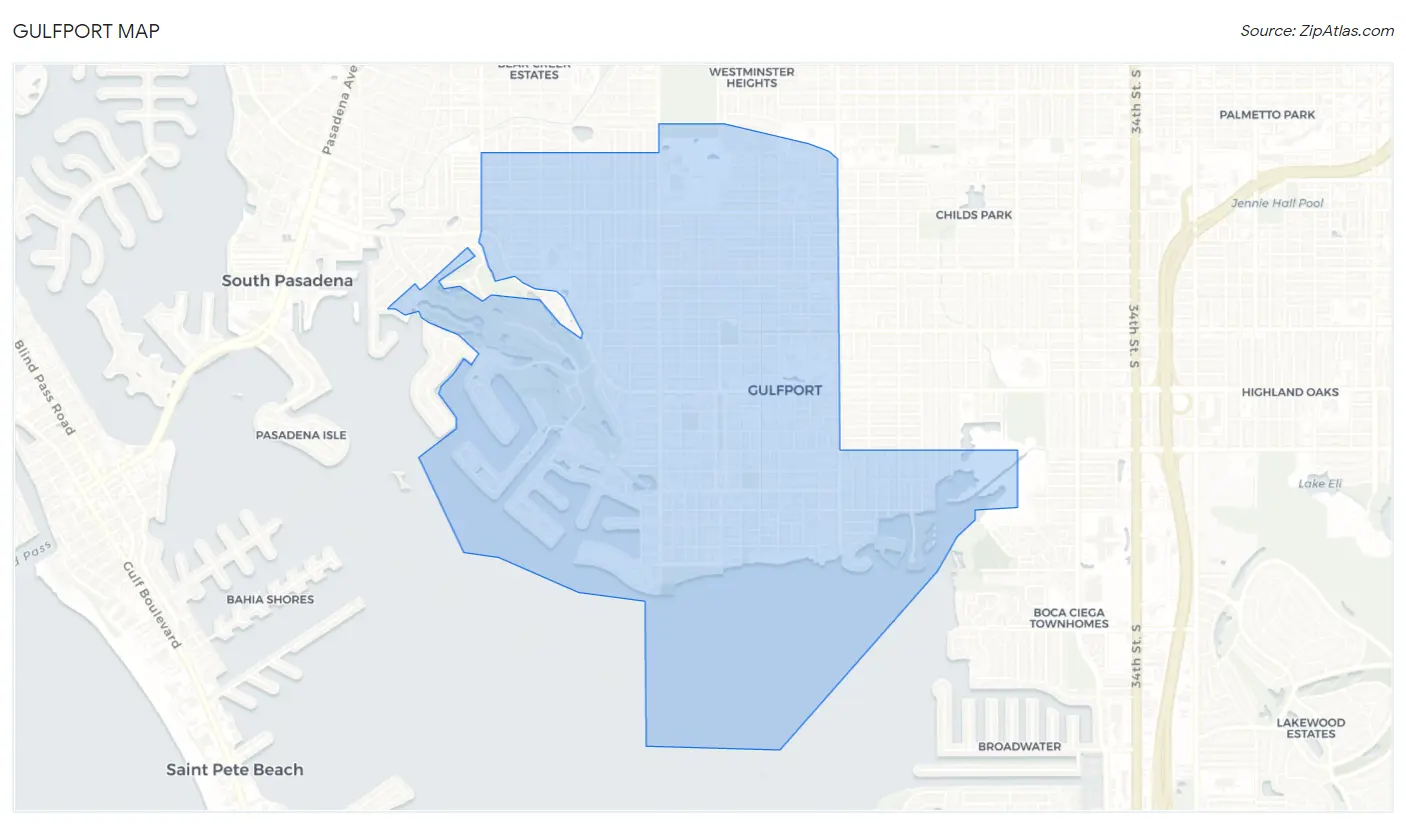
Gulfport Overview
$48,446
PER CAPITA INCOME
$75,000
AVG FAMILY INCOME
$60,461
AVG HOUSEHOLD INCOME
21.5%
WAGE / INCOME GAP [ % ]
78.5¢/ $1
WAGE / INCOME GAP [ $ ]
0.52
INEQUALITY / GINI INDEX
11,796
TOTAL POPULATION
5,453
MALE POPULATION
6,343
FEMALE POPULATION
85.97
MALES / 100 FEMALES
116.32
FEMALES / 100 MALES
59.0
MEDIAN AGE
2.5
AVG FAMILY SIZE
1.9
AVG HOUSEHOLD SIZE
5,142
LABOR FORCE [ PEOPLE ]
46.6%
PERCENT IN LABOR FORCE
5.9%
UNEMPLOYMENT RATE
Gulfport Area Codes
Income in Gulfport
Income Overview in Gulfport
Per Capita Income in Gulfport is $48,446, while median incomes of families and households are $75,000 and $60,461 respectively.
| Characteristic | Number | Measure |
| Per Capita Income | 11,796 | $48,446 |
| Median Family Income | 2,990 | $75,000 |
| Mean Family Income | 2,990 | $102,621 |
| Median Household Income | 6,207 | $60,461 |
| Mean Household Income | 6,207 | $89,563 |
| Income Deficit | 2,990 | $0 |
| Wage / Income Gap (%) | 11,796 | 21.52% |
| Wage / Income Gap ($) | 11,796 | 78.48¢ per $1 |
| Gini / Inequality Index | 11,796 | 0.52 |
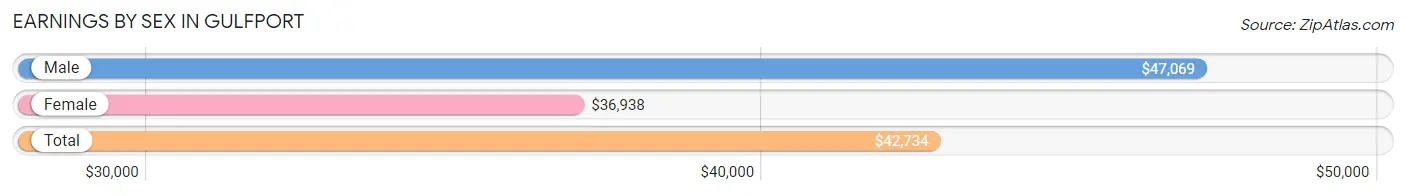
Earnings by Sex in Gulfport
Average Earnings in Gulfport are $42,734, $47,069 for men and $36,938 for women, a difference of 21.5%.
| Sex | Number | Average Earnings |
| Male | 2,697 (50.9%) | $47,069 |
| Female | 2,598 (49.1%) | $36,938 |
| Total | 5,295 (100.0%) | $42,734 |
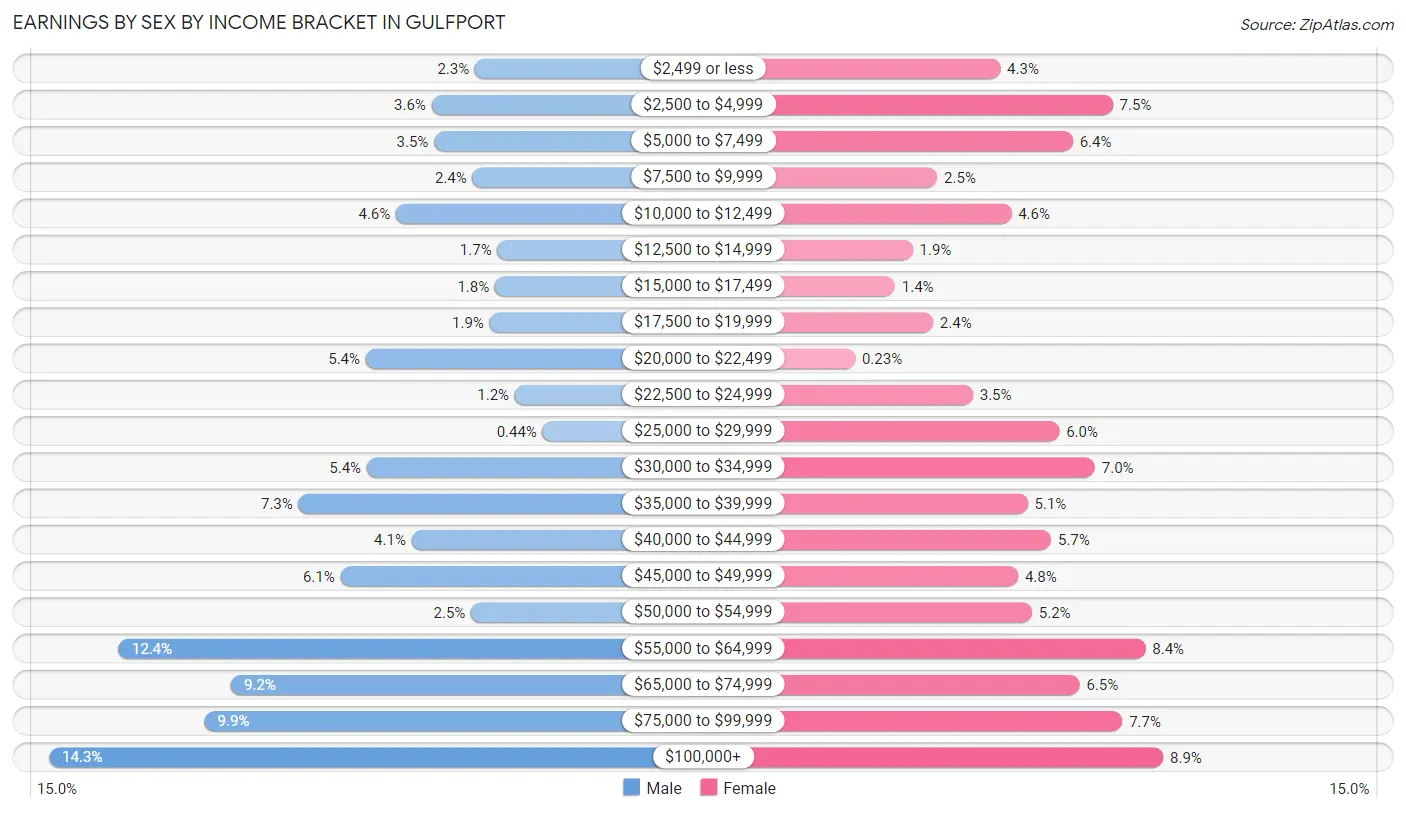
Earnings by Sex by Income Bracket in Gulfport
The most common earnings brackets in Gulfport are $100,000+ for men (386 | 14.3%) and $100,000+ for women (231 | 8.9%).
| Income | Male | Female |
| $2,499 or less | 63 (2.3%) | 112 (4.3%) |
| $2,500 to $4,999 | 96 (3.6%) | 194 (7.5%) |
| $5,000 to $7,499 | 94 (3.5%) | 165 (6.4%) |
| $7,500 to $9,999 | 65 (2.4%) | 66 (2.5%) |
| $10,000 to $12,499 | 123 (4.6%) | 120 (4.6%) |
| $12,500 to $14,999 | 46 (1.7%) | 48 (1.8%) |
| $15,000 to $17,499 | 48 (1.8%) | 35 (1.3%) |
| $17,500 to $19,999 | 52 (1.9%) | 63 (2.4%) |
| $20,000 to $22,499 | 146 (5.4%) | 6 (0.2%) |
| $22,500 to $24,999 | 33 (1.2%) | 92 (3.5%) |
| $25,000 to $29,999 | 12 (0.4%) | 155 (6.0%) |
| $30,000 to $34,999 | 145 (5.4%) | 181 (7.0%) |
| $35,000 to $39,999 | 197 (7.3%) | 132 (5.1%) |
| $40,000 to $44,999 | 111 (4.1%) | 149 (5.7%) |
| $45,000 to $49,999 | 165 (6.1%) | 125 (4.8%) |
| $50,000 to $54,999 | 66 (2.5%) | 135 (5.2%) |
| $55,000 to $64,999 | 333 (12.3%) | 218 (8.4%) |
| $65,000 to $74,999 | 248 (9.2%) | 170 (6.5%) |
| $75,000 to $99,999 | 268 (9.9%) | 201 (7.7%) |
| $100,000+ | 386 (14.3%) | 231 (8.9%) |
| Total | 2,697 (100.0%) | 2,598 (100.0%) |
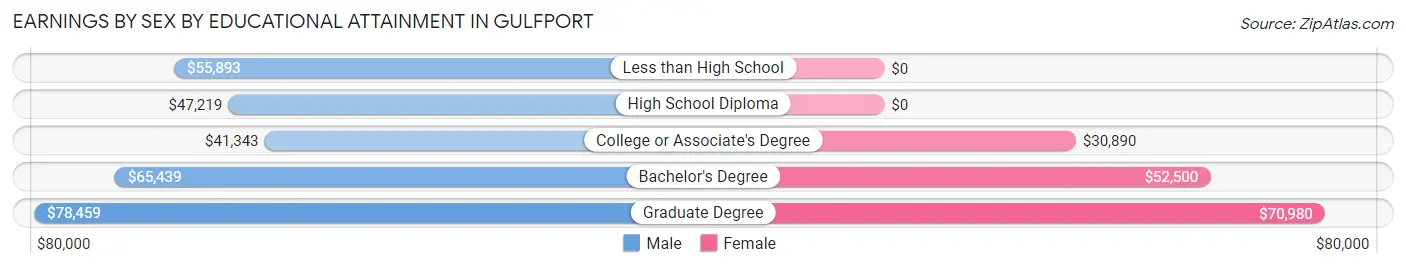
Earnings by Sex by Educational Attainment in Gulfport
Average earnings in Gulfport are $55,108 for men and $38,185 for women, a difference of 30.7%. Men with an educational attainment of graduate degree enjoy the highest average annual earnings of $78,459, while those with college or associate's degree education earn the least with $41,343. Women with an educational attainment of graduate degree earn the most with the average annual earnings of $70,980, while those with college or associate's degree education have the smallest earnings of $30,890.
| Educational Attainment | Male Income | Female Income |
| Less than High School | $55,893 | $0 |
| High School Diploma | $47,219 | $0 |
| College or Associate's Degree | $41,343 | $30,890 |
| Bachelor's Degree | $65,439 | $52,500 |
| Graduate Degree | $78,459 | $70,980 |
| Total | $55,108 | $38,185 |
Family Income in Gulfport
Family Income Brackets in Gulfport
According to the Gulfport family income data, there are 727 families falling into the $50,000 to $74,999 income range, which is the most common income bracket and makes up 24.3% of all families. Conversely, the less than $10,000 income bracket is the least frequent group with only 75 families (2.5%) belonging to this category.
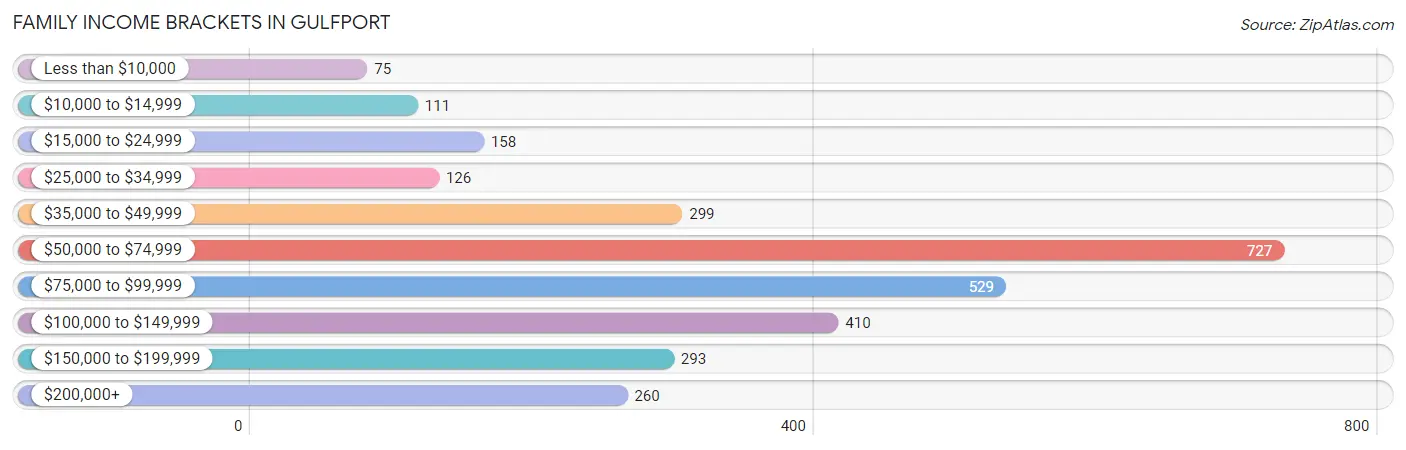
| Income Bracket | # Families | % Families |
| Less than $10,000 | 75 | 2.5% |
| $10,000 to $14,999 | 111 | 3.7% |
| $15,000 to $24,999 | 158 | 5.3% |
| $25,000 to $34,999 | 126 | 4.2% |
| $35,000 to $49,999 | 299 | 10.0% |
| $50,000 to $74,999 | 727 | 24.3% |
| $75,000 to $99,999 | 529 | 17.7% |
| $100,000 to $149,999 | 410 | 13.7% |
| $150,000 to $199,999 | 293 | 9.8% |
| $200,000+ | 260 | 8.7% |
Family Income by Famaliy Size in Gulfport
4-person families (135 | 4.5%) account for the highest median family income in Gulfport with $120,250 per family, while 2-person families (2,362 | 79.0%) have the highest median income of $36,125 per family member.
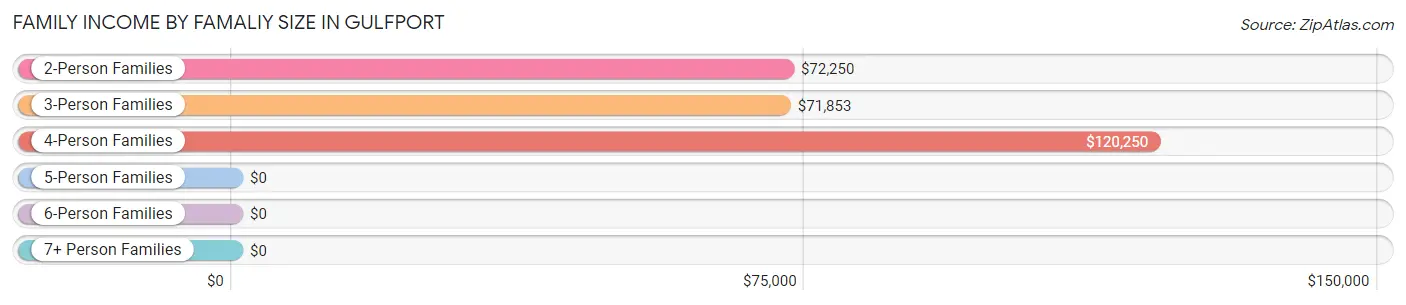
| Income Bracket | # Families | Median Income |
| 2-Person Families | 2,362 (79.0%) | $72,250 |
| 3-Person Families | 457 (15.3%) | $71,853 |
| 4-Person Families | 135 (4.5%) | $120,250 |
| 5-Person Families | 10 (0.3%) | $0 |
| 6-Person Families | 26 (0.9%) | $0 |
| 7+ Person Families | 0 (0.0%) | $0 |
| Total | 2,990 (100.0%) | $75,000 |
Family Income by Number of Earners in Gulfport
The median family income in Gulfport is $75,000, with families comprising 2 earners (807) having the highest median family income of $118,125, while families with no earners (872) have the lowest median family income of $57,033, accounting for 27.0% and 29.2% of families, respectively.
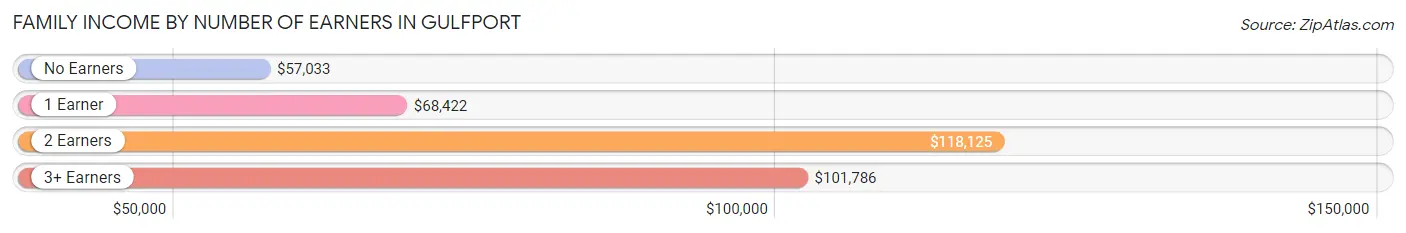
| Number of Earners | # Families | Median Income |
| No Earners | 872 (29.2%) | $57,033 |
| 1 Earner | 1,243 (41.6%) | $68,422 |
| 2 Earners | 807 (27.0%) | $118,125 |
| 3+ Earners | 68 (2.3%) | $101,786 |
| Total | 2,990 (100.0%) | $75,000 |
Household Income in Gulfport
Household Income Brackets in Gulfport
With 1,272 households falling in the category, the $50,000 to $74,999 income range is the most frequent in Gulfport, accounting for 20.5% of all households. In contrast, only 323 households (5.2%) fall into the $10,000 to $14,999 income bracket, making it the least populous group.
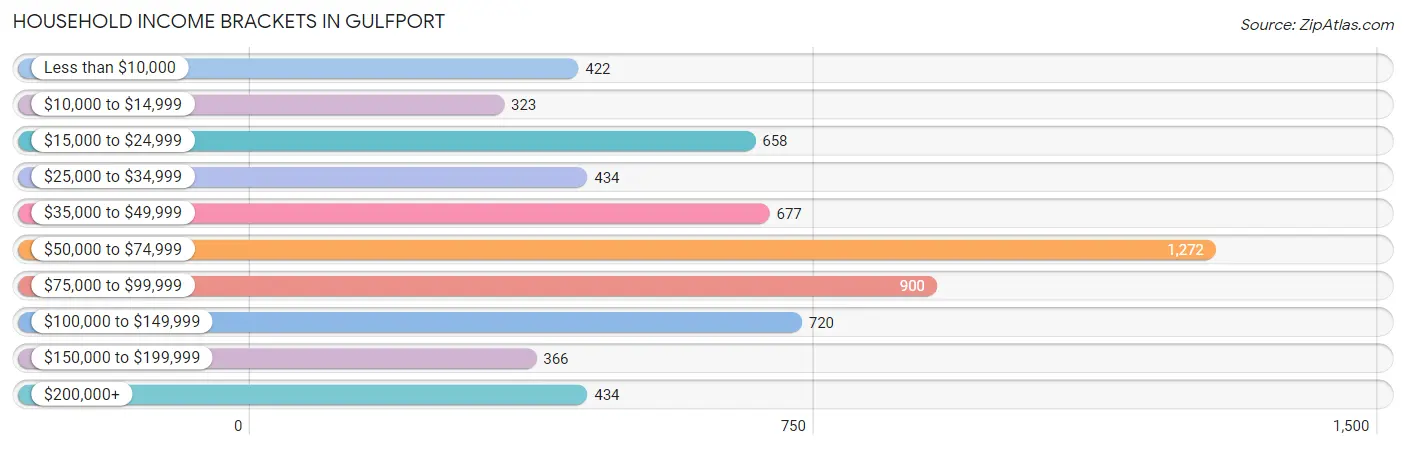
| Income Bracket | # Households | % Households |
| Less than $10,000 | 422 | 6.8% |
| $10,000 to $14,999 | 323 | 5.2% |
| $15,000 to $24,999 | 658 | 10.6% |
| $25,000 to $34,999 | 434 | 7.0% |
| $35,000 to $49,999 | 677 | 10.9% |
| $50,000 to $74,999 | 1,272 | 20.5% |
| $75,000 to $99,999 | 900 | 14.5% |
| $100,000 to $149,999 | 720 | 11.6% |
| $150,000 to $199,999 | 366 | 5.9% |
| $200,000+ | 434 | 7.0% |
Household Income by Householder Age in Gulfport
The median household income in Gulfport is $60,461, with the highest median household income of $71,611 found in the 45 to 64 years age bracket for the primary householder. A total of 2,404 households (38.7%) fall into this category. Meanwhile, the 15 to 24 years age bracket for the primary householder has the lowest median household income of $0, with 134 households (2.2%) in this group.
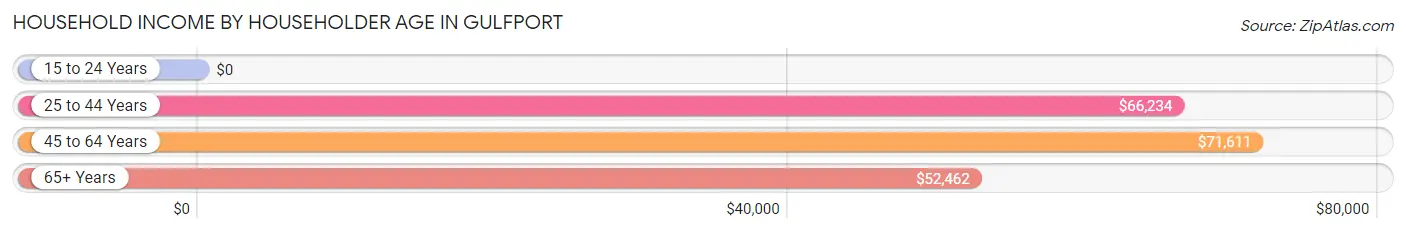
| Income Bracket | # Households | Median Income |
| 15 to 24 Years | 134 (2.2%) | $0 |
| 25 to 44 Years | 895 (14.4%) | $66,234 |
| 45 to 64 Years | 2,404 (38.7%) | $71,611 |
| 65+ Years | 2,774 (44.7%) | $52,462 |
| Total | 6,207 (100.0%) | $60,461 |
Poverty in Gulfport
Income Below Poverty by Sex and Age in Gulfport
With 13.2% poverty level for males and 13.0% for females among the residents of Gulfport, 12 to 14 year old males and 18 to 24 year old females are the most vulnerable to poverty, with 91 males (66.9%) and 29 females (19.1%) in their respective age groups living below the poverty level.
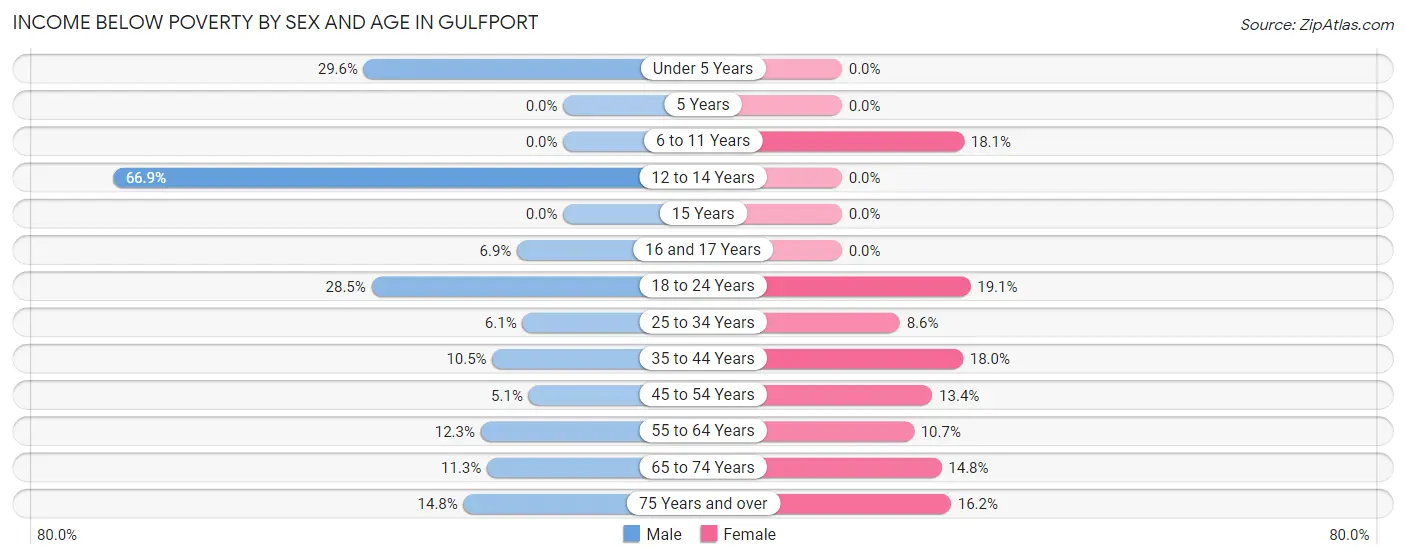
| Age Bracket | Male | Female |
| Under 5 Years | 40 (29.6%) | 0 (0.0%) |
| 5 Years | 0 (0.0%) | 0 (0.0%) |
| 6 to 11 Years | 0 (0.0%) | 29 (18.1%) |
| 12 to 14 Years | 91 (66.9%) | 0 (0.0%) |
| 15 Years | 0 (0.0%) | 0 (0.0%) |
| 16 and 17 Years | 7 (6.9%) | 0 (0.0%) |
| 18 to 24 Years | 78 (28.5%) | 29 (19.1%) |
| 25 to 34 Years | 32 (6.1%) | 35 (8.6%) |
| 35 to 44 Years | 36 (10.5%) | 83 (18.0%) |
| 45 to 54 Years | 39 (5.1%) | 115 (13.4%) |
| 55 to 64 Years | 148 (12.3%) | 138 (10.7%) |
| 65 to 74 Years | 114 (11.3%) | 208 (14.8%) |
| 75 Years and over | 121 (14.8%) | 174 (16.2%) |
| Total | 706 (13.2%) | 811 (13.0%) |
Income Above Poverty by Sex and Age in Gulfport
According to the poverty statistics in Gulfport, males aged 5 years and females aged under 5 years are the age groups that are most secure financially, with 100.0% of males and 100.0% of females in these age groups living above the poverty line.
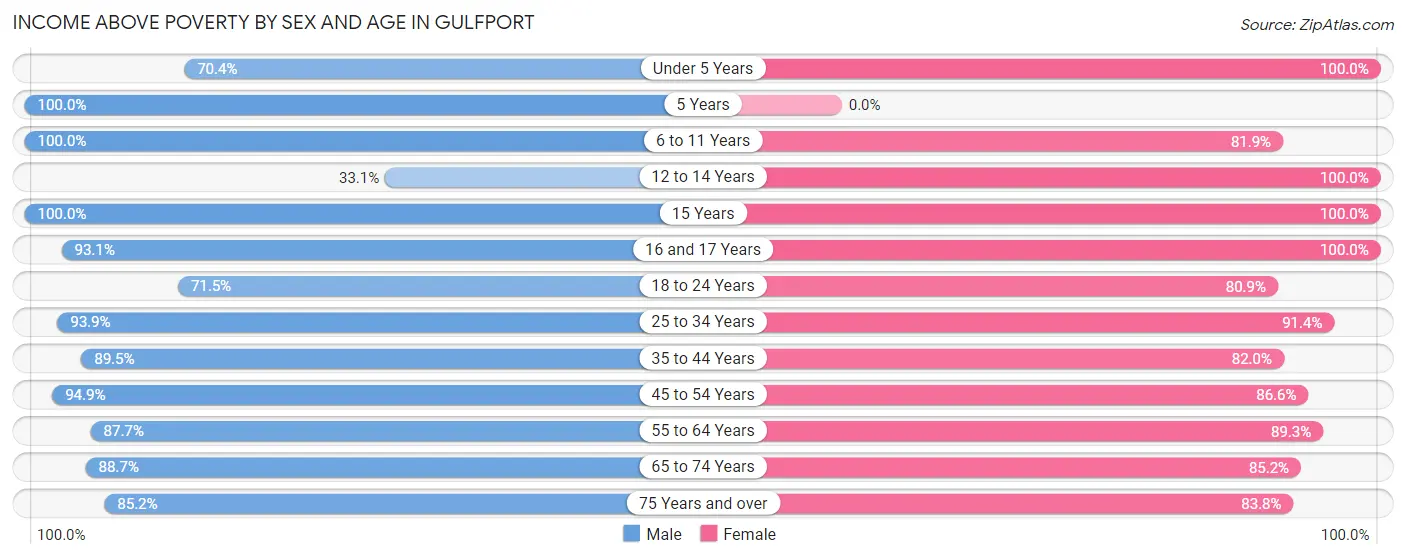
| Age Bracket | Male | Female |
| Under 5 Years | 95 (70.4%) | 239 (100.0%) |
| 5 Years | 10 (100.0%) | 0 (0.0%) |
| 6 to 11 Years | 22 (100.0%) | 131 (81.9%) |
| 12 to 14 Years | 45 (33.1%) | 28 (100.0%) |
| 15 Years | 25 (100.0%) | 5 (100.0%) |
| 16 and 17 Years | 95 (93.1%) | 166 (100.0%) |
| 18 to 24 Years | 196 (71.5%) | 123 (80.9%) |
| 25 to 34 Years | 495 (93.9%) | 372 (91.4%) |
| 35 to 44 Years | 306 (89.5%) | 379 (82.0%) |
| 45 to 54 Years | 720 (94.9%) | 742 (86.6%) |
| 55 to 64 Years | 1,059 (87.7%) | 1,154 (89.3%) |
| 65 to 74 Years | 893 (88.7%) | 1,199 (85.2%) |
| 75 Years and over | 696 (85.2%) | 901 (83.8%) |
| Total | 4,657 (86.8%) | 5,439 (87.0%) |
Income Below Poverty Among Married-Couple Families in Gulfport
The poverty statistics for married-couple families in Gulfport show that 6.5% or 147 of the total 2,270 families live below the poverty line. Families with no children have the highest poverty rate of 6.7%, comprising of 137 families. On the other hand, families with 3 or 4 children have the lowest poverty rate of 0.0%, which includes 0 families.
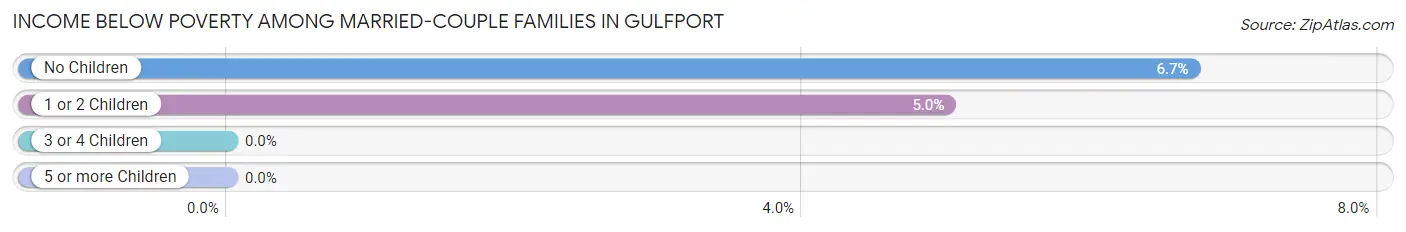
| Children | Above Poverty | Below Poverty |
| No Children | 1,907 (93.3%) | 137 (6.7%) |
| 1 or 2 Children | 190 (95.0%) | 10 (5.0%) |
| 3 or 4 Children | 26 (100.0%) | 0 (0.0%) |
| 5 or more Children | 0 (0.0%) | 0 (0.0%) |
| Total | 2,123 (93.5%) | 147 (6.5%) |
Income Below Poverty Among Single-Parent Households in Gulfport
According to the poverty data in Gulfport, 12.8% or 25 single-father households and 13.3% or 70 single-mother households are living below the poverty line. Among single-father households, those with 3 or 4 children have the highest poverty rate, with 15 households (100.0%) experiencing poverty. Likewise, among single-mother households, those with 1 or 2 children have the highest poverty rate, with 70 households (21.0%) falling below the poverty line.
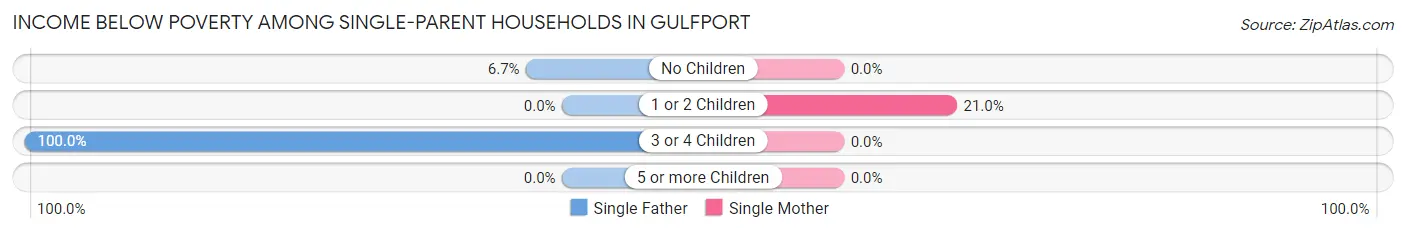
| Children | Single Father | Single Mother |
| No Children | 10 (6.7%) | 0 (0.0%) |
| 1 or 2 Children | 0 (0.0%) | 70 (21.0%) |
| 3 or 4 Children | 15 (100.0%) | 0 (0.0%) |
| 5 or more Children | 0 (0.0%) | 0 (0.0%) |
| Total | 25 (12.8%) | 70 (13.3%) |
Income Below Poverty Among Married-Couple vs Single-Parent Households in Gulfport
The poverty data for Gulfport shows that 147 of the married-couple family households (6.5%) and 95 of the single-parent households (13.2%) are living below the poverty level. Within the married-couple family households, those with no children have the highest poverty rate, with 137 households (6.7%) falling below the poverty line. Among the single-parent households, those with 3 or 4 children have the highest poverty rate, with 15 household (60.0%) living below poverty.
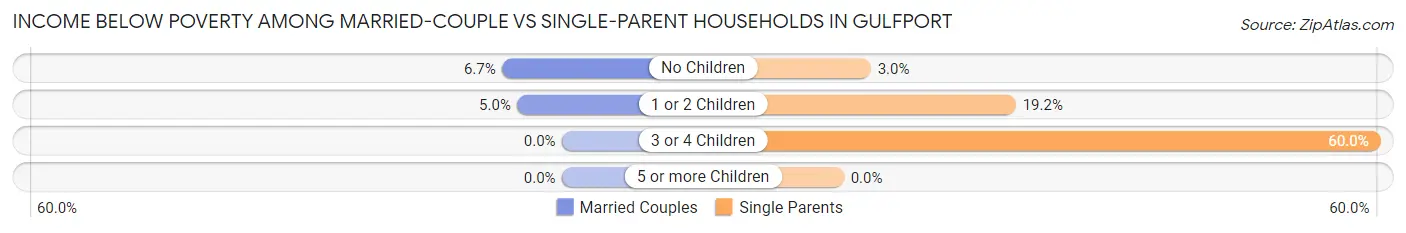
| Children | Married-Couple Families | Single-Parent Households |
| No Children | 137 (6.7%) | 10 (3.0%) |
| 1 or 2 Children | 10 (5.0%) | 70 (19.2%) |
| 3 or 4 Children | 0 (0.0%) | 15 (60.0%) |
| 5 or more Children | 0 (0.0%) | 0 (0.0%) |
| Total | 147 (6.5%) | 95 (13.2%) |
Race in Gulfport
The most populous races in Gulfport are White / Caucasian (9,989 | 84.7%), Two or more Races (946 | 8.0%), and Hispanic or Latino (839 | 7.1%).
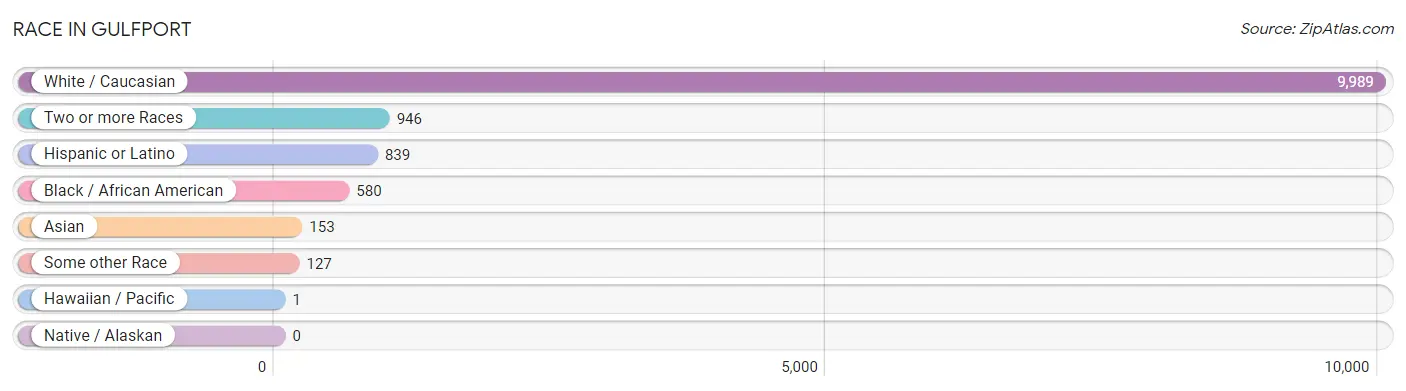
| Race | # Population | % Population |
| Asian | 153 | 1.3% |
| Black / African American | 580 | 4.9% |
| Hawaiian / Pacific | 1 | 0.0% |
| Hispanic or Latino | 839 | 7.1% |
| Native / Alaskan | 0 | 0.0% |
| White / Caucasian | 9,989 | 84.7% |
| Two or more Races | 946 | 8.0% |
| Some other Race | 127 | 1.1% |
| Total | 11,796 | 100.0% |
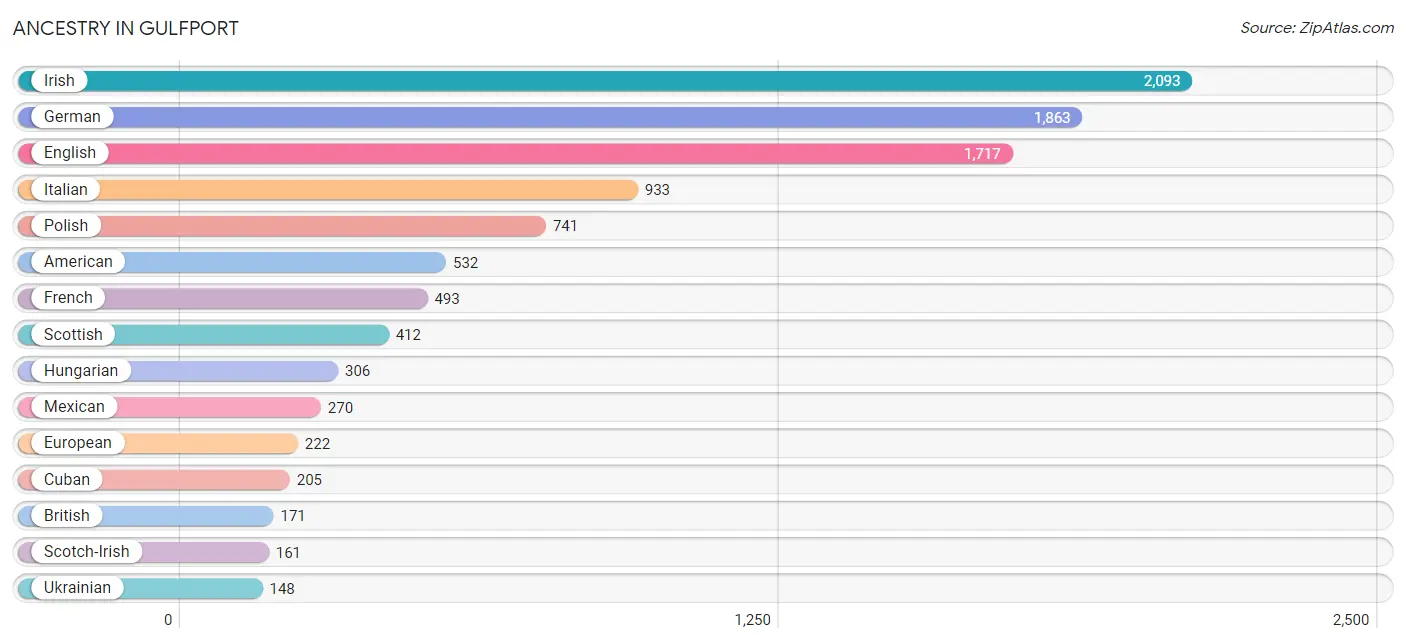
Ancestry in Gulfport
The most populous ancestries reported in Gulfport are Irish (2,093 | 17.7%), German (1,863 | 15.8%), English (1,717 | 14.6%), Italian (933 | 7.9%), and Polish (741 | 6.3%), together accounting for 62.3% of all Gulfport residents.
| Ancestry | # Population | % Population |
| African | 49 | 0.4% |
| Albanian | 23 | 0.2% |
| Alsatian | 52 | 0.4% |
| American | 532 | 4.5% |
| Arab | 12 | 0.1% |
| Argentinean | 17 | 0.1% |
| Australian | 15 | 0.1% |
| Austrian | 103 | 0.9% |
| Belgian | 13 | 0.1% |
| Bhutanese | 33 | 0.3% |
| British | 171 | 1.5% |
| Canadian | 26 | 0.2% |
| Central American | 27 | 0.2% |
| Cherokee | 16 | 0.1% |
| Colombian | 27 | 0.2% |
| Croatian | 8 | 0.1% |
| Cuban | 205 | 1.7% |
| Czech | 93 | 0.8% |
| Danish | 28 | 0.2% |
| Dominican | 21 | 0.2% |
| Dutch | 131 | 1.1% |
| Eastern European | 51 | 0.4% |
| Egyptian | 1 | 0.0% |
| English | 1,717 | 14.6% |
| Ethiopian | 2 | 0.0% |
| European | 222 | 1.9% |
| Finnish | 53 | 0.4% |
| French | 493 | 4.2% |
| French Canadian | 89 | 0.7% |
| German | 1,863 | 15.8% |
| Greek | 71 | 0.6% |
| Guyanese | 8 | 0.1% |
| Hungarian | 306 | 2.6% |
| Indian (Asian) | 66 | 0.6% |
| Irish | 2,093 | 17.7% |
| Italian | 933 | 7.9% |
| Japanese | 45 | 0.4% |
| Korean | 35 | 0.3% |
| Lithuanian | 74 | 0.6% |
| Lumbee | 13 | 0.1% |
| Mexican | 270 | 2.3% |
| Native Hawaiian | 1 | 0.0% |
| Northern European | 70 | 0.6% |
| Norwegian | 60 | 0.5% |
| Pakistani | 55 | 0.5% |
| Panamanian | 6 | 0.1% |
| Pennsylvania German | 40 | 0.3% |
| Polish | 741 | 6.3% |
| Portuguese | 69 | 0.6% |
| Puerto Rican | 105 | 0.9% |
| Romanian | 31 | 0.3% |
| Russian | 127 | 1.1% |
| Salvadoran | 21 | 0.2% |
| Scandinavian | 61 | 0.5% |
| Scotch-Irish | 161 | 1.4% |
| Scottish | 412 | 3.5% |
| Sioux | 3 | 0.0% |
| Slavic | 19 | 0.2% |
| Slovak | 57 | 0.5% |
| Slovene | 11 | 0.1% |
| South American | 44 | 0.4% |
| Spaniard | 133 | 1.1% |
| Spanish | 33 | 0.3% |
| Sri Lankan | 16 | 0.1% |
| Subsaharan African | 51 | 0.4% |
| Swedish | 142 | 1.2% |
| Swiss | 23 | 0.2% |
| Syrian | 11 | 0.1% |
| Thai | 16 | 0.1% |
| Ukrainian | 148 | 1.3% |
| Welsh | 79 | 0.7% |
| West Indian | 14 | 0.1% |
| Yugoslavian | 9 | 0.1% | View All 73 Rows |
Immigrants in Gulfport
The most numerous immigrant groups reported in Gulfport came from Europe (330 | 2.8%), Latin America (287 | 2.4%), Caribbean (192 | 1.6%), Canada (167 | 1.4%), and Eastern Europe (150 | 1.3%), together accounting for 9.6% of all Gulfport residents.
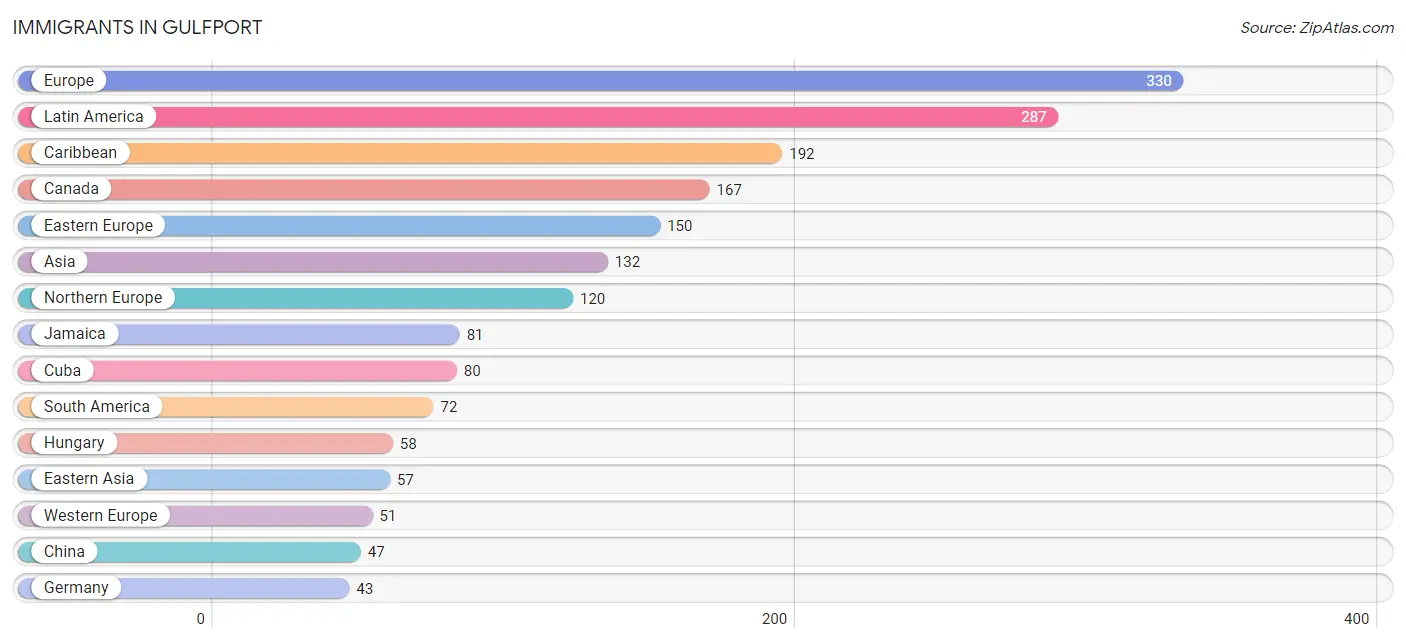
| Immigration Origin | # Population | % Population |
| Africa | 26 | 0.2% |
| Asia | 132 | 1.1% |
| Australia | 15 | 0.1% |
| Azores | 9 | 0.1% |
| Brazil | 20 | 0.2% |
| Canada | 167 | 1.4% |
| Caribbean | 192 | 1.6% |
| Central America | 23 | 0.2% |
| China | 47 | 0.4% |
| Colombia | 36 | 0.3% |
| Croatia | 8 | 0.1% |
| Cuba | 80 | 0.7% |
| Dominica | 10 | 0.1% |
| Dominican Republic | 11 | 0.1% |
| Eastern Africa | 1 | 0.0% |
| Eastern Asia | 57 | 0.5% |
| Eastern Europe | 150 | 1.3% |
| England | 34 | 0.3% |
| Ethiopia | 1 | 0.0% |
| Europe | 330 | 2.8% |
| Germany | 43 | 0.4% |
| Guyana | 8 | 0.1% |
| Hong Kong | 29 | 0.3% |
| Hungary | 58 | 0.5% |
| India | 16 | 0.1% |
| Iran | 26 | 0.2% |
| Ireland | 32 | 0.3% |
| Israel | 6 | 0.1% |
| Jamaica | 81 | 0.7% |
| Japan | 10 | 0.1% |
| Latin America | 287 | 2.4% |
| Lithuania | 12 | 0.1% |
| Mexico | 23 | 0.2% |
| Northern Europe | 120 | 1.0% |
| Oceania | 33 | 0.3% |
| Poland | 11 | 0.1% |
| Portugal | 9 | 0.1% |
| Russia | 33 | 0.3% |
| South Africa | 25 | 0.2% |
| South America | 72 | 0.6% |
| South Central Asia | 42 | 0.4% |
| South Eastern Asia | 27 | 0.2% |
| Southern Europe | 9 | 0.1% |
| Sweden | 6 | 0.1% |
| Switzerland | 8 | 0.1% |
| Thailand | 6 | 0.1% |
| Ukraine | 28 | 0.2% |
| Venezuela | 8 | 0.1% |
| Vietnam | 21 | 0.2% |
| Western Asia | 6 | 0.1% |
| Western Europe | 51 | 0.4% | View All 51 Rows |
Sex and Age in Gulfport
Sex and Age in Gulfport
The most populous age groups in Gulfport are 60 to 64 Years (647 | 11.9%) for men and 65 to 69 Years (787 | 12.4%) for women.
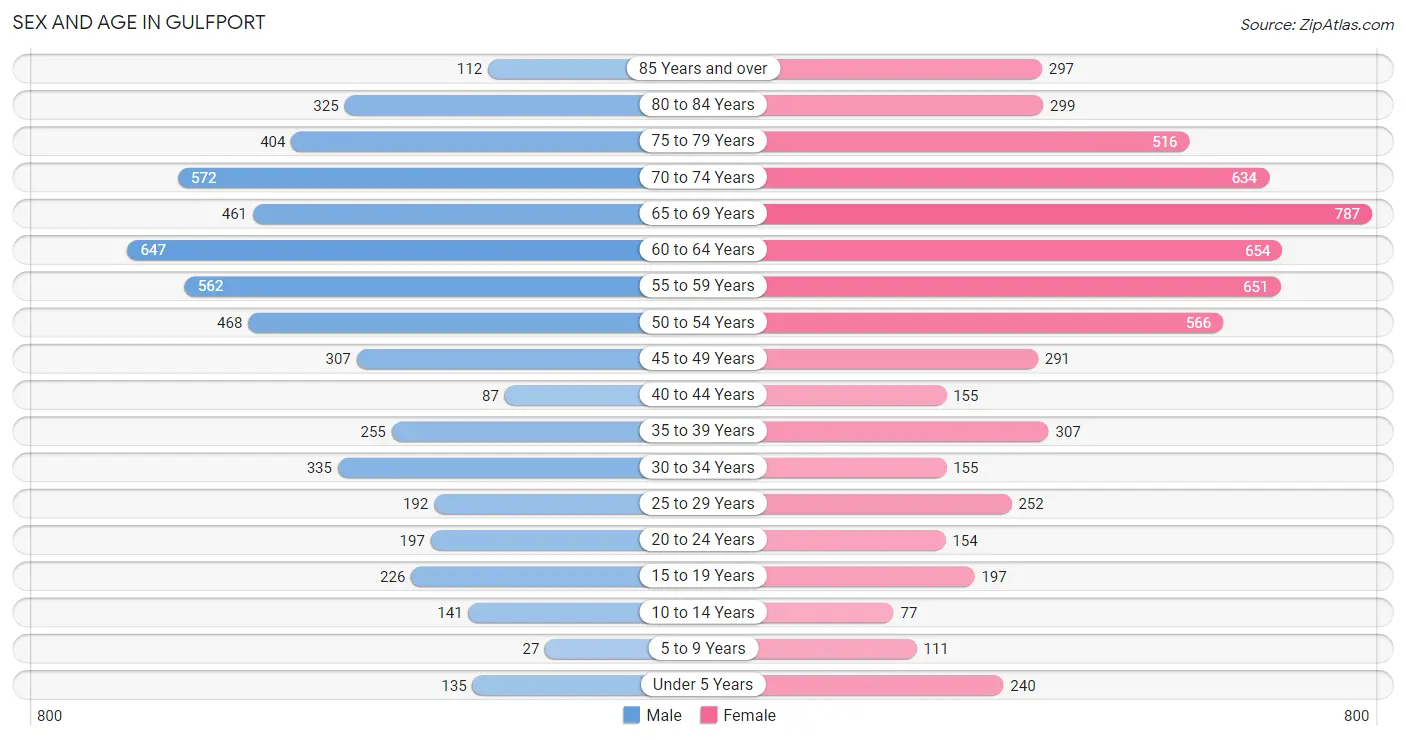
| Age Bracket | Male | Female |
| Under 5 Years | 135 (2.5%) | 240 (3.8%) |
| 5 to 9 Years | 27 (0.5%) | 111 (1.8%) |
| 10 to 14 Years | 141 (2.6%) | 77 (1.2%) |
| 15 to 19 Years | 226 (4.1%) | 197 (3.1%) |
| 20 to 24 Years | 197 (3.6%) | 154 (2.4%) |
| 25 to 29 Years | 192 (3.5%) | 252 (4.0%) |
| 30 to 34 Years | 335 (6.1%) | 155 (2.4%) |
| 35 to 39 Years | 255 (4.7%) | 307 (4.8%) |
| 40 to 44 Years | 87 (1.6%) | 155 (2.4%) |
| 45 to 49 Years | 307 (5.6%) | 291 (4.6%) |
| 50 to 54 Years | 468 (8.6%) | 566 (8.9%) |
| 55 to 59 Years | 562 (10.3%) | 651 (10.3%) |
| 60 to 64 Years | 647 (11.9%) | 654 (10.3%) |
| 65 to 69 Years | 461 (8.5%) | 787 (12.4%) |
| 70 to 74 Years | 572 (10.5%) | 634 (10.0%) |
| 75 to 79 Years | 404 (7.4%) | 516 (8.1%) |
| 80 to 84 Years | 325 (6.0%) | 299 (4.7%) |
| 85 Years and over | 112 (2.1%) | 297 (4.7%) |
| Total | 5,453 (100.0%) | 6,343 (100.0%) |
Families and Households in Gulfport
Median Family Size in Gulfport
The median family size in Gulfport is 2.47 persons per family, with single female/mother families (525 | 17.6%) accounting for the largest median family size of 2.8 persons per family. On the other hand, married-couple families (2,270 | 75.9%) represent the smallest median family size with 2.37 persons per family.
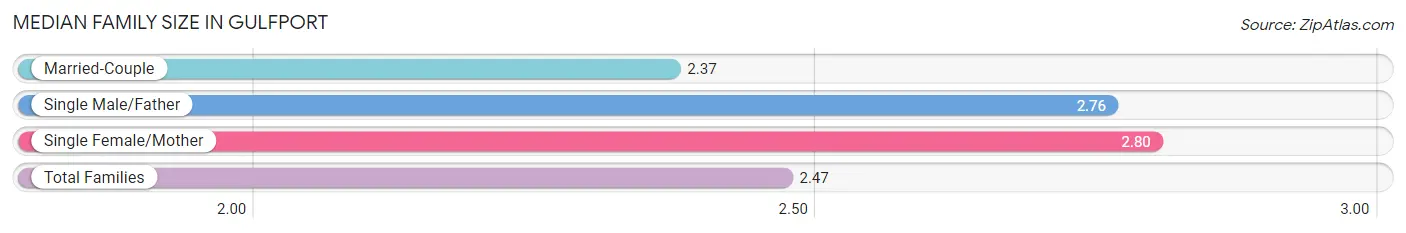
| Family Type | # Families | Family Size |
| Married-Couple | 2,270 (75.9%) | 2.37 |
| Single Male/Father | 195 (6.5%) | 2.76 |
| Single Female/Mother | 525 (17.6%) | 2.80 |
| Total Families | 2,990 (100.0%) | 2.47 |
Median Household Size in Gulfport
The median household size in Gulfport is 1.87 persons per household, with single female/mother households (525 | 8.5%) accounting for the largest median household size of 3.02 persons per household. non-family households (3,217 | 51.8%) represent the smallest median household size with 1.25 persons per household.
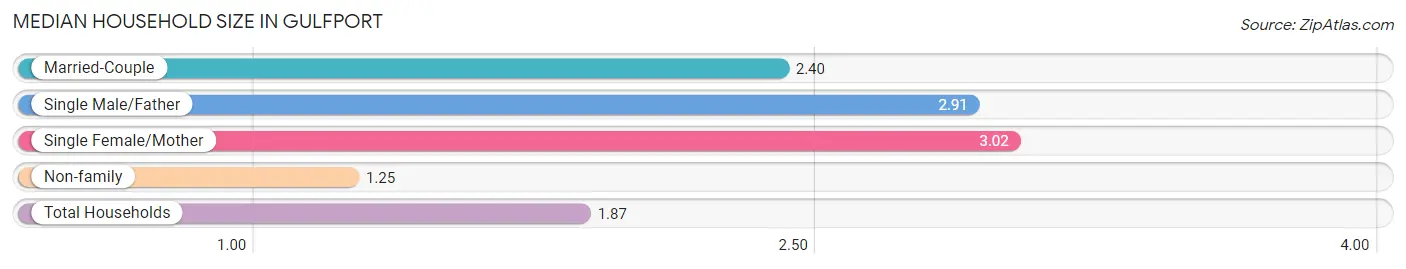
| Household Type | # Households | Household Size |
| Married-Couple | 2,270 (36.6%) | 2.40 |
| Single Male/Father | 195 (3.1%) | 2.91 |
| Single Female/Mother | 525 (8.5%) | 3.02 |
| Non-family | 3,217 (51.8%) | 1.25 |
| Total Households | 6,207 (100.0%) | 1.87 |
Household Size by Marriage Status in Gulfport
Out of a total of 6,207 households in Gulfport, 2,990 (48.2%) are family households, while 3,217 (51.8%) are nonfamily households. The most numerous type of family households are 2-person households, comprising 2,187, and the most common type of nonfamily households are 1-person households, comprising 2,587.
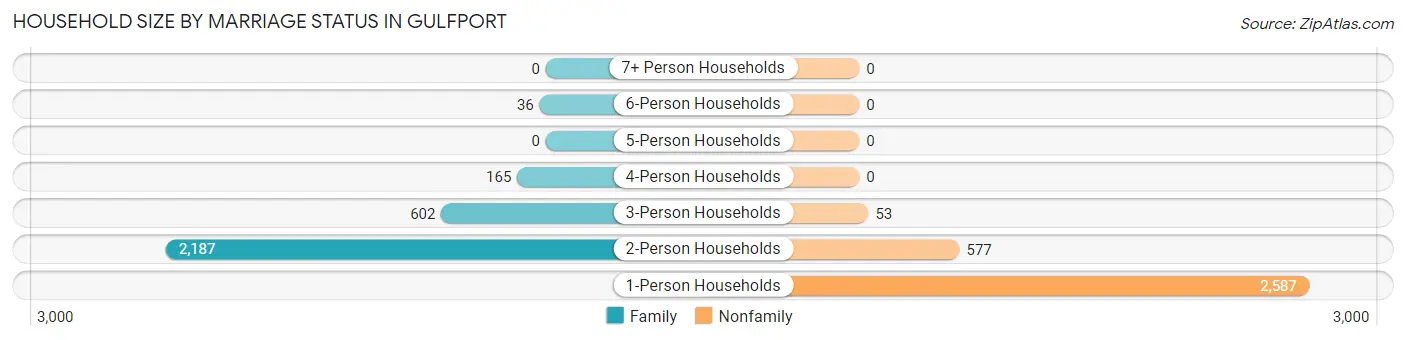
| Household Size | Family Households | Nonfamily Households |
| 1-Person Households | - | 2,587 (41.7%) |
| 2-Person Households | 2,187 (35.2%) | 577 (9.3%) |
| 3-Person Households | 602 (9.7%) | 53 (0.9%) |
| 4-Person Households | 165 (2.7%) | 0 (0.0%) |
| 5-Person Households | 0 (0.0%) | 0 (0.0%) |
| 6-Person Households | 36 (0.6%) | 0 (0.0%) |
| 7+ Person Households | 0 (0.0%) | 0 (0.0%) |
| Total | 2,990 (48.2%) | 3,217 (51.8%) |
Female Fertility in Gulfport
Fertility by Age in Gulfport
Average fertility rate in Gulfport is 33.0 births per 1,000 women. Women in the age bracket of 35 to 50 years have the highest fertility rate with 52.0 births per 1,000 women. Women in the age bracket of 35 to 50 years acount for 82.7% of all women with births.
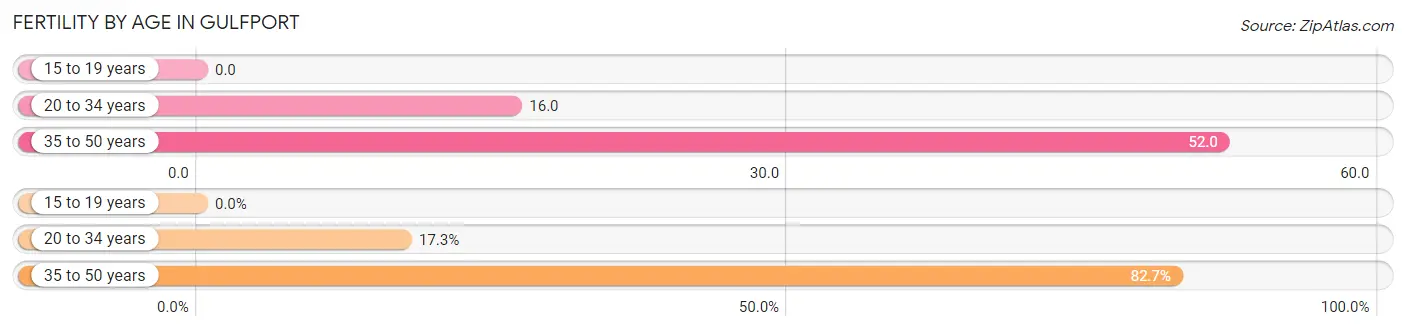
| Age Bracket | Women with Births | Births / 1,000 Women |
| 15 to 19 years | 0 (0.0%) | 0.0 |
| 20 to 34 years | 9 (17.3%) | 16.0 |
| 35 to 50 years | 43 (82.7%) | 52.0 |
| Total | 52 (100.0%) | 33.0 |
Fertility by Age by Marriage Status in Gulfport
82.7% of women with births (52) in Gulfport are married. The highest percentage of unmarried women with births falls into 20 to 34 years age bracket with 100.0% of them unmarried at the time of birth, while the lowest percentage of unmarried women with births belong to 35 to 50 years age bracket with 0.0% of them unmarried.
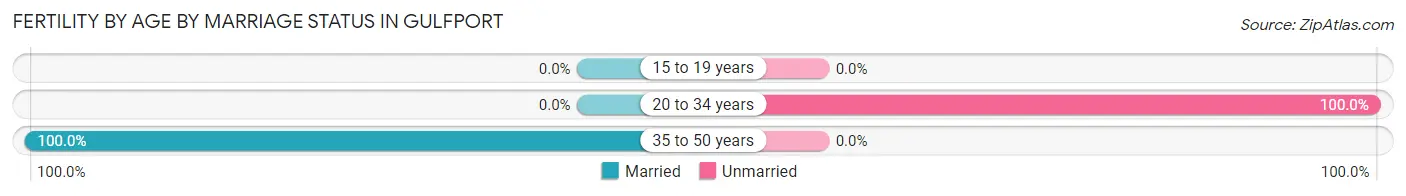
| Age Bracket | Married | Unmarried |
| 15 to 19 years | 0 (0.0%) | 0 (0.0%) |
| 20 to 34 years | 0 (0.0%) | 9 (100.0%) |
| 35 to 50 years | 43 (100.0%) | 0 (0.0%) |
| Total | 43 (82.7%) | 9 (17.3%) |
Fertility by Education in Gulfport
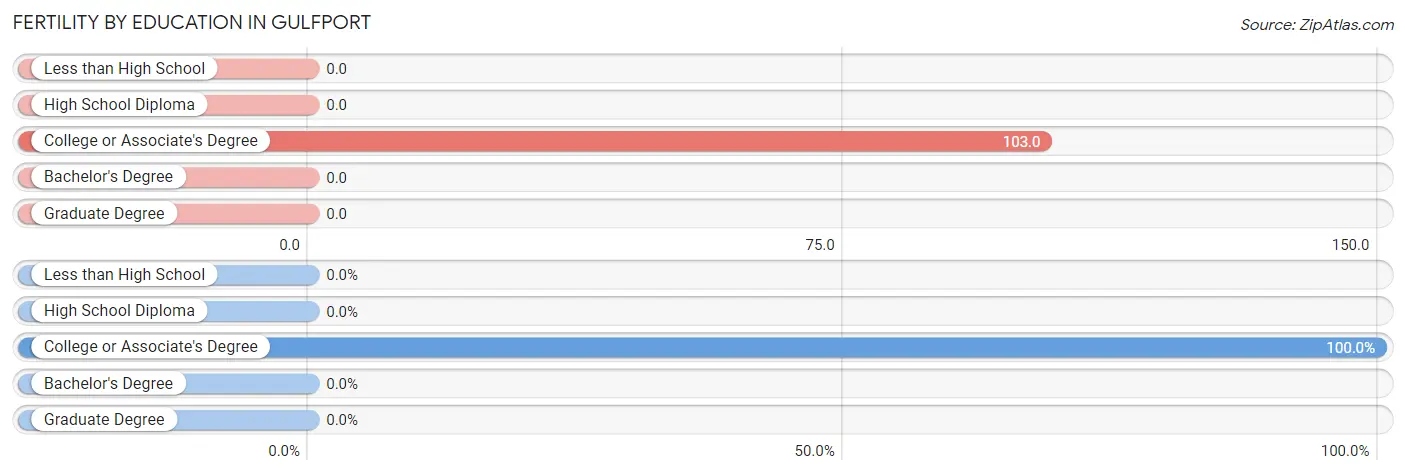
| Educational Attainment | Women with Births | Births / 1,000 Women |
| Less than High School | 0 (0.0%) | 0.0 |
| High School Diploma | 0 (0.0%) | 0.0 |
| College or Associate's Degree | 52 (100.0%) | 103.0 |
| Bachelor's Degree | 0 (0.0%) | 0.0 |
| Graduate Degree | 0 (0.0%) | 0.0 |
| Total | 52 (100.0%) | 33.0 |
Fertility by Education by Marriage Status in Gulfport
17.3% of women with births in Gulfport are unmarried. Women with the educational attainment of college or associate's degree are most likely to be married with 82.7% of them married at childbirth, while women with the educational attainment of college or associate's degree are least likely to be married with 17.3% of them unmarried at childbirth.
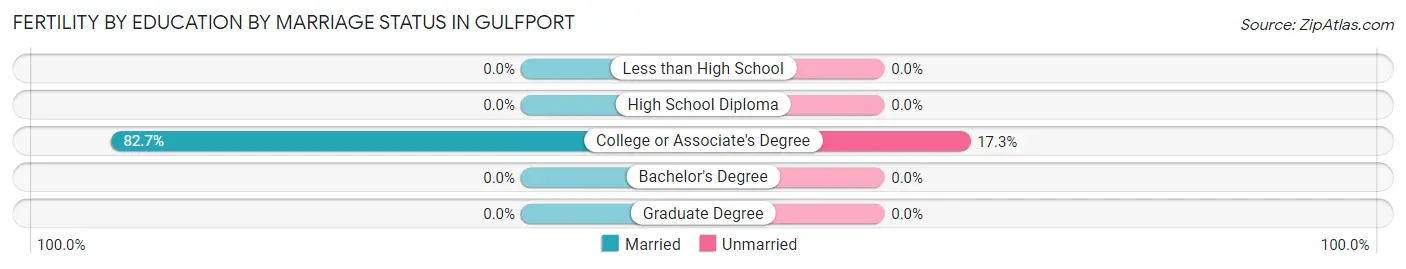
| Educational Attainment | Married | Unmarried |
| Less than High School | 0 (0.0%) | 0 (0.0%) |
| High School Diploma | 0 (0.0%) | 0 (0.0%) |
| College or Associate's Degree | 43 (82.7%) | 9 (17.3%) |
| Bachelor's Degree | 0 (0.0%) | 0 (0.0%) |
| Graduate Degree | 0 (0.0%) | 0 (0.0%) |
| Total | 43 (82.7%) | 9 (17.3%) |
Employment Characteristics in Gulfport
Employment by Class of Employer in Gulfport
Among the 4,631 employed individuals in Gulfport, private company employees (2,729 | 58.9%), not-for-profit organizations (506 | 10.9%), and self-employed (not incorporated) (486 | 10.5%) make up the most common classes of employment.
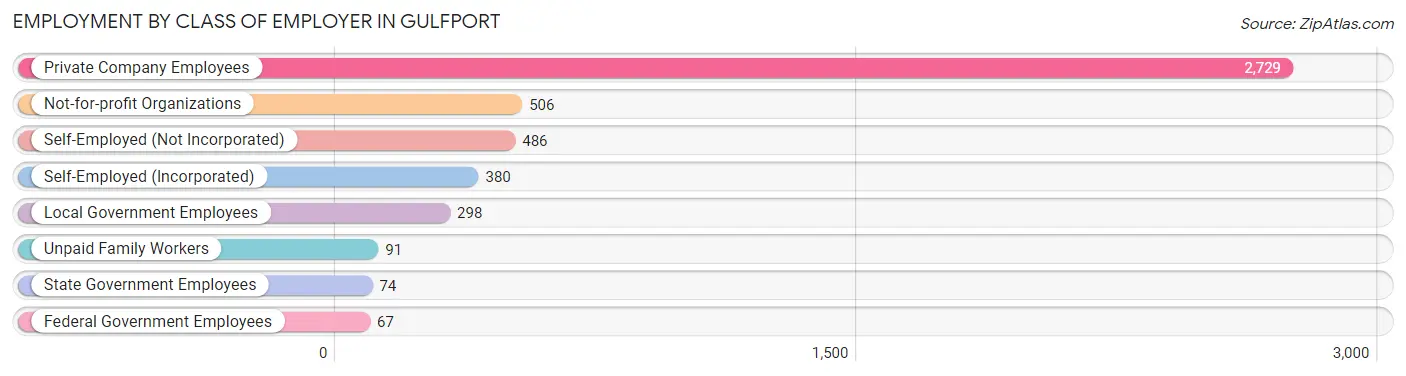
| Employer Class | # Employees | % Employees |
| Private Company Employees | 2,729 | 58.9% |
| Self-Employed (Incorporated) | 380 | 8.2% |
| Self-Employed (Not Incorporated) | 486 | 10.5% |
| Not-for-profit Organizations | 506 | 10.9% |
| Local Government Employees | 298 | 6.4% |
| State Government Employees | 74 | 1.6% |
| Federal Government Employees | 67 | 1.5% |
| Unpaid Family Workers | 91 | 2.0% |
| Total | 4,631 | 100.0% |
Employment Status by Age in Gulfport
According to the labor force statistics for Gulfport, out of the total population over 16 years of age (11,035), 46.6% or 5,142 individuals are in the labor force, with 5.9% or 303 of them unemployed. The age group with the highest labor force participation rate is 30 to 34 years, with 94.7% or 464 individuals in the labor force. Within the labor force, the 20 to 24 years age range has the highest percentage of unemployed individuals, with 16.7% or 45 of them being unemployed.
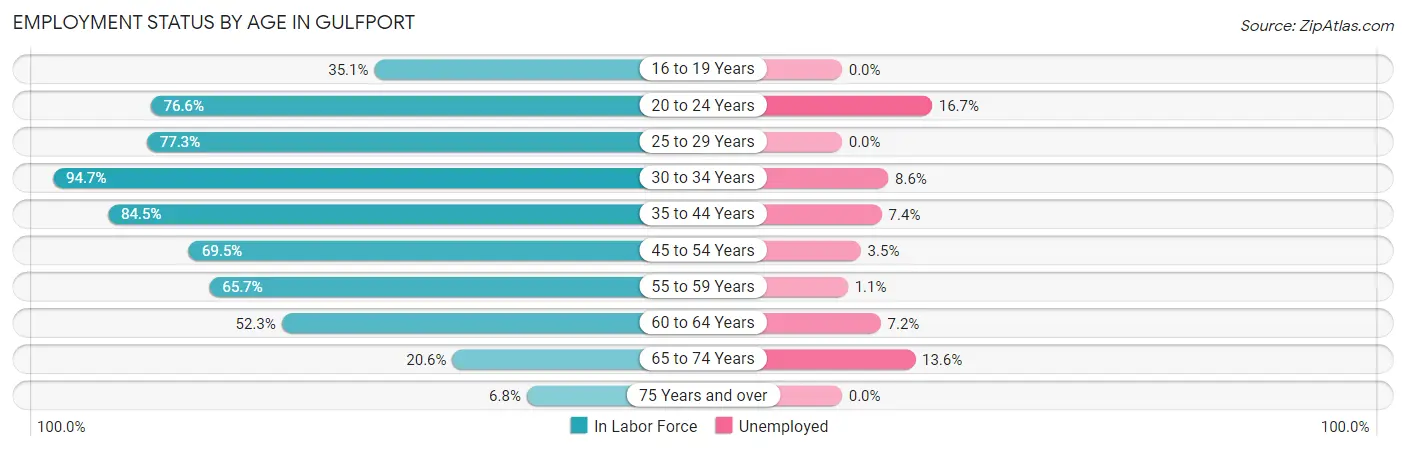
| Age Bracket | In Labor Force | Unemployed |
| 16 to 19 Years | 138 (35.1%) | 0 (0.0%) |
| 20 to 24 Years | 269 (76.6%) | 45 (16.7%) |
| 25 to 29 Years | 343 (77.3%) | 0 (0.0%) |
| 30 to 34 Years | 464 (94.7%) | 40 (8.6%) |
| 35 to 44 Years | 679 (84.5%) | 50 (7.4%) |
| 45 to 54 Years | 1,134 (69.5%) | 40 (3.5%) |
| 55 to 59 Years | 797 (65.7%) | 9 (1.1%) |
| 60 to 64 Years | 680 (52.3%) | 49 (7.2%) |
| 65 to 74 Years | 506 (20.6%) | 69 (13.6%) |
| 75 Years and over | 133 (6.8%) | 0 (0.0%) |
| Total | 5,142 (46.6%) | 303 (5.9%) |
Employment Status by Educational Attainment in Gulfport
According to labor force statistics for Gulfport, 69.6% of individuals (4,095) out of the total population between 25 and 64 years of age (5,884) are in the labor force, with 4.6% or 188 of them being unemployed. The group with the highest labor force participation rate are those with the educational attainment of bachelor's degree or higher, with 79.2% or 1,905 individuals in the labor force. Within the labor force, individuals with less than high school education have the highest percentage of unemployment, with 22.3% or 21 of them being unemployed.
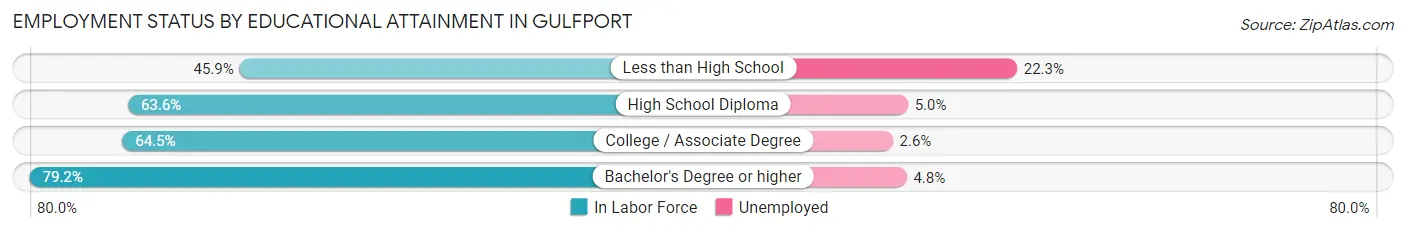
| Educational Attainment | In Labor Force | Unemployed |
| Less than High School | 94 (45.9%) | 46 (22.3%) |
| High School Diploma | 897 (63.6%) | 71 (5.0%) |
| College / Associate Degree | 1,202 (64.5%) | 48 (2.6%) |
| Bachelor's Degree or higher | 1,905 (79.2%) | 115 (4.8%) |
| Total | 4,095 (69.6%) | 271 (4.6%) |
Employment Occupations by Sex in Gulfport
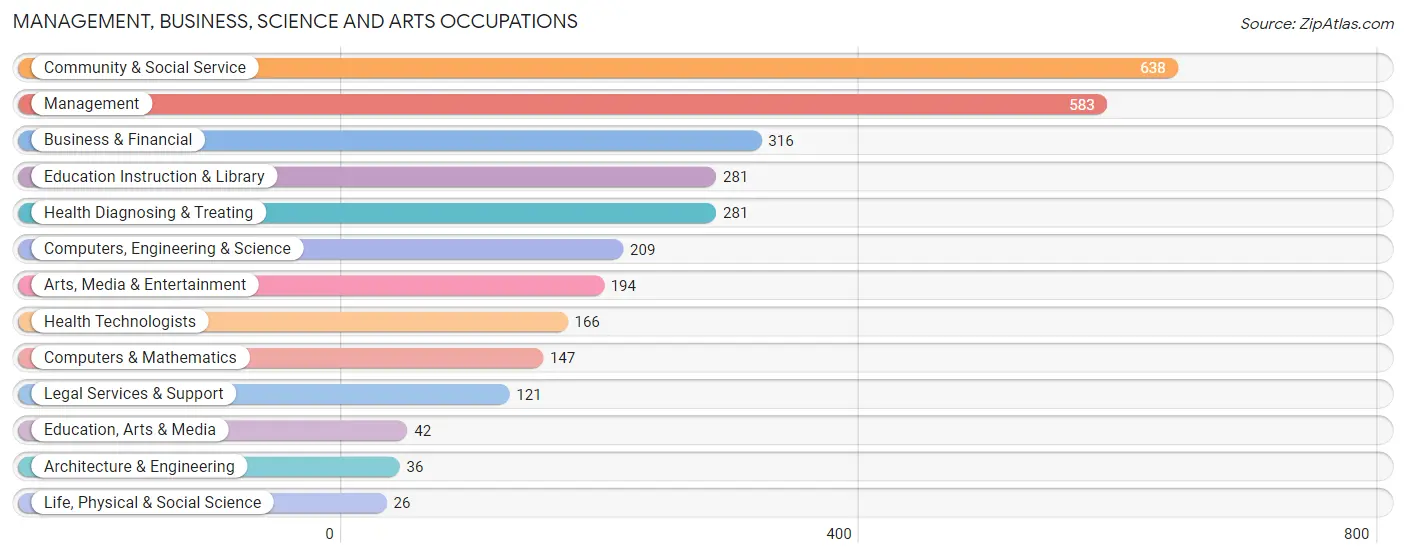
Management, Business, Science and Arts Occupations
The most common Management, Business, Science and Arts occupations in Gulfport are Community & Social Service (638 | 13.2%), Management (583 | 12.0%), Business & Financial (316 | 6.5%), Education Instruction & Library (281 | 5.8%), and Health Diagnosing & Treating (281 | 5.8%).
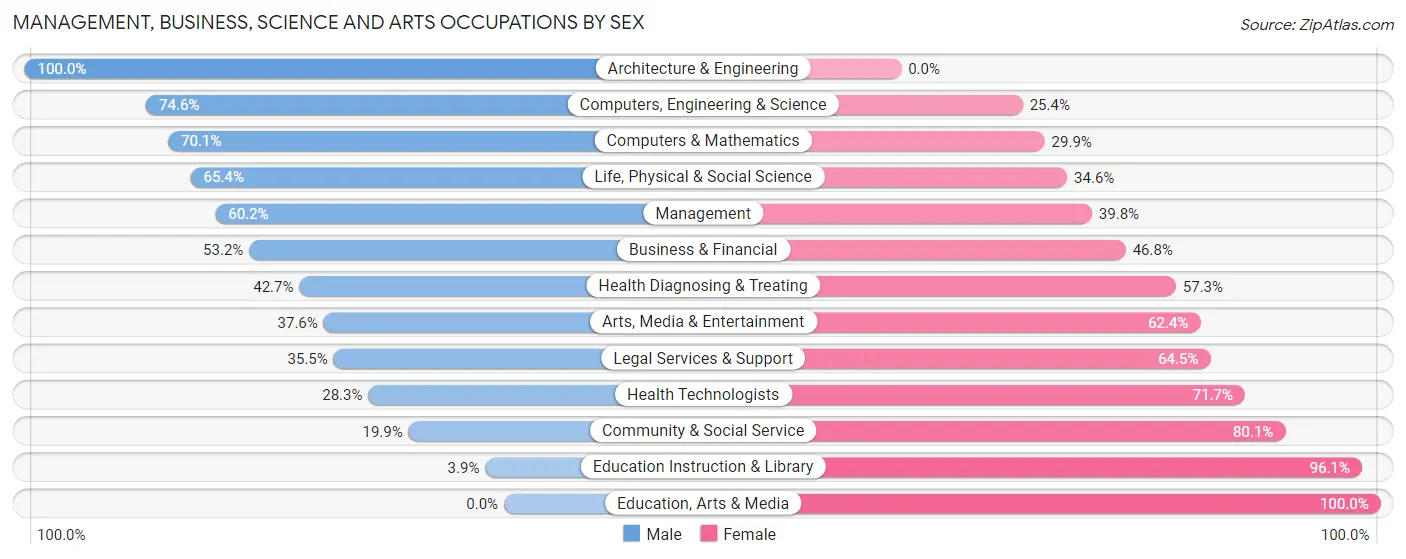
Management, Business, Science and Arts Occupations by Sex
Within the Management, Business, Science and Arts occupations in Gulfport, the most male-oriented occupations are Architecture & Engineering (100.0%), Computers, Engineering & Science (74.6%), and Computers & Mathematics (70.1%), while the most female-oriented occupations are Education, Arts & Media (100.0%), Education Instruction & Library (96.1%), and Community & Social Service (80.1%).
| Occupation | Male | Female |
| Management | 351 (60.2%) | 232 (39.8%) |
| Business & Financial | 168 (53.2%) | 148 (46.8%) |
| Computers, Engineering & Science | 156 (74.6%) | 53 (25.4%) |
| Computers & Mathematics | 103 (70.1%) | 44 (29.9%) |
| Architecture & Engineering | 36 (100.0%) | 0 (0.0%) |
| Life, Physical & Social Science | 17 (65.4%) | 9 (34.6%) |
| Community & Social Service | 127 (19.9%) | 511 (80.1%) |
| Education, Arts & Media | 0 (0.0%) | 42 (100.0%) |
| Legal Services & Support | 43 (35.5%) | 78 (64.5%) |
| Education Instruction & Library | 11 (3.9%) | 270 (96.1%) |
| Arts, Media & Entertainment | 73 (37.6%) | 121 (62.4%) |
| Health Diagnosing & Treating | 120 (42.7%) | 161 (57.3%) |
| Health Technologists | 47 (28.3%) | 119 (71.7%) |
| Total (Category) | 922 (45.5%) | 1,105 (54.5%) |
| Total (Overall) | 2,445 (50.5%) | 2,397 (49.5%) |
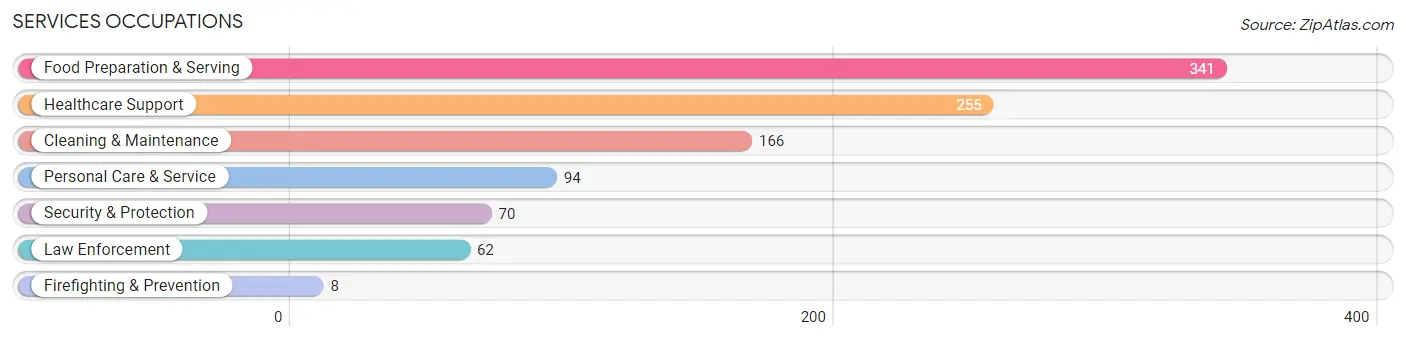
Services Occupations
The most common Services occupations in Gulfport are Food Preparation & Serving (341 | 7.0%), Healthcare Support (255 | 5.3%), Cleaning & Maintenance (166 | 3.4%), Personal Care & Service (94 | 1.9%), and Security & Protection (70 | 1.5%).
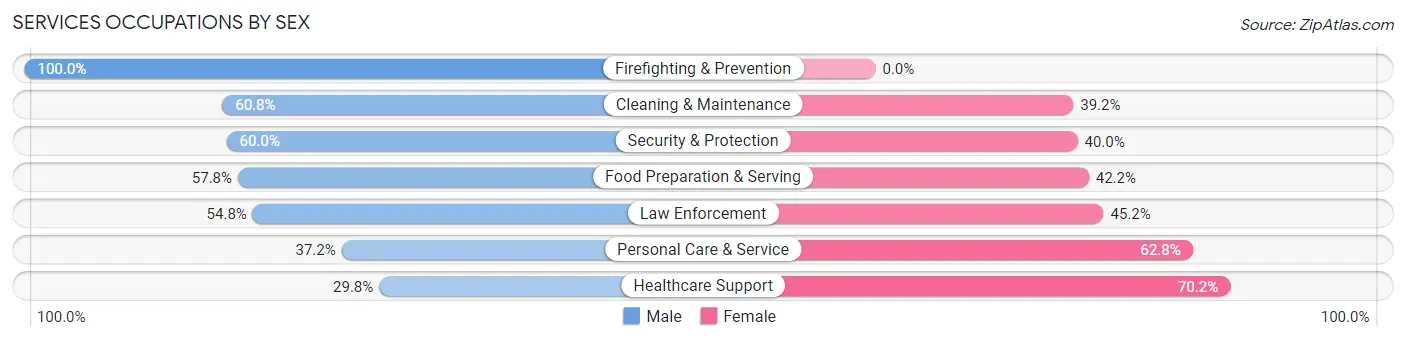
Services Occupations by Sex
Within the Services occupations in Gulfport, the most male-oriented occupations are Firefighting & Prevention (100.0%), Cleaning & Maintenance (60.8%), and Security & Protection (60.0%), while the most female-oriented occupations are Healthcare Support (70.2%), Personal Care & Service (62.8%), and Law Enforcement (45.2%).
| Occupation | Male | Female |
| Healthcare Support | 76 (29.8%) | 179 (70.2%) |
| Security & Protection | 42 (60.0%) | 28 (40.0%) |
| Firefighting & Prevention | 8 (100.0%) | 0 (0.0%) |
| Law Enforcement | 34 (54.8%) | 28 (45.2%) |
| Food Preparation & Serving | 197 (57.8%) | 144 (42.2%) |
| Cleaning & Maintenance | 101 (60.8%) | 65 (39.2%) |
| Personal Care & Service | 35 (37.2%) | 59 (62.8%) |
| Total (Category) | 451 (48.7%) | 475 (51.3%) |
| Total (Overall) | 2,445 (50.5%) | 2,397 (49.5%) |
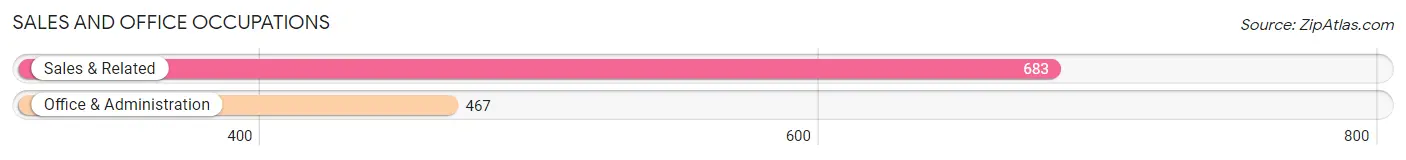
Sales and Office Occupations
The most common Sales and Office occupations in Gulfport are Sales & Related (683 | 14.1%), and Office & Administration (467 | 9.6%).
Sales and Office Occupations by Sex
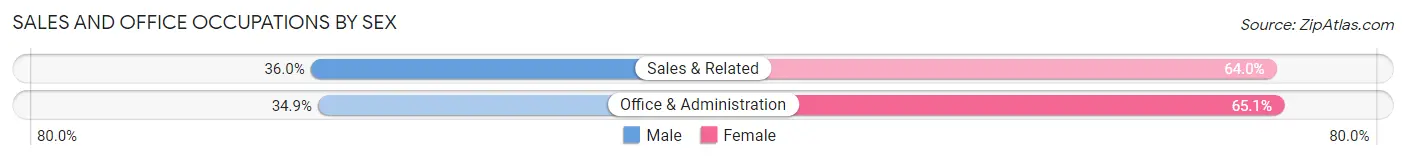
| Occupation | Male | Female |
| Sales & Related | 246 (36.0%) | 437 (64.0%) |
| Office & Administration | 163 (34.9%) | 304 (65.1%) |
| Total (Category) | 409 (35.6%) | 741 (64.4%) |
| Total (Overall) | 2,445 (50.5%) | 2,397 (49.5%) |
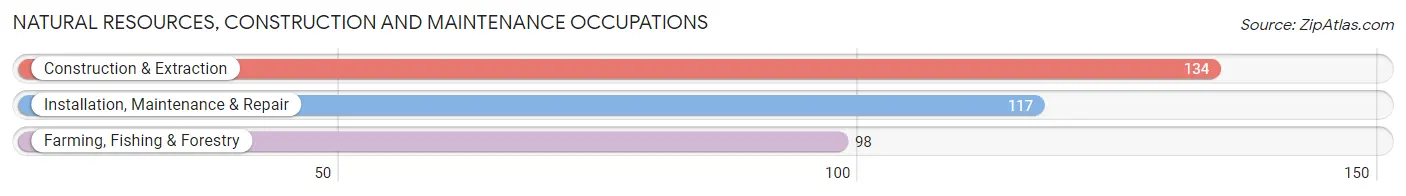
Natural Resources, Construction and Maintenance Occupations
The most common Natural Resources, Construction and Maintenance occupations in Gulfport are Construction & Extraction (134 | 2.8%), Installation, Maintenance & Repair (117 | 2.4%), and Farming, Fishing & Forestry (98 | 2.0%).
Natural Resources, Construction and Maintenance Occupations by Sex
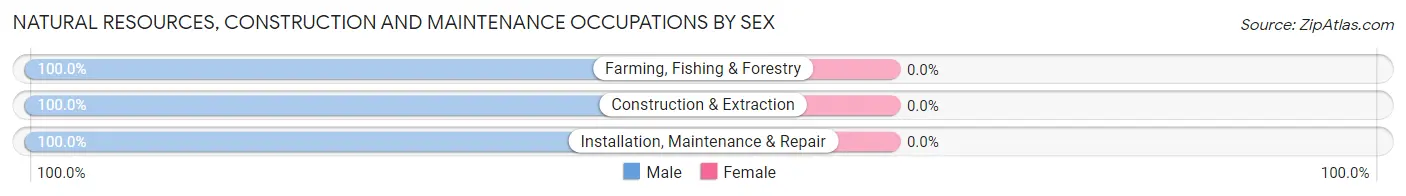
| Occupation | Male | Female |
| Farming, Fishing & Forestry | 98 (100.0%) | 0 (0.0%) |
| Construction & Extraction | 134 (100.0%) | 0 (0.0%) |
| Installation, Maintenance & Repair | 117 (100.0%) | 0 (0.0%) |
| Total (Category) | 349 (100.0%) | 0 (0.0%) |
| Total (Overall) | 2,445 (50.5%) | 2,397 (49.5%) |
Production, Transportation and Moving Occupations
The most common Production, Transportation and Moving occupations in Gulfport are Production (200 | 4.1%), Transportation (142 | 2.9%), and Material Moving (48 | 1.0%).
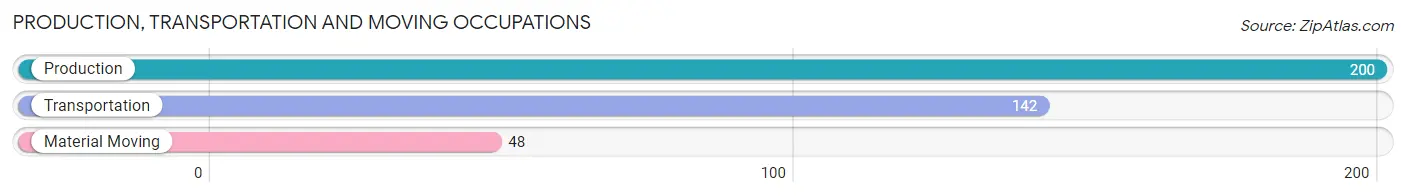
Production, Transportation and Moving Occupations by Sex
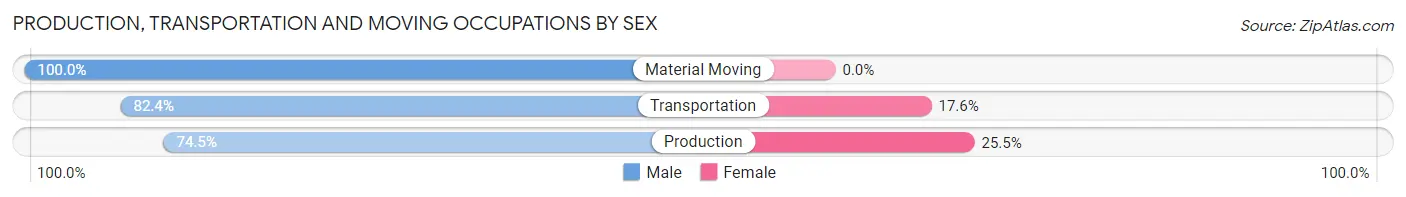
| Occupation | Male | Female |
| Production | 149 (74.5%) | 51 (25.5%) |
| Transportation | 117 (82.4%) | 25 (17.6%) |
| Material Moving | 48 (100.0%) | 0 (0.0%) |
| Total (Category) | 314 (80.5%) | 76 (19.5%) |
| Total (Overall) | 2,445 (50.5%) | 2,397 (49.5%) |
Employment Industries by Sex in Gulfport
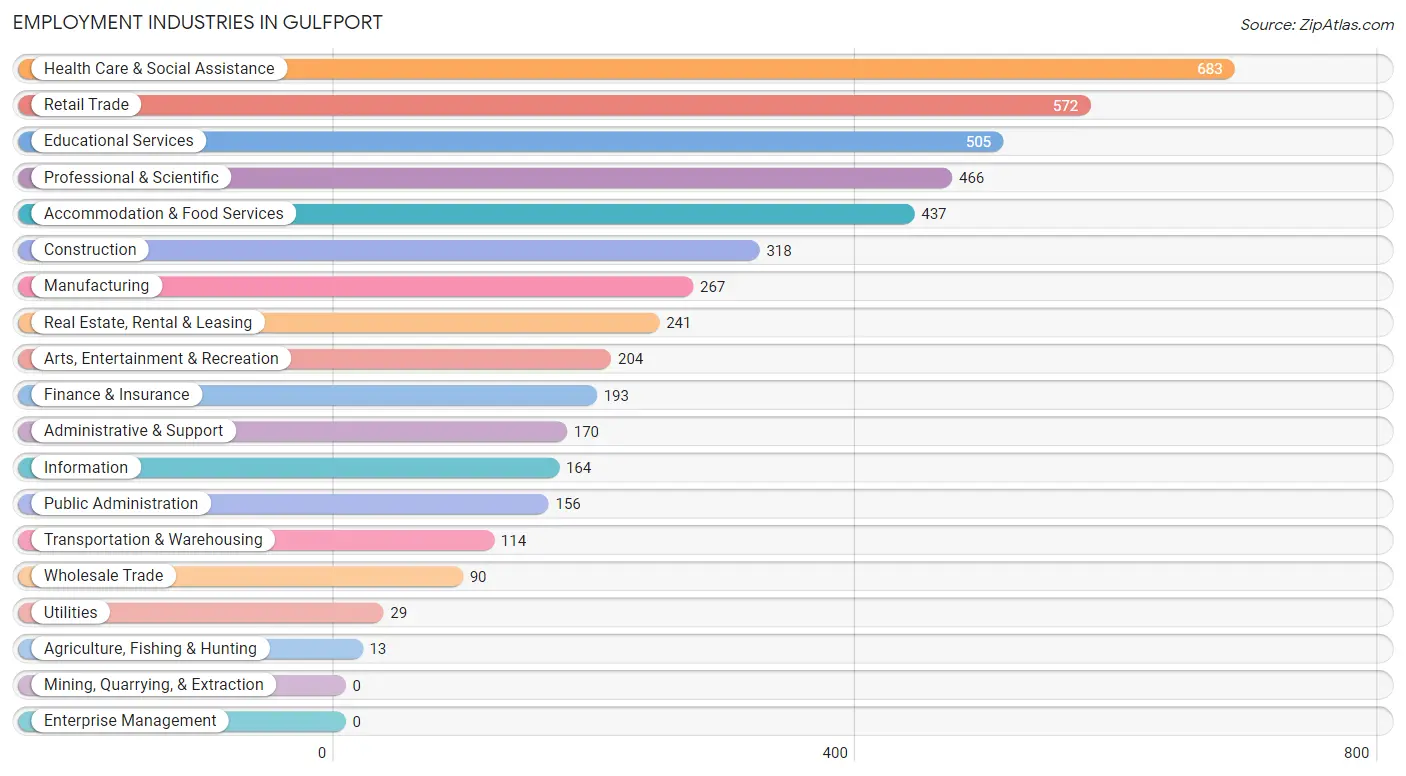
Employment Industries in Gulfport
The major employment industries in Gulfport include Health Care & Social Assistance (683 | 14.1%), Retail Trade (572 | 11.8%), Educational Services (505 | 10.4%), Professional & Scientific (466 | 9.6%), and Accommodation & Food Services (437 | 9.0%).
Employment Industries by Sex in Gulfport
The Gulfport industries that see more men than women are Utilities (100.0%), Construction (90.2%), and Transportation & Warehousing (81.6%), whereas the industries that tend to have a higher number of women are Agriculture, Fishing & Hunting (100.0%), Real Estate, Rental & Leasing (80.1%), and Health Care & Social Assistance (71.5%).
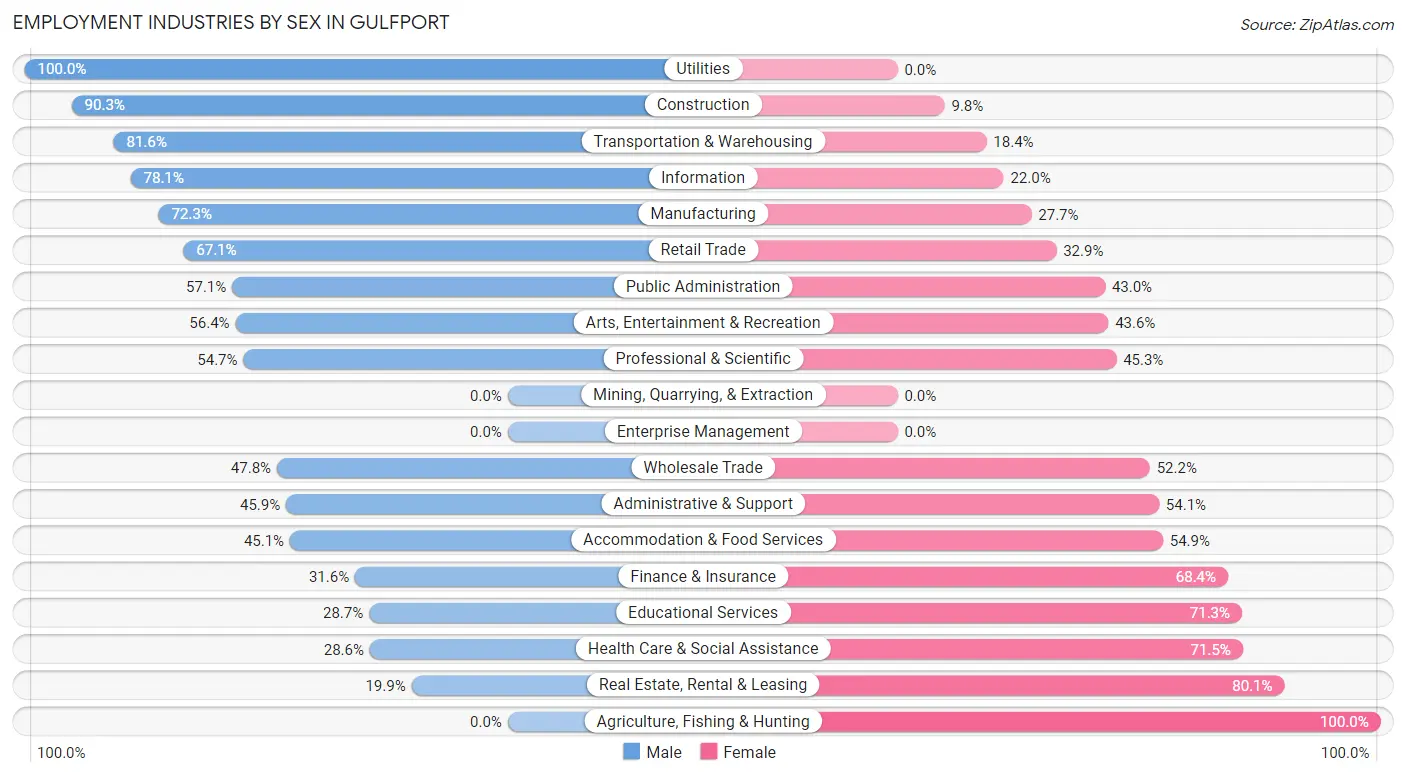
| Industry | Male | Female |
| Agriculture, Fishing & Hunting | 0 (0.0%) | 13 (100.0%) |
| Mining, Quarrying, & Extraction | 0 (0.0%) | 0 (0.0%) |
| Construction | 287 (90.2%) | 31 (9.8%) |
| Manufacturing | 193 (72.3%) | 74 (27.7%) |
| Wholesale Trade | 43 (47.8%) | 47 (52.2%) |
| Retail Trade | 384 (67.1%) | 188 (32.9%) |
| Transportation & Warehousing | 93 (81.6%) | 21 (18.4%) |
| Utilities | 29 (100.0%) | 0 (0.0%) |
| Information | 128 (78.0%) | 36 (22.0%) |
| Finance & Insurance | 61 (31.6%) | 132 (68.4%) |
| Real Estate, Rental & Leasing | 48 (19.9%) | 193 (80.1%) |
| Professional & Scientific | 255 (54.7%) | 211 (45.3%) |
| Enterprise Management | 0 (0.0%) | 0 (0.0%) |
| Administrative & Support | 78 (45.9%) | 92 (54.1%) |
| Educational Services | 145 (28.7%) | 360 (71.3%) |
| Health Care & Social Assistance | 195 (28.5%) | 488 (71.5%) |
| Arts, Entertainment & Recreation | 115 (56.4%) | 89 (43.6%) |
| Accommodation & Food Services | 197 (45.1%) | 240 (54.9%) |
| Public Administration | 89 (57.1%) | 67 (42.9%) |
| Total | 2,445 (50.5%) | 2,397 (49.5%) |
Education in Gulfport
School Enrollment in Gulfport
The most common levels of schooling among the 1,223 students in Gulfport are high school (434 | 35.5%), college / undergraduate (243 | 19.9%), and nursery / preschool (157 | 12.8%).
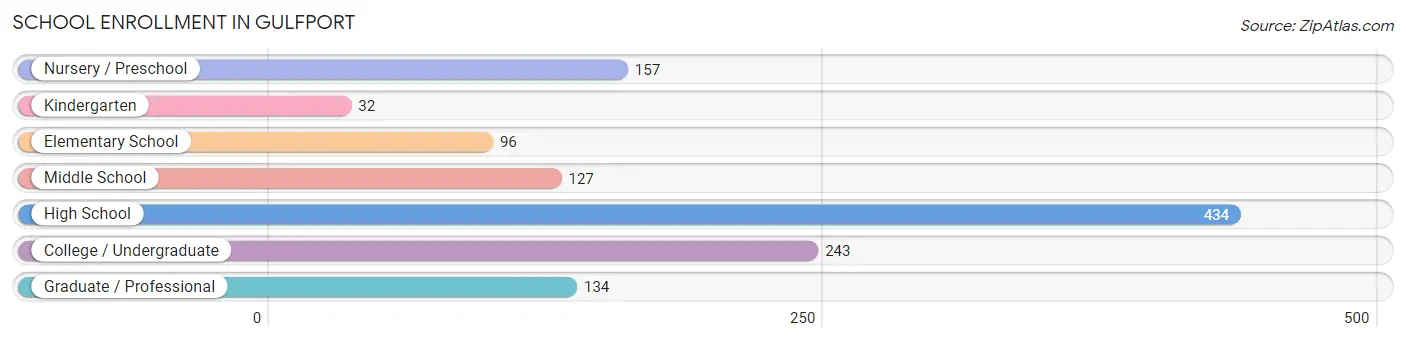
| School Level | # Students | % Students |
| Nursery / Preschool | 157 | 12.8% |
| Kindergarten | 32 | 2.6% |
| Elementary School | 96 | 7.9% |
| Middle School | 127 | 10.4% |
| High School | 434 | 35.5% |
| College / Undergraduate | 243 | 19.9% |
| Graduate / Professional | 134 | 11.0% |
| Total | 1,223 | 100.0% |
School Enrollment by Age by Funding Source in Gulfport
Out of a total of 1,223 students who are enrolled in schools in Gulfport, 280 (22.9%) attend a private institution, while the remaining 943 (77.1%) are enrolled in public schools. The age group of 3 to 4 year olds has the highest likelihood of being enrolled in private schools, with 87 (55.4% in the age bracket) enrolled. Conversely, the age group of 15 to 17 year olds has the lowest likelihood of being enrolled in a private school, with 298 (100.0% in the age bracket) attending a public institution.
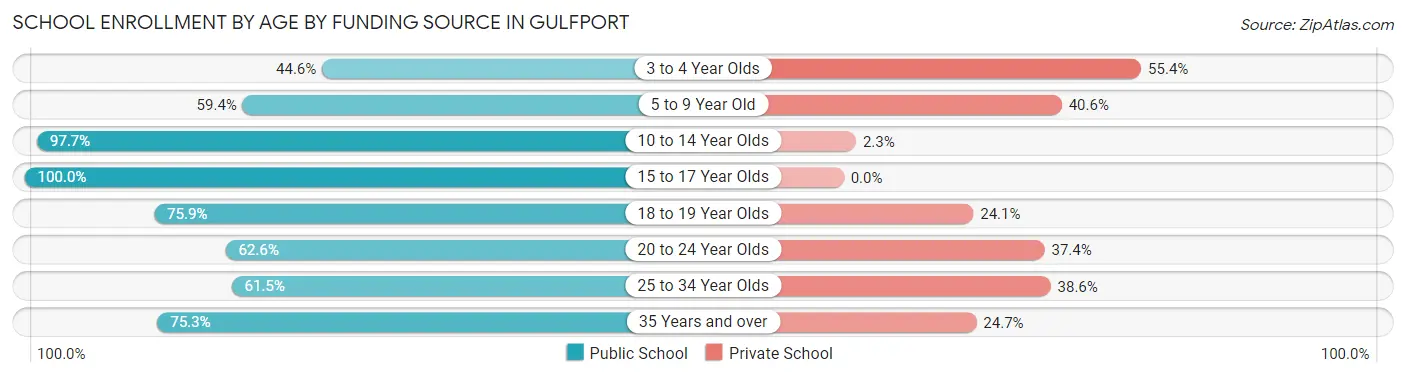
| Age Bracket | Public School | Private School |
| 3 to 4 Year Olds | 70 (44.6%) | 87 (55.4%) |
| 5 to 9 Year Old | 76 (59.4%) | 52 (40.6%) |
| 10 to 14 Year Olds | 213 (97.7%) | 5 (2.3%) |
| 15 to 17 Year Olds | 298 (100.0%) | 0 (0.0%) |
| 18 to 19 Year Olds | 66 (75.9%) | 21 (24.1%) |
| 20 to 24 Year Olds | 102 (62.6%) | 61 (37.4%) |
| 25 to 34 Year Olds | 51 (61.5%) | 32 (38.6%) |
| 35 Years and over | 67 (75.3%) | 22 (24.7%) |
| Total | 943 (77.1%) | 280 (22.9%) |
Educational Attainment by Field of Study in Gulfport
Education (874 | 19.6%), business (668 | 15.0%), social sciences (433 | 9.7%), science & technology (312 | 7.0%), and psychology (306 | 6.9%) are the most common fields of study among 4,466 individuals in Gulfport who have obtained a bachelor's degree or higher.
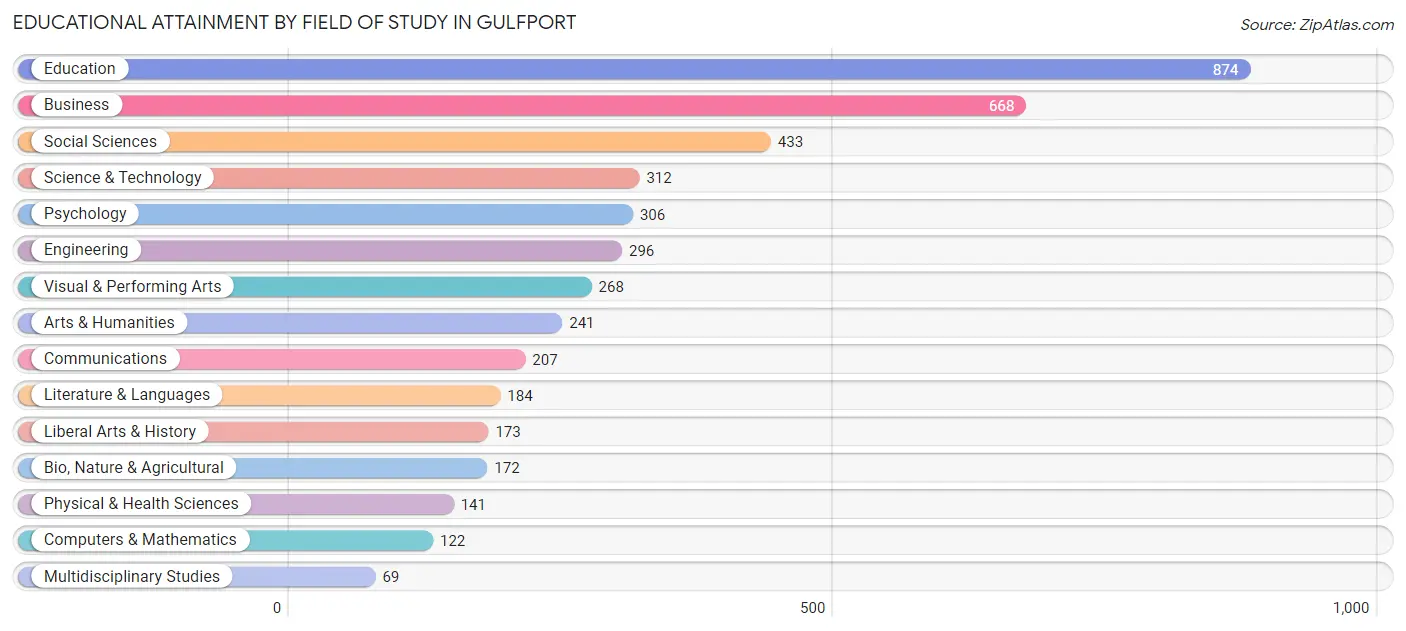
| Field of Study | # Graduates | % Graduates |
| Computers & Mathematics | 122 | 2.7% |
| Bio, Nature & Agricultural | 172 | 3.8% |
| Physical & Health Sciences | 141 | 3.2% |
| Psychology | 306 | 6.9% |
| Social Sciences | 433 | 9.7% |
| Engineering | 296 | 6.6% |
| Multidisciplinary Studies | 69 | 1.5% |
| Science & Technology | 312 | 7.0% |
| Business | 668 | 15.0% |
| Education | 874 | 19.6% |
| Literature & Languages | 184 | 4.1% |
| Liberal Arts & History | 173 | 3.9% |
| Visual & Performing Arts | 268 | 6.0% |
| Communications | 207 | 4.6% |
| Arts & Humanities | 241 | 5.4% |
| Total | 4,466 | 100.0% |
Transportation & Commute in Gulfport
Vehicle Availability by Sex in Gulfport
The most prevalent vehicle ownership categories in Gulfport are males with 2 vehicles (1,106, accounting for 46.1%) and females with 2 vehicles (992, making up 49.7%).
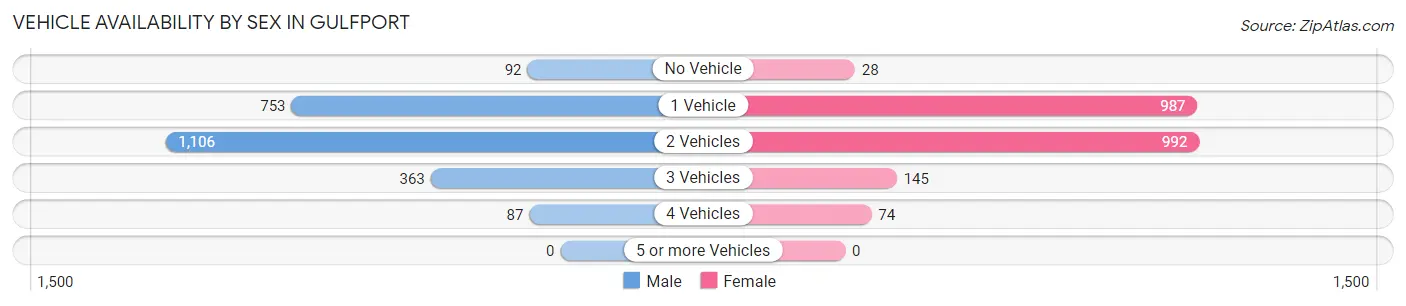
| Vehicles Available | Male | Female |
| No Vehicle | 92 (3.8%) | 28 (1.3%) |
| 1 Vehicle | 753 (31.4%) | 987 (44.3%) |
| 2 Vehicles | 1,106 (46.1%) | 992 (44.6%) |
| 3 Vehicles | 363 (15.1%) | 145 (6.5%) |
| 4 Vehicles | 87 (3.6%) | 74 (3.3%) |
| 5 or more Vehicles | 0 (0.0%) | 0 (0.0%) |
| Total | 2,401 (100.0%) | 2,226 (100.0%) |
Commute Time in Gulfport
The most frequently occuring commute durations in Gulfport are 15 to 19 minutes (802 commuters, 21.7%), 10 to 14 minutes (580 commuters, 15.7%), and 20 to 24 minutes (538 commuters, 14.5%).
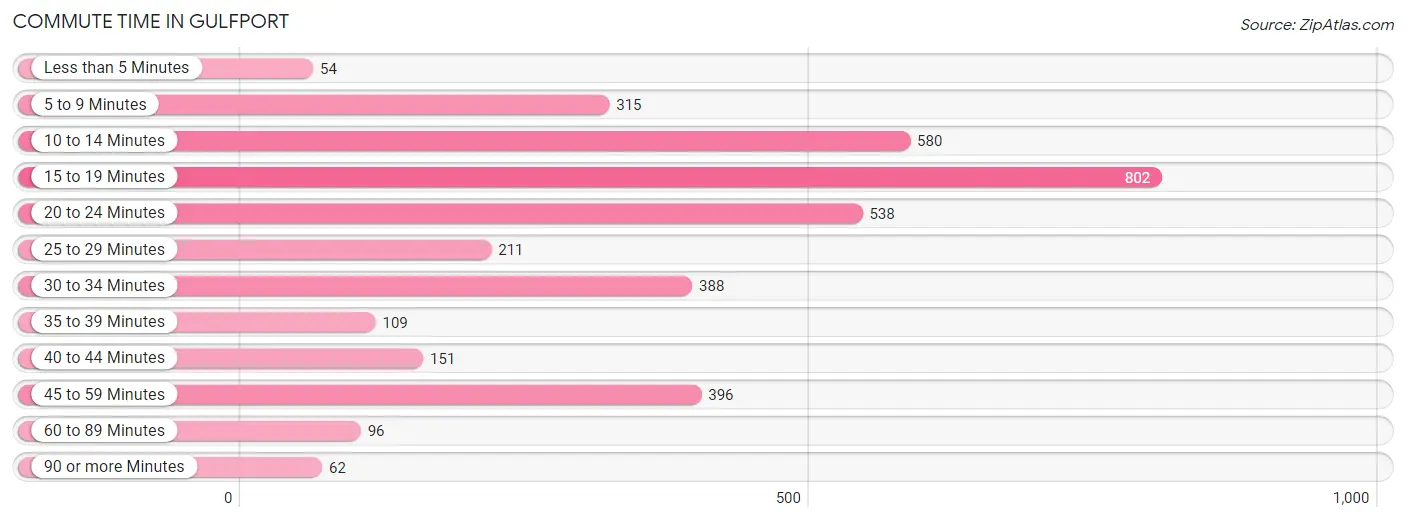
| Commute Time | # Commuters | % Commuters |
| Less than 5 Minutes | 54 | 1.5% |
| 5 to 9 Minutes | 315 | 8.5% |
| 10 to 14 Minutes | 580 | 15.7% |
| 15 to 19 Minutes | 802 | 21.7% |
| 20 to 24 Minutes | 538 | 14.5% |
| 25 to 29 Minutes | 211 | 5.7% |
| 30 to 34 Minutes | 388 | 10.5% |
| 35 to 39 Minutes | 109 | 2.9% |
| 40 to 44 Minutes | 151 | 4.1% |
| 45 to 59 Minutes | 396 | 10.7% |
| 60 to 89 Minutes | 96 | 2.6% |
| 90 or more Minutes | 62 | 1.7% |
Commute Time by Sex in Gulfport
The most common commute times in Gulfport are 15 to 19 minutes (449 commuters, 23.1%) for males and 15 to 19 minutes (353 commuters, 20.1%) for females.
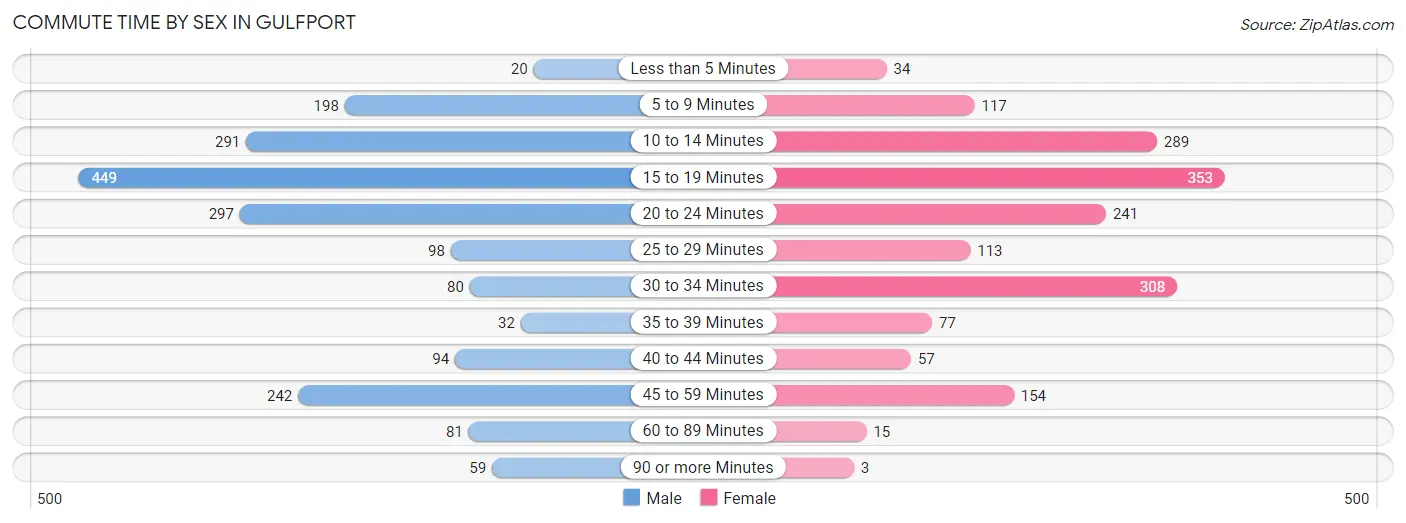
| Commute Time | Male | Female |
| Less than 5 Minutes | 20 (1.0%) | 34 (1.9%) |
| 5 to 9 Minutes | 198 (10.2%) | 117 (6.6%) |
| 10 to 14 Minutes | 291 (15.0%) | 289 (16.4%) |
| 15 to 19 Minutes | 449 (23.1%) | 353 (20.1%) |
| 20 to 24 Minutes | 297 (15.3%) | 241 (13.7%) |
| 25 to 29 Minutes | 98 (5.1%) | 113 (6.4%) |
| 30 to 34 Minutes | 80 (4.1%) | 308 (17.5%) |
| 35 to 39 Minutes | 32 (1.7%) | 77 (4.4%) |
| 40 to 44 Minutes | 94 (4.8%) | 57 (3.2%) |
| 45 to 59 Minutes | 242 (12.5%) | 154 (8.7%) |
| 60 to 89 Minutes | 81 (4.2%) | 15 (0.9%) |
| 90 or more Minutes | 59 (3.0%) | 3 (0.2%) |
Time of Departure to Work by Sex in Gulfport
The most frequent times of departure to work in Gulfport are 7:30 AM to 7:59 AM (360, 18.5%) for males and 7:00 AM to 7:29 AM (243, 13.8%) for females.
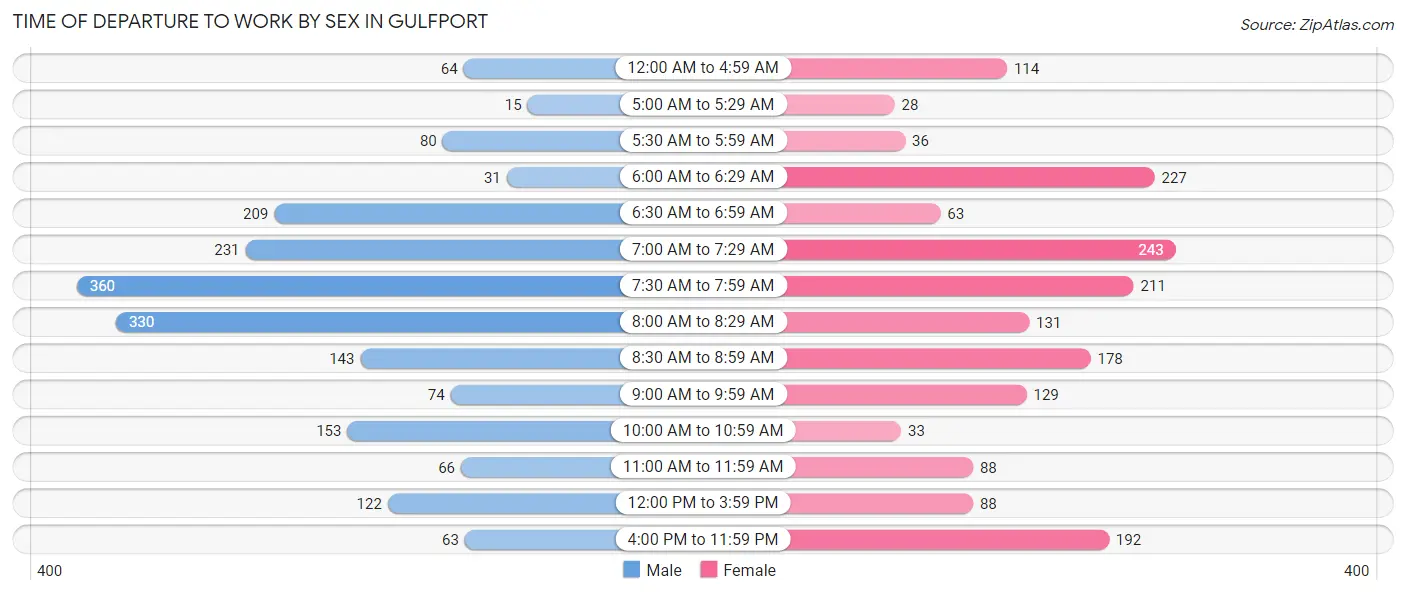
| Time of Departure | Male | Female |
| 12:00 AM to 4:59 AM | 64 (3.3%) | 114 (6.5%) |
| 5:00 AM to 5:29 AM | 15 (0.8%) | 28 (1.6%) |
| 5:30 AM to 5:59 AM | 80 (4.1%) | 36 (2.0%) |
| 6:00 AM to 6:29 AM | 31 (1.6%) | 227 (12.9%) |
| 6:30 AM to 6:59 AM | 209 (10.8%) | 63 (3.6%) |
| 7:00 AM to 7:29 AM | 231 (11.9%) | 243 (13.8%) |
| 7:30 AM to 7:59 AM | 360 (18.5%) | 211 (12.0%) |
| 8:00 AM to 8:29 AM | 330 (17.0%) | 131 (7.4%) |
| 8:30 AM to 8:59 AM | 143 (7.4%) | 178 (10.1%) |
| 9:00 AM to 9:59 AM | 74 (3.8%) | 129 (7.3%) |
| 10:00 AM to 10:59 AM | 153 (7.9%) | 33 (1.9%) |
| 11:00 AM to 11:59 AM | 66 (3.4%) | 88 (5.0%) |
| 12:00 PM to 3:59 PM | 122 (6.3%) | 88 (5.0%) |
| 4:00 PM to 11:59 PM | 63 (3.3%) | 192 (10.9%) |
| Total | 1,941 (100.0%) | 1,761 (100.0%) |
Housing Occupancy in Gulfport
Occupancy by Ownership in Gulfport
Of the total 6,207 dwellings in Gulfport, owner-occupied units account for 4,560 (73.5%), while renter-occupied units make up 1,647 (26.5%).
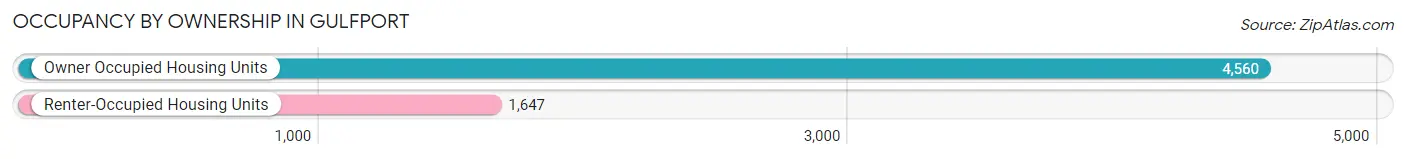
| Occupancy | # Housing Units | % Housing Units |
| Owner Occupied Housing Units | 4,560 | 73.5% |
| Renter-Occupied Housing Units | 1,647 | 26.5% |
| Total Occupied Housing Units | 6,207 | 100.0% |
Occupancy by Household Size in Gulfport
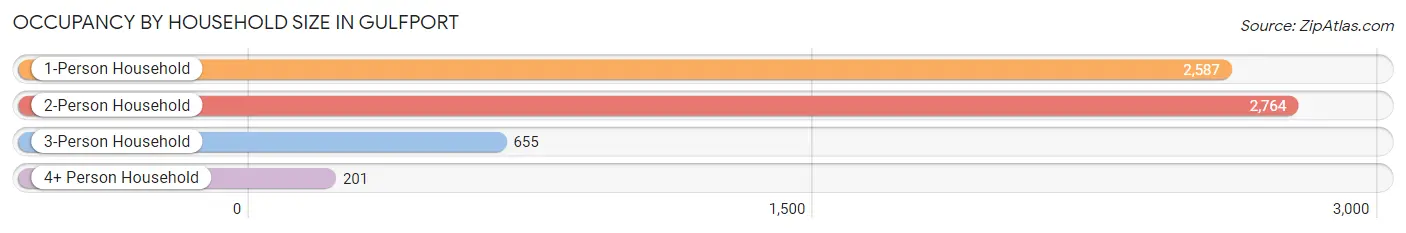
| Household Size | # Housing Units | % Housing Units |
| 1-Person Household | 2,587 | 41.7% |
| 2-Person Household | 2,764 | 44.5% |
| 3-Person Household | 655 | 10.5% |
| 4+ Person Household | 201 | 3.2% |
| Total Housing Units | 6,207 | 100.0% |
Occupancy by Ownership by Household Size in Gulfport
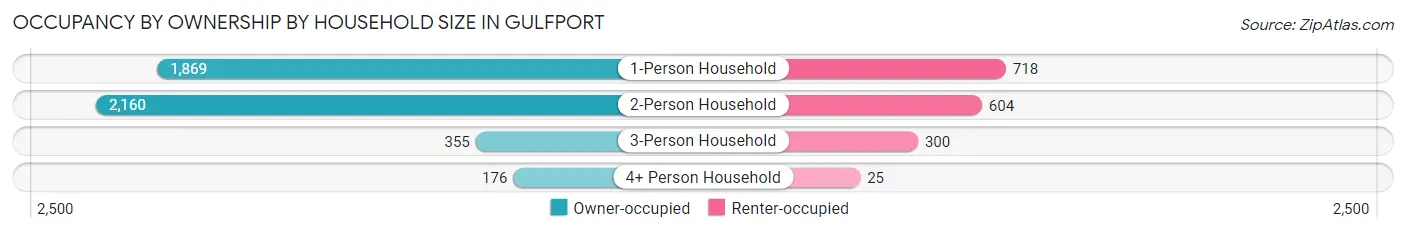
| Household Size | Owner-occupied | Renter-occupied |
| 1-Person Household | 1,869 (72.3%) | 718 (27.8%) |
| 2-Person Household | 2,160 (78.1%) | 604 (21.8%) |
| 3-Person Household | 355 (54.2%) | 300 (45.8%) |
| 4+ Person Household | 176 (87.6%) | 25 (12.4%) |
| Total Housing Units | 4,560 (73.5%) | 1,647 (26.5%) |
Occupancy by Educational Attainment in Gulfport
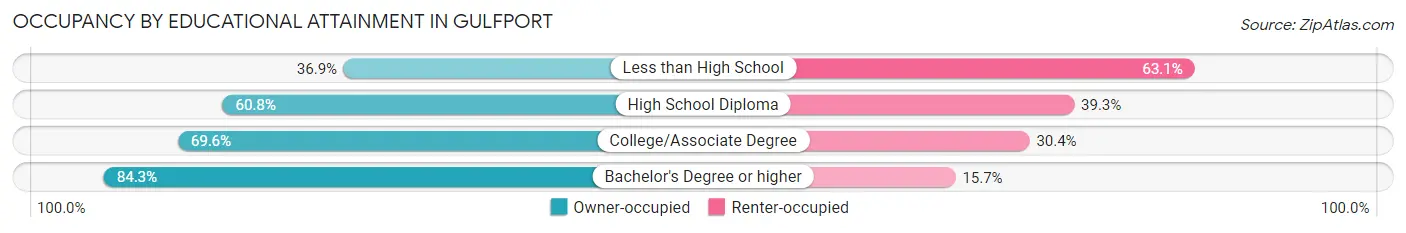
| Household Size | Owner-occupied | Renter-occupied |
| Less than High School | 90 (36.9%) | 154 (63.1%) |
| High School Diploma | 709 (60.8%) | 458 (39.3%) |
| College/Associate Degree | 1,333 (69.6%) | 582 (30.4%) |
| Bachelor's Degree or higher | 2,428 (84.3%) | 453 (15.7%) |
Occupancy by Age of Householder in Gulfport
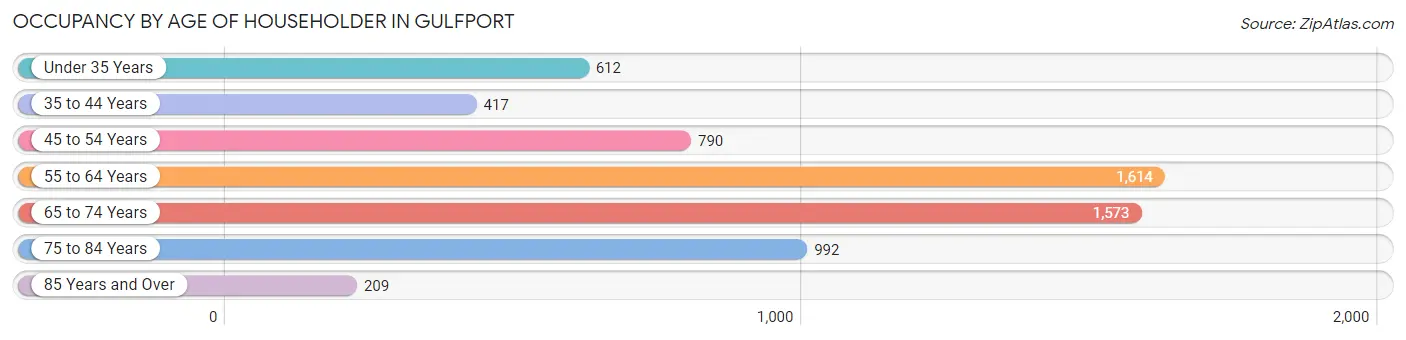
| Age Bracket | # Households | % Households |
| Under 35 Years | 612 | 9.9% |
| 35 to 44 Years | 417 | 6.7% |
| 45 to 54 Years | 790 | 12.7% |
| 55 to 64 Years | 1,614 | 26.0% |
| 65 to 74 Years | 1,573 | 25.3% |
| 75 to 84 Years | 992 | 16.0% |
| 85 Years and Over | 209 | 3.4% |
| Total | 6,207 | 100.0% |
Housing Finances in Gulfport
Median Income by Occupancy in Gulfport
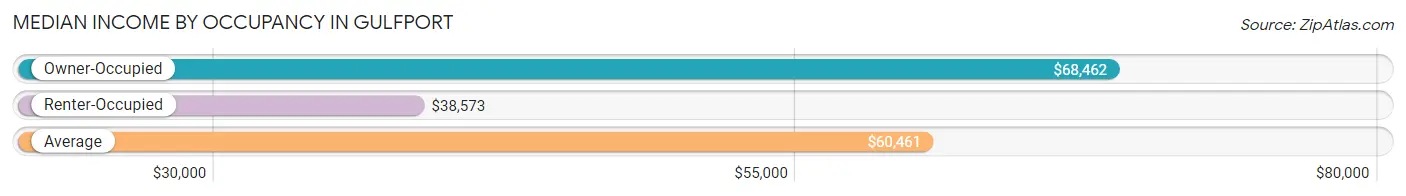
| Occupancy Type | # Households | Median Income |
| Owner-Occupied | 4,560 (73.5%) | $68,462 |
| Renter-Occupied | 1,647 (26.5%) | $38,573 |
| Average | 6,207 (100.0%) | $60,461 |
Occupancy by Householder Income Bracket in Gulfport
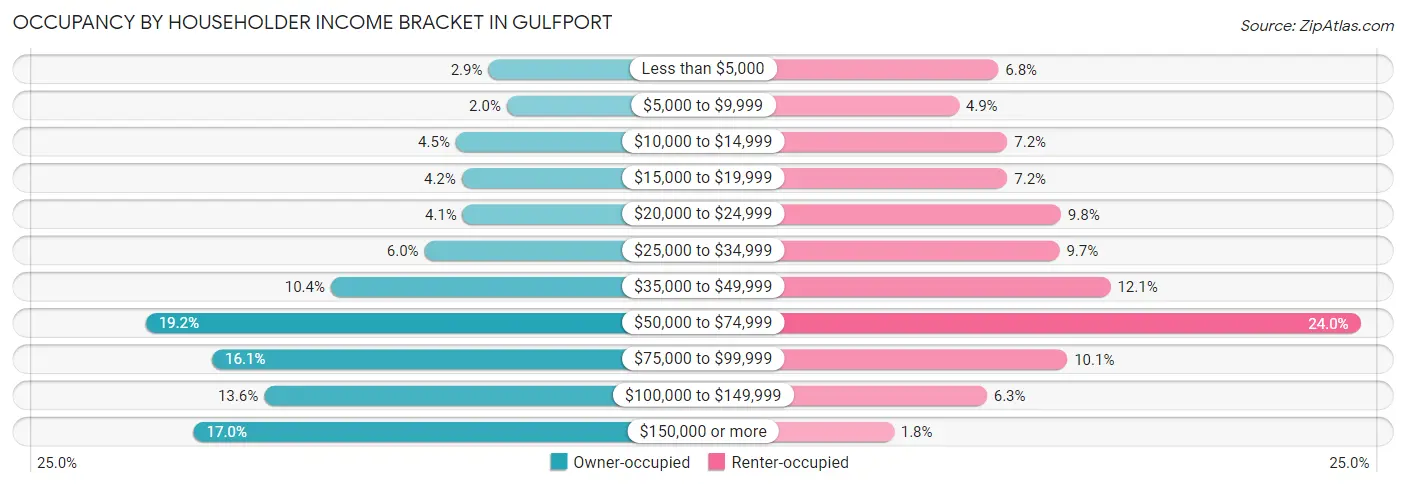
| Income Bracket | Owner-occupied | Renter-occupied |
| Less than $5,000 | 133 (2.9%) | 112 (6.8%) |
| $5,000 to $9,999 | 93 (2.0%) | 81 (4.9%) |
| $10,000 to $14,999 | 204 (4.5%) | 119 (7.2%) |
| $15,000 to $19,999 | 191 (4.2%) | 119 (7.2%) |
| $20,000 to $24,999 | 189 (4.1%) | 161 (9.8%) |
| $25,000 to $34,999 | 272 (6.0%) | 160 (9.7%) |
| $35,000 to $49,999 | 475 (10.4%) | 200 (12.1%) |
| $50,000 to $74,999 | 877 (19.2%) | 396 (24.0%) |
| $75,000 to $99,999 | 733 (16.1%) | 166 (10.1%) |
| $100,000 to $149,999 | 620 (13.6%) | 103 (6.2%) |
| $150,000 or more | 773 (17.0%) | 30 (1.8%) |
| Total | 4,560 (100.0%) | 1,647 (100.0%) |
Monthly Housing Cost Tiers in Gulfport
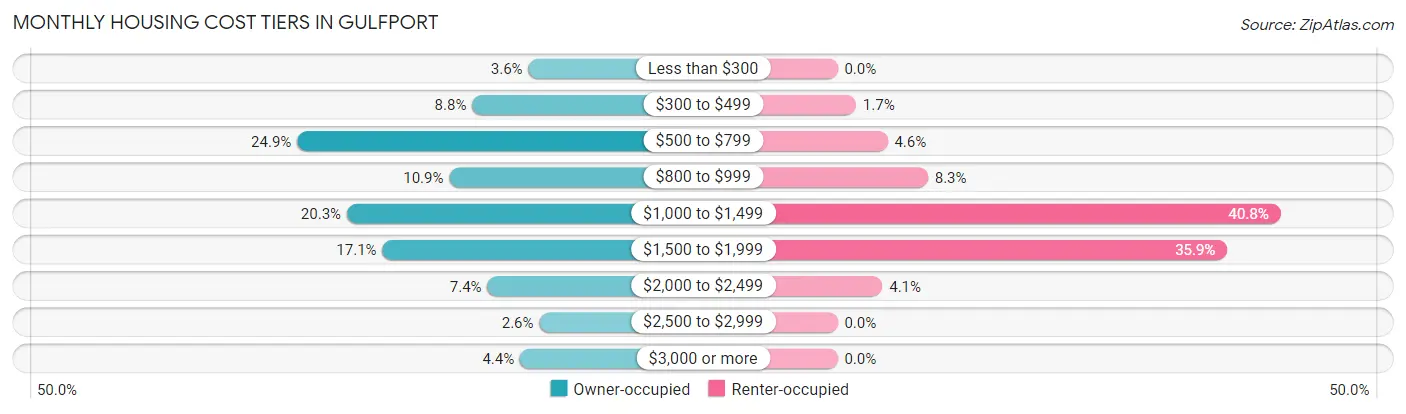
| Monthly Cost | Owner-occupied | Renter-occupied |
| Less than $300 | 165 (3.6%) | 0 (0.0%) |
| $300 to $499 | 401 (8.8%) | 28 (1.7%) |
| $500 to $799 | 1,136 (24.9%) | 76 (4.6%) |
| $800 to $999 | 497 (10.9%) | 137 (8.3%) |
| $1,000 to $1,499 | 927 (20.3%) | 672 (40.8%) |
| $1,500 to $1,999 | 778 (17.1%) | 591 (35.9%) |
| $2,000 to $2,499 | 337 (7.4%) | 68 (4.1%) |
| $2,500 to $2,999 | 119 (2.6%) | 0 (0.0%) |
| $3,000 or more | 200 (4.4%) | 0 (0.0%) |
| Total | 4,560 (100.0%) | 1,647 (100.0%) |
Physical Housing Characteristics in Gulfport
Housing Structures in Gulfport
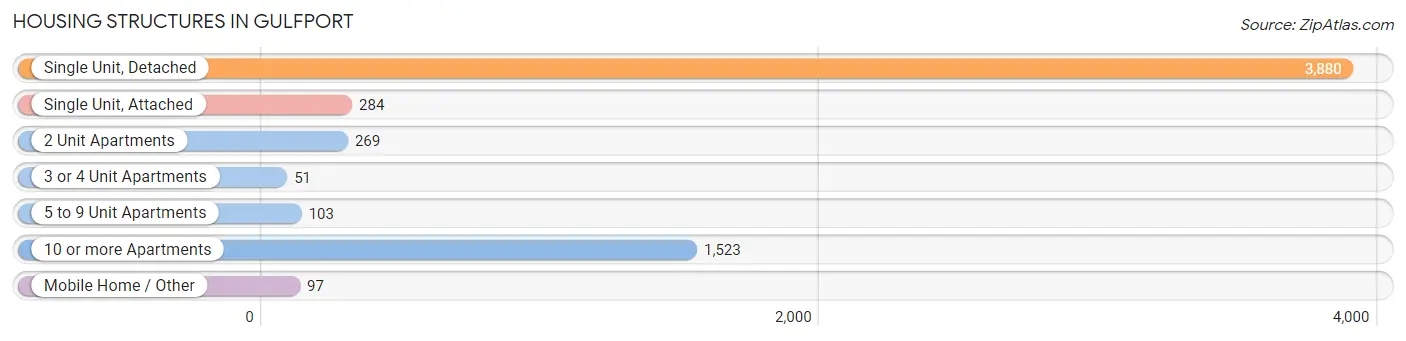
| Structure Type | # Housing Units | % Housing Units |
| Single Unit, Detached | 3,880 | 62.5% |
| Single Unit, Attached | 284 | 4.6% |
| 2 Unit Apartments | 269 | 4.3% |
| 3 or 4 Unit Apartments | 51 | 0.8% |
| 5 to 9 Unit Apartments | 103 | 1.7% |
| 10 or more Apartments | 1,523 | 24.5% |
| Mobile Home / Other | 97 | 1.6% |
| Total | 6,207 | 100.0% |
Housing Structures by Occupancy in Gulfport
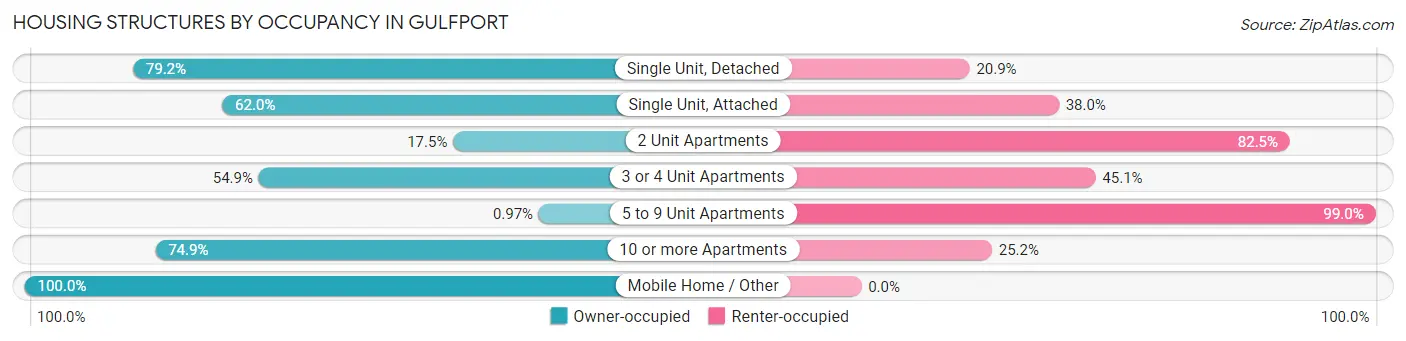
| Structure Type | Owner-occupied | Renter-occupied |
| Single Unit, Detached | 3,071 (79.1%) | 809 (20.8%) |
| Single Unit, Attached | 176 (62.0%) | 108 (38.0%) |
| 2 Unit Apartments | 47 (17.5%) | 222 (82.5%) |
| 3 or 4 Unit Apartments | 28 (54.9%) | 23 (45.1%) |
| 5 to 9 Unit Apartments | 1 (1.0%) | 102 (99.0%) |
| 10 or more Apartments | 1,140 (74.9%) | 383 (25.2%) |
| Mobile Home / Other | 97 (100.0%) | 0 (0.0%) |
| Total | 4,560 (73.5%) | 1,647 (26.5%) |
Housing Structures by Number of Rooms in Gulfport
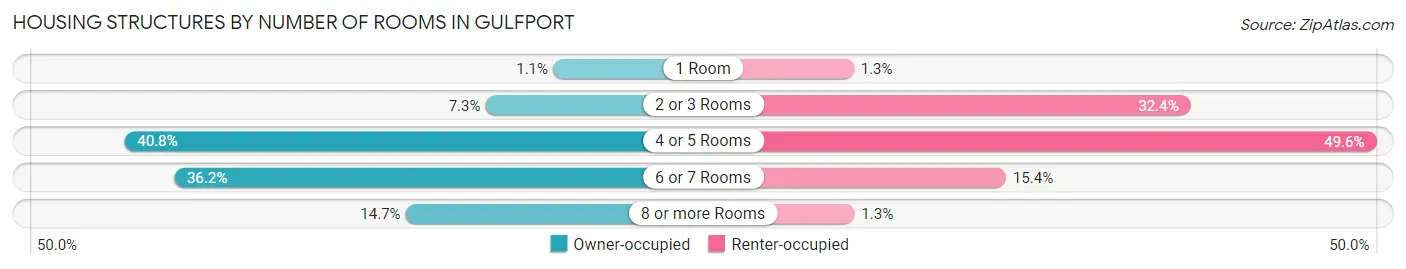
| Number of Rooms | Owner-occupied | Renter-occupied |
| 1 Room | 48 (1.1%) | 21 (1.3%) |
| 2 or 3 Rooms | 333 (7.3%) | 534 (32.4%) |
| 4 or 5 Rooms | 1,859 (40.8%) | 817 (49.6%) |
| 6 or 7 Rooms | 1,650 (36.2%) | 253 (15.4%) |
| 8 or more Rooms | 670 (14.7%) | 22 (1.3%) |
| Total | 4,560 (100.0%) | 1,647 (100.0%) |
Housing Structure by Heating Type in Gulfport
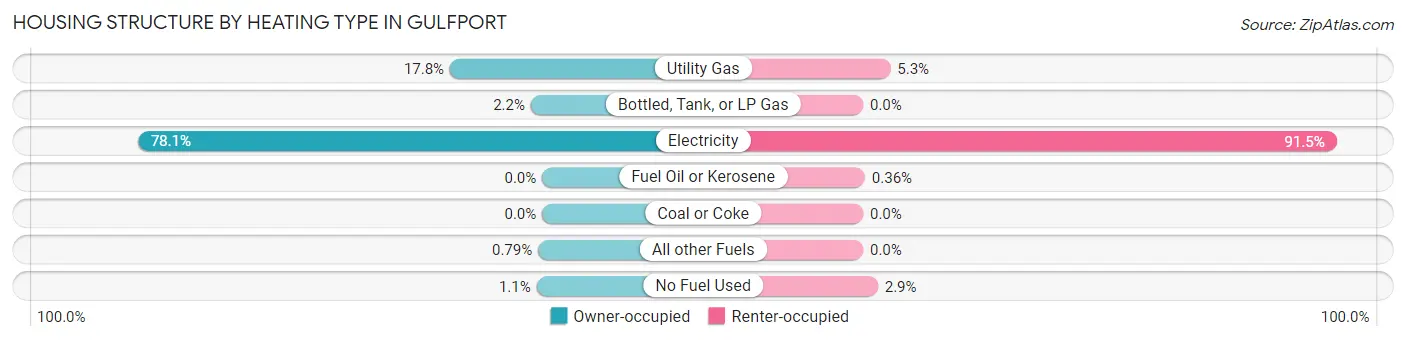
| Heating Type | Owner-occupied | Renter-occupied |
| Utility Gas | 812 (17.8%) | 87 (5.3%) |
| Bottled, Tank, or LP Gas | 100 (2.2%) | 0 (0.0%) |
| Electricity | 3,563 (78.1%) | 1,507 (91.5%) |
| Fuel Oil or Kerosene | 0 (0.0%) | 6 (0.4%) |
| Coal or Coke | 0 (0.0%) | 0 (0.0%) |
| All other Fuels | 36 (0.8%) | 0 (0.0%) |
| No Fuel Used | 49 (1.1%) | 47 (2.9%) |
| Total | 4,560 (100.0%) | 1,647 (100.0%) |
Household Vehicle Usage in Gulfport
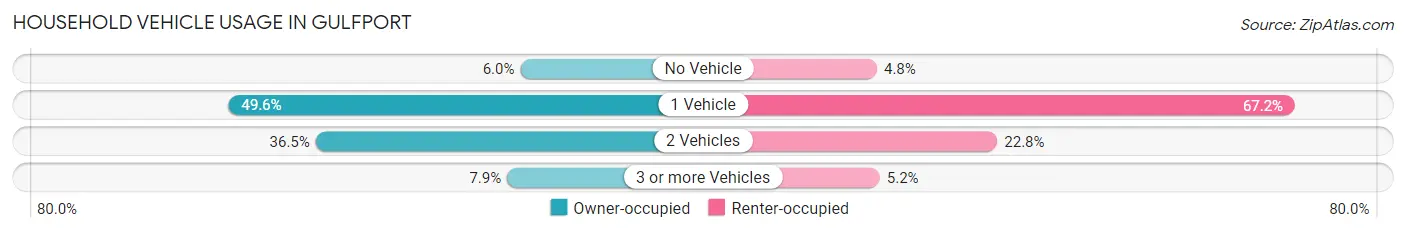
| Vehicles per Household | Owner-occupied | Renter-occupied |
| No Vehicle | 272 (6.0%) | 79 (4.8%) |
| 1 Vehicle | 2,260 (49.6%) | 1,107 (67.2%) |
| 2 Vehicles | 1,666 (36.5%) | 375 (22.8%) |
| 3 or more Vehicles | 362 (7.9%) | 86 (5.2%) |
| Total | 4,560 (100.0%) | 1,647 (100.0%) |
Real Estate & Mortgages in Gulfport
Real Estate and Mortgage Overview in Gulfport
| Characteristic | Without Mortgage | With Mortgage |
| Housing Units | 2,398 | 2,162 |
| Median Property Value | $286,000 | $301,000 |
| Median Household Income | $60,766 | $442 |
| Monthly Housing Costs | $655 | $189 |
| Real Estate Taxes | $1,847 | $40 |
Property Value by Mortgage Status in Gulfport
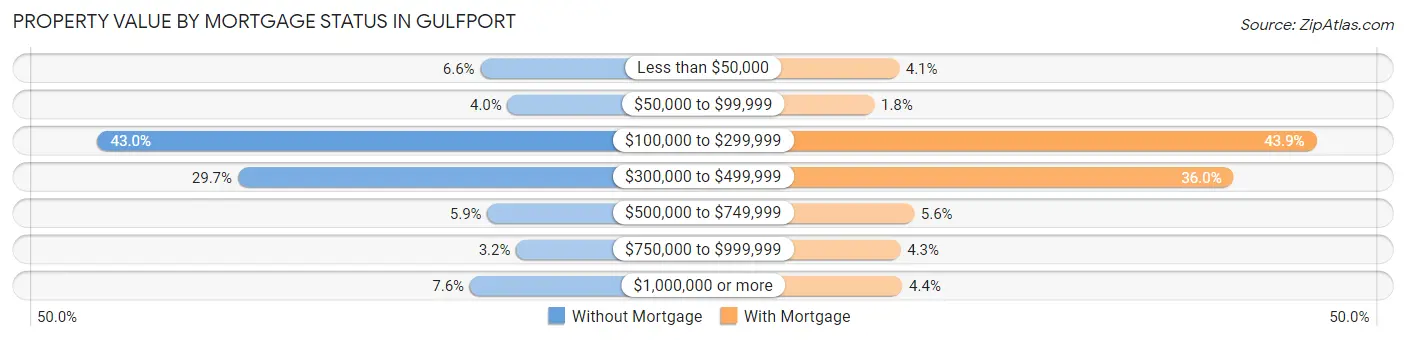
| Property Value | Without Mortgage | With Mortgage |
| Less than $50,000 | 158 (6.6%) | 89 (4.1%) |
| $50,000 to $99,999 | 96 (4.0%) | 38 (1.8%) |
| $100,000 to $299,999 | 1,032 (43.0%) | 949 (43.9%) |
| $300,000 to $499,999 | 712 (29.7%) | 778 (36.0%) |
| $500,000 to $749,999 | 142 (5.9%) | 120 (5.6%) |
| $750,000 to $999,999 | 76 (3.2%) | 92 (4.3%) |
| $1,000,000 or more | 182 (7.6%) | 96 (4.4%) |
| Total | 2,398 (100.0%) | 2,162 (100.0%) |
Household Income by Mortgage Status in Gulfport
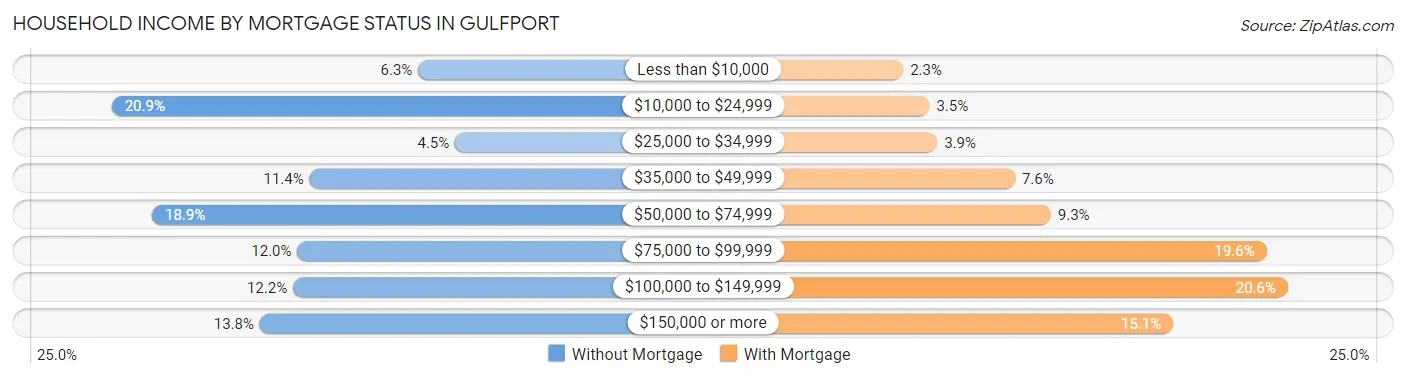
| Household Income | Without Mortgage | With Mortgage |
| Less than $10,000 | 150 (6.3%) | 49 (2.3%) |
| $10,000 to $24,999 | 500 (20.8%) | 76 (3.5%) |
| $25,000 to $34,999 | 108 (4.5%) | 84 (3.9%) |
| $35,000 to $49,999 | 274 (11.4%) | 164 (7.6%) |
| $50,000 to $74,999 | 454 (18.9%) | 201 (9.3%) |
| $75,000 to $99,999 | 288 (12.0%) | 423 (19.6%) |
| $100,000 to $149,999 | 293 (12.2%) | 445 (20.6%) |
| $150,000 or more | 331 (13.8%) | 327 (15.1%) |
| Total | 2,398 (100.0%) | 2,162 (100.0%) |
Property Value to Household Income Ratio in Gulfport
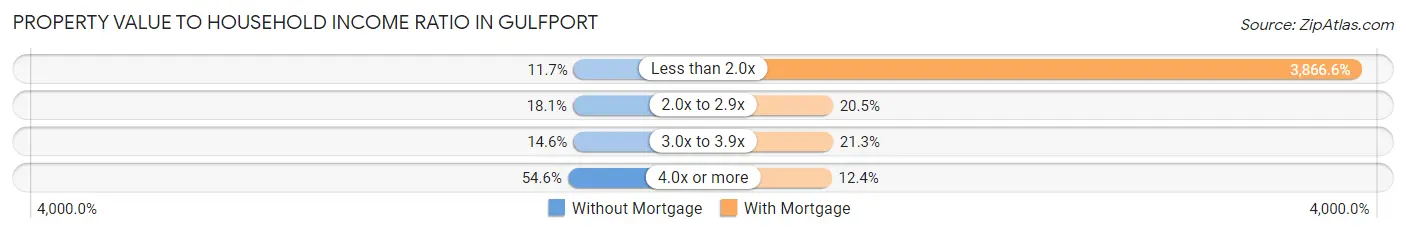
| Value-to-Income Ratio | Without Mortgage | With Mortgage |
| Less than 2.0x | 281 (11.7%) | 83,596 (3,866.6%) |
| 2.0x to 2.9x | 433 (18.1%) | 443 (20.5%) |
| 3.0x to 3.9x | 351 (14.6%) | 460 (21.3%) |
| 4.0x or more | 1,308 (54.5%) | 267 (12.3%) |
| Total | 2,398 (100.0%) | 2,162 (100.0%) |
Real Estate Taxes by Mortgage Status in Gulfport
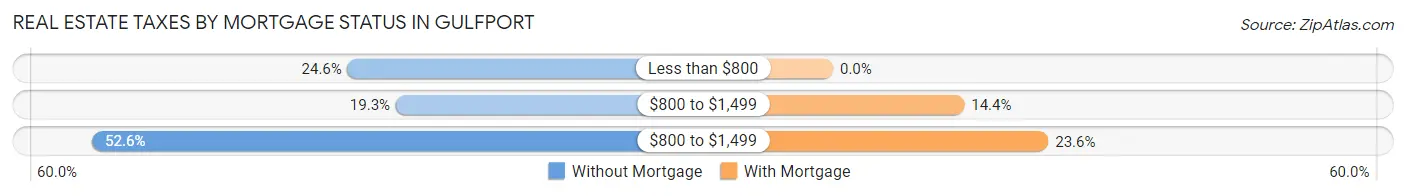
| Property Taxes | Without Mortgage | With Mortgage |
| Less than $800 | 590 (24.6%) | 0 (0.0%) |
| $800 to $1,499 | 463 (19.3%) | 311 (14.4%) |
| $800 to $1,499 | 1,261 (52.6%) | 510 (23.6%) |
| Total | 2,398 (100.0%) | 2,162 (100.0%) |
Health & Disability in Gulfport
Health Insurance Coverage by Age in Gulfport

| Age Bracket | With Coverage | Without Coverage |
| Under 6 Years | 384 (100.0%) | 0 (0.0%) |
| 6 to 18 Years | 705 (96.4%) | 26 (3.6%) |
| 19 to 25 Years | 324 (72.3%) | 124 (27.7%) |
| 26 to 34 Years | 790 (90.4%) | 84 (9.6%) |
| 35 to 44 Years | 559 (69.5%) | 245 (30.5%) |
| 45 to 54 Years | 1,217 (75.3%) | 400 (24.7%) |
| 55 to 64 Years | 2,342 (93.7%) | 157 (6.3%) |
| 65 to 74 Years | 2,406 (99.7%) | 8 (0.3%) |
| 75 Years and older | 1,856 (98.1%) | 36 (1.9%) |
| Total | 10,583 (90.7%) | 1,080 (9.3%) |
Health Insurance Coverage by Citizenship Status in Gulfport
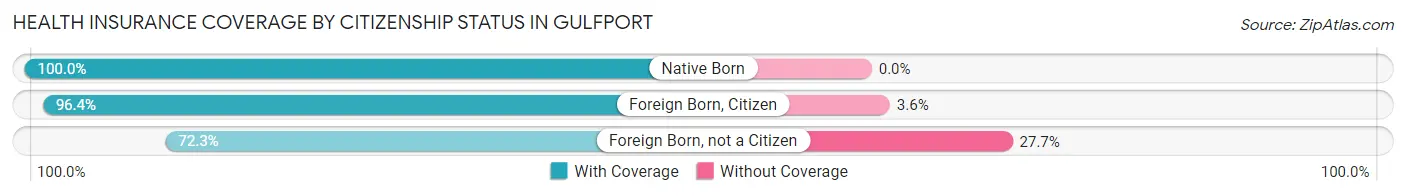
| Citizenship Status | With Coverage | Without Coverage |
| Native Born | 384 (100.0%) | 0 (0.0%) |
| Foreign Born, Citizen | 705 (96.4%) | 26 (3.6%) |
| Foreign Born, not a Citizen | 324 (72.3%) | 124 (27.7%) |
Health Insurance Coverage by Household Income in Gulfport
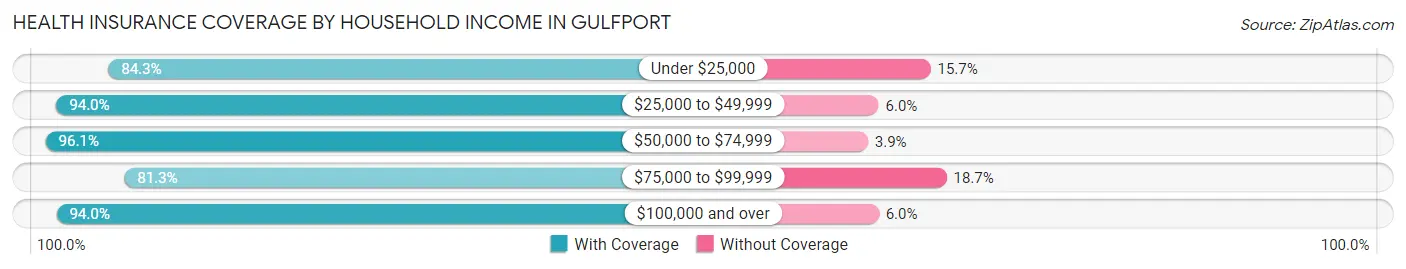
| Household Income | With Coverage | Without Coverage |
| Under $25,000 | 1,784 (84.3%) | 332 (15.7%) |
| $25,000 to $49,999 | 1,531 (94.0%) | 97 (6.0%) |
| $50,000 to $74,999 | 2,368 (96.1%) | 97 (3.9%) |
| $75,000 to $99,999 | 1,466 (81.3%) | 337 (18.7%) |
| $100,000 and over | 3,379 (94.0%) | 215 (6.0%) |
Public vs Private Health Insurance Coverage by Age in Gulfport
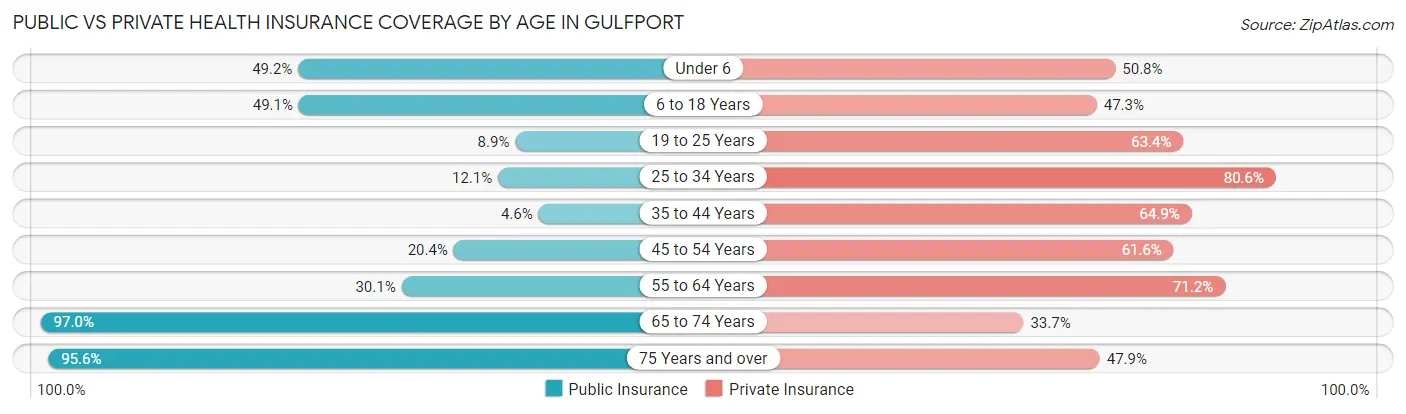
| Age Bracket | Public Insurance | Private Insurance |
| Under 6 | 189 (49.2%) | 195 (50.8%) |
| 6 to 18 Years | 359 (49.1%) | 346 (47.3%) |
| 19 to 25 Years | 40 (8.9%) | 284 (63.4%) |
| 25 to 34 Years | 106 (12.1%) | 704 (80.5%) |
| 35 to 44 Years | 37 (4.6%) | 522 (64.9%) |
| 45 to 54 Years | 329 (20.3%) | 996 (61.6%) |
| 55 to 64 Years | 751 (30.0%) | 1,778 (71.2%) |
| 65 to 74 Years | 2,342 (97.0%) | 814 (33.7%) |
| 75 Years and over | 1,809 (95.6%) | 906 (47.9%) |
| Total | 5,962 (51.1%) | 6,545 (56.1%) |
Disability Status by Sex by Age in Gulfport
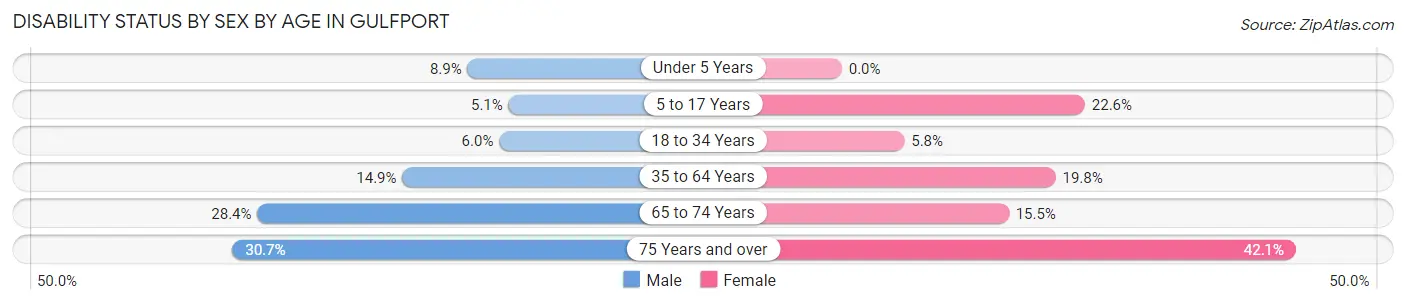
| Age Bracket | Male | Female |
| Under 5 Years | 12 (8.9%) | 0 (0.0%) |
| 5 to 17 Years | 15 (5.1%) | 81 (22.6%) |
| 18 to 34 Years | 49 (5.9%) | 34 (5.8%) |
| 35 to 64 Years | 345 (14.9%) | 518 (19.8%) |
| 65 to 74 Years | 286 (28.4%) | 218 (15.5%) |
| 75 Years and over | 251 (30.7%) | 453 (42.1%) |
Disability Class by Sex by Age in Gulfport
Disability Class: Hearing Difficulty
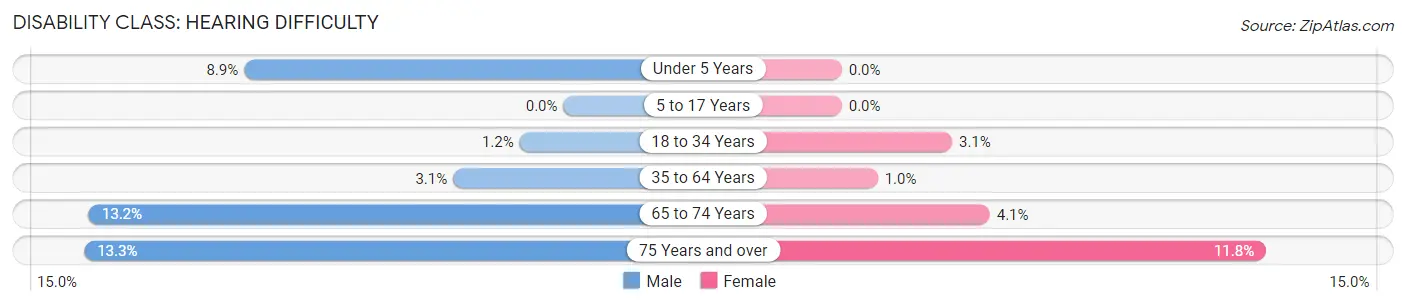
| Age Bracket | Male | Female |
| Under 5 Years | 12 (8.9%) | 0 (0.0%) |
| 5 to 17 Years | 0 (0.0%) | 0 (0.0%) |
| 18 to 34 Years | 10 (1.2%) | 18 (3.1%) |
| 35 to 64 Years | 71 (3.1%) | 26 (1.0%) |
| 65 to 74 Years | 133 (13.2%) | 58 (4.1%) |
| 75 Years and over | 109 (13.3%) | 127 (11.8%) |
Disability Class: Vision Difficulty
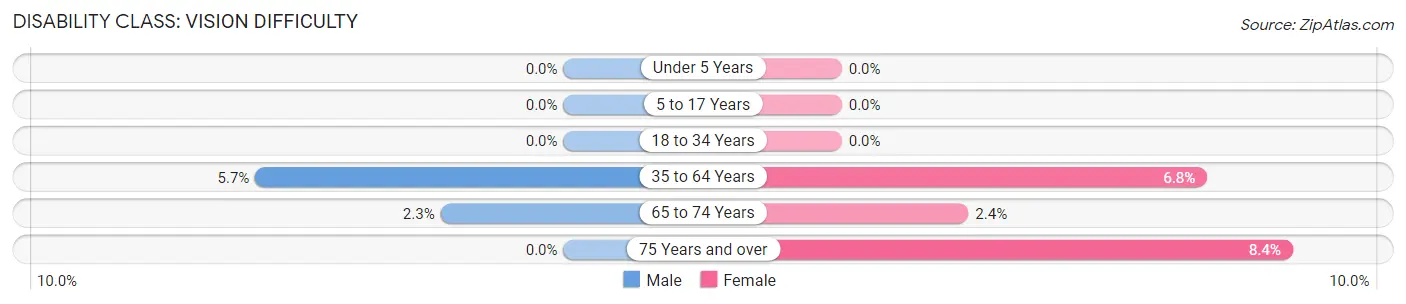
| Age Bracket | Male | Female |
| Under 5 Years | 0 (0.0%) | 0 (0.0%) |
| 5 to 17 Years | 0 (0.0%) | 0 (0.0%) |
| 18 to 34 Years | 0 (0.0%) | 0 (0.0%) |
| 35 to 64 Years | 132 (5.7%) | 177 (6.8%) |
| 65 to 74 Years | 23 (2.3%) | 33 (2.4%) |
| 75 Years and over | 0 (0.0%) | 90 (8.4%) |
Disability Class: Cognitive Difficulty
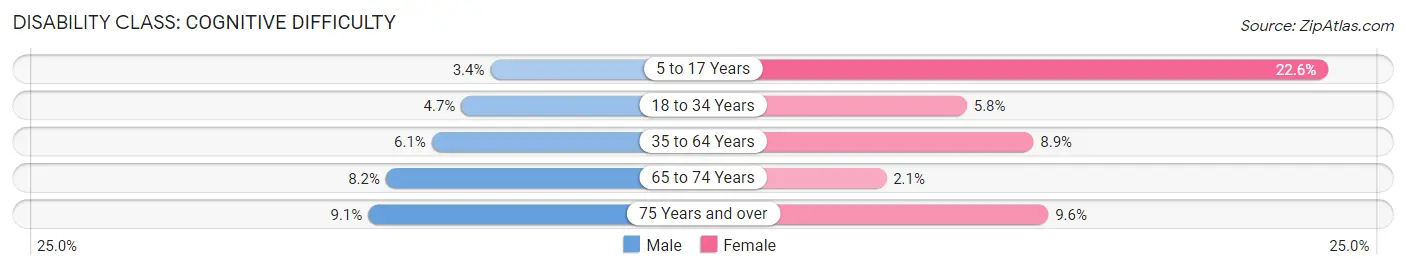
| Age Bracket | Male | Female |
| 5 to 17 Years | 10 (3.4%) | 81 (22.6%) |
| 18 to 34 Years | 39 (4.7%) | 34 (5.8%) |
| 35 to 64 Years | 141 (6.1%) | 232 (8.9%) |
| 65 to 74 Years | 83 (8.2%) | 29 (2.1%) |
| 75 Years and over | 74 (9.1%) | 103 (9.6%) |
Disability Class: Ambulatory Difficulty
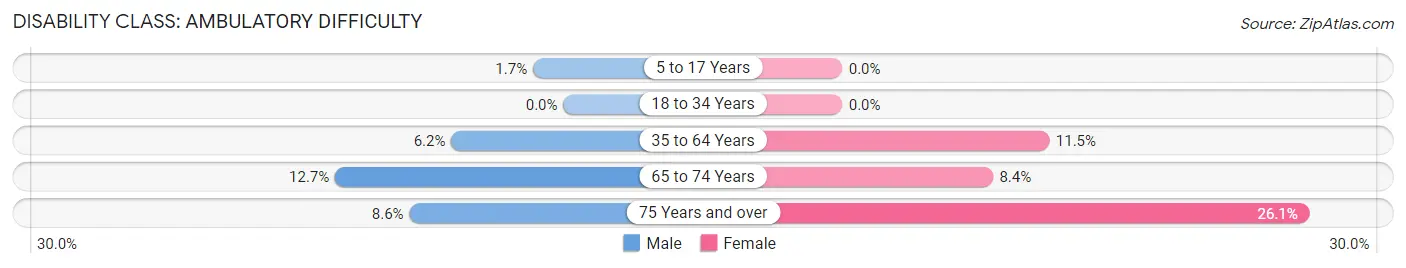
| Age Bracket | Male | Female |
| 5 to 17 Years | 5 (1.7%) | 0 (0.0%) |
| 18 to 34 Years | 0 (0.0%) | 0 (0.0%) |
| 35 to 64 Years | 144 (6.2%) | 301 (11.5%) |
| 65 to 74 Years | 128 (12.7%) | 118 (8.4%) |
| 75 Years and over | 70 (8.6%) | 280 (26.1%) |
Disability Class: Self-Care Difficulty
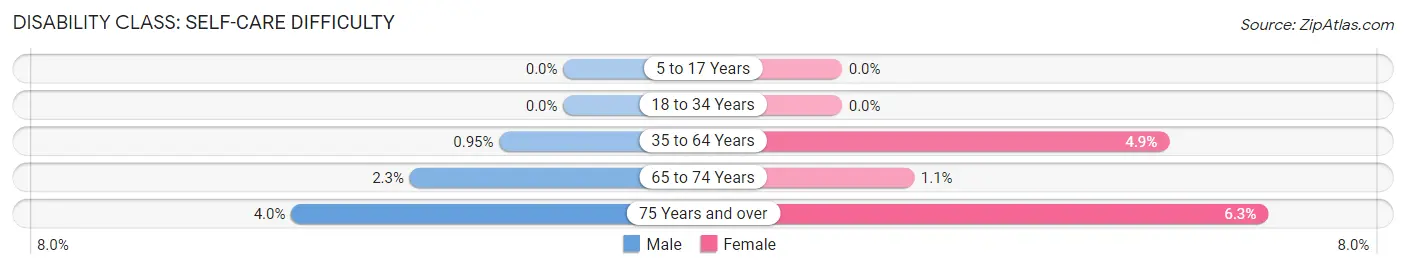
| Age Bracket | Male | Female |
| 5 to 17 Years | 0 (0.0%) | 0 (0.0%) |
| 18 to 34 Years | 0 (0.0%) | 0 (0.0%) |
| 35 to 64 Years | 22 (0.9%) | 127 (4.9%) |
| 65 to 74 Years | 23 (2.3%) | 15 (1.1%) |
| 75 Years and over | 33 (4.0%) | 68 (6.3%) |
Technology Access in Gulfport
Computing Device Access in Gulfport
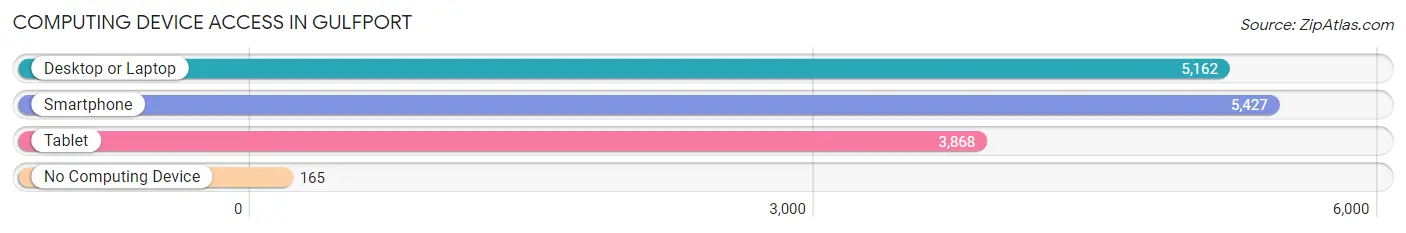
| Device Type | # Households | % Households |
| Desktop or Laptop | 5,162 | 83.2% |
| Smartphone | 5,427 | 87.4% |
| Tablet | 3,868 | 62.3% |
| No Computing Device | 165 | 2.7% |
| Total | 6,207 | 100.0% |
Internet Access in Gulfport
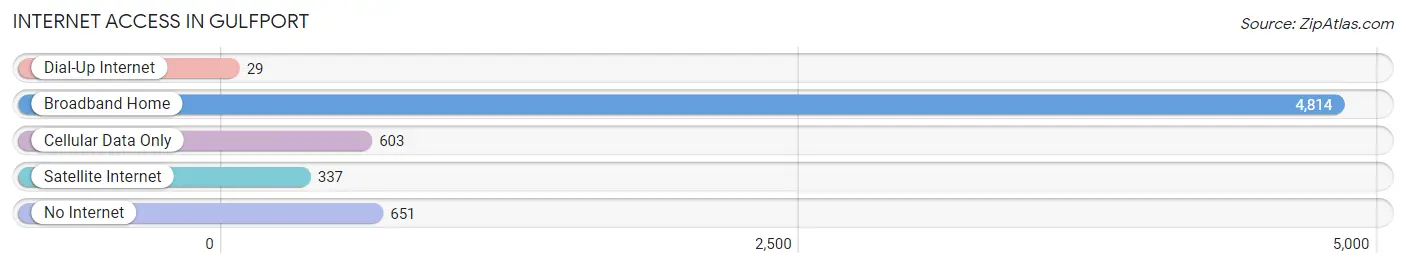
| Internet Type | # Households | % Households |
| Dial-Up Internet | 29 | 0.5% |
| Broadband Home | 4,814 | 77.6% |
| Cellular Data Only | 603 | 9.7% |
| Satellite Internet | 337 | 5.4% |
| No Internet | 651 | 10.5% |
| Total | 6,207 | 100.0% |
Gulfport Summary
Gulfport, Florida is a small city located in Pinellas County, on the Gulf of Mexico. It is part of the Tampa Bay Area and is located just south of St. Petersburg. The city has a population of 12,029 as of the 2020 census, making it the 22nd largest city in Pinellas County.
Geography
Gulfport is located on the Gulf of Mexico, just south of St. Petersburg. It is bordered by the cities of St. Pete Beach to the north, South Pasadena to the east, and Pasadena to the south. The city is situated on a peninsula, with Boca Ciega Bay to the east and the Gulf of Mexico to the west. The city covers an area of 4.2 square miles, with a population density of 2,890 people per square mile.
History
Gulfport was founded in 1910 by William H. Platt, who named the city after the Gulf of Mexico. The city was incorporated in 1910 and was originally a fishing village. In the 1920s, the city began to grow as a tourist destination, with the construction of the Gulfport Casino and the Gulfport Pier. The city continued to grow throughout the 20th century, and in the 1950s, the city was home to a thriving art scene, with many galleries and studios.
Economy
Gulfport’s economy is largely based on tourism and retail. The city is home to several popular tourist attractions, including the Gulfport Casino, the Gulfport Pier, and the Gulfport Art Walk. The city also has a thriving retail sector, with many shops and restaurants located along Beach Boulevard. The city is also home to several large employers, including the Pinellas County Sheriff’s Office, the Pinellas County School Board, and the Pinellas County Health Department.
Demographics
As of the 2020 census, Gulfport had a population of 12,029. The racial makeup of the city was 79.2% White, 11.2% African American, 0.7% Native American, 2.2% Asian, 0.1% Pacific Islander, 4.2% from other races, and 2.6% from two or more races. Hispanic or Latino of any race were 11.2% of the population.
The median income for a household in Gulfport was $45,845, and the median income for a family was $54,945. The per capita income for the city was $25,945. About 11.2% of families and 14.2% of the population were below the poverty line, including 19.2% of those under age 18 and 8.2% of those age 65 or over.
Gulfport is a small city with a rich history and a vibrant economy. The city is home to many popular tourist attractions, as well as a thriving retail sector. The city also has a diverse population, with a mix of races and ethnicities. Gulfport is a great place to live, work, and visit.
Common Questions
What is Per Capita Income in Gulfport?
Per Capita income in Gulfport is $48,446.
What is the Median Family Income in Gulfport?
Median Family Income in Gulfport is $75,000.
What is the Median Household income in Gulfport?
Median Household Income in Gulfport is $60,461.
What is Income or Wage Gap in Gulfport?
Income or Wage Gap in Gulfport is 21.5%.
Women in Gulfport earn 78.5 cents for every dollar earned by a man.
What is Inequality or Gini Index in Gulfport?
Inequality or Gini Index in Gulfport is 0.52.
What is the Total Population of Gulfport?
Total Population of Gulfport is 11,796.
What is the Total Male Population of Gulfport?
Total Male Population of Gulfport is 5,453.
What is the Total Female Population of Gulfport?
Total Female Population of Gulfport is 6,343.
What is the Ratio of Males per 100 Females in Gulfport?
There are 85.97 Males per 100 Females in Gulfport.
What is the Ratio of Females per 100 Males in Gulfport?
There are 116.32 Females per 100 Males in Gulfport.
What is the Median Population Age in Gulfport?
Median Population Age in Gulfport is 59.0 Years.
What is the Average Family Size in Gulfport
Average Family Size in Gulfport is 2.5 People.
What is the Average Household Size in Gulfport
Average Household Size in Gulfport is 1.9 People.
How Large is the Labor Force in Gulfport?
There are 5,142 People in the Labor Forcein in Gulfport.
What is the Percentage of People in the Labor Force in Gulfport?
46.6% of People are in the Labor Force in Gulfport.
What is the Unemployment Rate in Gulfport?
Unemployment Rate in Gulfport is 5.9%.