Beverly Beach, FL Map & Demographics
Beverly Beach Map
Beverly Beach Overview
$51,574
PER CAPITA INCOME
$93,000
AVG FAMILY INCOME
$42,273
AVG HOUSEHOLD INCOME
0.6%
WAGE / INCOME GAP [ % ]
99.4¢/ $1
WAGE / INCOME GAP [ $ ]
0.51
INEQUALITY / GINI INDEX
495
TOTAL POPULATION
258
MALE POPULATION
237
FEMALE POPULATION
108.86
MALES / 100 FEMALES
91.86
FEMALES / 100 MALES
64.5
MEDIAN AGE
2.2
AVG FAMILY SIZE
1.7
AVG HOUSEHOLD SIZE
175
LABOR FORCE [ PEOPLE ]
36.2%
PERCENT IN LABOR FORCE
4.0%
UNEMPLOYMENT RATE
Beverly Beach Area Codes
Income in Beverly Beach
Income Overview in Beverly Beach
Per Capita Income in Beverly Beach is $51,574, while median incomes of families and households are $93,000 and $42,273 respectively.
| Characteristic | Number | Measure |
| Per Capita Income | 495 | $51,574 |
| Median Family Income | 160 | $93,000 |
| Mean Family Income | 160 | $122,307 |
| Median Household Income | 296 | $42,273 |
| Mean Household Income | 296 | $85,804 |
| Income Deficit | 160 | $0 |
| Wage / Income Gap (%) | 495 | 0.55% |
| Wage / Income Gap ($) | 495 | 99.45¢ per $1 |
| Gini / Inequality Index | 495 | 0.51 |
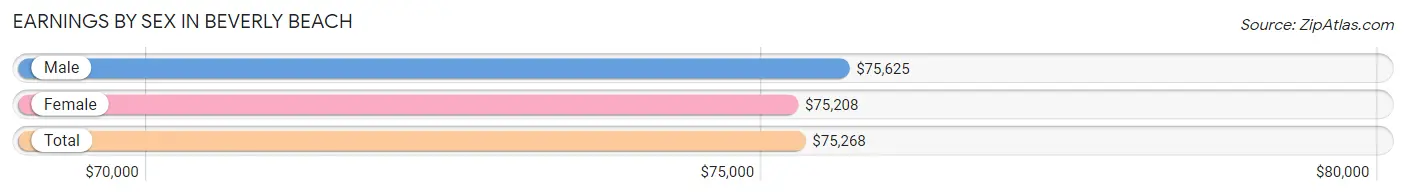
Earnings by Sex in Beverly Beach
Average Earnings in Beverly Beach are $75,268, $75,625 for men and $75,208 for women, a difference of 0.5%.
| Sex | Number | Average Earnings |
| Male | 105 (60.0%) | $75,625 |
| Female | 70 (40.0%) | $75,208 |
| Total | 175 (100.0%) | $75,268 |
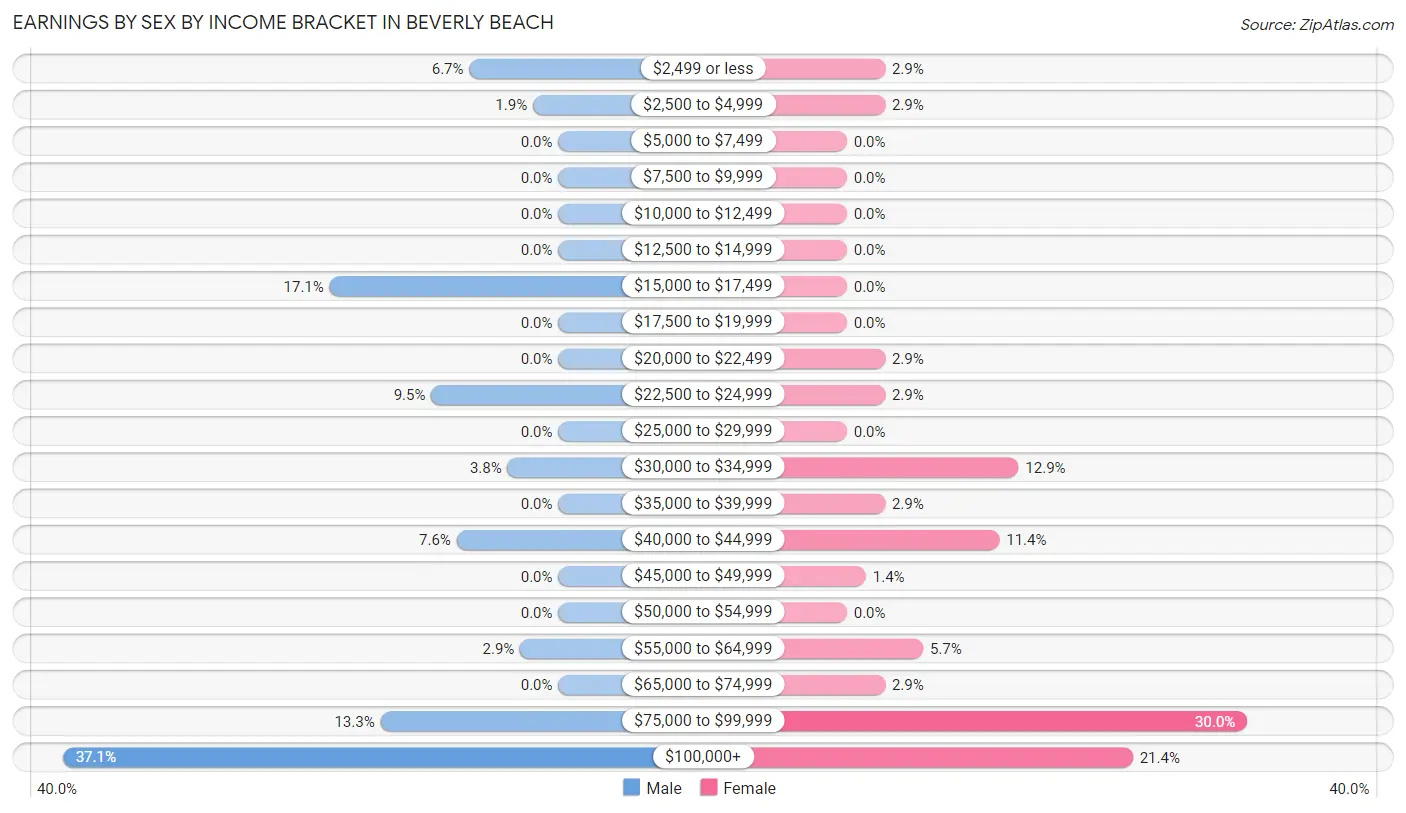
Earnings by Sex by Income Bracket in Beverly Beach
The most common earnings brackets in Beverly Beach are $100,000+ for men (39 | 37.1%) and $75,000 to $99,999 for women (21 | 30.0%).
| Income | Male | Female |
| $2,499 or less | 7 (6.7%) | 2 (2.9%) |
| $2,500 to $4,999 | 2 (1.9%) | 2 (2.9%) |
| $5,000 to $7,499 | 0 (0.0%) | 0 (0.0%) |
| $7,500 to $9,999 | 0 (0.0%) | 0 (0.0%) |
| $10,000 to $12,499 | 0 (0.0%) | 0 (0.0%) |
| $12,500 to $14,999 | 0 (0.0%) | 0 (0.0%) |
| $15,000 to $17,499 | 18 (17.1%) | 0 (0.0%) |
| $17,500 to $19,999 | 0 (0.0%) | 0 (0.0%) |
| $20,000 to $22,499 | 0 (0.0%) | 2 (2.9%) |
| $22,500 to $24,999 | 10 (9.5%) | 2 (2.9%) |
| $25,000 to $29,999 | 0 (0.0%) | 0 (0.0%) |
| $30,000 to $34,999 | 4 (3.8%) | 9 (12.9%) |
| $35,000 to $39,999 | 0 (0.0%) | 2 (2.9%) |
| $40,000 to $44,999 | 8 (7.6%) | 8 (11.4%) |
| $45,000 to $49,999 | 0 (0.0%) | 1 (1.4%) |
| $50,000 to $54,999 | 0 (0.0%) | 0 (0.0%) |
| $55,000 to $64,999 | 3 (2.9%) | 4 (5.7%) |
| $65,000 to $74,999 | 0 (0.0%) | 2 (2.9%) |
| $75,000 to $99,999 | 14 (13.3%) | 21 (30.0%) |
| $100,000+ | 39 (37.1%) | 15 (21.4%) |
| Total | 105 (100.0%) | 70 (100.0%) |
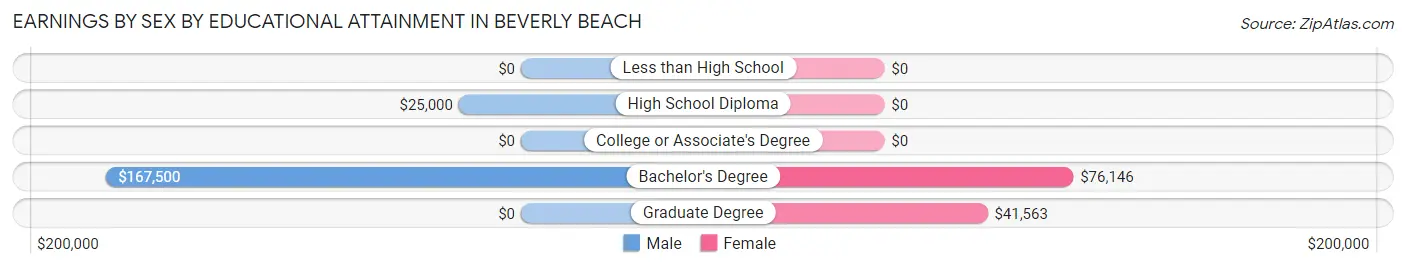
Earnings by Sex by Educational Attainment in Beverly Beach
Average earnings in Beverly Beach are $75,625 for men and $75,208 for women, a difference of 0.5%. Men with an educational attainment of bachelor's degree enjoy the highest average annual earnings of $167,500, while those with high school diploma education earn the least with $25,000. Women with an educational attainment of bachelor's degree earn the most with the average annual earnings of $76,146, while those with graduate degree education have the smallest earnings of $41,563.
| Educational Attainment | Male Income | Female Income |
| Less than High School | - | - |
| High School Diploma | $25,000 | $0 |
| College or Associate's Degree | - | - |
| Bachelor's Degree | $167,500 | $76,146 |
| Graduate Degree | - | - |
| Total | $75,625 | $75,208 |
Family Income in Beverly Beach
Family Income Brackets in Beverly Beach
According to the Beverly Beach family income data, there are 30 families falling into the $100,000 to $149,999 income range, which is the most common income bracket and makes up 18.8% of all families.
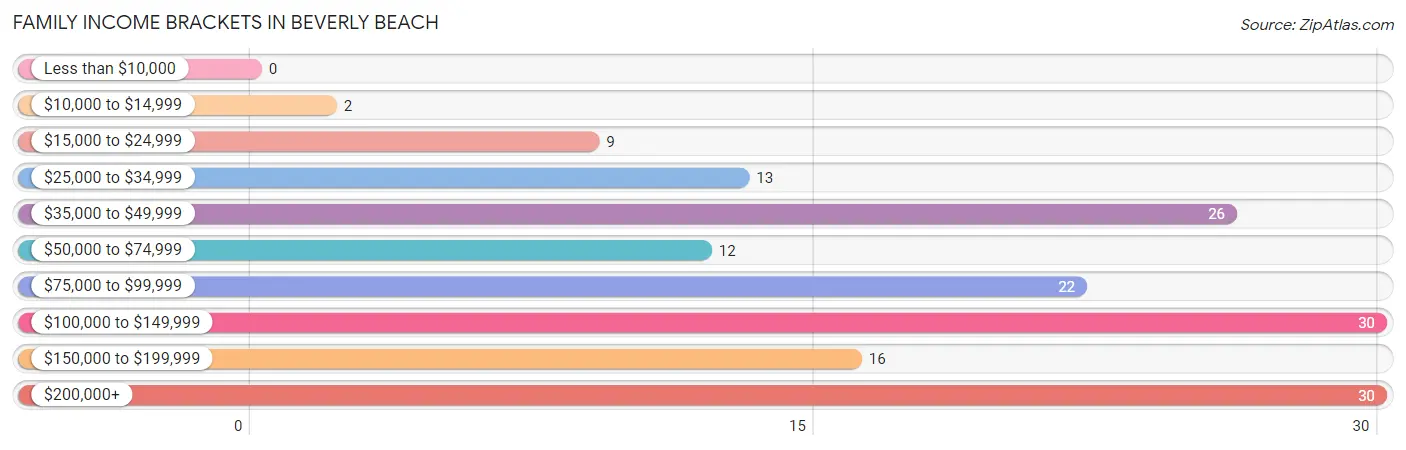
| Income Bracket | # Families | % Families |
| Less than $10,000 | 0 | 0.0% |
| $10,000 to $14,999 | 2 | 1.3% |
| $15,000 to $24,999 | 9 | 5.6% |
| $25,000 to $34,999 | 13 | 8.1% |
| $35,000 to $49,999 | 26 | 16.3% |
| $50,000 to $74,999 | 12 | 7.5% |
| $75,000 to $99,999 | 22 | 13.8% |
| $100,000 to $149,999 | 30 | 18.8% |
| $150,000 to $199,999 | 16 | 10.0% |
| $200,000+ | 30 | 18.8% |
Family Income by Famaliy Size in Beverly Beach
3-person families (9 | 5.6%) account for the highest median family income in Beverly Beach with $250,001 per family, while 3-person families (9 | 5.6%) have the highest median income of $83,334 per family member.
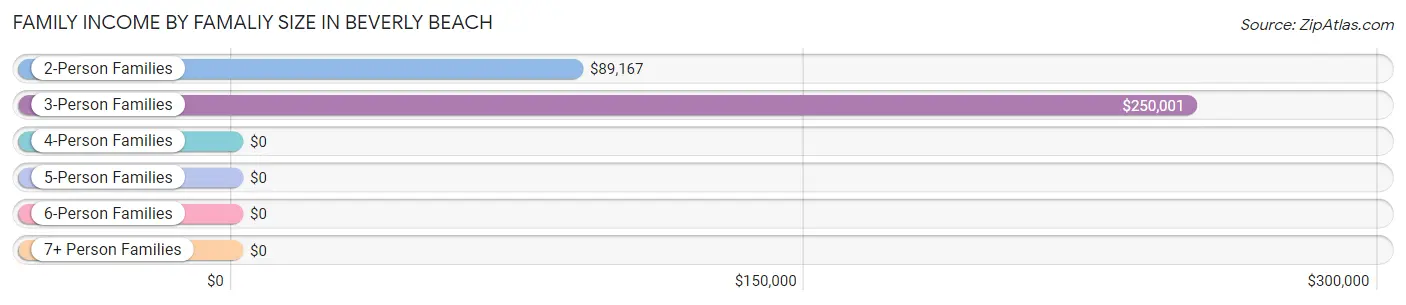
| Income Bracket | # Families | Median Income |
| 2-Person Families | 146 (91.2%) | $89,167 |
| 3-Person Families | 9 (5.6%) | $250,001 |
| 4-Person Families | 4 (2.5%) | $0 |
| 5-Person Families | 1 (0.6%) | $0 |
| 6-Person Families | 0 (0.0%) | $0 |
| 7+ Person Families | 0 (0.0%) | $0 |
| Total | 160 (100.0%) | $93,000 |
Family Income by Number of Earners in Beverly Beach
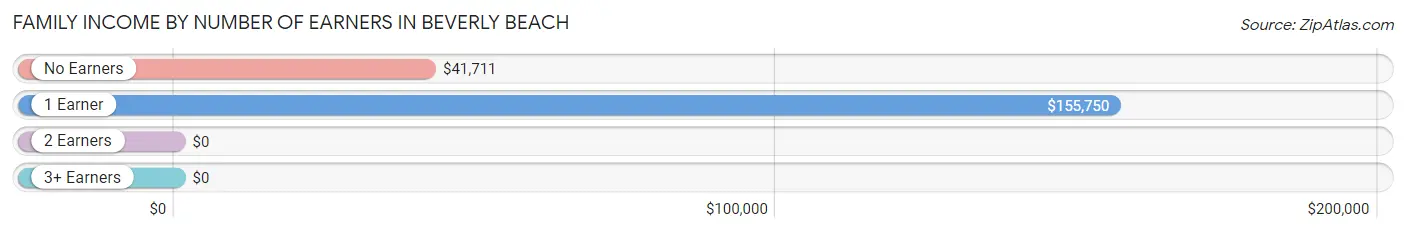
| Number of Earners | # Families | Median Income |
| No Earners | 74 (46.3%) | $41,711 |
| 1 Earner | 47 (29.4%) | $155,750 |
| 2 Earners | 39 (24.4%) | $0 |
| 3+ Earners | 0 (0.0%) | $0 |
| Total | 160 (100.0%) | $93,000 |
Household Income in Beverly Beach
Household Income Brackets in Beverly Beach
With 56 households falling in the category, the $25,000 to $34,999 income range is the most frequent in Beverly Beach, accounting for 18.9% of all households. In contrast, only 5 households (1.7%) fall into the $10,000 to $14,999 income bracket, making it the least populous group.
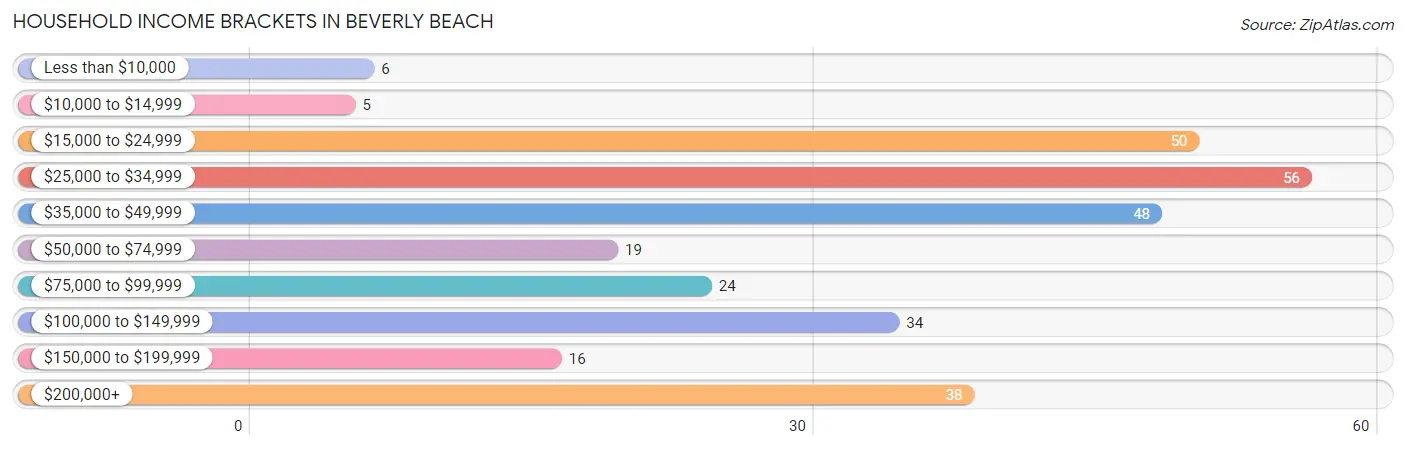
| Income Bracket | # Households | % Households |
| Less than $10,000 | 6 | 2.0% |
| $10,000 to $14,999 | 5 | 1.7% |
| $15,000 to $24,999 | 50 | 16.9% |
| $25,000 to $34,999 | 56 | 18.9% |
| $35,000 to $49,999 | 48 | 16.2% |
| $50,000 to $74,999 | 19 | 6.4% |
| $75,000 to $99,999 | 24 | 8.1% |
| $100,000 to $149,999 | 34 | 11.5% |
| $150,000 to $199,999 | 16 | 5.4% |
| $200,000+ | 38 | 12.8% |
Household Income by Householder Age in Beverly Beach
The median household income in Beverly Beach is $42,273, with the highest median household income of $101,500 found in the 25 to 44 years age bracket for the primary householder. A total of 16 households (5.4%) fall into this category.
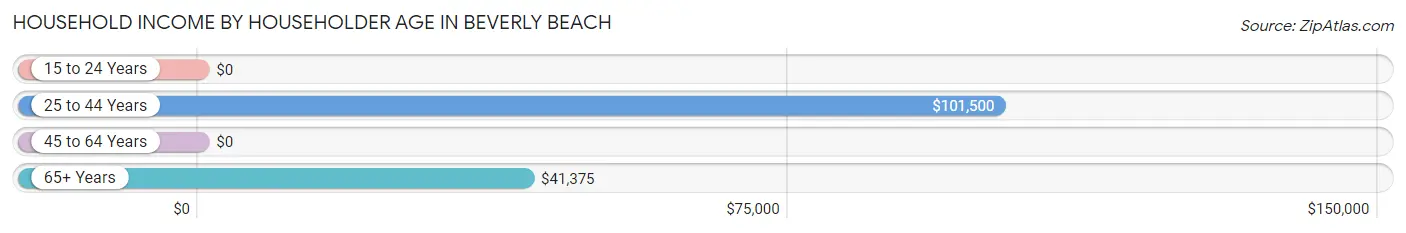
| Income Bracket | # Households | Median Income |
| 15 to 24 Years | 0 (0.0%) | $0 |
| 25 to 44 Years | 16 (5.4%) | $101,500 |
| 45 to 64 Years | 116 (39.2%) | $0 |
| 65+ Years | 164 (55.4%) | $41,375 |
| Total | 296 (100.0%) | $42,273 |
Poverty in Beverly Beach
Income Below Poverty by Sex and Age in Beverly Beach
With 5.8% poverty level for males and 7.6% for females among the residents of Beverly Beach, 65 to 74 year old males and 75 year old and over females are the most vulnerable to poverty, with 9 males (17.6%) and 10 females (15.9%) in their respective age groups living below the poverty level.
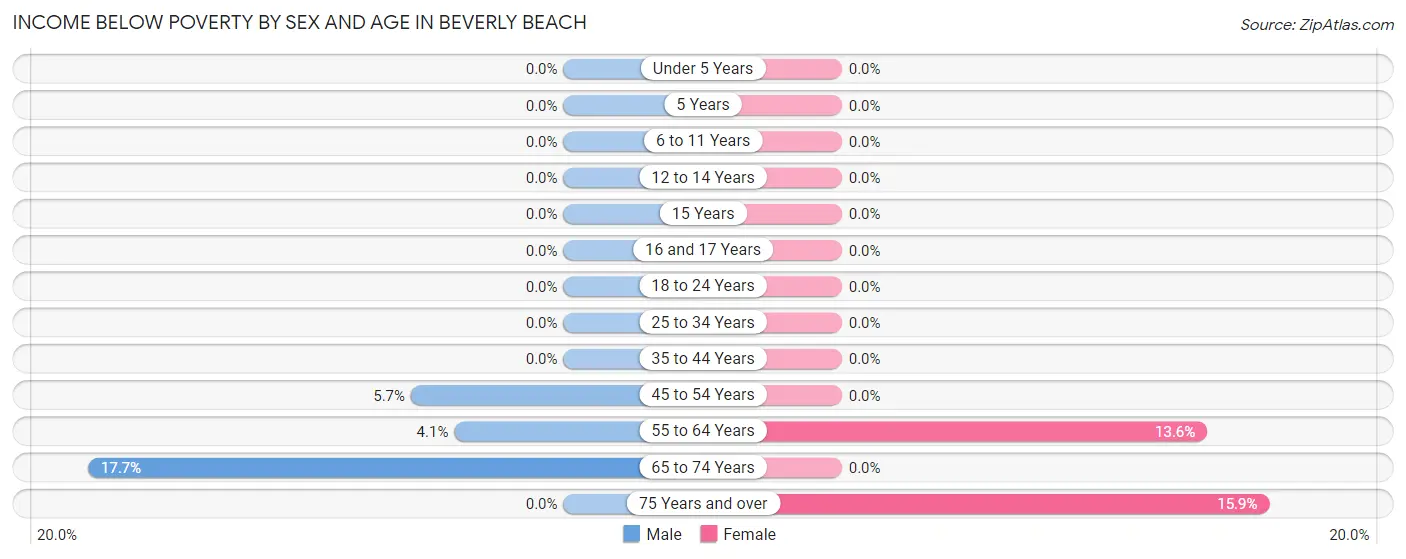
| Age Bracket | Male | Female |
| Under 5 Years | 0 (0.0%) | 0 (0.0%) |
| 5 Years | 0 (0.0%) | 0 (0.0%) |
| 6 to 11 Years | 0 (0.0%) | 0 (0.0%) |
| 12 to 14 Years | 0 (0.0%) | 0 (0.0%) |
| 15 Years | 0 (0.0%) | 0 (0.0%) |
| 16 and 17 Years | 0 (0.0%) | 0 (0.0%) |
| 18 to 24 Years | 0 (0.0%) | 0 (0.0%) |
| 25 to 34 Years | 0 (0.0%) | 0 (0.0%) |
| 35 to 44 Years | 0 (0.0%) | 0 (0.0%) |
| 45 to 54 Years | 3 (5.7%) | 0 (0.0%) |
| 55 to 64 Years | 3 (4.1%) | 8 (13.6%) |
| 65 to 74 Years | 9 (17.6%) | 0 (0.0%) |
| 75 Years and over | 0 (0.0%) | 10 (15.9%) |
| Total | 15 (5.8%) | 18 (7.6%) |
Income Above Poverty by Sex and Age in Beverly Beach
According to the poverty statistics in Beverly Beach, males aged 6 to 11 years and females aged 6 to 11 years are the age groups that are most secure financially, with 100.0% of males and 100.0% of females in these age groups living above the poverty line.
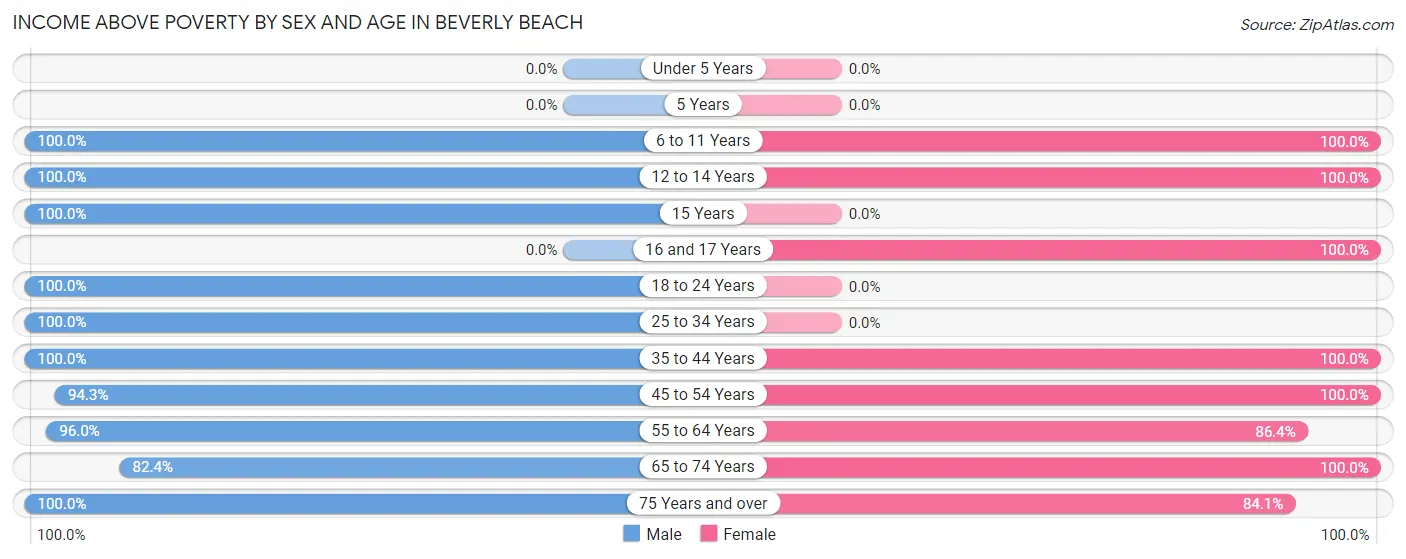
| Age Bracket | Male | Female |
| Under 5 Years | 0 (0.0%) | 0 (0.0%) |
| 5 Years | 0 (0.0%) | 0 (0.0%) |
| 6 to 11 Years | 4 (100.0%) | 1 (100.0%) |
| 12 to 14 Years | 1 (100.0%) | 2 (100.0%) |
| 15 Years | 4 (100.0%) | 0 (0.0%) |
| 16 and 17 Years | 0 (0.0%) | 3 (100.0%) |
| 18 to 24 Years | 2 (100.0%) | 0 (0.0%) |
| 25 to 34 Years | 10 (100.0%) | 0 (0.0%) |
| 35 to 44 Years | 2 (100.0%) | 11 (100.0%) |
| 45 to 54 Years | 50 (94.3%) | 29 (100.0%) |
| 55 to 64 Years | 71 (96.0%) | 51 (86.4%) |
| 65 to 74 Years | 42 (82.4%) | 69 (100.0%) |
| 75 Years and over | 57 (100.0%) | 53 (84.1%) |
| Total | 243 (94.2%) | 219 (92.4%) |
Income Below Poverty Among Married-Couple Families in Beverly Beach
The poverty statistics for married-couple families in Beverly Beach show that 6.3% or 9 of the total 142 families live below the poverty line. Families with no children have the highest poverty rate of 6.7%, comprising of 9 families. On the other hand, families with 1 or 2 children have the lowest poverty rate of 0.0%, which includes 0 families.
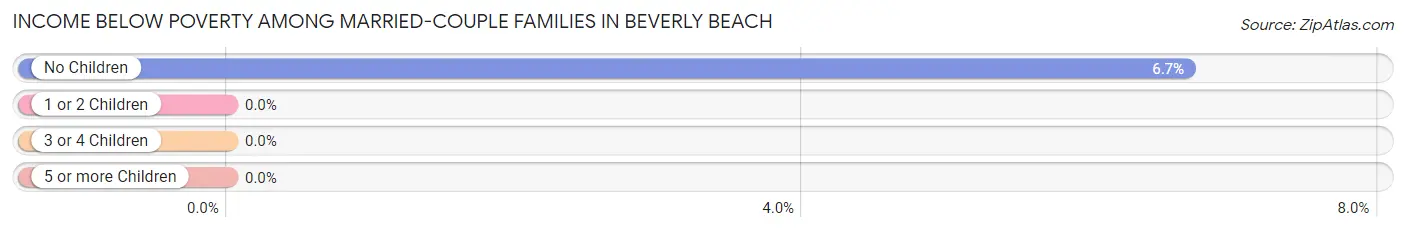
| Children | Above Poverty | Below Poverty |
| No Children | 126 (93.3%) | 9 (6.7%) |
| 1 or 2 Children | 6 (100.0%) | 0 (0.0%) |
| 3 or 4 Children | 1 (100.0%) | 0 (0.0%) |
| 5 or more Children | 0 (0.0%) | 0 (0.0%) |
| Total | 133 (93.7%) | 9 (6.3%) |
Income Below Poverty Among Single-Parent Households in Beverly Beach
| Children | Single Father | Single Mother |
| No Children | 0 (0.0%) | 0 (0.0%) |
| 1 or 2 Children | 0 (0.0%) | 0 (0.0%) |
| 3 or 4 Children | 0 (0.0%) | 0 (0.0%) |
| 5 or more Children | 0 (0.0%) | 0 (0.0%) |
| Total | 0 (0.0%) | 0 (0.0%) |
Income Below Poverty Among Married-Couple vs Single-Parent Households in Beverly Beach
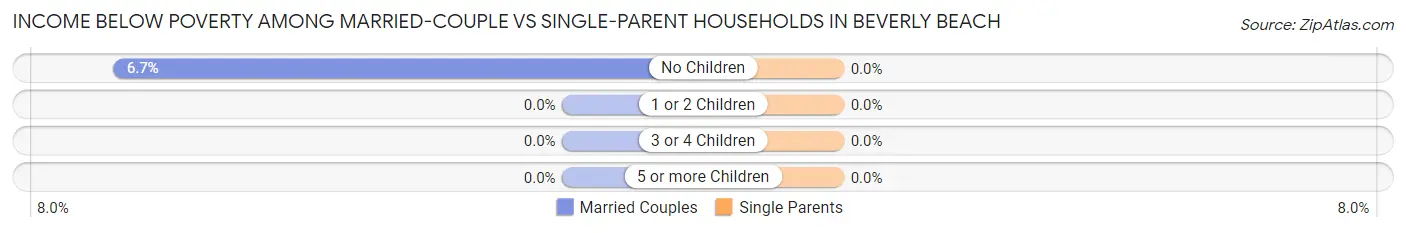
| Children | Married-Couple Families | Single-Parent Households |
| No Children | 9 (6.7%) | 0 (0.0%) |
| 1 or 2 Children | 0 (0.0%) | 0 (0.0%) |
| 3 or 4 Children | 0 (0.0%) | 0 (0.0%) |
| 5 or more Children | 0 (0.0%) | 0 (0.0%) |
| Total | 9 (6.3%) | 0 (0.0%) |
Race in Beverly Beach
The most populous races in Beverly Beach are White / Caucasian (474 | 95.8%), Two or more Races (19 | 3.8%), and Hispanic or Latino (6 | 1.2%).
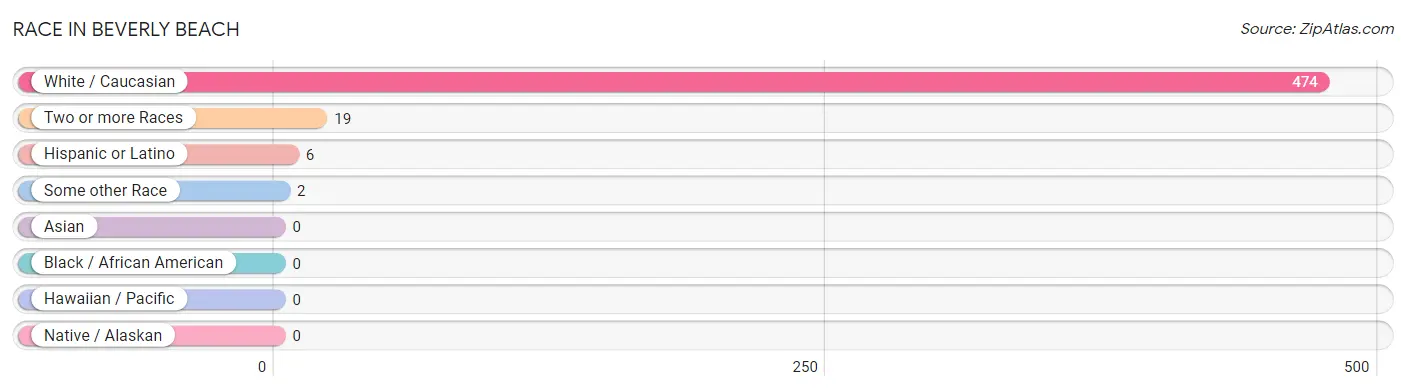
| Race | # Population | % Population |
| Asian | 0 | 0.0% |
| Black / African American | 0 | 0.0% |
| Hawaiian / Pacific | 0 | 0.0% |
| Hispanic or Latino | 6 | 1.2% |
| Native / Alaskan | 0 | 0.0% |
| White / Caucasian | 474 | 95.8% |
| Two or more Races | 19 | 3.8% |
| Some other Race | 2 | 0.4% |
| Total | 495 | 100.0% |
Ancestry in Beverly Beach
The most populous ancestries reported in Beverly Beach are American (122 | 24.6%), German (94 | 19.0%), Irish (77 | 15.6%), English (52 | 10.5%), and Italian (30 | 6.1%), together accounting for 75.8% of all Beverly Beach residents.
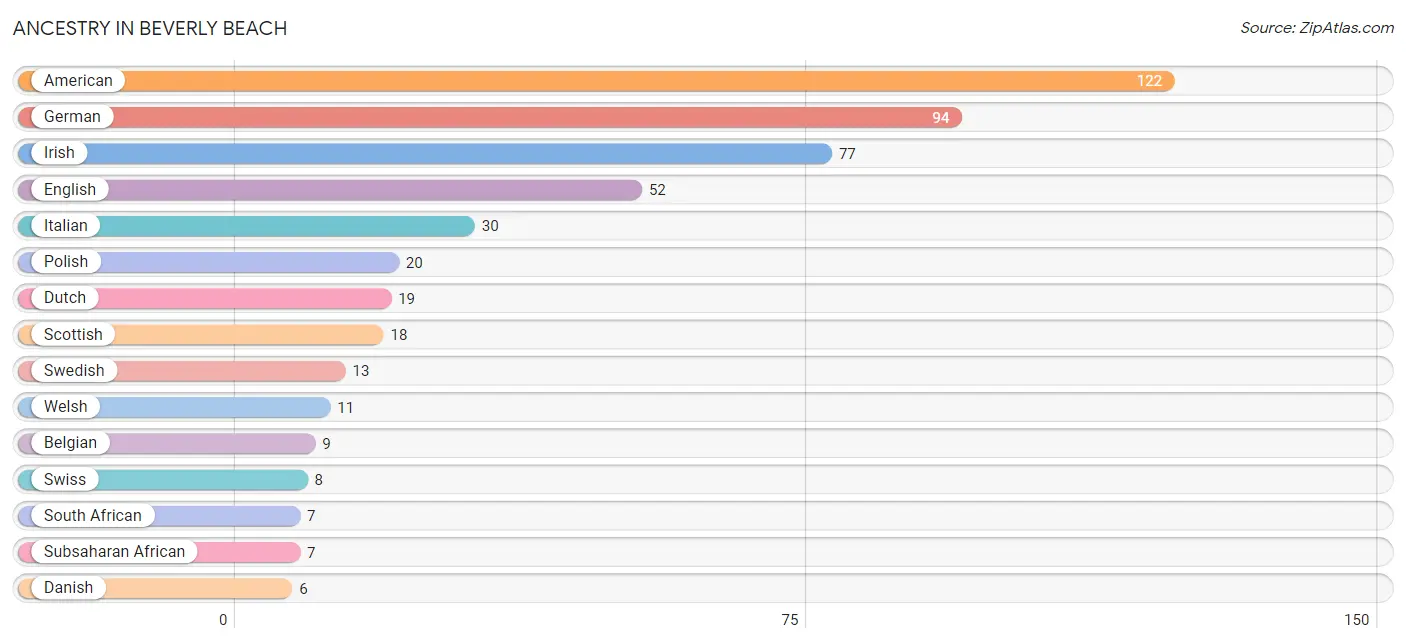
| Ancestry | # Population | % Population |
| American | 122 | 24.6% |
| Belgian | 9 | 1.8% |
| Central American | 4 | 0.8% |
| Danish | 6 | 1.2% |
| Dutch | 19 | 3.8% |
| English | 52 | 10.5% |
| European | 4 | 0.8% |
| French | 5 | 1.0% |
| French Canadian | 5 | 1.0% |
| German | 94 | 19.0% |
| Honduran | 4 | 0.8% |
| Hungarian | 3 | 0.6% |
| Iranian | 3 | 0.6% |
| Irish | 77 | 15.6% |
| Italian | 30 | 6.1% |
| Northern European | 2 | 0.4% |
| Polish | 20 | 4.0% |
| Puerto Rican | 2 | 0.4% |
| Russian | 2 | 0.4% |
| Scotch-Irish | 5 | 1.0% |
| Scottish | 18 | 3.6% |
| South African | 7 | 1.4% |
| Subsaharan African | 7 | 1.4% |
| Swedish | 13 | 2.6% |
| Swiss | 8 | 1.6% |
| Ukrainian | 2 | 0.4% |
| Welsh | 11 | 2.2% | View All 27 Rows |
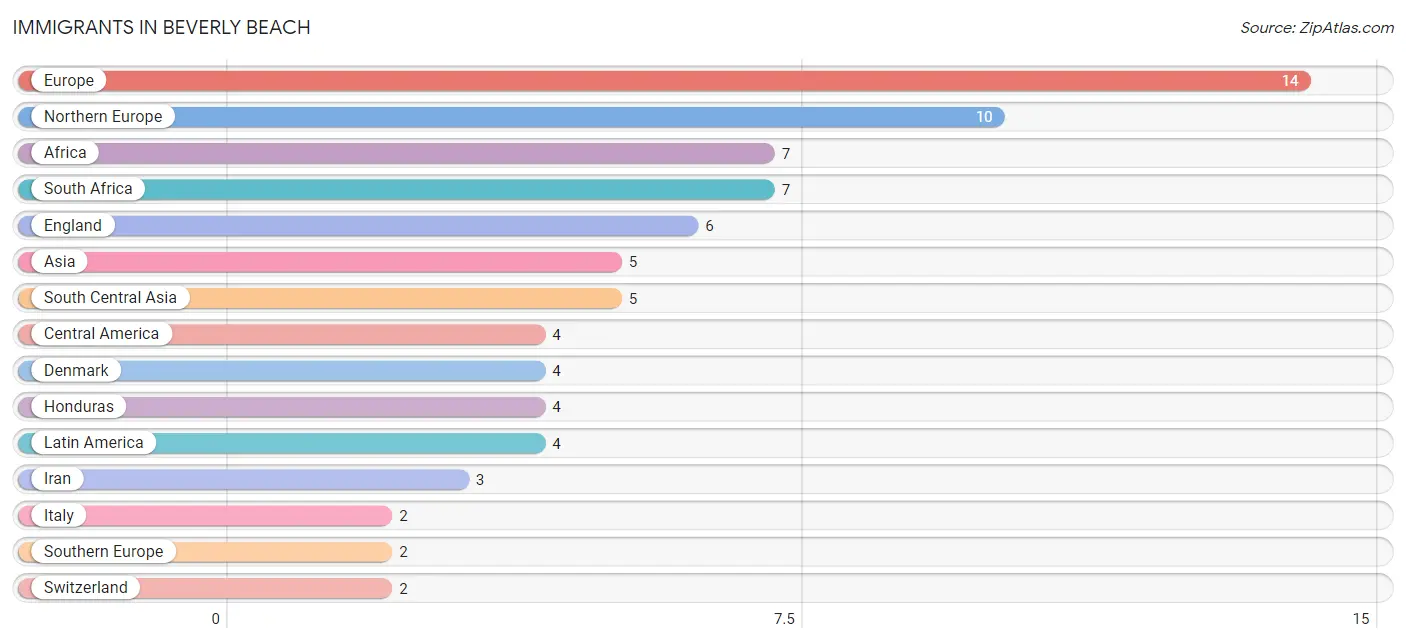
Immigrants in Beverly Beach
The most numerous immigrant groups reported in Beverly Beach came from Europe (14 | 2.8%), Northern Europe (10 | 2.0%), Africa (7 | 1.4%), South Africa (7 | 1.4%), and England (6 | 1.2%), together accounting for 8.9% of all Beverly Beach residents.
| Immigration Origin | # Population | % Population |
| Africa | 7 | 1.4% |
| Asia | 5 | 1.0% |
| Central America | 4 | 0.8% |
| Denmark | 4 | 0.8% |
| England | 6 | 1.2% |
| Europe | 14 | 2.8% |
| Honduras | 4 | 0.8% |
| Iran | 3 | 0.6% |
| Italy | 2 | 0.4% |
| Latin America | 4 | 0.8% |
| Northern Europe | 10 | 2.0% |
| South Africa | 7 | 1.4% |
| South Central Asia | 5 | 1.0% |
| Southern Europe | 2 | 0.4% |
| Switzerland | 2 | 0.4% |
| Uzbekistan | 2 | 0.4% |
| Western Europe | 2 | 0.4% | View All 17 Rows |
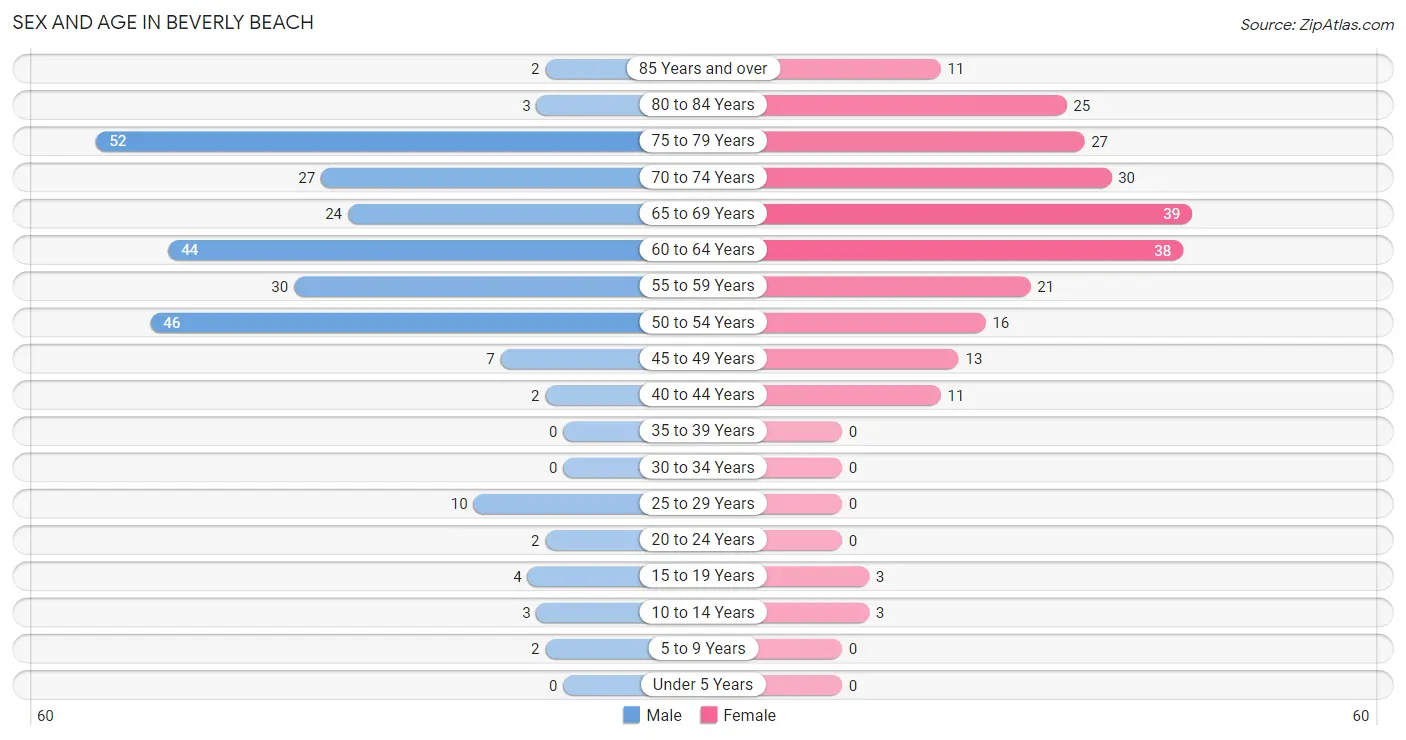
Sex and Age in Beverly Beach
Sex and Age in Beverly Beach
The most populous age groups in Beverly Beach are 75 to 79 Years (52 | 20.2%) for men and 65 to 69 Years (39 | 16.5%) for women.
| Age Bracket | Male | Female |
| Under 5 Years | 0 (0.0%) | 0 (0.0%) |
| 5 to 9 Years | 2 (0.8%) | 0 (0.0%) |
| 10 to 14 Years | 3 (1.2%) | 3 (1.3%) |
| 15 to 19 Years | 4 (1.5%) | 3 (1.3%) |
| 20 to 24 Years | 2 (0.8%) | 0 (0.0%) |
| 25 to 29 Years | 10 (3.9%) | 0 (0.0%) |
| 30 to 34 Years | 0 (0.0%) | 0 (0.0%) |
| 35 to 39 Years | 0 (0.0%) | 0 (0.0%) |
| 40 to 44 Years | 2 (0.8%) | 11 (4.6%) |
| 45 to 49 Years | 7 (2.7%) | 13 (5.5%) |
| 50 to 54 Years | 46 (17.8%) | 16 (6.8%) |
| 55 to 59 Years | 30 (11.6%) | 21 (8.9%) |
| 60 to 64 Years | 44 (17.1%) | 38 (16.0%) |
| 65 to 69 Years | 24 (9.3%) | 39 (16.5%) |
| 70 to 74 Years | 27 (10.5%) | 30 (12.7%) |
| 75 to 79 Years | 52 (20.2%) | 27 (11.4%) |
| 80 to 84 Years | 3 (1.2%) | 25 (10.5%) |
| 85 Years and over | 2 (0.8%) | 11 (4.6%) |
| Total | 258 (100.0%) | 237 (100.0%) |
Families and Households in Beverly Beach
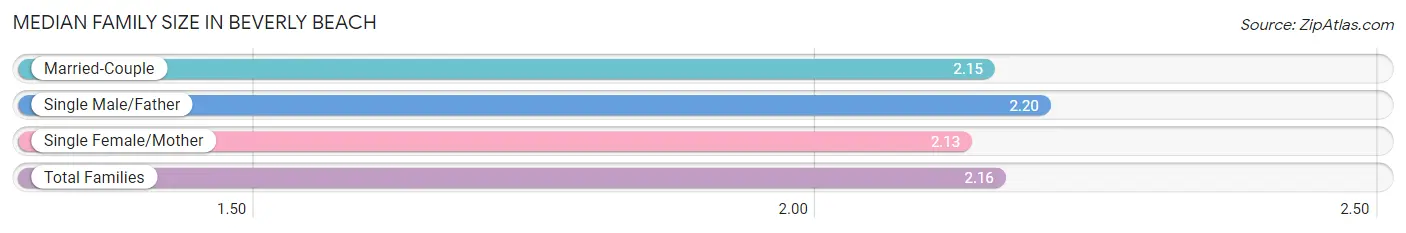
Median Family Size in Beverly Beach
The median family size in Beverly Beach is 2.16 persons per family, with single male/father families (10 | 6.2%) accounting for the largest median family size of 2.2 persons per family. On the other hand, single female/mother families (8 | 5.0%) represent the smallest median family size with 2.13 persons per family.
| Family Type | # Families | Family Size |
| Married-Couple | 142 (88.7%) | 2.15 |
| Single Male/Father | 10 (6.2%) | 2.20 |
| Single Female/Mother | 8 (5.0%) | 2.13 |
| Total Families | 160 (100.0%) | 2.16 |
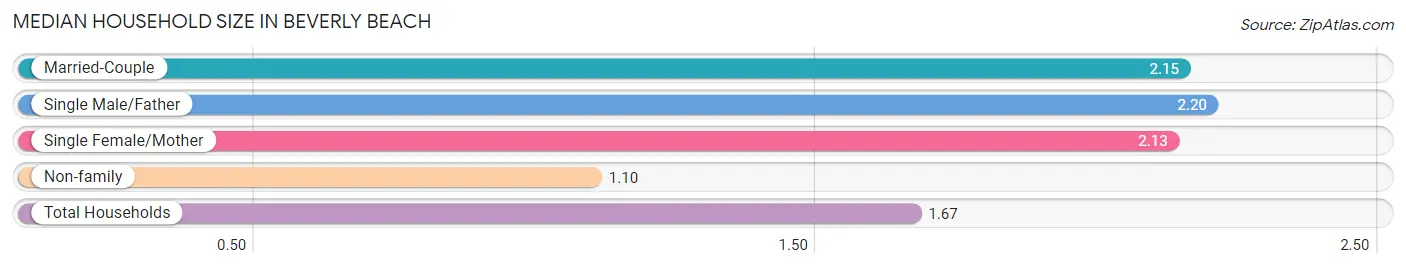
Median Household Size in Beverly Beach
The median household size in Beverly Beach is 1.67 persons per household, with single male/father households (10 | 3.4%) accounting for the largest median household size of 2.2 persons per household. non-family households (136 | 46.0%) represent the smallest median household size with 1.10 persons per household.
| Household Type | # Households | Household Size |
| Married-Couple | 142 (48.0%) | 2.15 |
| Single Male/Father | 10 (3.4%) | 2.20 |
| Single Female/Mother | 8 (2.7%) | 2.13 |
| Non-family | 136 (46.0%) | 1.10 |
| Total Households | 296 (100.0%) | 1.67 |
Household Size by Marriage Status in Beverly Beach
Out of a total of 296 households in Beverly Beach, 160 (54.0%) are family households, while 136 (46.0%) are nonfamily households. The most numerous type of family households are 2-person households, comprising 146, and the most common type of nonfamily households are 1-person households, comprising 119.
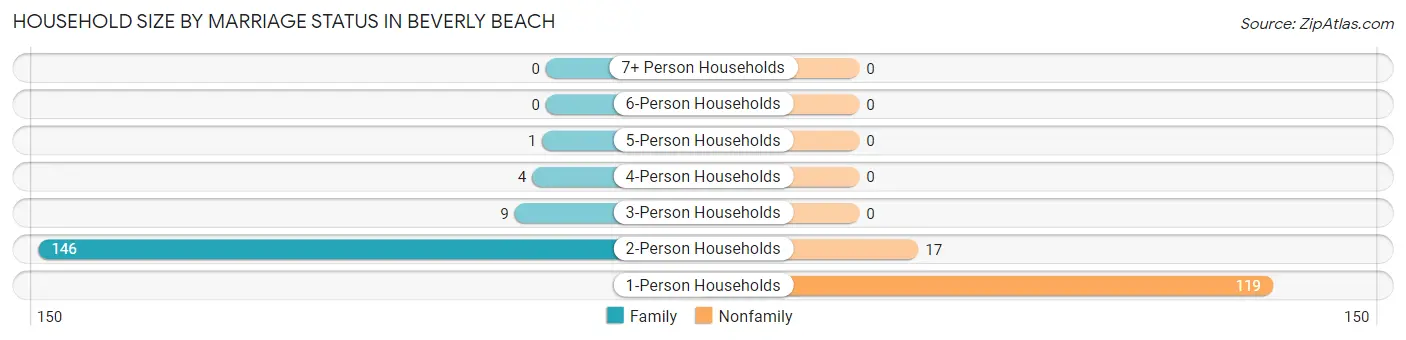
| Household Size | Family Households | Nonfamily Households |
| 1-Person Households | - | 119 (40.2%) |
| 2-Person Households | 146 (49.3%) | 17 (5.7%) |
| 3-Person Households | 9 (3.0%) | 0 (0.0%) |
| 4-Person Households | 4 (1.3%) | 0 (0.0%) |
| 5-Person Households | 1 (0.3%) | 0 (0.0%) |
| 6-Person Households | 0 (0.0%) | 0 (0.0%) |
| 7+ Person Households | 0 (0.0%) | 0 (0.0%) |
| Total | 160 (54.0%) | 136 (46.0%) |
Female Fertility in Beverly Beach
Fertility by Age in Beverly Beach
| Age Bracket | Women with Births | Births / 1,000 Women |
| 15 to 19 years | 0 (0.0%) | 0.0 |
| 20 to 34 years | 0 (0.0%) | 0.0 |
| 35 to 50 years | 0 (0.0%) | 0.0 |
| Total | 0 (0.0%) | 0.0 |
Fertility by Age by Marriage Status in Beverly Beach
| Age Bracket | Married | Unmarried |
| 15 to 19 years | 0 (0.0%) | 0 (0.0%) |
| 20 to 34 years | 0 (0.0%) | 0 (0.0%) |
| 35 to 50 years | 0 (0.0%) | 0 (0.0%) |
| Total | 0 (0.0%) | 0 (0.0%) |
Fertility by Education in Beverly Beach
| Educational Attainment | Women with Births | Births / 1,000 Women |
| Less than High School | 0 (0.0%) | 0.0 |
| High School Diploma | 0 (0.0%) | 0.0 |
| College or Associate's Degree | 0 (0.0%) | 0.0 |
| Bachelor's Degree | 0 (0.0%) | 0.0 |
| Graduate Degree | 0 (0.0%) | 0.0 |
| Total | 0 (0.0%) | 0.0 |
Fertility by Education by Marriage Status in Beverly Beach
| Educational Attainment | Married | Unmarried |
| Less than High School | 0 (0.0%) | 0 (0.0%) |
| High School Diploma | 0 (0.0%) | 0 (0.0%) |
| College or Associate's Degree | 0 (0.0%) | 0 (0.0%) |
| Bachelor's Degree | 0 (0.0%) | 0 (0.0%) |
| Graduate Degree | 0 (0.0%) | 0 (0.0%) |
| Total | 0 (0.0%) | 0 (0.0%) |
Employment Characteristics in Beverly Beach
Employment by Class of Employer in Beverly Beach
Among the 168 employed individuals in Beverly Beach, private company employees (96 | 57.1%), self-employed (not incorporated) (42 | 25.0%), and not-for-profit organizations (16 | 9.5%) make up the most common classes of employment.
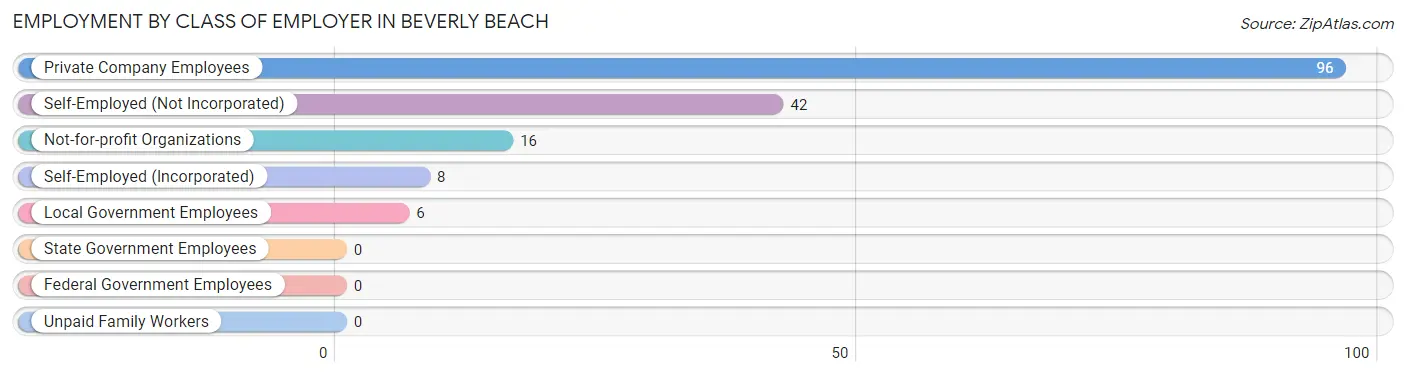
| Employer Class | # Employees | % Employees |
| Private Company Employees | 96 | 57.1% |
| Self-Employed (Incorporated) | 8 | 4.8% |
| Self-Employed (Not Incorporated) | 42 | 25.0% |
| Not-for-profit Organizations | 16 | 9.5% |
| Local Government Employees | 6 | 3.6% |
| State Government Employees | 0 | 0.0% |
| Federal Government Employees | 0 | 0.0% |
| Unpaid Family Workers | 0 | 0.0% |
| Total | 168 | 100.0% |
Employment Status by Age in Beverly Beach
According to the labor force statistics for Beverly Beach, out of the total population over 16 years of age (483), 36.2% or 175 individuals are in the labor force, with 4.0% or 7 of them unemployed. The age group with the highest labor force participation rate is 25 to 29 years, with 100.0% or 10 individuals in the labor force. Within the labor force, the 65 to 74 years age range has the highest percentage of unemployed individuals, with 31.8% or 7 of them being unemployed.
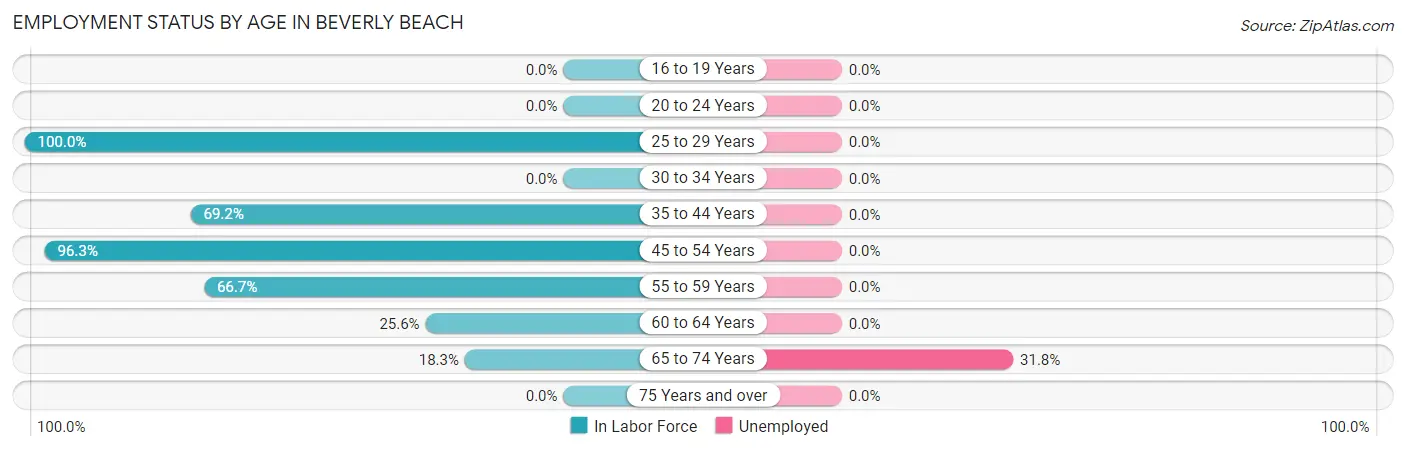
| Age Bracket | In Labor Force | Unemployed |
| 16 to 19 Years | 0 (0.0%) | 0 (0.0%) |
| 20 to 24 Years | 0 (0.0%) | 0 (0.0%) |
| 25 to 29 Years | 10 (100.0%) | 0 (0.0%) |
| 30 to 34 Years | 0 (0.0%) | 0 (0.0%) |
| 35 to 44 Years | 9 (69.2%) | 0 (0.0%) |
| 45 to 54 Years | 79 (96.3%) | 0 (0.0%) |
| 55 to 59 Years | 34 (66.7%) | 0 (0.0%) |
| 60 to 64 Years | 21 (25.6%) | 0 (0.0%) |
| 65 to 74 Years | 22 (18.3%) | 7 (31.8%) |
| 75 Years and over | 0 (0.0%) | 0 (0.0%) |
| Total | 175 (36.2%) | 7 (4.0%) |
Employment Status by Educational Attainment in Beverly Beach
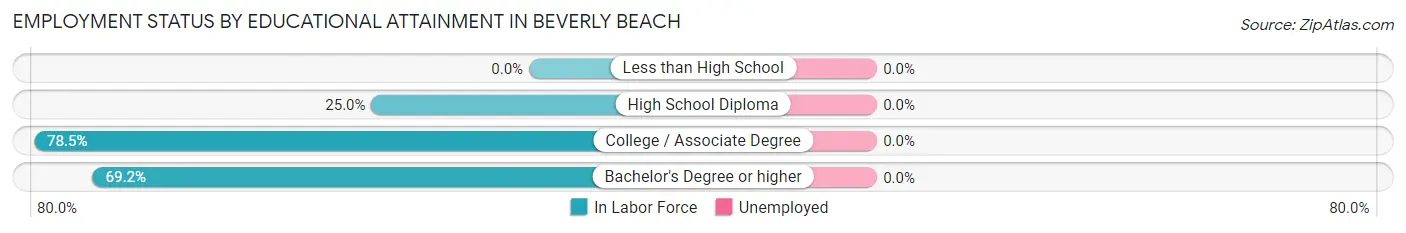
| Educational Attainment | In Labor Force | Unemployed |
| Less than High School | 0 (0.0%) | 0 (0.0%) |
| High School Diploma | 10 (25.0%) | 0 (0.0%) |
| College / Associate Degree | 51 (78.5%) | 0 (0.0%) |
| Bachelor's Degree or higher | 92 (69.2%) | 0 (0.0%) |
| Total | 153 (64.3%) | 0 (0.0%) |
Employment Occupations by Sex in Beverly Beach
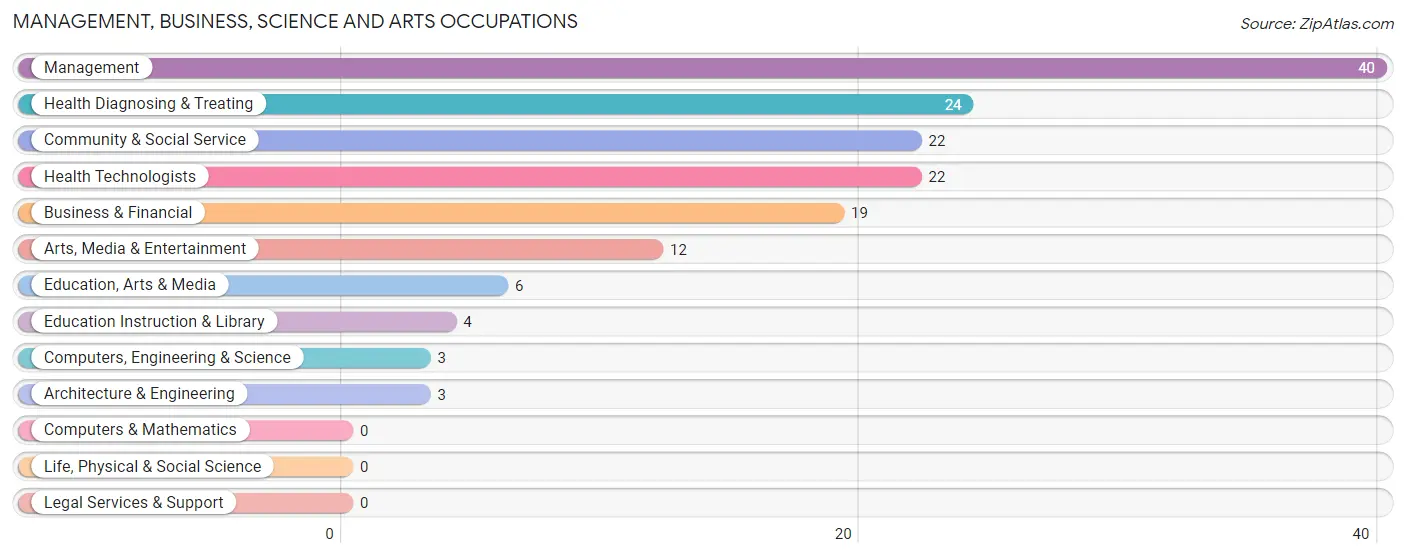
Management, Business, Science and Arts Occupations
The most common Management, Business, Science and Arts occupations in Beverly Beach are Management (40 | 23.8%), Health Diagnosing & Treating (24 | 14.3%), Community & Social Service (22 | 13.1%), Health Technologists (22 | 13.1%), and Business & Financial (19 | 11.3%).
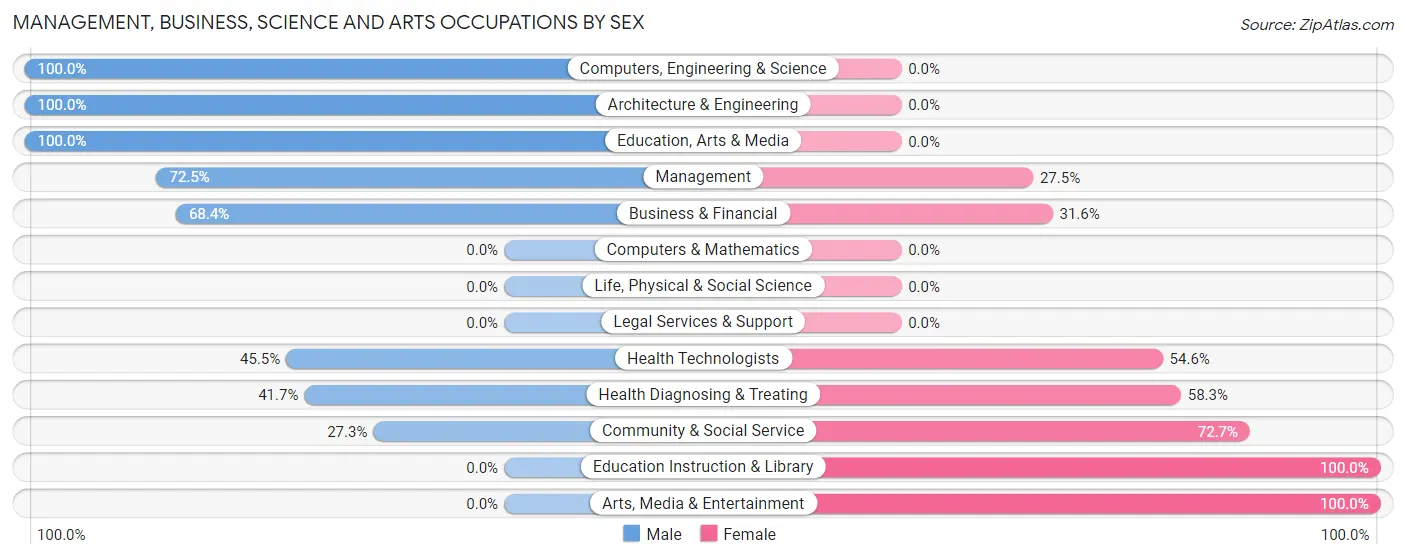
Management, Business, Science and Arts Occupations by Sex
Within the Management, Business, Science and Arts occupations in Beverly Beach, the most male-oriented occupations are Computers, Engineering & Science (100.0%), Architecture & Engineering (100.0%), and Education, Arts & Media (100.0%), while the most female-oriented occupations are Education Instruction & Library (100.0%), Arts, Media & Entertainment (100.0%), and Community & Social Service (72.7%).
| Occupation | Male | Female |
| Management | 29 (72.5%) | 11 (27.5%) |
| Business & Financial | 13 (68.4%) | 6 (31.6%) |
| Computers, Engineering & Science | 3 (100.0%) | 0 (0.0%) |
| Computers & Mathematics | 0 (0.0%) | 0 (0.0%) |
| Architecture & Engineering | 3 (100.0%) | 0 (0.0%) |
| Life, Physical & Social Science | 0 (0.0%) | 0 (0.0%) |
| Community & Social Service | 6 (27.3%) | 16 (72.7%) |
| Education, Arts & Media | 6 (100.0%) | 0 (0.0%) |
| Legal Services & Support | 0 (0.0%) | 0 (0.0%) |
| Education Instruction & Library | 0 (0.0%) | 4 (100.0%) |
| Arts, Media & Entertainment | 0 (0.0%) | 12 (100.0%) |
| Health Diagnosing & Treating | 10 (41.7%) | 14 (58.3%) |
| Health Technologists | 10 (45.5%) | 12 (54.5%) |
| Total (Category) | 61 (56.5%) | 47 (43.5%) |
| Total (Overall) | 100 (59.5%) | 68 (40.5%) |
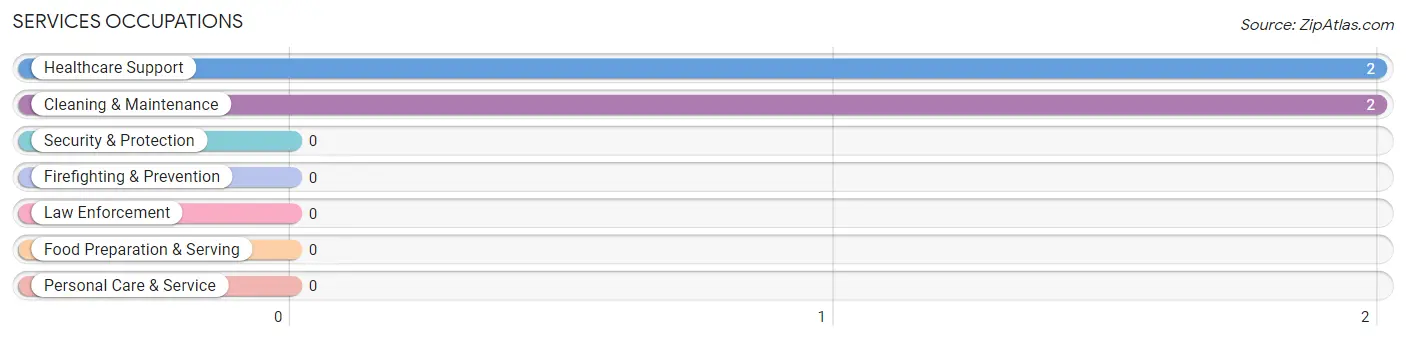
Services Occupations
The most common Services occupations in Beverly Beach are Healthcare Support (2 | 1.2%), and Cleaning & Maintenance (2 | 1.2%).
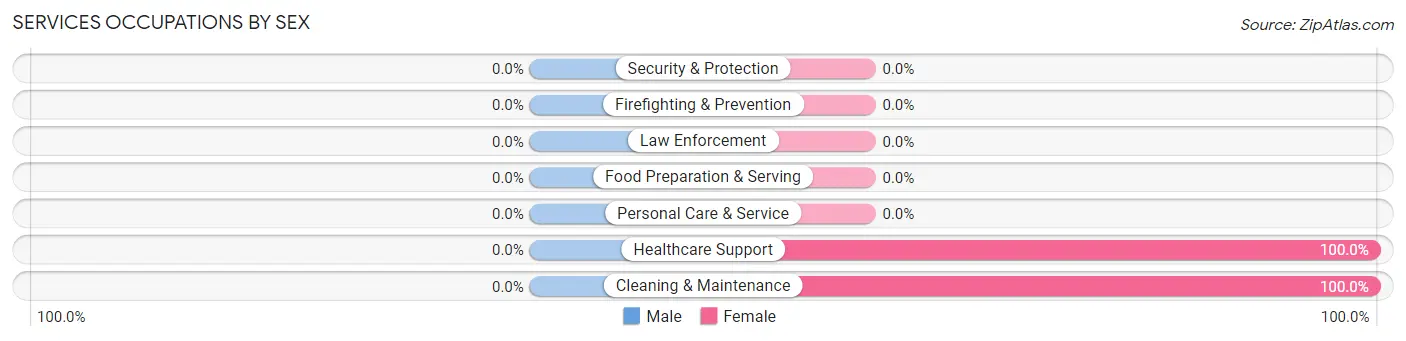
Services Occupations by Sex
| Occupation | Male | Female |
| Healthcare Support | 0 (0.0%) | 2 (100.0%) |
| Security & Protection | 0 (0.0%) | 0 (0.0%) |
| Firefighting & Prevention | 0 (0.0%) | 0 (0.0%) |
| Law Enforcement | 0 (0.0%) | 0 (0.0%) |
| Food Preparation & Serving | 0 (0.0%) | 0 (0.0%) |
| Cleaning & Maintenance | 0 (0.0%) | 2 (100.0%) |
| Personal Care & Service | 0 (0.0%) | 0 (0.0%) |
| Total (Category) | 0 (0.0%) | 4 (100.0%) |
| Total (Overall) | 100 (59.5%) | 68 (40.5%) |
Sales and Office Occupations
The most common Sales and Office occupations in Beverly Beach are Sales & Related (19 | 11.3%), and Office & Administration (9 | 5.4%).
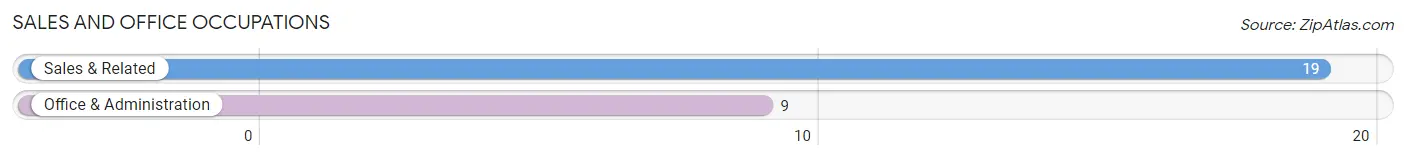
Sales and Office Occupations by Sex
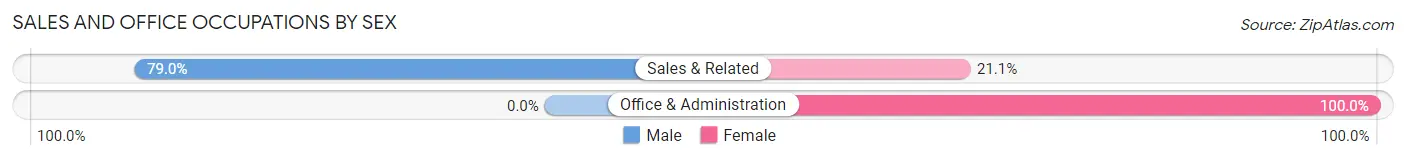
| Occupation | Male | Female |
| Sales & Related | 15 (78.9%) | 4 (21.0%) |
| Office & Administration | 0 (0.0%) | 9 (100.0%) |
| Total (Category) | 15 (53.6%) | 13 (46.4%) |
| Total (Overall) | 100 (59.5%) | 68 (40.5%) |
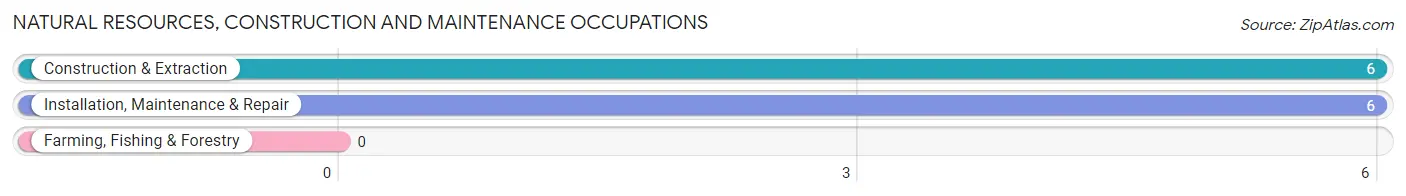
Natural Resources, Construction and Maintenance Occupations
The most common Natural Resources, Construction and Maintenance occupations in Beverly Beach are Construction & Extraction (6 | 3.6%), and Installation, Maintenance & Repair (6 | 3.6%).
Natural Resources, Construction and Maintenance Occupations by Sex
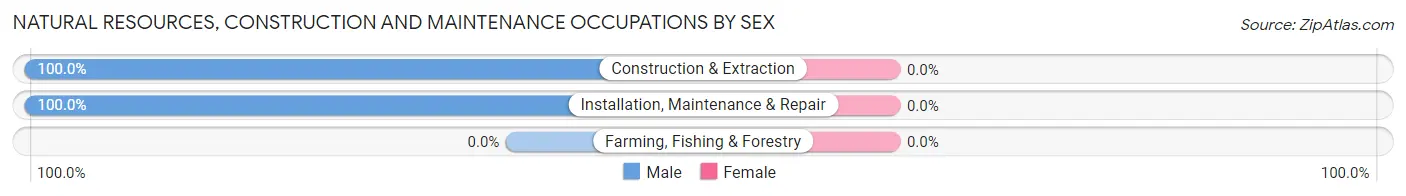
| Occupation | Male | Female |
| Farming, Fishing & Forestry | 0 (0.0%) | 0 (0.0%) |
| Construction & Extraction | 6 (100.0%) | 0 (0.0%) |
| Installation, Maintenance & Repair | 6 (100.0%) | 0 (0.0%) |
| Total (Category) | 12 (100.0%) | 0 (0.0%) |
| Total (Overall) | 100 (59.5%) | 68 (40.5%) |
Production, Transportation and Moving Occupations
The most common Production, Transportation and Moving occupations in Beverly Beach are Production (12 | 7.1%), and Transportation (4 | 2.4%).
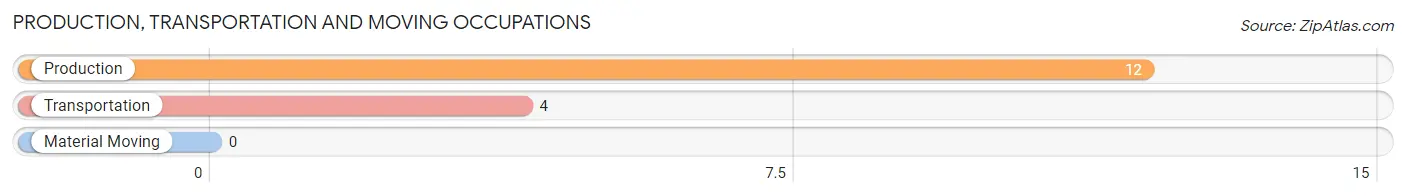
Production, Transportation and Moving Occupations by Sex
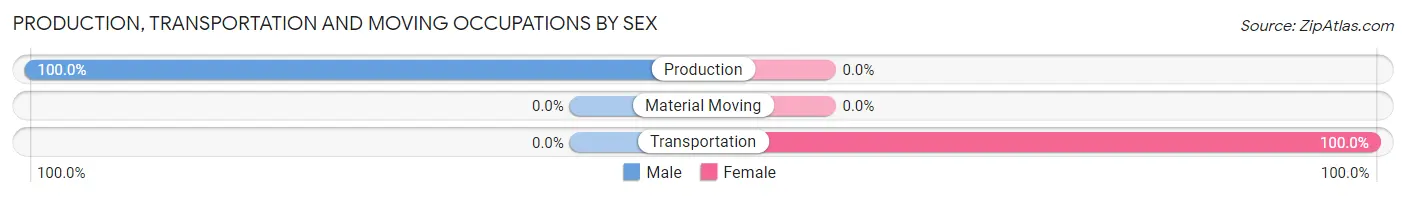
| Occupation | Male | Female |
| Production | 12 (100.0%) | 0 (0.0%) |
| Transportation | 0 (0.0%) | 4 (100.0%) |
| Material Moving | 0 (0.0%) | 0 (0.0%) |
| Total (Category) | 12 (75.0%) | 4 (25.0%) |
| Total (Overall) | 100 (59.5%) | 68 (40.5%) |
Employment Industries by Sex in Beverly Beach
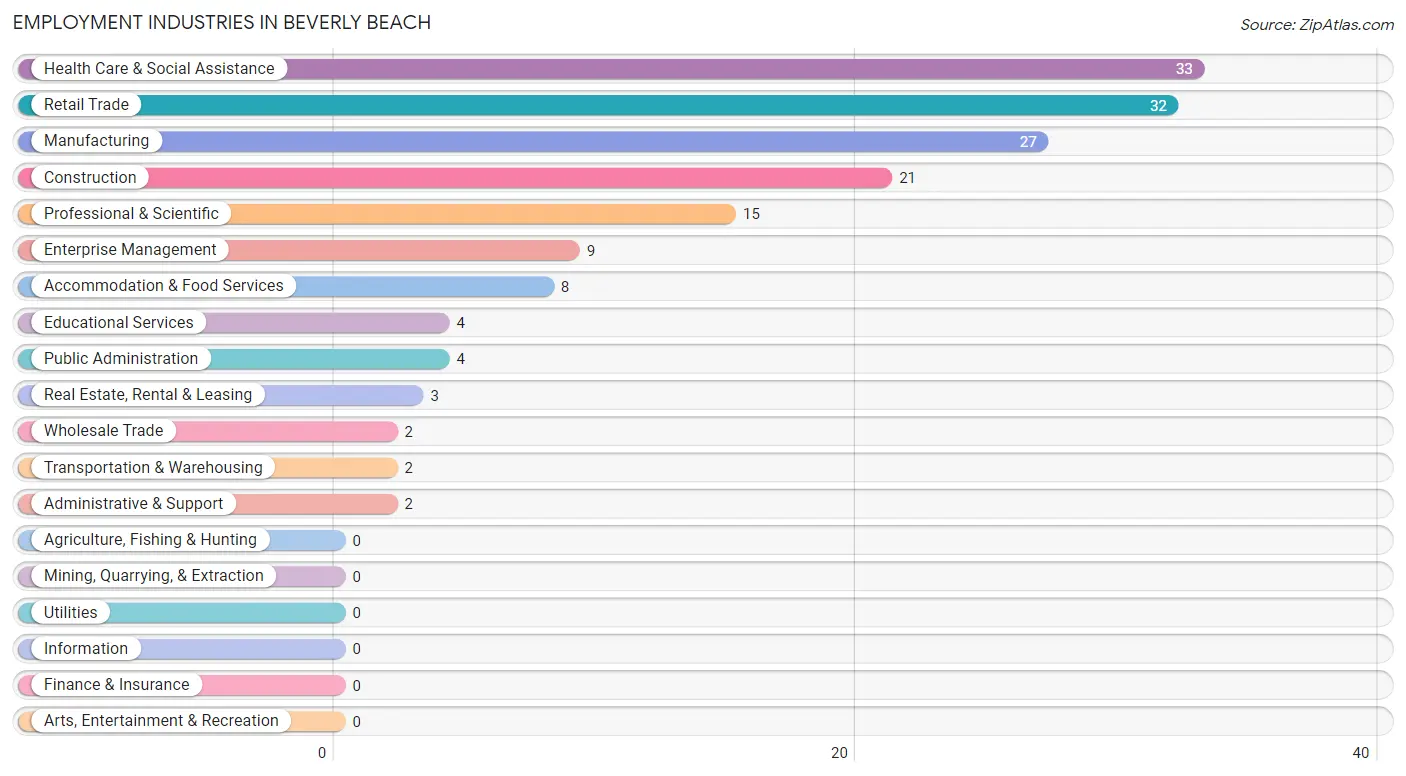
Employment Industries in Beverly Beach
The major employment industries in Beverly Beach include Health Care & Social Assistance (33 | 19.6%), Retail Trade (32 | 19.1%), Manufacturing (27 | 16.1%), Construction (21 | 12.5%), and Professional & Scientific (15 | 8.9%).
Employment Industries by Sex in Beverly Beach
The Beverly Beach industries that see more men than women are Wholesale Trade (100.0%), Transportation & Warehousing (100.0%), and Real Estate, Rental & Leasing (100.0%), whereas the industries that tend to have a higher number of women are Administrative & Support (100.0%), Educational Services (100.0%), and Health Care & Social Assistance (69.7%).
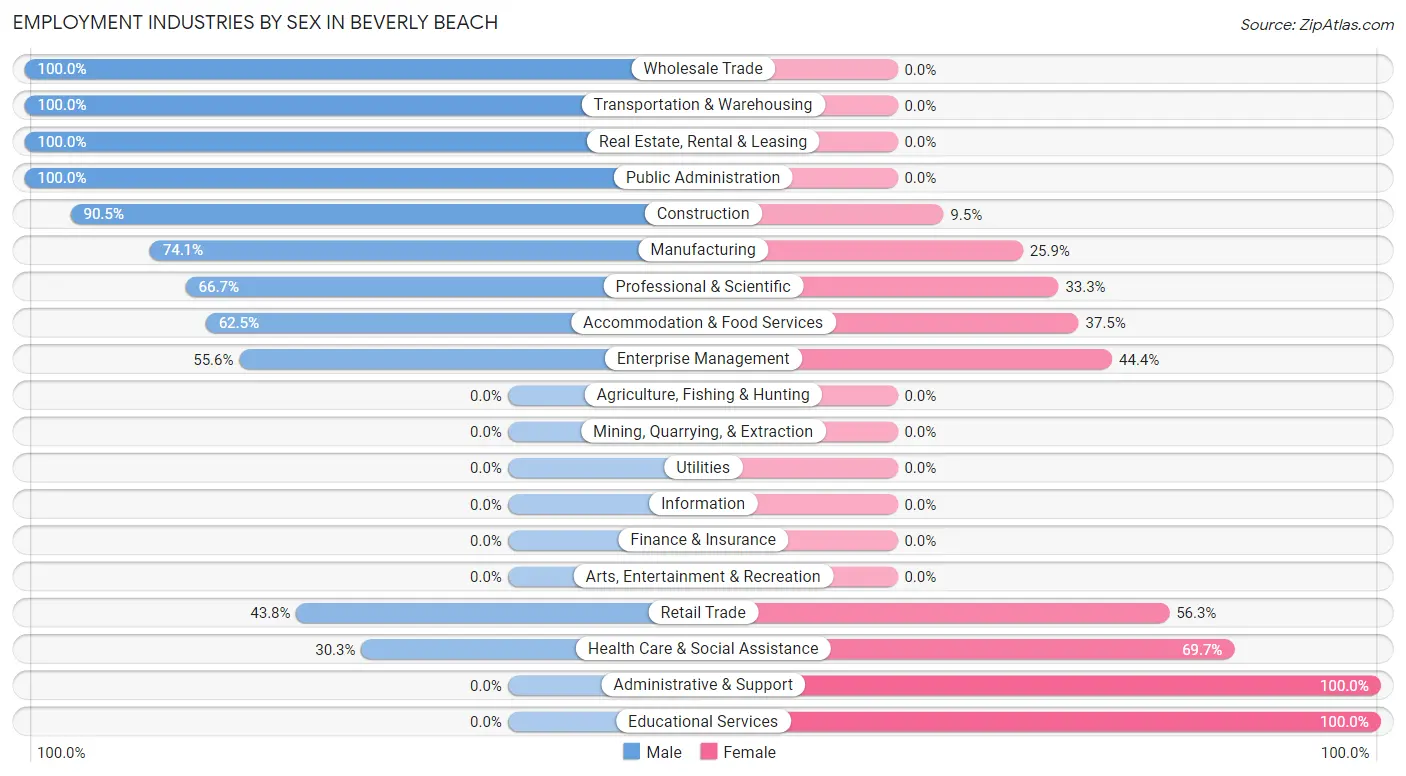
| Industry | Male | Female |
| Agriculture, Fishing & Hunting | 0 (0.0%) | 0 (0.0%) |
| Mining, Quarrying, & Extraction | 0 (0.0%) | 0 (0.0%) |
| Construction | 19 (90.5%) | 2 (9.5%) |
| Manufacturing | 20 (74.1%) | 7 (25.9%) |
| Wholesale Trade | 2 (100.0%) | 0 (0.0%) |
| Retail Trade | 14 (43.8%) | 18 (56.2%) |
| Transportation & Warehousing | 2 (100.0%) | 0 (0.0%) |
| Utilities | 0 (0.0%) | 0 (0.0%) |
| Information | 0 (0.0%) | 0 (0.0%) |
| Finance & Insurance | 0 (0.0%) | 0 (0.0%) |
| Real Estate, Rental & Leasing | 3 (100.0%) | 0 (0.0%) |
| Professional & Scientific | 10 (66.7%) | 5 (33.3%) |
| Enterprise Management | 5 (55.6%) | 4 (44.4%) |
| Administrative & Support | 0 (0.0%) | 2 (100.0%) |
| Educational Services | 0 (0.0%) | 4 (100.0%) |
| Health Care & Social Assistance | 10 (30.3%) | 23 (69.7%) |
| Arts, Entertainment & Recreation | 0 (0.0%) | 0 (0.0%) |
| Accommodation & Food Services | 5 (62.5%) | 3 (37.5%) |
| Public Administration | 4 (100.0%) | 0 (0.0%) |
| Total | 100 (59.5%) | 68 (40.5%) |
Education in Beverly Beach
School Enrollment in Beverly Beach
The most common levels of schooling among the 22 students in Beverly Beach are middle school (5 | 22.7%), college / undergraduate (5 | 22.7%), and graduate / professional (5 | 22.7%).
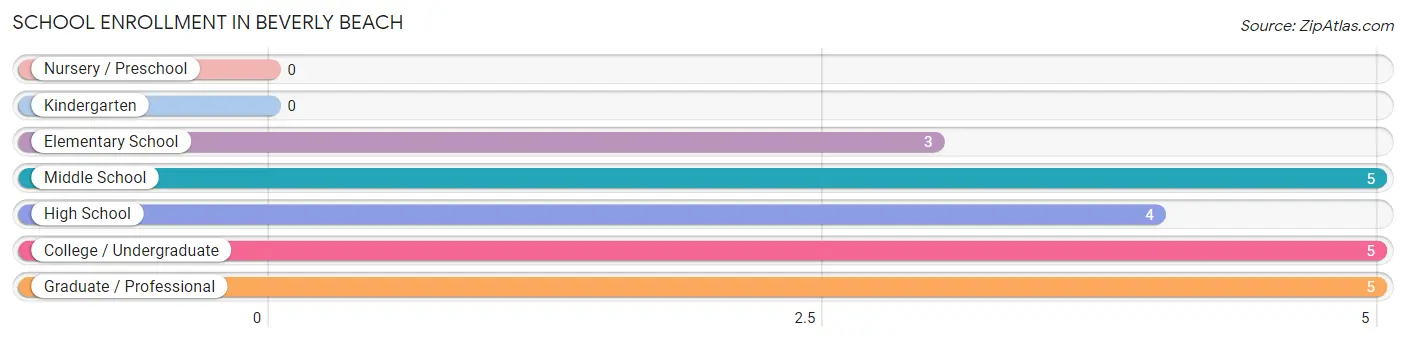
| School Level | # Students | % Students |
| Nursery / Preschool | 0 | 0.0% |
| Kindergarten | 0 | 0.0% |
| Elementary School | 3 | 13.6% |
| Middle School | 5 | 22.7% |
| High School | 4 | 18.2% |
| College / Undergraduate | 5 | 22.7% |
| Graduate / Professional | 5 | 22.7% |
| Total | 22 | 100.0% |
School Enrollment by Age by Funding Source in Beverly Beach
Out of a total of 22 students who are enrolled in schools in Beverly Beach, 5 (22.7%) attend a private institution, while the remaining 17 (77.3%) are enrolled in public schools. The age group of 5 to 9 year old has the highest likelihood of being enrolled in private schools, with 2 (100.0% in the age bracket) enrolled. Conversely, the age group of 35 years and over has the lowest likelihood of being enrolled in a private school, with 7 (100.0% in the age bracket) attending a public institution.
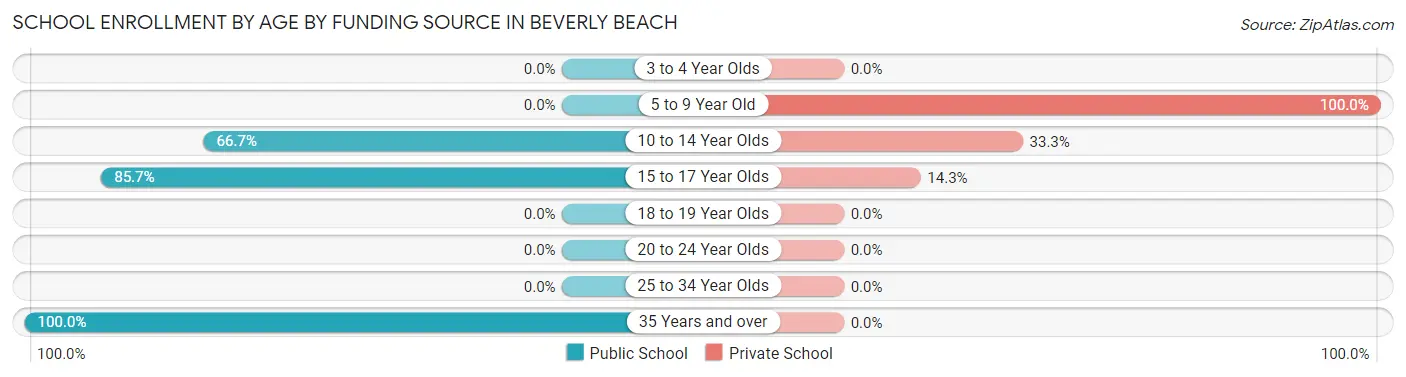
| Age Bracket | Public School | Private School |
| 3 to 4 Year Olds | 0 (0.0%) | 0 (0.0%) |
| 5 to 9 Year Old | 0 (0.0%) | 2 (100.0%) |
| 10 to 14 Year Olds | 4 (66.7%) | 2 (33.3%) |
| 15 to 17 Year Olds | 6 (85.7%) | 1 (14.3%) |
| 18 to 19 Year Olds | 0 (0.0%) | 0 (0.0%) |
| 20 to 24 Year Olds | 0 (0.0%) | 0 (0.0%) |
| 25 to 34 Year Olds | 0 (0.0%) | 0 (0.0%) |
| 35 Years and over | 7 (100.0%) | 0 (0.0%) |
| Total | 17 (77.3%) | 5 (22.7%) |
Educational Attainment by Field of Study in Beverly Beach
Business (30 | 15.9%), education (20 | 10.6%), engineering (18 | 9.5%), science & technology (18 | 9.5%), and liberal arts & history (17 | 9.0%) are the most common fields of study among 189 individuals in Beverly Beach who have obtained a bachelor's degree or higher.
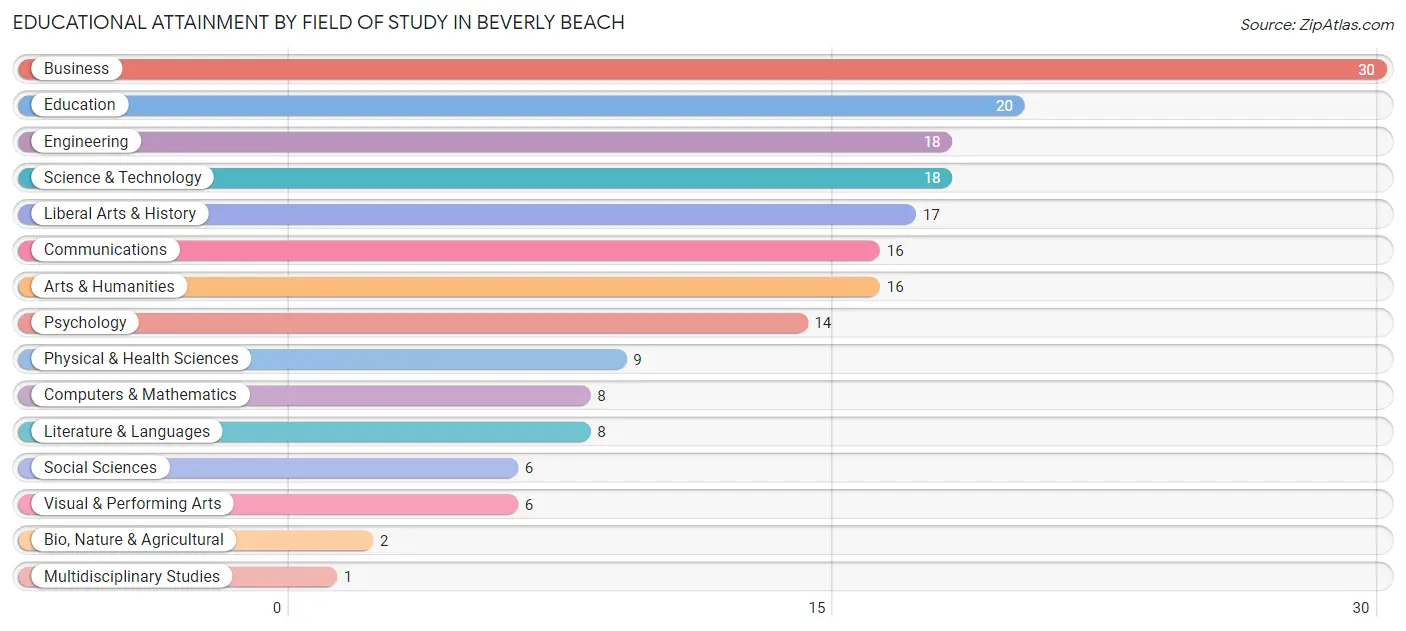
| Field of Study | # Graduates | % Graduates |
| Computers & Mathematics | 8 | 4.2% |
| Bio, Nature & Agricultural | 2 | 1.1% |
| Physical & Health Sciences | 9 | 4.8% |
| Psychology | 14 | 7.4% |
| Social Sciences | 6 | 3.2% |
| Engineering | 18 | 9.5% |
| Multidisciplinary Studies | 1 | 0.5% |
| Science & Technology | 18 | 9.5% |
| Business | 30 | 15.9% |
| Education | 20 | 10.6% |
| Literature & Languages | 8 | 4.2% |
| Liberal Arts & History | 17 | 9.0% |
| Visual & Performing Arts | 6 | 3.2% |
| Communications | 16 | 8.5% |
| Arts & Humanities | 16 | 8.5% |
| Total | 189 | 100.0% |
Transportation & Commute in Beverly Beach
Vehicle Availability by Sex in Beverly Beach
The most prevalent vehicle ownership categories in Beverly Beach are males with 2 vehicles (58, accounting for 58.0%) and females with 2 vehicles (50, making up 85.3%).
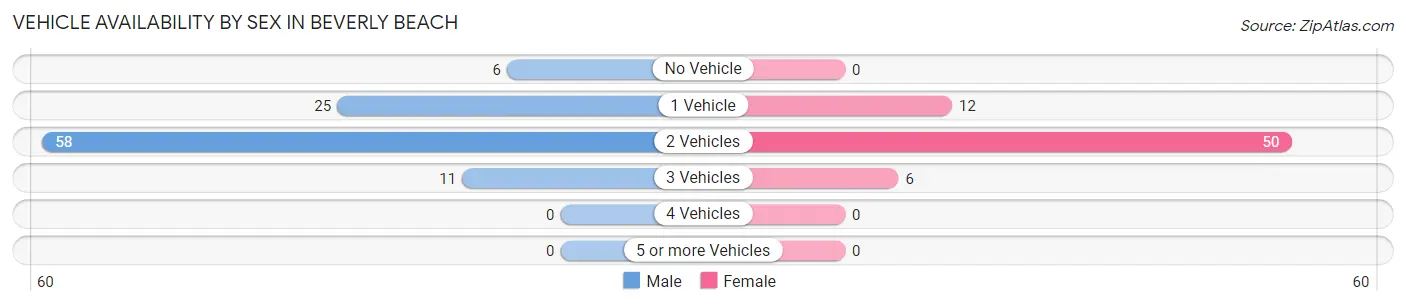
| Vehicles Available | Male | Female |
| No Vehicle | 6 (6.0%) | 0 (0.0%) |
| 1 Vehicle | 25 (25.0%) | 12 (17.6%) |
| 2 Vehicles | 58 (58.0%) | 50 (73.5%) |
| 3 Vehicles | 11 (11.0%) | 6 (8.8%) |
| 4 Vehicles | 0 (0.0%) | 0 (0.0%) |
| 5 or more Vehicles | 0 (0.0%) | 0 (0.0%) |
| Total | 100 (100.0%) | 68 (100.0%) |
Commute Time in Beverly Beach
The most frequently occuring commute durations in Beverly Beach are 30 to 34 minutes (25 commuters, 25.5%), 10 to 14 minutes (18 commuters, 18.4%), and 20 to 24 minutes (17 commuters, 17.3%).
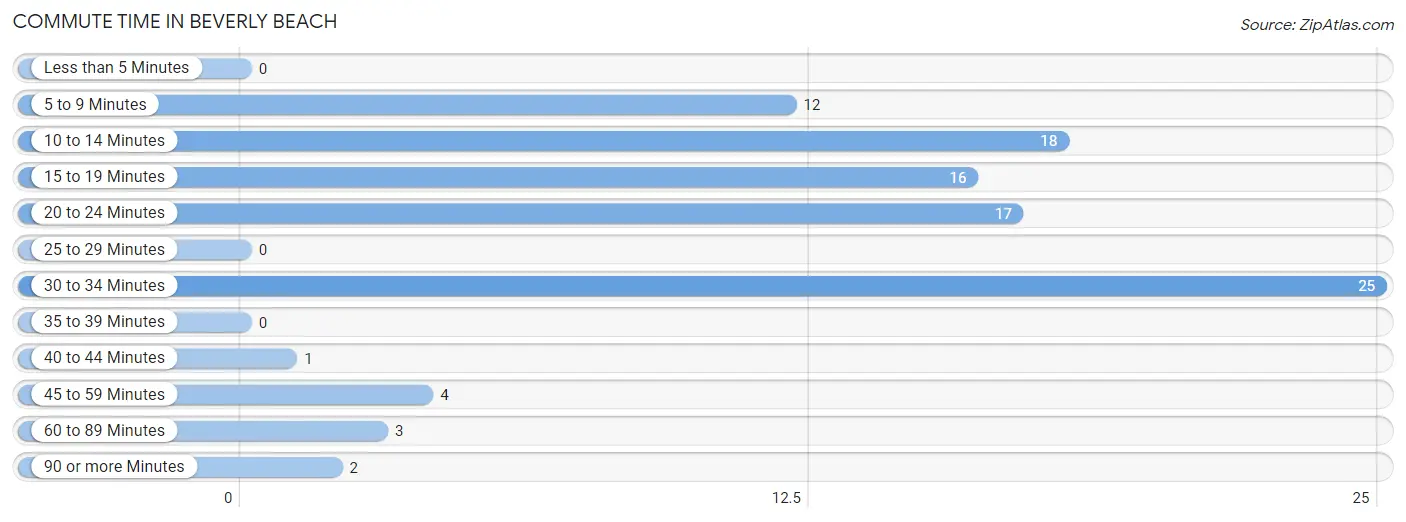
| Commute Time | # Commuters | % Commuters |
| Less than 5 Minutes | 0 | 0.0% |
| 5 to 9 Minutes | 12 | 12.2% |
| 10 to 14 Minutes | 18 | 18.4% |
| 15 to 19 Minutes | 16 | 16.3% |
| 20 to 24 Minutes | 17 | 17.3% |
| 25 to 29 Minutes | 0 | 0.0% |
| 30 to 34 Minutes | 25 | 25.5% |
| 35 to 39 Minutes | 0 | 0.0% |
| 40 to 44 Minutes | 1 | 1.0% |
| 45 to 59 Minutes | 4 | 4.1% |
| 60 to 89 Minutes | 3 | 3.1% |
| 90 or more Minutes | 2 | 2.0% |
Commute Time by Sex in Beverly Beach
The most common commute times in Beverly Beach are 30 to 34 minutes (19 commuters, 30.2%) for males and 20 to 24 minutes (14 commuters, 40.0%) for females.
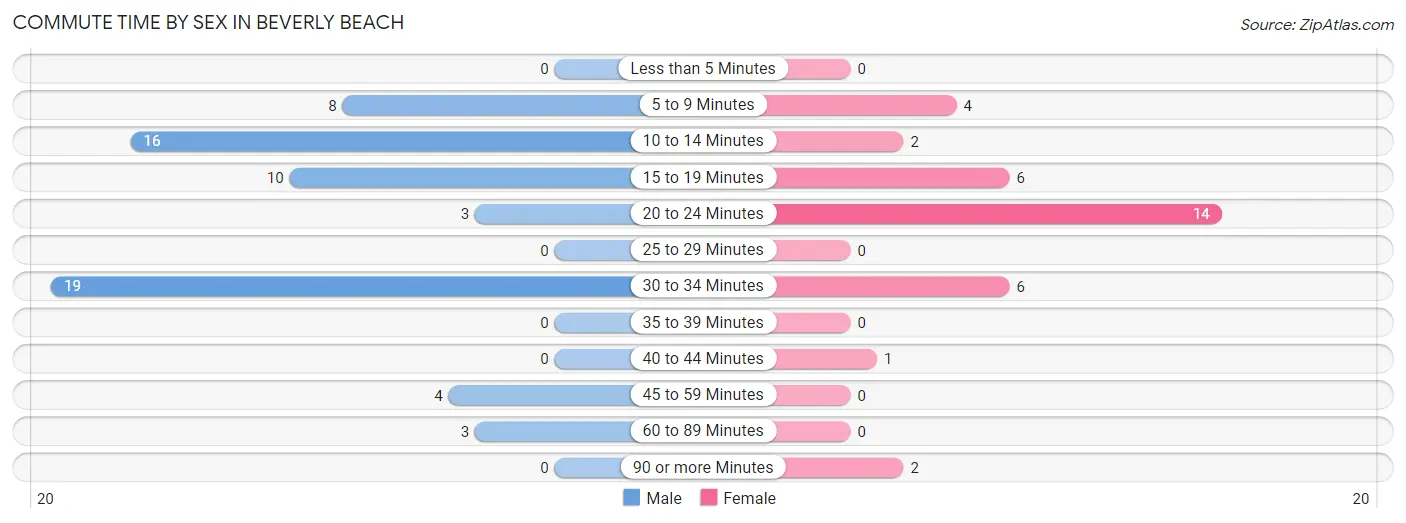
| Commute Time | Male | Female |
| Less than 5 Minutes | 0 (0.0%) | 0 (0.0%) |
| 5 to 9 Minutes | 8 (12.7%) | 4 (11.4%) |
| 10 to 14 Minutes | 16 (25.4%) | 2 (5.7%) |
| 15 to 19 Minutes | 10 (15.9%) | 6 (17.1%) |
| 20 to 24 Minutes | 3 (4.8%) | 14 (40.0%) |
| 25 to 29 Minutes | 0 (0.0%) | 0 (0.0%) |
| 30 to 34 Minutes | 19 (30.2%) | 6 (17.1%) |
| 35 to 39 Minutes | 0 (0.0%) | 0 (0.0%) |
| 40 to 44 Minutes | 0 (0.0%) | 1 (2.9%) |
| 45 to 59 Minutes | 4 (6.4%) | 0 (0.0%) |
| 60 to 89 Minutes | 3 (4.8%) | 0 (0.0%) |
| 90 or more Minutes | 0 (0.0%) | 2 (5.7%) |
Time of Departure to Work by Sex in Beverly Beach
The most frequent times of departure to work in Beverly Beach are 5:30 AM to 5:59 AM (17, 27.0%) for males and 8:00 AM to 8:29 AM (16, 45.7%) for females.
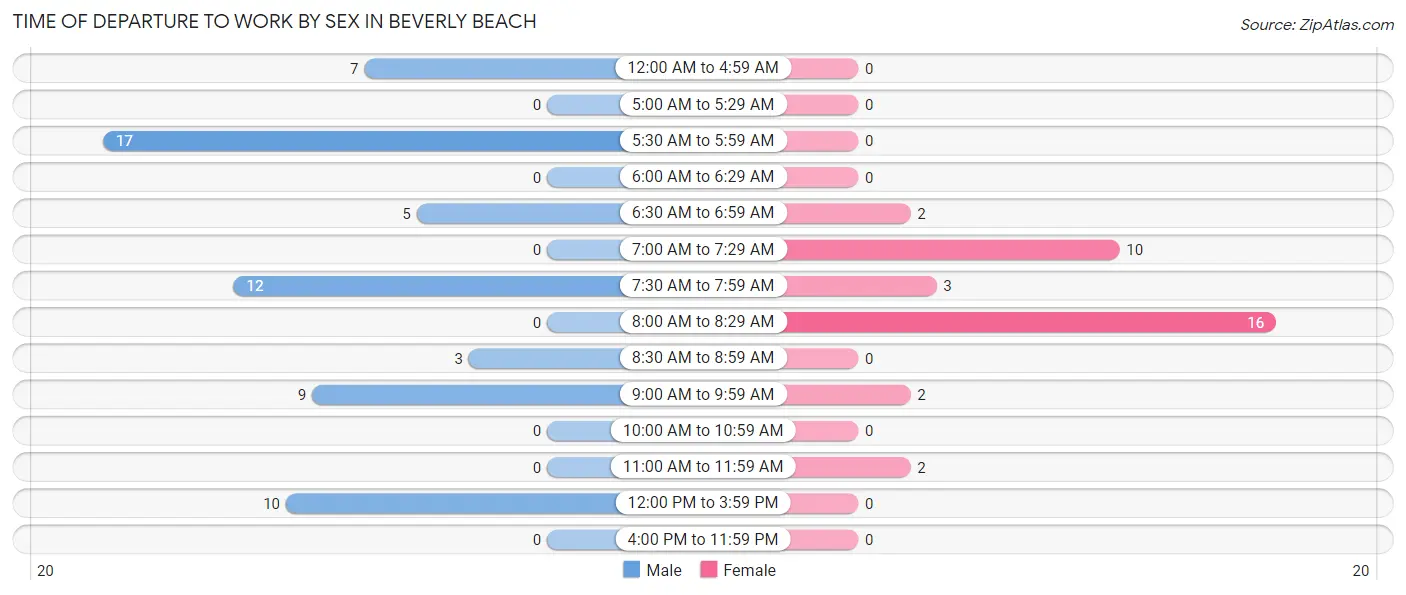
| Time of Departure | Male | Female |
| 12:00 AM to 4:59 AM | 7 (11.1%) | 0 (0.0%) |
| 5:00 AM to 5:29 AM | 0 (0.0%) | 0 (0.0%) |
| 5:30 AM to 5:59 AM | 17 (27.0%) | 0 (0.0%) |
| 6:00 AM to 6:29 AM | 0 (0.0%) | 0 (0.0%) |
| 6:30 AM to 6:59 AM | 5 (7.9%) | 2 (5.7%) |
| 7:00 AM to 7:29 AM | 0 (0.0%) | 10 (28.6%) |
| 7:30 AM to 7:59 AM | 12 (19.1%) | 3 (8.6%) |
| 8:00 AM to 8:29 AM | 0 (0.0%) | 16 (45.7%) |
| 8:30 AM to 8:59 AM | 3 (4.8%) | 0 (0.0%) |
| 9:00 AM to 9:59 AM | 9 (14.3%) | 2 (5.7%) |
| 10:00 AM to 10:59 AM | 0 (0.0%) | 0 (0.0%) |
| 11:00 AM to 11:59 AM | 0 (0.0%) | 2 (5.7%) |
| 12:00 PM to 3:59 PM | 10 (15.9%) | 0 (0.0%) |
| 4:00 PM to 11:59 PM | 0 (0.0%) | 0 (0.0%) |
| Total | 63 (100.0%) | 35 (100.0%) |
Housing Occupancy in Beverly Beach
Occupancy by Ownership in Beverly Beach
Of the total 296 dwellings in Beverly Beach, owner-occupied units account for 269 (90.9%), while renter-occupied units make up 27 (9.1%).
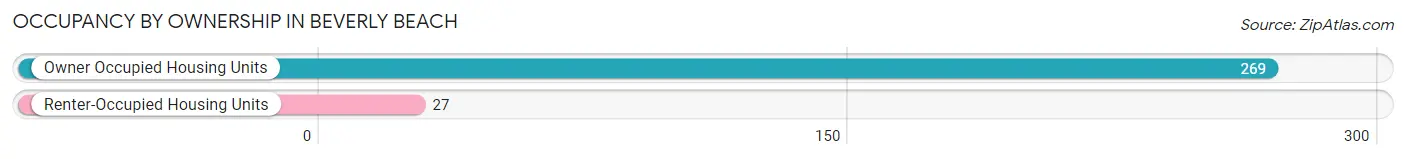
| Occupancy | # Housing Units | % Housing Units |
| Owner Occupied Housing Units | 269 | 90.9% |
| Renter-Occupied Housing Units | 27 | 9.1% |
| Total Occupied Housing Units | 296 | 100.0% |
Occupancy by Household Size in Beverly Beach
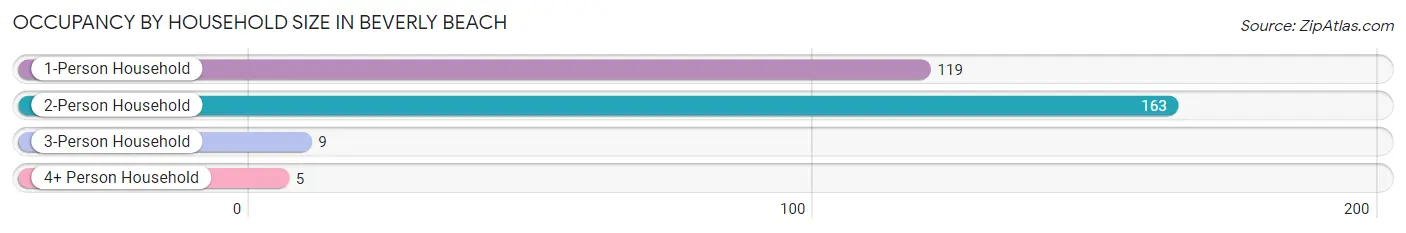
| Household Size | # Housing Units | % Housing Units |
| 1-Person Household | 119 | 40.2% |
| 2-Person Household | 163 | 55.1% |
| 3-Person Household | 9 | 3.0% |
| 4+ Person Household | 5 | 1.7% |
| Total Housing Units | 296 | 100.0% |
Occupancy by Ownership by Household Size in Beverly Beach
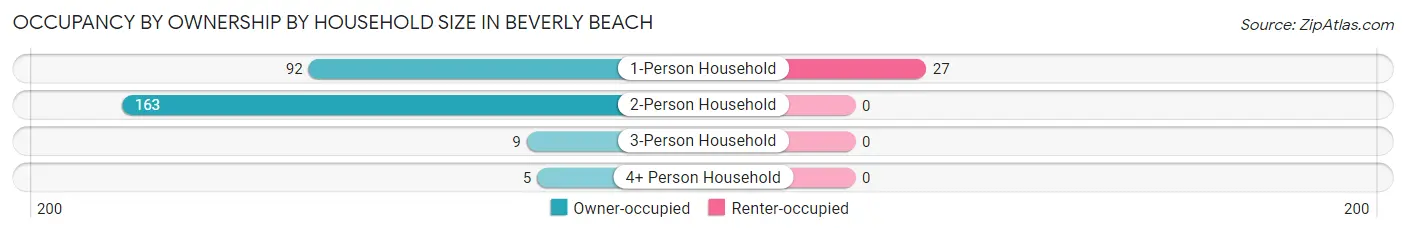
| Household Size | Owner-occupied | Renter-occupied |
| 1-Person Household | 92 (77.3%) | 27 (22.7%) |
| 2-Person Household | 163 (100.0%) | 0 (0.0%) |
| 3-Person Household | 9 (100.0%) | 0 (0.0%) |
| 4+ Person Household | 5 (100.0%) | 0 (0.0%) |
| Total Housing Units | 269 (90.9%) | 27 (9.1%) |
Occupancy by Educational Attainment in Beverly Beach
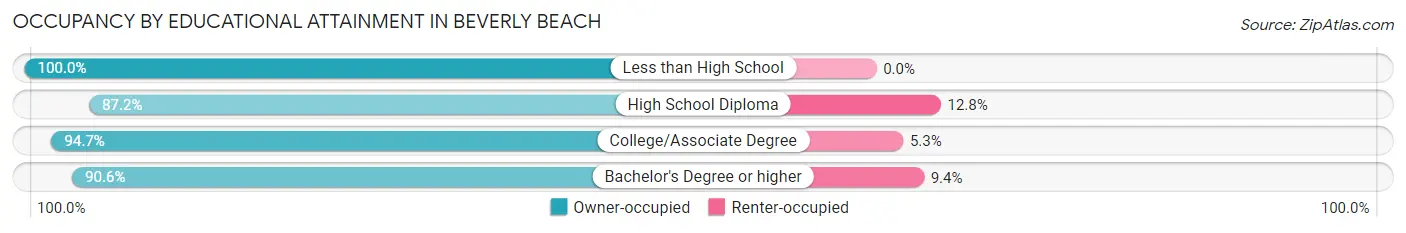
| Household Size | Owner-occupied | Renter-occupied |
| Less than High School | 2 (100.0%) | 0 (0.0%) |
| High School Diploma | 82 (87.2%) | 12 (12.8%) |
| College/Associate Degree | 89 (94.7%) | 5 (5.3%) |
| Bachelor's Degree or higher | 96 (90.6%) | 10 (9.4%) |
Occupancy by Age of Householder in Beverly Beach
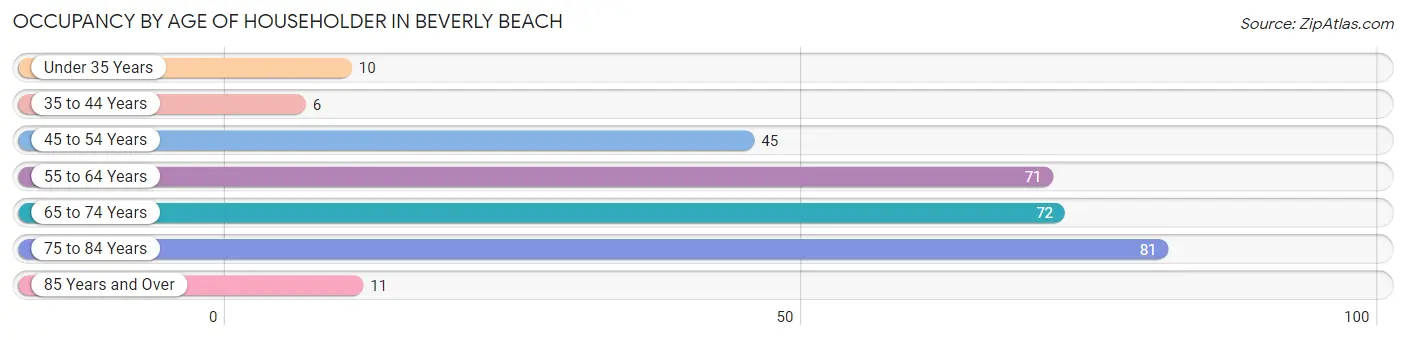
| Age Bracket | # Households | % Households |
| Under 35 Years | 10 | 3.4% |
| 35 to 44 Years | 6 | 2.0% |
| 45 to 54 Years | 45 | 15.2% |
| 55 to 64 Years | 71 | 24.0% |
| 65 to 74 Years | 72 | 24.3% |
| 75 to 84 Years | 81 | 27.4% |
| 85 Years and Over | 11 | 3.7% |
| Total | 296 | 100.0% |
Housing Finances in Beverly Beach
Median Income by Occupancy in Beverly Beach
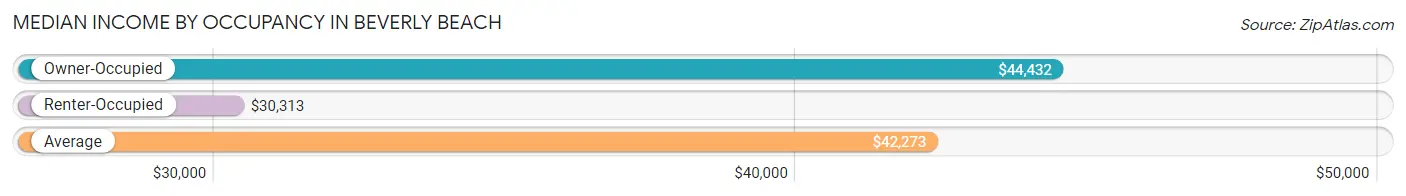
| Occupancy Type | # Households | Median Income |
| Owner-Occupied | 269 (90.9%) | $44,432 |
| Renter-Occupied | 27 (9.1%) | $30,313 |
| Average | 296 (100.0%) | $42,273 |
Occupancy by Householder Income Bracket in Beverly Beach
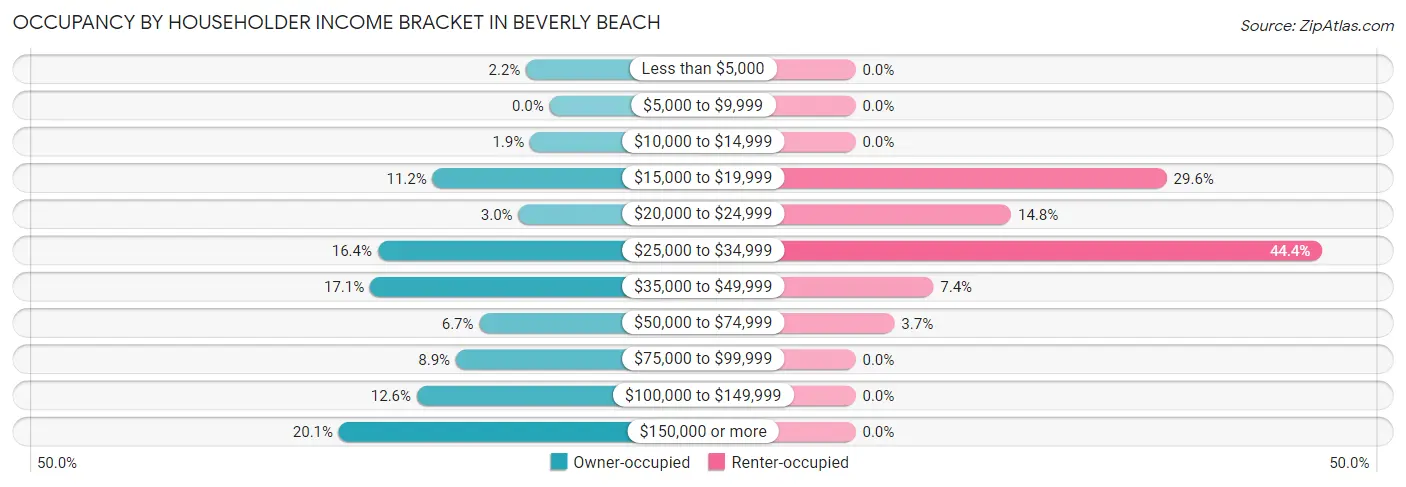
| Income Bracket | Owner-occupied | Renter-occupied |
| Less than $5,000 | 6 (2.2%) | 0 (0.0%) |
| $5,000 to $9,999 | 0 (0.0%) | 0 (0.0%) |
| $10,000 to $14,999 | 5 (1.9%) | 0 (0.0%) |
| $15,000 to $19,999 | 30 (11.2%) | 8 (29.6%) |
| $20,000 to $24,999 | 8 (3.0%) | 4 (14.8%) |
| $25,000 to $34,999 | 44 (16.4%) | 12 (44.4%) |
| $35,000 to $49,999 | 46 (17.1%) | 2 (7.4%) |
| $50,000 to $74,999 | 18 (6.7%) | 1 (3.7%) |
| $75,000 to $99,999 | 24 (8.9%) | 0 (0.0%) |
| $100,000 to $149,999 | 34 (12.6%) | 0 (0.0%) |
| $150,000 or more | 54 (20.1%) | 0 (0.0%) |
| Total | 269 (100.0%) | 27 (100.0%) |
Monthly Housing Cost Tiers in Beverly Beach
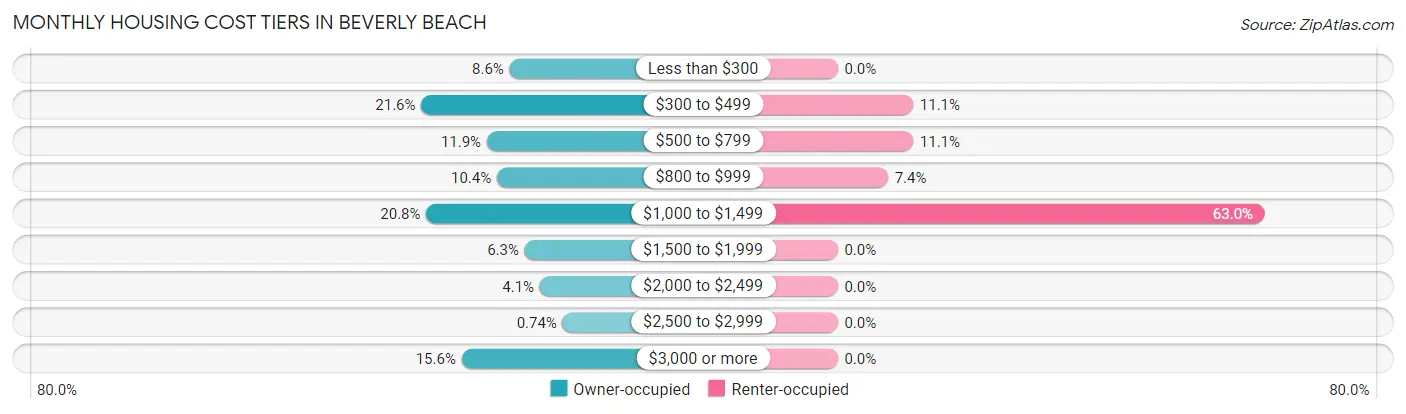
| Monthly Cost | Owner-occupied | Renter-occupied |
| Less than $300 | 23 (8.6%) | 0 (0.0%) |
| $300 to $499 | 58 (21.6%) | 3 (11.1%) |
| $500 to $799 | 32 (11.9%) | 3 (11.1%) |
| $800 to $999 | 28 (10.4%) | 2 (7.4%) |
| $1,000 to $1,499 | 56 (20.8%) | 17 (63.0%) |
| $1,500 to $1,999 | 17 (6.3%) | 0 (0.0%) |
| $2,000 to $2,499 | 11 (4.1%) | 0 (0.0%) |
| $2,500 to $2,999 | 2 (0.7%) | 0 (0.0%) |
| $3,000 or more | 42 (15.6%) | 0 (0.0%) |
| Total | 269 (100.0%) | 27 (100.0%) |
Physical Housing Characteristics in Beverly Beach
Housing Structures in Beverly Beach
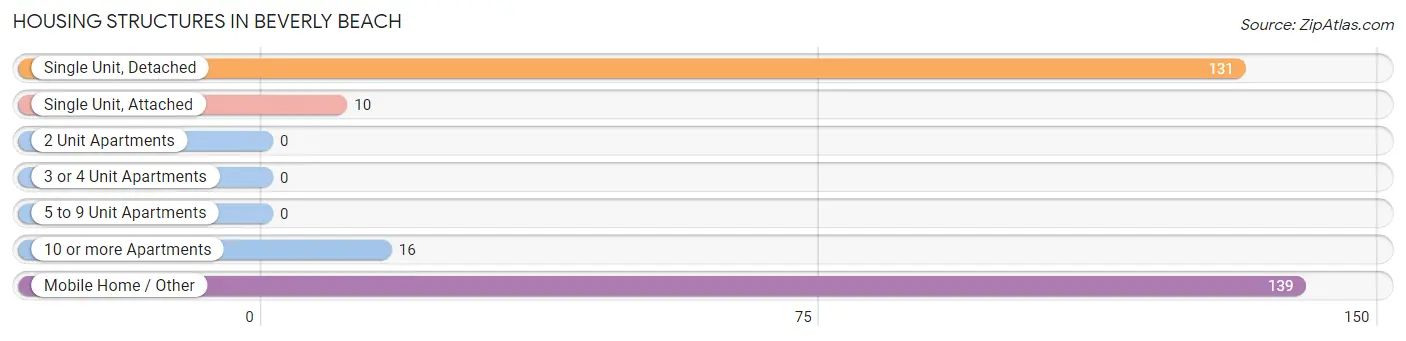
| Structure Type | # Housing Units | % Housing Units |
| Single Unit, Detached | 131 | 44.3% |
| Single Unit, Attached | 10 | 3.4% |
| 2 Unit Apartments | 0 | 0.0% |
| 3 or 4 Unit Apartments | 0 | 0.0% |
| 5 to 9 Unit Apartments | 0 | 0.0% |
| 10 or more Apartments | 16 | 5.4% |
| Mobile Home / Other | 139 | 47.0% |
| Total | 296 | 100.0% |
Housing Structures by Occupancy in Beverly Beach
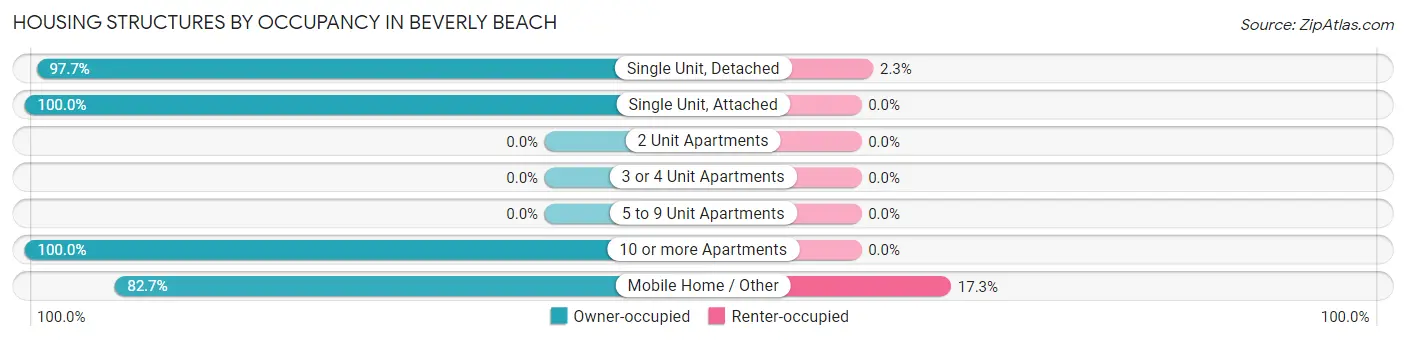
| Structure Type | Owner-occupied | Renter-occupied |
| Single Unit, Detached | 128 (97.7%) | 3 (2.3%) |
| Single Unit, Attached | 10 (100.0%) | 0 (0.0%) |
| 2 Unit Apartments | 0 (0.0%) | 0 (0.0%) |
| 3 or 4 Unit Apartments | 0 (0.0%) | 0 (0.0%) |
| 5 to 9 Unit Apartments | 0 (0.0%) | 0 (0.0%) |
| 10 or more Apartments | 16 (100.0%) | 0 (0.0%) |
| Mobile Home / Other | 115 (82.7%) | 24 (17.3%) |
| Total | 269 (90.9%) | 27 (9.1%) |
Housing Structures by Number of Rooms in Beverly Beach
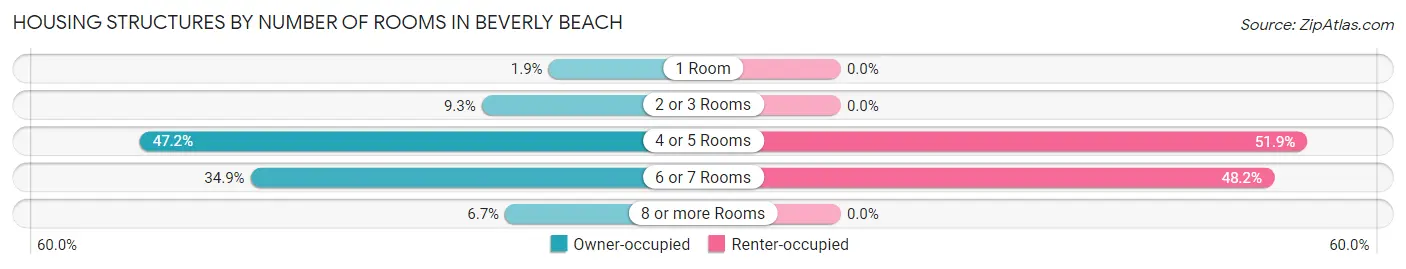
| Number of Rooms | Owner-occupied | Renter-occupied |
| 1 Room | 5 (1.9%) | 0 (0.0%) |
| 2 or 3 Rooms | 25 (9.3%) | 0 (0.0%) |
| 4 or 5 Rooms | 127 (47.2%) | 14 (51.8%) |
| 6 or 7 Rooms | 94 (34.9%) | 13 (48.1%) |
| 8 or more Rooms | 18 (6.7%) | 0 (0.0%) |
| Total | 269 (100.0%) | 27 (100.0%) |
Housing Structure by Heating Type in Beverly Beach
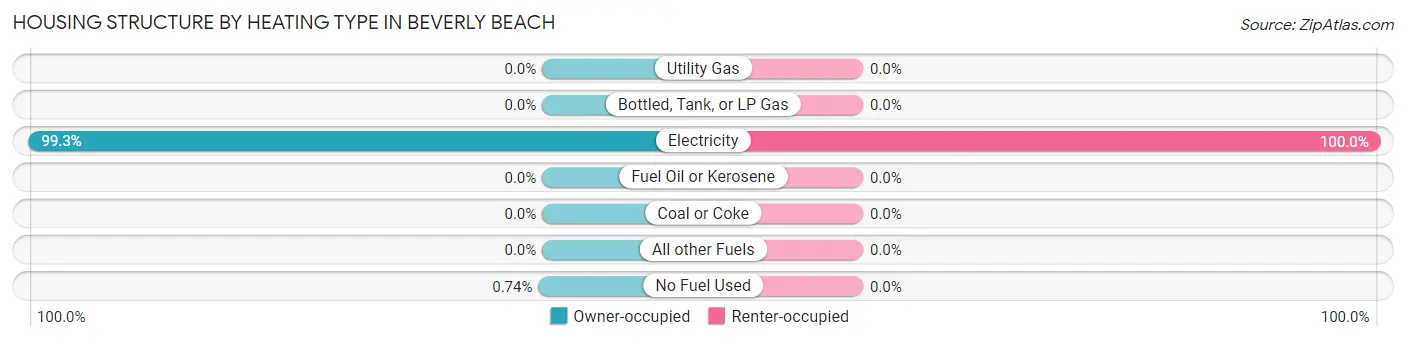
| Heating Type | Owner-occupied | Renter-occupied |
| Utility Gas | 0 (0.0%) | 0 (0.0%) |
| Bottled, Tank, or LP Gas | 0 (0.0%) | 0 (0.0%) |
| Electricity | 267 (99.3%) | 27 (100.0%) |
| Fuel Oil or Kerosene | 0 (0.0%) | 0 (0.0%) |
| Coal or Coke | 0 (0.0%) | 0 (0.0%) |
| All other Fuels | 0 (0.0%) | 0 (0.0%) |
| No Fuel Used | 2 (0.7%) | 0 (0.0%) |
| Total | 269 (100.0%) | 27 (100.0%) |
Household Vehicle Usage in Beverly Beach
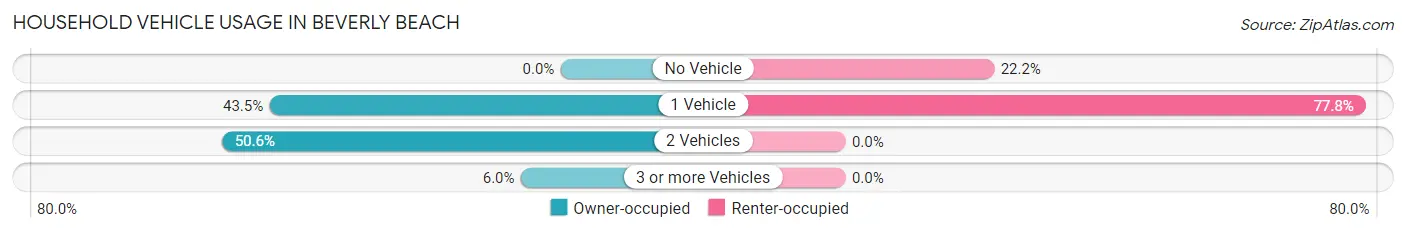
| Vehicles per Household | Owner-occupied | Renter-occupied |
| No Vehicle | 0 (0.0%) | 6 (22.2%) |
| 1 Vehicle | 117 (43.5%) | 21 (77.8%) |
| 2 Vehicles | 136 (50.6%) | 0 (0.0%) |
| 3 or more Vehicles | 16 (5.9%) | 0 (0.0%) |
| Total | 269 (100.0%) | 27 (100.0%) |
Real Estate & Mortgages in Beverly Beach
Real Estate and Mortgage Overview in Beverly Beach
| Characteristic | Without Mortgage | With Mortgage |
| Housing Units | 181 | 88 |
| Median Property Value | $214,500 | $557,100 |
| Median Household Income | $39,375 | $31 |
| Monthly Housing Costs | $545 | $42 |
| Real Estate Taxes | $2,130 | $2 |
Property Value by Mortgage Status in Beverly Beach
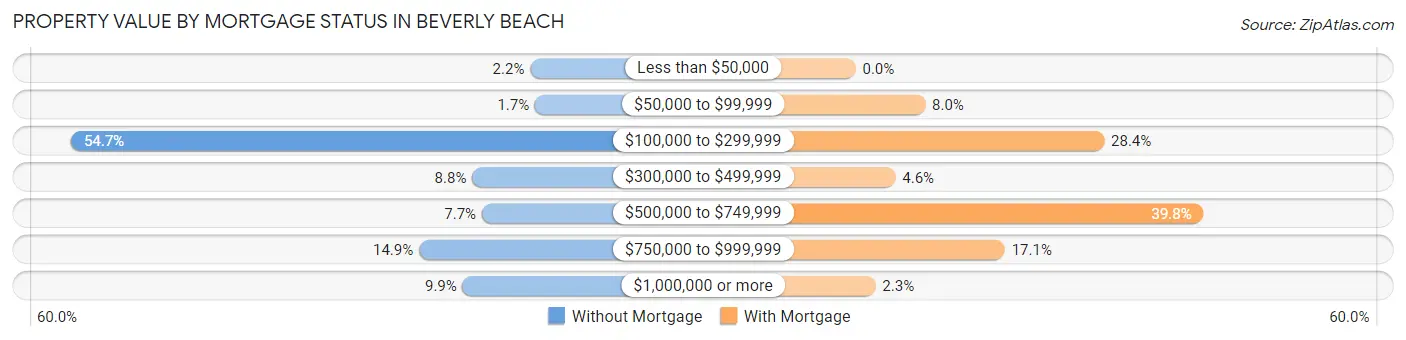
| Property Value | Without Mortgage | With Mortgage |
| Less than $50,000 | 4 (2.2%) | 0 (0.0%) |
| $50,000 to $99,999 | 3 (1.7%) | 7 (8.0%) |
| $100,000 to $299,999 | 99 (54.7%) | 25 (28.4%) |
| $300,000 to $499,999 | 16 (8.8%) | 4 (4.5%) |
| $500,000 to $749,999 | 14 (7.7%) | 35 (39.8%) |
| $750,000 to $999,999 | 27 (14.9%) | 15 (17.1%) |
| $1,000,000 or more | 18 (9.9%) | 2 (2.3%) |
| Total | 181 (100.0%) | 88 (100.0%) |
Household Income by Mortgage Status in Beverly Beach
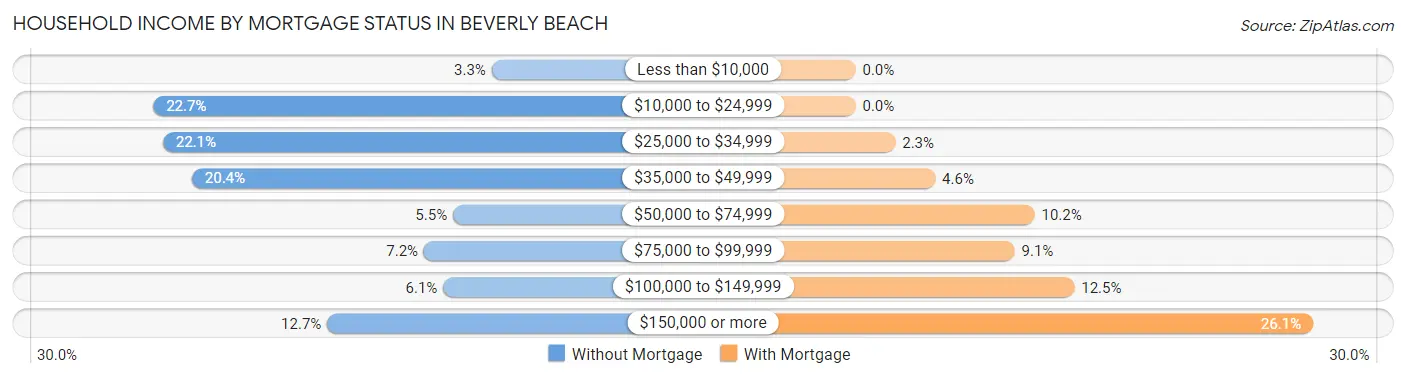
| Household Income | Without Mortgage | With Mortgage |
| Less than $10,000 | 6 (3.3%) | 0 (0.0%) |
| $10,000 to $24,999 | 41 (22.7%) | 0 (0.0%) |
| $25,000 to $34,999 | 40 (22.1%) | 2 (2.3%) |
| $35,000 to $49,999 | 37 (20.4%) | 4 (4.5%) |
| $50,000 to $74,999 | 10 (5.5%) | 9 (10.2%) |
| $75,000 to $99,999 | 13 (7.2%) | 8 (9.1%) |
| $100,000 to $149,999 | 11 (6.1%) | 11 (12.5%) |
| $150,000 or more | 23 (12.7%) | 23 (26.1%) |
| Total | 181 (100.0%) | 88 (100.0%) |
Property Value to Household Income Ratio in Beverly Beach
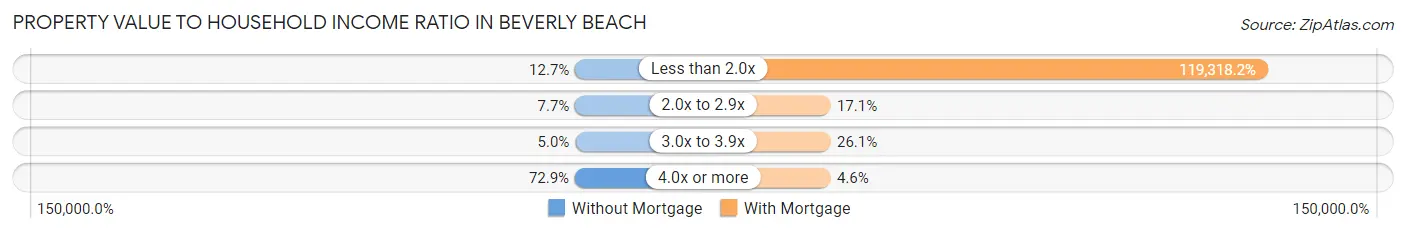
| Value-to-Income Ratio | Without Mortgage | With Mortgage |
| Less than 2.0x | 23 (12.7%) | 105,000 (119,318.2%) |
| 2.0x to 2.9x | 14 (7.7%) | 15 (17.1%) |
| 3.0x to 3.9x | 9 (5.0%) | 23 (26.1%) |
| 4.0x or more | 132 (72.9%) | 4 (4.5%) |
| Total | 181 (100.0%) | 88 (100.0%) |
Real Estate Taxes by Mortgage Status in Beverly Beach
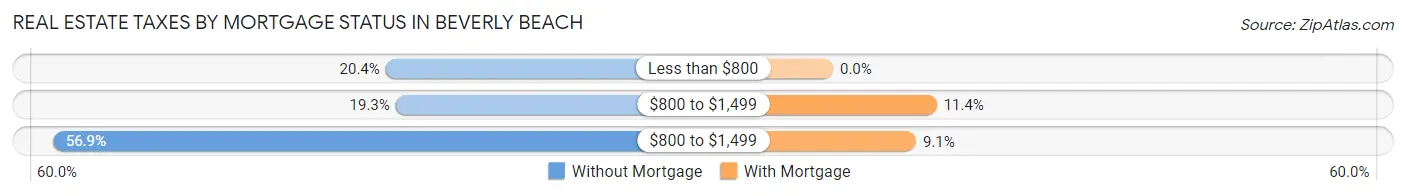
| Property Taxes | Without Mortgage | With Mortgage |
| Less than $800 | 37 (20.4%) | 0 (0.0%) |
| $800 to $1,499 | 35 (19.3%) | 10 (11.4%) |
| $800 to $1,499 | 103 (56.9%) | 8 (9.1%) |
| Total | 181 (100.0%) | 88 (100.0%) |
Health & Disability in Beverly Beach
Health Insurance Coverage by Age in Beverly Beach
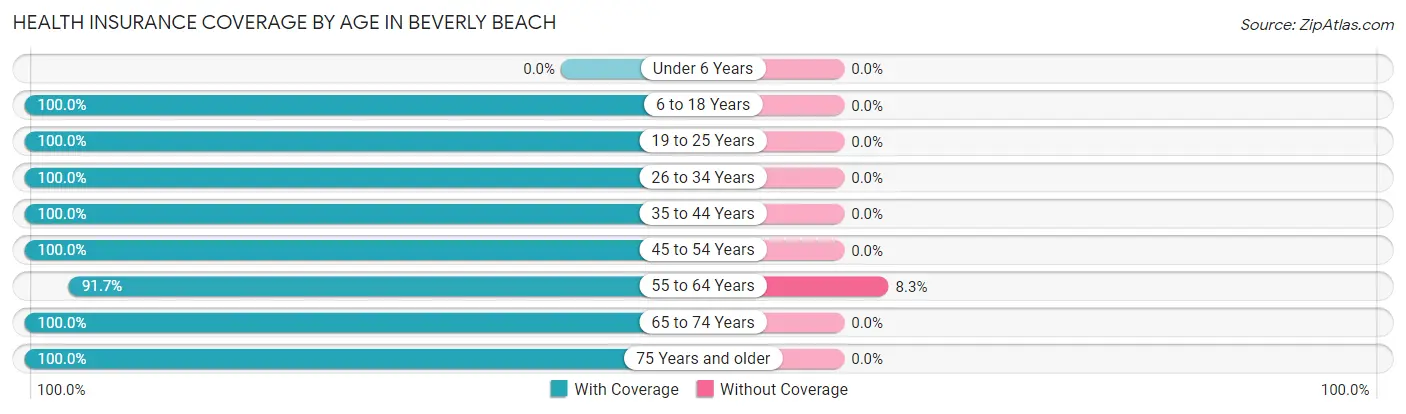
| Age Bracket | With Coverage | Without Coverage |
| Under 6 Years | 0 (0.0%) | 0 (0.0%) |
| 6 to 18 Years | 15 (100.0%) | 0 (0.0%) |
| 19 to 25 Years | 2 (100.0%) | 0 (0.0%) |
| 26 to 34 Years | 10 (100.0%) | 0 (0.0%) |
| 35 to 44 Years | 13 (100.0%) | 0 (0.0%) |
| 45 to 54 Years | 82 (100.0%) | 0 (0.0%) |
| 55 to 64 Years | 122 (91.7%) | 11 (8.3%) |
| 65 to 74 Years | 120 (100.0%) | 0 (0.0%) |
| 75 Years and older | 120 (100.0%) | 0 (0.0%) |
| Total | 484 (97.8%) | 11 (2.2%) |
Health Insurance Coverage by Citizenship Status in Beverly Beach
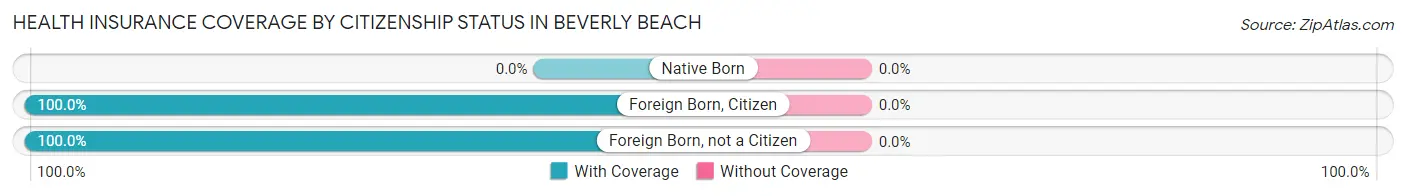
| Citizenship Status | With Coverage | Without Coverage |
| Native Born | 0 (0.0%) | 0 (0.0%) |
| Foreign Born, Citizen | 15 (100.0%) | 0 (0.0%) |
| Foreign Born, not a Citizen | 2 (100.0%) | 0 (0.0%) |
Health Insurance Coverage by Household Income in Beverly Beach
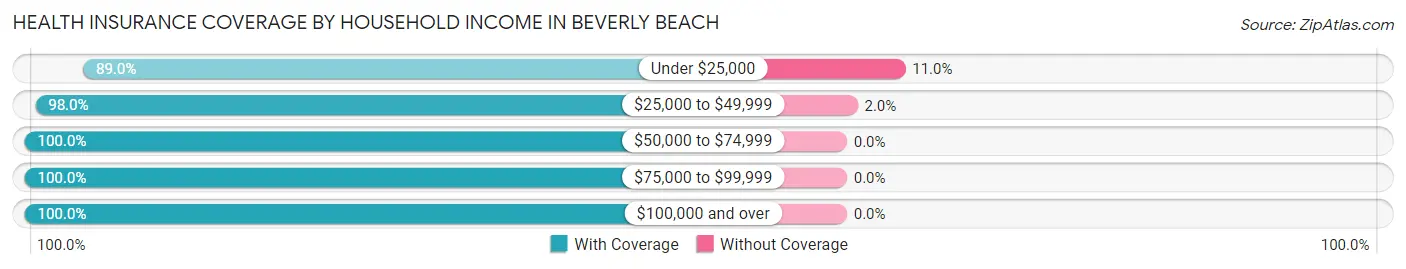
| Household Income | With Coverage | Without Coverage |
| Under $25,000 | 65 (89.0%) | 8 (11.0%) |
| $25,000 to $49,999 | 146 (98.0%) | 3 (2.0%) |
| $50,000 to $74,999 | 33 (100.0%) | 0 (0.0%) |
| $75,000 to $99,999 | 50 (100.0%) | 0 (0.0%) |
| $100,000 and over | 190 (100.0%) | 0 (0.0%) |
Public vs Private Health Insurance Coverage by Age in Beverly Beach
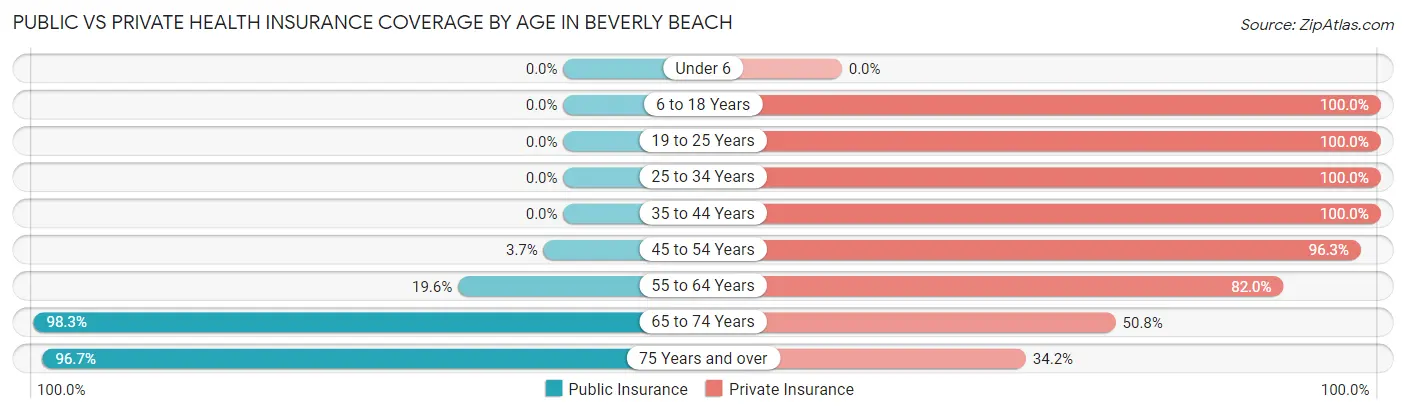
| Age Bracket | Public Insurance | Private Insurance |
| Under 6 | 0 (0.0%) | 0 (0.0%) |
| 6 to 18 Years | 0 (0.0%) | 15 (100.0%) |
| 19 to 25 Years | 0 (0.0%) | 2 (100.0%) |
| 25 to 34 Years | 0 (0.0%) | 10 (100.0%) |
| 35 to 44 Years | 0 (0.0%) | 13 (100.0%) |
| 45 to 54 Years | 3 (3.7%) | 79 (96.3%) |
| 55 to 64 Years | 26 (19.6%) | 109 (82.0%) |
| 65 to 74 Years | 118 (98.3%) | 61 (50.8%) |
| 75 Years and over | 116 (96.7%) | 41 (34.2%) |
| Total | 263 (53.1%) | 330 (66.7%) |
Disability Status by Sex by Age in Beverly Beach
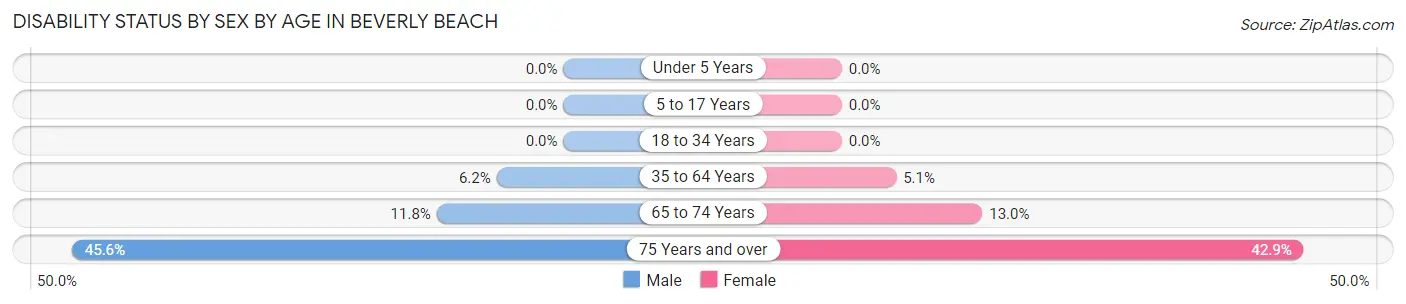
| Age Bracket | Male | Female |
| Under 5 Years | 0 (0.0%) | 0 (0.0%) |
| 5 to 17 Years | 0 (0.0%) | 0 (0.0%) |
| 18 to 34 Years | 0 (0.0%) | 0 (0.0%) |
| 35 to 64 Years | 8 (6.2%) | 5 (5.1%) |
| 65 to 74 Years | 6 (11.8%) | 9 (13.0%) |
| 75 Years and over | 26 (45.6%) | 27 (42.9%) |
Disability Class by Sex by Age in Beverly Beach
Disability Class: Hearing Difficulty
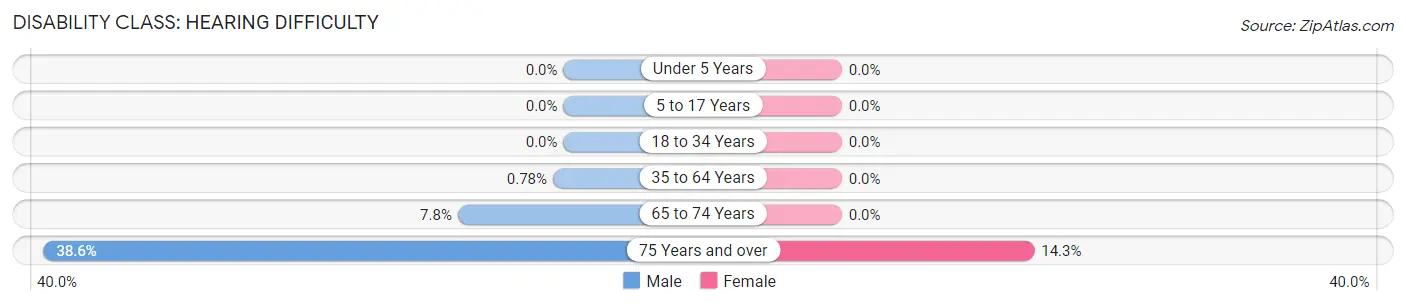
| Age Bracket | Male | Female |
| Under 5 Years | 0 (0.0%) | 0 (0.0%) |
| 5 to 17 Years | 0 (0.0%) | 0 (0.0%) |
| 18 to 34 Years | 0 (0.0%) | 0 (0.0%) |
| 35 to 64 Years | 1 (0.8%) | 0 (0.0%) |
| 65 to 74 Years | 4 (7.8%) | 0 (0.0%) |
| 75 Years and over | 22 (38.6%) | 9 (14.3%) |
Disability Class: Vision Difficulty
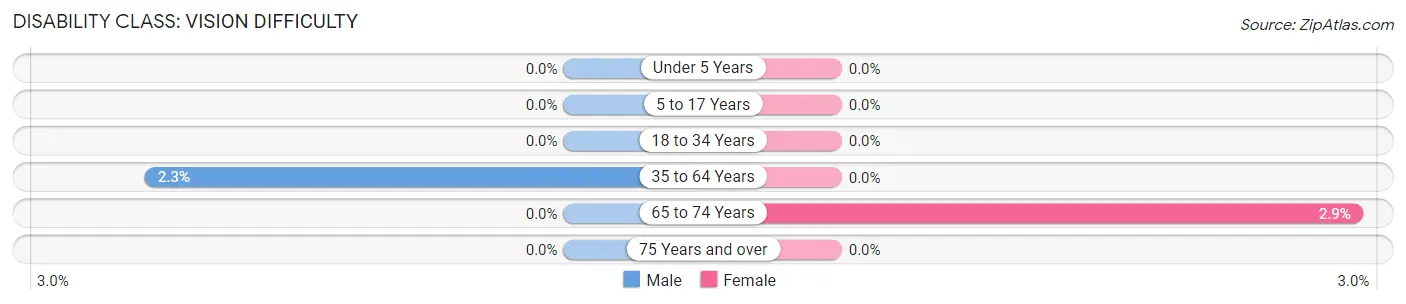
| Age Bracket | Male | Female |
| Under 5 Years | 0 (0.0%) | 0 (0.0%) |
| 5 to 17 Years | 0 (0.0%) | 0 (0.0%) |
| 18 to 34 Years | 0 (0.0%) | 0 (0.0%) |
| 35 to 64 Years | 3 (2.3%) | 0 (0.0%) |
| 65 to 74 Years | 0 (0.0%) | 2 (2.9%) |
| 75 Years and over | 0 (0.0%) | 0 (0.0%) |
Disability Class: Cognitive Difficulty
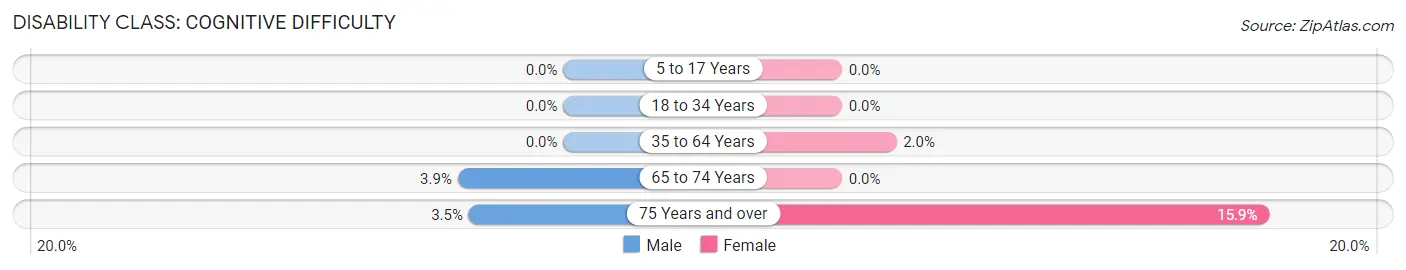
| Age Bracket | Male | Female |
| 5 to 17 Years | 0 (0.0%) | 0 (0.0%) |
| 18 to 34 Years | 0 (0.0%) | 0 (0.0%) |
| 35 to 64 Years | 0 (0.0%) | 2 (2.0%) |
| 65 to 74 Years | 2 (3.9%) | 0 (0.0%) |
| 75 Years and over | 2 (3.5%) | 10 (15.9%) |
Disability Class: Ambulatory Difficulty
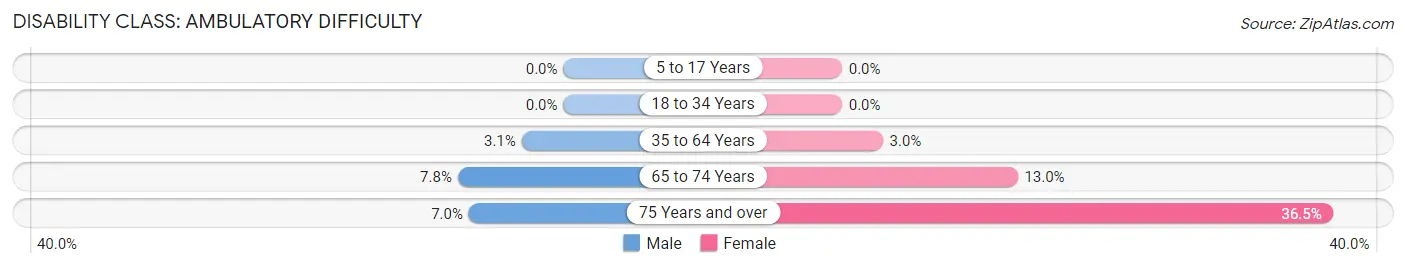
| Age Bracket | Male | Female |
| 5 to 17 Years | 0 (0.0%) | 0 (0.0%) |
| 18 to 34 Years | 0 (0.0%) | 0 (0.0%) |
| 35 to 64 Years | 4 (3.1%) | 3 (3.0%) |
| 65 to 74 Years | 4 (7.8%) | 9 (13.0%) |
| 75 Years and over | 4 (7.0%) | 23 (36.5%) |
Disability Class: Self-Care Difficulty
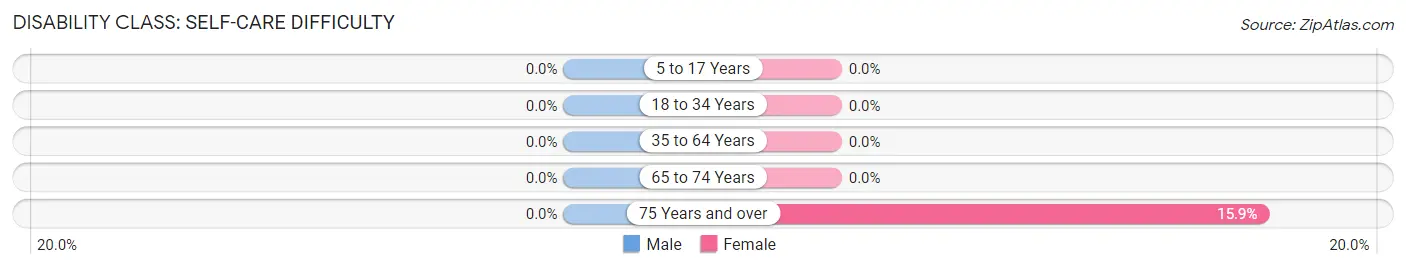
| Age Bracket | Male | Female |
| 5 to 17 Years | 0 (0.0%) | 0 (0.0%) |
| 18 to 34 Years | 0 (0.0%) | 0 (0.0%) |
| 35 to 64 Years | 0 (0.0%) | 0 (0.0%) |
| 65 to 74 Years | 0 (0.0%) | 0 (0.0%) |
| 75 Years and over | 0 (0.0%) | 10 (15.9%) |
Technology Access in Beverly Beach
Computing Device Access in Beverly Beach
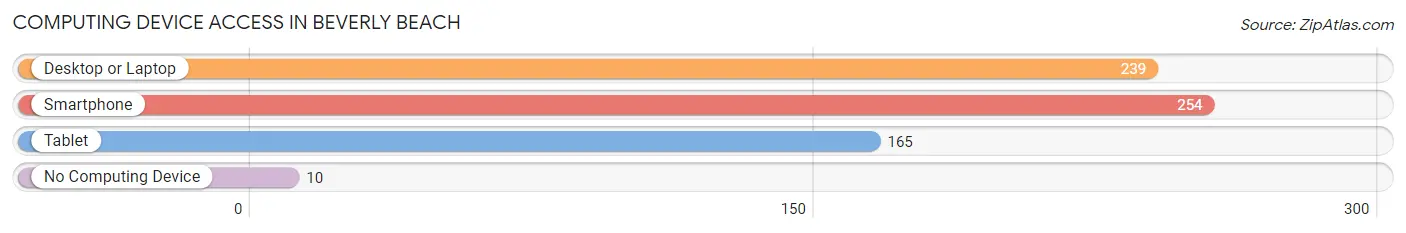
| Device Type | # Households | % Households |
| Desktop or Laptop | 239 | 80.7% |
| Smartphone | 254 | 85.8% |
| Tablet | 165 | 55.7% |
| No Computing Device | 10 | 3.4% |
| Total | 296 | 100.0% |
Internet Access in Beverly Beach
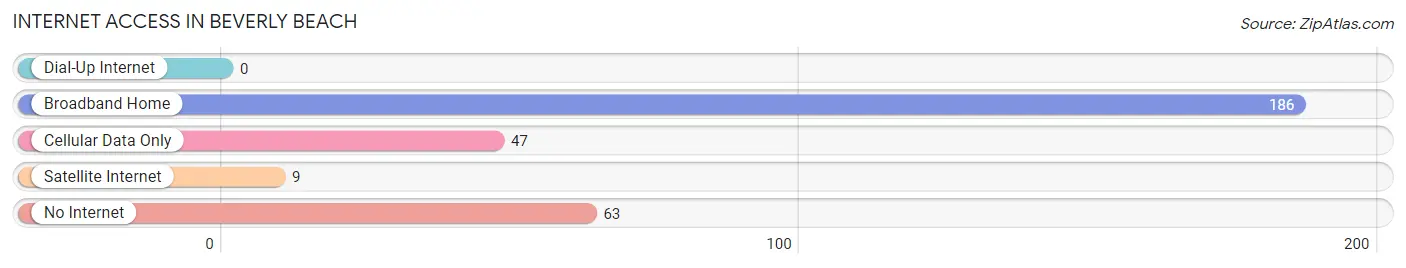
| Internet Type | # Households | % Households |
| Dial-Up Internet | 0 | 0.0% |
| Broadband Home | 186 | 62.8% |
| Cellular Data Only | 47 | 15.9% |
| Satellite Internet | 9 | 3.0% |
| No Internet | 63 | 21.3% |
| Total | 296 | 100.0% |
Beverly Beach Summary
Beverly Beach is a small unincorporated community located in Flagler County, Florida, United States. It is situated on the Atlantic Ocean, just north of Flagler Beach. The community is part of the Palm Coast metropolitan statistical area.
History
Beverly Beach was originally part of the town of Beverly Beach, which was established in the late 1800s. The town was named after the daughter of a local landowner, who was named Beverly. The town was a popular destination for tourists and fishermen, and it was home to a number of businesses, including a hotel, a general store, and a post office.
In the early 1900s, the town began to decline as the railroad bypassed it and the population began to move away. By the 1950s, the town was all but abandoned. In the 1970s, the area was redeveloped as a residential community, and the town of Beverly Beach was officially incorporated in 1975.
Geography
Beverly Beach is located in Flagler County, Florida, on the Atlantic Ocean. It is situated just north of Flagler Beach, and is bordered by the Intracoastal Waterway to the west and the Atlantic Ocean to the east. The community is located approximately 25 miles north of Daytona Beach and 50 miles south of Jacksonville.
The area is characterized by its sandy beaches, which are popular for swimming, fishing, and other recreational activities. The community is also home to a number of parks, including Gamble Rogers Memorial State Recreation Area, which offers camping, fishing, and other outdoor activities.
Economy
The economy of Beverly Beach is largely driven by tourism. The area is home to a number of hotels, restaurants, and other businesses that cater to visitors. The community is also home to a number of retail stores, including a grocery store, a pharmacy, and a hardware store.
The area is also home to a number of businesses that provide services to the local community, such as medical offices, banks, and auto repair shops. The community is also home to a number of marinas, which provide access to the Intracoastal Waterway and the Atlantic Ocean.
Demographics
As of the 2010 census, the population of Beverly Beach was 1,845. The population is largely white (90.2%), with a small percentage of African Americans (3.2%) and Hispanics (2.7%). The median household income is $45,938, and the median home value is $179,400.
The majority of the population is employed in the service industry (31.2%), followed by retail (17.2%), construction (14.2%), and health care (10.2%). The unemployment rate is 5.2%, which is lower than the national average.
Conclusion
Beverly Beach is a small unincorporated community located in Flagler County, Florida, United States. It is situated on the Atlantic Ocean, just north of Flagler Beach. The community is part of the Palm Coast metropolitan statistical area. The economy of Beverly Beach is largely driven by tourism, and the area is home to a number of hotels, restaurants, and other businesses that cater to visitors. The population of Beverly Beach is largely white, with a median household income of $45,938 and a median home value of $179,400. The majority of the population is employed in the service industry, followed by retail, construction, and health care.
Common Questions
What is Per Capita Income in Beverly Beach?
Per Capita income in Beverly Beach is $51,574.
What is the Median Family Income in Beverly Beach?
Median Family Income in Beverly Beach is $93,000.
What is the Median Household income in Beverly Beach?
Median Household Income in Beverly Beach is $42,273.
What is Income or Wage Gap in Beverly Beach?
Income or Wage Gap in Beverly Beach is 0.6%.
Women in Beverly Beach earn 99.4 cents for every dollar earned by a man.
What is Inequality or Gini Index in Beverly Beach?
Inequality or Gini Index in Beverly Beach is 0.51.
What is the Total Population of Beverly Beach?
Total Population of Beverly Beach is 495.
What is the Total Male Population of Beverly Beach?
Total Male Population of Beverly Beach is 258.
What is the Total Female Population of Beverly Beach?
Total Female Population of Beverly Beach is 237.
What is the Ratio of Males per 100 Females in Beverly Beach?
There are 108.86 Males per 100 Females in Beverly Beach.
What is the Ratio of Females per 100 Males in Beverly Beach?
There are 91.86 Females per 100 Males in Beverly Beach.
What is the Median Population Age in Beverly Beach?
Median Population Age in Beverly Beach is 64.5 Years.
What is the Average Family Size in Beverly Beach
Average Family Size in Beverly Beach is 2.2 People.
What is the Average Household Size in Beverly Beach
Average Household Size in Beverly Beach is 1.7 People.
How Large is the Labor Force in Beverly Beach?
There are 175 People in the Labor Forcein in Beverly Beach.
What is the Percentage of People in the Labor Force in Beverly Beach?
36.2% of People are in the Labor Force in Beverly Beach.
What is the Unemployment Rate in Beverly Beach?
Unemployment Rate in Beverly Beach is 4.0%.