Harbor Bluffs, FL Map & Demographics
Harbor Bluffs Map
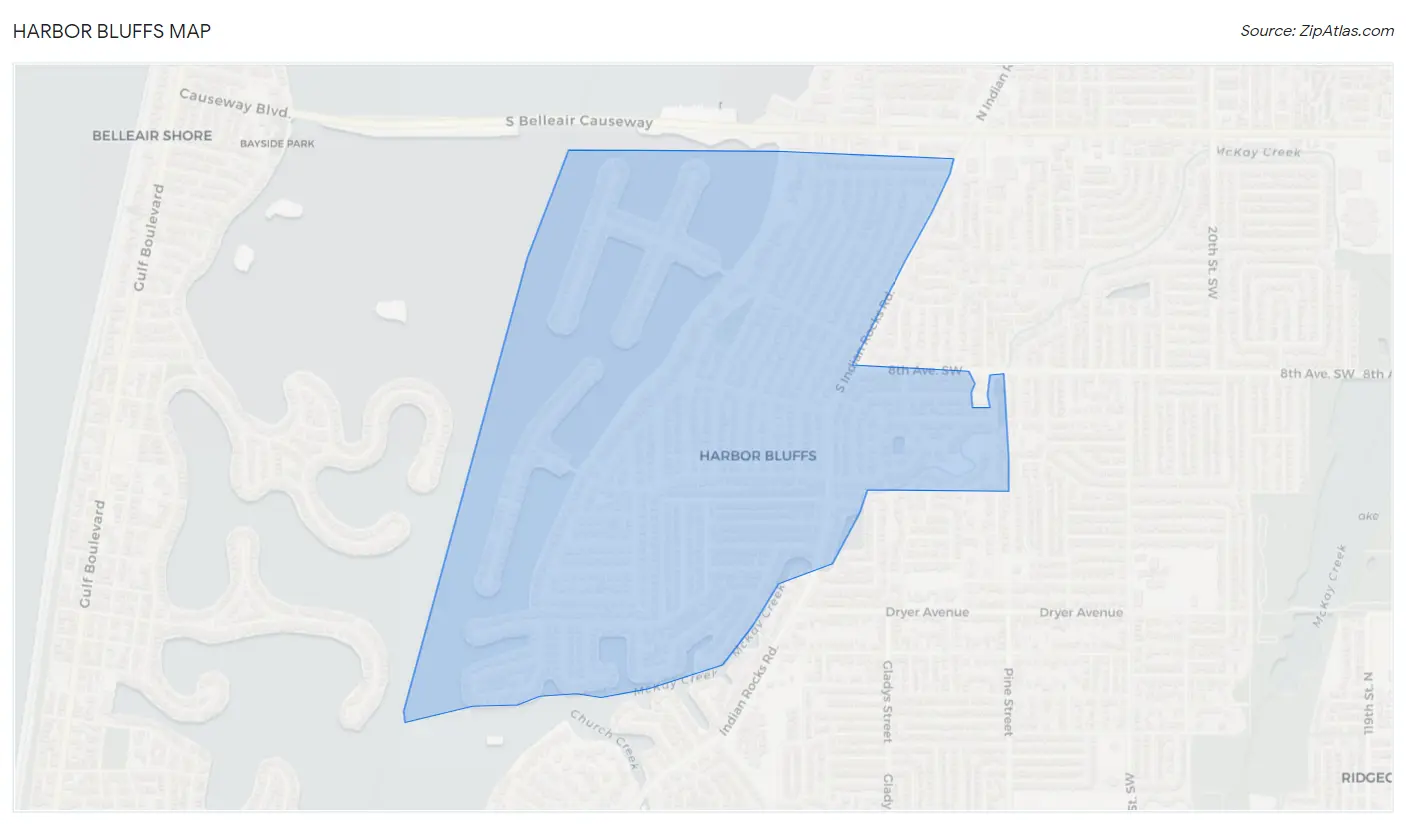
Harbor Bluffs Overview
$54,151
PER CAPITA INCOME
$135,580
AVG FAMILY INCOME
$108,403
AVG HOUSEHOLD INCOME
3.9%
WAGE / INCOME GAP [ % ]
96.1¢/ $1
WAGE / INCOME GAP [ $ ]
0.51
INEQUALITY / GINI INDEX
2,889
TOTAL POPULATION
1,327
MALE POPULATION
1,562
FEMALE POPULATION
84.96
MALES / 100 FEMALES
117.71
FEMALES / 100 MALES
48.5
MEDIAN AGE
3.0
AVG FAMILY SIZE
2.6
AVG HOUSEHOLD SIZE
1,339
LABOR FORCE [ PEOPLE ]
49.8%
PERCENT IN LABOR FORCE
9.6%
UNEMPLOYMENT RATE
Income in Harbor Bluffs
Income Overview in Harbor Bluffs
Per Capita Income in Harbor Bluffs is $54,151, while median incomes of families and households are $135,580 and $108,403 respectively.
| Characteristic | Number | Measure |
| Per Capita Income | 2,889 | $54,151 |
| Median Family Income | 859 | $135,580 |
| Mean Family Income | 859 | $171,993 |
| Median Household Income | 1,113 | $108,403 |
| Mean Household Income | 1,113 | $138,858 |
| Income Deficit | 859 | $0 |
| Wage / Income Gap (%) | 2,889 | 3.88% |
| Wage / Income Gap ($) | 2,889 | 96.12¢ per $1 |
| Gini / Inequality Index | 2,889 | 0.51 |
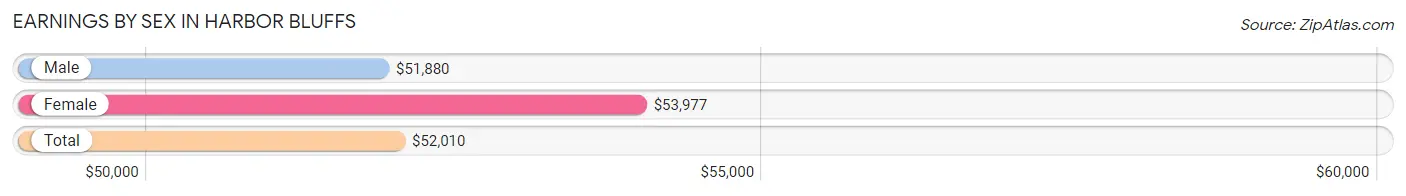
Earnings by Sex in Harbor Bluffs
Average Earnings in Harbor Bluffs are $52,010, $51,880 for men and $53,977 for women, a difference of 3.9%.
| Sex | Number | Average Earnings |
| Male | 636 (48.0%) | $51,880 |
| Female | 689 (52.0%) | $53,977 |
| Total | 1,325 (100.0%) | $52,010 |
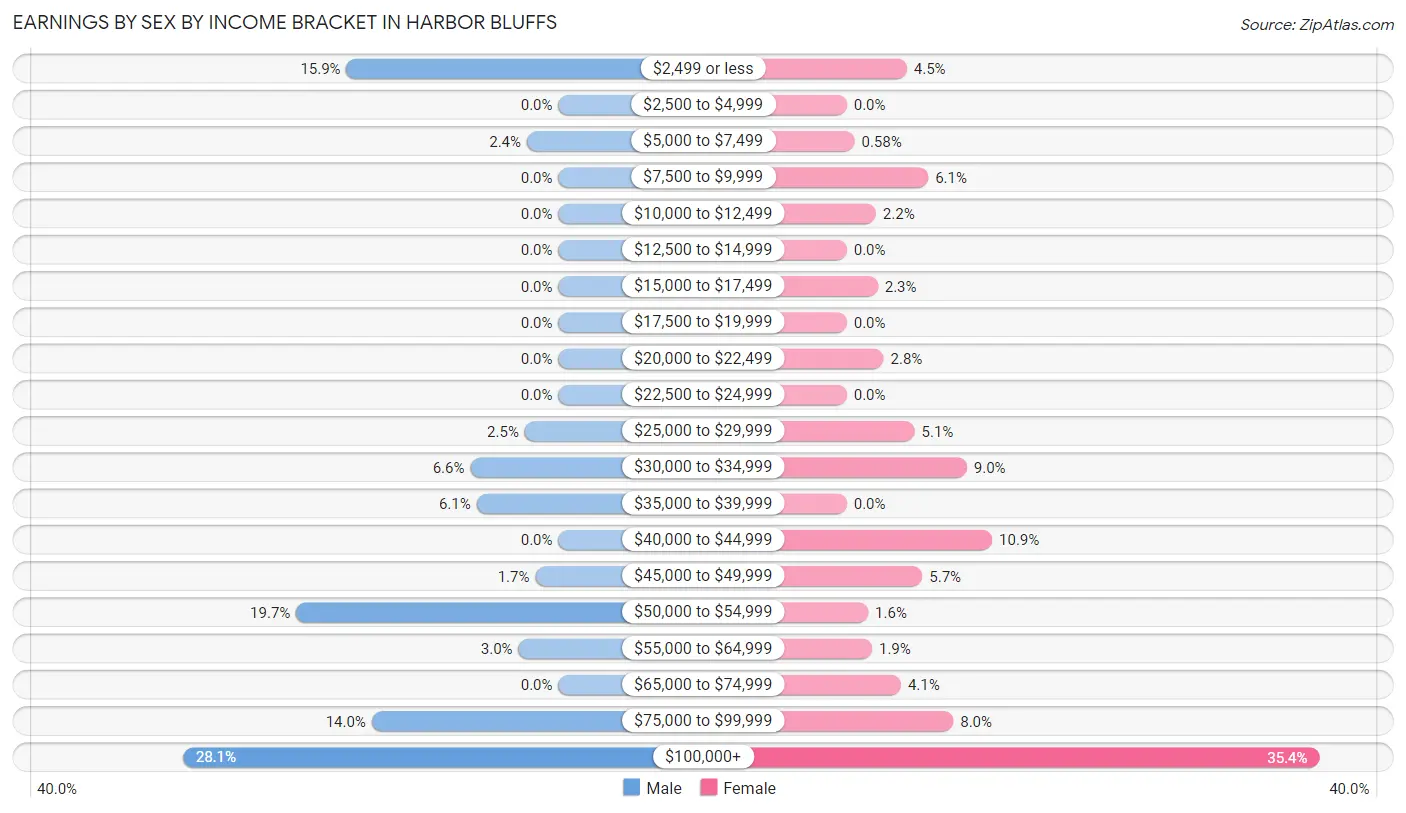
Earnings by Sex by Income Bracket in Harbor Bluffs
The most common earnings brackets in Harbor Bluffs are $100,000+ for men (179 | 28.1%) and $100,000+ for women (244 | 35.4%).
| Income | Male | Female |
| $2,499 or less | 101 (15.9%) | 31 (4.5%) |
| $2,500 to $4,999 | 0 (0.0%) | 0 (0.0%) |
| $5,000 to $7,499 | 15 (2.4%) | 4 (0.6%) |
| $7,500 to $9,999 | 0 (0.0%) | 42 (6.1%) |
| $10,000 to $12,499 | 0 (0.0%) | 15 (2.2%) |
| $12,500 to $14,999 | 0 (0.0%) | 0 (0.0%) |
| $15,000 to $17,499 | 0 (0.0%) | 16 (2.3%) |
| $17,500 to $19,999 | 0 (0.0%) | 0 (0.0%) |
| $20,000 to $22,499 | 0 (0.0%) | 19 (2.8%) |
| $22,500 to $24,999 | 0 (0.0%) | 0 (0.0%) |
| $25,000 to $29,999 | 16 (2.5%) | 35 (5.1%) |
| $30,000 to $34,999 | 42 (6.6%) | 62 (9.0%) |
| $35,000 to $39,999 | 39 (6.1%) | 0 (0.0%) |
| $40,000 to $44,999 | 0 (0.0%) | 75 (10.9%) |
| $45,000 to $49,999 | 11 (1.7%) | 39 (5.7%) |
| $50,000 to $54,999 | 125 (19.7%) | 11 (1.6%) |
| $55,000 to $64,999 | 19 (3.0%) | 13 (1.9%) |
| $65,000 to $74,999 | 0 (0.0%) | 28 (4.1%) |
| $75,000 to $99,999 | 89 (14.0%) | 55 (8.0%) |
| $100,000+ | 179 (28.1%) | 244 (35.4%) |
| Total | 636 (100.0%) | 689 (100.0%) |
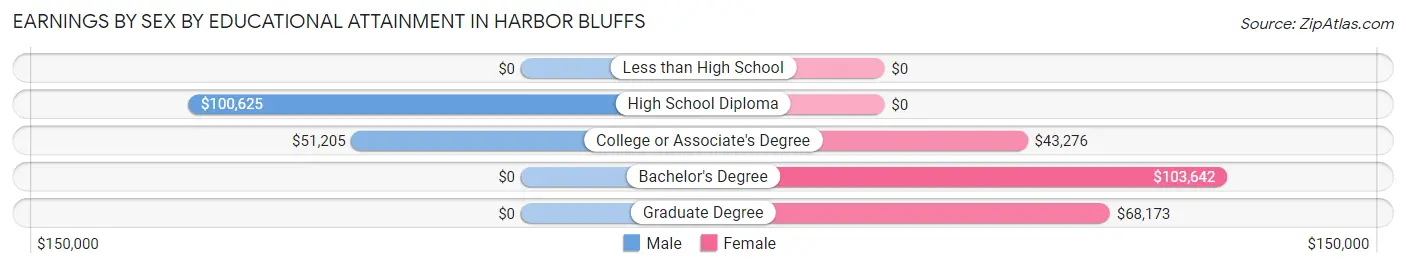
Earnings by Sex by Educational Attainment in Harbor Bluffs
Average earnings in Harbor Bluffs are $87,368 for men and $56,538 for women, a difference of 35.3%. Men with an educational attainment of high school diploma enjoy the highest average annual earnings of $100,625, while those with college or associate's degree education earn the least with $51,205. Women with an educational attainment of bachelor's degree earn the most with the average annual earnings of $103,642, while those with college or associate's degree education have the smallest earnings of $43,276.
| Educational Attainment | Male Income | Female Income |
| Less than High School | - | - |
| High School Diploma | $100,625 | $0 |
| College or Associate's Degree | $51,205 | $43,276 |
| Bachelor's Degree | - | - |
| Graduate Degree | - | - |
| Total | $87,368 | $56,538 |
Family Income in Harbor Bluffs
Family Income Brackets in Harbor Bluffs
According to the Harbor Bluffs family income data, there are 293 families falling into the $100,000 to $149,999 income range, which is the most common income bracket and makes up 34.1% of all families.
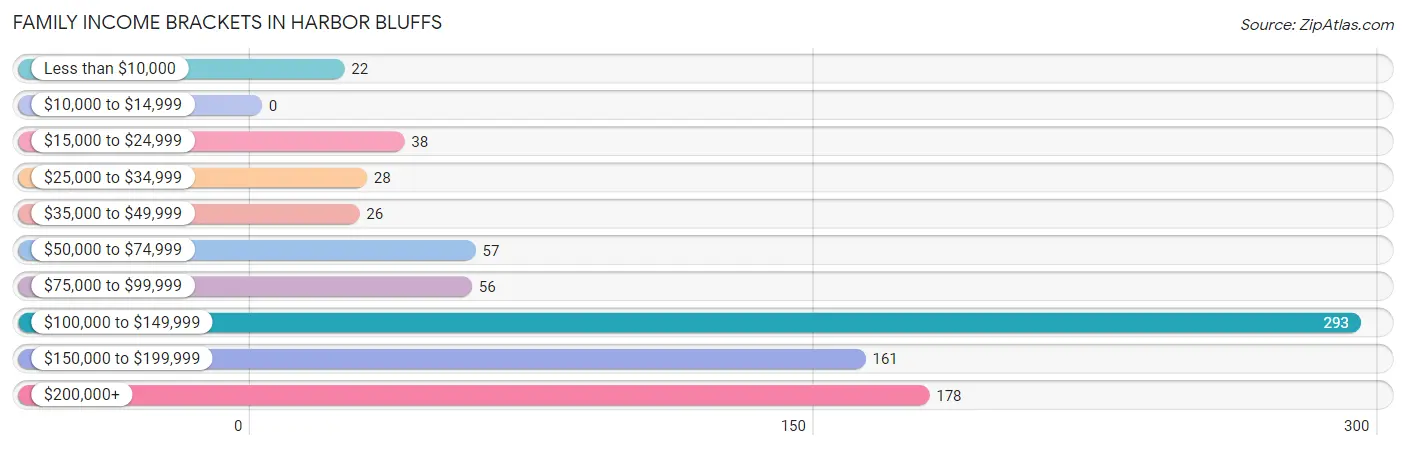
| Income Bracket | # Families | % Families |
| Less than $10,000 | 22 | 2.6% |
| $10,000 to $14,999 | 0 | 0.0% |
| $15,000 to $24,999 | 38 | 4.4% |
| $25,000 to $34,999 | 28 | 3.3% |
| $35,000 to $49,999 | 26 | 3.0% |
| $50,000 to $74,999 | 57 | 6.6% |
| $75,000 to $99,999 | 56 | 6.5% |
| $100,000 to $149,999 | 293 | 34.1% |
| $150,000 to $199,999 | 161 | 18.7% |
| $200,000+ | 178 | 20.7% |
Family Income by Famaliy Size in Harbor Bluffs
4-person families (178 | 20.7%) account for the highest median family income in Harbor Bluffs with $153,038 per family, while 2-person families (470 | 54.7%) have the highest median income of $67,636 per family member.
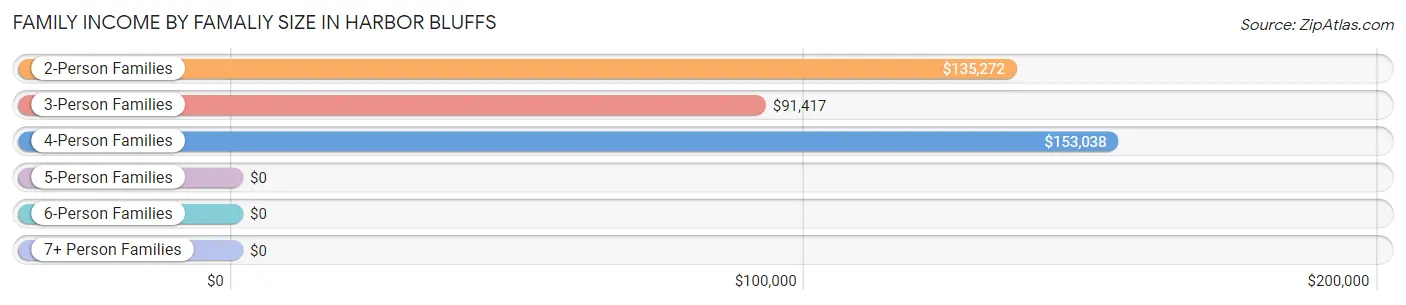
| Income Bracket | # Families | Median Income |
| 2-Person Families | 470 (54.7%) | $135,272 |
| 3-Person Families | 161 (18.7%) | $91,417 |
| 4-Person Families | 178 (20.7%) | $153,038 |
| 5-Person Families | 50 (5.8%) | $0 |
| 6-Person Families | 0 (0.0%) | $0 |
| 7+ Person Families | 0 (0.0%) | $0 |
| Total | 859 (100.0%) | $135,580 |
Family Income by Number of Earners in Harbor Bluffs
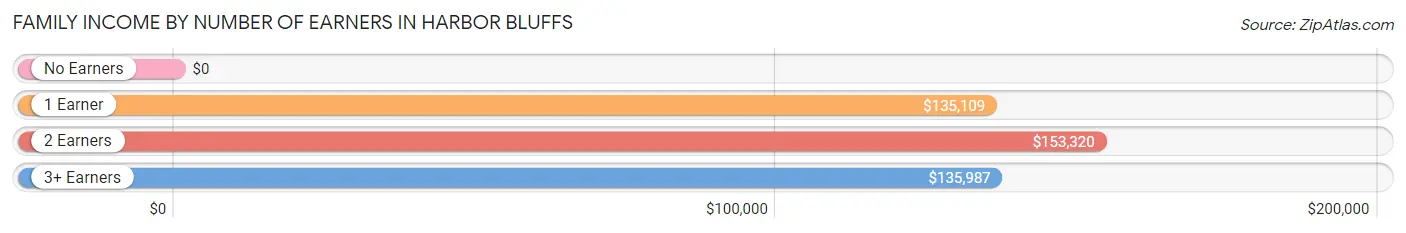
| Number of Earners | # Families | Median Income |
| No Earners | 190 (22.1%) | $0 |
| 1 Earner | 270 (31.4%) | $135,109 |
| 2 Earners | 283 (33.0%) | $153,320 |
| 3+ Earners | 116 (13.5%) | $135,987 |
| Total | 859 (100.0%) | $135,580 |
Household Income in Harbor Bluffs
Household Income Brackets in Harbor Bluffs
With 319 households falling in the category, the $100,000 to $149,999 income range is the most frequent in Harbor Bluffs, accounting for 28.7% of all households.
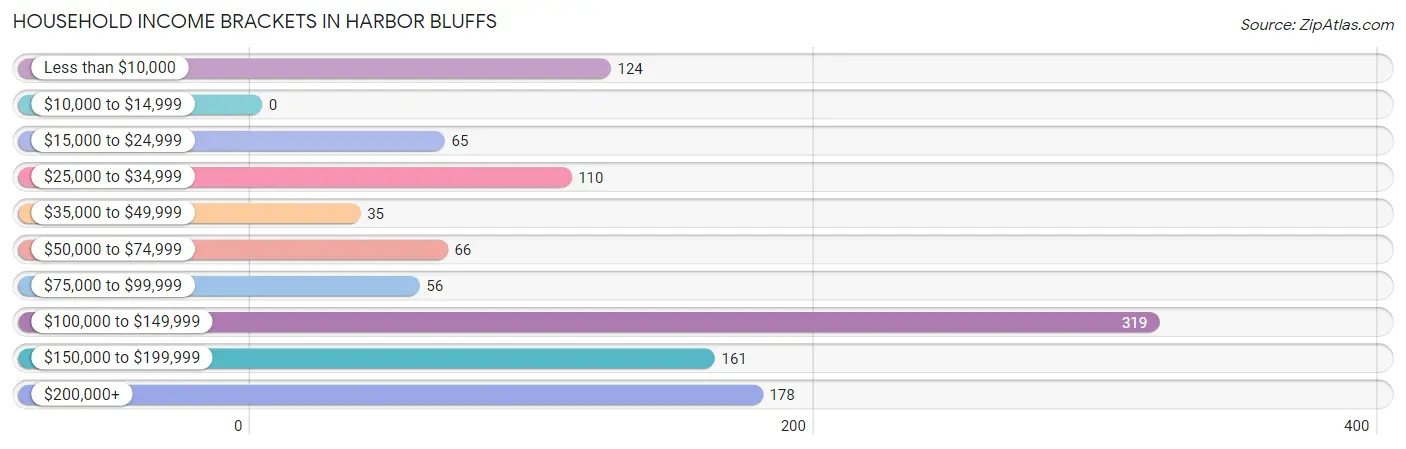
| Income Bracket | # Households | % Households |
| Less than $10,000 | 124 | 11.1% |
| $10,000 to $14,999 | 0 | 0.0% |
| $15,000 to $24,999 | 65 | 5.8% |
| $25,000 to $34,999 | 110 | 9.9% |
| $35,000 to $49,999 | 35 | 3.1% |
| $50,000 to $74,999 | 66 | 5.9% |
| $75,000 to $99,999 | 56 | 5.0% |
| $100,000 to $149,999 | 319 | 28.7% |
| $150,000 to $199,999 | 161 | 14.5% |
| $200,000+ | 178 | 16.0% |
Household Income by Householder Age in Harbor Bluffs
The median household income in Harbor Bluffs is $108,403, with the highest median household income of $137,083 found in the 45 to 64 years age bracket for the primary householder. A total of 652 households (58.6%) fall into this category. Meanwhile, the 15 to 24 years age bracket for the primary householder has the lowest median household income of $0, with 24 households (2.2%) in this group.
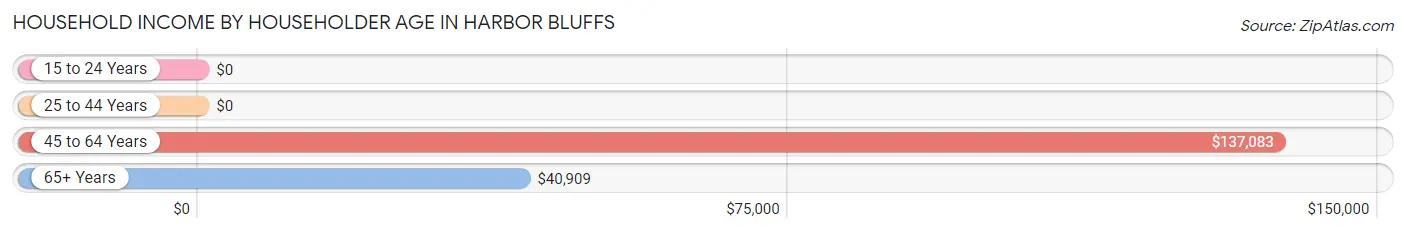
| Income Bracket | # Households | Median Income |
| 15 to 24 Years | 24 (2.2%) | $0 |
| 25 to 44 Years | 97 (8.7%) | $0 |
| 45 to 64 Years | 652 (58.6%) | $137,083 |
| 65+ Years | 340 (30.5%) | $40,909 |
| Total | 1,113 (100.0%) | $108,403 |
Poverty in Harbor Bluffs
Income Below Poverty by Sex and Age in Harbor Bluffs
With 2.9% poverty level for males and 10.9% for females among the residents of Harbor Bluffs, 55 to 64 year old males and 65 to 74 year old females are the most vulnerable to poverty, with 38 males (15.1%) and 38 females (22.5%) in their respective age groups living below the poverty level.
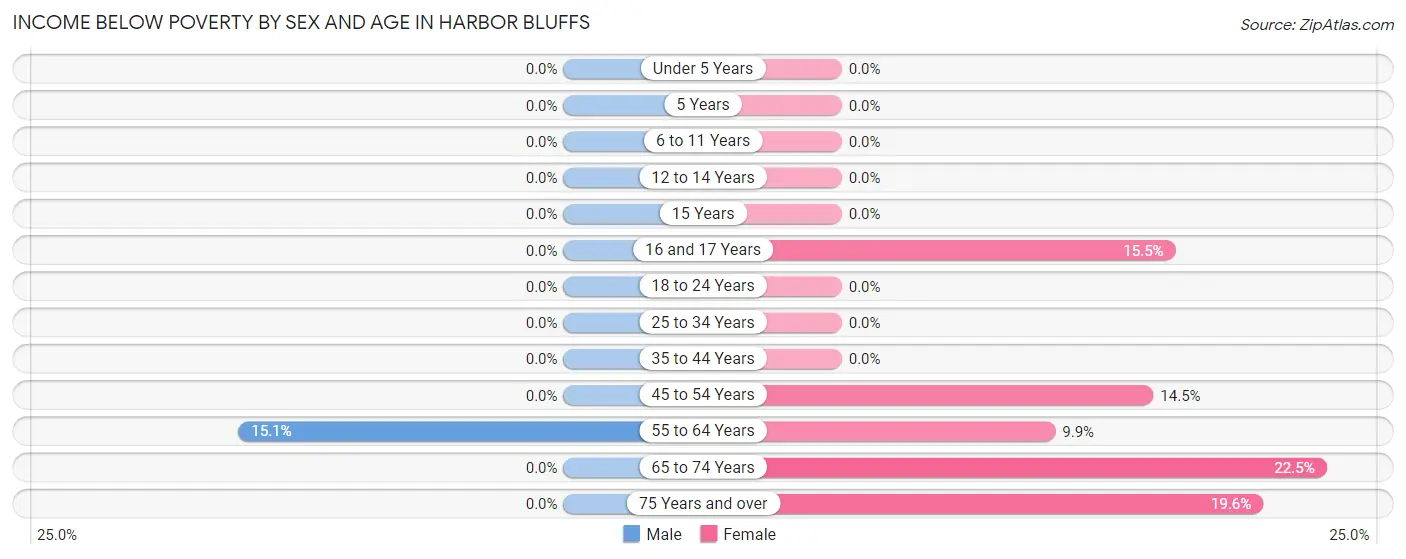
| Age Bracket | Male | Female |
| Under 5 Years | 0 (0.0%) | 0 (0.0%) |
| 5 Years | 0 (0.0%) | 0 (0.0%) |
| 6 to 11 Years | 0 (0.0%) | 0 (0.0%) |
| 12 to 14 Years | 0 (0.0%) | 0 (0.0%) |
| 15 Years | 0 (0.0%) | 0 (0.0%) |
| 16 and 17 Years | 0 (0.0%) | 26 (15.5%) |
| 18 to 24 Years | 0 (0.0%) | 0 (0.0%) |
| 25 to 34 Years | 0 (0.0%) | 0 (0.0%) |
| 35 to 44 Years | 0 (0.0%) | 0 (0.0%) |
| 45 to 54 Years | 0 (0.0%) | 58 (14.5%) |
| 55 to 64 Years | 38 (15.1%) | 22 (9.9%) |
| 65 to 74 Years | 0 (0.0%) | 38 (22.5%) |
| 75 Years and over | 0 (0.0%) | 26 (19.6%) |
| Total | 38 (2.9%) | 170 (10.9%) |
Income Above Poverty by Sex and Age in Harbor Bluffs
According to the poverty statistics in Harbor Bluffs, males aged under 5 years and females aged under 5 years are the age groups that are most secure financially, with 100.0% of males and 100.0% of females in these age groups living above the poverty line.
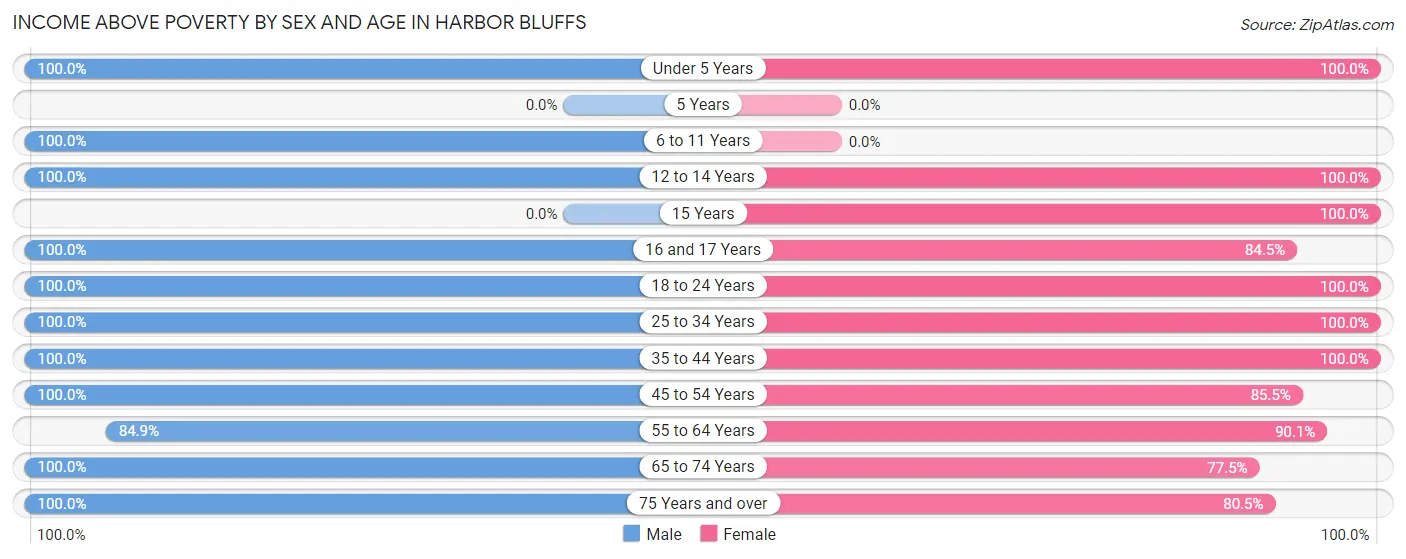
| Age Bracket | Male | Female |
| Under 5 Years | 16 (100.0%) | 19 (100.0%) |
| 5 Years | 0 (0.0%) | 0 (0.0%) |
| 6 to 11 Years | 69 (100.0%) | 0 (0.0%) |
| 12 to 14 Years | 49 (100.0%) | 34 (100.0%) |
| 15 Years | 0 (0.0%) | 14 (100.0%) |
| 16 and 17 Years | 147 (100.0%) | 142 (84.5%) |
| 18 to 24 Years | 202 (100.0%) | 207 (100.0%) |
| 25 to 34 Years | 66 (100.0%) | 88 (100.0%) |
| 35 to 44 Years | 34 (100.0%) | 107 (100.0%) |
| 45 to 54 Years | 196 (100.0%) | 343 (85.5%) |
| 55 to 64 Years | 214 (84.9%) | 200 (90.1%) |
| 65 to 74 Years | 231 (100.0%) | 131 (77.5%) |
| 75 Years and over | 65 (100.0%) | 107 (80.4%) |
| Total | 1,289 (97.1%) | 1,392 (89.1%) |
Income Below Poverty Among Married-Couple Families in Harbor Bluffs
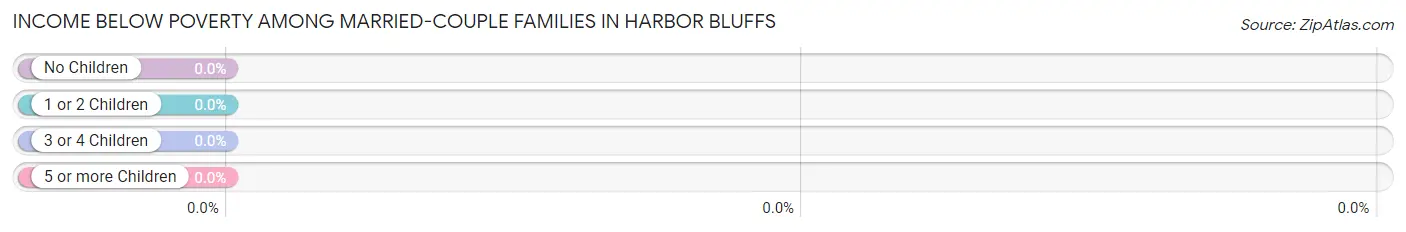
| Children | Above Poverty | Below Poverty |
| No Children | 453 (100.0%) | 0 (0.0%) |
| 1 or 2 Children | 293 (100.0%) | 0 (0.0%) |
| 3 or 4 Children | 0 (0.0%) | 0 (0.0%) |
| 5 or more Children | 0 (0.0%) | 0 (0.0%) |
| Total | 746 (100.0%) | 0 (0.0%) |
Income Below Poverty Among Single-Parent Households in Harbor Bluffs
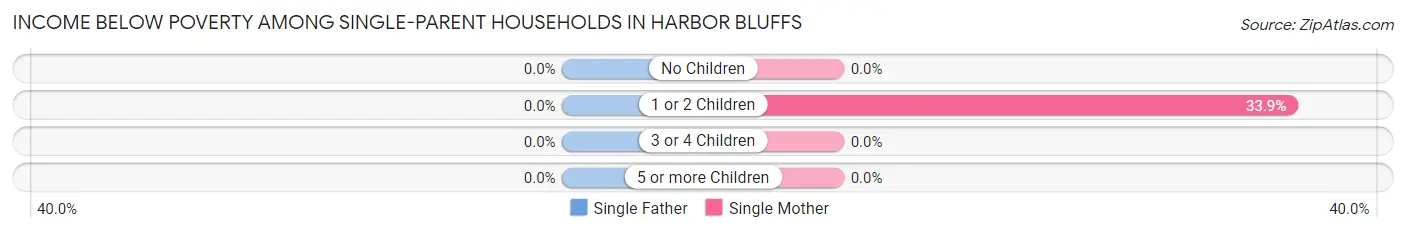
| Children | Single Father | Single Mother |
| No Children | 0 (0.0%) | 0 (0.0%) |
| 1 or 2 Children | 0 (0.0%) | 22 (33.9%) |
| 3 or 4 Children | 0 (0.0%) | 0 (0.0%) |
| 5 or more Children | 0 (0.0%) | 0 (0.0%) |
| Total | 0 (0.0%) | 22 (20.7%) |
Income Below Poverty Among Married-Couple vs Single-Parent Households in Harbor Bluffs
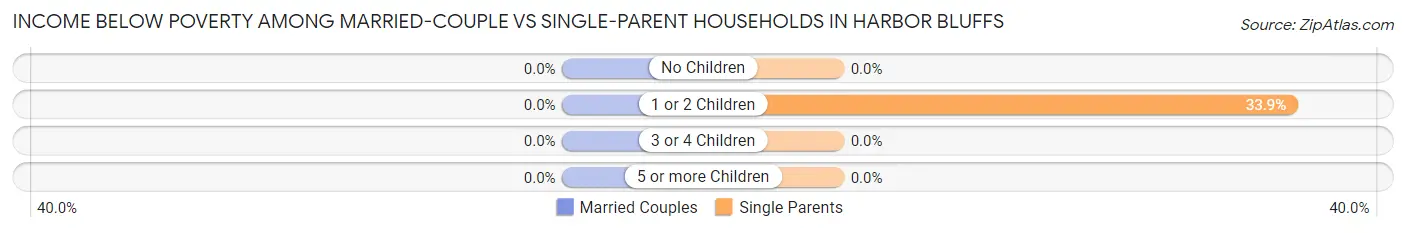
| Children | Married-Couple Families | Single-Parent Households |
| No Children | 0 (0.0%) | 0 (0.0%) |
| 1 or 2 Children | 0 (0.0%) | 22 (33.9%) |
| 3 or 4 Children | 0 (0.0%) | 0 (0.0%) |
| 5 or more Children | 0 (0.0%) | 0 (0.0%) |
| Total | 0 (0.0%) | 22 (19.5%) |
Race in Harbor Bluffs
The most populous races in Harbor Bluffs are White / Caucasian (2,676 | 92.6%), Two or more Races (99 | 3.4%), and Asian (50 | 1.7%).
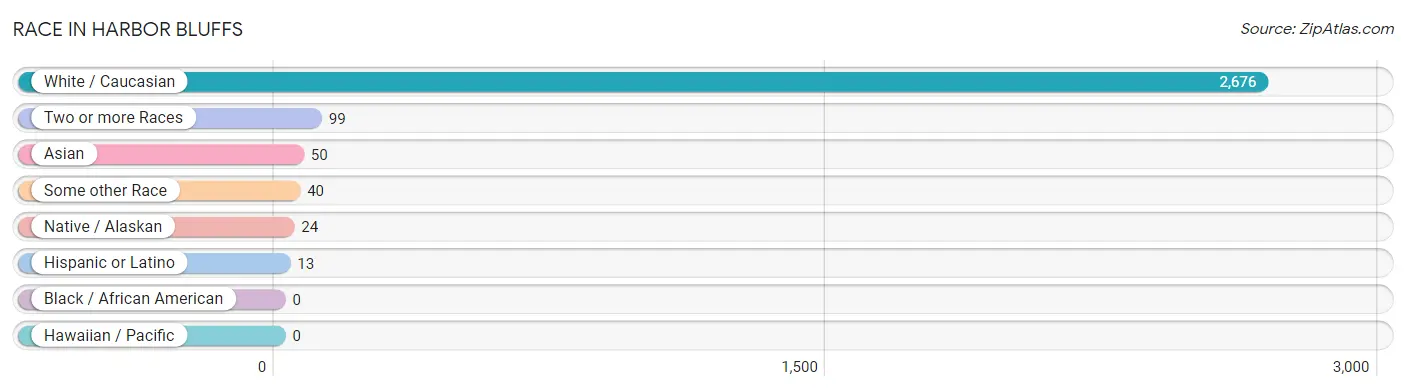
| Race | # Population | % Population |
| Asian | 50 | 1.7% |
| Black / African American | 0 | 0.0% |
| Hawaiian / Pacific | 0 | 0.0% |
| Hispanic or Latino | 13 | 0.4% |
| Native / Alaskan | 24 | 0.8% |
| White / Caucasian | 2,676 | 92.6% |
| Two or more Races | 99 | 3.4% |
| Some other Race | 40 | 1.4% |
| Total | 2,889 | 100.0% |
Ancestry in Harbor Bluffs
The most populous ancestries reported in Harbor Bluffs are German (482 | 16.7%), English (368 | 12.7%), Irish (268 | 9.3%), Polish (159 | 5.5%), and French (158 | 5.5%), together accounting for 49.7% of all Harbor Bluffs residents.
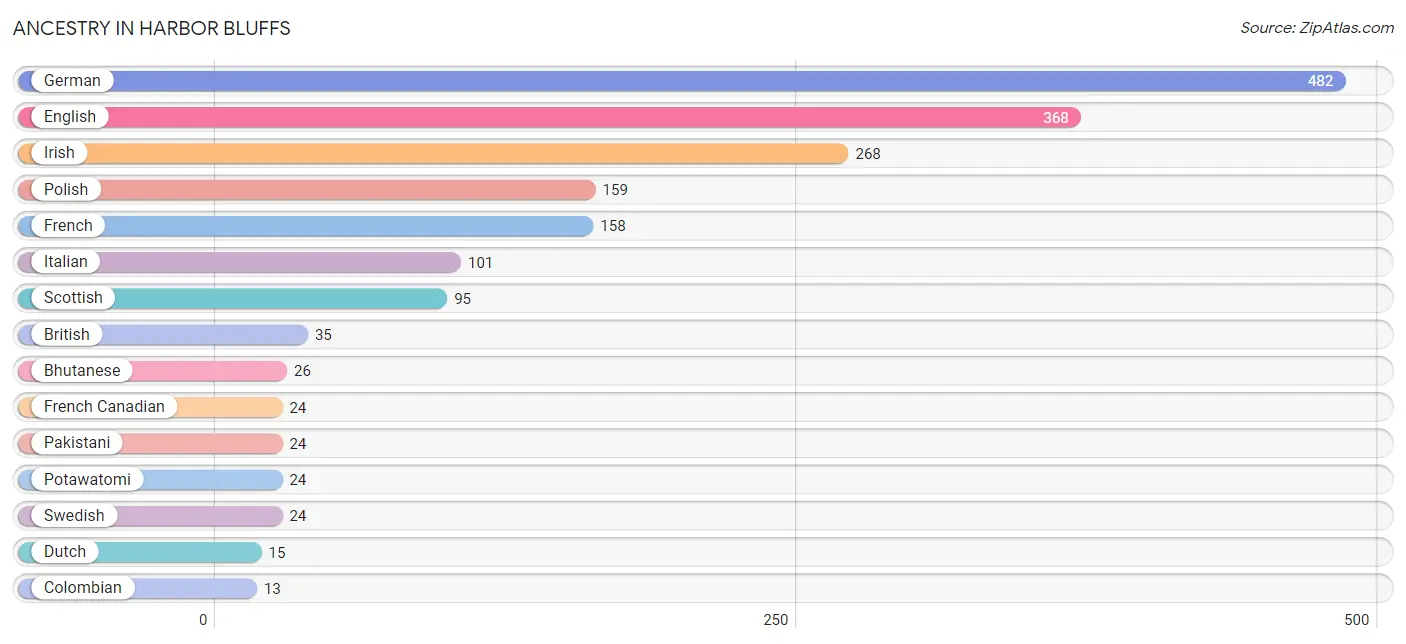
| Ancestry | # Population | % Population |
| Bhutanese | 26 | 0.9% |
| British | 35 | 1.2% |
| Colombian | 13 | 0.4% |
| Czech | 8 | 0.3% |
| Czechoslovakian | 12 | 0.4% |
| Danish | 12 | 0.4% |
| Dutch | 15 | 0.5% |
| English | 368 | 12.7% |
| French | 158 | 5.5% |
| French Canadian | 24 | 0.8% |
| German | 482 | 16.7% |
| Greek | 11 | 0.4% |
| Irish | 268 | 9.3% |
| Italian | 101 | 3.5% |
| Norwegian | 12 | 0.4% |
| Pakistani | 24 | 0.8% |
| Polish | 159 | 5.5% |
| Potawatomi | 24 | 0.8% |
| Scotch-Irish | 9 | 0.3% |
| Scottish | 95 | 3.3% |
| South American | 13 | 0.4% |
| Swedish | 24 | 0.8% |
| Welsh | 12 | 0.4% | View All 23 Rows |
Immigrants in Harbor Bluffs
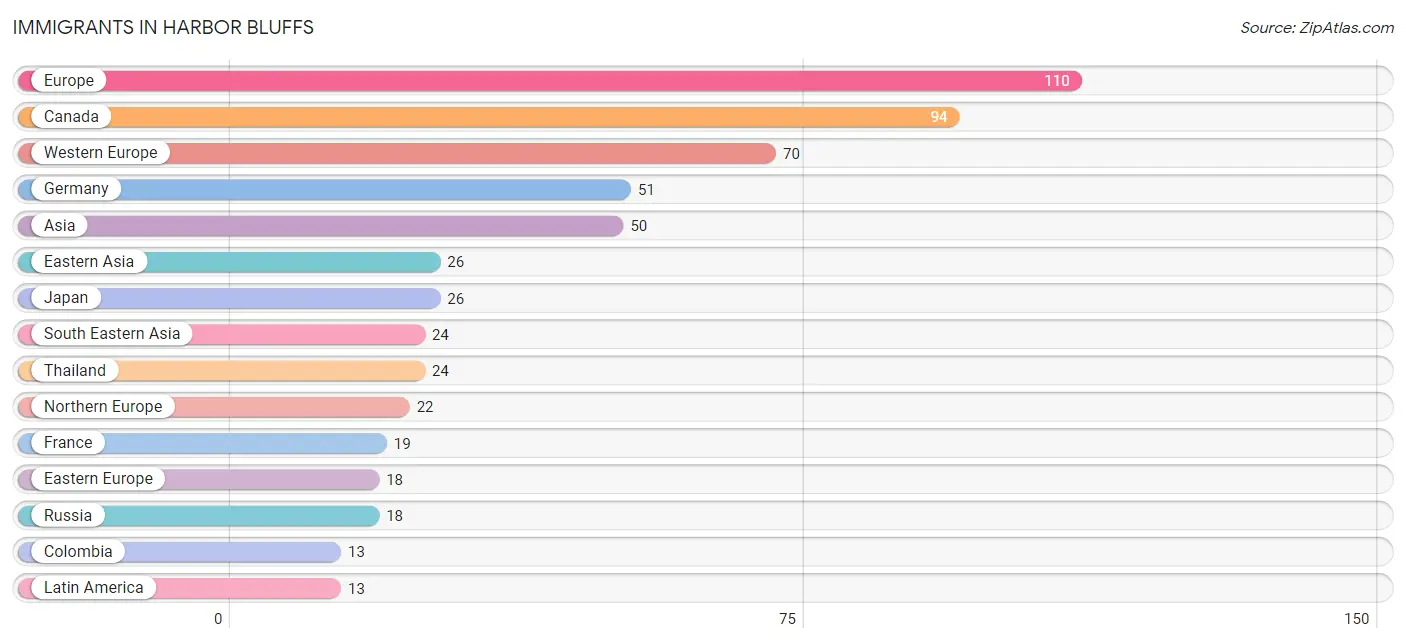
The most numerous immigrant groups reported in Harbor Bluffs came from Europe (110 | 3.8%), Canada (94 | 3.3%), Western Europe (70 | 2.4%), Germany (51 | 1.8%), and Asia (50 | 1.7%), together accounting for 13.0% of all Harbor Bluffs residents.
| Immigration Origin | # Population | % Population |
| Asia | 50 | 1.7% |
| Canada | 94 | 3.3% |
| Colombia | 13 | 0.4% |
| Eastern Asia | 26 | 0.9% |
| Eastern Europe | 18 | 0.6% |
| Europe | 110 | 3.8% |
| France | 19 | 0.7% |
| Germany | 51 | 1.8% |
| Japan | 26 | 0.9% |
| Latin America | 13 | 0.4% |
| Northern Europe | 22 | 0.8% |
| Russia | 18 | 0.6% |
| South America | 13 | 0.4% |
| South Eastern Asia | 24 | 0.8% |
| Thailand | 24 | 0.8% |
| Western Europe | 70 | 2.4% | View All 16 Rows |
Sex and Age in Harbor Bluffs
Sex and Age in Harbor Bluffs
The most populous age groups in Harbor Bluffs are 15 to 19 Years (275 | 20.7%) for men and 15 to 19 Years (316 | 20.2%) for women.
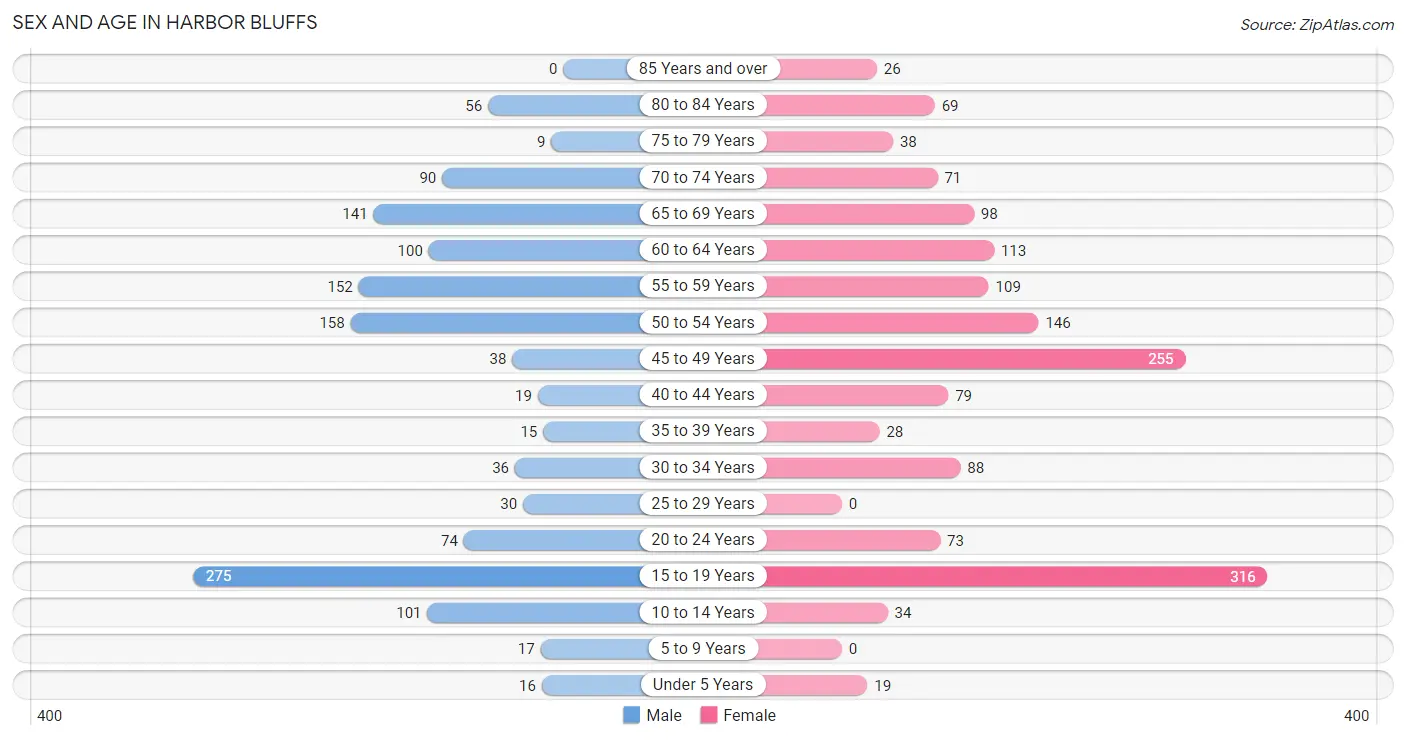
| Age Bracket | Male | Female |
| Under 5 Years | 16 (1.2%) | 19 (1.2%) |
| 5 to 9 Years | 17 (1.3%) | 0 (0.0%) |
| 10 to 14 Years | 101 (7.6%) | 34 (2.2%) |
| 15 to 19 Years | 275 (20.7%) | 316 (20.2%) |
| 20 to 24 Years | 74 (5.6%) | 73 (4.7%) |
| 25 to 29 Years | 30 (2.3%) | 0 (0.0%) |
| 30 to 34 Years | 36 (2.7%) | 88 (5.6%) |
| 35 to 39 Years | 15 (1.1%) | 28 (1.8%) |
| 40 to 44 Years | 19 (1.4%) | 79 (5.1%) |
| 45 to 49 Years | 38 (2.9%) | 255 (16.3%) |
| 50 to 54 Years | 158 (11.9%) | 146 (9.3%) |
| 55 to 59 Years | 152 (11.5%) | 109 (7.0%) |
| 60 to 64 Years | 100 (7.5%) | 113 (7.2%) |
| 65 to 69 Years | 141 (10.6%) | 98 (6.3%) |
| 70 to 74 Years | 90 (6.8%) | 71 (4.5%) |
| 75 to 79 Years | 9 (0.7%) | 38 (2.4%) |
| 80 to 84 Years | 56 (4.2%) | 69 (4.4%) |
| 85 Years and over | 0 (0.0%) | 26 (1.7%) |
| Total | 1,327 (100.0%) | 1,562 (100.0%) |
Families and Households in Harbor Bluffs
Median Family Size in Harbor Bluffs
The median family size in Harbor Bluffs is 2.98 persons per family, with married-couple families (746 | 86.9%) accounting for the largest median family size of 3.03 persons per family. On the other hand, single female/mother families (106 | 12.3%) represent the smallest median family size with 2.66 persons per family.
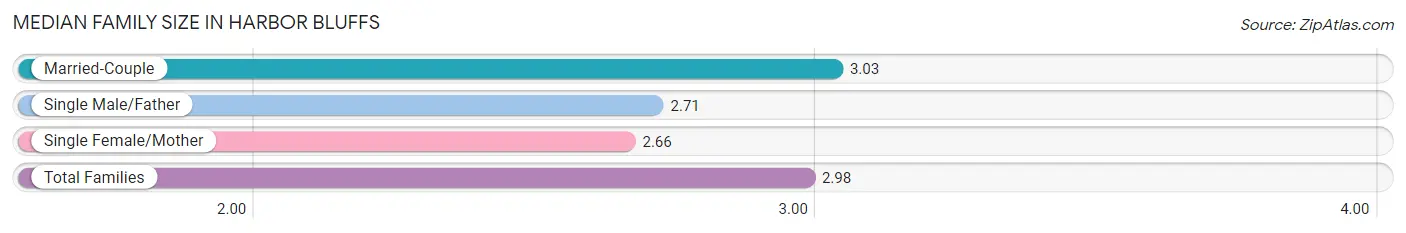
| Family Type | # Families | Family Size |
| Married-Couple | 746 (86.9%) | 3.03 |
| Single Male/Father | 7 (0.8%) | 2.71 |
| Single Female/Mother | 106 (12.3%) | 2.66 |
| Total Families | 859 (100.0%) | 2.98 |
Median Household Size in Harbor Bluffs
The median household size in Harbor Bluffs is 2.60 persons per household, with married-couple households (746 | 67.0%) accounting for the largest median household size of 3.03 persons per household. non-family households (254 | 22.8%) represent the smallest median household size with 1.30 persons per household.
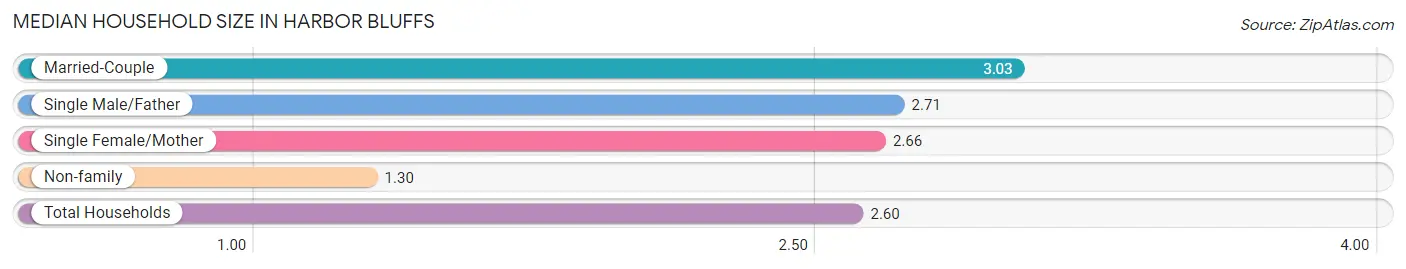
| Household Type | # Households | Household Size |
| Married-Couple | 746 (67.0%) | 3.03 |
| Single Male/Father | 7 (0.6%) | 2.71 |
| Single Female/Mother | 106 (9.5%) | 2.66 |
| Non-family | 254 (22.8%) | 1.30 |
| Total Households | 1,113 (100.0%) | 2.60 |
Household Size by Marriage Status in Harbor Bluffs
Out of a total of 1,113 households in Harbor Bluffs, 859 (77.2%) are family households, while 254 (22.8%) are nonfamily households. The most numerous type of family households are 2-person households, comprising 470, and the most common type of nonfamily households are 1-person households, comprising 198.
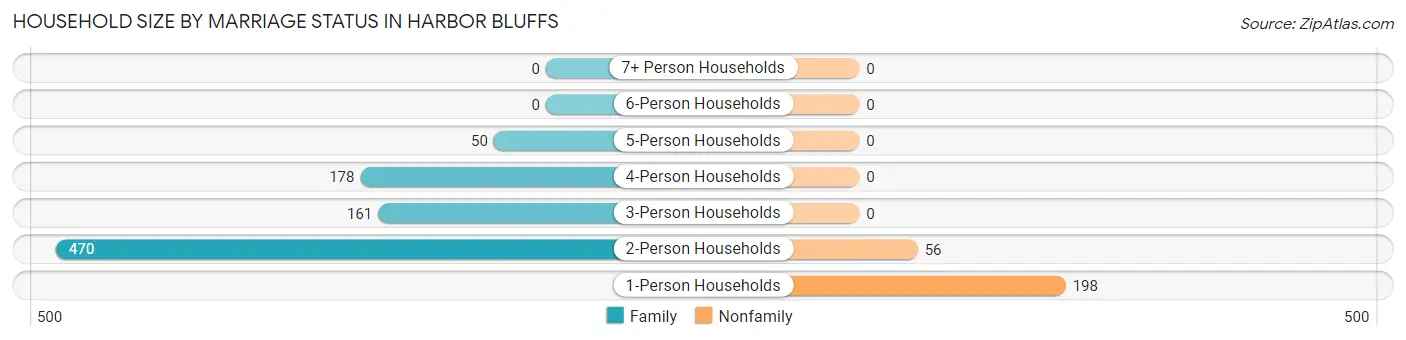
| Household Size | Family Households | Nonfamily Households |
| 1-Person Households | - | 198 (17.8%) |
| 2-Person Households | 470 (42.2%) | 56 (5.0%) |
| 3-Person Households | 161 (14.5%) | 0 (0.0%) |
| 4-Person Households | 178 (16.0%) | 0 (0.0%) |
| 5-Person Households | 50 (4.5%) | 0 (0.0%) |
| 6-Person Households | 0 (0.0%) | 0 (0.0%) |
| 7+ Person Households | 0 (0.0%) | 0 (0.0%) |
| Total | 859 (77.2%) | 254 (22.8%) |
Female Fertility in Harbor Bluffs
Fertility by Age in Harbor Bluffs
Average fertility rate in Harbor Bluffs is 18.0 births per 1,000 women. Women in the age bracket of 35 to 50 years have the highest fertility rate with 40.0 births per 1,000 women. Women in the age bracket of 35 to 50 years acount for 100.0% of all women with births.
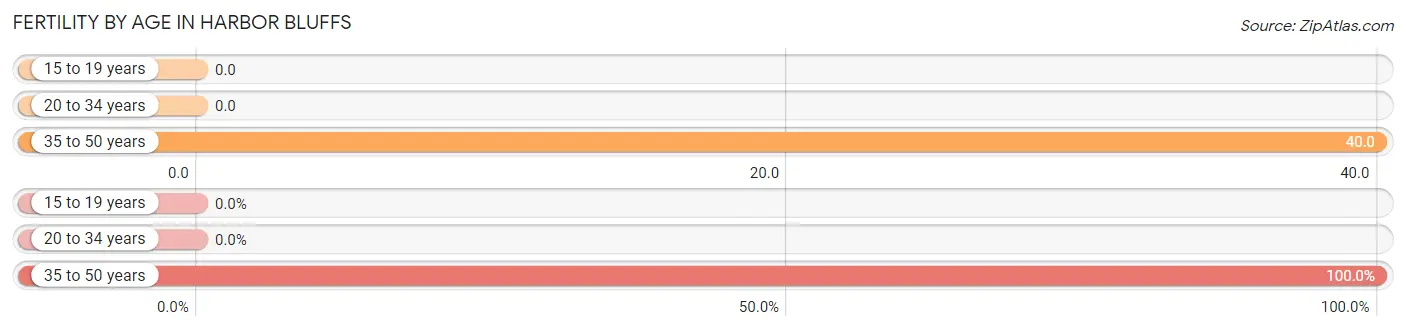
| Age Bracket | Women with Births | Births / 1,000 Women |
| 15 to 19 years | 0 (0.0%) | 0.0 |
| 20 to 34 years | 0 (0.0%) | 0.0 |
| 35 to 50 years | 15 (100.0%) | 40.0 |
| Total | 15 (100.0%) | 18.0 |
Fertility by Age by Marriage Status in Harbor Bluffs
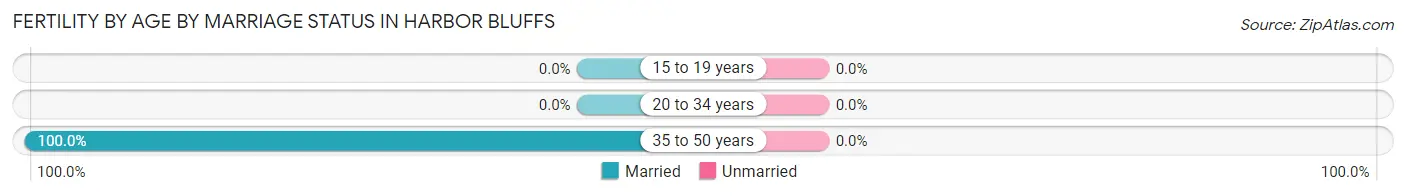
| Age Bracket | Married | Unmarried |
| 15 to 19 years | 0 (0.0%) | 0 (0.0%) |
| 20 to 34 years | 0 (0.0%) | 0 (0.0%) |
| 35 to 50 years | 15 (100.0%) | 0 (0.0%) |
| Total | 15 (100.0%) | 0 (0.0%) |
Fertility by Education in Harbor Bluffs
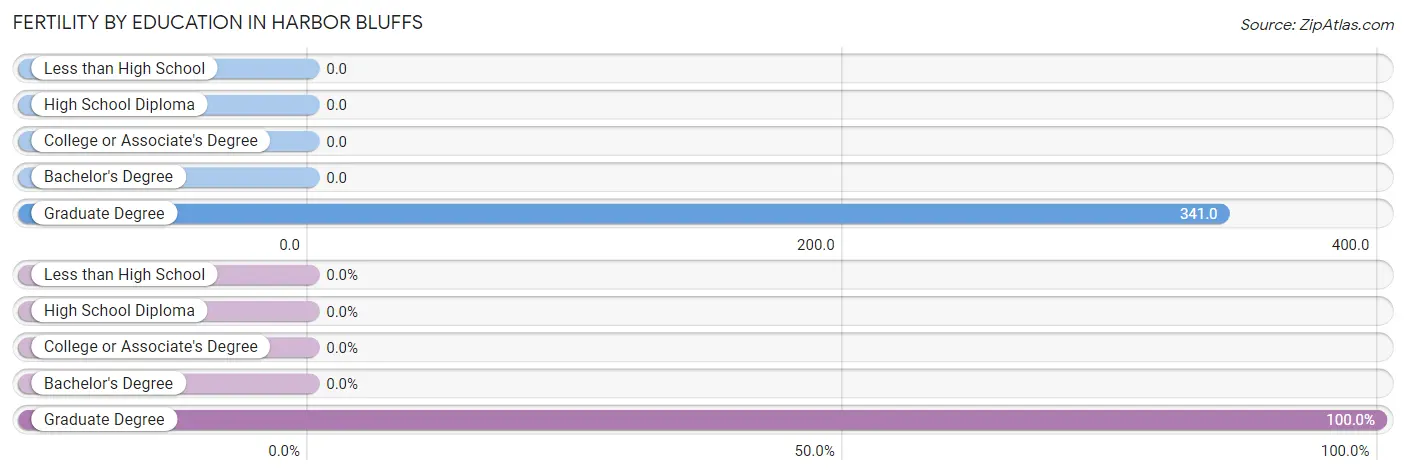
| Educational Attainment | Women with Births | Births / 1,000 Women |
| Less than High School | 0 (0.0%) | 0.0 |
| High School Diploma | 0 (0.0%) | 0.0 |
| College or Associate's Degree | 0 (0.0%) | 0.0 |
| Bachelor's Degree | 0 (0.0%) | 0.0 |
| Graduate Degree | 15 (100.0%) | 341.0 |
| Total | 15 (100.0%) | 18.0 |
Fertility by Education by Marriage Status in Harbor Bluffs
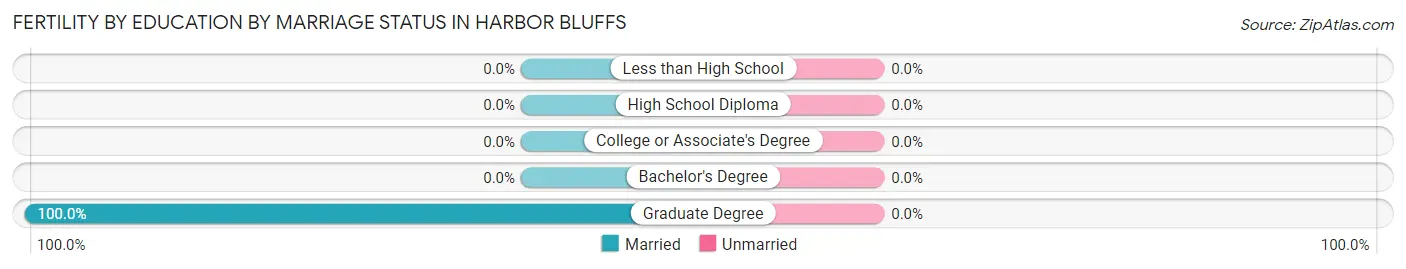
| Educational Attainment | Married | Unmarried |
| Less than High School | 0 (0.0%) | 0 (0.0%) |
| High School Diploma | 0 (0.0%) | 0 (0.0%) |
| College or Associate's Degree | 0 (0.0%) | 0 (0.0%) |
| Bachelor's Degree | 0 (0.0%) | 0 (0.0%) |
| Graduate Degree | 15 (100.0%) | 0 (0.0%) |
| Total | 15 (100.0%) | 0 (0.0%) |
Employment Characteristics in Harbor Bluffs
Employment by Class of Employer in Harbor Bluffs
Among the 1,180 employed individuals in Harbor Bluffs, private company employees (755 | 64.0%), not-for-profit organizations (127 | 10.8%), and self-employed (incorporated) (117 | 9.9%) make up the most common classes of employment.
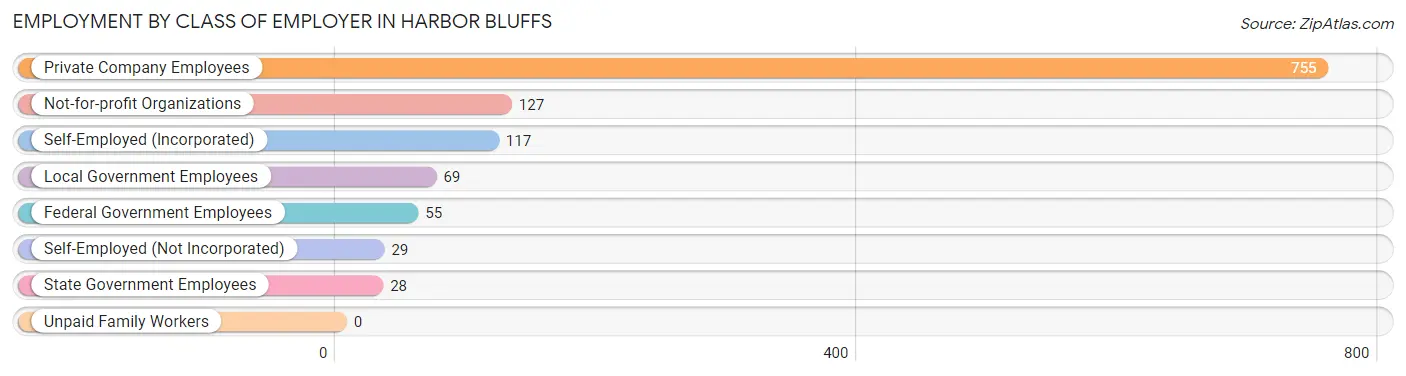
| Employer Class | # Employees | % Employees |
| Private Company Employees | 755 | 64.0% |
| Self-Employed (Incorporated) | 117 | 9.9% |
| Self-Employed (Not Incorporated) | 29 | 2.5% |
| Not-for-profit Organizations | 127 | 10.8% |
| Local Government Employees | 69 | 5.9% |
| State Government Employees | 28 | 2.4% |
| Federal Government Employees | 55 | 4.7% |
| Unpaid Family Workers | 0 | 0.0% |
| Total | 1,180 | 100.0% |
Employment Status by Age in Harbor Bluffs
According to the labor force statistics for Harbor Bluffs, out of the total population over 16 years of age (2,688), 49.8% or 1,339 individuals are in the labor force, with 9.6% or 129 of them unemployed. The age group with the highest labor force participation rate is 45 to 54 years, with 94.1% or 562 individuals in the labor force. Within the labor force, the 16 to 19 years age range has the highest percentage of unemployed individuals, with 39.1% or 45 of them being unemployed.
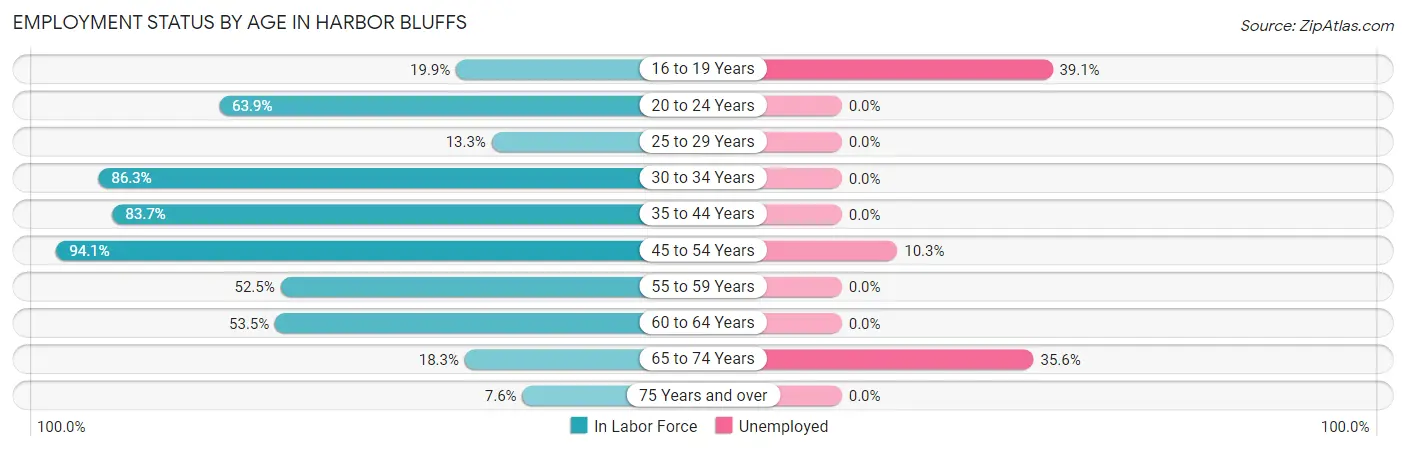
| Age Bracket | In Labor Force | Unemployed |
| 16 to 19 Years | 115 (19.9%) | 45 (39.1%) |
| 20 to 24 Years | 94 (63.9%) | 0 (0.0%) |
| 25 to 29 Years | 4 (13.3%) | 0 (0.0%) |
| 30 to 34 Years | 107 (86.3%) | 0 (0.0%) |
| 35 to 44 Years | 118 (83.7%) | 0 (0.0%) |
| 45 to 54 Years | 562 (94.1%) | 58 (10.3%) |
| 55 to 59 Years | 137 (52.5%) | 0 (0.0%) |
| 60 to 64 Years | 114 (53.5%) | 0 (0.0%) |
| 65 to 74 Years | 73 (18.3%) | 26 (35.6%) |
| 75 Years and over | 15 (7.6%) | 0 (0.0%) |
| Total | 1,339 (49.8%) | 129 (9.6%) |
Employment Status by Educational Attainment in Harbor Bluffs
According to labor force statistics for Harbor Bluffs, 76.3% of individuals (1,042) out of the total population between 25 and 64 years of age (1,366) are in the labor force, with 5.6% or 58 of them being unemployed. The group with the highest labor force participation rate are those with the educational attainment of high school diploma, with 89.3% or 184 individuals in the labor force. Within the labor force, individuals with college / associate degree education have the highest percentage of unemployment, with 17.3% or 58 of them being unemployed.
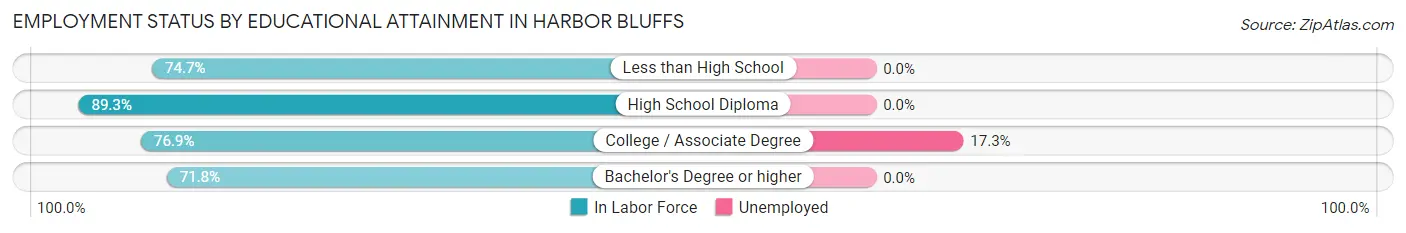
| Educational Attainment | In Labor Force | Unemployed |
| Less than High School | 74 (74.7%) | 0 (0.0%) |
| High School Diploma | 184 (89.3%) | 0 (0.0%) |
| College / Associate Degree | 336 (76.9%) | 76 (17.3%) |
| Bachelor's Degree or higher | 448 (71.8%) | 0 (0.0%) |
| Total | 1,042 (76.3%) | 76 (5.6%) |
Employment Occupations by Sex in Harbor Bluffs
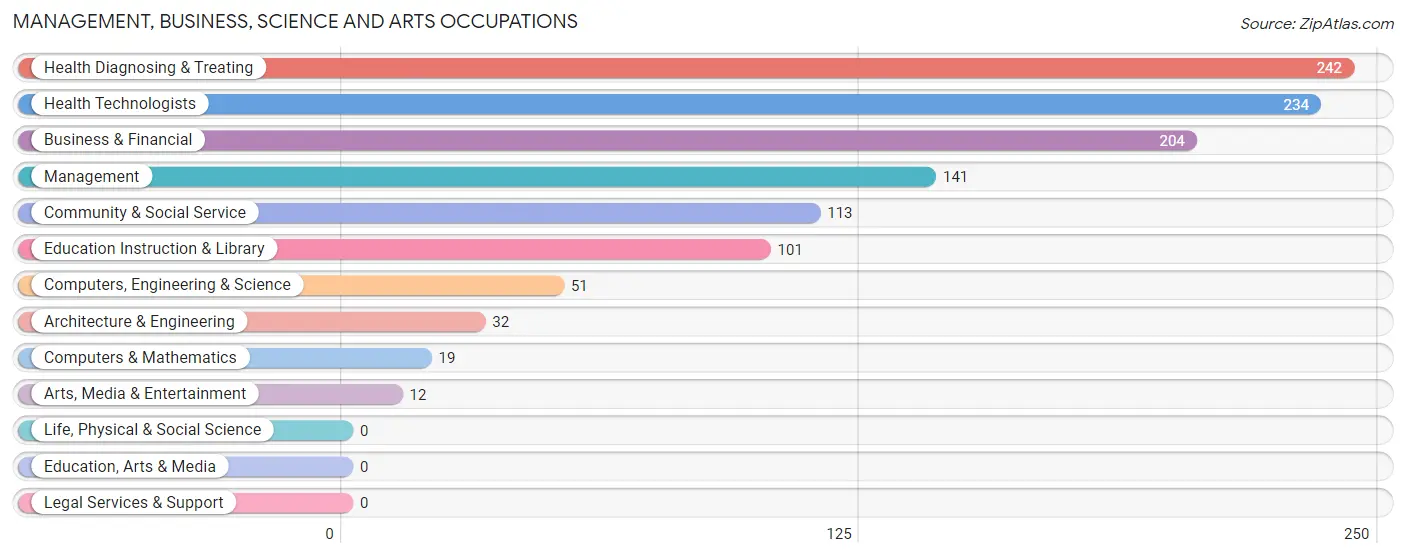
Management, Business, Science and Arts Occupations
The most common Management, Business, Science and Arts occupations in Harbor Bluffs are Health Diagnosing & Treating (242 | 20.0%), Health Technologists (234 | 19.3%), Business & Financial (204 | 16.9%), Management (141 | 11.7%), and Community & Social Service (113 | 9.3%).
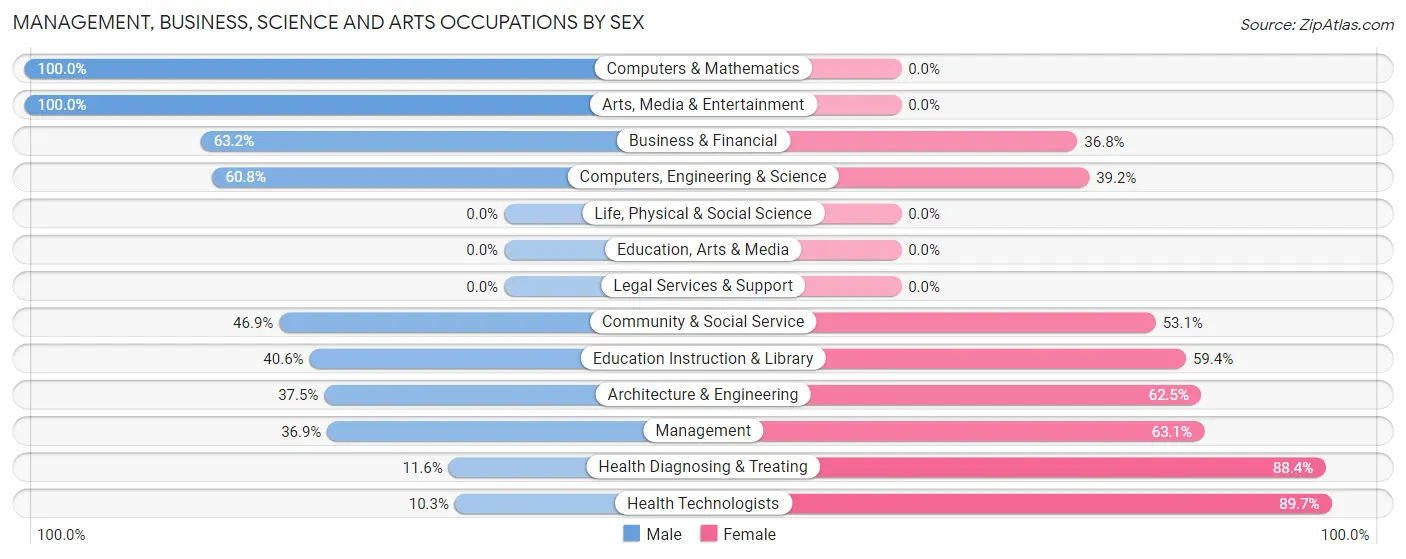
Management, Business, Science and Arts Occupations by Sex
Within the Management, Business, Science and Arts occupations in Harbor Bluffs, the most male-oriented occupations are Computers & Mathematics (100.0%), Arts, Media & Entertainment (100.0%), and Business & Financial (63.2%), while the most female-oriented occupations are Health Technologists (89.7%), Health Diagnosing & Treating (88.4%), and Management (63.1%).
| Occupation | Male | Female |
| Management | 52 (36.9%) | 89 (63.1%) |
| Business & Financial | 129 (63.2%) | 75 (36.8%) |
| Computers, Engineering & Science | 31 (60.8%) | 20 (39.2%) |
| Computers & Mathematics | 19 (100.0%) | 0 (0.0%) |
| Architecture & Engineering | 12 (37.5%) | 20 (62.5%) |
| Life, Physical & Social Science | 0 (0.0%) | 0 (0.0%) |
| Community & Social Service | 53 (46.9%) | 60 (53.1%) |
| Education, Arts & Media | 0 (0.0%) | 0 (0.0%) |
| Legal Services & Support | 0 (0.0%) | 0 (0.0%) |
| Education Instruction & Library | 41 (40.6%) | 60 (59.4%) |
| Arts, Media & Entertainment | 12 (100.0%) | 0 (0.0%) |
| Health Diagnosing & Treating | 28 (11.6%) | 214 (88.4%) |
| Health Technologists | 24 (10.3%) | 210 (89.7%) |
| Total (Category) | 293 (39.0%) | 458 (61.0%) |
| Total (Overall) | 537 (44.4%) | 673 (55.6%) |
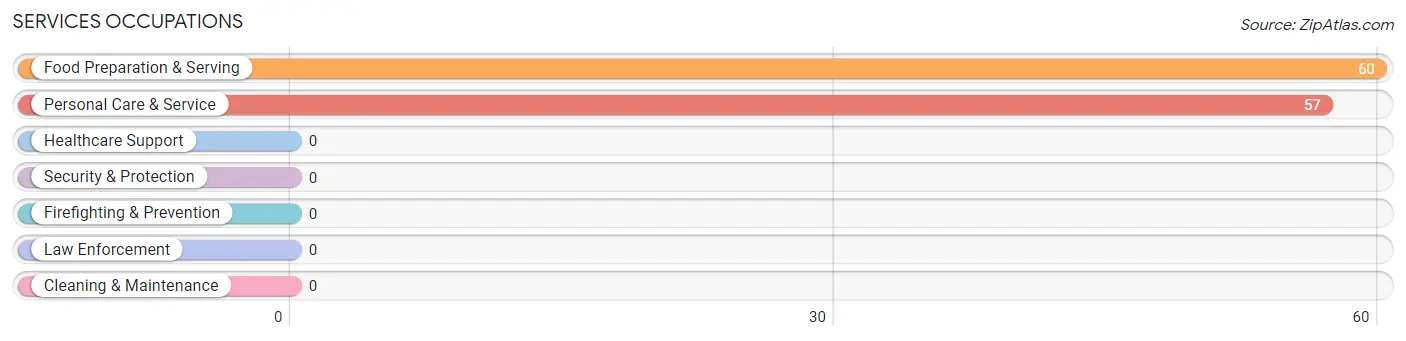
Services Occupations
The most common Services occupations in Harbor Bluffs are Food Preparation & Serving (60 | 5.0%), and Personal Care & Service (57 | 4.7%).
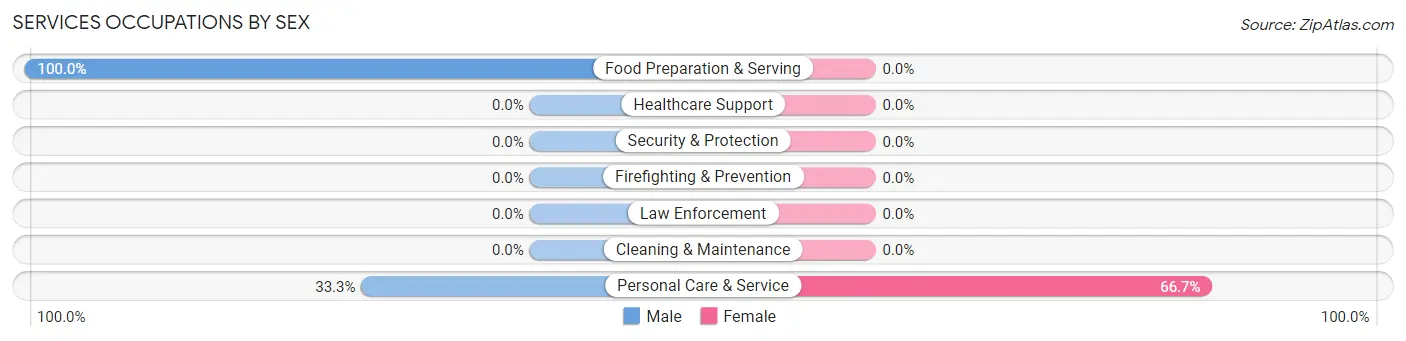
Services Occupations by Sex
| Occupation | Male | Female |
| Healthcare Support | 0 (0.0%) | 0 (0.0%) |
| Security & Protection | 0 (0.0%) | 0 (0.0%) |
| Firefighting & Prevention | 0 (0.0%) | 0 (0.0%) |
| Law Enforcement | 0 (0.0%) | 0 (0.0%) |
| Food Preparation & Serving | 60 (100.0%) | 0 (0.0%) |
| Cleaning & Maintenance | 0 (0.0%) | 0 (0.0%) |
| Personal Care & Service | 19 (33.3%) | 38 (66.7%) |
| Total (Category) | 79 (67.5%) | 38 (32.5%) |
| Total (Overall) | 537 (44.4%) | 673 (55.6%) |
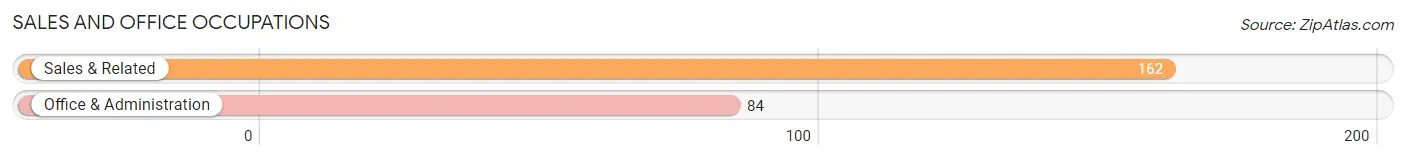
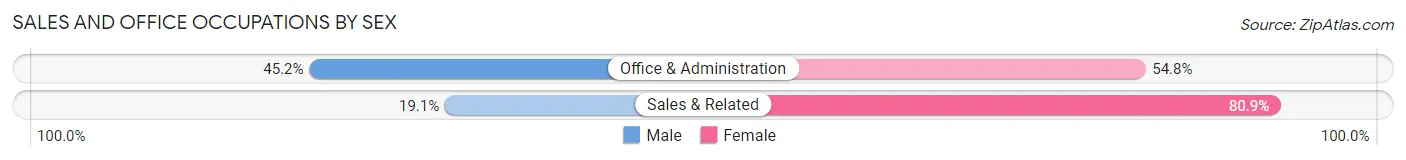
Sales and Office Occupations
The most common Sales and Office occupations in Harbor Bluffs are Sales & Related (162 | 13.4%), and Office & Administration (84 | 6.9%).
Sales and Office Occupations by Sex
| Occupation | Male | Female |
| Sales & Related | 31 (19.1%) | 131 (80.9%) |
| Office & Administration | 38 (45.2%) | 46 (54.8%) |
| Total (Category) | 69 (28.1%) | 177 (72.0%) |
| Total (Overall) | 537 (44.4%) | 673 (55.6%) |
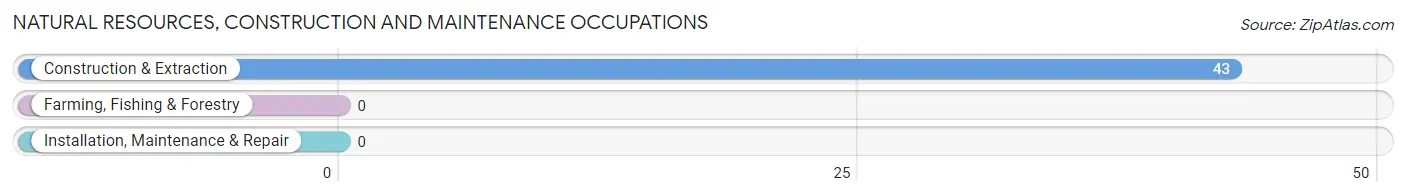
Natural Resources, Construction and Maintenance Occupations
The most common Natural Resources, Construction and Maintenance occupations in Harbor Bluffs are , and Construction & Extraction (43 | 3.5%).
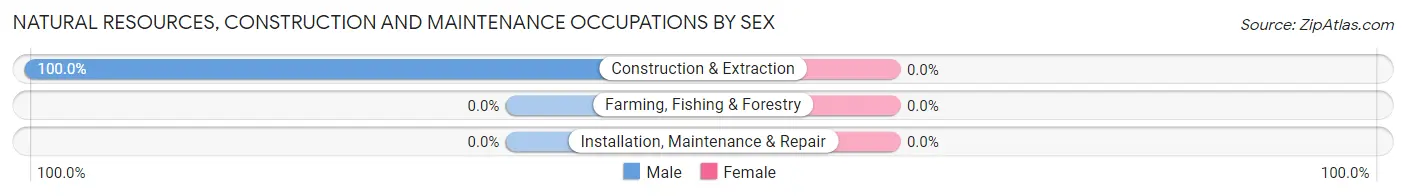
Natural Resources, Construction and Maintenance Occupations by Sex
| Occupation | Male | Female |
| Farming, Fishing & Forestry | 0 (0.0%) | 0 (0.0%) |
| Construction & Extraction | 43 (100.0%) | 0 (0.0%) |
| Installation, Maintenance & Repair | 0 (0.0%) | 0 (0.0%) |
| Total (Category) | 43 (100.0%) | 0 (0.0%) |
| Total (Overall) | 537 (44.4%) | 673 (55.6%) |
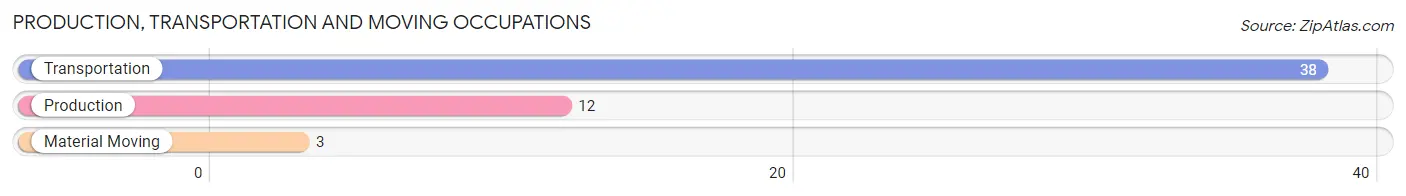
Production, Transportation and Moving Occupations
The most common Production, Transportation and Moving occupations in Harbor Bluffs are Transportation (38 | 3.1%), Production (12 | 1.0%), and Material Moving (3 | 0.3%).
Production, Transportation and Moving Occupations by Sex
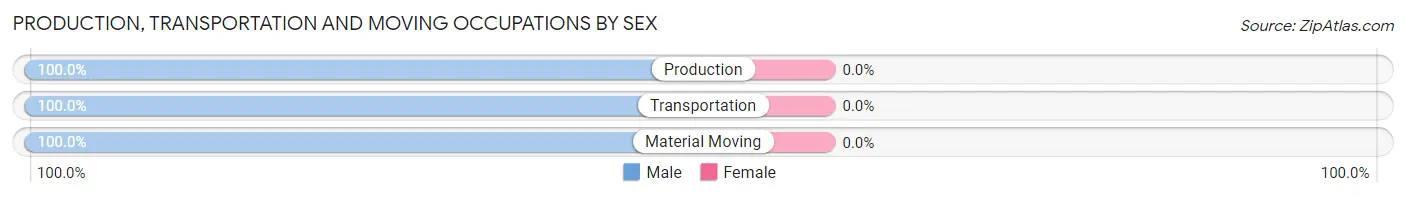
| Occupation | Male | Female |
| Production | 12 (100.0%) | 0 (0.0%) |
| Transportation | 38 (100.0%) | 0 (0.0%) |
| Material Moving | 3 (100.0%) | 0 (0.0%) |
| Total (Category) | 53 (100.0%) | 0 (0.0%) |
| Total (Overall) | 537 (44.4%) | 673 (55.6%) |
Employment Industries by Sex in Harbor Bluffs
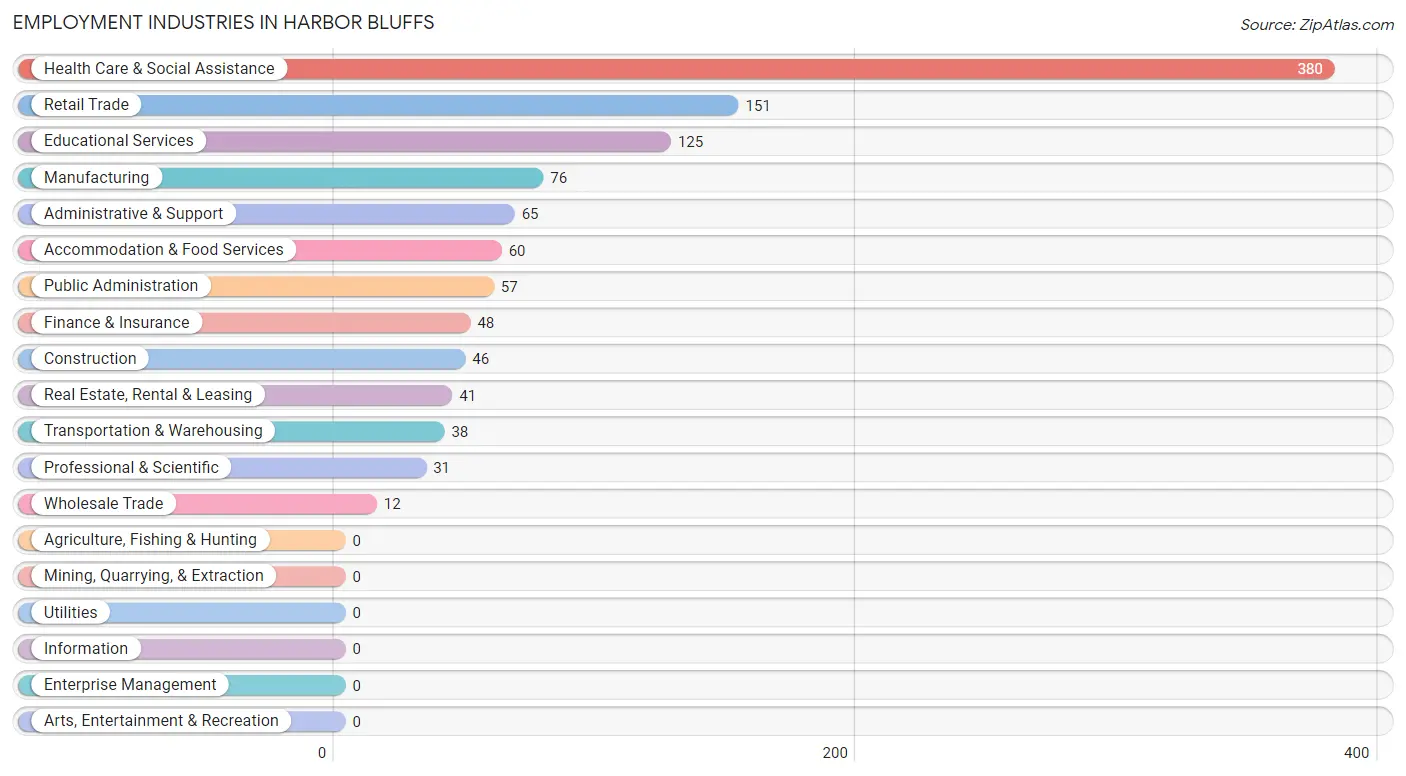
Employment Industries in Harbor Bluffs
The major employment industries in Harbor Bluffs include Health Care & Social Assistance (380 | 31.4%), Retail Trade (151 | 12.5%), Educational Services (125 | 10.3%), Manufacturing (76 | 6.3%), and Administrative & Support (65 | 5.4%).
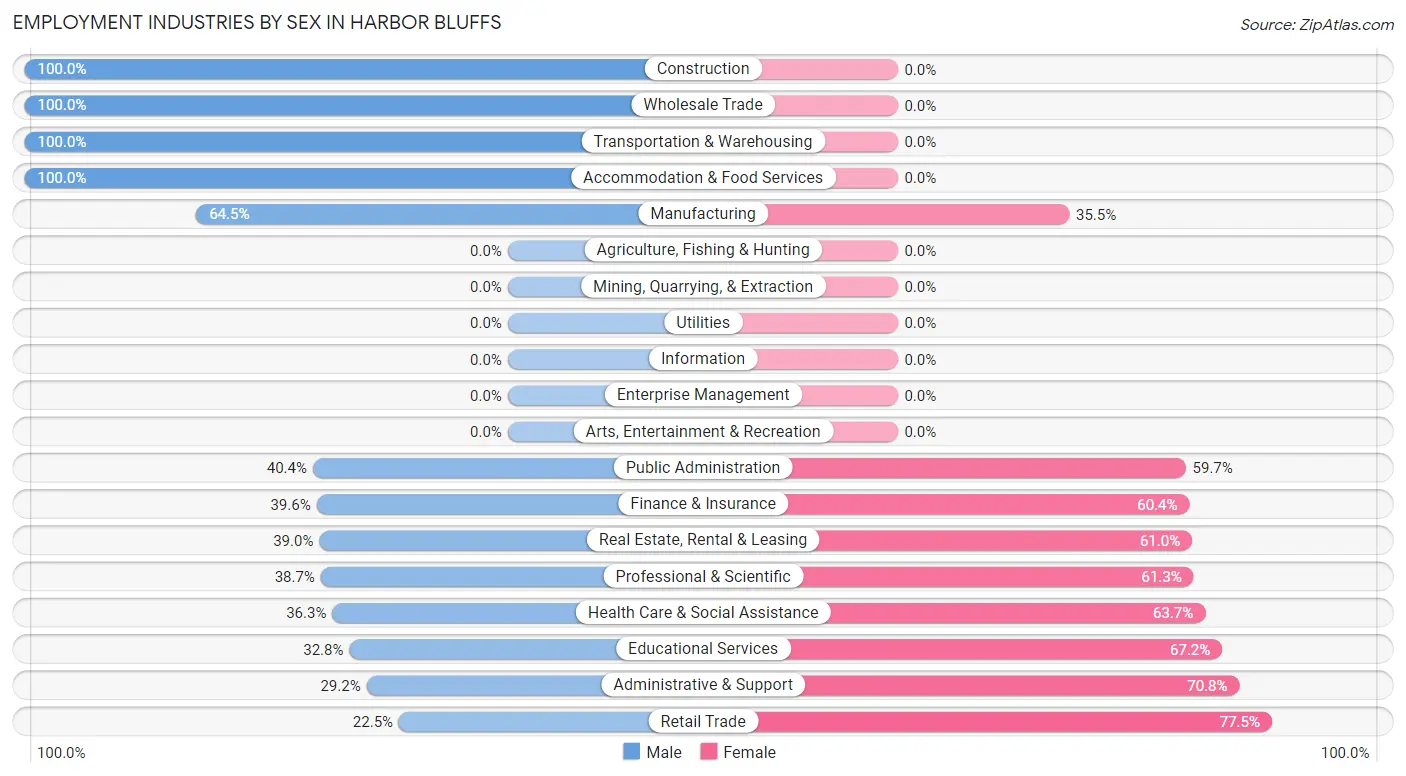
Employment Industries by Sex in Harbor Bluffs
The Harbor Bluffs industries that see more men than women are Construction (100.0%), Wholesale Trade (100.0%), and Transportation & Warehousing (100.0%), whereas the industries that tend to have a higher number of women are Retail Trade (77.5%), Administrative & Support (70.8%), and Educational Services (67.2%).
| Industry | Male | Female |
| Agriculture, Fishing & Hunting | 0 (0.0%) | 0 (0.0%) |
| Mining, Quarrying, & Extraction | 0 (0.0%) | 0 (0.0%) |
| Construction | 46 (100.0%) | 0 (0.0%) |
| Manufacturing | 49 (64.5%) | 27 (35.5%) |
| Wholesale Trade | 12 (100.0%) | 0 (0.0%) |
| Retail Trade | 34 (22.5%) | 117 (77.5%) |
| Transportation & Warehousing | 38 (100.0%) | 0 (0.0%) |
| Utilities | 0 (0.0%) | 0 (0.0%) |
| Information | 0 (0.0%) | 0 (0.0%) |
| Finance & Insurance | 19 (39.6%) | 29 (60.4%) |
| Real Estate, Rental & Leasing | 16 (39.0%) | 25 (61.0%) |
| Professional & Scientific | 12 (38.7%) | 19 (61.3%) |
| Enterprise Management | 0 (0.0%) | 0 (0.0%) |
| Administrative & Support | 19 (29.2%) | 46 (70.8%) |
| Educational Services | 41 (32.8%) | 84 (67.2%) |
| Health Care & Social Assistance | 138 (36.3%) | 242 (63.7%) |
| Arts, Entertainment & Recreation | 0 (0.0%) | 0 (0.0%) |
| Accommodation & Food Services | 60 (100.0%) | 0 (0.0%) |
| Public Administration | 23 (40.4%) | 34 (59.7%) |
| Total | 537 (44.4%) | 673 (55.6%) |
Education in Harbor Bluffs
School Enrollment in Harbor Bluffs
The most common levels of schooling among the 795 students in Harbor Bluffs are high school (329 | 41.4%), college / undergraduate (270 | 34.0%), and middle school (135 | 17.0%).
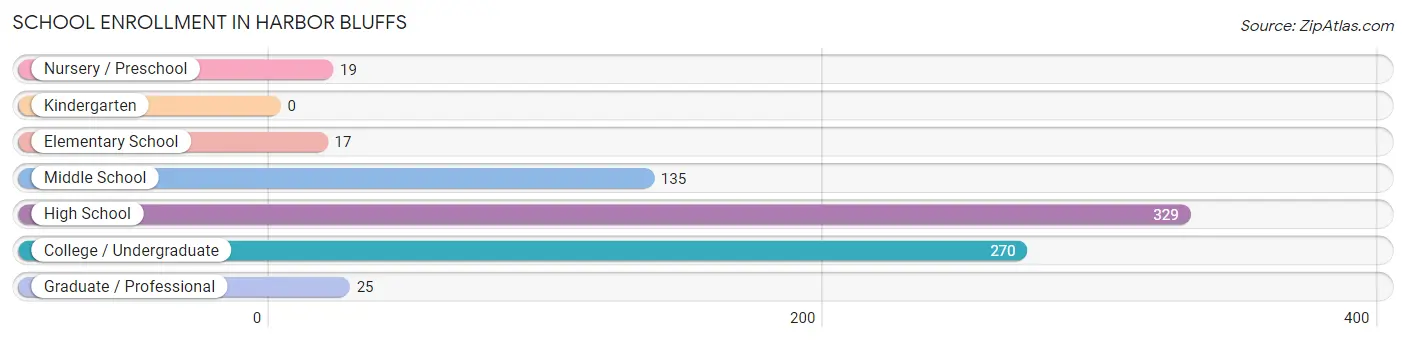
| School Level | # Students | % Students |
| Nursery / Preschool | 19 | 2.4% |
| Kindergarten | 0 | 0.0% |
| Elementary School | 17 | 2.1% |
| Middle School | 135 | 17.0% |
| High School | 329 | 41.4% |
| College / Undergraduate | 270 | 34.0% |
| Graduate / Professional | 25 | 3.1% |
| Total | 795 | 100.0% |
School Enrollment by Age by Funding Source in Harbor Bluffs
Out of a total of 795 students who are enrolled in schools in Harbor Bluffs, 161 (20.3%) attend a private institution, while the remaining 634 (79.7%) are enrolled in public schools. The age group of 3 to 4 year olds has the highest likelihood of being enrolled in private schools, with 19 (100.0% in the age bracket) enrolled. Conversely, the age group of 5 to 9 year old has the lowest likelihood of being enrolled in a private school, with 17 (100.0% in the age bracket) attending a public institution.
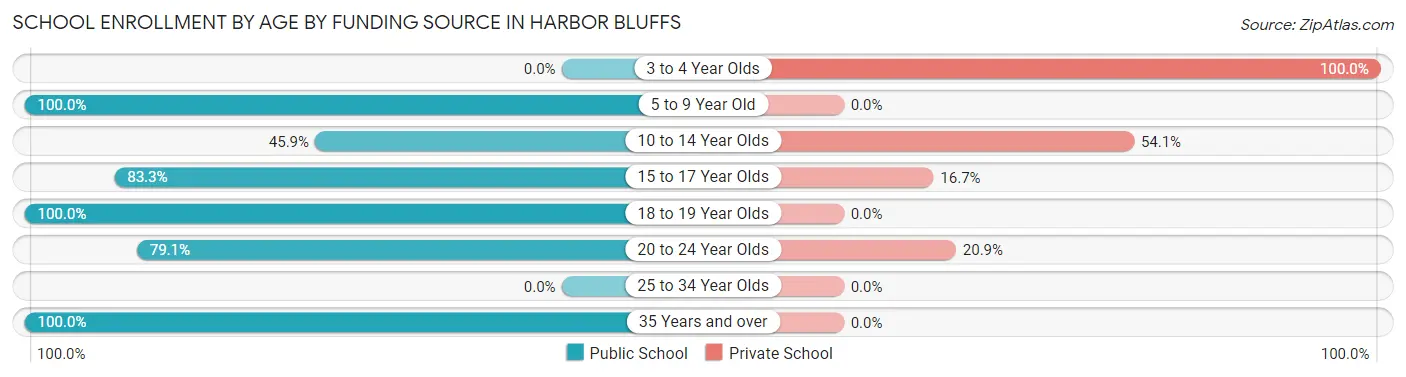
| Age Bracket | Public School | Private School |
| 3 to 4 Year Olds | 0 (0.0%) | 19 (100.0%) |
| 5 to 9 Year Old | 17 (100.0%) | 0 (0.0%) |
| 10 to 14 Year Olds | 62 (45.9%) | 73 (54.1%) |
| 15 to 17 Year Olds | 274 (83.3%) | 55 (16.7%) |
| 18 to 19 Year Olds | 217 (100.0%) | 0 (0.0%) |
| 20 to 24 Year Olds | 53 (79.1%) | 14 (20.9%) |
| 25 to 34 Year Olds | 0 (0.0%) | 0 (0.0%) |
| 35 Years and over | 11 (100.0%) | 0 (0.0%) |
| Total | 634 (79.7%) | 161 (20.3%) |
Educational Attainment by Field of Study in Harbor Bluffs
Science & technology (332 | 31.8%), business (268 | 25.7%), education (153 | 14.7%), psychology (42 | 4.0%), and literature & languages (39 | 3.7%) are the most common fields of study among 1,044 individuals in Harbor Bluffs who have obtained a bachelor's degree or higher.
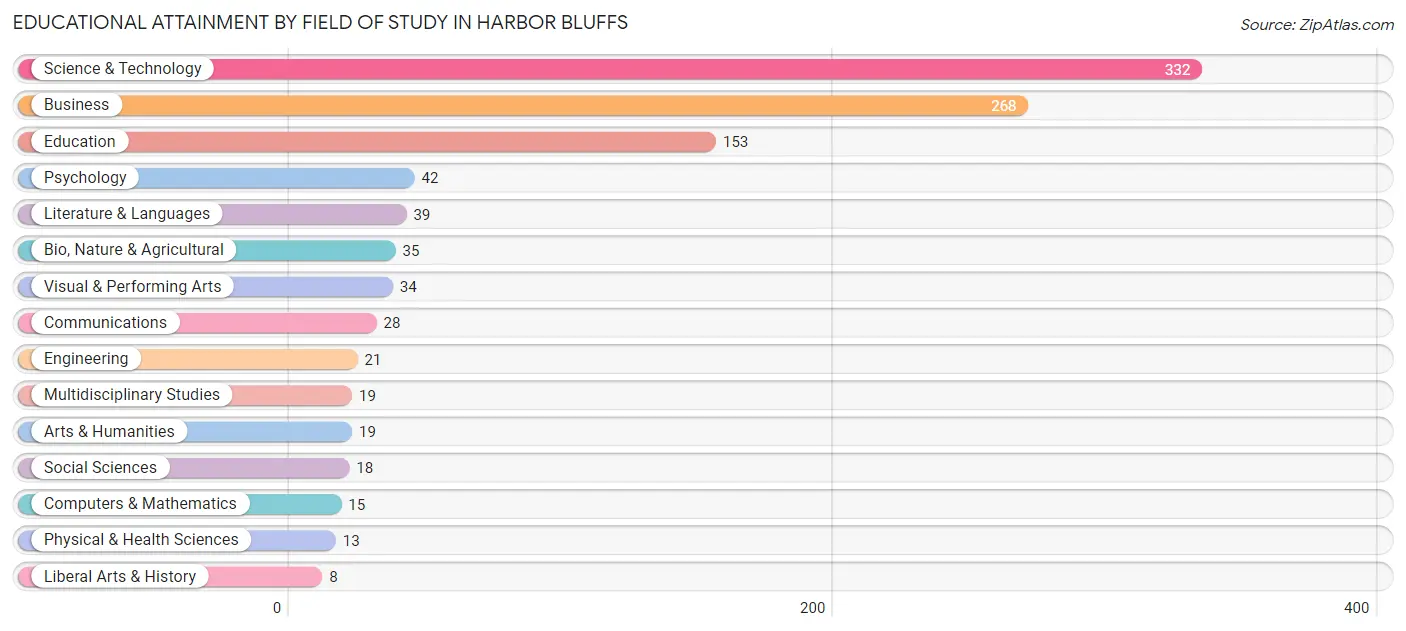
| Field of Study | # Graduates | % Graduates |
| Computers & Mathematics | 15 | 1.4% |
| Bio, Nature & Agricultural | 35 | 3.4% |
| Physical & Health Sciences | 13 | 1.3% |
| Psychology | 42 | 4.0% |
| Social Sciences | 18 | 1.7% |
| Engineering | 21 | 2.0% |
| Multidisciplinary Studies | 19 | 1.8% |
| Science & Technology | 332 | 31.8% |
| Business | 268 | 25.7% |
| Education | 153 | 14.7% |
| Literature & Languages | 39 | 3.7% |
| Liberal Arts & History | 8 | 0.8% |
| Visual & Performing Arts | 34 | 3.3% |
| Communications | 28 | 2.7% |
| Arts & Humanities | 19 | 1.8% |
| Total | 1,044 | 100.0% |
Transportation & Commute in Harbor Bluffs
Vehicle Availability by Sex in Harbor Bluffs
The most prevalent vehicle ownership categories in Harbor Bluffs are males with 2 vehicles (259, accounting for 49.6%) and females with 2 vehicles (392, making up 39.4%).
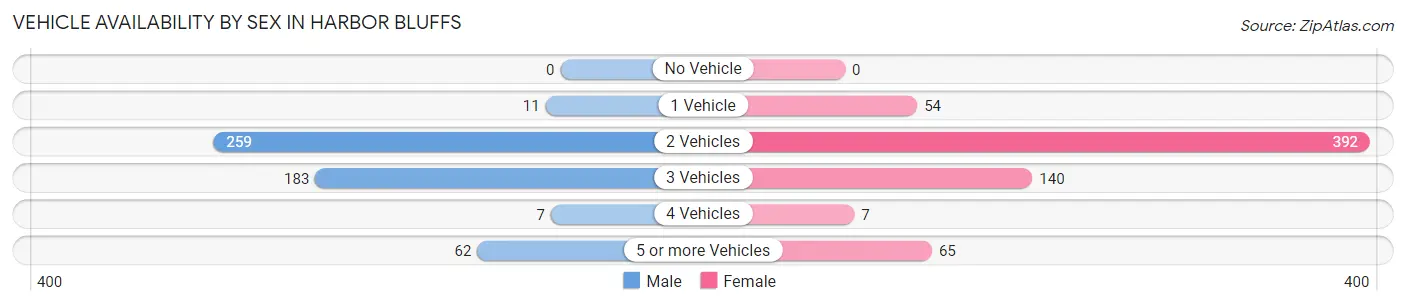
| Vehicles Available | Male | Female |
| No Vehicle | 0 (0.0%) | 0 (0.0%) |
| 1 Vehicle | 11 (2.1%) | 54 (8.2%) |
| 2 Vehicles | 259 (49.6%) | 392 (59.6%) |
| 3 Vehicles | 183 (35.1%) | 140 (21.3%) |
| 4 Vehicles | 7 (1.3%) | 7 (1.1%) |
| 5 or more Vehicles | 62 (11.9%) | 65 (9.9%) |
| Total | 522 (100.0%) | 658 (100.0%) |
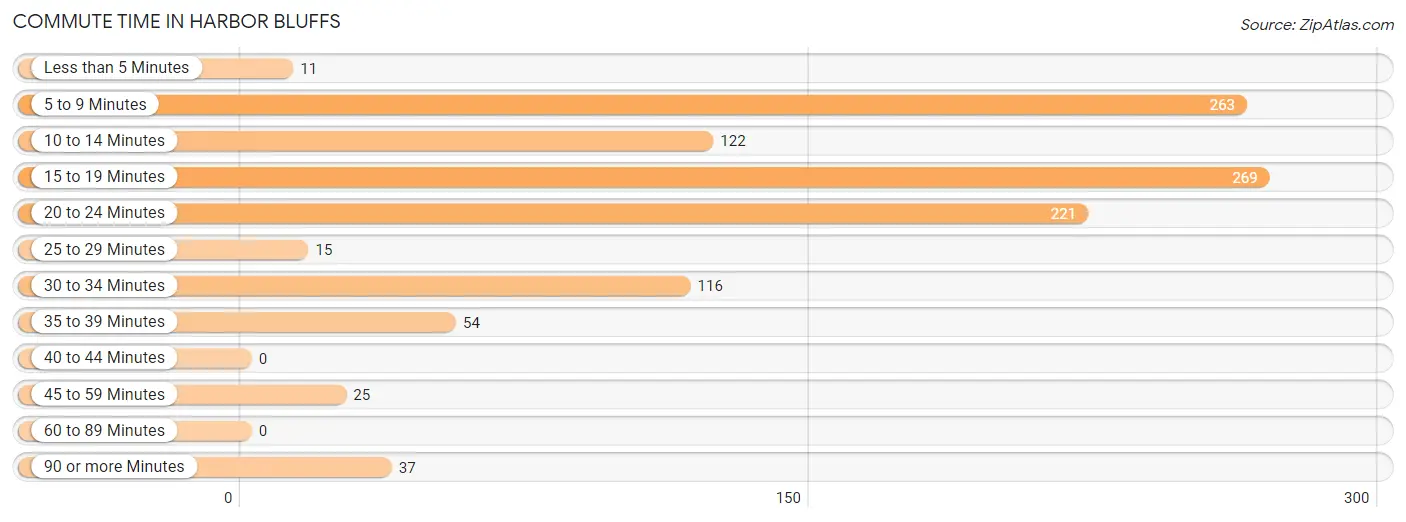
Commute Time in Harbor Bluffs
The most frequently occuring commute durations in Harbor Bluffs are 15 to 19 minutes (269 commuters, 23.7%), 5 to 9 minutes (263 commuters, 23.2%), and 20 to 24 minutes (221 commuters, 19.5%).
| Commute Time | # Commuters | % Commuters |
| Less than 5 Minutes | 11 | 1.0% |
| 5 to 9 Minutes | 263 | 23.2% |
| 10 to 14 Minutes | 122 | 10.8% |
| 15 to 19 Minutes | 269 | 23.7% |
| 20 to 24 Minutes | 221 | 19.5% |
| 25 to 29 Minutes | 15 | 1.3% |
| 30 to 34 Minutes | 116 | 10.2% |
| 35 to 39 Minutes | 54 | 4.8% |
| 40 to 44 Minutes | 0 | 0.0% |
| 45 to 59 Minutes | 25 | 2.2% |
| 60 to 89 Minutes | 0 | 0.0% |
| 90 or more Minutes | 37 | 3.3% |
Commute Time by Sex in Harbor Bluffs
The most common commute times in Harbor Bluffs are 10 to 14 minutes (122 commuters, 24.2%) for males and 5 to 9 minutes (202 commuters, 32.1%) for females.
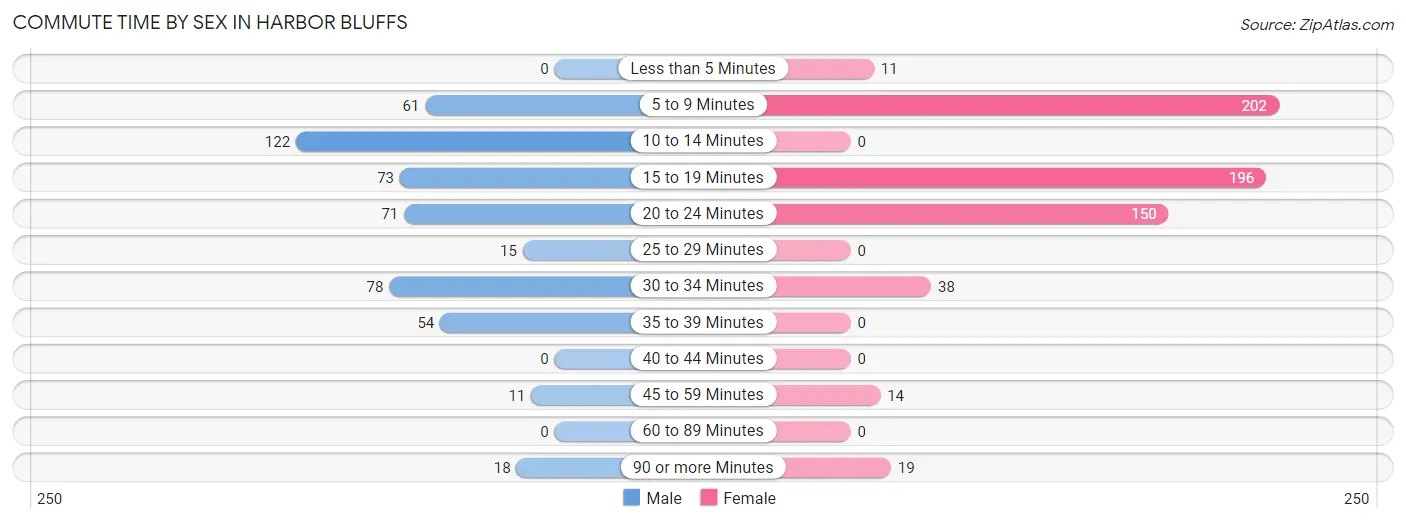
| Commute Time | Male | Female |
| Less than 5 Minutes | 0 (0.0%) | 11 (1.8%) |
| 5 to 9 Minutes | 61 (12.1%) | 202 (32.1%) |
| 10 to 14 Minutes | 122 (24.2%) | 0 (0.0%) |
| 15 to 19 Minutes | 73 (14.5%) | 196 (31.1%) |
| 20 to 24 Minutes | 71 (14.1%) | 150 (23.8%) |
| 25 to 29 Minutes | 15 (3.0%) | 0 (0.0%) |
| 30 to 34 Minutes | 78 (15.5%) | 38 (6.0%) |
| 35 to 39 Minutes | 54 (10.7%) | 0 (0.0%) |
| 40 to 44 Minutes | 0 (0.0%) | 0 (0.0%) |
| 45 to 59 Minutes | 11 (2.2%) | 14 (2.2%) |
| 60 to 89 Minutes | 0 (0.0%) | 0 (0.0%) |
| 90 or more Minutes | 18 (3.6%) | 19 (3.0%) |
Time of Departure to Work by Sex in Harbor Bluffs
The most frequent times of departure to work in Harbor Bluffs are 7:30 AM to 7:59 AM (145, 28.8%) for males and 8:00 AM to 8:29 AM (175, 27.8%) for females.
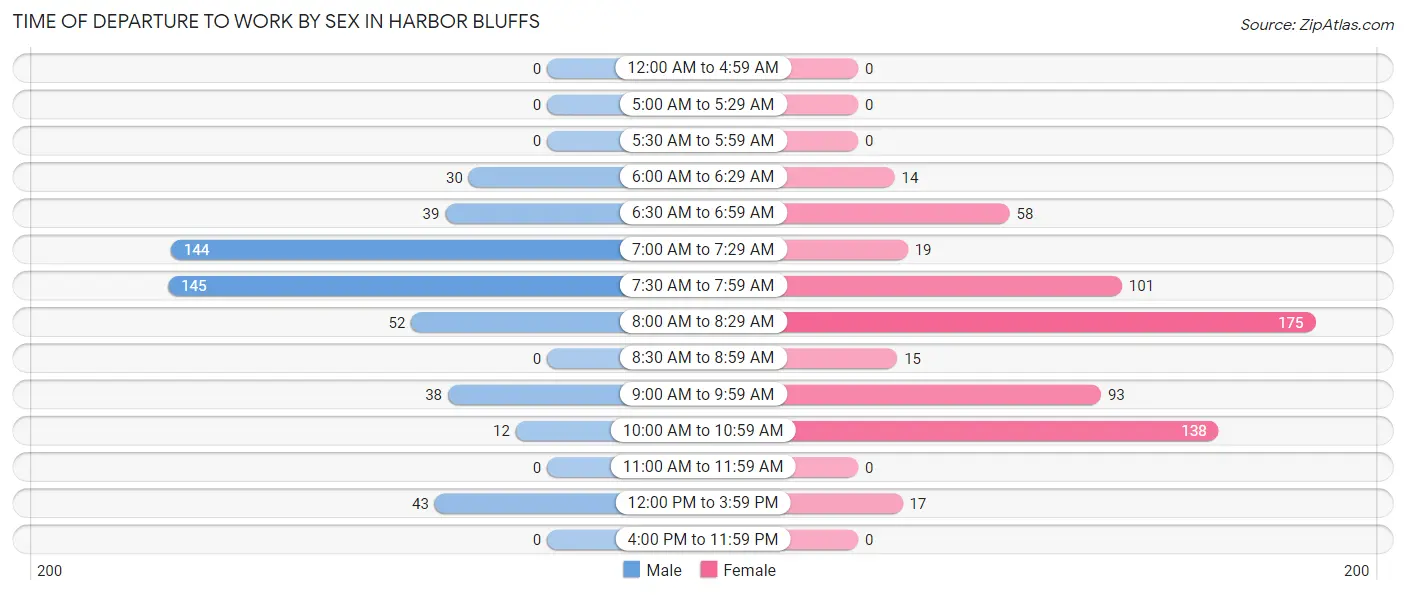
| Time of Departure | Male | Female |
| 12:00 AM to 4:59 AM | 0 (0.0%) | 0 (0.0%) |
| 5:00 AM to 5:29 AM | 0 (0.0%) | 0 (0.0%) |
| 5:30 AM to 5:59 AM | 0 (0.0%) | 0 (0.0%) |
| 6:00 AM to 6:29 AM | 30 (6.0%) | 14 (2.2%) |
| 6:30 AM to 6:59 AM | 39 (7.7%) | 58 (9.2%) |
| 7:00 AM to 7:29 AM | 144 (28.6%) | 19 (3.0%) |
| 7:30 AM to 7:59 AM | 145 (28.8%) | 101 (16.0%) |
| 8:00 AM to 8:29 AM | 52 (10.3%) | 175 (27.8%) |
| 8:30 AM to 8:59 AM | 0 (0.0%) | 15 (2.4%) |
| 9:00 AM to 9:59 AM | 38 (7.5%) | 93 (14.8%) |
| 10:00 AM to 10:59 AM | 12 (2.4%) | 138 (21.9%) |
| 11:00 AM to 11:59 AM | 0 (0.0%) | 0 (0.0%) |
| 12:00 PM to 3:59 PM | 43 (8.6%) | 17 (2.7%) |
| 4:00 PM to 11:59 PM | 0 (0.0%) | 0 (0.0%) |
| Total | 503 (100.0%) | 630 (100.0%) |
Housing Occupancy in Harbor Bluffs
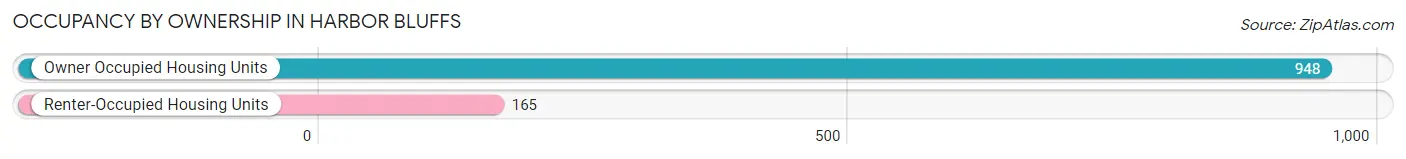
Occupancy by Ownership in Harbor Bluffs
Of the total 1,113 dwellings in Harbor Bluffs, owner-occupied units account for 948 (85.2%), while renter-occupied units make up 165 (14.8%).
| Occupancy | # Housing Units | % Housing Units |
| Owner Occupied Housing Units | 948 | 85.2% |
| Renter-Occupied Housing Units | 165 | 14.8% |
| Total Occupied Housing Units | 1,113 | 100.0% |
Occupancy by Household Size in Harbor Bluffs
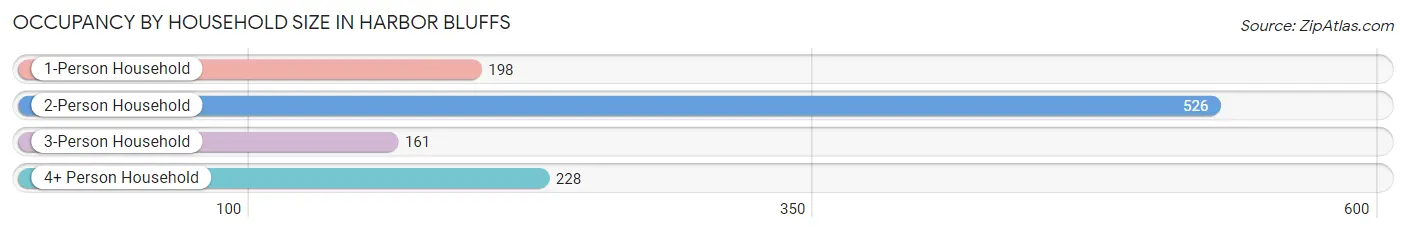
| Household Size | # Housing Units | % Housing Units |
| 1-Person Household | 198 | 17.8% |
| 2-Person Household | 526 | 47.3% |
| 3-Person Household | 161 | 14.5% |
| 4+ Person Household | 228 | 20.5% |
| Total Housing Units | 1,113 | 100.0% |
Occupancy by Ownership by Household Size in Harbor Bluffs
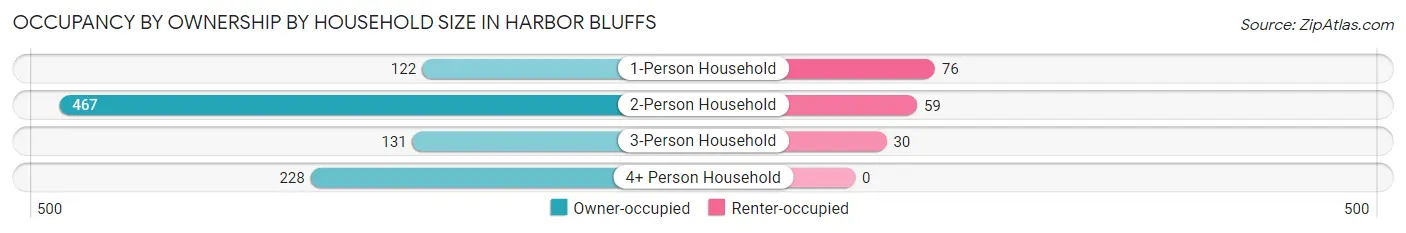
| Household Size | Owner-occupied | Renter-occupied |
| 1-Person Household | 122 (61.6%) | 76 (38.4%) |
| 2-Person Household | 467 (88.8%) | 59 (11.2%) |
| 3-Person Household | 131 (81.4%) | 30 (18.6%) |
| 4+ Person Household | 228 (100.0%) | 0 (0.0%) |
| Total Housing Units | 948 (85.2%) | 165 (14.8%) |
Occupancy by Educational Attainment in Harbor Bluffs
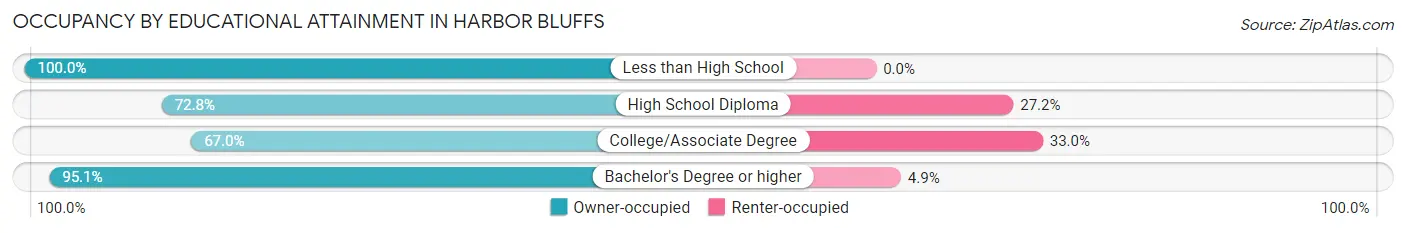
| Household Size | Owner-occupied | Renter-occupied |
| Less than High School | 55 (100.0%) | 0 (0.0%) |
| High School Diploma | 158 (72.8%) | 59 (27.2%) |
| College/Associate Degree | 154 (67.0%) | 76 (33.0%) |
| Bachelor's Degree or higher | 581 (95.1%) | 30 (4.9%) |
Occupancy by Age of Householder in Harbor Bluffs
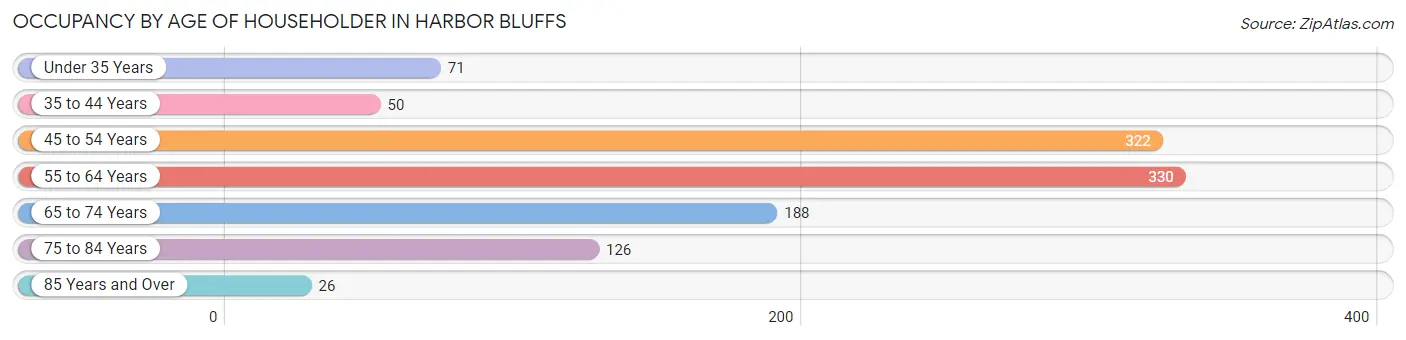
| Age Bracket | # Households | % Households |
| Under 35 Years | 71 | 6.4% |
| 35 to 44 Years | 50 | 4.5% |
| 45 to 54 Years | 322 | 28.9% |
| 55 to 64 Years | 330 | 29.6% |
| 65 to 74 Years | 188 | 16.9% |
| 75 to 84 Years | 126 | 11.3% |
| 85 Years and Over | 26 | 2.3% |
| Total | 1,113 | 100.0% |
Housing Finances in Harbor Bluffs
Median Income by Occupancy in Harbor Bluffs
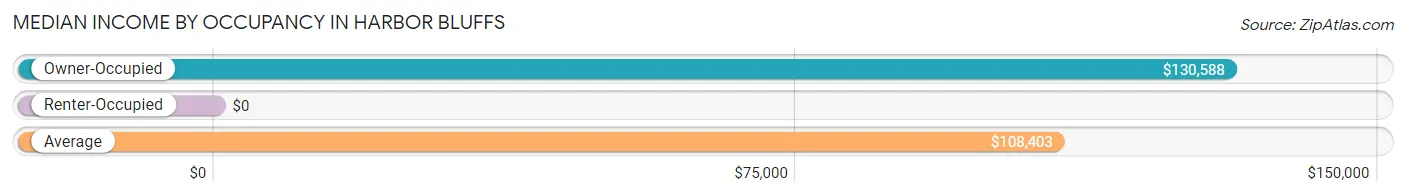
| Occupancy Type | # Households | Median Income |
| Owner-Occupied | 948 (85.2%) | $130,588 |
| Renter-Occupied | 165 (14.8%) | $0 |
| Average | 1,113 (100.0%) | $108,403 |
Occupancy by Householder Income Bracket in Harbor Bluffs
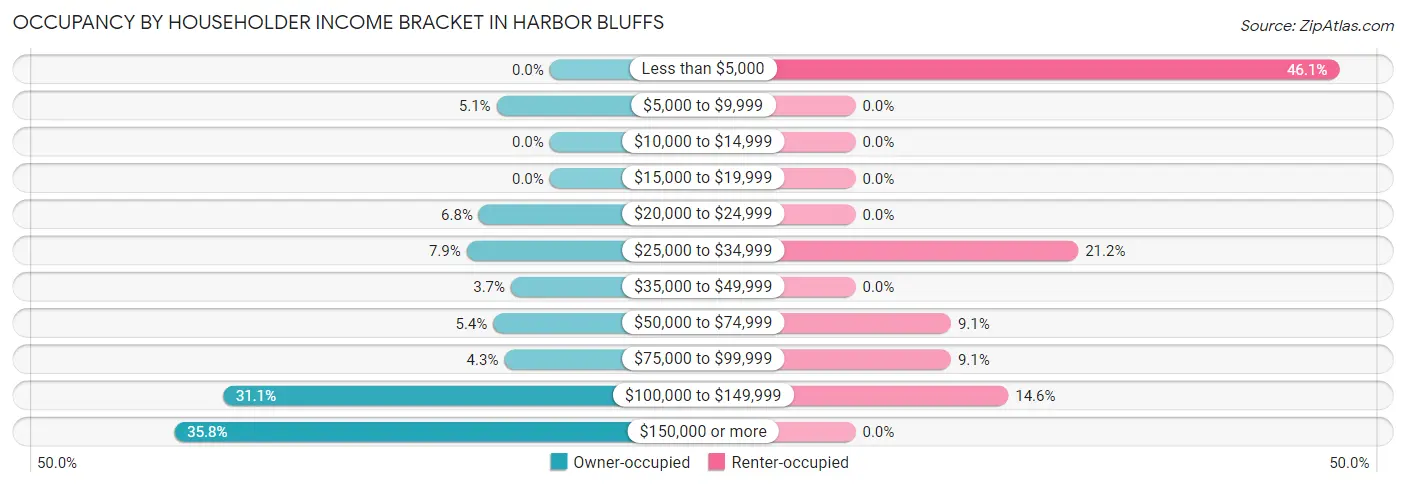
| Income Bracket | Owner-occupied | Renter-occupied |
| Less than $5,000 | 0 (0.0%) | 76 (46.1%) |
| $5,000 to $9,999 | 48 (5.1%) | 0 (0.0%) |
| $10,000 to $14,999 | 0 (0.0%) | 0 (0.0%) |
| $15,000 to $19,999 | 0 (0.0%) | 0 (0.0%) |
| $20,000 to $24,999 | 64 (6.8%) | 0 (0.0%) |
| $25,000 to $34,999 | 75 (7.9%) | 35 (21.2%) |
| $35,000 to $49,999 | 35 (3.7%) | 0 (0.0%) |
| $50,000 to $74,999 | 51 (5.4%) | 15 (9.1%) |
| $75,000 to $99,999 | 41 (4.3%) | 15 (9.1%) |
| $100,000 to $149,999 | 295 (31.1%) | 24 (14.5%) |
| $150,000 or more | 339 (35.8%) | 0 (0.0%) |
| Total | 948 (100.0%) | 165 (100.0%) |
Monthly Housing Cost Tiers in Harbor Bluffs
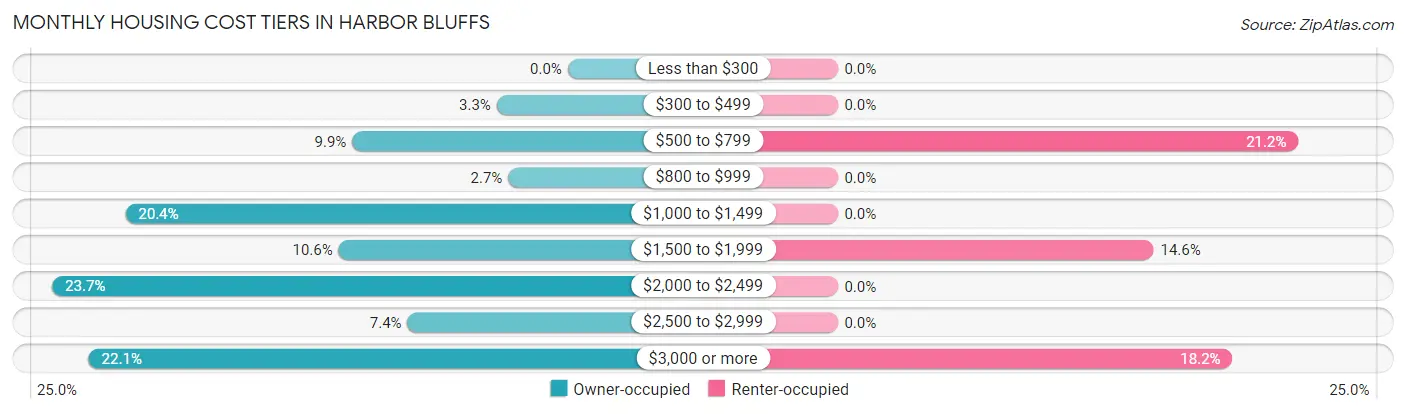
| Monthly Cost | Owner-occupied | Renter-occupied |
| Less than $300 | 0 (0.0%) | 0 (0.0%) |
| $300 to $499 | 31 (3.3%) | 0 (0.0%) |
| $500 to $799 | 94 (9.9%) | 35 (21.2%) |
| $800 to $999 | 26 (2.7%) | 0 (0.0%) |
| $1,000 to $1,499 | 193 (20.4%) | 0 (0.0%) |
| $1,500 to $1,999 | 100 (10.5%) | 24 (14.5%) |
| $2,000 to $2,499 | 225 (23.7%) | 0 (0.0%) |
| $2,500 to $2,999 | 70 (7.4%) | 0 (0.0%) |
| $3,000 or more | 209 (22.1%) | 30 (18.2%) |
| Total | 948 (100.0%) | 165 (100.0%) |
Physical Housing Characteristics in Harbor Bluffs
Housing Structures in Harbor Bluffs
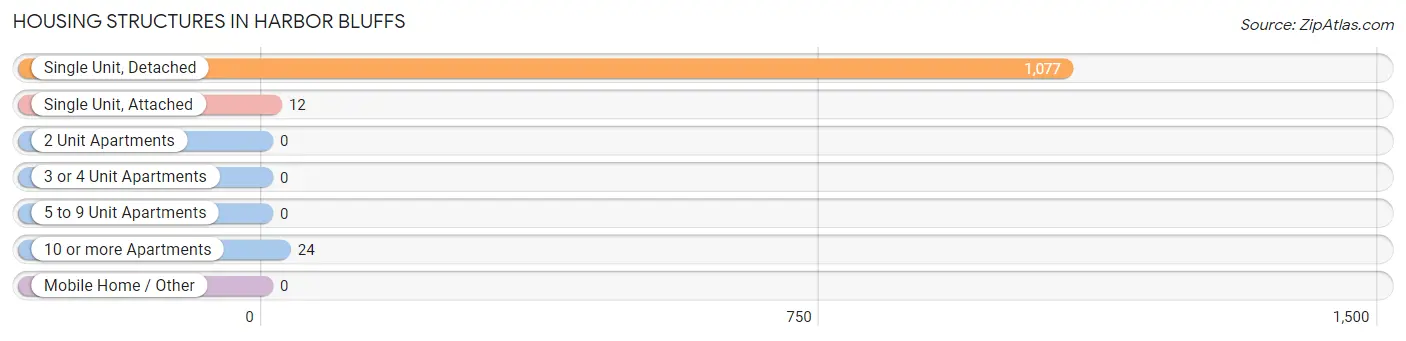
| Structure Type | # Housing Units | % Housing Units |
| Single Unit, Detached | 1,077 | 96.8% |
| Single Unit, Attached | 12 | 1.1% |
| 2 Unit Apartments | 0 | 0.0% |
| 3 or 4 Unit Apartments | 0 | 0.0% |
| 5 to 9 Unit Apartments | 0 | 0.0% |
| 10 or more Apartments | 24 | 2.2% |
| Mobile Home / Other | 0 | 0.0% |
| Total | 1,113 | 100.0% |
Housing Structures by Occupancy in Harbor Bluffs
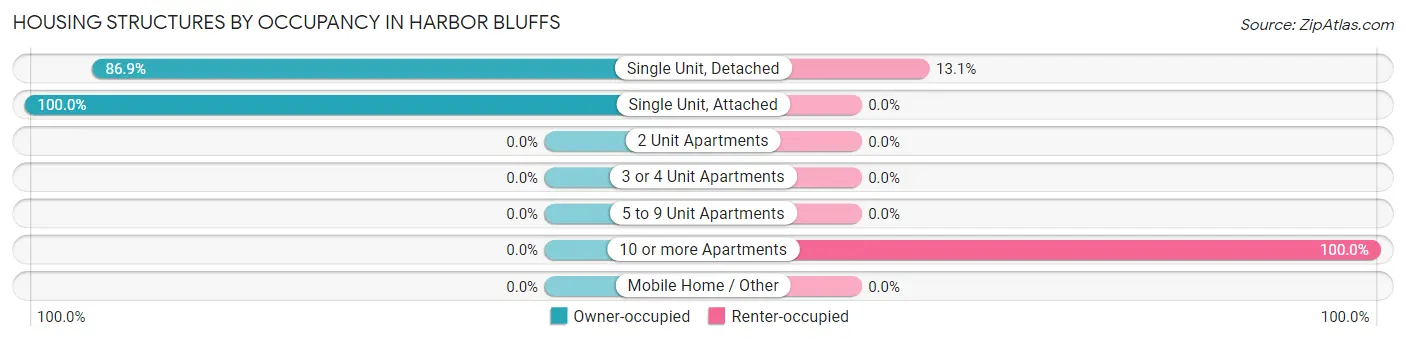
| Structure Type | Owner-occupied | Renter-occupied |
| Single Unit, Detached | 936 (86.9%) | 141 (13.1%) |
| Single Unit, Attached | 12 (100.0%) | 0 (0.0%) |
| 2 Unit Apartments | 0 (0.0%) | 0 (0.0%) |
| 3 or 4 Unit Apartments | 0 (0.0%) | 0 (0.0%) |
| 5 to 9 Unit Apartments | 0 (0.0%) | 0 (0.0%) |
| 10 or more Apartments | 0 (0.0%) | 24 (100.0%) |
| Mobile Home / Other | 0 (0.0%) | 0 (0.0%) |
| Total | 948 (85.2%) | 165 (14.8%) |
Housing Structures by Number of Rooms in Harbor Bluffs
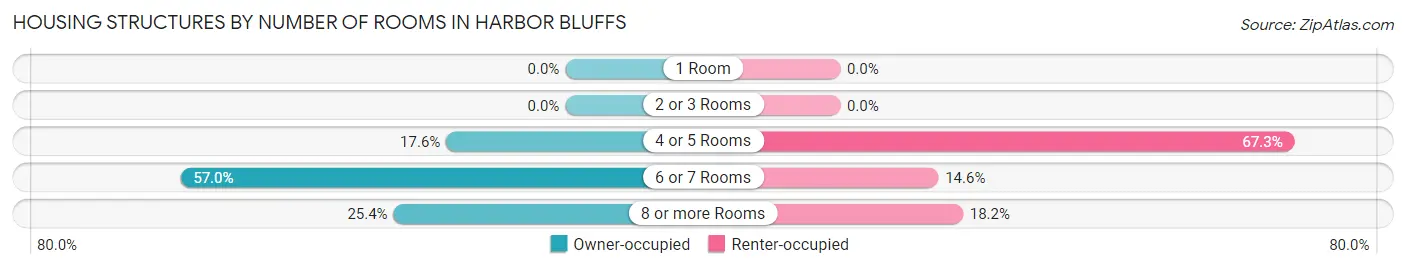
| Number of Rooms | Owner-occupied | Renter-occupied |
| 1 Room | 0 (0.0%) | 0 (0.0%) |
| 2 or 3 Rooms | 0 (0.0%) | 0 (0.0%) |
| 4 or 5 Rooms | 167 (17.6%) | 111 (67.3%) |
| 6 or 7 Rooms | 540 (57.0%) | 24 (14.5%) |
| 8 or more Rooms | 241 (25.4%) | 30 (18.2%) |
| Total | 948 (100.0%) | 165 (100.0%) |
Housing Structure by Heating Type in Harbor Bluffs
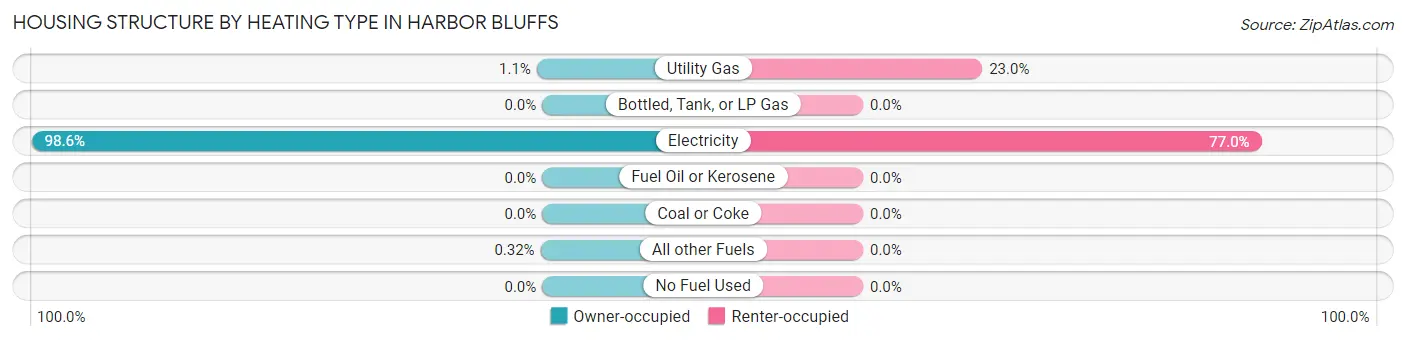
| Heating Type | Owner-occupied | Renter-occupied |
| Utility Gas | 10 (1.1%) | 38 (23.0%) |
| Bottled, Tank, or LP Gas | 0 (0.0%) | 0 (0.0%) |
| Electricity | 935 (98.6%) | 127 (77.0%) |
| Fuel Oil or Kerosene | 0 (0.0%) | 0 (0.0%) |
| Coal or Coke | 0 (0.0%) | 0 (0.0%) |
| All other Fuels | 3 (0.3%) | 0 (0.0%) |
| No Fuel Used | 0 (0.0%) | 0 (0.0%) |
| Total | 948 (100.0%) | 165 (100.0%) |
Household Vehicle Usage in Harbor Bluffs
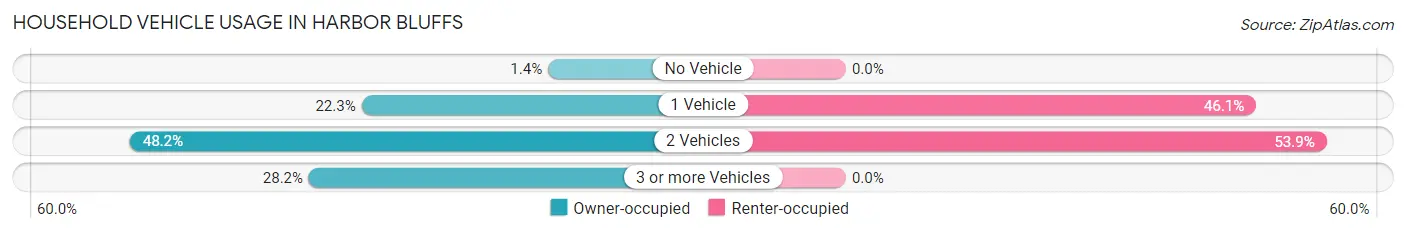
| Vehicles per Household | Owner-occupied | Renter-occupied |
| No Vehicle | 13 (1.4%) | 0 (0.0%) |
| 1 Vehicle | 211 (22.3%) | 76 (46.1%) |
| 2 Vehicles | 457 (48.2%) | 89 (53.9%) |
| 3 or more Vehicles | 267 (28.2%) | 0 (0.0%) |
| Total | 948 (100.0%) | 165 (100.0%) |
Real Estate & Mortgages in Harbor Bluffs
Real Estate and Mortgage Overview in Harbor Bluffs
| Characteristic | Without Mortgage | With Mortgage |
| Housing Units | 457 | 491 |
| Median Property Value | $495,600 | $420,700 |
| Median Household Income | $107,122 | $261 |
| Monthly Housing Costs | $1,264 | $174 |
| Real Estate Taxes | $5,262 | $0 |
Property Value by Mortgage Status in Harbor Bluffs
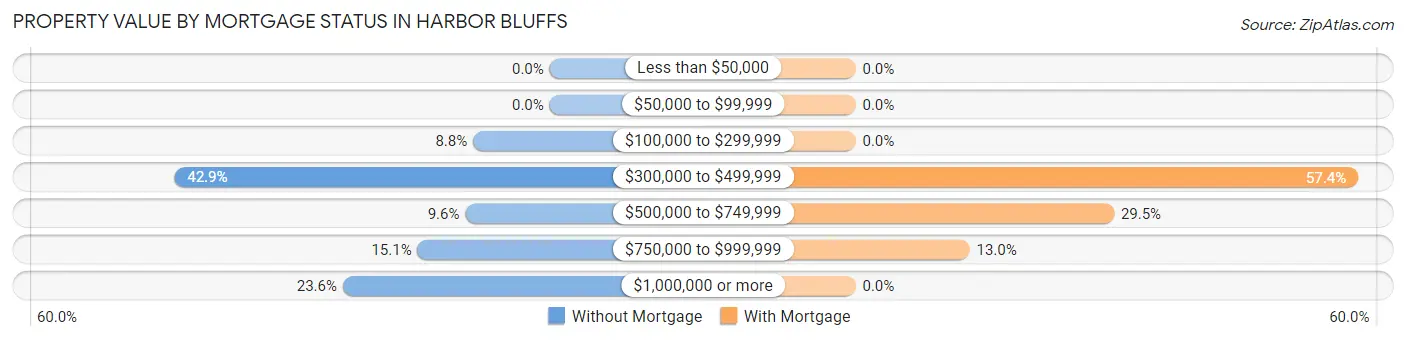
| Property Value | Without Mortgage | With Mortgage |
| Less than $50,000 | 0 (0.0%) | 0 (0.0%) |
| $50,000 to $99,999 | 0 (0.0%) | 0 (0.0%) |
| $100,000 to $299,999 | 40 (8.7%) | 0 (0.0%) |
| $300,000 to $499,999 | 196 (42.9%) | 282 (57.4%) |
| $500,000 to $749,999 | 44 (9.6%) | 145 (29.5%) |
| $750,000 to $999,999 | 69 (15.1%) | 64 (13.0%) |
| $1,000,000 or more | 108 (23.6%) | 0 (0.0%) |
| Total | 457 (100.0%) | 491 (100.0%) |
Household Income by Mortgage Status in Harbor Bluffs
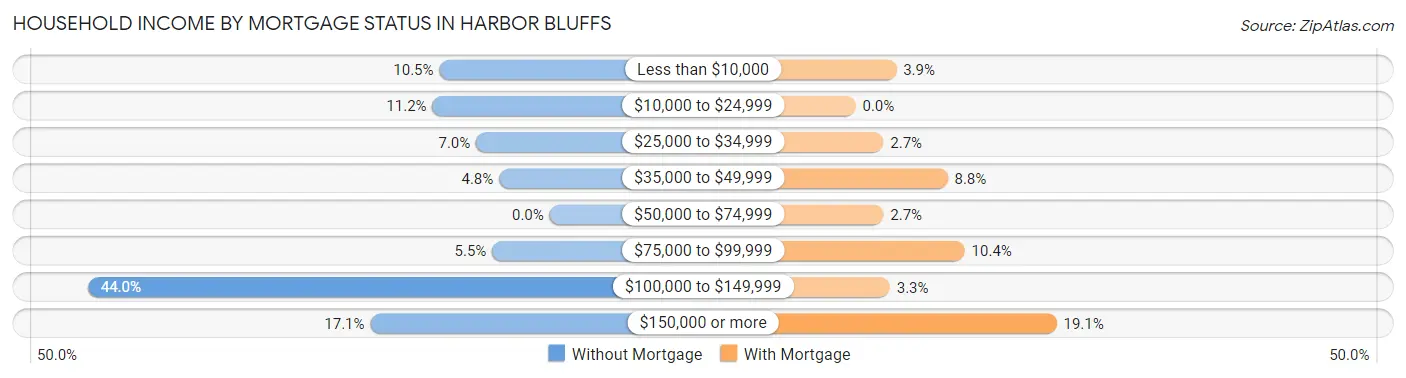
| Household Income | Without Mortgage | With Mortgage |
| Less than $10,000 | 48 (10.5%) | 19 (3.9%) |
| $10,000 to $24,999 | 51 (11.2%) | 0 (0.0%) |
| $25,000 to $34,999 | 32 (7.0%) | 13 (2.6%) |
| $35,000 to $49,999 | 22 (4.8%) | 43 (8.8%) |
| $50,000 to $74,999 | 0 (0.0%) | 13 (2.6%) |
| $75,000 to $99,999 | 25 (5.5%) | 51 (10.4%) |
| $100,000 to $149,999 | 201 (44.0%) | 16 (3.3%) |
| $150,000 or more | 78 (17.1%) | 94 (19.1%) |
| Total | 457 (100.0%) | 491 (100.0%) |
Property Value to Household Income Ratio in Harbor Bluffs
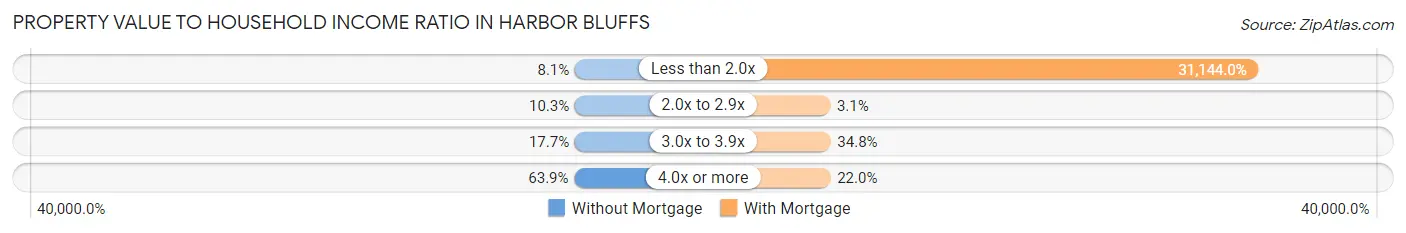
| Value-to-Income Ratio | Without Mortgage | With Mortgage |
| Less than 2.0x | 37 (8.1%) | 152,917 (31,144.0%) |
| 2.0x to 2.9x | 47 (10.3%) | 15 (3.0%) |
| 3.0x to 3.9x | 81 (17.7%) | 171 (34.8%) |
| 4.0x or more | 292 (63.9%) | 108 (22.0%) |
| Total | 457 (100.0%) | 491 (100.0%) |
Real Estate Taxes by Mortgage Status in Harbor Bluffs
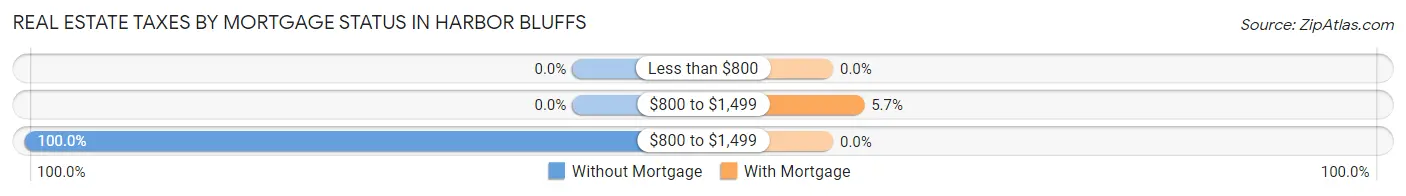
| Property Taxes | Without Mortgage | With Mortgage |
| Less than $800 | 0 (0.0%) | 0 (0.0%) |
| $800 to $1,499 | 0 (0.0%) | 28 (5.7%) |
| $800 to $1,499 | 457 (100.0%) | 0 (0.0%) |
| Total | 457 (100.0%) | 491 (100.0%) |
Health & Disability in Harbor Bluffs
Health Insurance Coverage by Age in Harbor Bluffs
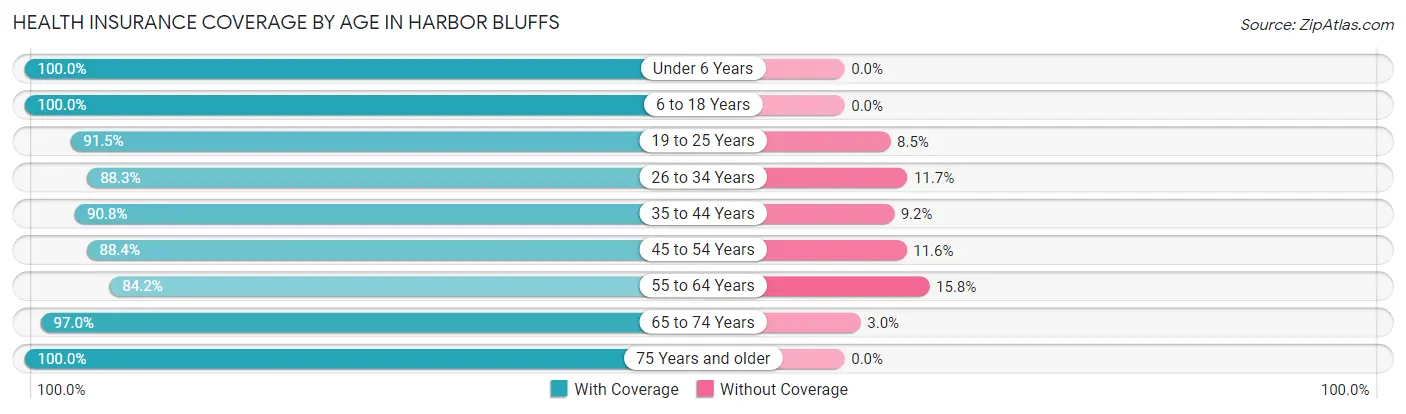
| Age Bracket | With Coverage | Without Coverage |
| Under 6 Years | 35 (100.0%) | 0 (0.0%) |
| 6 to 18 Years | 609 (100.0%) | 0 (0.0%) |
| 19 to 25 Years | 257 (91.5%) | 24 (8.5%) |
| 26 to 34 Years | 136 (88.3%) | 18 (11.7%) |
| 35 to 44 Years | 128 (90.8%) | 13 (9.2%) |
| 45 to 54 Years | 528 (88.4%) | 69 (11.6%) |
| 55 to 64 Years | 399 (84.2%) | 75 (15.8%) |
| 65 to 74 Years | 388 (97.0%) | 12 (3.0%) |
| 75 Years and older | 198 (100.0%) | 0 (0.0%) |
| Total | 2,678 (92.7%) | 211 (7.3%) |
Health Insurance Coverage by Citizenship Status in Harbor Bluffs
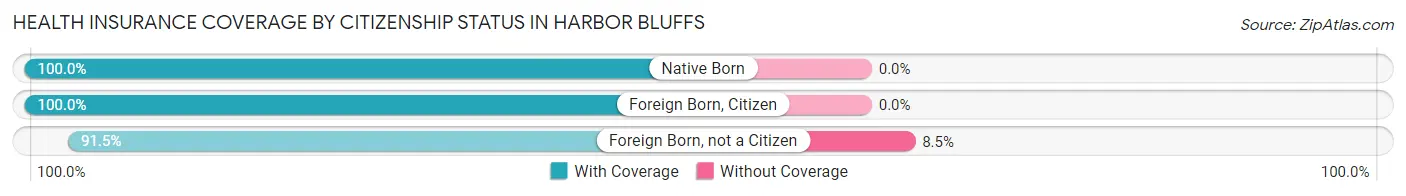
| Citizenship Status | With Coverage | Without Coverage |
| Native Born | 35 (100.0%) | 0 (0.0%) |
| Foreign Born, Citizen | 609 (100.0%) | 0 (0.0%) |
| Foreign Born, not a Citizen | 257 (91.5%) | 24 (8.5%) |
Health Insurance Coverage by Household Income in Harbor Bluffs
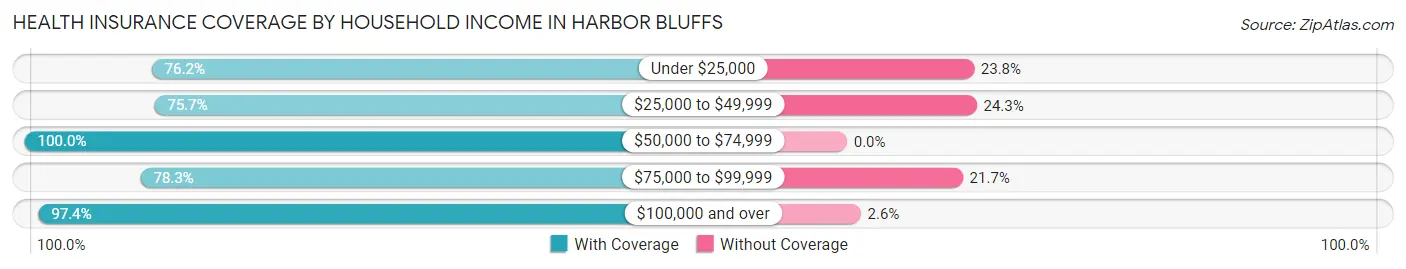
| Household Income | With Coverage | Without Coverage |
| Under $25,000 | 192 (76.2%) | 60 (23.8%) |
| $25,000 to $49,999 | 218 (75.7%) | 70 (24.3%) |
| $50,000 to $74,999 | 172 (100.0%) | 0 (0.0%) |
| $75,000 to $99,999 | 101 (78.3%) | 28 (21.7%) |
| $100,000 and over | 1,995 (97.4%) | 53 (2.6%) |
Public vs Private Health Insurance Coverage by Age in Harbor Bluffs
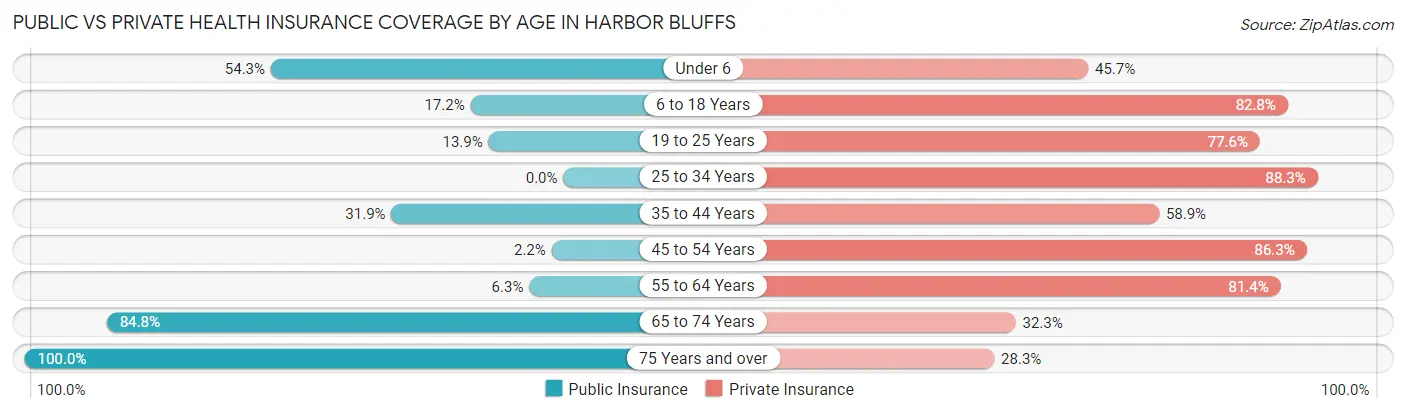
| Age Bracket | Public Insurance | Private Insurance |
| Under 6 | 19 (54.3%) | 16 (45.7%) |
| 6 to 18 Years | 105 (17.2%) | 504 (82.8%) |
| 19 to 25 Years | 39 (13.9%) | 218 (77.6%) |
| 25 to 34 Years | 0 (0.0%) | 136 (88.3%) |
| 35 to 44 Years | 45 (31.9%) | 83 (58.9%) |
| 45 to 54 Years | 13 (2.2%) | 515 (86.3%) |
| 55 to 64 Years | 30 (6.3%) | 386 (81.4%) |
| 65 to 74 Years | 339 (84.8%) | 129 (32.3%) |
| 75 Years and over | 198 (100.0%) | 56 (28.3%) |
| Total | 788 (27.3%) | 2,043 (70.7%) |
Disability Status by Sex by Age in Harbor Bluffs
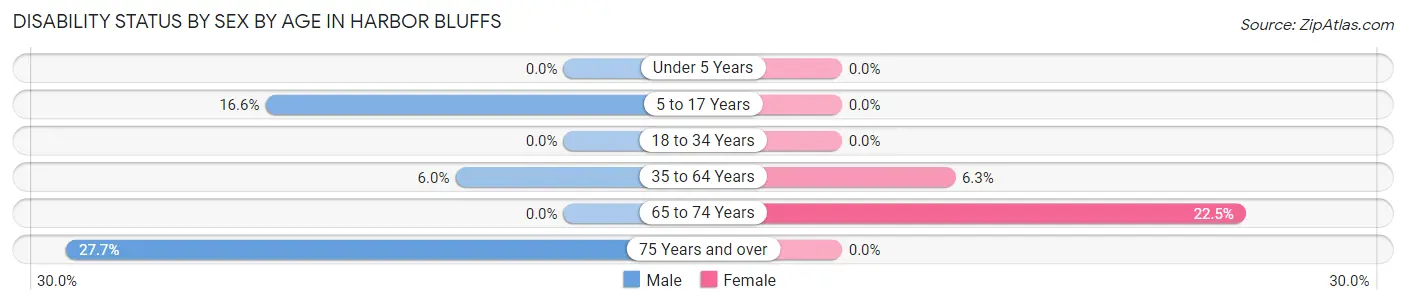
| Age Bracket | Male | Female |
| Under 5 Years | 0 (0.0%) | 0 (0.0%) |
| 5 to 17 Years | 44 (16.6%) | 0 (0.0%) |
| 18 to 34 Years | 0 (0.0%) | 0 (0.0%) |
| 35 to 64 Years | 29 (6.0%) | 46 (6.3%) |
| 65 to 74 Years | 0 (0.0%) | 38 (22.5%) |
| 75 Years and over | 18 (27.7%) | 0 (0.0%) |
Disability Class by Sex by Age in Harbor Bluffs
Disability Class: Hearing Difficulty
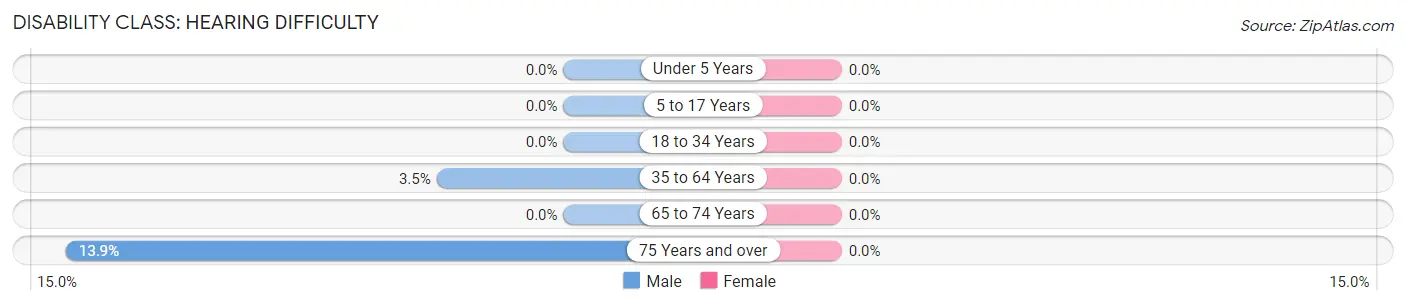
| Age Bracket | Male | Female |
| Under 5 Years | 0 (0.0%) | 0 (0.0%) |
| 5 to 17 Years | 0 (0.0%) | 0 (0.0%) |
| 18 to 34 Years | 0 (0.0%) | 0 (0.0%) |
| 35 to 64 Years | 17 (3.5%) | 0 (0.0%) |
| 65 to 74 Years | 0 (0.0%) | 0 (0.0%) |
| 75 Years and over | 9 (13.9%) | 0 (0.0%) |
Disability Class: Vision Difficulty
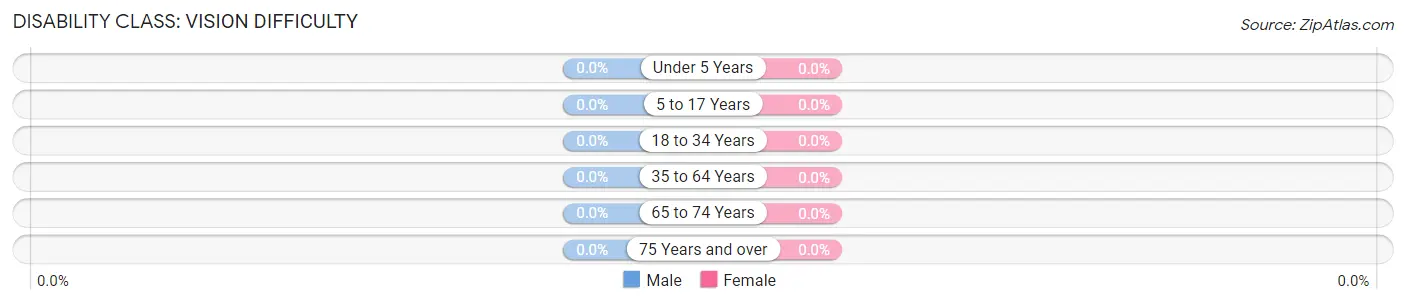
| Age Bracket | Male | Female |
| Under 5 Years | 0 (0.0%) | 0 (0.0%) |
| 5 to 17 Years | 0 (0.0%) | 0 (0.0%) |
| 18 to 34 Years | 0 (0.0%) | 0 (0.0%) |
| 35 to 64 Years | 0 (0.0%) | 0 (0.0%) |
| 65 to 74 Years | 0 (0.0%) | 0 (0.0%) |
| 75 Years and over | 0 (0.0%) | 0 (0.0%) |
Disability Class: Cognitive Difficulty
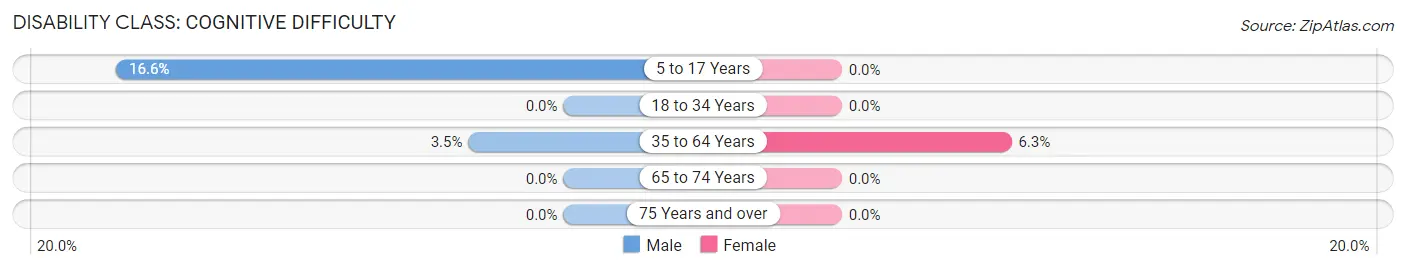
| Age Bracket | Male | Female |
| 5 to 17 Years | 44 (16.6%) | 0 (0.0%) |
| 18 to 34 Years | 0 (0.0%) | 0 (0.0%) |
| 35 to 64 Years | 17 (3.5%) | 46 (6.3%) |
| 65 to 74 Years | 0 (0.0%) | 0 (0.0%) |
| 75 Years and over | 0 (0.0%) | 0 (0.0%) |
Disability Class: Ambulatory Difficulty
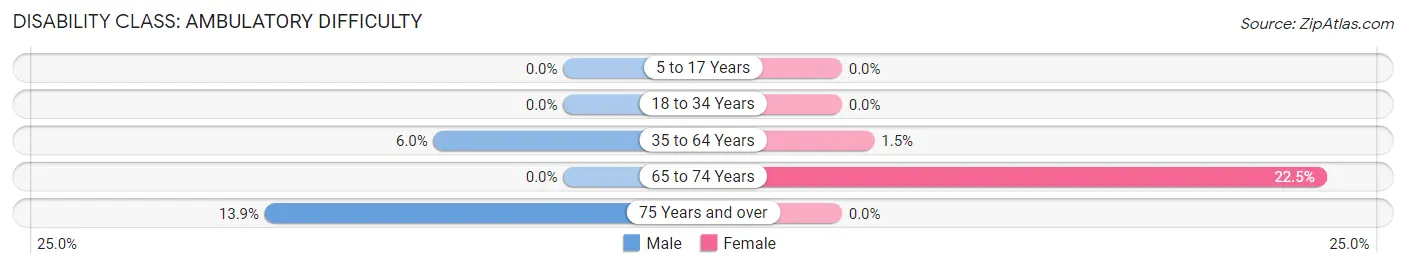
| Age Bracket | Male | Female |
| 5 to 17 Years | 0 (0.0%) | 0 (0.0%) |
| 18 to 34 Years | 0 (0.0%) | 0 (0.0%) |
| 35 to 64 Years | 29 (6.0%) | 11 (1.5%) |
| 65 to 74 Years | 0 (0.0%) | 38 (22.5%) |
| 75 Years and over | 9 (13.9%) | 0 (0.0%) |
Disability Class: Self-Care Difficulty
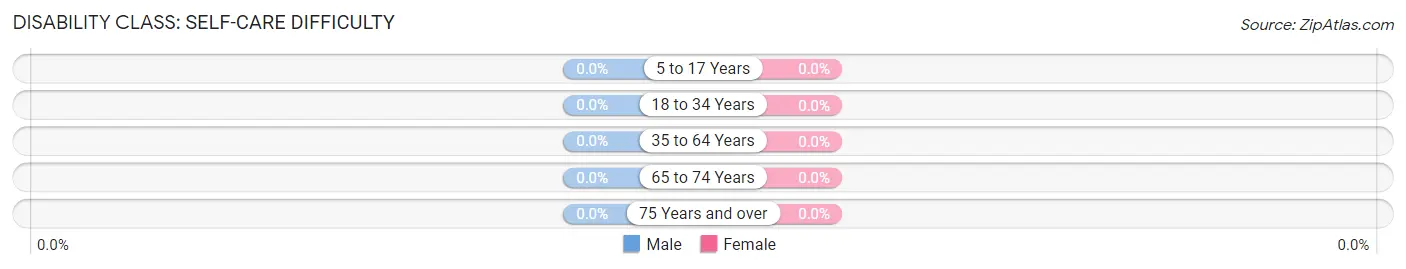
| Age Bracket | Male | Female |
| 5 to 17 Years | 0 (0.0%) | 0 (0.0%) |
| 18 to 34 Years | 0 (0.0%) | 0 (0.0%) |
| 35 to 64 Years | 0 (0.0%) | 0 (0.0%) |
| 65 to 74 Years | 0 (0.0%) | 0 (0.0%) |
| 75 Years and over | 0 (0.0%) | 0 (0.0%) |
Technology Access in Harbor Bluffs
Computing Device Access in Harbor Bluffs
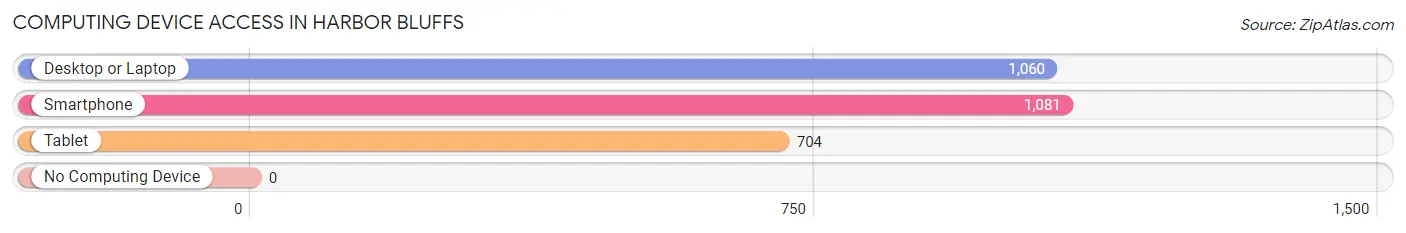
| Device Type | # Households | % Households |
| Desktop or Laptop | 1,060 | 95.2% |
| Smartphone | 1,081 | 97.1% |
| Tablet | 704 | 63.2% |
| No Computing Device | 0 | 0.0% |
| Total | 1,113 | 100.0% |
Internet Access in Harbor Bluffs
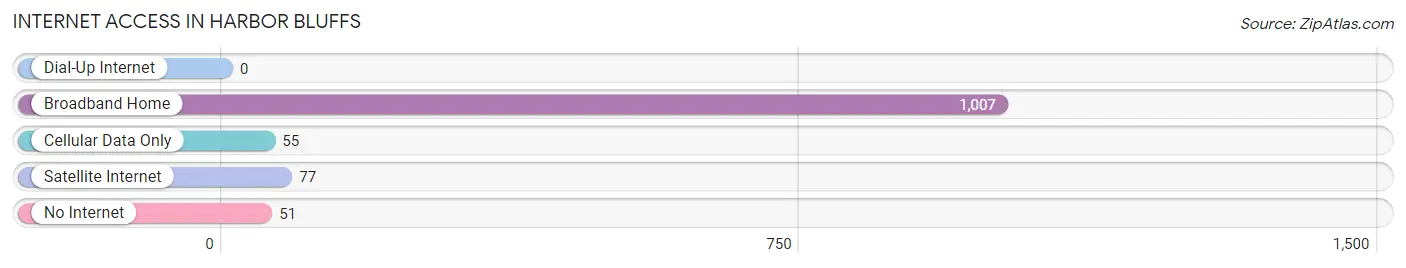
| Internet Type | # Households | % Households |
| Dial-Up Internet | 0 | 0.0% |
| Broadband Home | 1,007 | 90.5% |
| Cellular Data Only | 55 | 4.9% |
| Satellite Internet | 77 | 6.9% |
| No Internet | 51 | 4.6% |
| Total | 1,113 | 100.0% |
Harbor Bluffs Summary
Harbor Bluffs is a small, unincorporated community located in Pinellas County, Florida. It is situated on the Gulf of Mexico, just south of Clearwater Beach and north of Indian Rocks Beach. The community is bordered by the Intracoastal Waterway to the east and the Gulf of Mexico to the west. The population of Harbor Bluffs was estimated to be 1,845 in 2019.
History
Harbor Bluffs was first settled in the late 1800s by a group of fishermen and farmers. The area was originally known as "Harbor Bluff" and was a popular spot for fishing and boating. In the early 1900s, the area began to attract more visitors and eventually became a popular vacation destination. The first hotel was built in the area in the 1920s and the community began to grow.
In the 1950s, the area was developed into a residential community. The first homes were built in the area and the population began to grow. The community was officially incorporated in 1959 and the name was changed to Harbor Bluffs.
Geography
Harbor Bluffs is located in Pinellas County, Florida. It is situated on the Gulf of Mexico, just south of Clearwater Beach and north of Indian Rocks Beach. The community is bordered by the Intracoastal Waterway to the east and the Gulf of Mexico to the west. The area is mostly flat and is located at an elevation of 10 feet above sea level.
The climate in Harbor Bluffs is classified as humid subtropical. The average temperature in the summer is around 90 degrees Fahrenheit and the average temperature in the winter is around 70 degrees Fahrenheit. The area receives an average of 54 inches of rain per year.
Economy
The economy of Harbor Bluffs is largely based on tourism. The area is home to several hotels, restaurants, and other tourist attractions. The community also has a number of marinas and boat docks, which attract visitors from all over the world.
The area is also home to a number of small businesses, including retail stores, restaurants, and other services. The community is also home to a number of professional services, such as lawyers, accountants, and real estate agents.
Demographics
The population of Harbor Bluffs was estimated to be 1,845 in 2019. The population is mostly white (90.3%) and the median age is 57. The median household income is $50,945 and the median home value is $310,000.
The majority of the population (90.3%) is white, 4.2% is Hispanic or Latino, 2.2% is African American, and 1.3% is Asian. The majority of the population (90.3%) is non-Hispanic. The median age is 57 and the median household income is $50,945.
Conclusion
Harbor Bluffs is a small, unincorporated community located in Pinellas County, Florida. It is situated on the Gulf of Mexico, just south of Clearwater Beach and north of Indian Rocks Beach. The community is bordered by the Intracoastal Waterway to the east and the Gulf of Mexico to the west. The population of Harbor Bluffs was estimated to be 1,845 in 2019. The economy of Harbor Bluffs is largely based on tourism and the area is home to several hotels, restaurants, and other tourist attractions. The majority of the population is white (90.3%) and the median age is 57. The median household income is $50,945 and the median home value is $310,000.
Common Questions
What is Per Capita Income in Harbor Bluffs?
Per Capita income in Harbor Bluffs is $54,151.
What is the Median Family Income in Harbor Bluffs?
Median Family Income in Harbor Bluffs is $135,580.
What is the Median Household income in Harbor Bluffs?
Median Household Income in Harbor Bluffs is $108,403.
What is Income or Wage Gap in Harbor Bluffs?
Income or Wage Gap in Harbor Bluffs is 3.9%.
Women in Harbor Bluffs earn 96.1 cents for every dollar earned by a man.
What is Inequality or Gini Index in Harbor Bluffs?
Inequality or Gini Index in Harbor Bluffs is 0.51.
What is the Total Population of Harbor Bluffs?
Total Population of Harbor Bluffs is 2,889.
What is the Total Male Population of Harbor Bluffs?
Total Male Population of Harbor Bluffs is 1,327.
What is the Total Female Population of Harbor Bluffs?
Total Female Population of Harbor Bluffs is 1,562.
What is the Ratio of Males per 100 Females in Harbor Bluffs?
There are 84.96 Males per 100 Females in Harbor Bluffs.
What is the Ratio of Females per 100 Males in Harbor Bluffs?
There are 117.71 Females per 100 Males in Harbor Bluffs.
What is the Median Population Age in Harbor Bluffs?
Median Population Age in Harbor Bluffs is 48.5 Years.
What is the Average Family Size in Harbor Bluffs
Average Family Size in Harbor Bluffs is 3.0 People.
What is the Average Household Size in Harbor Bluffs
Average Household Size in Harbor Bluffs is 2.6 People.
How Large is the Labor Force in Harbor Bluffs?
There are 1,339 People in the Labor Forcein in Harbor Bluffs.
What is the Percentage of People in the Labor Force in Harbor Bluffs?
49.8% of People are in the Labor Force in Harbor Bluffs.
What is the Unemployment Rate in Harbor Bluffs?
Unemployment Rate in Harbor Bluffs is 9.6%.