Ridgecrest, FL Map & Demographics
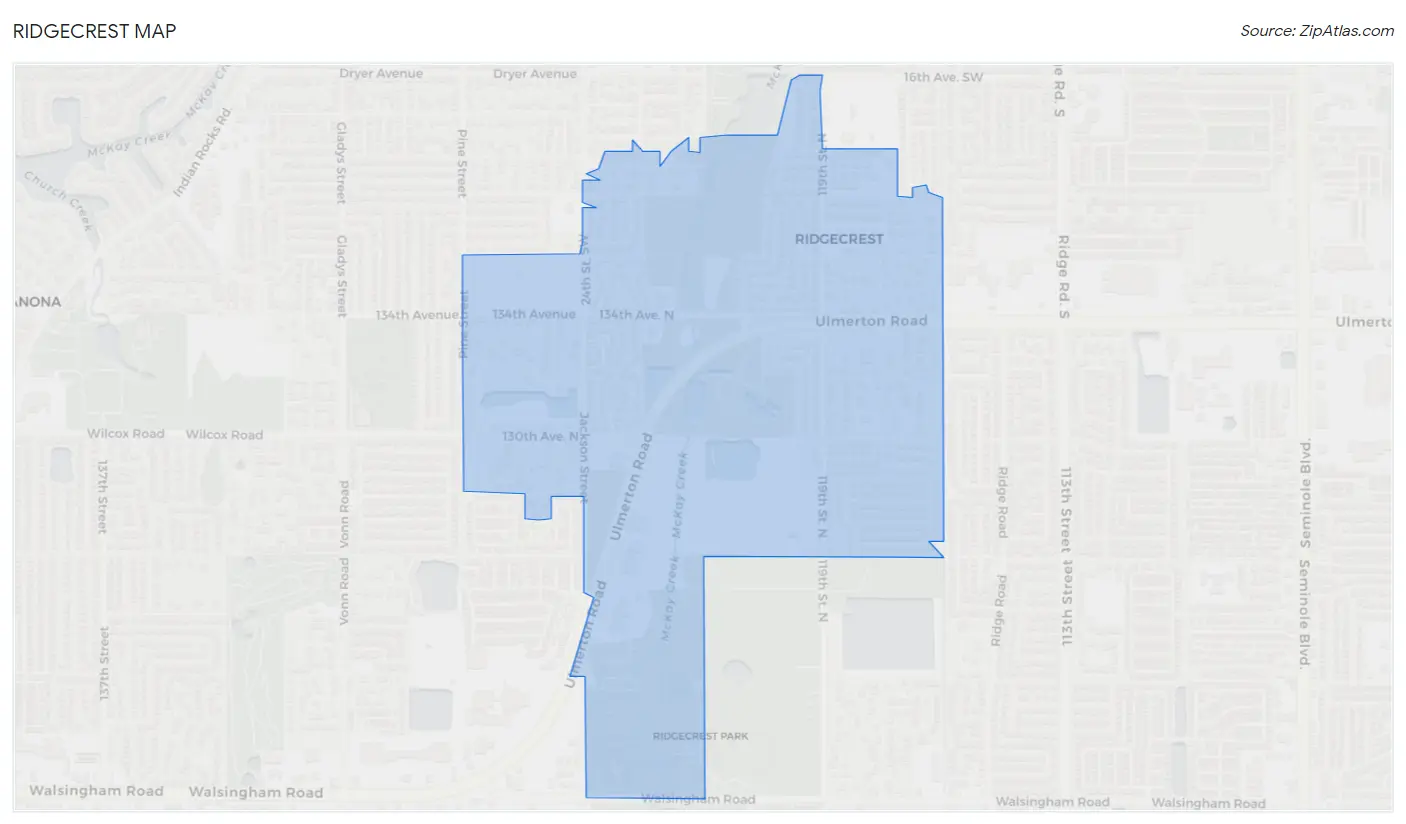
Ridgecrest Map
Ridgecrest Overview
$20,642
PER CAPITA INCOME
$42,412
AVG HOUSEHOLD INCOME
19.6%
WAGE / INCOME GAP [ % ]
80.4¢/ $1
WAGE / INCOME GAP [ $ ]
0.36
INEQUALITY / GINI INDEX
3,020
TOTAL POPULATION
1,457
MALE POPULATION
1,563
FEMALE POPULATION
93.22
MALES / 100 FEMALES
107.28
FEMALES / 100 MALES
35.9
MEDIAN AGE
3.3
AVG FAMILY SIZE
2.9
AVG HOUSEHOLD SIZE
1,571
LABOR FORCE [ PEOPLE ]
63.9%
PERCENT IN LABOR FORCE
10.6%
UNEMPLOYMENT RATE
Income in Ridgecrest
Income Overview in Ridgecrest
| Characteristic | Number | Measure |
| Per Capita Income | 3,020 | $20,642 |
| Median Family Income | 778 | $0 |
| Mean Family Income | 778 | $67,299 |
| Median Household Income | 1,030 | $42,412 |
| Mean Household Income | 1,030 | $58,634 |
| Income Deficit | 778 | $0 |
| Wage / Income Gap (%) | 3,020 | 19.61% |
| Wage / Income Gap ($) | 3,020 | 80.39¢ per $1 |
| Gini / Inequality Index | 3,020 | 0.36 |
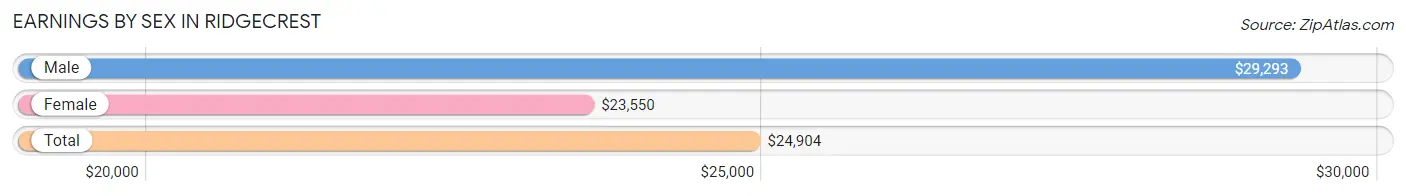
Earnings by Sex in Ridgecrest
Average Earnings in Ridgecrest are $24,904, $29,293 for men and $23,550 for women, a difference of 19.6%.
| Sex | Number | Average Earnings |
| Male | 643 (40.8%) | $29,293 |
| Female | 931 (59.2%) | $23,550 |
| Total | 1,574 (100.0%) | $24,904 |
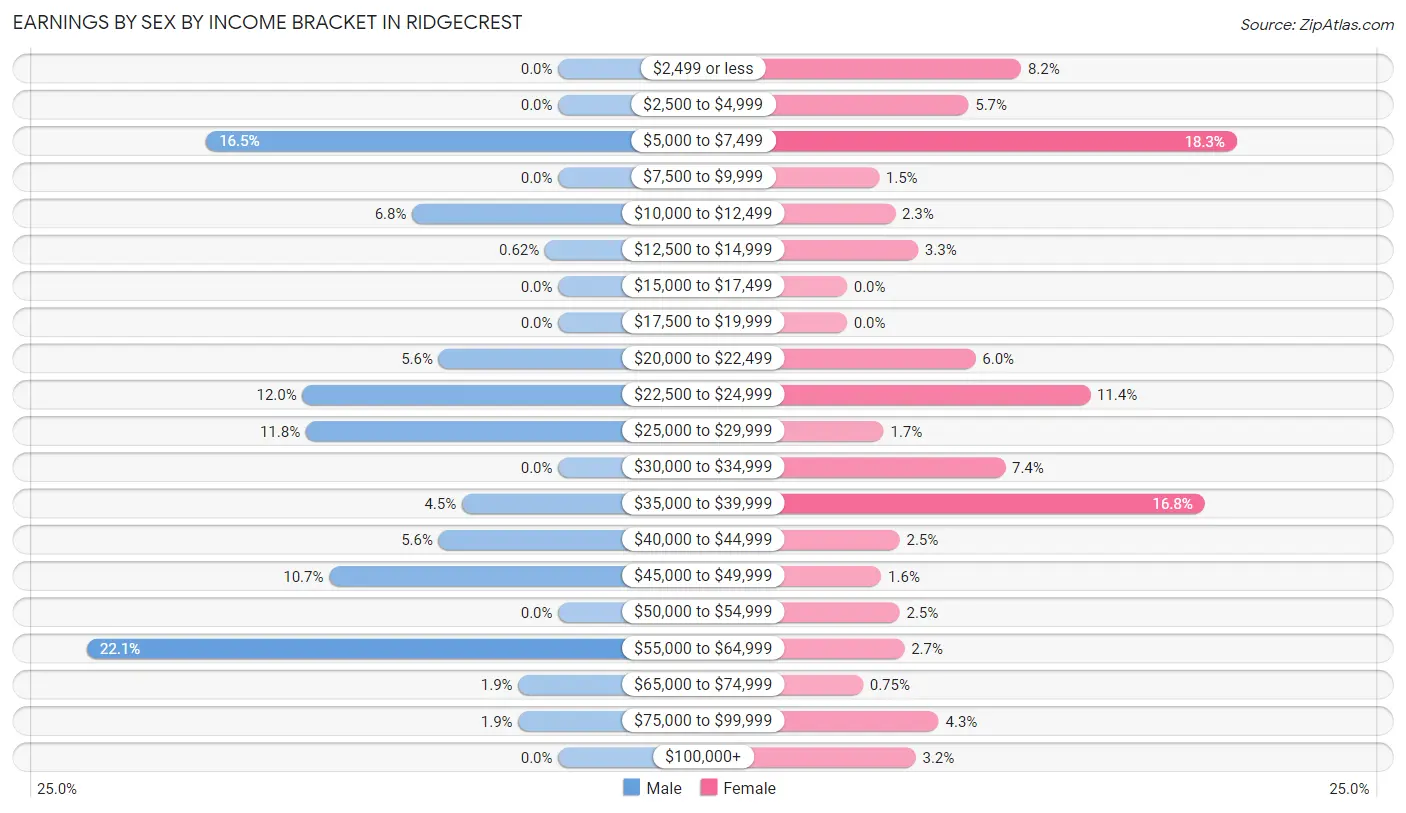
Earnings by Sex by Income Bracket in Ridgecrest
The most common earnings brackets in Ridgecrest are $55,000 to $64,999 for men (142 | 22.1%) and $5,000 to $7,499 for women (170 | 18.3%).
| Income | Male | Female |
| $2,499 or less | 0 (0.0%) | 76 (8.2%) |
| $2,500 to $4,999 | 0 (0.0%) | 53 (5.7%) |
| $5,000 to $7,499 | 106 (16.5%) | 170 (18.3%) |
| $7,500 to $9,999 | 0 (0.0%) | 14 (1.5%) |
| $10,000 to $12,499 | 44 (6.8%) | 21 (2.3%) |
| $12,500 to $14,999 | 4 (0.6%) | 31 (3.3%) |
| $15,000 to $17,499 | 0 (0.0%) | 0 (0.0%) |
| $17,500 to $19,999 | 0 (0.0%) | 0 (0.0%) |
| $20,000 to $22,499 | 36 (5.6%) | 56 (6.0%) |
| $22,500 to $24,999 | 77 (12.0%) | 106 (11.4%) |
| $25,000 to $29,999 | 76 (11.8%) | 16 (1.7%) |
| $30,000 to $34,999 | 0 (0.0%) | 69 (7.4%) |
| $35,000 to $39,999 | 29 (4.5%) | 156 (16.8%) |
| $40,000 to $44,999 | 36 (5.6%) | 23 (2.5%) |
| $45,000 to $49,999 | 69 (10.7%) | 15 (1.6%) |
| $50,000 to $54,999 | 0 (0.0%) | 23 (2.5%) |
| $55,000 to $64,999 | 142 (22.1%) | 25 (2.7%) |
| $65,000 to $74,999 | 12 (1.9%) | 7 (0.7%) |
| $75,000 to $99,999 | 12 (1.9%) | 40 (4.3%) |
| $100,000+ | 0 (0.0%) | 30 (3.2%) |
| Total | 643 (100.0%) | 931 (100.0%) |
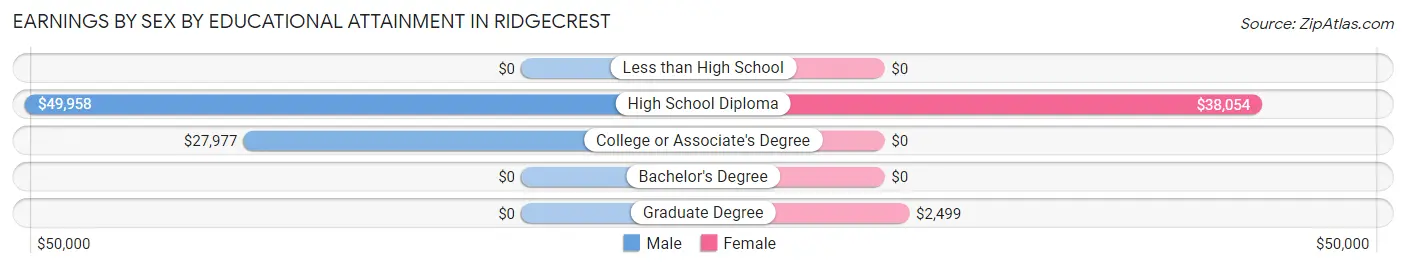
Earnings by Sex by Educational Attainment in Ridgecrest
Average earnings in Ridgecrest are $29,803 for men and $24,127 for women, a difference of 19.1%. Men with an educational attainment of high school diploma enjoy the highest average annual earnings of $49,958, while those with college or associate's degree education earn the least with $27,977. Women with an educational attainment of high school diploma earn the most with the average annual earnings of $38,054, while those with graduate degree education have the smallest earnings of $2,499.
| Educational Attainment | Male Income | Female Income |
| Less than High School | - | - |
| High School Diploma | $49,958 | $38,054 |
| College or Associate's Degree | $27,977 | $0 |
| Bachelor's Degree | - | - |
| Graduate Degree | - | - |
| Total | $29,803 | $24,127 |
Family Income in Ridgecrest
Family Income Brackets in Ridgecrest
According to the Ridgecrest family income data, there are 298 families falling into the $35,000 to $49,999 income range, which is the most common income bracket and makes up 38.3% of all families.
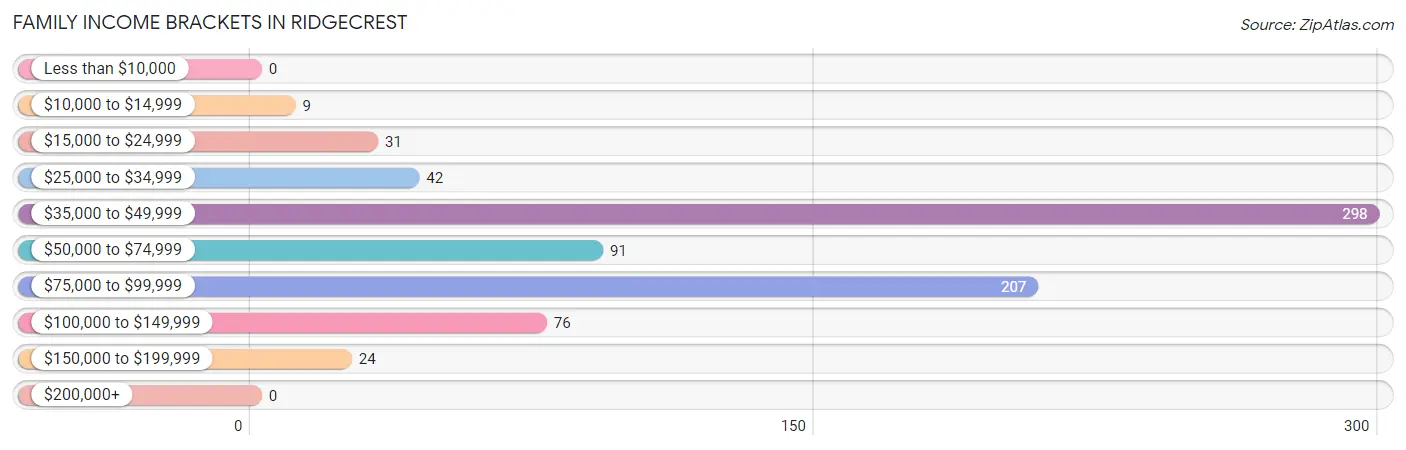
| Income Bracket | # Families | % Families |
| Less than $10,000 | 0 | 0.0% |
| $10,000 to $14,999 | 9 | 1.2% |
| $15,000 to $24,999 | 31 | 4.0% |
| $25,000 to $34,999 | 42 | 5.4% |
| $35,000 to $49,999 | 298 | 38.3% |
| $50,000 to $74,999 | 91 | 11.7% |
| $75,000 to $99,999 | 207 | 26.6% |
| $100,000 to $149,999 | 76 | 9.8% |
| $150,000 to $199,999 | 24 | 3.1% |
| $200,000+ | 0 | 0.0% |
Family Income by Famaliy Size in Ridgecrest
3-person families (264 | 33.9%) account for the highest median family income in Ridgecrest with $98,528 per family, while 3-person families (264 | 33.9%) have the highest median income of $32,843 per family member.
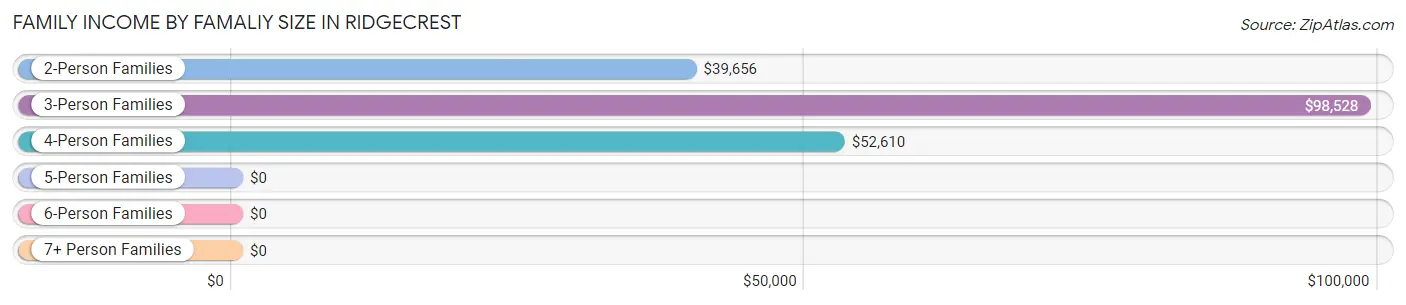
| Income Bracket | # Families | Median Income |
| 2-Person Families | 283 (36.4%) | $39,656 |
| 3-Person Families | 264 (33.9%) | $98,528 |
| 4-Person Families | 127 (16.3%) | $52,610 |
| 5-Person Families | 104 (13.4%) | $0 |
| 6-Person Families | 0 (0.0%) | $0 |
| 7+ Person Families | 0 (0.0%) | $0 |
| Total | 778 (100.0%) | $0 |
Family Income by Number of Earners in Ridgecrest
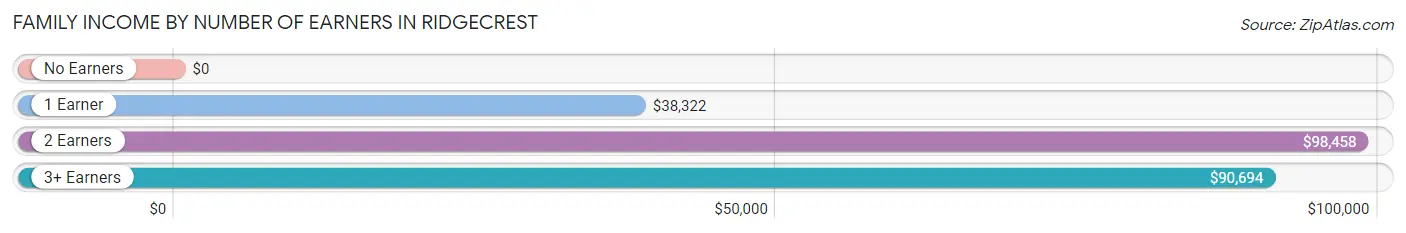
| Number of Earners | # Families | Median Income |
| No Earners | 25 (3.2%) | $0 |
| 1 Earner | 384 (49.4%) | $38,322 |
| 2 Earners | 312 (40.1%) | $98,458 |
| 3+ Earners | 57 (7.3%) | $90,694 |
| Total | 778 (100.0%) | $0 |
Household Income in Ridgecrest
Household Income Brackets in Ridgecrest
With 387 households falling in the category, the $35,000 to $49,999 income range is the most frequent in Ridgecrest, accounting for 37.6% of all households.
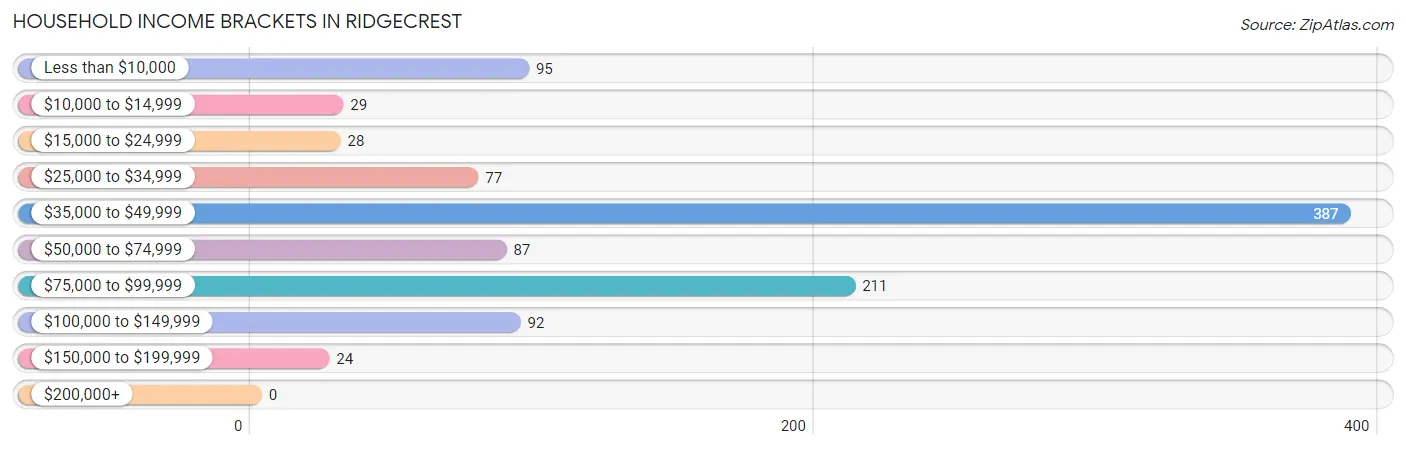
| Income Bracket | # Households | % Households |
| Less than $10,000 | 95 | 9.2% |
| $10,000 to $14,999 | 29 | 2.8% |
| $15,000 to $24,999 | 28 | 2.7% |
| $25,000 to $34,999 | 77 | 7.5% |
| $35,000 to $49,999 | 387 | 37.6% |
| $50,000 to $74,999 | 87 | 8.4% |
| $75,000 to $99,999 | 211 | 20.5% |
| $100,000 to $149,999 | 92 | 8.9% |
| $150,000 to $199,999 | 24 | 2.3% |
| $200,000+ | 0 | 0.0% |
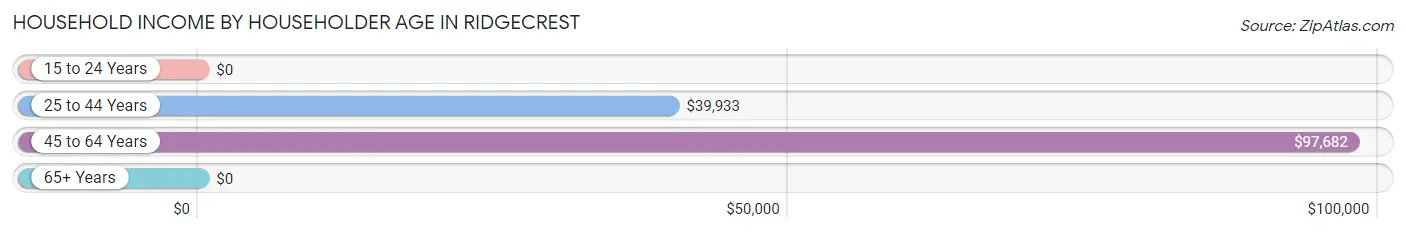
Household Income by Householder Age in Ridgecrest
The median household income in Ridgecrest is $42,412, with the highest median household income of $97,682 found in the 45 to 64 years age bracket for the primary householder. A total of 457 households (44.4%) fall into this category.
| Income Bracket | # Households | Median Income |
| 15 to 24 Years | 0 (0.0%) | $0 |
| 25 to 44 Years | 394 (38.3%) | $39,933 |
| 45 to 64 Years | 457 (44.4%) | $97,682 |
| 65+ Years | 179 (17.4%) | $0 |
| Total | 1,030 (100.0%) | $42,412 |
Poverty in Ridgecrest
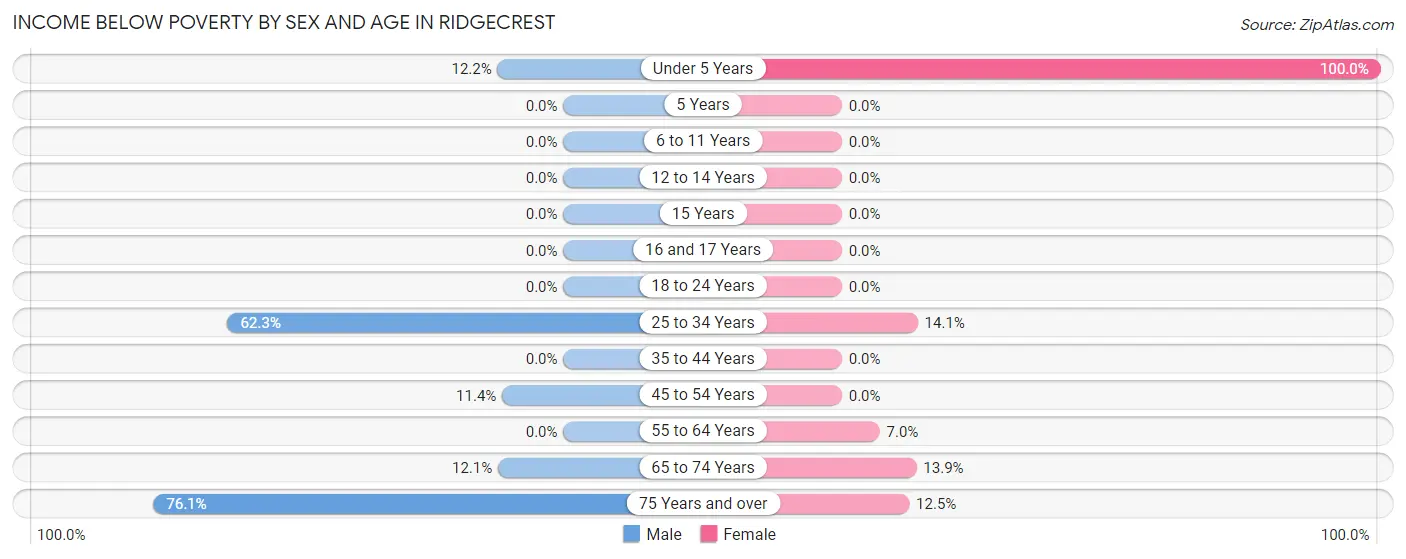
Income Below Poverty by Sex and Age in Ridgecrest
With 17.1% poverty level for males and 6.8% for females among the residents of Ridgecrest, 75 year old and over males and under 5 year old females are the most vulnerable to poverty, with 35 males (76.1%) and 25 females (100.0%) in their respective age groups living below the poverty level.
| Age Bracket | Male | Female |
| Under 5 Years | 22 (12.2%) | 25 (100.0%) |
| 5 Years | 0 (0.0%) | 0 (0.0%) |
| 6 to 11 Years | 0 (0.0%) | 0 (0.0%) |
| 12 to 14 Years | 0 (0.0%) | 0 (0.0%) |
| 15 Years | 0 (0.0%) | 0 (0.0%) |
| 16 and 17 Years | 0 (0.0%) | 0 (0.0%) |
| 18 to 24 Years | 0 (0.0%) | 0 (0.0%) |
| 25 to 34 Years | 149 (62.3%) | 20 (14.1%) |
| 35 to 44 Years | 0 (0.0%) | 0 (0.0%) |
| 45 to 54 Years | 15 (11.4%) | 0 (0.0%) |
| 55 to 64 Years | 0 (0.0%) | 20 (7.0%) |
| 65 to 74 Years | 28 (12.1%) | 32 (13.9%) |
| 75 Years and over | 35 (76.1%) | 9 (12.5%) |
| Total | 249 (17.1%) | 106 (6.8%) |
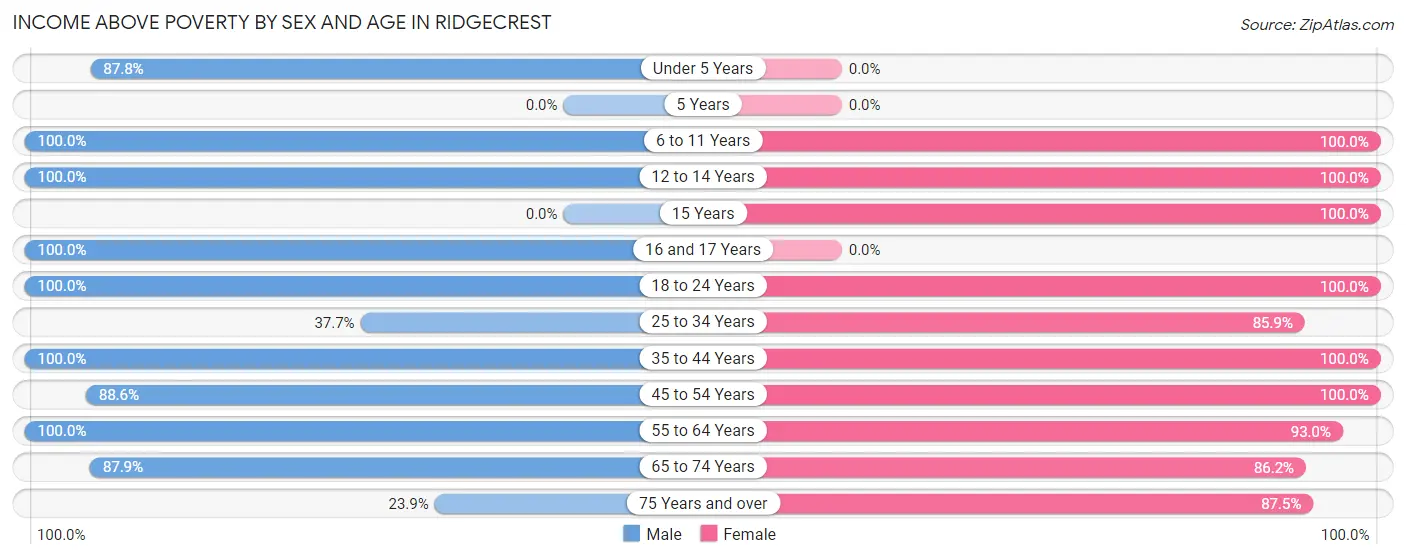
Income Above Poverty by Sex and Age in Ridgecrest
According to the poverty statistics in Ridgecrest, males aged 6 to 11 years and females aged 6 to 11 years are the age groups that are most secure financially, with 100.0% of males and 100.0% of females in these age groups living above the poverty line.
| Age Bracket | Male | Female |
| Under 5 Years | 158 (87.8%) | 0 (0.0%) |
| 5 Years | 0 (0.0%) | 0 (0.0%) |
| 6 to 11 Years | 69 (100.0%) | 138 (100.0%) |
| 12 to 14 Years | 62 (100.0%) | 25 (100.0%) |
| 15 Years | 0 (0.0%) | 62 (100.0%) |
| 16 and 17 Years | 199 (100.0%) | 0 (0.0%) |
| 18 to 24 Years | 83 (100.0%) | 124 (100.0%) |
| 25 to 34 Years | 90 (37.7%) | 122 (85.9%) |
| 35 to 44 Years | 149 (100.0%) | 347 (100.0%) |
| 45 to 54 Years | 117 (88.6%) | 112 (100.0%) |
| 55 to 64 Years | 67 (100.0%) | 265 (93.0%) |
| 65 to 74 Years | 203 (87.9%) | 199 (86.2%) |
| 75 Years and over | 11 (23.9%) | 63 (87.5%) |
| Total | 1,208 (82.9%) | 1,457 (93.2%) |
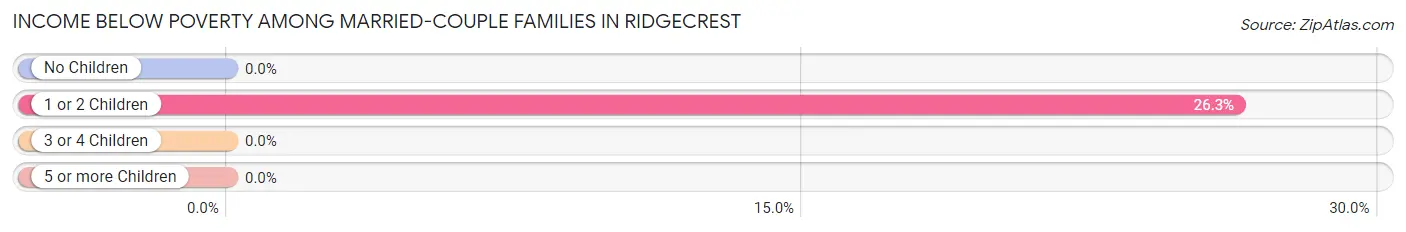
Income Below Poverty Among Married-Couple Families in Ridgecrest
The poverty statistics for married-couple families in Ridgecrest show that 5.6% or 20 of the total 357 families live below the poverty line. Families with 1 or 2 children have the highest poverty rate of 26.3%, comprising of 20 families. On the other hand, families with no children have the lowest poverty rate of 0.0%, which includes 0 families.
| Children | Above Poverty | Below Poverty |
| No Children | 281 (100.0%) | 0 (0.0%) |
| 1 or 2 Children | 56 (73.7%) | 20 (26.3%) |
| 3 or 4 Children | 0 (0.0%) | 0 (0.0%) |
| 5 or more Children | 0 (0.0%) | 0 (0.0%) |
| Total | 337 (94.4%) | 20 (5.6%) |
Income Below Poverty Among Single-Parent Households in Ridgecrest
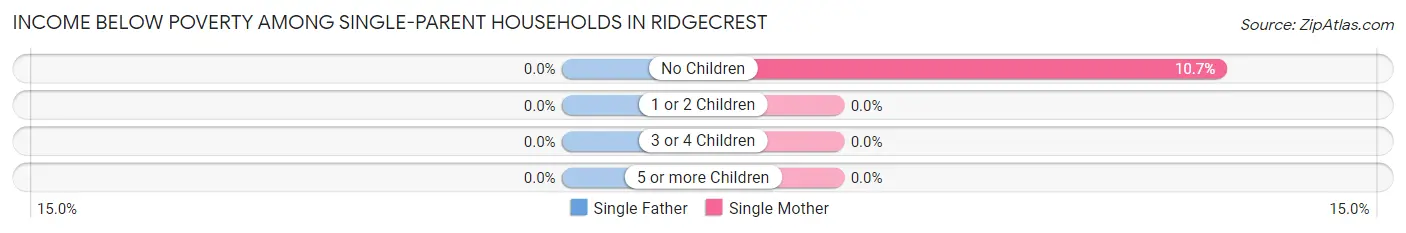
| Children | Single Father | Single Mother |
| No Children | 0 (0.0%) | 9 (10.7%) |
| 1 or 2 Children | 0 (0.0%) | 0 (0.0%) |
| 3 or 4 Children | 0 (0.0%) | 0 (0.0%) |
| 5 or more Children | 0 (0.0%) | 0 (0.0%) |
| Total | 0 (0.0%) | 9 (2.2%) |
Income Below Poverty Among Married-Couple vs Single-Parent Households in Ridgecrest
The poverty data for Ridgecrest shows that 20 of the married-couple family households (5.6%) and 9 of the single-parent households (2.1%) are living below the poverty level. Within the married-couple family households, those with 1 or 2 children have the highest poverty rate, with 20 households (26.3%) falling below the poverty line. Among the single-parent households, those with no children have the highest poverty rate, with 9 household (10.2%) living below poverty.
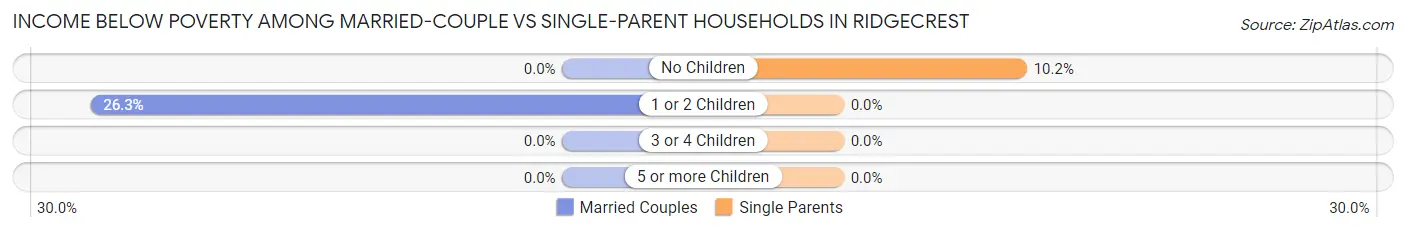
| Children | Married-Couple Families | Single-Parent Households |
| No Children | 0 (0.0%) | 9 (10.2%) |
| 1 or 2 Children | 20 (26.3%) | 0 (0.0%) |
| 3 or 4 Children | 0 (0.0%) | 0 (0.0%) |
| 5 or more Children | 0 (0.0%) | 0 (0.0%) |
| Total | 20 (5.6%) | 9 (2.1%) |
Race in Ridgecrest
The most populous races in Ridgecrest are Black / African American (1,239 | 41.0%), White / Caucasian (841 | 27.9%), and Two or more Races (570 | 18.9%).
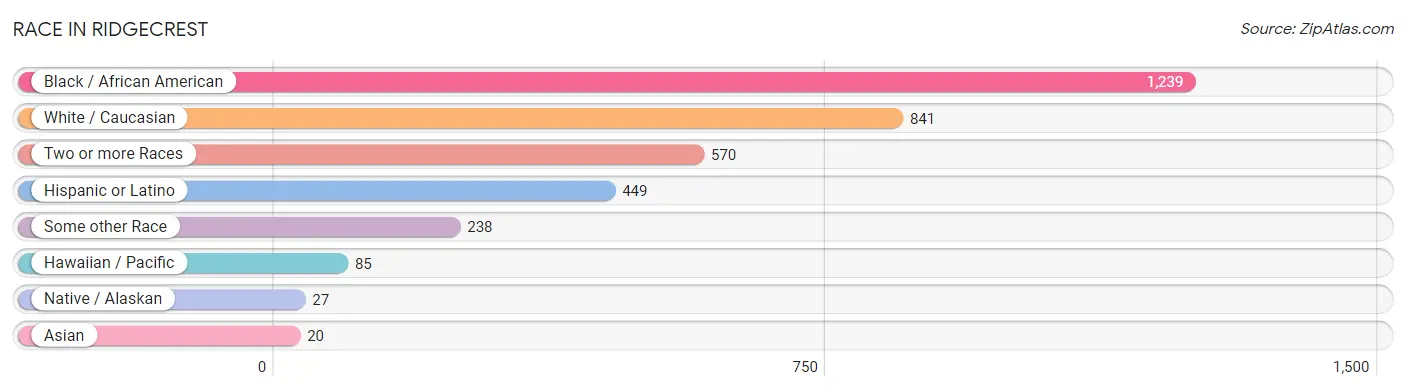
| Race | # Population | % Population |
| Asian | 20 | 0.7% |
| Black / African American | 1,239 | 41.0% |
| Hawaiian / Pacific | 85 | 2.8% |
| Hispanic or Latino | 449 | 14.9% |
| Native / Alaskan | 27 | 0.9% |
| White / Caucasian | 841 | 27.9% |
| Two or more Races | 570 | 18.9% |
| Some other Race | 238 | 7.9% |
| Total | 3,020 | 100.0% |
Ancestry in Ridgecrest
The most populous ancestries reported in Ridgecrest are Italian (380 | 12.6%), American (247 | 8.2%), Puerto Rican (221 | 7.3%), Ukrainian (158 | 5.2%), and Irish (154 | 5.1%), together accounting for 38.4% of all Ridgecrest residents.
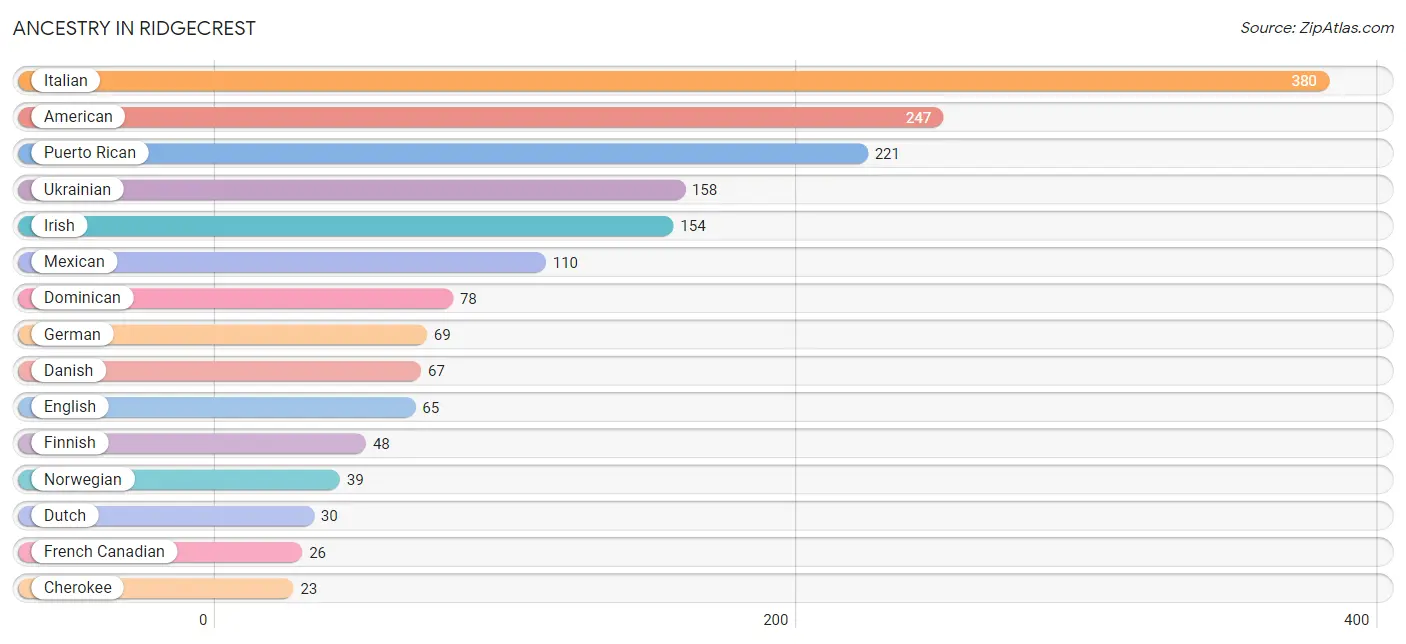
| Ancestry | # Population | % Population |
| American | 247 | 8.2% |
| Cherokee | 23 | 0.8% |
| Danish | 67 | 2.2% |
| Dominican | 78 | 2.6% |
| Dutch | 30 | 1.0% |
| English | 65 | 2.1% |
| Finnish | 48 | 1.6% |
| French Canadian | 26 | 0.9% |
| German | 69 | 2.3% |
| Indian (Asian) | 20 | 0.7% |
| Irish | 154 | 5.1% |
| Italian | 380 | 12.6% |
| Korean | 22 | 0.7% |
| Mexican | 110 | 3.6% |
| Nigerian | 21 | 0.7% |
| Norwegian | 39 | 1.3% |
| Puerto Rican | 221 | 7.3% |
| Spaniard | 18 | 0.6% |
| Subsaharan African | 21 | 0.7% |
| Turkish | 4 | 0.1% |
| Ukrainian | 158 | 5.2% | View All 21 Rows |
Immigrants in Ridgecrest
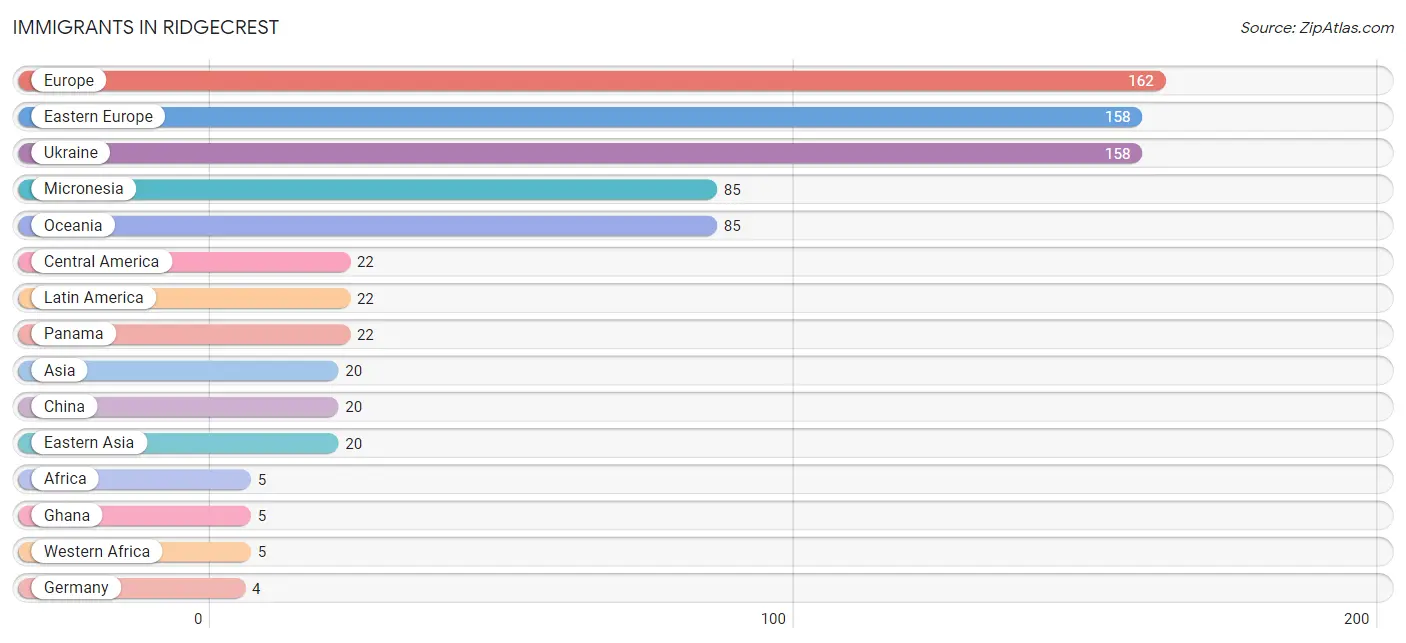
The most numerous immigrant groups reported in Ridgecrest came from Europe (162 | 5.4%), Eastern Europe (158 | 5.2%), Ukraine (158 | 5.2%), Micronesia (85 | 2.8%), and Oceania (85 | 2.8%), together accounting for 21.4% of all Ridgecrest residents.
| Immigration Origin | # Population | % Population |
| Africa | 5 | 0.2% |
| Asia | 20 | 0.7% |
| Central America | 22 | 0.7% |
| China | 20 | 0.7% |
| Eastern Asia | 20 | 0.7% |
| Eastern Europe | 158 | 5.2% |
| Europe | 162 | 5.4% |
| Germany | 4 | 0.1% |
| Ghana | 5 | 0.2% |
| Latin America | 22 | 0.7% |
| Micronesia | 85 | 2.8% |
| Oceania | 85 | 2.8% |
| Panama | 22 | 0.7% |
| Ukraine | 158 | 5.2% |
| Western Africa | 5 | 0.2% |
| Western Europe | 4 | 0.1% | View All 16 Rows |
Sex and Age in Ridgecrest
Sex and Age in Ridgecrest
The most populous age groups in Ridgecrest are 15 to 19 Years (225 | 15.4%) for men and 35 to 39 Years (252 | 16.1%) for women.
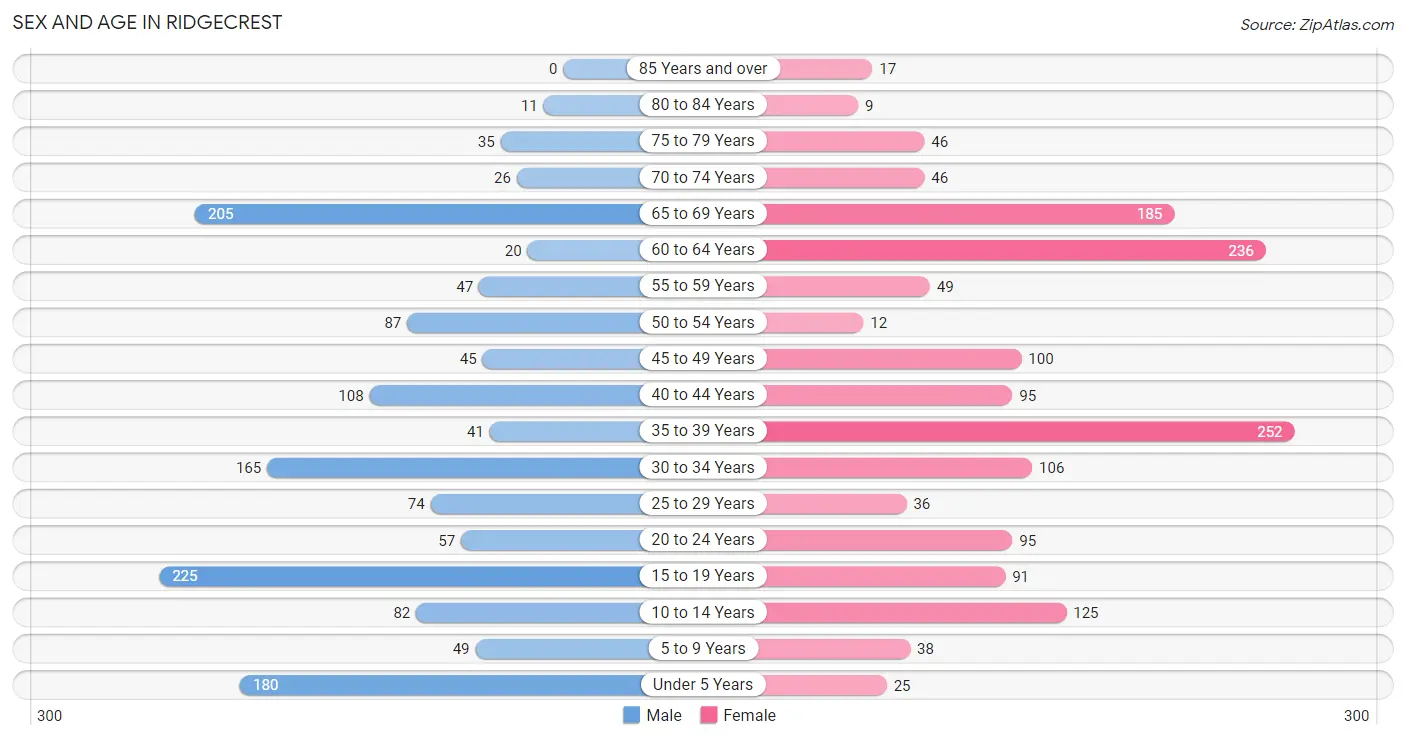
| Age Bracket | Male | Female |
| Under 5 Years | 180 (12.3%) | 25 (1.6%) |
| 5 to 9 Years | 49 (3.4%) | 38 (2.4%) |
| 10 to 14 Years | 82 (5.6%) | 125 (8.0%) |
| 15 to 19 Years | 225 (15.4%) | 91 (5.8%) |
| 20 to 24 Years | 57 (3.9%) | 95 (6.1%) |
| 25 to 29 Years | 74 (5.1%) | 36 (2.3%) |
| 30 to 34 Years | 165 (11.3%) | 106 (6.8%) |
| 35 to 39 Years | 41 (2.8%) | 252 (16.1%) |
| 40 to 44 Years | 108 (7.4%) | 95 (6.1%) |
| 45 to 49 Years | 45 (3.1%) | 100 (6.4%) |
| 50 to 54 Years | 87 (6.0%) | 12 (0.8%) |
| 55 to 59 Years | 47 (3.2%) | 49 (3.1%) |
| 60 to 64 Years | 20 (1.4%) | 236 (15.1%) |
| 65 to 69 Years | 205 (14.1%) | 185 (11.8%) |
| 70 to 74 Years | 26 (1.8%) | 46 (2.9%) |
| 75 to 79 Years | 35 (2.4%) | 46 (2.9%) |
| 80 to 84 Years | 11 (0.7%) | 9 (0.6%) |
| 85 Years and over | 0 (0.0%) | 17 (1.1%) |
| Total | 1,457 (100.0%) | 1,563 (100.0%) |
Families and Households in Ridgecrest
Median Family Size in Ridgecrest
The median family size in Ridgecrest is 3.30 persons per family, with single male/father families (4 | 0.5%) accounting for the largest median family size of 8.5 persons per family. On the other hand, married-couple families (357 | 45.9%) represent the smallest median family size with 3.24 persons per family.
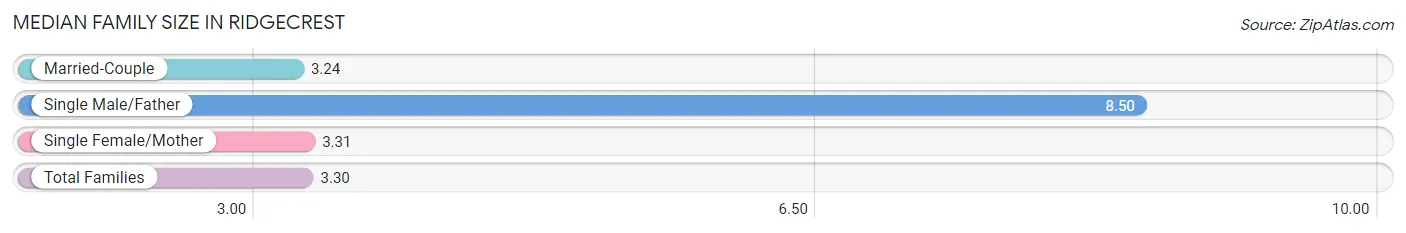
| Family Type | # Families | Family Size |
| Married-Couple | 357 (45.9%) | 3.24 |
| Single Male/Father | 4 (0.5%) | 8.50 |
| Single Female/Mother | 417 (53.6%) | 3.31 |
| Total Families | 778 (100.0%) | 3.30 |
Median Household Size in Ridgecrest
The median household size in Ridgecrest is 2.93 persons per household, with single male/father households (4 | 0.4%) accounting for the largest median household size of 10 persons per household. non-family households (252 | 24.5%) represent the smallest median household size with 1.18 persons per household.
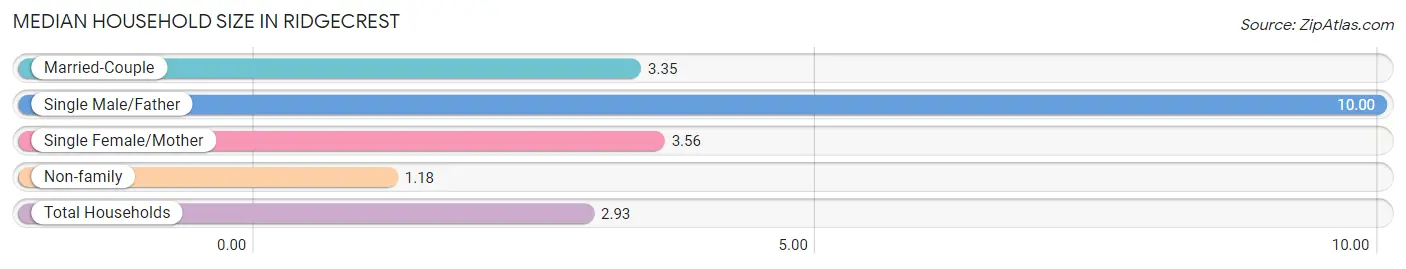
| Household Type | # Households | Household Size |
| Married-Couple | 357 (34.7%) | 3.35 |
| Single Male/Father | 4 (0.4%) | 10.00 |
| Single Female/Mother | 417 (40.5%) | 3.56 |
| Non-family | 252 (24.5%) | 1.18 |
| Total Households | 1,030 (100.0%) | 2.93 |
Household Size by Marriage Status in Ridgecrest
Out of a total of 1,030 households in Ridgecrest, 778 (75.5%) are family households, while 252 (24.5%) are nonfamily households. The most numerous type of family households are 2-person households, comprising 283, and the most common type of nonfamily households are 1-person households, comprising 228.
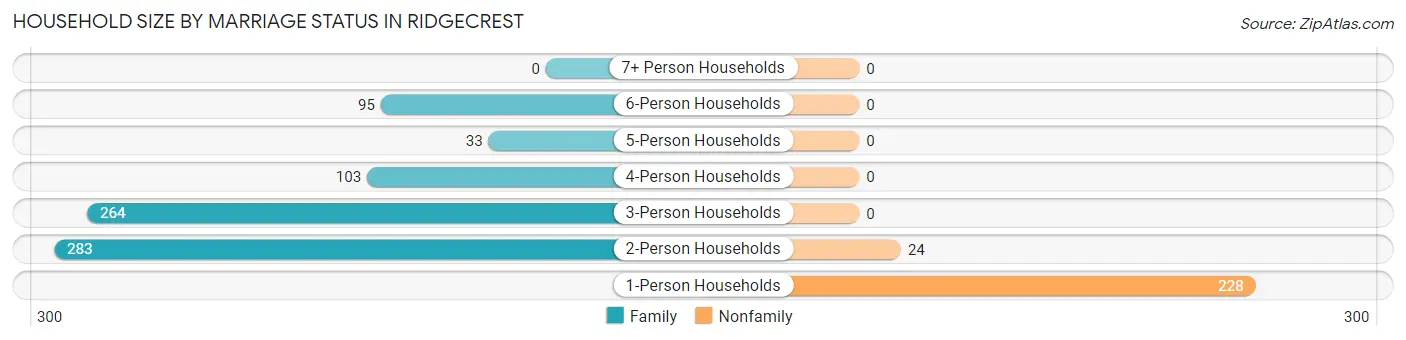
| Household Size | Family Households | Nonfamily Households |
| 1-Person Households | - | 228 (22.1%) |
| 2-Person Households | 283 (27.5%) | 24 (2.3%) |
| 3-Person Households | 264 (25.6%) | 0 (0.0%) |
| 4-Person Households | 103 (10.0%) | 0 (0.0%) |
| 5-Person Households | 33 (3.2%) | 0 (0.0%) |
| 6-Person Households | 95 (9.2%) | 0 (0.0%) |
| 7+ Person Households | 0 (0.0%) | 0 (0.0%) |
| Total | 778 (75.5%) | 252 (24.5%) |
Female Fertility in Ridgecrest
Fertility by Age in Ridgecrest
| Age Bracket | Women with Births | Births / 1,000 Women |
| 15 to 19 years | 0 (0.0%) | 0.0 |
| 20 to 34 years | 0 (0.0%) | 0.0 |
| 35 to 50 years | 0 (0.0%) | 0.0 |
| Total | 0 (0.0%) | 0.0 |
Fertility by Age by Marriage Status in Ridgecrest
| Age Bracket | Married | Unmarried |
| 15 to 19 years | 0 (0.0%) | 0 (0.0%) |
| 20 to 34 years | 0 (0.0%) | 0 (0.0%) |
| 35 to 50 years | 0 (0.0%) | 0 (0.0%) |
| Total | 0 (0.0%) | 0 (0.0%) |
Fertility by Education in Ridgecrest
| Educational Attainment | Women with Births | Births / 1,000 Women |
| Less than High School | 0 (0.0%) | 0.0 |
| High School Diploma | 0 (0.0%) | 0.0 |
| College or Associate's Degree | 0 (0.0%) | 0.0 |
| Bachelor's Degree | 0 (0.0%) | 0.0 |
| Graduate Degree | 0 (0.0%) | 0.0 |
| Total | 0 (0.0%) | 0.0 |
Fertility by Education by Marriage Status in Ridgecrest
| Educational Attainment | Married | Unmarried |
| Less than High School | 0 (0.0%) | 0 (0.0%) |
| High School Diploma | 0 (0.0%) | 0 (0.0%) |
| College or Associate's Degree | 0 (0.0%) | 0 (0.0%) |
| Bachelor's Degree | 0 (0.0%) | 0 (0.0%) |
| Graduate Degree | 0 (0.0%) | 0 (0.0%) |
| Total | 0 (0.0%) | 0 (0.0%) |
Employment Characteristics in Ridgecrest
Employment by Class of Employer in Ridgecrest
Among the 1,406 employed individuals in Ridgecrest, private company employees (1,071 | 76.2%), not-for-profit organizations (143 | 10.2%), and local government employees (105 | 7.5%) make up the most common classes of employment.
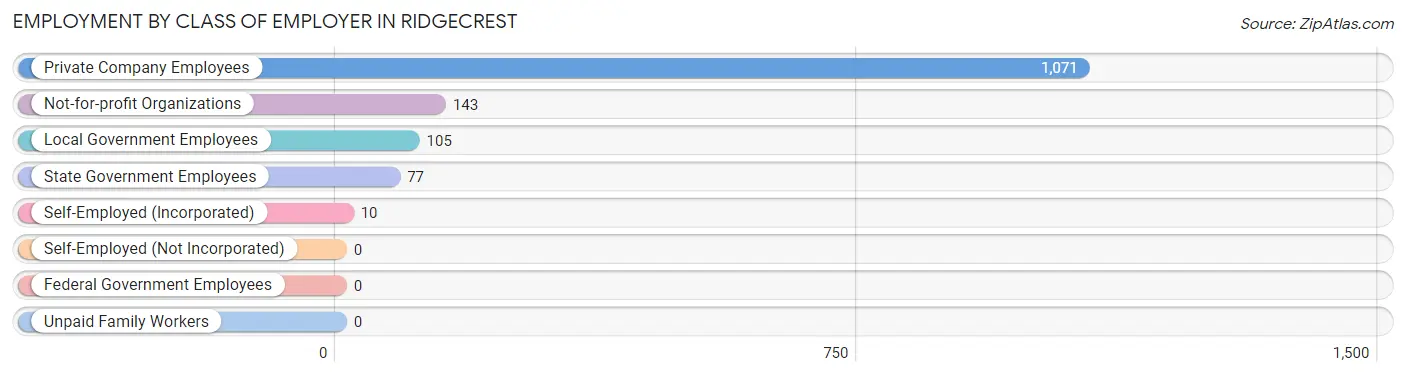
| Employer Class | # Employees | % Employees |
| Private Company Employees | 1,071 | 76.2% |
| Self-Employed (Incorporated) | 10 | 0.7% |
| Self-Employed (Not Incorporated) | 0 | 0.0% |
| Not-for-profit Organizations | 143 | 10.2% |
| Local Government Employees | 105 | 7.5% |
| State Government Employees | 77 | 5.5% |
| Federal Government Employees | 0 | 0.0% |
| Unpaid Family Workers | 0 | 0.0% |
| Total | 1,406 | 100.0% |
Employment Status by Age in Ridgecrest
According to the labor force statistics for Ridgecrest, out of the total population over 16 years of age (2,459), 63.9% or 1,571 individuals are in the labor force, with 10.6% or 167 of them unemployed. The age group with the highest labor force participation rate is 35 to 44 years, with 93.8% or 465 individuals in the labor force. Within the labor force, the 30 to 34 years age range has the highest percentage of unemployed individuals, with 44.5% or 106 of them being unemployed.
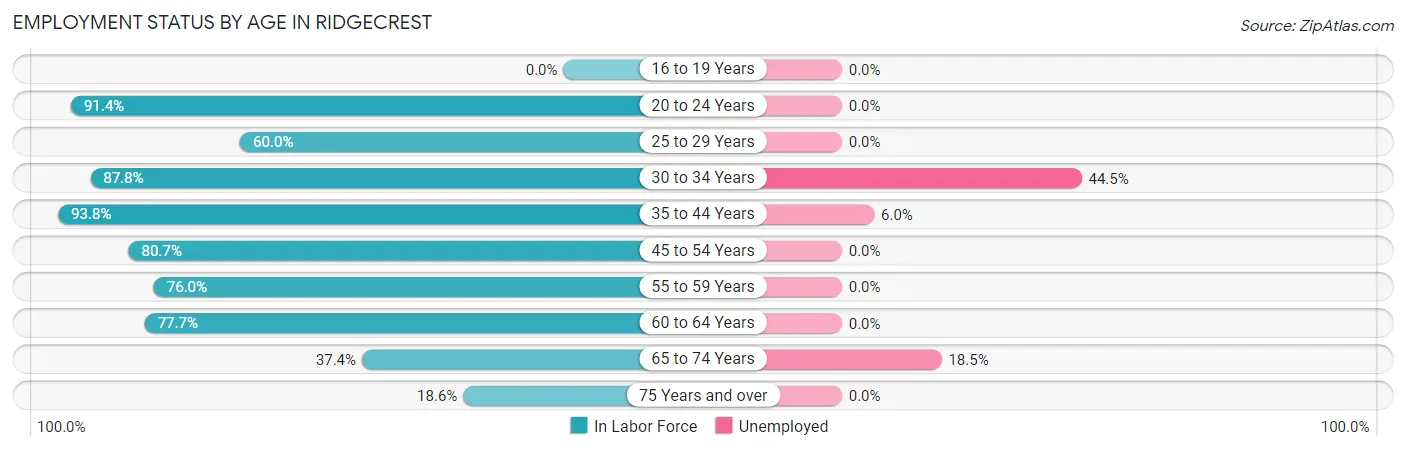
| Age Bracket | In Labor Force | Unemployed |
| 16 to 19 Years | 0 (0.0%) | 0 (0.0%) |
| 20 to 24 Years | 139 (91.4%) | 0 (0.0%) |
| 25 to 29 Years | 66 (60.0%) | 0 (0.0%) |
| 30 to 34 Years | 238 (87.8%) | 106 (44.5%) |
| 35 to 44 Years | 465 (93.8%) | 28 (6.0%) |
| 45 to 54 Years | 197 (80.7%) | 0 (0.0%) |
| 55 to 59 Years | 73 (76.0%) | 0 (0.0%) |
| 60 to 64 Years | 199 (77.7%) | 0 (0.0%) |
| 65 to 74 Years | 173 (37.4%) | 32 (18.5%) |
| 75 Years and over | 22 (18.6%) | 0 (0.0%) |
| Total | 1,571 (63.9%) | 167 (10.6%) |
Employment Status by Educational Attainment in Ridgecrest
According to labor force statistics for Ridgecrest, 84.0% of individuals (1,237) out of the total population between 25 and 64 years of age (1,473) are in the labor force, with 10.8% or 134 of them being unemployed. The group with the highest labor force participation rate are those with the educational attainment of college / associate degree, with 90.8% or 600 individuals in the labor force. Within the labor force, individuals with less than high school education have the highest percentage of unemployment, with 100.0% or 106 of them being unemployed.
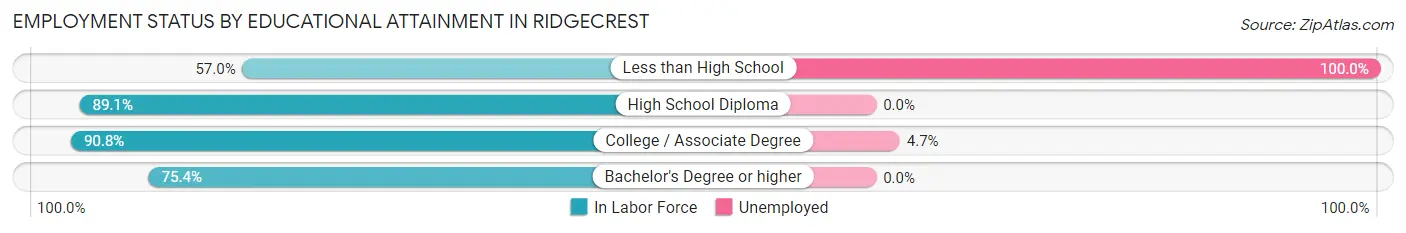
| Educational Attainment | In Labor Force | Unemployed |
| Less than High School | 106 (57.0%) | 186 (100.0%) |
| High School Diploma | 391 (89.1%) | 0 (0.0%) |
| College / Associate Degree | 600 (90.8%) | 31 (4.7%) |
| Bachelor's Degree or higher | 141 (75.4%) | 0 (0.0%) |
| Total | 1,237 (84.0%) | 159 (10.8%) |
Employment Occupations by Sex in Ridgecrest
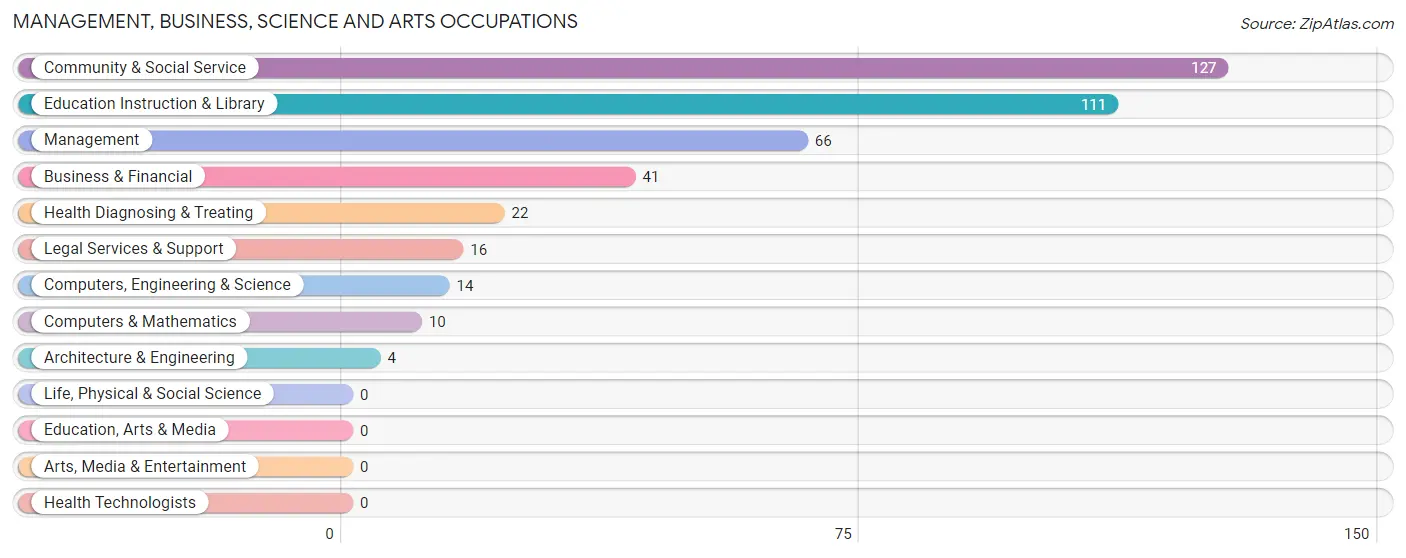
Management, Business, Science and Arts Occupations
The most common Management, Business, Science and Arts occupations in Ridgecrest are Community & Social Service (127 | 9.0%), Education Instruction & Library (111 | 7.9%), Management (66 | 4.7%), Business & Financial (41 | 2.9%), and Health Diagnosing & Treating (22 | 1.6%).
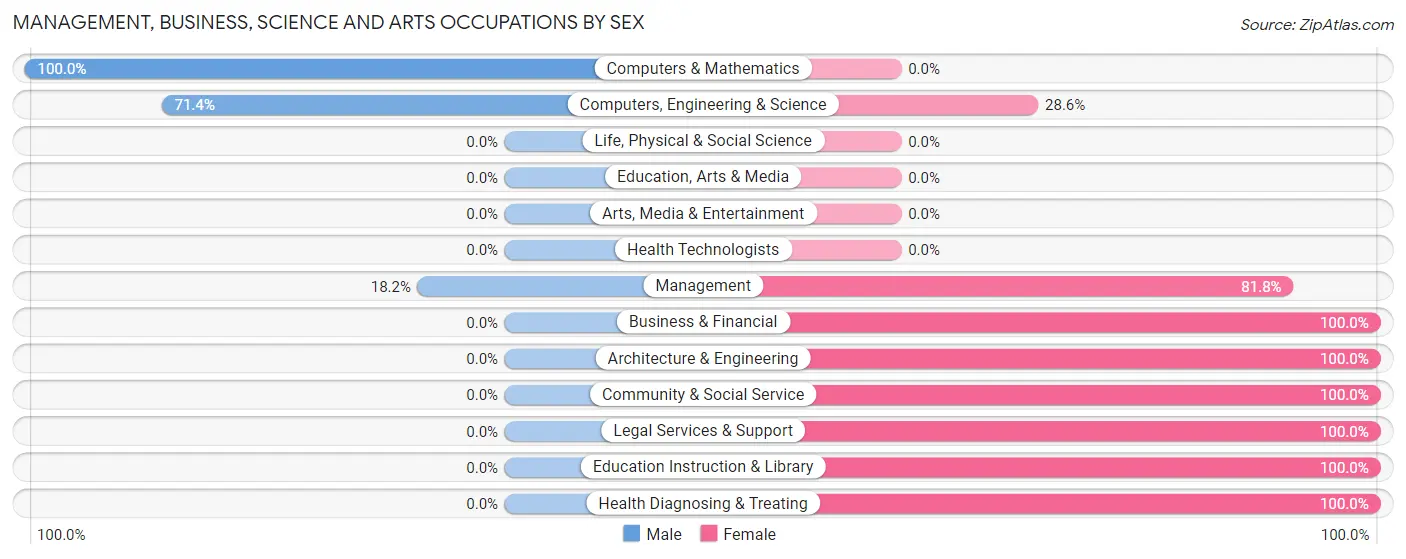
Management, Business, Science and Arts Occupations by Sex
Within the Management, Business, Science and Arts occupations in Ridgecrest, the most male-oriented occupations are Computers & Mathematics (100.0%), Computers, Engineering & Science (71.4%), and Management (18.2%), while the most female-oriented occupations are Business & Financial (100.0%), Architecture & Engineering (100.0%), and Community & Social Service (100.0%).
| Occupation | Male | Female |
| Management | 12 (18.2%) | 54 (81.8%) |
| Business & Financial | 0 (0.0%) | 41 (100.0%) |
| Computers, Engineering & Science | 10 (71.4%) | 4 (28.6%) |
| Computers & Mathematics | 10 (100.0%) | 0 (0.0%) |
| Architecture & Engineering | 0 (0.0%) | 4 (100.0%) |
| Life, Physical & Social Science | 0 (0.0%) | 0 (0.0%) |
| Community & Social Service | 0 (0.0%) | 127 (100.0%) |
| Education, Arts & Media | 0 (0.0%) | 0 (0.0%) |
| Legal Services & Support | 0 (0.0%) | 16 (100.0%) |
| Education Instruction & Library | 0 (0.0%) | 111 (100.0%) |
| Arts, Media & Entertainment | 0 (0.0%) | 0 (0.0%) |
| Health Diagnosing & Treating | 0 (0.0%) | 22 (100.0%) |
| Health Technologists | 0 (0.0%) | 0 (0.0%) |
| Total (Category) | 22 (8.2%) | 248 (91.8%) |
| Total (Overall) | 496 (35.3%) | 910 (64.7%) |
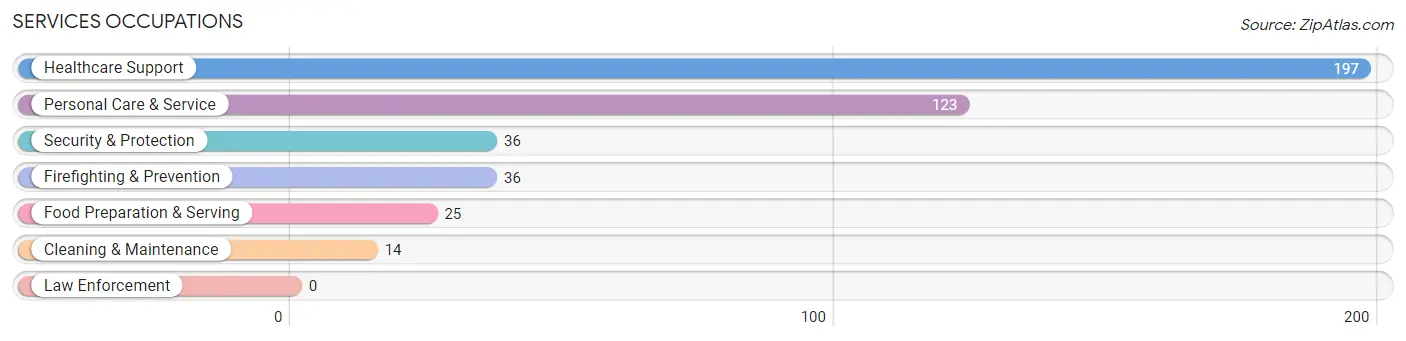
Services Occupations
The most common Services occupations in Ridgecrest are Healthcare Support (197 | 14.0%), Personal Care & Service (123 | 8.7%), Security & Protection (36 | 2.6%), Firefighting & Prevention (36 | 2.6%), and Food Preparation & Serving (25 | 1.8%).
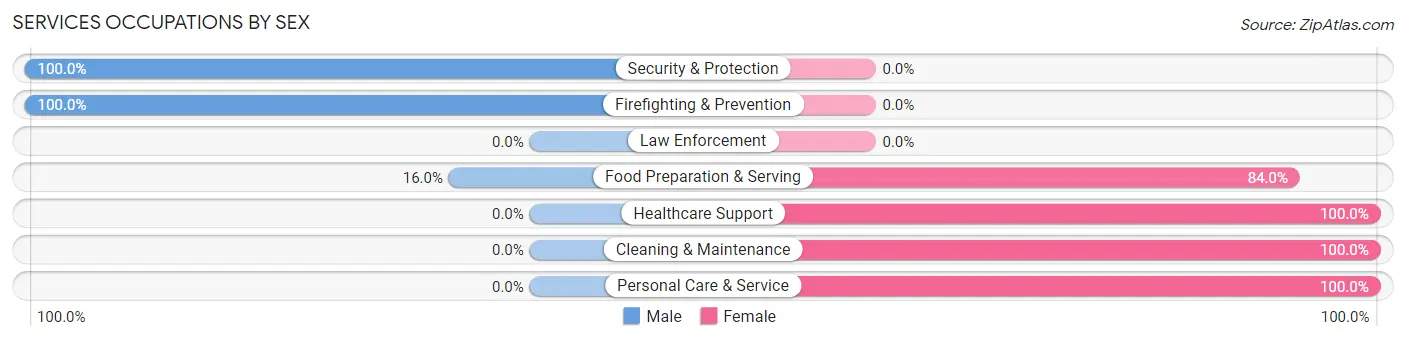
Services Occupations by Sex
Within the Services occupations in Ridgecrest, the most male-oriented occupations are Security & Protection (100.0%), Firefighting & Prevention (100.0%), and Food Preparation & Serving (16.0%), while the most female-oriented occupations are Healthcare Support (100.0%), Cleaning & Maintenance (100.0%), and Personal Care & Service (100.0%).
| Occupation | Male | Female |
| Healthcare Support | 0 (0.0%) | 197 (100.0%) |
| Security & Protection | 36 (100.0%) | 0 (0.0%) |
| Firefighting & Prevention | 36 (100.0%) | 0 (0.0%) |
| Law Enforcement | 0 (0.0%) | 0 (0.0%) |
| Food Preparation & Serving | 4 (16.0%) | 21 (84.0%) |
| Cleaning & Maintenance | 0 (0.0%) | 14 (100.0%) |
| Personal Care & Service | 0 (0.0%) | 123 (100.0%) |
| Total (Category) | 40 (10.1%) | 355 (89.9%) |
| Total (Overall) | 496 (35.3%) | 910 (64.7%) |
Sales and Office Occupations
The most common Sales and Office occupations in Ridgecrest are Office & Administration (269 | 19.1%), and Sales & Related (43 | 3.1%).
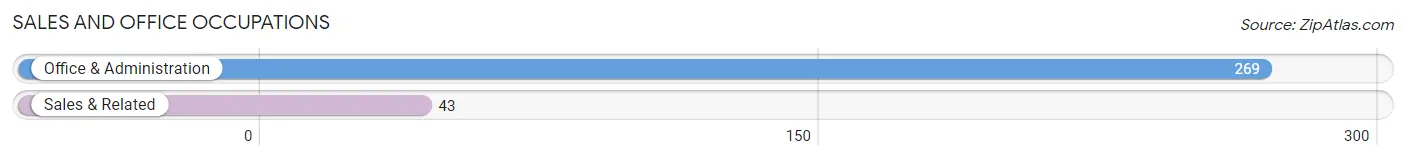
Sales and Office Occupations by Sex
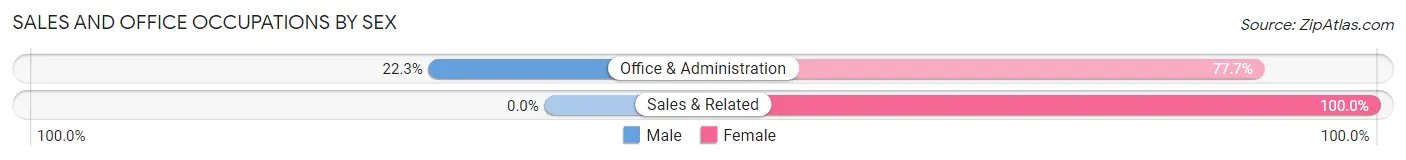
| Occupation | Male | Female |
| Sales & Related | 0 (0.0%) | 43 (100.0%) |
| Office & Administration | 60 (22.3%) | 209 (77.7%) |
| Total (Category) | 60 (19.2%) | 252 (80.8%) |
| Total (Overall) | 496 (35.3%) | 910 (64.7%) |
Natural Resources, Construction and Maintenance Occupations
The most common Natural Resources, Construction and Maintenance occupations in Ridgecrest are Construction & Extraction (125 | 8.9%), Installation, Maintenance & Repair (111 | 7.9%), and Farming, Fishing & Forestry (16 | 1.1%).
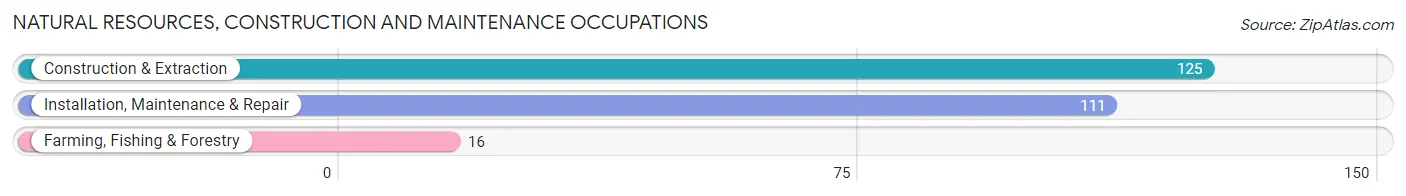
Natural Resources, Construction and Maintenance Occupations by Sex
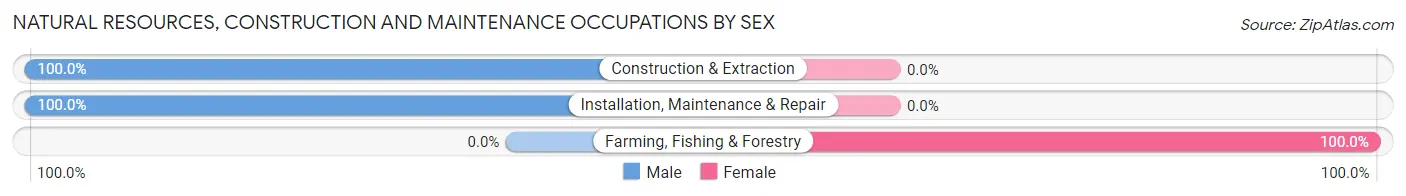
| Occupation | Male | Female |
| Farming, Fishing & Forestry | 0 (0.0%) | 16 (100.0%) |
| Construction & Extraction | 125 (100.0%) | 0 (0.0%) |
| Installation, Maintenance & Repair | 111 (100.0%) | 0 (0.0%) |
| Total (Category) | 236 (93.6%) | 16 (6.4%) |
| Total (Overall) | 496 (35.3%) | 910 (64.7%) |
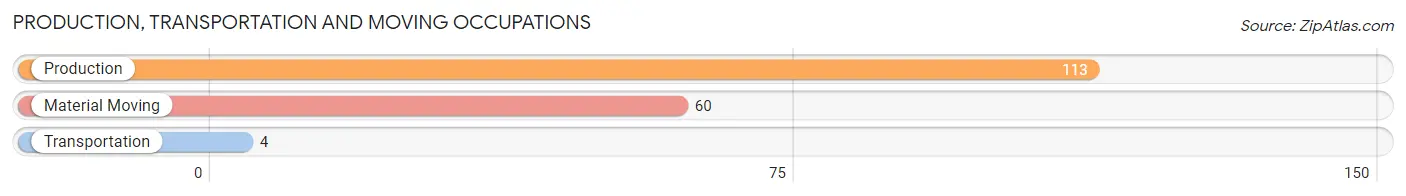
Production, Transportation and Moving Occupations
The most common Production, Transportation and Moving occupations in Ridgecrest are Production (113 | 8.0%), Material Moving (60 | 4.3%), and Transportation (4 | 0.3%).
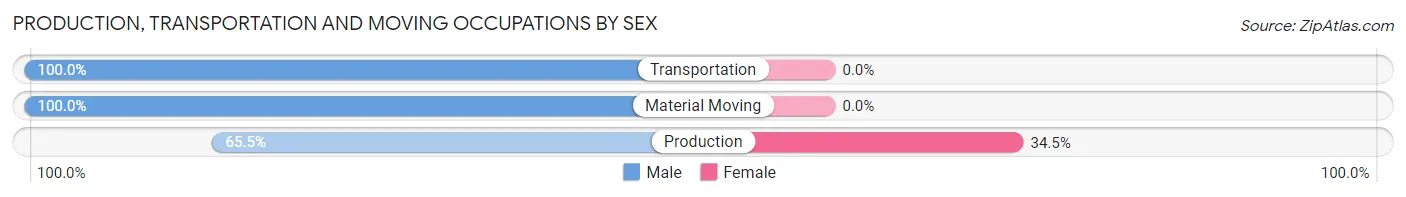
Production, Transportation and Moving Occupations by Sex
| Occupation | Male | Female |
| Production | 74 (65.5%) | 39 (34.5%) |
| Transportation | 4 (100.0%) | 0 (0.0%) |
| Material Moving | 60 (100.0%) | 0 (0.0%) |
| Total (Category) | 138 (78.0%) | 39 (22.0%) |
| Total (Overall) | 496 (35.3%) | 910 (64.7%) |
Employment Industries by Sex in Ridgecrest
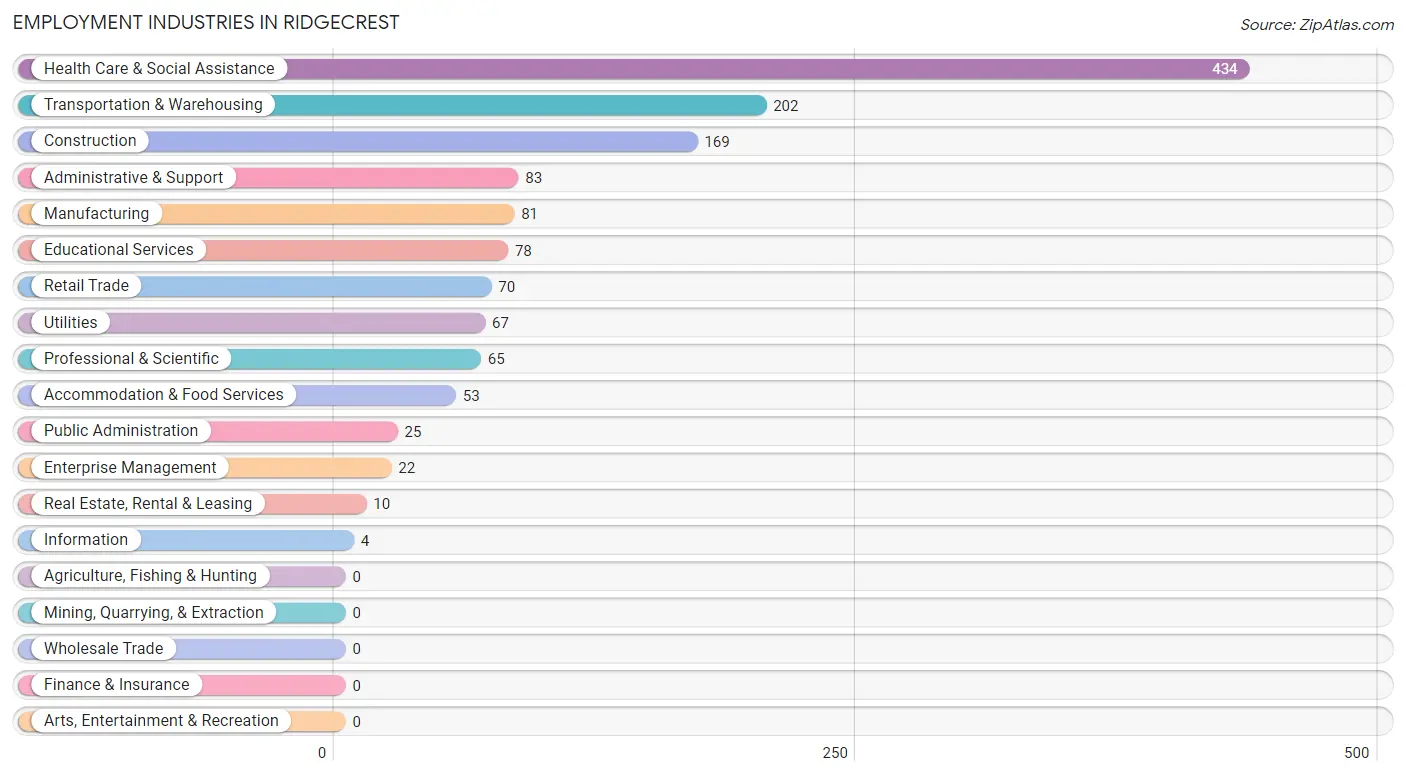
Employment Industries in Ridgecrest
The major employment industries in Ridgecrest include Health Care & Social Assistance (434 | 30.9%), Transportation & Warehousing (202 | 14.4%), Construction (169 | 12.0%), Administrative & Support (83 | 5.9%), and Manufacturing (81 | 5.8%).
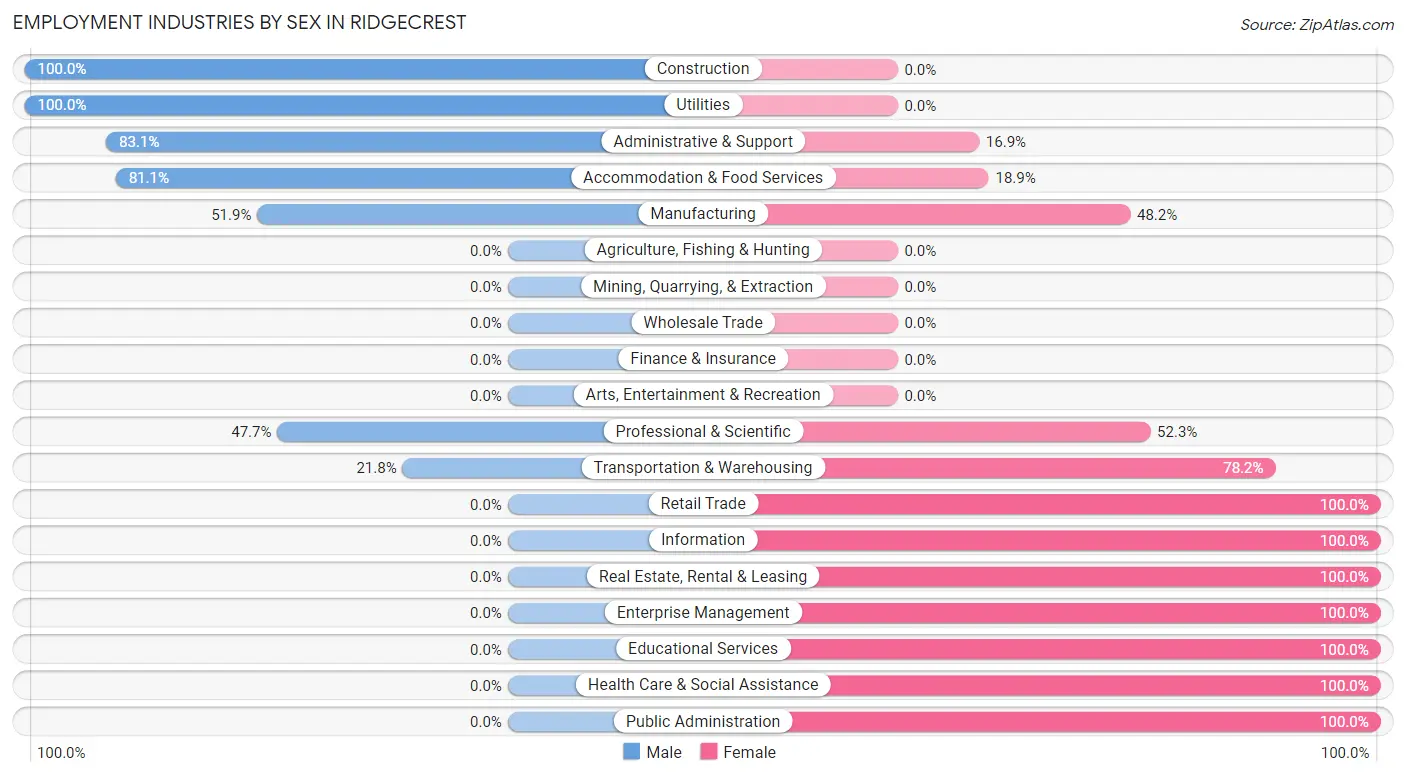
Employment Industries by Sex in Ridgecrest
The Ridgecrest industries that see more men than women are Construction (100.0%), Utilities (100.0%), and Administrative & Support (83.1%), whereas the industries that tend to have a higher number of women are Retail Trade (100.0%), Information (100.0%), and Real Estate, Rental & Leasing (100.0%).
| Industry | Male | Female |
| Agriculture, Fishing & Hunting | 0 (0.0%) | 0 (0.0%) |
| Mining, Quarrying, & Extraction | 0 (0.0%) | 0 (0.0%) |
| Construction | 169 (100.0%) | 0 (0.0%) |
| Manufacturing | 42 (51.8%) | 39 (48.1%) |
| Wholesale Trade | 0 (0.0%) | 0 (0.0%) |
| Retail Trade | 0 (0.0%) | 70 (100.0%) |
| Transportation & Warehousing | 44 (21.8%) | 158 (78.2%) |
| Utilities | 67 (100.0%) | 0 (0.0%) |
| Information | 0 (0.0%) | 4 (100.0%) |
| Finance & Insurance | 0 (0.0%) | 0 (0.0%) |
| Real Estate, Rental & Leasing | 0 (0.0%) | 10 (100.0%) |
| Professional & Scientific | 31 (47.7%) | 34 (52.3%) |
| Enterprise Management | 0 (0.0%) | 22 (100.0%) |
| Administrative & Support | 69 (83.1%) | 14 (16.9%) |
| Educational Services | 0 (0.0%) | 78 (100.0%) |
| Health Care & Social Assistance | 0 (0.0%) | 434 (100.0%) |
| Arts, Entertainment & Recreation | 0 (0.0%) | 0 (0.0%) |
| Accommodation & Food Services | 43 (81.1%) | 10 (18.9%) |
| Public Administration | 0 (0.0%) | 25 (100.0%) |
| Total | 496 (35.3%) | 910 (64.7%) |
Education in Ridgecrest
School Enrollment in Ridgecrest
The most common levels of schooling among the 805 students in Ridgecrest are high school (489 | 60.8%), middle school (183 | 22.7%), and elementary school (87 | 10.8%).
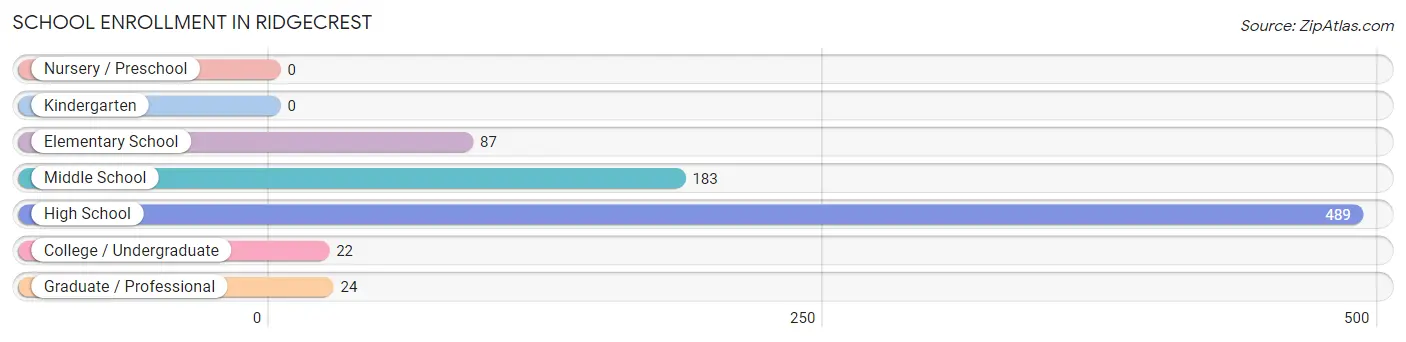
| School Level | # Students | % Students |
| Nursery / Preschool | 0 | 0.0% |
| Kindergarten | 0 | 0.0% |
| Elementary School | 87 | 10.8% |
| Middle School | 183 | 22.7% |
| High School | 489 | 60.8% |
| College / Undergraduate | 22 | 2.7% |
| Graduate / Professional | 24 | 3.0% |
| Total | 805 | 100.0% |
School Enrollment by Age by Funding Source in Ridgecrest
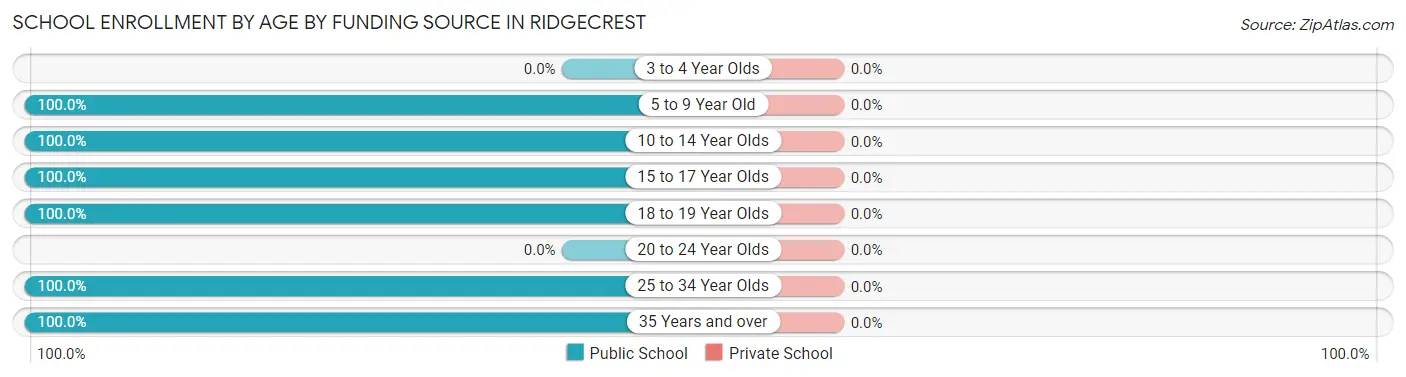
| Age Bracket | Public School | Private School |
| 3 to 4 Year Olds | 0 (0.0%) | 0 (0.0%) |
| 5 to 9 Year Old | 87 (100.0%) | 0 (0.0%) |
| 10 to 14 Year Olds | 207 (100.0%) | 0 (0.0%) |
| 15 to 17 Year Olds | 261 (100.0%) | 0 (0.0%) |
| 18 to 19 Year Olds | 55 (100.0%) | 0 (0.0%) |
| 20 to 24 Year Olds | 0 (0.0%) | 0 (0.0%) |
| 25 to 34 Year Olds | 24 (100.0%) | 0 (0.0%) |
| 35 Years and over | 171 (100.0%) | 0 (0.0%) |
| Total | 805 (100.0%) | 0 (0.0%) |
Educational Attainment by Field of Study in Ridgecrest
Literature & languages (55 | 24.8%), engineering (45 | 20.3%), arts & humanities (30 | 13.5%), business (29 | 13.1%), and psychology (21 | 9.5%) are the most common fields of study among 222 individuals in Ridgecrest who have obtained a bachelor's degree or higher.
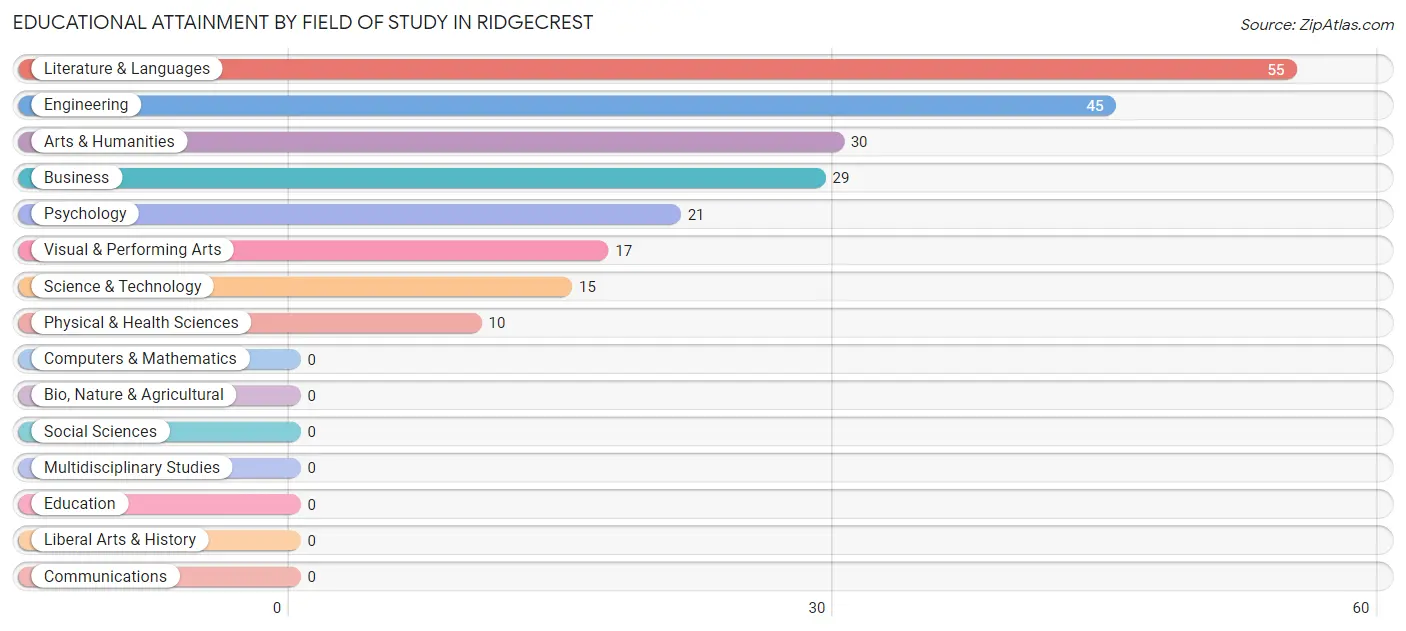
| Field of Study | # Graduates | % Graduates |
| Computers & Mathematics | 0 | 0.0% |
| Bio, Nature & Agricultural | 0 | 0.0% |
| Physical & Health Sciences | 10 | 4.5% |
| Psychology | 21 | 9.5% |
| Social Sciences | 0 | 0.0% |
| Engineering | 45 | 20.3% |
| Multidisciplinary Studies | 0 | 0.0% |
| Science & Technology | 15 | 6.8% |
| Business | 29 | 13.1% |
| Education | 0 | 0.0% |
| Literature & Languages | 55 | 24.8% |
| Liberal Arts & History | 0 | 0.0% |
| Visual & Performing Arts | 17 | 7.7% |
| Communications | 0 | 0.0% |
| Arts & Humanities | 30 | 13.5% |
| Total | 222 | 100.0% |
Transportation & Commute in Ridgecrest
Vehicle Availability by Sex in Ridgecrest
The most prevalent vehicle ownership categories in Ridgecrest are males with 3 vehicles (207, accounting for 41.7%) and females with 3 vehicles (418, making up 22.8%).
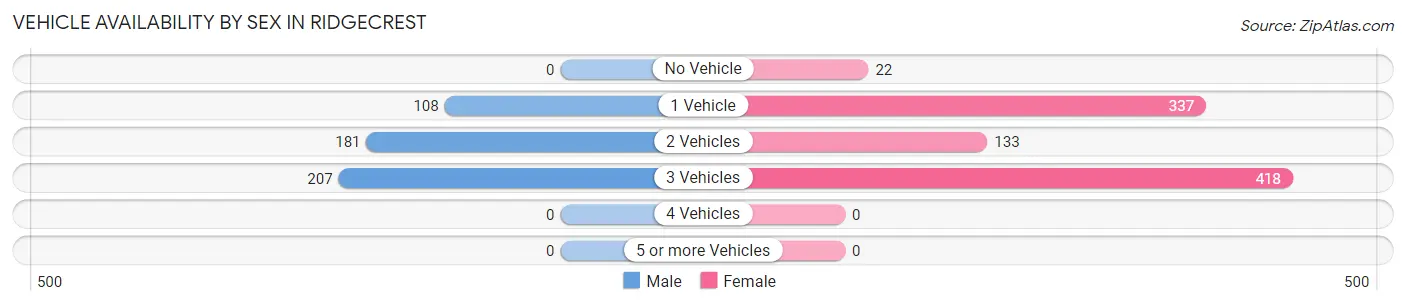
| Vehicles Available | Male | Female |
| No Vehicle | 0 (0.0%) | 22 (2.4%) |
| 1 Vehicle | 108 (21.8%) | 337 (37.0%) |
| 2 Vehicles | 181 (36.5%) | 133 (14.6%) |
| 3 Vehicles | 207 (41.7%) | 418 (45.9%) |
| 4 Vehicles | 0 (0.0%) | 0 (0.0%) |
| 5 or more Vehicles | 0 (0.0%) | 0 (0.0%) |
| Total | 496 (100.0%) | 910 (100.0%) |
Commute Time in Ridgecrest
The most frequently occuring commute durations in Ridgecrest are 20 to 24 minutes (286 commuters, 21.3%), 45 to 59 minutes (218 commuters, 16.2%), and 15 to 19 minutes (164 commuters, 12.2%).
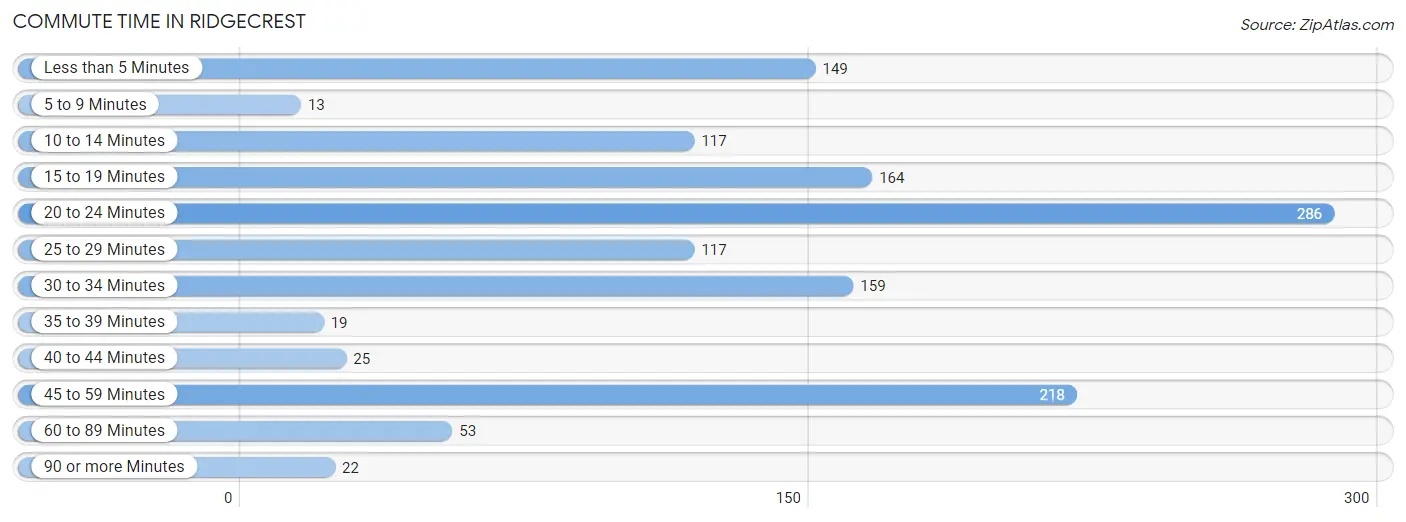
| Commute Time | # Commuters | % Commuters |
| Less than 5 Minutes | 149 | 11.1% |
| 5 to 9 Minutes | 13 | 1.0% |
| 10 to 14 Minutes | 117 | 8.7% |
| 15 to 19 Minutes | 164 | 12.2% |
| 20 to 24 Minutes | 286 | 21.3% |
| 25 to 29 Minutes | 117 | 8.7% |
| 30 to 34 Minutes | 159 | 11.8% |
| 35 to 39 Minutes | 19 | 1.4% |
| 40 to 44 Minutes | 25 | 1.9% |
| 45 to 59 Minutes | 218 | 16.2% |
| 60 to 89 Minutes | 53 | 4.0% |
| 90 or more Minutes | 22 | 1.6% |
Commute Time by Sex in Ridgecrest
The most common commute times in Ridgecrest are 45 to 59 minutes (186 commuters, 40.0%) for males and 20 to 24 minutes (190 commuters, 21.7%) for females.
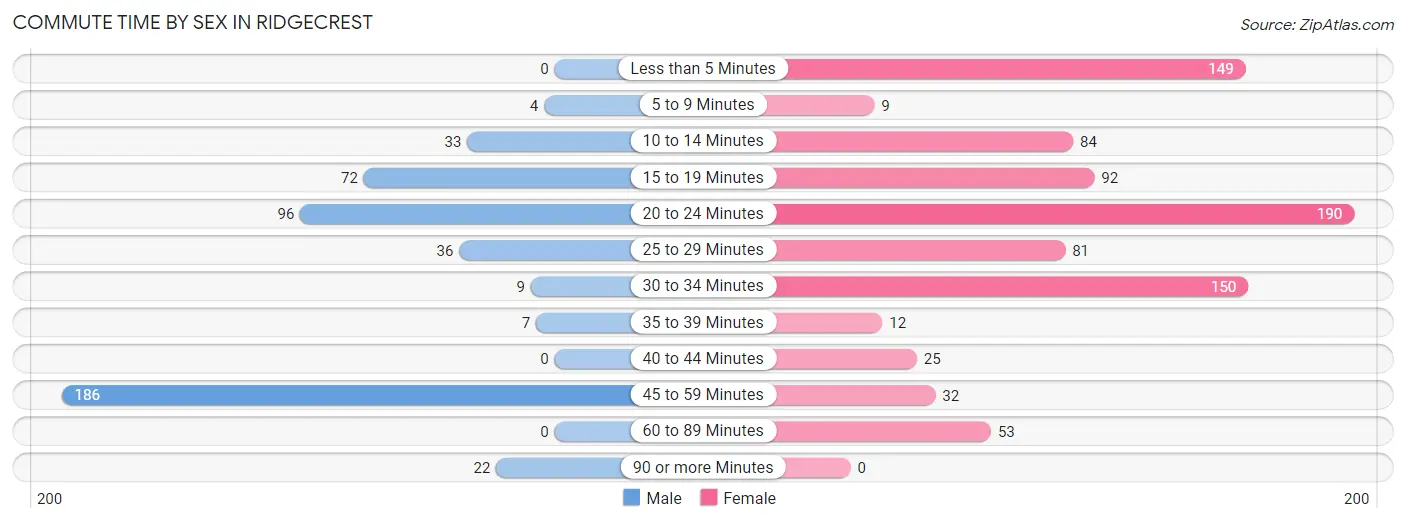
| Commute Time | Male | Female |
| Less than 5 Minutes | 0 (0.0%) | 149 (17.0%) |
| 5 to 9 Minutes | 4 (0.9%) | 9 (1.0%) |
| 10 to 14 Minutes | 33 (7.1%) | 84 (9.6%) |
| 15 to 19 Minutes | 72 (15.5%) | 92 (10.5%) |
| 20 to 24 Minutes | 96 (20.6%) | 190 (21.7%) |
| 25 to 29 Minutes | 36 (7.7%) | 81 (9.2%) |
| 30 to 34 Minutes | 9 (1.9%) | 150 (17.1%) |
| 35 to 39 Minutes | 7 (1.5%) | 12 (1.4%) |
| 40 to 44 Minutes | 0 (0.0%) | 25 (2.9%) |
| 45 to 59 Minutes | 186 (40.0%) | 32 (3.6%) |
| 60 to 89 Minutes | 0 (0.0%) | 53 (6.0%) |
| 90 or more Minutes | 22 (4.7%) | 0 (0.0%) |
Time of Departure to Work by Sex in Ridgecrest
The most frequent times of departure to work in Ridgecrest are 8:00 AM to 8:29 AM (179, 38.5%) for males and 7:00 AM to 7:29 AM (328, 37.4%) for females.
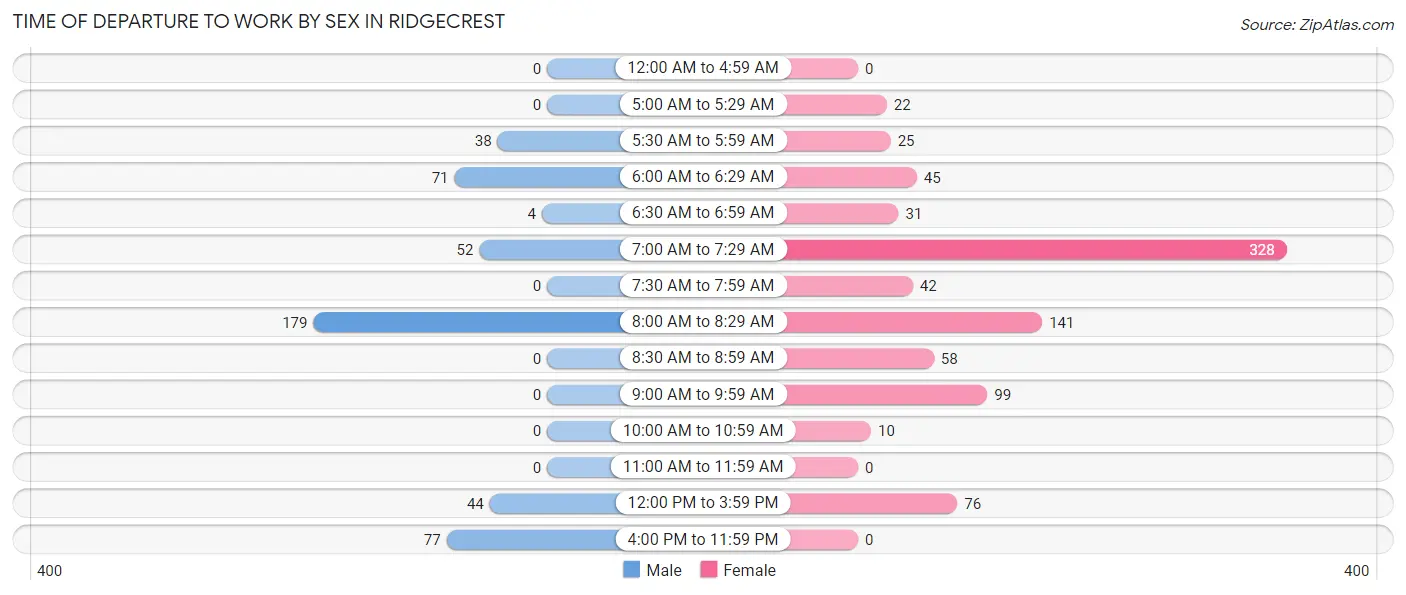
| Time of Departure | Male | Female |
| 12:00 AM to 4:59 AM | 0 (0.0%) | 0 (0.0%) |
| 5:00 AM to 5:29 AM | 0 (0.0%) | 22 (2.5%) |
| 5:30 AM to 5:59 AM | 38 (8.2%) | 25 (2.9%) |
| 6:00 AM to 6:29 AM | 71 (15.3%) | 45 (5.1%) |
| 6:30 AM to 6:59 AM | 4 (0.9%) | 31 (3.5%) |
| 7:00 AM to 7:29 AM | 52 (11.2%) | 328 (37.4%) |
| 7:30 AM to 7:59 AM | 0 (0.0%) | 42 (4.8%) |
| 8:00 AM to 8:29 AM | 179 (38.5%) | 141 (16.1%) |
| 8:30 AM to 8:59 AM | 0 (0.0%) | 58 (6.6%) |
| 9:00 AM to 9:59 AM | 0 (0.0%) | 99 (11.3%) |
| 10:00 AM to 10:59 AM | 0 (0.0%) | 10 (1.1%) |
| 11:00 AM to 11:59 AM | 0 (0.0%) | 0 (0.0%) |
| 12:00 PM to 3:59 PM | 44 (9.5%) | 76 (8.7%) |
| 4:00 PM to 11:59 PM | 77 (16.6%) | 0 (0.0%) |
| Total | 465 (100.0%) | 877 (100.0%) |
Housing Occupancy in Ridgecrest
Occupancy by Ownership in Ridgecrest
Of the total 1,030 dwellings in Ridgecrest, owner-occupied units account for 727 (70.6%), while renter-occupied units make up 303 (29.4%).
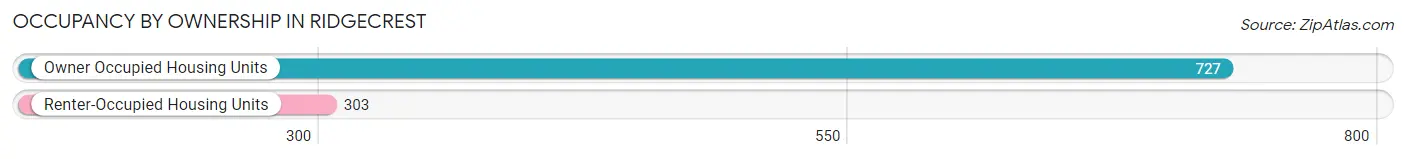
| Occupancy | # Housing Units | % Housing Units |
| Owner Occupied Housing Units | 727 | 70.6% |
| Renter-Occupied Housing Units | 303 | 29.4% |
| Total Occupied Housing Units | 1,030 | 100.0% |
Occupancy by Household Size in Ridgecrest
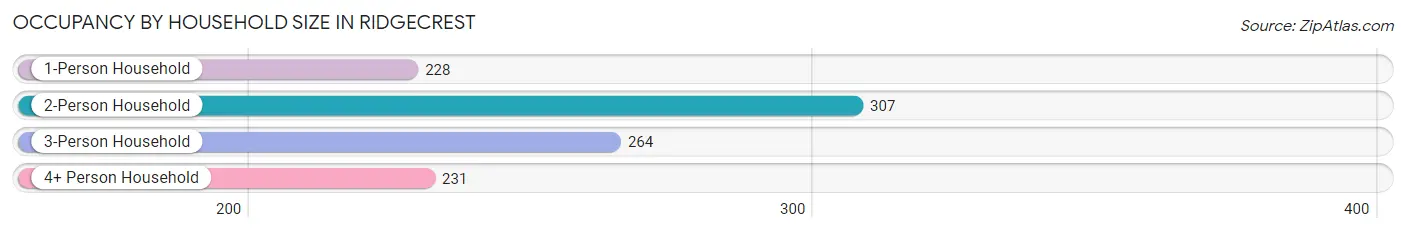
| Household Size | # Housing Units | % Housing Units |
| 1-Person Household | 228 | 22.1% |
| 2-Person Household | 307 | 29.8% |
| 3-Person Household | 264 | 25.6% |
| 4+ Person Household | 231 | 22.4% |
| Total Housing Units | 1,030 | 100.0% |
Occupancy by Ownership by Household Size in Ridgecrest
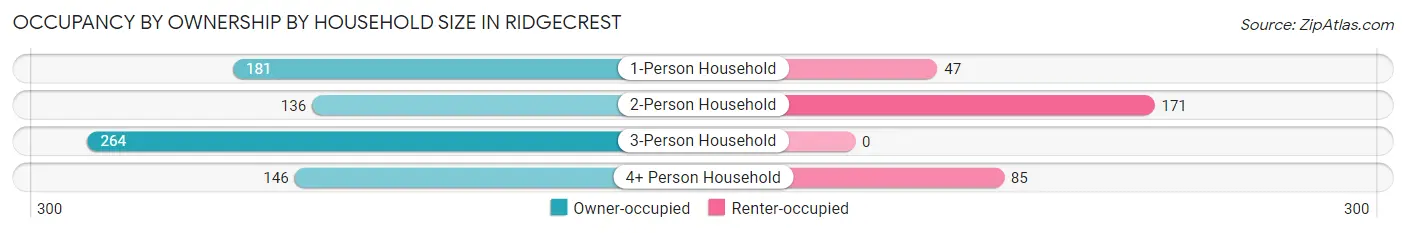
| Household Size | Owner-occupied | Renter-occupied |
| 1-Person Household | 181 (79.4%) | 47 (20.6%) |
| 2-Person Household | 136 (44.3%) | 171 (55.7%) |
| 3-Person Household | 264 (100.0%) | 0 (0.0%) |
| 4+ Person Household | 146 (63.2%) | 85 (36.8%) |
| Total Housing Units | 727 (70.6%) | 303 (29.4%) |
Occupancy by Educational Attainment in Ridgecrest
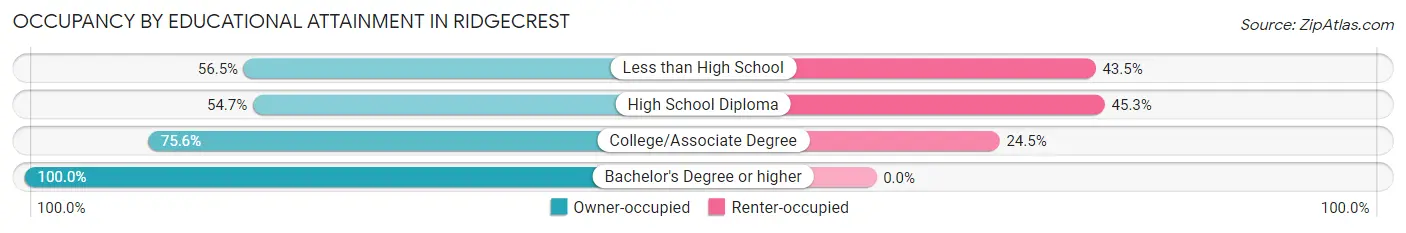
| Household Size | Owner-occupied | Renter-occupied |
| Less than High School | 26 (56.5%) | 20 (43.5%) |
| High School Diploma | 180 (54.7%) | 149 (45.3%) |
| College/Associate Degree | 414 (75.5%) | 134 (24.4%) |
| Bachelor's Degree or higher | 107 (100.0%) | 0 (0.0%) |
Occupancy by Age of Householder in Ridgecrest
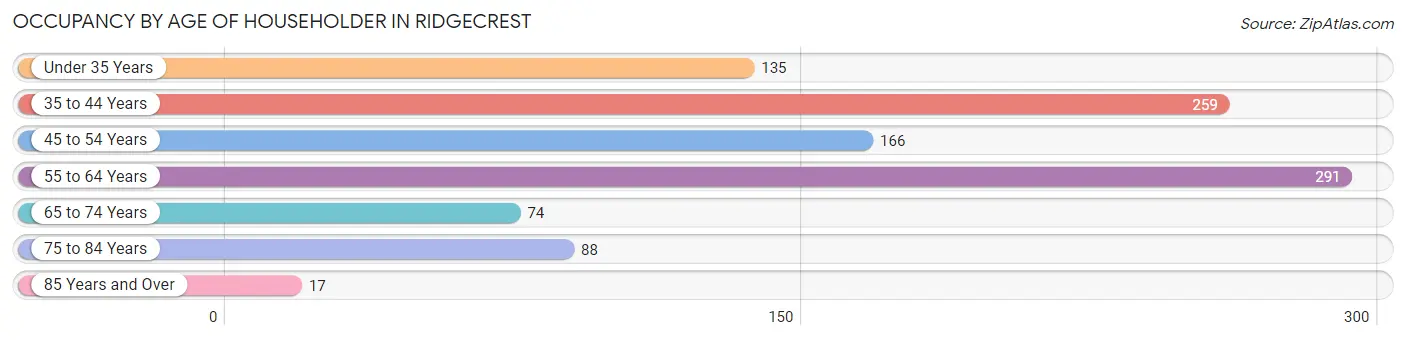
| Age Bracket | # Households | % Households |
| Under 35 Years | 135 | 13.1% |
| 35 to 44 Years | 259 | 25.2% |
| 45 to 54 Years | 166 | 16.1% |
| 55 to 64 Years | 291 | 28.2% |
| 65 to 74 Years | 74 | 7.2% |
| 75 to 84 Years | 88 | 8.5% |
| 85 Years and Over | 17 | 1.7% |
| Total | 1,030 | 100.0% |
Housing Finances in Ridgecrest
Median Income by Occupancy in Ridgecrest
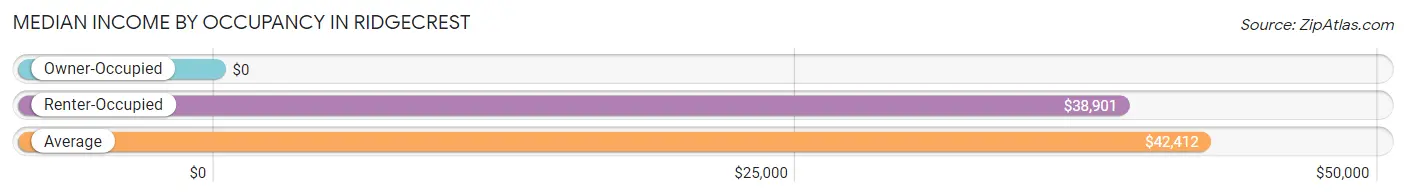
| Occupancy Type | # Households | Median Income |
| Owner-Occupied | 727 (70.6%) | $0 |
| Renter-Occupied | 303 (29.4%) | $38,901 |
| Average | 1,030 (100.0%) | $42,412 |
Occupancy by Householder Income Bracket in Ridgecrest
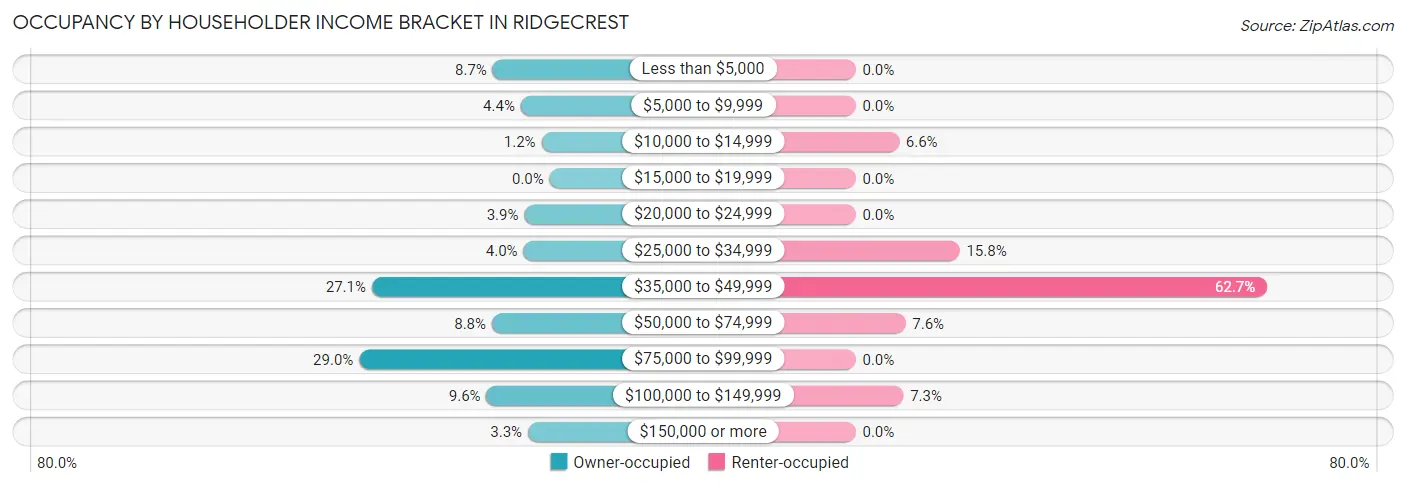
| Income Bracket | Owner-occupied | Renter-occupied |
| Less than $5,000 | 63 (8.7%) | 0 (0.0%) |
| $5,000 to $9,999 | 32 (4.4%) | 0 (0.0%) |
| $10,000 to $14,999 | 9 (1.2%) | 20 (6.6%) |
| $15,000 to $19,999 | 0 (0.0%) | 0 (0.0%) |
| $20,000 to $24,999 | 28 (3.8%) | 0 (0.0%) |
| $25,000 to $34,999 | 29 (4.0%) | 48 (15.8%) |
| $35,000 to $49,999 | 197 (27.1%) | 190 (62.7%) |
| $50,000 to $74,999 | 64 (8.8%) | 23 (7.6%) |
| $75,000 to $99,999 | 211 (29.0%) | 0 (0.0%) |
| $100,000 to $149,999 | 70 (9.6%) | 22 (7.3%) |
| $150,000 or more | 24 (3.3%) | 0 (0.0%) |
| Total | 727 (100.0%) | 303 (100.0%) |
Monthly Housing Cost Tiers in Ridgecrest
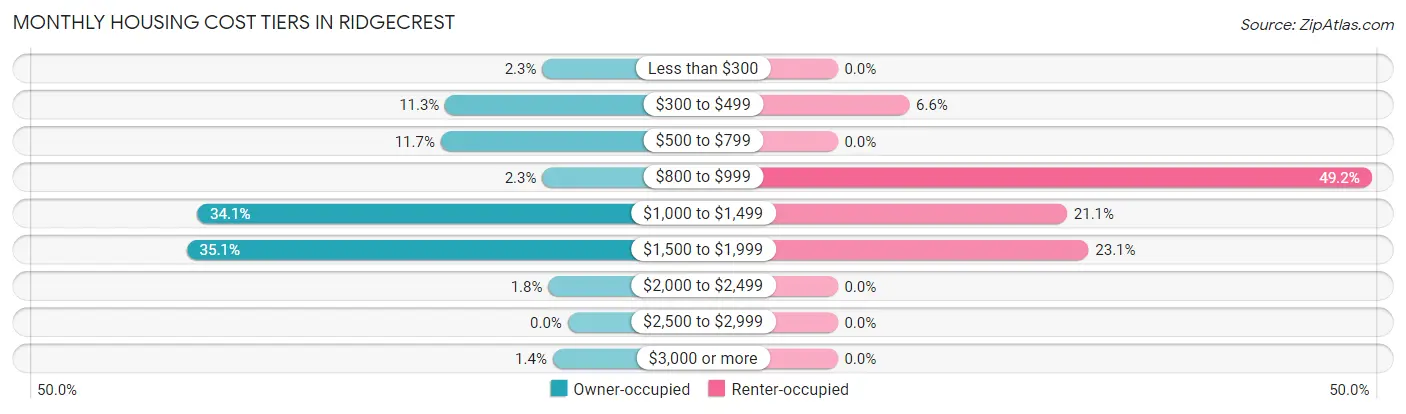
| Monthly Cost | Owner-occupied | Renter-occupied |
| Less than $300 | 17 (2.3%) | 0 (0.0%) |
| $300 to $499 | 82 (11.3%) | 20 (6.6%) |
| $500 to $799 | 85 (11.7%) | 0 (0.0%) |
| $800 to $999 | 17 (2.3%) | 149 (49.2%) |
| $1,000 to $1,499 | 248 (34.1%) | 64 (21.1%) |
| $1,500 to $1,999 | 255 (35.1%) | 70 (23.1%) |
| $2,000 to $2,499 | 13 (1.8%) | 0 (0.0%) |
| $2,500 to $2,999 | 0 (0.0%) | 0 (0.0%) |
| $3,000 or more | 10 (1.4%) | 0 (0.0%) |
| Total | 727 (100.0%) | 303 (100.0%) |
Physical Housing Characteristics in Ridgecrest
Housing Structures in Ridgecrest
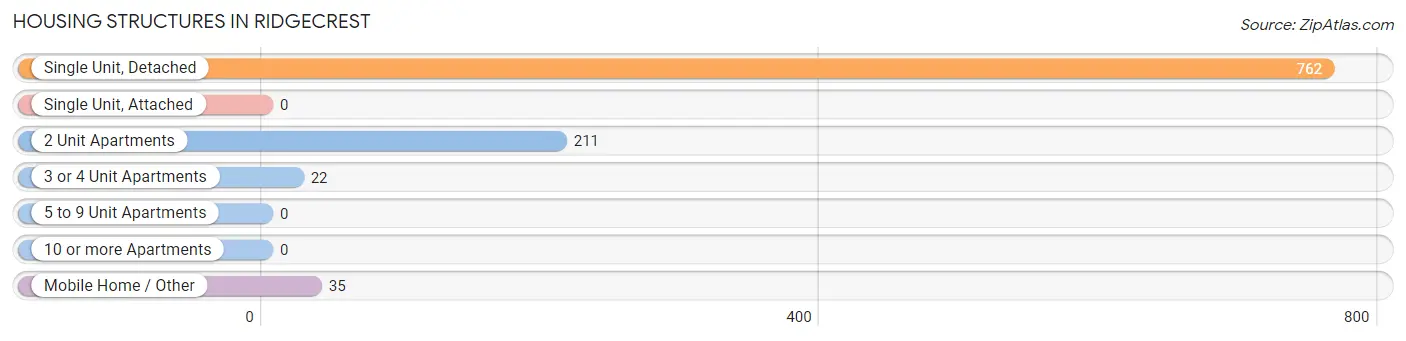
| Structure Type | # Housing Units | % Housing Units |
| Single Unit, Detached | 762 | 74.0% |
| Single Unit, Attached | 0 | 0.0% |
| 2 Unit Apartments | 211 | 20.5% |
| 3 or 4 Unit Apartments | 22 | 2.1% |
| 5 to 9 Unit Apartments | 0 | 0.0% |
| 10 or more Apartments | 0 | 0.0% |
| Mobile Home / Other | 35 | 3.4% |
| Total | 1,030 | 100.0% |
Housing Structures by Occupancy in Ridgecrest
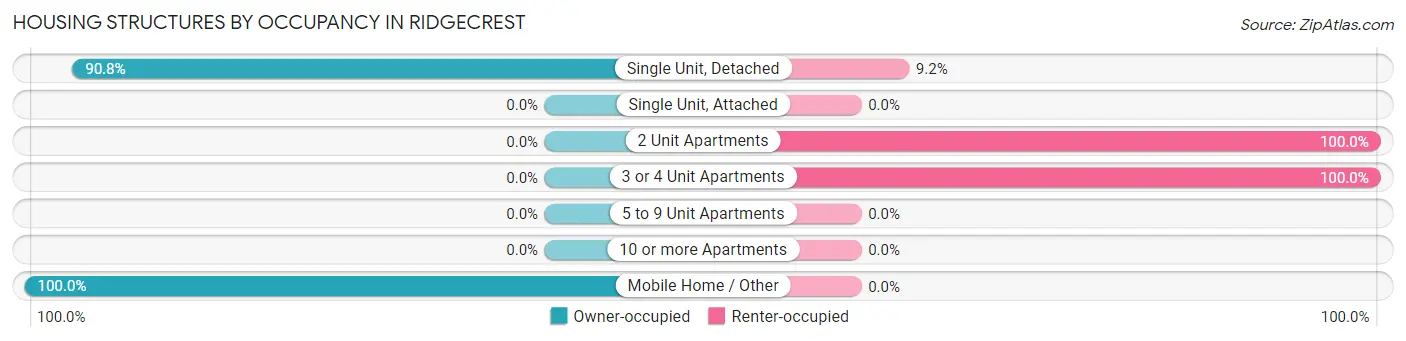
| Structure Type | Owner-occupied | Renter-occupied |
| Single Unit, Detached | 692 (90.8%) | 70 (9.2%) |
| Single Unit, Attached | 0 (0.0%) | 0 (0.0%) |
| 2 Unit Apartments | 0 (0.0%) | 211 (100.0%) |
| 3 or 4 Unit Apartments | 0 (0.0%) | 22 (100.0%) |
| 5 to 9 Unit Apartments | 0 (0.0%) | 0 (0.0%) |
| 10 or more Apartments | 0 (0.0%) | 0 (0.0%) |
| Mobile Home / Other | 35 (100.0%) | 0 (0.0%) |
| Total | 727 (70.6%) | 303 (29.4%) |
Housing Structures by Number of Rooms in Ridgecrest
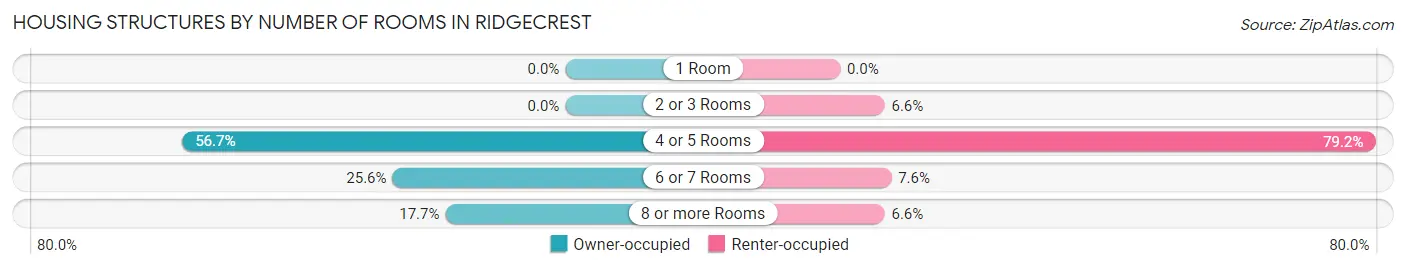
| Number of Rooms | Owner-occupied | Renter-occupied |
| 1 Room | 0 (0.0%) | 0 (0.0%) |
| 2 or 3 Rooms | 0 (0.0%) | 20 (6.6%) |
| 4 or 5 Rooms | 412 (56.7%) | 240 (79.2%) |
| 6 or 7 Rooms | 186 (25.6%) | 23 (7.6%) |
| 8 or more Rooms | 129 (17.7%) | 20 (6.6%) |
| Total | 727 (100.0%) | 303 (100.0%) |
Housing Structure by Heating Type in Ridgecrest
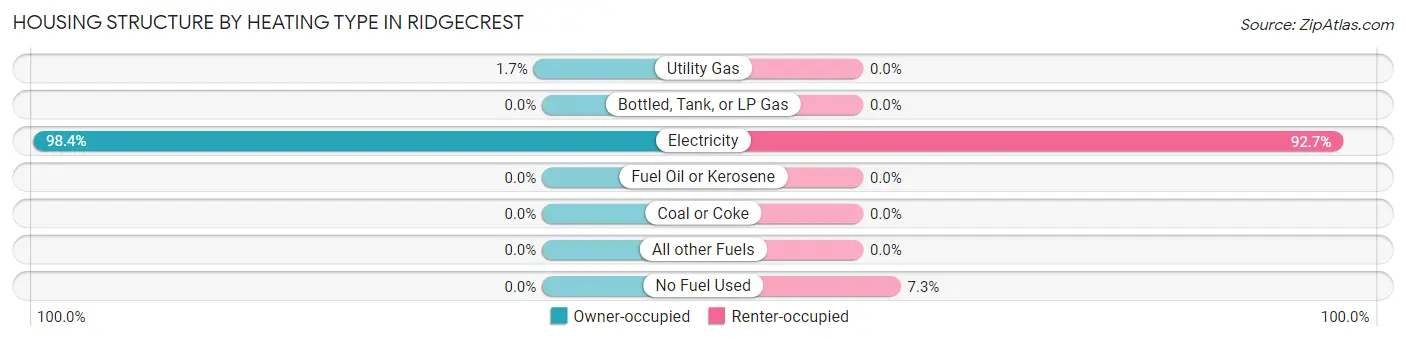
| Heating Type | Owner-occupied | Renter-occupied |
| Utility Gas | 12 (1.7%) | 0 (0.0%) |
| Bottled, Tank, or LP Gas | 0 (0.0%) | 0 (0.0%) |
| Electricity | 715 (98.4%) | 281 (92.7%) |
| Fuel Oil or Kerosene | 0 (0.0%) | 0 (0.0%) |
| Coal or Coke | 0 (0.0%) | 0 (0.0%) |
| All other Fuels | 0 (0.0%) | 0 (0.0%) |
| No Fuel Used | 0 (0.0%) | 22 (7.3%) |
| Total | 727 (100.0%) | 303 (100.0%) |
Household Vehicle Usage in Ridgecrest
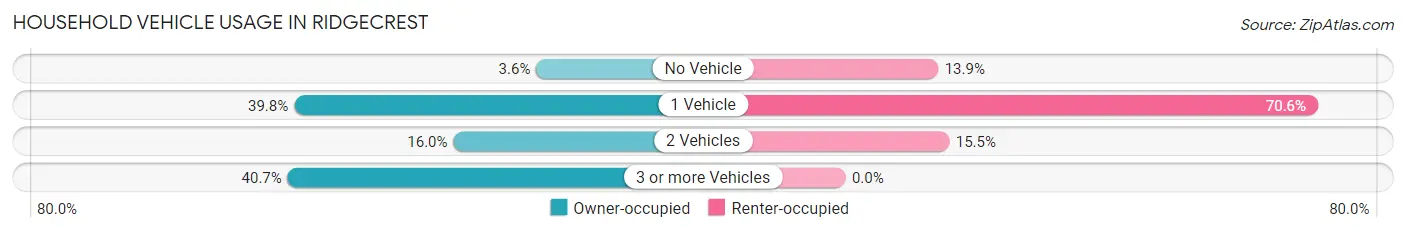
| Vehicles per Household | Owner-occupied | Renter-occupied |
| No Vehicle | 26 (3.6%) | 42 (13.9%) |
| 1 Vehicle | 289 (39.8%) | 214 (70.6%) |
| 2 Vehicles | 116 (16.0%) | 47 (15.5%) |
| 3 or more Vehicles | 296 (40.7%) | 0 (0.0%) |
| Total | 727 (100.0%) | 303 (100.0%) |
Real Estate & Mortgages in Ridgecrest
Real Estate and Mortgage Overview in Ridgecrest
| Characteristic | Without Mortgage | With Mortgage |
| Housing Units | 184 | 543 |
| Median Property Value | $229,800 | $310,500 |
| Median Household Income | - | - |
| Monthly Housing Costs | $480 | $10 |
| Real Estate Taxes | $976 | $0 |
Property Value by Mortgage Status in Ridgecrest
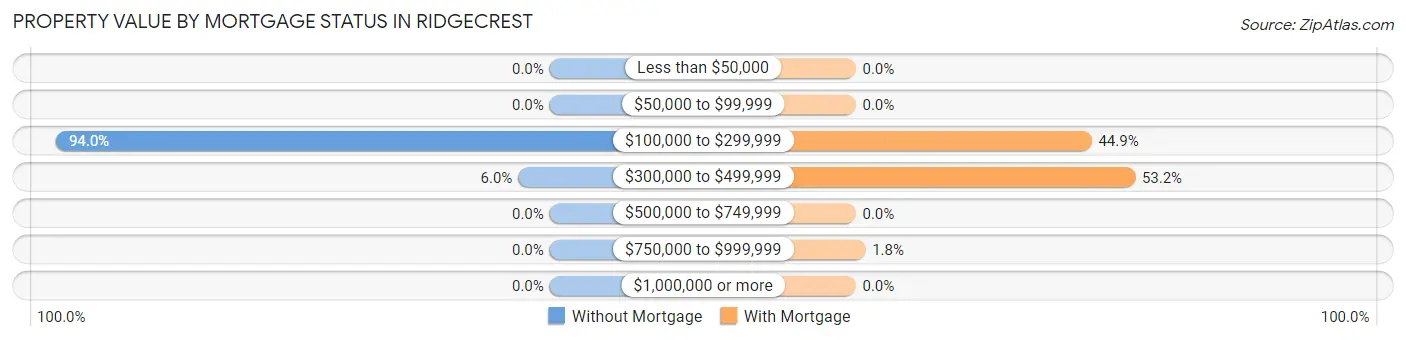
| Property Value | Without Mortgage | With Mortgage |
| Less than $50,000 | 0 (0.0%) | 0 (0.0%) |
| $50,000 to $99,999 | 0 (0.0%) | 0 (0.0%) |
| $100,000 to $299,999 | 173 (94.0%) | 244 (44.9%) |
| $300,000 to $499,999 | 11 (6.0%) | 289 (53.2%) |
| $500,000 to $749,999 | 0 (0.0%) | 0 (0.0%) |
| $750,000 to $999,999 | 0 (0.0%) | 10 (1.8%) |
| $1,000,000 or more | 0 (0.0%) | 0 (0.0%) |
| Total | 184 (100.0%) | 543 (100.0%) |
Household Income by Mortgage Status in Ridgecrest
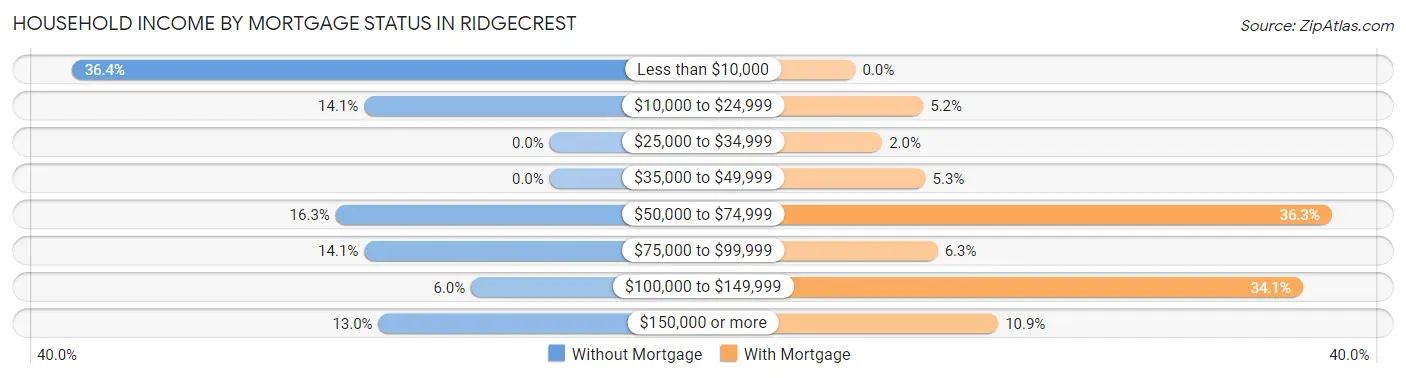
| Household Income | Without Mortgage | With Mortgage |
| Less than $10,000 | 67 (36.4%) | 0 (0.0%) |
| $10,000 to $24,999 | 26 (14.1%) | 28 (5.2%) |
| $25,000 to $34,999 | 0 (0.0%) | 11 (2.0%) |
| $35,000 to $49,999 | 0 (0.0%) | 29 (5.3%) |
| $50,000 to $74,999 | 30 (16.3%) | 197 (36.3%) |
| $75,000 to $99,999 | 26 (14.1%) | 34 (6.3%) |
| $100,000 to $149,999 | 11 (6.0%) | 185 (34.1%) |
| $150,000 or more | 24 (13.0%) | 59 (10.9%) |
| Total | 184 (100.0%) | 543 (100.0%) |
Property Value to Household Income Ratio in Ridgecrest
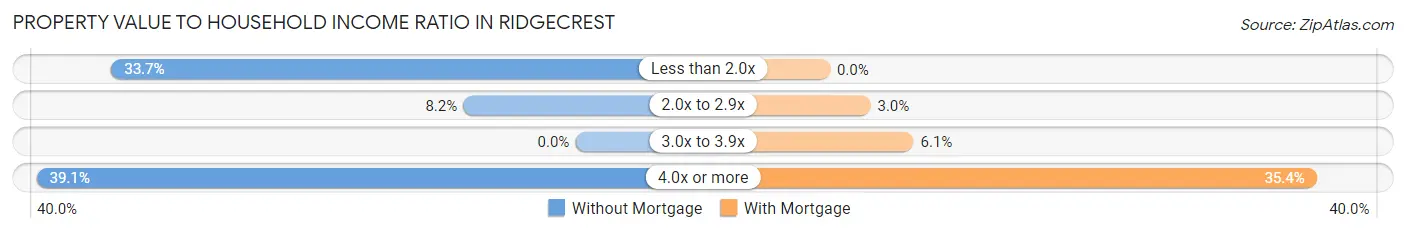
| Value-to-Income Ratio | Without Mortgage | With Mortgage |
| Less than 2.0x | 62 (33.7%) | 0 (0.0%) |
| 2.0x to 2.9x | 15 (8.2%) | 16 (2.9%) |
| 3.0x to 3.9x | 0 (0.0%) | 33 (6.1%) |
| 4.0x or more | 72 (39.1%) | 192 (35.4%) |
| Total | 184 (100.0%) | 543 (100.0%) |
Real Estate Taxes by Mortgage Status in Ridgecrest
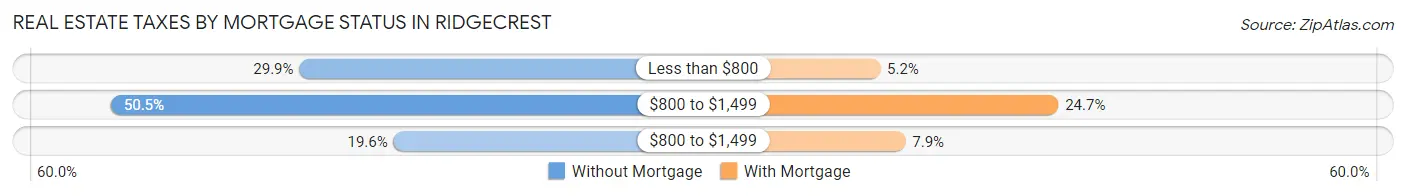
| Property Taxes | Without Mortgage | With Mortgage |
| Less than $800 | 55 (29.9%) | 28 (5.2%) |
| $800 to $1,499 | 93 (50.5%) | 134 (24.7%) |
| $800 to $1,499 | 36 (19.6%) | 43 (7.9%) |
| Total | 184 (100.0%) | 543 (100.0%) |
Health & Disability in Ridgecrest
Health Insurance Coverage by Age in Ridgecrest
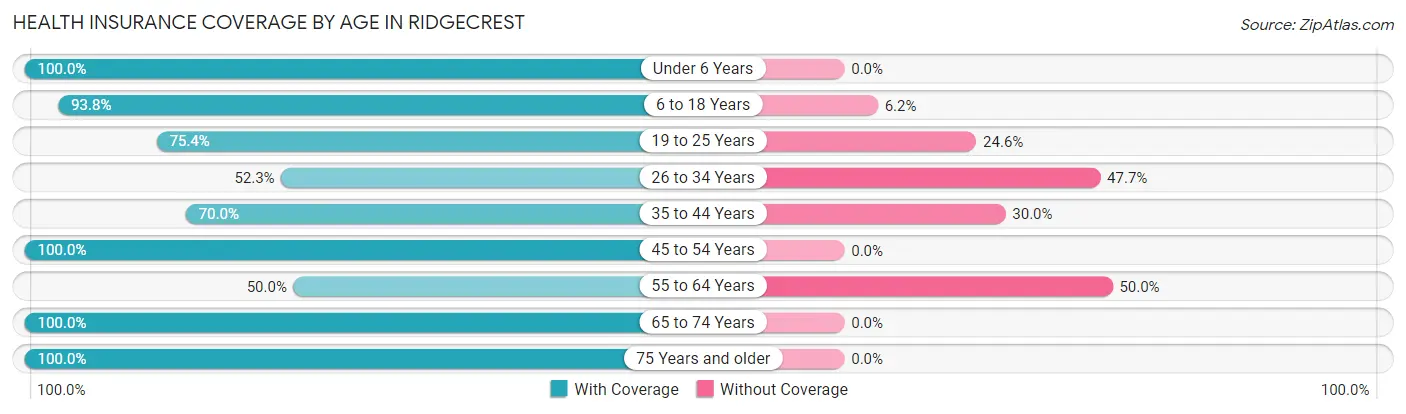
| Age Bracket | With Coverage | Without Coverage |
| Under 6 Years | 205 (100.0%) | 0 (0.0%) |
| 6 to 18 Years | 572 (93.8%) | 38 (6.2%) |
| 19 to 25 Years | 138 (75.4%) | 45 (24.6%) |
| 26 to 34 Years | 183 (52.3%) | 167 (47.7%) |
| 35 to 44 Years | 347 (70.0%) | 149 (30.0%) |
| 45 to 54 Years | 244 (100.0%) | 0 (0.0%) |
| 55 to 64 Years | 176 (50.0%) | 176 (50.0%) |
| 65 to 74 Years | 462 (100.0%) | 0 (0.0%) |
| 75 Years and older | 118 (100.0%) | 0 (0.0%) |
| Total | 2,445 (81.0%) | 575 (19.0%) |
Health Insurance Coverage by Citizenship Status in Ridgecrest
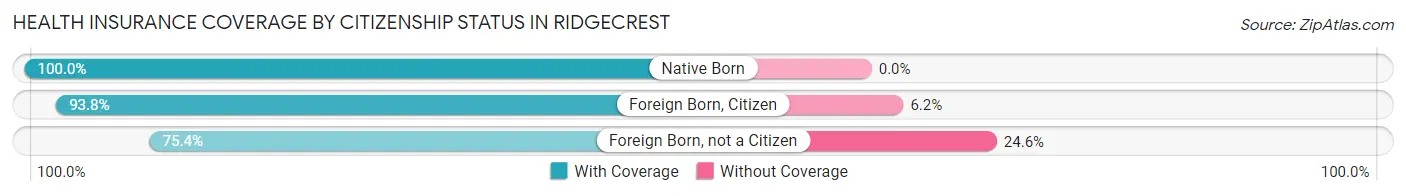
| Citizenship Status | With Coverage | Without Coverage |
| Native Born | 205 (100.0%) | 0 (0.0%) |
| Foreign Born, Citizen | 572 (93.8%) | 38 (6.2%) |
| Foreign Born, not a Citizen | 138 (75.4%) | 45 (24.6%) |
Health Insurance Coverage by Household Income in Ridgecrest
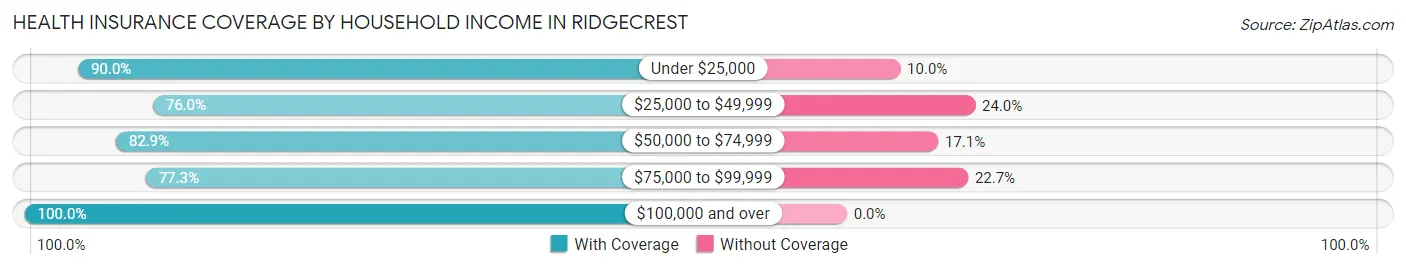
| Household Income | With Coverage | Without Coverage |
| Under $25,000 | 189 (90.0%) | 21 (10.0%) |
| $25,000 to $49,999 | 1,066 (76.0%) | 337 (24.0%) |
| $50,000 to $74,999 | 286 (82.9%) | 59 (17.1%) |
| $75,000 to $99,999 | 538 (77.3%) | 158 (22.7%) |
| $100,000 and over | 366 (100.0%) | 0 (0.0%) |
Public vs Private Health Insurance Coverage by Age in Ridgecrest
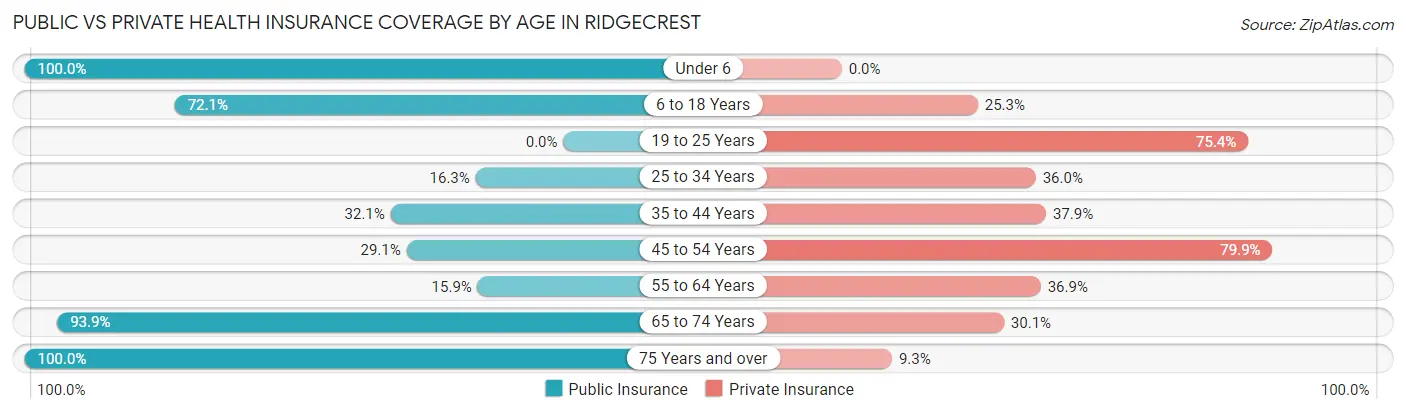
| Age Bracket | Public Insurance | Private Insurance |
| Under 6 | 205 (100.0%) | 0 (0.0%) |
| 6 to 18 Years | 440 (72.1%) | 154 (25.3%) |
| 19 to 25 Years | 0 (0.0%) | 138 (75.4%) |
| 25 to 34 Years | 57 (16.3%) | 126 (36.0%) |
| 35 to 44 Years | 159 (32.1%) | 188 (37.9%) |
| 45 to 54 Years | 71 (29.1%) | 195 (79.9%) |
| 55 to 64 Years | 56 (15.9%) | 130 (36.9%) |
| 65 to 74 Years | 434 (93.9%) | 139 (30.1%) |
| 75 Years and over | 118 (100.0%) | 11 (9.3%) |
| Total | 1,540 (51.0%) | 1,081 (35.8%) |
Disability Status by Sex by Age in Ridgecrest
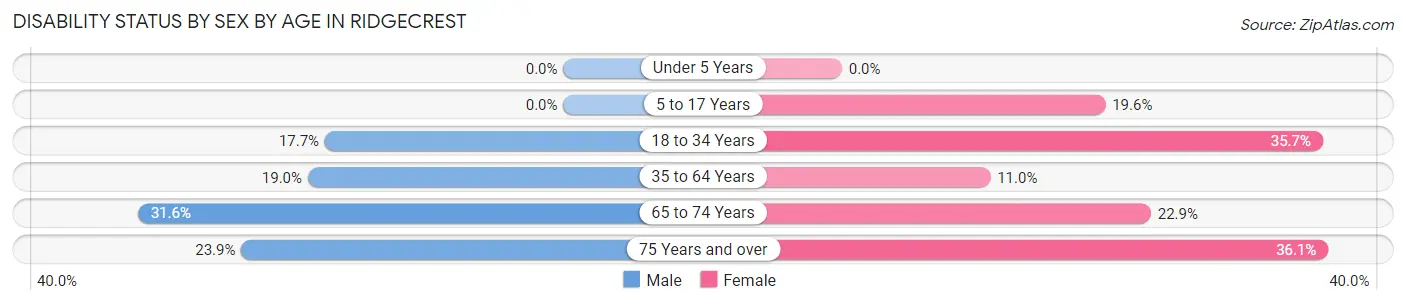
| Age Bracket | Male | Female |
| Under 5 Years | 0 (0.0%) | 0 (0.0%) |
| 5 to 17 Years | 0 (0.0%) | 44 (19.6%) |
| 18 to 34 Years | 57 (17.7%) | 95 (35.7%) |
| 35 to 64 Years | 66 (19.0%) | 82 (11.0%) |
| 65 to 74 Years | 73 (31.6%) | 53 (22.9%) |
| 75 Years and over | 11 (23.9%) | 26 (36.1%) |
Disability Class by Sex by Age in Ridgecrest
Disability Class: Hearing Difficulty
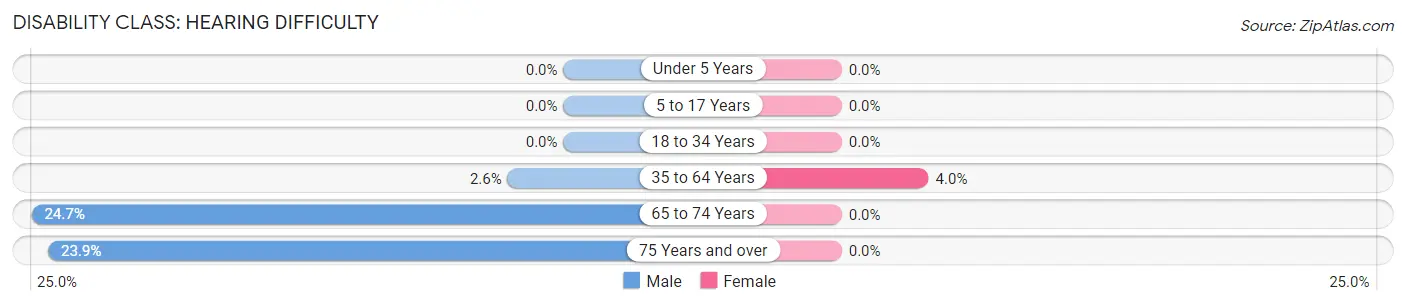
| Age Bracket | Male | Female |
| Under 5 Years | 0 (0.0%) | 0 (0.0%) |
| 5 to 17 Years | 0 (0.0%) | 0 (0.0%) |
| 18 to 34 Years | 0 (0.0%) | 0 (0.0%) |
| 35 to 64 Years | 9 (2.6%) | 30 (4.0%) |
| 65 to 74 Years | 57 (24.7%) | 0 (0.0%) |
| 75 Years and over | 11 (23.9%) | 0 (0.0%) |
Disability Class: Vision Difficulty
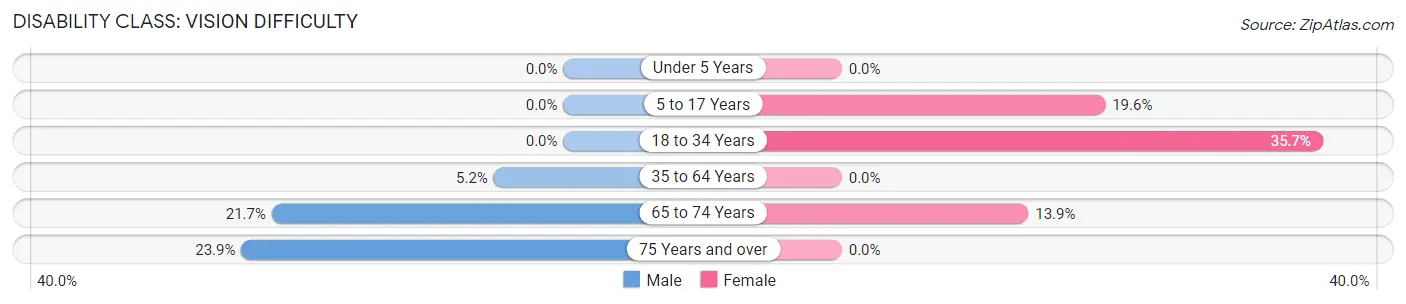
| Age Bracket | Male | Female |
| Under 5 Years | 0 (0.0%) | 0 (0.0%) |
| 5 to 17 Years | 0 (0.0%) | 44 (19.6%) |
| 18 to 34 Years | 0 (0.0%) | 95 (35.7%) |
| 35 to 64 Years | 18 (5.2%) | 0 (0.0%) |
| 65 to 74 Years | 50 (21.6%) | 32 (13.9%) |
| 75 Years and over | 11 (23.9%) | 0 (0.0%) |
Disability Class: Cognitive Difficulty
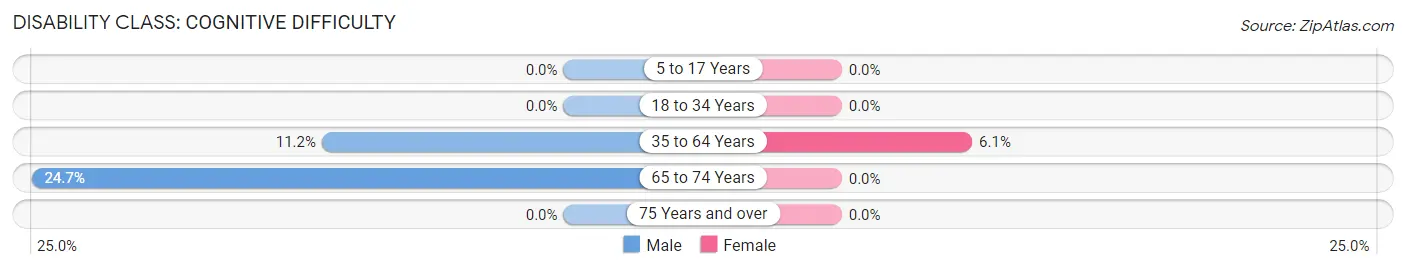
| Age Bracket | Male | Female |
| 5 to 17 Years | 0 (0.0%) | 0 (0.0%) |
| 18 to 34 Years | 0 (0.0%) | 0 (0.0%) |
| 35 to 64 Years | 39 (11.2%) | 45 (6.0%) |
| 65 to 74 Years | 57 (24.7%) | 0 (0.0%) |
| 75 Years and over | 0 (0.0%) | 0 (0.0%) |
Disability Class: Ambulatory Difficulty
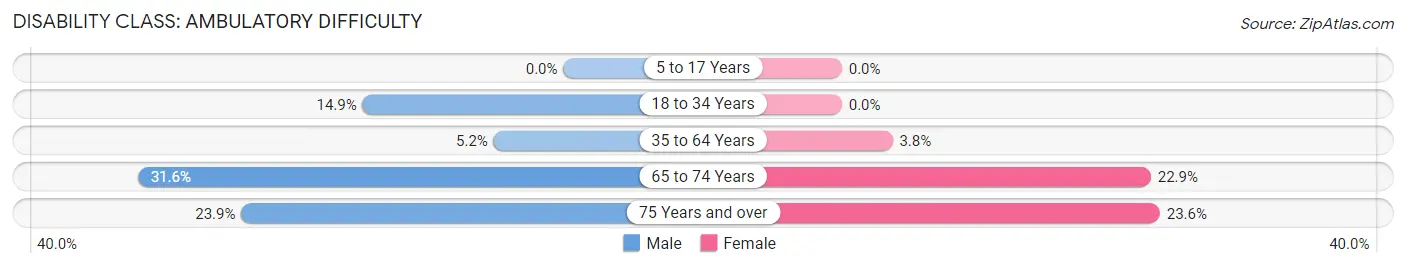
| Age Bracket | Male | Female |
| 5 to 17 Years | 0 (0.0%) | 0 (0.0%) |
| 18 to 34 Years | 48 (14.9%) | 0 (0.0%) |
| 35 to 64 Years | 18 (5.2%) | 28 (3.8%) |
| 65 to 74 Years | 73 (31.6%) | 53 (22.9%) |
| 75 Years and over | 11 (23.9%) | 17 (23.6%) |
Disability Class: Self-Care Difficulty
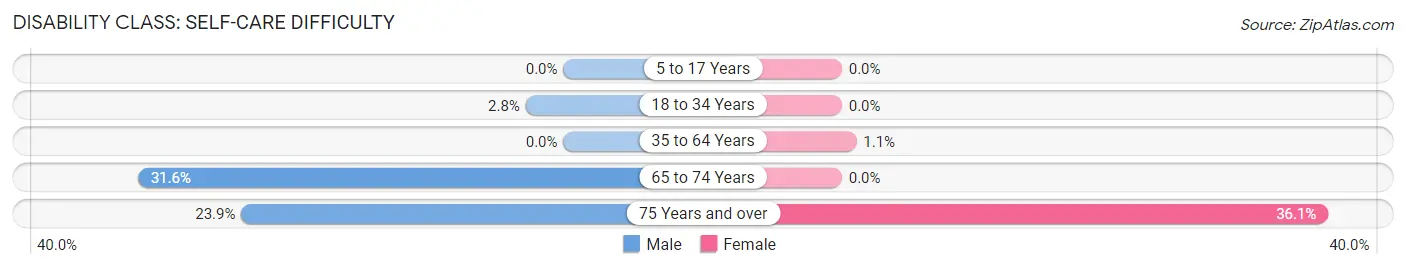
| Age Bracket | Male | Female |
| 5 to 17 Years | 0 (0.0%) | 0 (0.0%) |
| 18 to 34 Years | 9 (2.8%) | 0 (0.0%) |
| 35 to 64 Years | 0 (0.0%) | 8 (1.1%) |
| 65 to 74 Years | 73 (31.6%) | 0 (0.0%) |
| 75 Years and over | 11 (23.9%) | 26 (36.1%) |
Technology Access in Ridgecrest
Computing Device Access in Ridgecrest
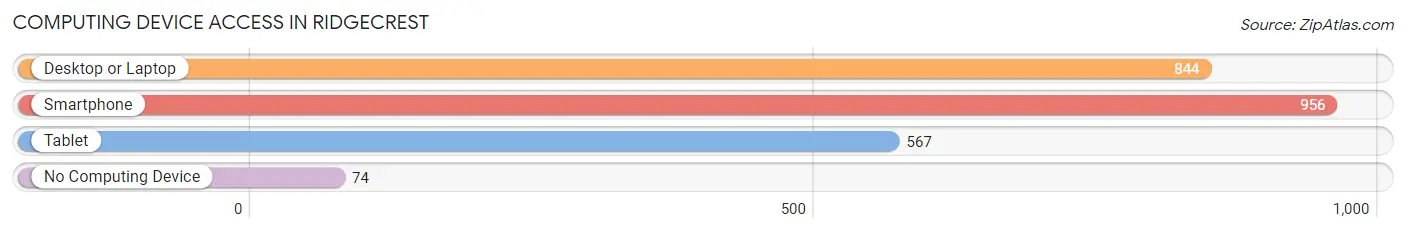
| Device Type | # Households | % Households |
| Desktop or Laptop | 844 | 81.9% |
| Smartphone | 956 | 92.8% |
| Tablet | 567 | 55.0% |
| No Computing Device | 74 | 7.2% |
| Total | 1,030 | 100.0% |
Internet Access in Ridgecrest
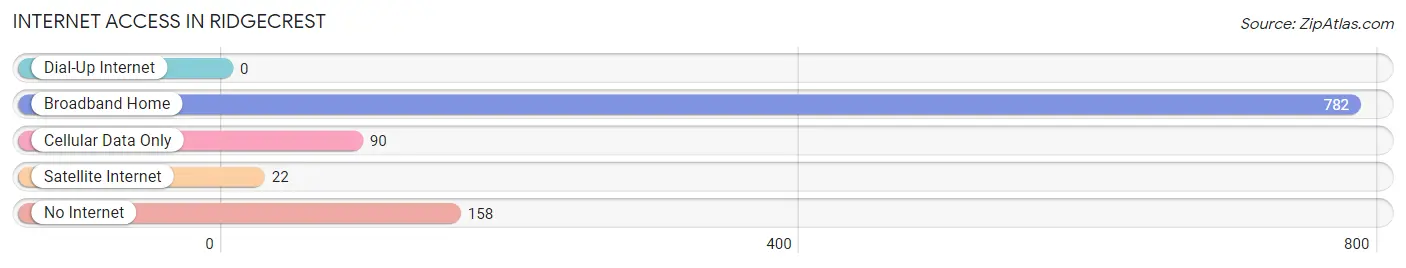
| Internet Type | # Households | % Households |
| Dial-Up Internet | 0 | 0.0% |
| Broadband Home | 782 | 75.9% |
| Cellular Data Only | 90 | 8.7% |
| Satellite Internet | 22 | 2.1% |
| No Internet | 158 | 15.3% |
| Total | 1,030 | 100.0% |
Ridgecrest Summary
Ridgecrest is a small unincorporated community located in Santa Rosa County, Florida. It is situated on the western edge of the county, just south of the city of Milton. The community is bordered by the Blackwater River to the east and the Escambia River to the west. The population of Ridgecrest was estimated to be 1,845 in 2019.
History
Ridgecrest was first settled in the early 1800s by settlers from the nearby city of Milton. The community was originally known as "Ridgecrest Plantation" and was home to a large cotton plantation. The plantation was owned by the prominent local family of William and Mary Ann Miller. The Millers were among the first settlers in the area and were instrumental in the development of the community.
In the late 1800s, the community began to grow and develop. The first post office was established in 1887 and the first school was built in 1889. The community was officially incorporated in 1895 and the first mayor was elected in 1896.
Geography
Ridgecrest is located in Santa Rosa County, Florida. It is situated on the western edge of the county, just south of the city of Milton. The community is bordered by the Blackwater River to the east and the Escambia River to the west. The terrain is mostly flat with some rolling hills. The climate is humid subtropical with hot summers and mild winters.
Economy
Ridgecrest is primarily a residential community with a few small businesses. The main industries in the area are agriculture, forestry, and tourism. The community is home to several farms and ranches that produce a variety of crops, including cotton, corn, soybeans, and peanuts. The area is also home to several timber companies that harvest timber from the nearby forests.
Tourism is an important part of the local economy. The community is home to several popular attractions, including the Blackwater River State Park, the Escambia River State Park, and the Santa Rosa County Fairgrounds. The area is also home to several popular restaurants and shops.
Demographics
Ridgecrest is a predominantly white community with a population of 1,845 in 2019. The median household income is $45,000 and the median home value is $150,000. The unemployment rate is 4.2%. The majority of the population is Christian, with a small percentage of other religions. The community is served by the Santa Rosa County School District.
Common Questions
What is Per Capita Income in Ridgecrest?
Per Capita income in Ridgecrest is $20,642.
What is the Median Household income in Ridgecrest?
Median Household Income in Ridgecrest is $42,412.
What is Income or Wage Gap in Ridgecrest?
Income or Wage Gap in Ridgecrest is 19.6%.
Women in Ridgecrest earn 80.4 cents for every dollar earned by a man.
What is Inequality or Gini Index in Ridgecrest?
Inequality or Gini Index in Ridgecrest is 0.36.
What is the Total Population of Ridgecrest?
Total Population of Ridgecrest is 3,020.
What is the Total Male Population of Ridgecrest?
Total Male Population of Ridgecrest is 1,457.
What is the Total Female Population of Ridgecrest?
Total Female Population of Ridgecrest is 1,563.
What is the Ratio of Males per 100 Females in Ridgecrest?
There are 93.22 Males per 100 Females in Ridgecrest.
What is the Ratio of Females per 100 Males in Ridgecrest?
There are 107.28 Females per 100 Males in Ridgecrest.
What is the Median Population Age in Ridgecrest?
Median Population Age in Ridgecrest is 35.9 Years.
What is the Average Family Size in Ridgecrest
Average Family Size in Ridgecrest is 3.3 People.
What is the Average Household Size in Ridgecrest
Average Household Size in Ridgecrest is 2.9 People.
How Large is the Labor Force in Ridgecrest?
There are 1,571 People in the Labor Forcein in Ridgecrest.
What is the Percentage of People in the Labor Force in Ridgecrest?
63.9% of People are in the Labor Force in Ridgecrest.
What is the Unemployment Rate in Ridgecrest?
Unemployment Rate in Ridgecrest is 10.6%.