Scotch-Irish vs Immigrants from Morocco Disability Age 5 to 17
COMPARE
Scotch-Irish
Immigrants from Morocco
Disability Age 5 to 17
Disability Age 5 to 17 Comparison
Scotch-Irish
Immigrants from Morocco
6.3%
DISABILITY AGE 5 TO 17
0.0/ 100
METRIC RATING
308th/ 347
METRIC RANK
5.8%
DISABILITY AGE 5 TO 17
8.3/ 100
METRIC RATING
214th/ 347
METRIC RANK
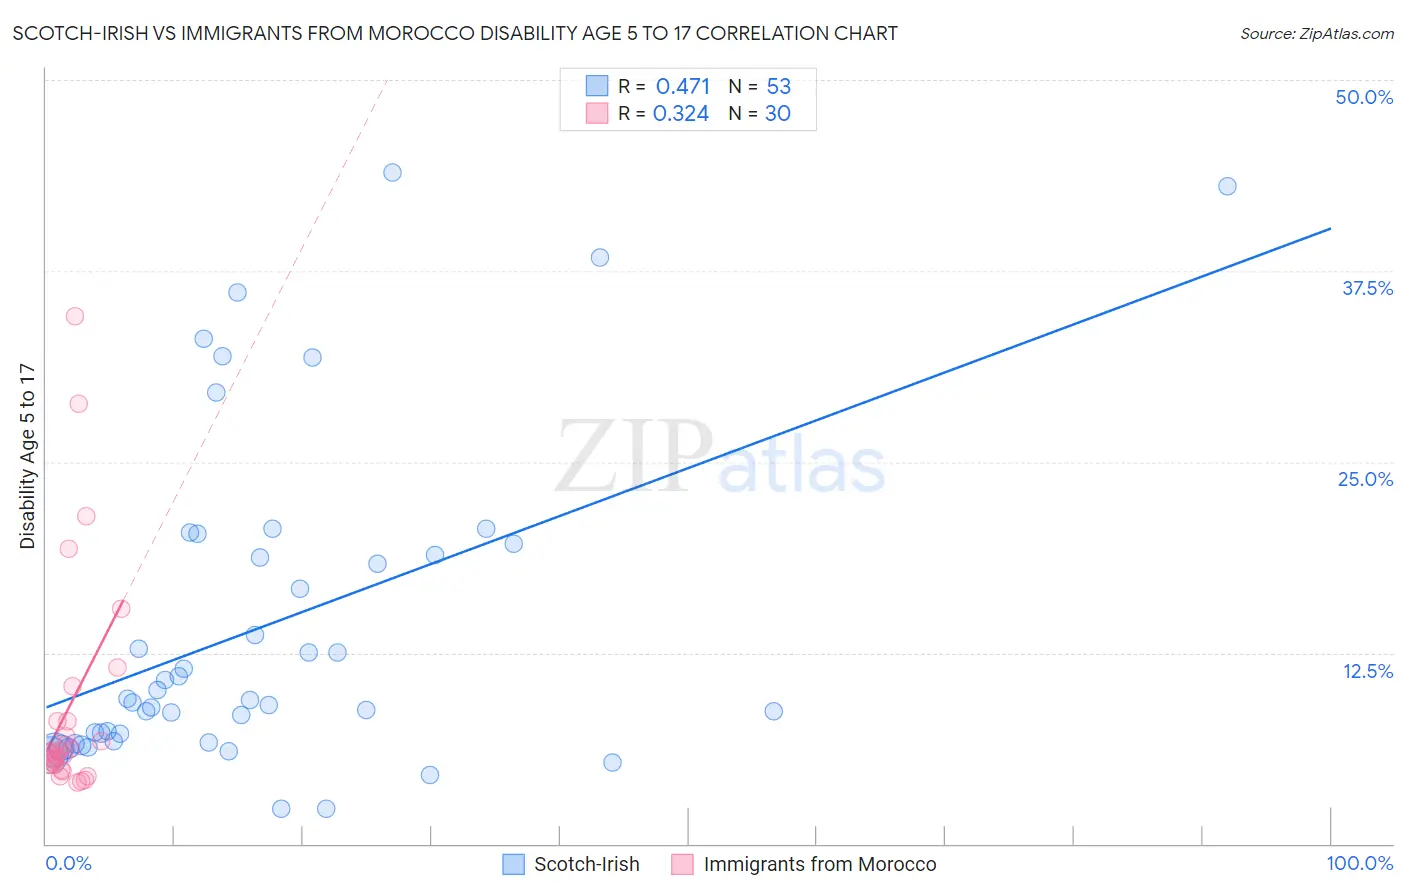
Scotch-Irish vs Immigrants from Morocco Disability Age 5 to 17 Correlation Chart
The statistical analysis conducted on geographies consisting of 537,256,381 people shows a moderate positive correlation between the proportion of Scotch-Irish and percentage of population with a disability between the ages 5 and 17 in the United States with a correlation coefficient (R) of 0.471 and weighted average of 6.3%. Similarly, the statistical analysis conducted on geographies consisting of 178,475,877 people shows a mild positive correlation between the proportion of Immigrants from Morocco and percentage of population with a disability between the ages 5 and 17 in the United States with a correlation coefficient (R) of 0.324 and weighted average of 5.8%, a difference of 9.9%.
Disability Age 5 to 17 Correlation Summary
| Measurement | Scotch-Irish | Immigrants from Morocco |
| Minimum | 2.3% | 4.0% |
| Maximum | 43.9% | 34.6% |
| Range | 41.6% | 30.6% |
| Mean | 14.2% | 9.0% |
| Median | 9.4% | 6.0% |
| Interquartile 25% (IQ1) | 6.7% | 5.2% |
| Interquartile 75% (IQ3) | 19.3% | 8.0% |
| Interquartile Range (IQR) | 12.6% | 2.9% |
| Standard Deviation (Sample) | 10.6% | 7.5% |
| Standard Deviation (Population) | 10.5% | 7.4% |
Similar Demographics by Disability Age 5 to 17
Demographics Similar to Scotch-Irish by Disability Age 5 to 17
In terms of disability age 5 to 17, the demographic groups most similar to Scotch-Irish are Hmong (6.3%, a difference of 0.020%), Alaskan Athabascan (6.3%, a difference of 0.16%), Immigrants from Dominica (6.3%, a difference of 0.20%), Bahamian (6.3%, a difference of 0.23%), and Bermudan (6.4%, a difference of 0.32%).
| Demographics | Rating | Rank | Disability Age 5 to 17 |
| U.S. Virgin Islanders | 0.0 /100 | #301 | Tragic 6.3% |
| Celtics | 0.0 /100 | #302 | Tragic 6.3% |
| Yakama | 0.0 /100 | #303 | Tragic 6.3% |
| Senegalese | 0.0 /100 | #304 | Tragic 6.3% |
| Natives/Alaskans | 0.0 /100 | #305 | Tragic 6.3% |
| Immigrants | Nonimmigrants | 0.0 /100 | #306 | Tragic 6.3% |
| Bahamians | 0.0 /100 | #307 | Tragic 6.3% |
| Scotch-Irish | 0.0 /100 | #308 | Tragic 6.3% |
| Hmong | 0.0 /100 | #309 | Tragic 6.3% |
| Alaskan Athabascans | 0.0 /100 | #310 | Tragic 6.3% |
| Immigrants | Dominica | 0.0 /100 | #311 | Tragic 6.3% |
| Bermudans | 0.0 /100 | #312 | Tragic 6.4% |
| Apache | 0.0 /100 | #313 | Tragic 6.4% |
| French | 0.0 /100 | #314 | Tragic 6.4% |
| Immigrants | Portugal | 0.0 /100 | #315 | Tragic 6.4% |
Demographics Similar to Immigrants from Morocco by Disability Age 5 to 17
In terms of disability age 5 to 17, the demographic groups most similar to Immigrants from Morocco are Immigrants from Cameroon (5.8%, a difference of 0.0%), Swedish (5.8%, a difference of 0.040%), Immigrants from Panama (5.8%, a difference of 0.050%), Yugoslavian (5.8%, a difference of 0.12%), and Nigerian (5.8%, a difference of 0.13%).
| Demographics | Rating | Rank | Disability Age 5 to 17 |
| Moroccans | 10.4 /100 | #207 | Poor 5.7% |
| Kenyans | 10.0 /100 | #208 | Poor 5.8% |
| Immigrants | Uganda | 9.7 /100 | #209 | Tragic 5.8% |
| Immigrants | Haiti | 9.5 /100 | #210 | Tragic 5.8% |
| Yugoslavians | 9.1 /100 | #211 | Tragic 5.8% |
| Immigrants | Panama | 8.7 /100 | #212 | Tragic 5.8% |
| Immigrants | Cameroon | 8.3 /100 | #213 | Tragic 5.8% |
| Immigrants | Morocco | 8.3 /100 | #214 | Tragic 5.8% |
| Swedes | 8.1 /100 | #215 | Tragic 5.8% |
| Nigerians | 7.5 /100 | #216 | Tragic 5.8% |
| Czechs | 7.4 /100 | #217 | Tragic 5.8% |
| Immigrants | Sierra Leone | 7.1 /100 | #218 | Tragic 5.8% |
| Sierra Leoneans | 7.0 /100 | #219 | Tragic 5.8% |
| Belgians | 6.9 /100 | #220 | Tragic 5.8% |
| Lithuanians | 6.7 /100 | #221 | Tragic 5.8% |