Scotch-Irish vs Luxembourger Disability Age 5 to 17
COMPARE
Scotch-Irish
Luxembourger
Disability Age 5 to 17
Disability Age 5 to 17 Comparison
Scotch-Irish
Luxembourgers
6.3%
DISABILITY AGE 5 TO 17
0.0/ 100
METRIC RATING
308th/ 347
METRIC RANK
5.3%
DISABILITY AGE 5 TO 17
99.2/ 100
METRIC RATING
92nd/ 347
METRIC RANK
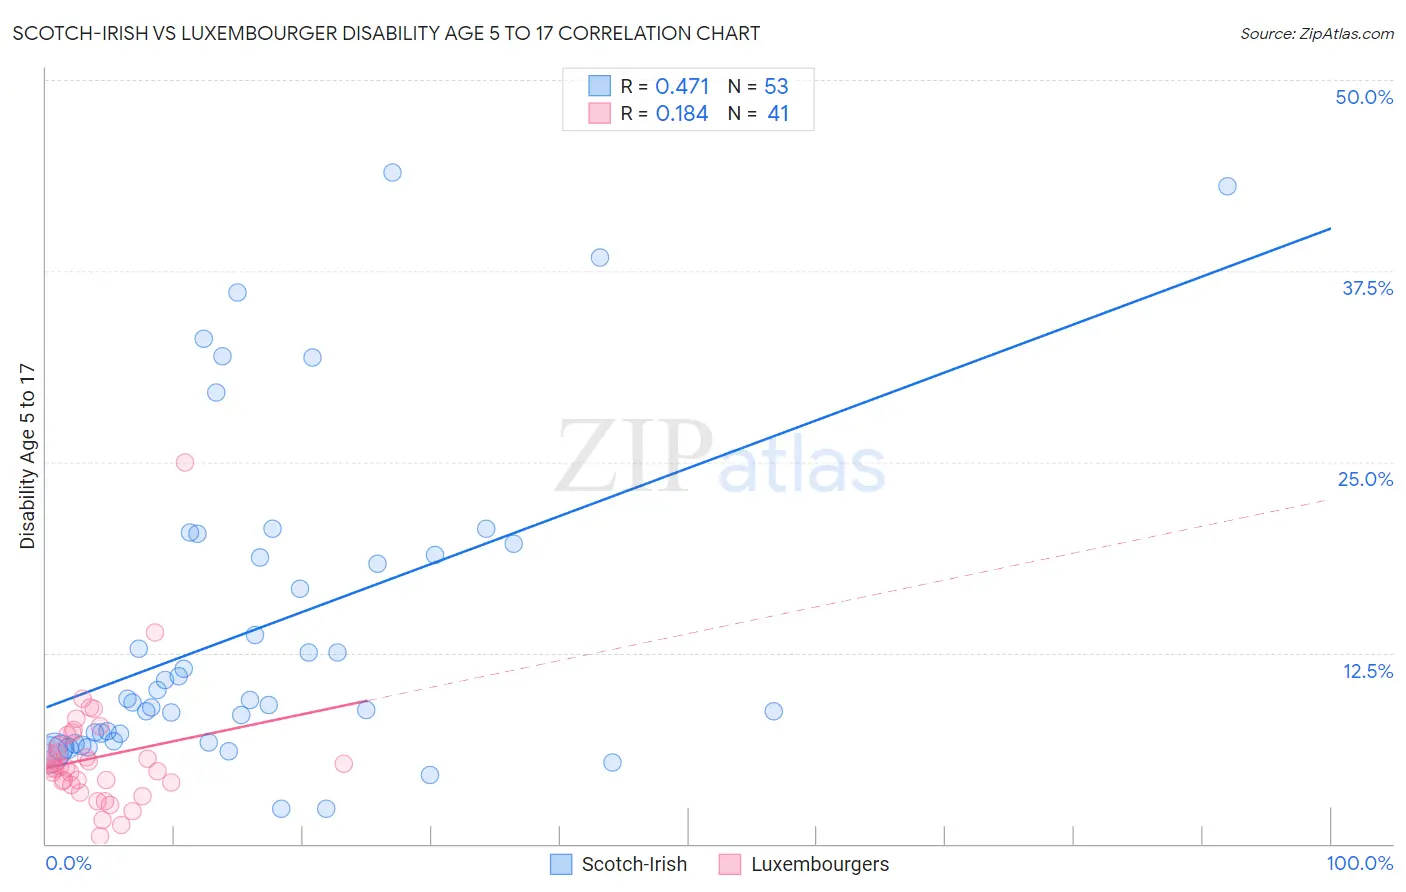
Scotch-Irish vs Luxembourger Disability Age 5 to 17 Correlation Chart
The statistical analysis conducted on geographies consisting of 537,256,381 people shows a moderate positive correlation between the proportion of Scotch-Irish and percentage of population with a disability between the ages 5 and 17 in the United States with a correlation coefficient (R) of 0.471 and weighted average of 6.3%. Similarly, the statistical analysis conducted on geographies consisting of 143,736,782 people shows a poor positive correlation between the proportion of Luxembourgers and percentage of population with a disability between the ages 5 and 17 in the United States with a correlation coefficient (R) of 0.184 and weighted average of 5.3%, a difference of 20.3%.
Disability Age 5 to 17 Correlation Summary
| Measurement | Scotch-Irish | Luxembourger |
| Minimum | 2.3% | 0.53% |
| Maximum | 43.9% | 25.0% |
| Range | 41.6% | 24.5% |
| Mean | 14.2% | 5.7% |
| Median | 9.4% | 5.0% |
| Interquartile 25% (IQ1) | 6.7% | 3.9% |
| Interquartile 75% (IQ3) | 19.3% | 6.8% |
| Interquartile Range (IQR) | 12.6% | 2.8% |
| Standard Deviation (Sample) | 10.6% | 4.0% |
| Standard Deviation (Population) | 10.5% | 3.9% |
Similar Demographics by Disability Age 5 to 17
Demographics Similar to Scotch-Irish by Disability Age 5 to 17
In terms of disability age 5 to 17, the demographic groups most similar to Scotch-Irish are Hmong (6.3%, a difference of 0.020%), Alaskan Athabascan (6.3%, a difference of 0.16%), Immigrants from Dominica (6.3%, a difference of 0.20%), Bahamian (6.3%, a difference of 0.23%), and Bermudan (6.4%, a difference of 0.32%).
| Demographics | Rating | Rank | Disability Age 5 to 17 |
| U.S. Virgin Islanders | 0.0 /100 | #301 | Tragic 6.3% |
| Celtics | 0.0 /100 | #302 | Tragic 6.3% |
| Yakama | 0.0 /100 | #303 | Tragic 6.3% |
| Senegalese | 0.0 /100 | #304 | Tragic 6.3% |
| Natives/Alaskans | 0.0 /100 | #305 | Tragic 6.3% |
| Immigrants | Nonimmigrants | 0.0 /100 | #306 | Tragic 6.3% |
| Bahamians | 0.0 /100 | #307 | Tragic 6.3% |
| Scotch-Irish | 0.0 /100 | #308 | Tragic 6.3% |
| Hmong | 0.0 /100 | #309 | Tragic 6.3% |
| Alaskan Athabascans | 0.0 /100 | #310 | Tragic 6.3% |
| Immigrants | Dominica | 0.0 /100 | #311 | Tragic 6.3% |
| Bermudans | 0.0 /100 | #312 | Tragic 6.4% |
| Apache | 0.0 /100 | #313 | Tragic 6.4% |
| French | 0.0 /100 | #314 | Tragic 6.4% |
| Immigrants | Portugal | 0.0 /100 | #315 | Tragic 6.4% |
Demographics Similar to Luxembourgers by Disability Age 5 to 17
In terms of disability age 5 to 17, the demographic groups most similar to Luxembourgers are Mongolian (5.3%, a difference of 0.010%), Immigrants from Peru (5.3%, a difference of 0.080%), Immigrants from Jordan (5.3%, a difference of 0.14%), Immigrants from Grenada (5.3%, a difference of 0.16%), and Immigrants from Kuwait (5.3%, a difference of 0.30%).
| Demographics | Rating | Rank | Disability Age 5 to 17 |
| Bulgarians | 99.4 /100 | #85 | Exceptional 5.2% |
| Immigrants | St. Vincent and the Grenadines | 99.4 /100 | #86 | Exceptional 5.2% |
| Eastern Europeans | 99.4 /100 | #87 | Exceptional 5.2% |
| Immigrants | Croatia | 99.4 /100 | #88 | Exceptional 5.2% |
| Immigrants | Spain | 99.4 /100 | #89 | Exceptional 5.2% |
| Immigrants | Kuwait | 99.4 /100 | #90 | Exceptional 5.3% |
| Mongolians | 99.2 /100 | #91 | Exceptional 5.3% |
| Luxembourgers | 99.2 /100 | #92 | Exceptional 5.3% |
| Immigrants | Peru | 99.1 /100 | #93 | Exceptional 5.3% |
| Immigrants | Jordan | 99.1 /100 | #94 | Exceptional 5.3% |
| Immigrants | Grenada | 99.1 /100 | #95 | Exceptional 5.3% |
| Immigrants | El Salvador | 99.0 /100 | #96 | Exceptional 5.3% |
| Immigrants | Europe | 99.0 /100 | #97 | Exceptional 5.3% |
| Immigrants | Austria | 98.9 /100 | #98 | Exceptional 5.3% |
| Cambodians | 98.8 /100 | #99 | Exceptional 5.3% |