Scotch-Irish vs Choctaw Disability Age 5 to 17
COMPARE
Scotch-Irish
Choctaw
Disability Age 5 to 17
Disability Age 5 to 17 Comparison
Scotch-Irish
Choctaw
6.3%
DISABILITY AGE 5 TO 17
0.0/ 100
METRIC RATING
308th/ 347
METRIC RANK
6.9%
DISABILITY AGE 5 TO 17
0.0/ 100
METRIC RATING
339th/ 347
METRIC RANK
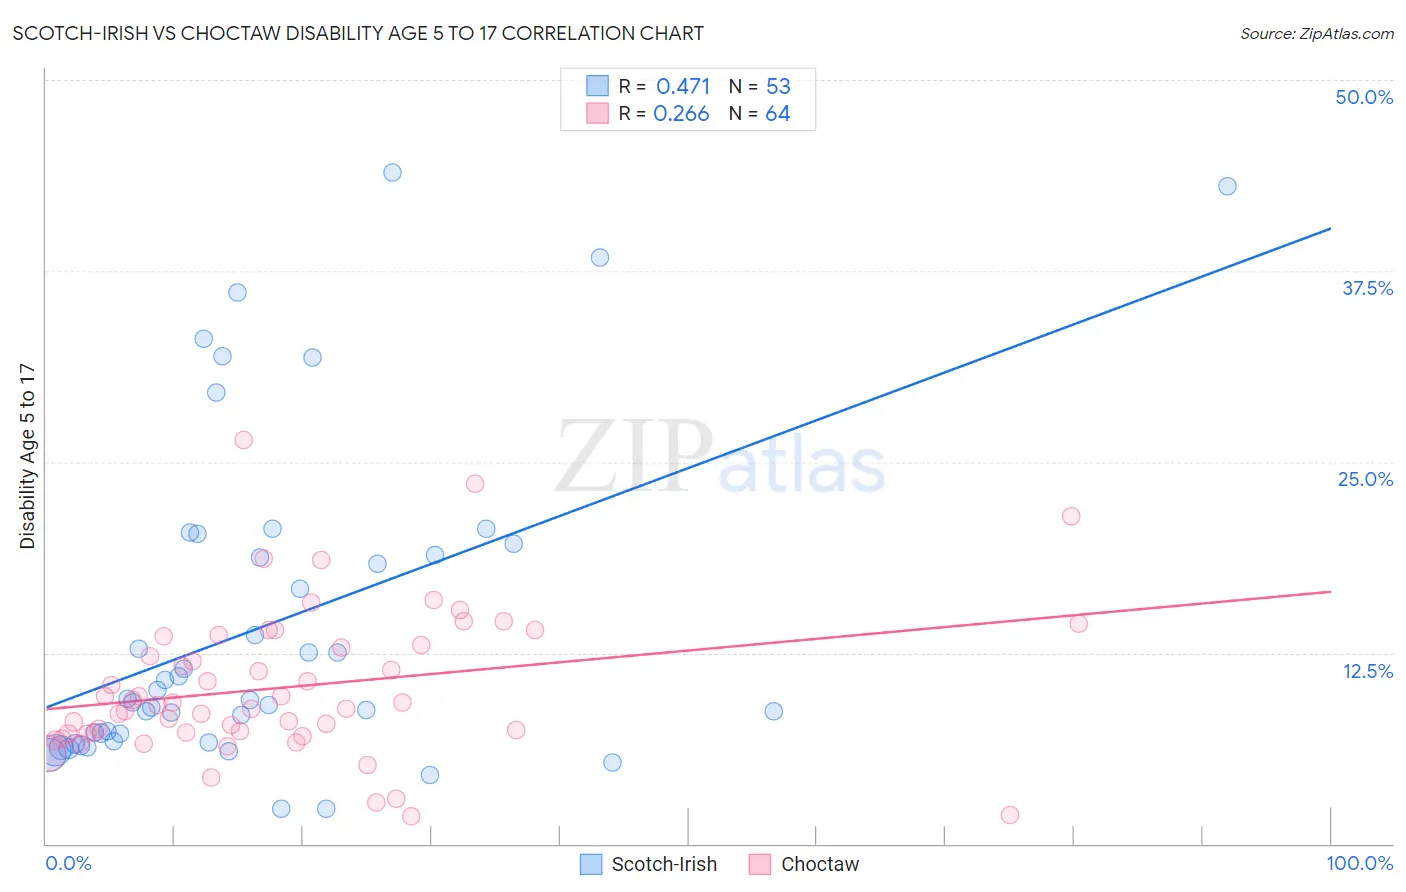
Scotch-Irish vs Choctaw Disability Age 5 to 17 Correlation Chart
The statistical analysis conducted on geographies consisting of 537,256,381 people shows a moderate positive correlation between the proportion of Scotch-Irish and percentage of population with a disability between the ages 5 and 17 in the United States with a correlation coefficient (R) of 0.471 and weighted average of 6.3%. Similarly, the statistical analysis conducted on geographies consisting of 268,025,414 people shows a weak positive correlation between the proportion of Choctaw and percentage of population with a disability between the ages 5 and 17 in the United States with a correlation coefficient (R) of 0.266 and weighted average of 6.9%, a difference of 9.0%.
Disability Age 5 to 17 Correlation Summary
| Measurement | Scotch-Irish | Choctaw |
| Minimum | 2.3% | 1.8% |
| Maximum | 43.9% | 26.4% |
| Range | 41.6% | 24.6% |
| Mean | 14.2% | 10.3% |
| Median | 9.4% | 9.2% |
| Interquartile 25% (IQ1) | 6.7% | 7.2% |
| Interquartile 75% (IQ3) | 19.3% | 13.3% |
| Interquartile Range (IQR) | 12.6% | 6.1% |
| Standard Deviation (Sample) | 10.6% | 4.8% |
| Standard Deviation (Population) | 10.5% | 4.8% |
Similar Demographics by Disability Age 5 to 17
Demographics Similar to Scotch-Irish by Disability Age 5 to 17
In terms of disability age 5 to 17, the demographic groups most similar to Scotch-Irish are Hmong (6.3%, a difference of 0.020%), Alaskan Athabascan (6.3%, a difference of 0.16%), Immigrants from Dominica (6.3%, a difference of 0.20%), Bahamian (6.3%, a difference of 0.23%), and Bermudan (6.4%, a difference of 0.32%).
| Demographics | Rating | Rank | Disability Age 5 to 17 |
| U.S. Virgin Islanders | 0.0 /100 | #301 | Tragic 6.3% |
| Celtics | 0.0 /100 | #302 | Tragic 6.3% |
| Yakama | 0.0 /100 | #303 | Tragic 6.3% |
| Senegalese | 0.0 /100 | #304 | Tragic 6.3% |
| Natives/Alaskans | 0.0 /100 | #305 | Tragic 6.3% |
| Immigrants | Nonimmigrants | 0.0 /100 | #306 | Tragic 6.3% |
| Bahamians | 0.0 /100 | #307 | Tragic 6.3% |
| Scotch-Irish | 0.0 /100 | #308 | Tragic 6.3% |
| Hmong | 0.0 /100 | #309 | Tragic 6.3% |
| Alaskan Athabascans | 0.0 /100 | #310 | Tragic 6.3% |
| Immigrants | Dominica | 0.0 /100 | #311 | Tragic 6.3% |
| Bermudans | 0.0 /100 | #312 | Tragic 6.4% |
| Apache | 0.0 /100 | #313 | Tragic 6.4% |
| French | 0.0 /100 | #314 | Tragic 6.4% |
| Immigrants | Portugal | 0.0 /100 | #315 | Tragic 6.4% |
Demographics Similar to Choctaw by Disability Age 5 to 17
In terms of disability age 5 to 17, the demographic groups most similar to Choctaw are Cherokee (6.9%, a difference of 0.26%), Iroquois (6.9%, a difference of 0.33%), Creek (6.9%, a difference of 0.57%), Cape Verdean (7.0%, a difference of 0.80%), and Chickasaw (6.8%, a difference of 1.0%).
| Demographics | Rating | Rank | Disability Age 5 to 17 |
| Immigrants | Azores | 0.0 /100 | #332 | Tragic 6.7% |
| Blacks/African Americans | 0.0 /100 | #333 | Tragic 6.8% |
| Seminole | 0.0 /100 | #334 | Tragic 6.8% |
| Ottawa | 0.0 /100 | #335 | Tragic 6.8% |
| Chickasaw | 0.0 /100 | #336 | Tragic 6.8% |
| Creek | 0.0 /100 | #337 | Tragic 6.9% |
| Iroquois | 0.0 /100 | #338 | Tragic 6.9% |
| Choctaw | 0.0 /100 | #339 | Tragic 6.9% |
| Cherokee | 0.0 /100 | #340 | Tragic 6.9% |
| Cape Verdeans | 0.0 /100 | #341 | Tragic 7.0% |
| Chippewa | 0.0 /100 | #342 | Tragic 7.1% |
| Immigrants | Cabo Verde | 0.0 /100 | #343 | Tragic 7.1% |
| Cajuns | 0.0 /100 | #344 | Tragic 7.2% |
| Tsimshian | 0.0 /100 | #345 | Tragic 7.9% |
| Puerto Ricans | 0.0 /100 | #346 | Tragic 8.3% |