Scotch-Irish vs Latvian Disability Age 5 to 17
COMPARE
Scotch-Irish
Latvian
Disability Age 5 to 17
Disability Age 5 to 17 Comparison
Scotch-Irish
Latvians
6.3%
DISABILITY AGE 5 TO 17
0.0/ 100
METRIC RATING
308th/ 347
METRIC RANK
5.4%
DISABILITY AGE 5 TO 17
95.0/ 100
METRIC RATING
127th/ 347
METRIC RANK
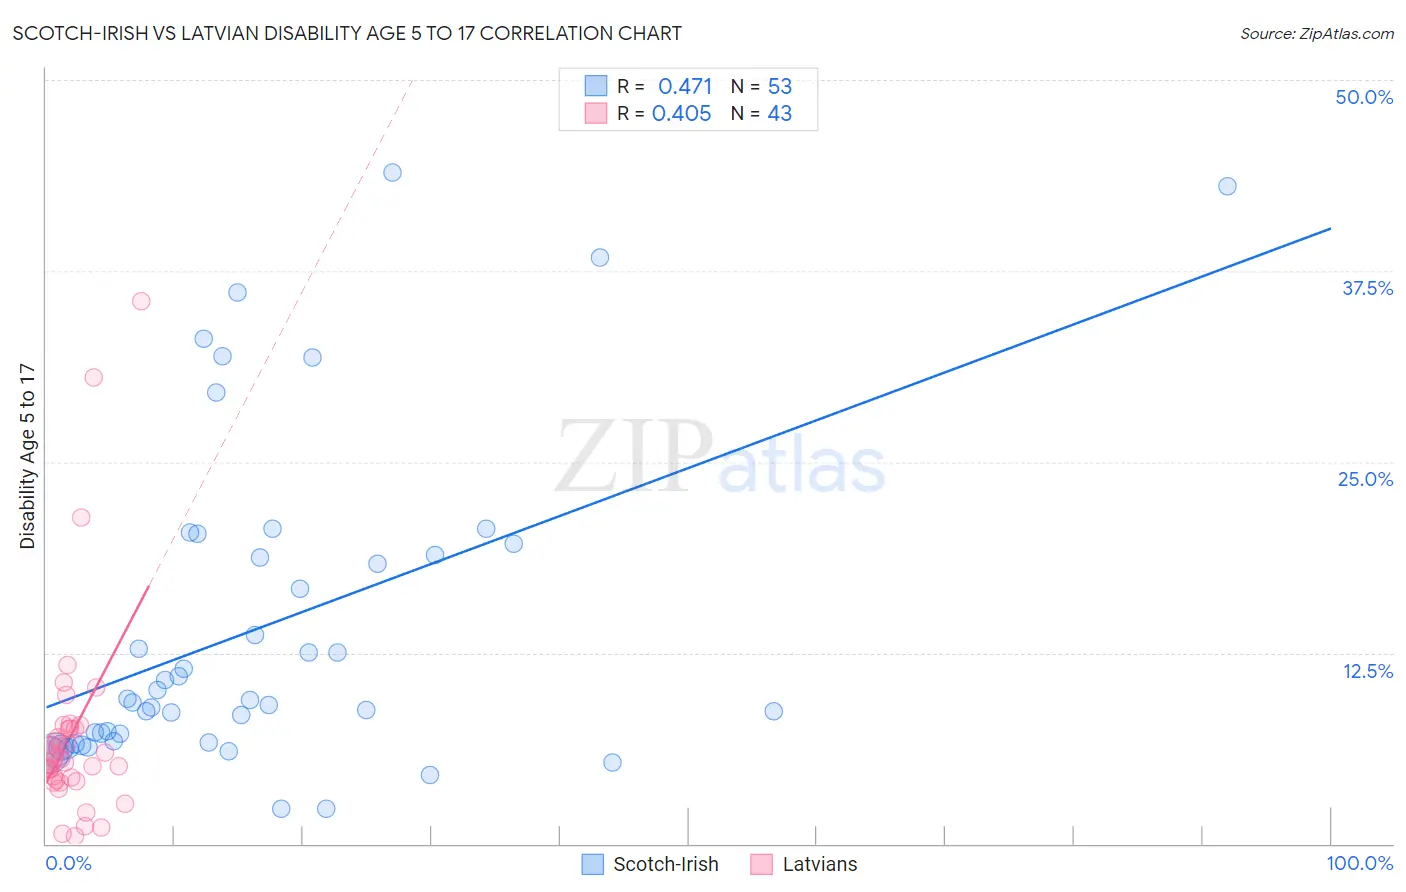
Scotch-Irish vs Latvian Disability Age 5 to 17 Correlation Chart
The statistical analysis conducted on geographies consisting of 537,256,381 people shows a moderate positive correlation between the proportion of Scotch-Irish and percentage of population with a disability between the ages 5 and 17 in the United States with a correlation coefficient (R) of 0.471 and weighted average of 6.3%. Similarly, the statistical analysis conducted on geographies consisting of 219,260,682 people shows a moderate positive correlation between the proportion of Latvians and percentage of population with a disability between the ages 5 and 17 in the United States with a correlation coefficient (R) of 0.405 and weighted average of 5.4%, a difference of 17.4%.
Disability Age 5 to 17 Correlation Summary
| Measurement | Scotch-Irish | Latvian |
| Minimum | 2.3% | 0.51% |
| Maximum | 43.9% | 35.5% |
| Range | 41.6% | 35.0% |
| Mean | 14.2% | 7.2% |
| Median | 9.4% | 5.6% |
| Interquartile 25% (IQ1) | 6.7% | 4.1% |
| Interquartile 75% (IQ3) | 19.3% | 7.5% |
| Interquartile Range (IQR) | 12.6% | 3.4% |
| Standard Deviation (Sample) | 10.6% | 6.8% |
| Standard Deviation (Population) | 10.5% | 6.7% |
Similar Demographics by Disability Age 5 to 17
Demographics Similar to Scotch-Irish by Disability Age 5 to 17
In terms of disability age 5 to 17, the demographic groups most similar to Scotch-Irish are Hmong (6.3%, a difference of 0.020%), Alaskan Athabascan (6.3%, a difference of 0.16%), Immigrants from Dominica (6.3%, a difference of 0.20%), Bahamian (6.3%, a difference of 0.23%), and Bermudan (6.4%, a difference of 0.32%).
| Demographics | Rating | Rank | Disability Age 5 to 17 |
| U.S. Virgin Islanders | 0.0 /100 | #301 | Tragic 6.3% |
| Celtics | 0.0 /100 | #302 | Tragic 6.3% |
| Yakama | 0.0 /100 | #303 | Tragic 6.3% |
| Senegalese | 0.0 /100 | #304 | Tragic 6.3% |
| Natives/Alaskans | 0.0 /100 | #305 | Tragic 6.3% |
| Immigrants | Nonimmigrants | 0.0 /100 | #306 | Tragic 6.3% |
| Bahamians | 0.0 /100 | #307 | Tragic 6.3% |
| Scotch-Irish | 0.0 /100 | #308 | Tragic 6.3% |
| Hmong | 0.0 /100 | #309 | Tragic 6.3% |
| Alaskan Athabascans | 0.0 /100 | #310 | Tragic 6.3% |
| Immigrants | Dominica | 0.0 /100 | #311 | Tragic 6.3% |
| Bermudans | 0.0 /100 | #312 | Tragic 6.4% |
| Apache | 0.0 /100 | #313 | Tragic 6.4% |
| French | 0.0 /100 | #314 | Tragic 6.4% |
| Immigrants | Portugal | 0.0 /100 | #315 | Tragic 6.4% |
Demographics Similar to Latvians by Disability Age 5 to 17
In terms of disability age 5 to 17, the demographic groups most similar to Latvians are New Zealander (5.4%, a difference of 0.0%), Immigrants from Chile (5.4%, a difference of 0.010%), Crow (5.4%, a difference of 0.030%), Immigrants from Venezuela (5.4%, a difference of 0.11%), and Immigrants from Ethiopia (5.4%, a difference of 0.16%).
| Demographics | Rating | Rank | Disability Age 5 to 17 |
| Immigrants | Immigrants | 97.0 /100 | #120 | Exceptional 5.4% |
| Maltese | 96.0 /100 | #121 | Exceptional 5.4% |
| Chileans | 95.8 /100 | #122 | Exceptional 5.4% |
| Immigrants | Ethiopia | 95.5 /100 | #123 | Exceptional 5.4% |
| Crow | 95.0 /100 | #124 | Exceptional 5.4% |
| Immigrants | Chile | 95.0 /100 | #125 | Exceptional 5.4% |
| New Zealanders | 95.0 /100 | #126 | Exceptional 5.4% |
| Latvians | 95.0 /100 | #127 | Exceptional 5.4% |
| Immigrants | Venezuela | 94.5 /100 | #128 | Exceptional 5.4% |
| Romanians | 94.1 /100 | #129 | Exceptional 5.4% |
| Immigrants | Bulgaria | 94.0 /100 | #130 | Exceptional 5.4% |
| Arabs | 92.9 /100 | #131 | Exceptional 5.4% |
| Immigrants | Colombia | 92.9 /100 | #132 | Exceptional 5.4% |
| Venezuelans | 92.7 /100 | #133 | Exceptional 5.4% |
| Yuman | 92.3 /100 | #134 | Exceptional 5.4% |