Scotch-Irish vs Immigrants from Latin America Disability Age 5 to 17
COMPARE
Scotch-Irish
Immigrants from Latin America
Disability Age 5 to 17
Disability Age 5 to 17 Comparison
Scotch-Irish
Immigrants from Latin America
6.3%
DISABILITY AGE 5 TO 17
0.0/ 100
METRIC RATING
308th/ 347
METRIC RANK
5.6%
DISABILITY AGE 5 TO 17
34.3/ 100
METRIC RATING
183rd/ 347
METRIC RANK
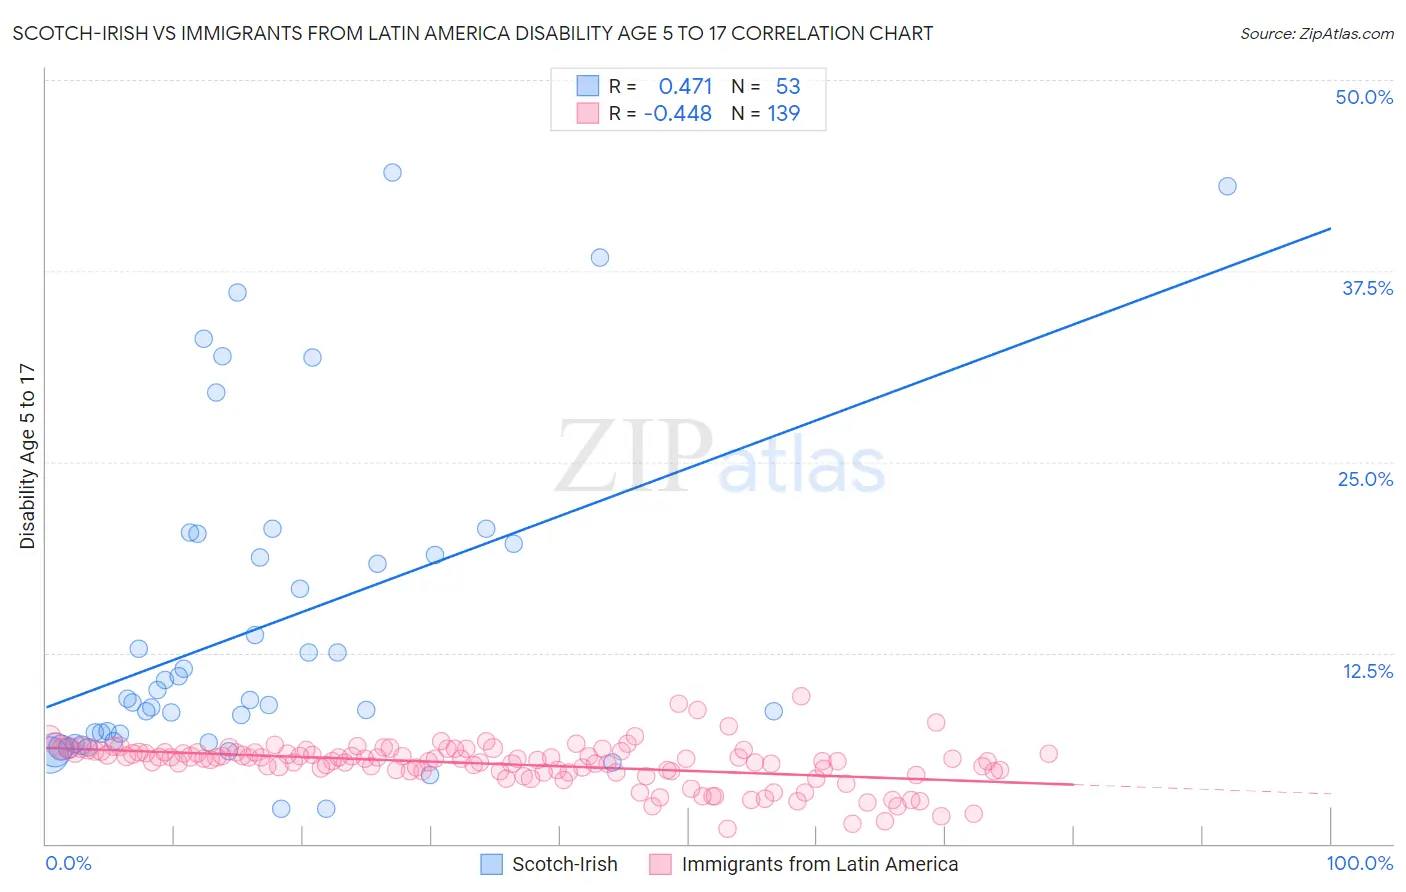
Scotch-Irish vs Immigrants from Latin America Disability Age 5 to 17 Correlation Chart
The statistical analysis conducted on geographies consisting of 537,256,381 people shows a moderate positive correlation between the proportion of Scotch-Irish and percentage of population with a disability between the ages 5 and 17 in the United States with a correlation coefficient (R) of 0.471 and weighted average of 6.3%. Similarly, the statistical analysis conducted on geographies consisting of 547,403,428 people shows a moderate negative correlation between the proportion of Immigrants from Latin America and percentage of population with a disability between the ages 5 and 17 in the United States with a correlation coefficient (R) of -0.448 and weighted average of 5.6%, a difference of 12.2%.
Disability Age 5 to 17 Correlation Summary
| Measurement | Scotch-Irish | Immigrants from Latin America |
| Minimum | 2.3% | 1.0% |
| Maximum | 43.9% | 9.7% |
| Range | 41.6% | 8.7% |
| Mean | 14.2% | 5.2% |
| Median | 9.4% | 5.5% |
| Interquartile 25% (IQ1) | 6.7% | 4.7% |
| Interquartile 75% (IQ3) | 19.3% | 6.0% |
| Interquartile Range (IQR) | 12.6% | 1.3% |
| Standard Deviation (Sample) | 10.6% | 1.4% |
| Standard Deviation (Population) | 10.5% | 1.4% |
Similar Demographics by Disability Age 5 to 17
Demographics Similar to Scotch-Irish by Disability Age 5 to 17
In terms of disability age 5 to 17, the demographic groups most similar to Scotch-Irish are Hmong (6.3%, a difference of 0.020%), Alaskan Athabascan (6.3%, a difference of 0.16%), Immigrants from Dominica (6.3%, a difference of 0.20%), Bahamian (6.3%, a difference of 0.23%), and Bermudan (6.4%, a difference of 0.32%).
| Demographics | Rating | Rank | Disability Age 5 to 17 |
| U.S. Virgin Islanders | 0.0 /100 | #301 | Tragic 6.3% |
| Celtics | 0.0 /100 | #302 | Tragic 6.3% |
| Yakama | 0.0 /100 | #303 | Tragic 6.3% |
| Senegalese | 0.0 /100 | #304 | Tragic 6.3% |
| Natives/Alaskans | 0.0 /100 | #305 | Tragic 6.3% |
| Immigrants | Nonimmigrants | 0.0 /100 | #306 | Tragic 6.3% |
| Bahamians | 0.0 /100 | #307 | Tragic 6.3% |
| Scotch-Irish | 0.0 /100 | #308 | Tragic 6.3% |
| Hmong | 0.0 /100 | #309 | Tragic 6.3% |
| Alaskan Athabascans | 0.0 /100 | #310 | Tragic 6.3% |
| Immigrants | Dominica | 0.0 /100 | #311 | Tragic 6.3% |
| Bermudans | 0.0 /100 | #312 | Tragic 6.4% |
| Apache | 0.0 /100 | #313 | Tragic 6.4% |
| French | 0.0 /100 | #314 | Tragic 6.4% |
| Immigrants | Portugal | 0.0 /100 | #315 | Tragic 6.4% |
Demographics Similar to Immigrants from Latin America by Disability Age 5 to 17
In terms of disability age 5 to 17, the demographic groups most similar to Immigrants from Latin America are Syrian (5.6%, a difference of 0.020%), Immigrants from Mexico (5.6%, a difference of 0.030%), Mexican American Indian (5.6%, a difference of 0.050%), Immigrants from England (5.6%, a difference of 0.11%), and Fijian (5.7%, a difference of 0.14%).
| Demographics | Rating | Rank | Disability Age 5 to 17 |
| Immigrants | Central America | 49.4 /100 | #176 | Average 5.6% |
| Immigrants | Western Europe | 47.8 /100 | #177 | Average 5.6% |
| Immigrants | Trinidad and Tobago | 47.6 /100 | #178 | Average 5.6% |
| Immigrants | Barbados | 40.5 /100 | #179 | Average 5.6% |
| Immigrants | Uruguay | 37.7 /100 | #180 | Fair 5.6% |
| Immigrants | England | 36.4 /100 | #181 | Fair 5.6% |
| Mexican American Indians | 35.2 /100 | #182 | Fair 5.6% |
| Immigrants | Latin America | 34.3 /100 | #183 | Fair 5.6% |
| Syrians | 33.8 /100 | #184 | Fair 5.6% |
| Immigrants | Mexico | 33.7 /100 | #185 | Fair 5.6% |
| Fijians | 31.7 /100 | #186 | Fair 5.7% |
| Immigrants | Thailand | 30.2 /100 | #187 | Fair 5.7% |
| Marshallese | 28.1 /100 | #188 | Fair 5.7% |
| Pueblo | 27.5 /100 | #189 | Fair 5.7% |
| Immigrants | Eastern Africa | 27.3 /100 | #190 | Fair 5.7% |