Coats Bend, AL Map & Demographics
Coats Bend Map
Coats Bend Overview
$25,934
PER CAPITA INCOME
$57,120
AVG FAMILY INCOME
$48,243
AVG HOUSEHOLD INCOME
43.3%
WAGE / INCOME GAP [ % ]
56.7¢/ $1
WAGE / INCOME GAP [ $ ]
0.39
INEQUALITY / GINI INDEX
1,353
TOTAL POPULATION
696
MALE POPULATION
657
FEMALE POPULATION
105.94
MALES / 100 FEMALES
94.40
FEMALES / 100 MALES
45.5
MEDIAN AGE
3.2
AVG FAMILY SIZE
2.5
AVG HOUSEHOLD SIZE
642
LABOR FORCE [ PEOPLE ]
59.9%
PERCENT IN LABOR FORCE
2.3%
UNEMPLOYMENT RATE
Income in Coats Bend
Income Overview in Coats Bend
Per Capita Income in Coats Bend is $25,934, while median incomes of families and households are $57,120 and $48,243 respectively.
| Characteristic | Number | Measure |
| Per Capita Income | 1,353 | $25,934 |
| Median Family Income | 351 | $57,120 |
| Mean Family Income | 351 | $72,764 |
| Median Household Income | 546 | $48,243 |
| Mean Household Income | 546 | $59,534 |
| Income Deficit | 351 | $0 |
| Wage / Income Gap (%) | 1,353 | 43.27% |
| Wage / Income Gap ($) | 1,353 | 56.73¢ per $1 |
| Gini / Inequality Index | 1,353 | 0.39 |
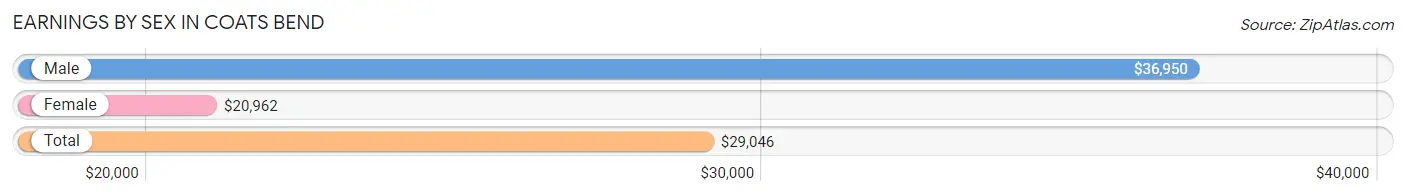
Earnings by Sex in Coats Bend
Average Earnings in Coats Bend are $29,046, $36,950 for men and $20,962 for women, a difference of 43.3%.
| Sex | Number | Average Earnings |
| Male | 371 (55.3%) | $36,950 |
| Female | 300 (44.7%) | $20,962 |
| Total | 671 (100.0%) | $29,046 |
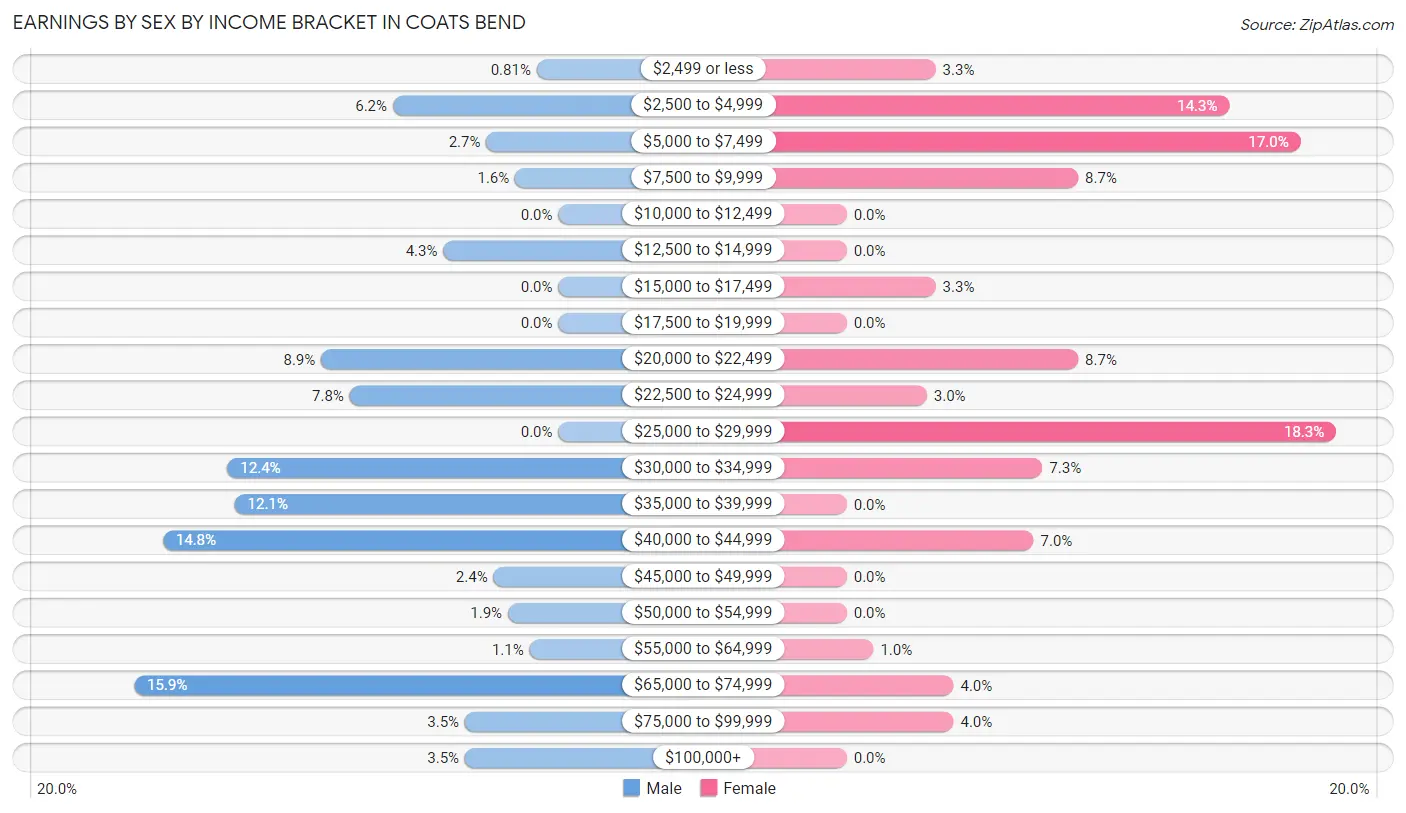
Earnings by Sex by Income Bracket in Coats Bend
The most common earnings brackets in Coats Bend are $65,000 to $74,999 for men (59 | 15.9%) and $25,000 to $29,999 for women (55 | 18.3%).
| Income | Male | Female |
| $2,499 or less | 3 (0.8%) | 10 (3.3%) |
| $2,500 to $4,999 | 23 (6.2%) | 43 (14.3%) |
| $5,000 to $7,499 | 10 (2.7%) | 51 (17.0%) |
| $7,500 to $9,999 | 6 (1.6%) | 26 (8.7%) |
| $10,000 to $12,499 | 0 (0.0%) | 0 (0.0%) |
| $12,500 to $14,999 | 16 (4.3%) | 0 (0.0%) |
| $15,000 to $17,499 | 0 (0.0%) | 10 (3.3%) |
| $17,500 to $19,999 | 0 (0.0%) | 0 (0.0%) |
| $20,000 to $22,499 | 33 (8.9%) | 26 (8.7%) |
| $22,500 to $24,999 | 29 (7.8%) | 9 (3.0%) |
| $25,000 to $29,999 | 0 (0.0%) | 55 (18.3%) |
| $30,000 to $34,999 | 46 (12.4%) | 22 (7.3%) |
| $35,000 to $39,999 | 45 (12.1%) | 0 (0.0%) |
| $40,000 to $44,999 | 55 (14.8%) | 21 (7.0%) |
| $45,000 to $49,999 | 9 (2.4%) | 0 (0.0%) |
| $50,000 to $54,999 | 7 (1.9%) | 0 (0.0%) |
| $55,000 to $64,999 | 4 (1.1%) | 3 (1.0%) |
| $65,000 to $74,999 | 59 (15.9%) | 12 (4.0%) |
| $75,000 to $99,999 | 13 (3.5%) | 12 (4.0%) |
| $100,000+ | 13 (3.5%) | 0 (0.0%) |
| Total | 371 (100.0%) | 300 (100.0%) |
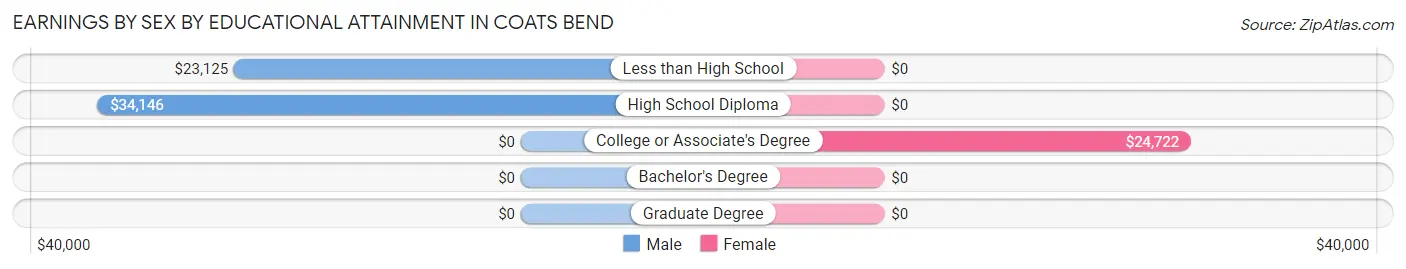
Earnings by Sex by Educational Attainment in Coats Bend
Average earnings in Coats Bend are $35,950 for men and $22,260 for women, a difference of 38.1%. Men with an educational attainment of high school diploma enjoy the highest average annual earnings of $34,146, while those with less than high school education earn the least with $23,125. Women with an educational attainment of college or associate's degree earn the most with the average annual earnings of $24,722, while those with college or associate's degree education have the smallest earnings of $24,722.
| Educational Attainment | Male Income | Female Income |
| Less than High School | $23,125 | $0 |
| High School Diploma | $34,146 | $0 |
| College or Associate's Degree | - | - |
| Bachelor's Degree | - | - |
| Graduate Degree | - | - |
| Total | $35,950 | $22,260 |
Family Income in Coats Bend
Family Income Brackets in Coats Bend
According to the Coats Bend family income data, there are 111 families falling into the $35,000 to $49,999 income range, which is the most common income bracket and makes up 31.6% of all families.
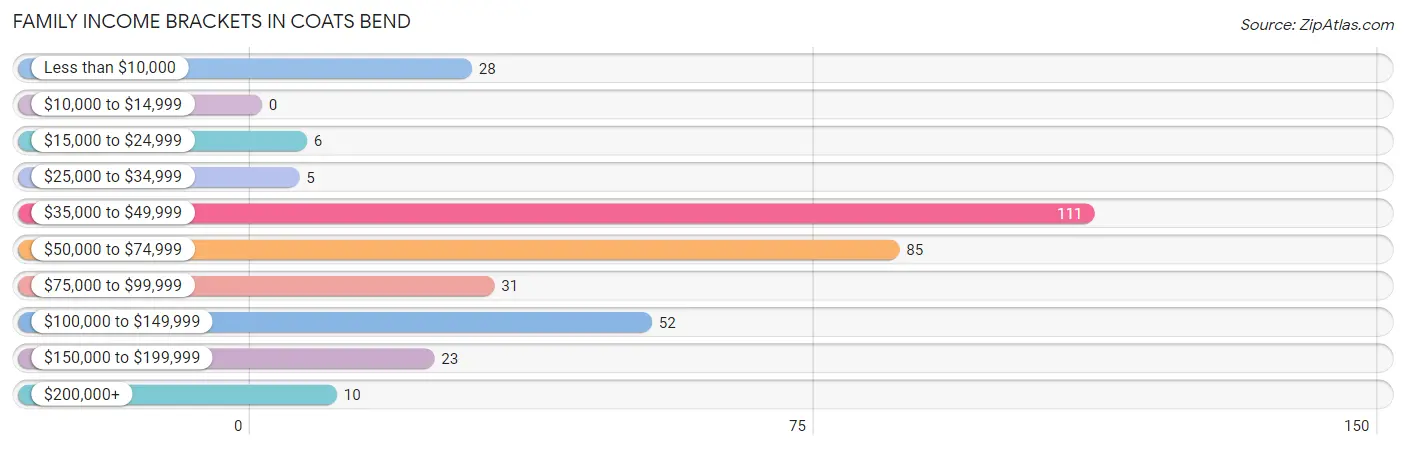
| Income Bracket | # Families | % Families |
| Less than $10,000 | 28 | 8.0% |
| $10,000 to $14,999 | 0 | 0.0% |
| $15,000 to $24,999 | 6 | 1.7% |
| $25,000 to $34,999 | 5 | 1.4% |
| $35,000 to $49,999 | 111 | 31.6% |
| $50,000 to $74,999 | 85 | 24.2% |
| $75,000 to $99,999 | 31 | 8.8% |
| $100,000 to $149,999 | 52 | 14.8% |
| $150,000 to $199,999 | 23 | 6.6% |
| $200,000+ | 10 | 2.8% |
Family Income by Famaliy Size in Coats Bend
4-person families (27 | 7.7%) account for the highest median family income in Coats Bend with $117,969 per family, while 4-person families (27 | 7.7%) have the highest median income of $29,492 per family member.
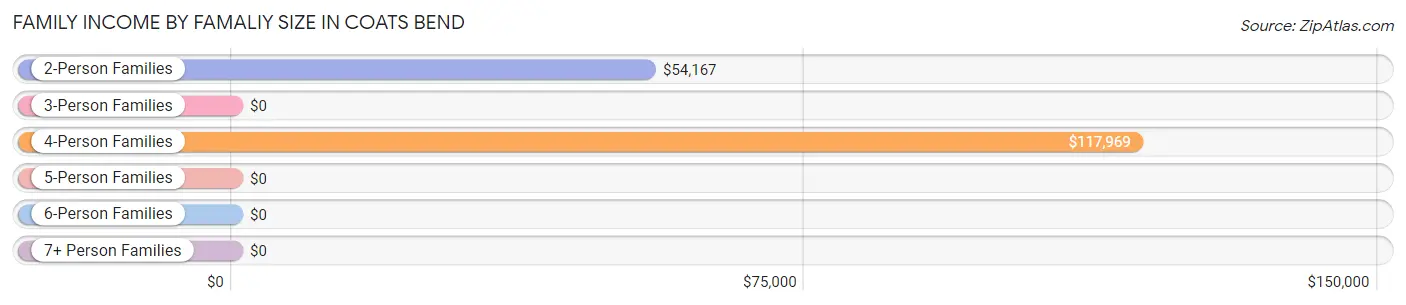
| Income Bracket | # Families | Median Income |
| 2-Person Families | 204 (58.1%) | $54,167 |
| 3-Person Families | 77 (21.9%) | $0 |
| 4-Person Families | 27 (7.7%) | $117,969 |
| 5-Person Families | 30 (8.6%) | $0 |
| 6-Person Families | 0 (0.0%) | $0 |
| 7+ Person Families | 13 (3.7%) | $0 |
| Total | 351 (100.0%) | $57,120 |
Family Income by Number of Earners in Coats Bend
The median family income in Coats Bend is $57,120, with families comprising 3+ earners (34) having the highest median family income of $119,688, while families with 1 earner (157) have the lowest median family income of $47,669, accounting for 9.7% and 44.7% of families, respectively.
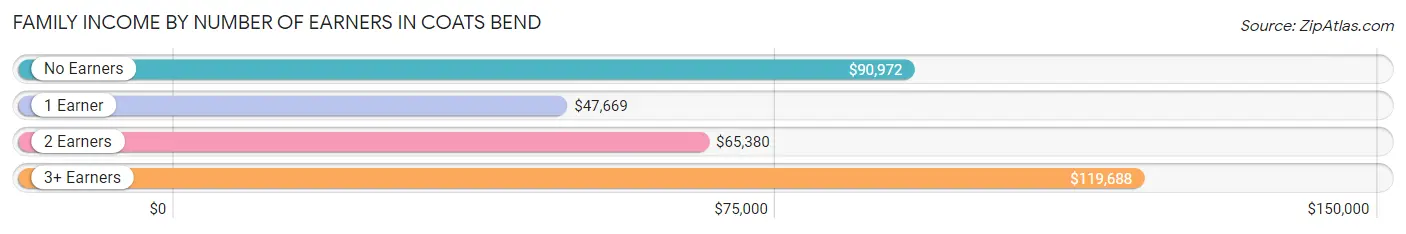
| Number of Earners | # Families | Median Income |
| No Earners | 43 (12.2%) | $90,972 |
| 1 Earner | 157 (44.7%) | $47,669 |
| 2 Earners | 117 (33.3%) | $65,380 |
| 3+ Earners | 34 (9.7%) | $119,688 |
| Total | 351 (100.0%) | $57,120 |
Household Income in Coats Bend
Household Income Brackets in Coats Bend
With 132 households falling in the category, the $35,000 to $49,999 income range is the most frequent in Coats Bend, accounting for 24.2% of all households.
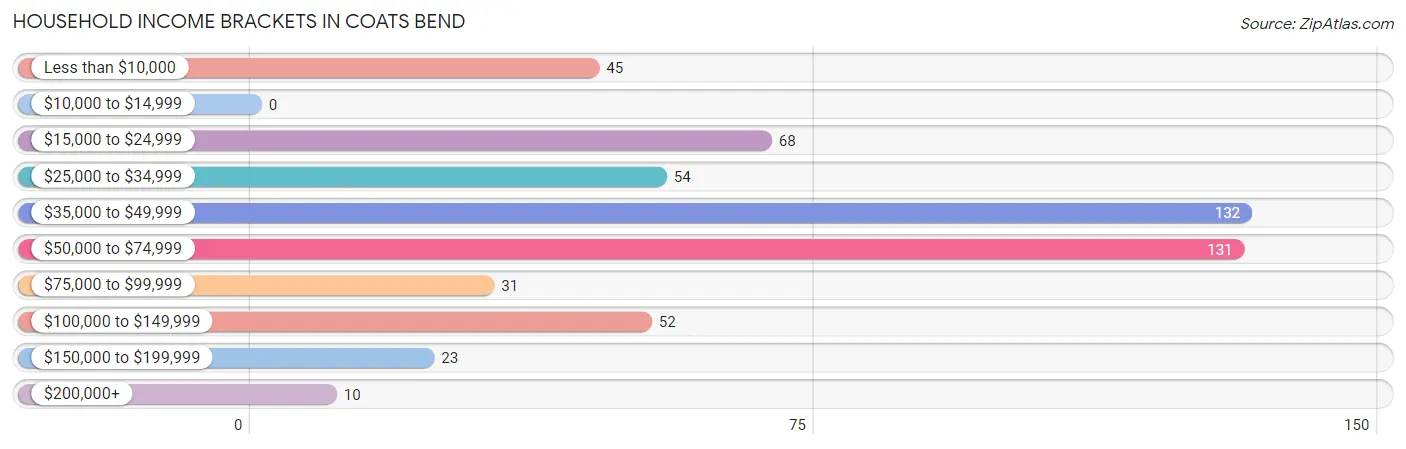
| Income Bracket | # Households | % Households |
| Less than $10,000 | 45 | 8.2% |
| $10,000 to $14,999 | 0 | 0.0% |
| $15,000 to $24,999 | 68 | 12.5% |
| $25,000 to $34,999 | 54 | 9.9% |
| $35,000 to $49,999 | 132 | 24.2% |
| $50,000 to $74,999 | 131 | 24.0% |
| $75,000 to $99,999 | 31 | 5.7% |
| $100,000 to $149,999 | 52 | 9.5% |
| $150,000 to $199,999 | 23 | 4.2% |
| $200,000+ | 10 | 1.8% |
Household Income by Householder Age in Coats Bend
The median household income in Coats Bend is $48,243, with the highest median household income of $67,361 found in the 45 to 64 years age bracket for the primary householder. A total of 175 households (32.1%) fall into this category.
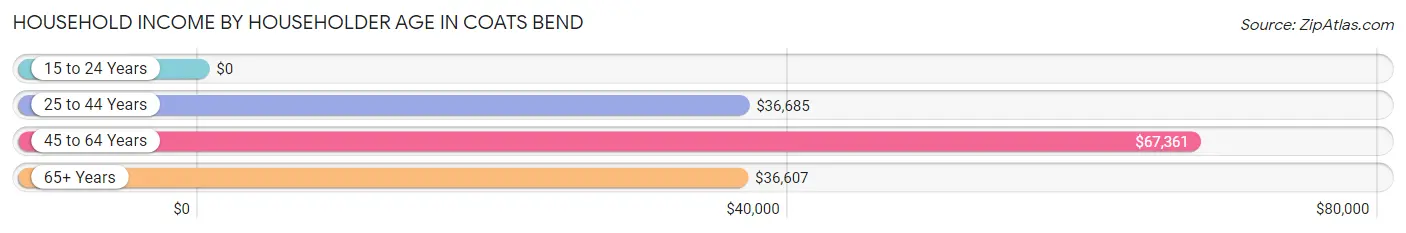
| Income Bracket | # Households | Median Income |
| 15 to 24 Years | 0 (0.0%) | $0 |
| 25 to 44 Years | 191 (35.0%) | $36,685 |
| 45 to 64 Years | 175 (32.1%) | $67,361 |
| 65+ Years | 180 (33.0%) | $36,607 |
| Total | 546 (100.0%) | $48,243 |
Poverty in Coats Bend
Income Below Poverty by Sex and Age in Coats Bend
With 18.1% poverty level for males and 24.2% for females among the residents of Coats Bend, under 5 year old males and 12 to 14 year old females are the most vulnerable to poverty, with 51 males (100.0%) and 15 females (100.0%) in their respective age groups living below the poverty level.
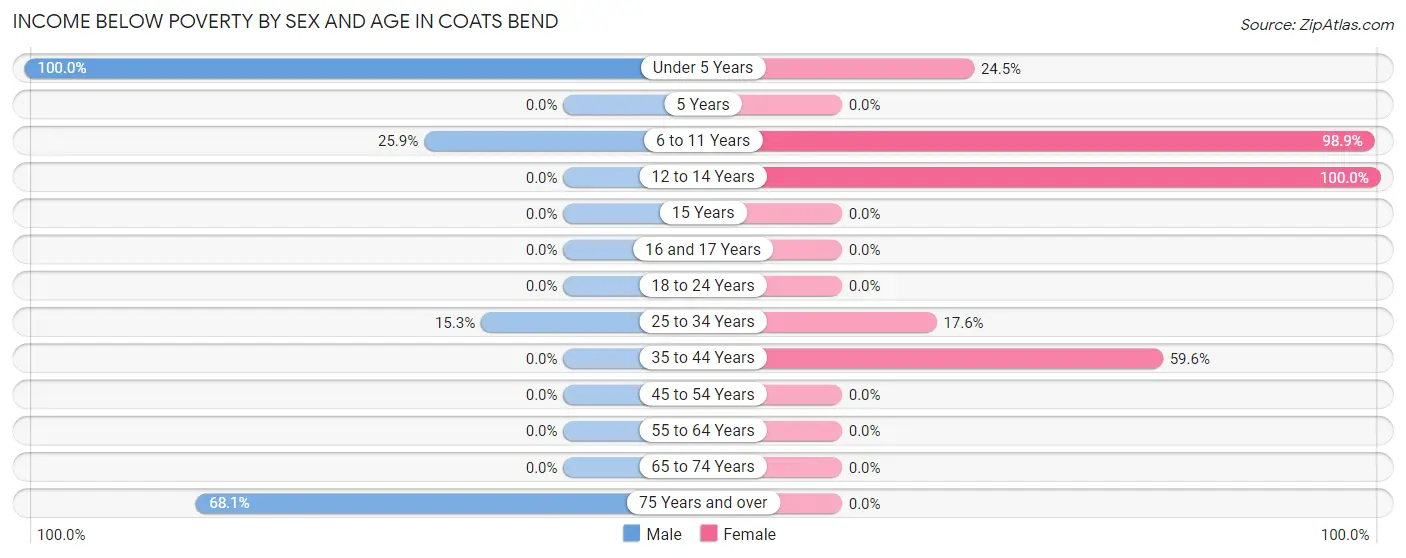
| Age Bracket | Male | Female |
| Under 5 Years | 51 (100.0%) | 13 (24.5%) |
| 5 Years | 0 (0.0%) | 0 (0.0%) |
| 6 to 11 Years | 15 (25.9%) | 90 (98.9%) |
| 12 to 14 Years | 0 (0.0%) | 15 (100.0%) |
| 15 Years | 0 (0.0%) | 0 (0.0%) |
| 16 and 17 Years | 0 (0.0%) | 0 (0.0%) |
| 18 to 24 Years | 0 (0.0%) | 0 (0.0%) |
| 25 to 34 Years | 13 (15.3%) | 13 (17.6%) |
| 35 to 44 Years | 0 (0.0%) | 28 (59.6%) |
| 45 to 54 Years | 0 (0.0%) | 0 (0.0%) |
| 55 to 64 Years | 0 (0.0%) | 0 (0.0%) |
| 65 to 74 Years | 0 (0.0%) | 0 (0.0%) |
| 75 Years and over | 47 (68.1%) | 0 (0.0%) |
| Total | 126 (18.1%) | 159 (24.2%) |
Income Above Poverty by Sex and Age in Coats Bend
According to the poverty statistics in Coats Bend, males aged 12 to 14 years and females aged 15 years are the age groups that are most secure financially, with 100.0% of males and 100.0% of females in these age groups living above the poverty line.
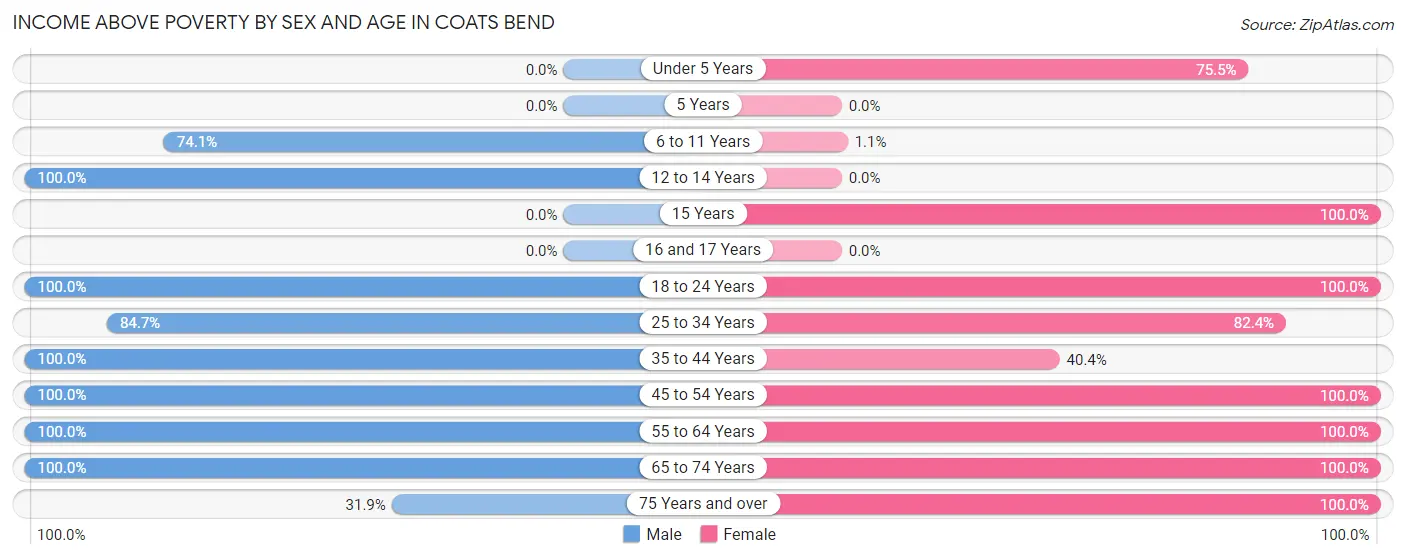
| Age Bracket | Male | Female |
| Under 5 Years | 0 (0.0%) | 40 (75.5%) |
| 5 Years | 0 (0.0%) | 0 (0.0%) |
| 6 to 11 Years | 43 (74.1%) | 1 (1.1%) |
| 12 to 14 Years | 1 (100.0%) | 0 (0.0%) |
| 15 Years | 0 (0.0%) | 13 (100.0%) |
| 16 and 17 Years | 0 (0.0%) | 0 (0.0%) |
| 18 to 24 Years | 40 (100.0%) | 50 (100.0%) |
| 25 to 34 Years | 72 (84.7%) | 61 (82.4%) |
| 35 to 44 Years | 93 (100.0%) | 19 (40.4%) |
| 45 to 54 Years | 103 (100.0%) | 141 (100.0%) |
| 55 to 64 Years | 100 (100.0%) | 53 (100.0%) |
| 65 to 74 Years | 96 (100.0%) | 58 (100.0%) |
| 75 Years and over | 22 (31.9%) | 62 (100.0%) |
| Total | 570 (81.9%) | 498 (75.8%) |
Income Below Poverty Among Married-Couple Families in Coats Bend
The poverty statistics for married-couple families in Coats Bend show that 4.4% or 13 of the total 292 families live below the poverty line. Families with 5 or more children have the highest poverty rate of 100.0%, comprising of 13 families. On the other hand, families with no children have the lowest poverty rate of 0.0%, which includes 0 families.
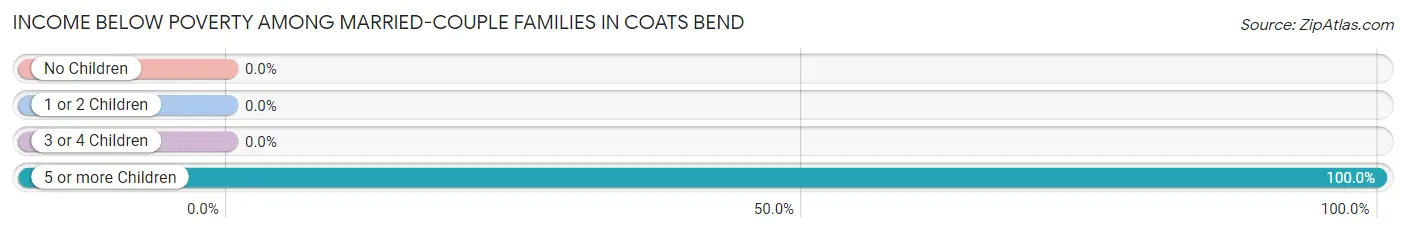
| Children | Above Poverty | Below Poverty |
| No Children | 260 (100.0%) | 0 (0.0%) |
| 1 or 2 Children | 19 (100.0%) | 0 (0.0%) |
| 3 or 4 Children | 0 (0.0%) | 0 (0.0%) |
| 5 or more Children | 0 (0.0%) | 13 (100.0%) |
| Total | 279 (95.6%) | 13 (4.4%) |
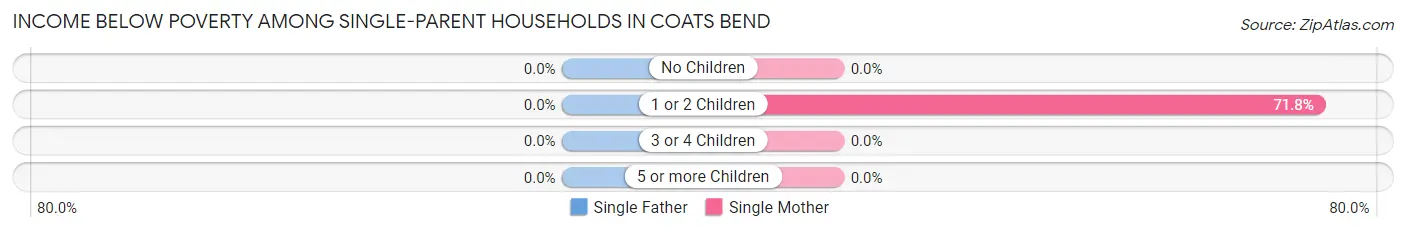
Income Below Poverty Among Single-Parent Households in Coats Bend
| Children | Single Father | Single Mother |
| No Children | 0 (0.0%) | 0 (0.0%) |
| 1 or 2 Children | 0 (0.0%) | 28 (71.8%) |
| 3 or 4 Children | 0 (0.0%) | 0 (0.0%) |
| 5 or more Children | 0 (0.0%) | 0 (0.0%) |
| Total | 0 (0.0%) | 28 (71.8%) |
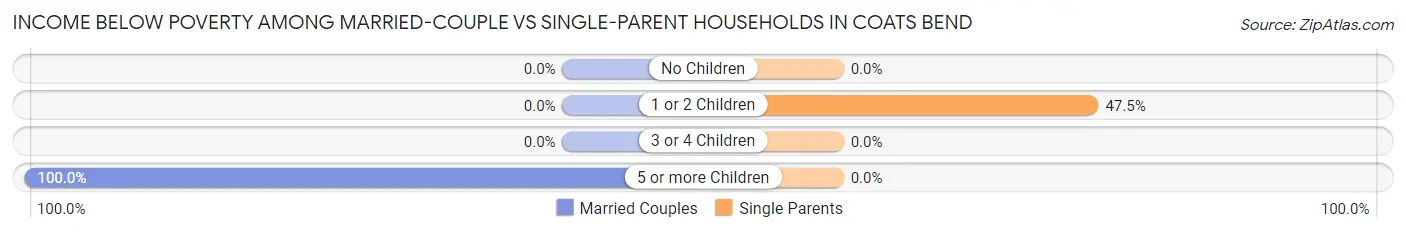
Income Below Poverty Among Married-Couple vs Single-Parent Households in Coats Bend
The poverty data for Coats Bend shows that 13 of the married-couple family households (4.4%) and 28 of the single-parent households (47.5%) are living below the poverty level. Within the married-couple family households, those with 5 or more children have the highest poverty rate, with 13 households (100.0%) falling below the poverty line. Among the single-parent households, those with 1 or 2 children have the highest poverty rate, with 28 household (47.5%) living below poverty.
| Children | Married-Couple Families | Single-Parent Households |
| No Children | 0 (0.0%) | 0 (0.0%) |
| 1 or 2 Children | 0 (0.0%) | 28 (47.5%) |
| 3 or 4 Children | 0 (0.0%) | 0 (0.0%) |
| 5 or more Children | 13 (100.0%) | 0 (0.0%) |
| Total | 13 (4.4%) | 28 (47.5%) |
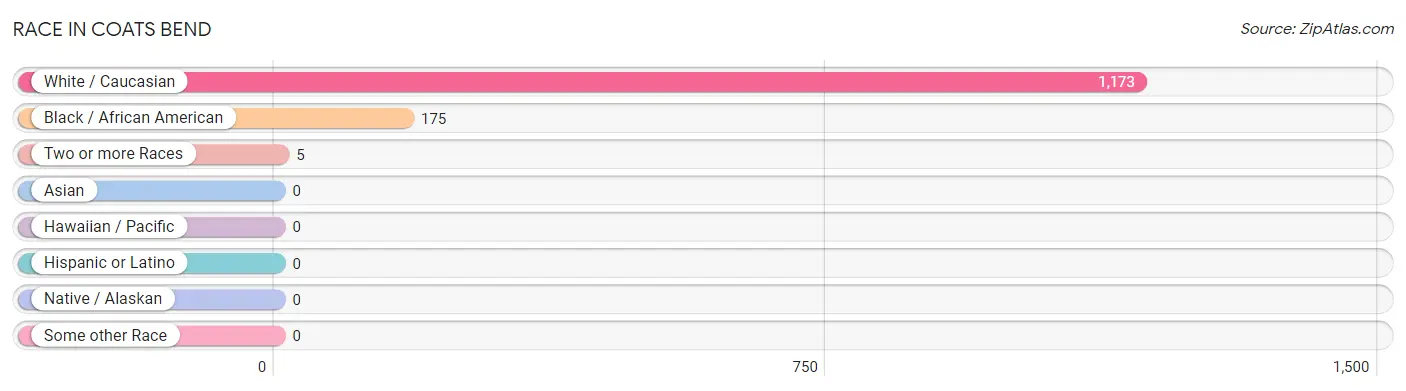
Race in Coats Bend
The most populous races in Coats Bend are White / Caucasian (1,173 | 86.7%), Black / African American (175 | 12.9%), and Two or more Races (5 | 0.4%).
| Race | # Population | % Population |
| Asian | 0 | 0.0% |
| Black / African American | 175 | 12.9% |
| Hawaiian / Pacific | 0 | 0.0% |
| Hispanic or Latino | 0 | 0.0% |
| Native / Alaskan | 0 | 0.0% |
| White / Caucasian | 1,173 | 86.7% |
| Two or more Races | 5 | 0.4% |
| Some other Race | 0 | 0.0% |
| Total | 1,353 | 100.0% |
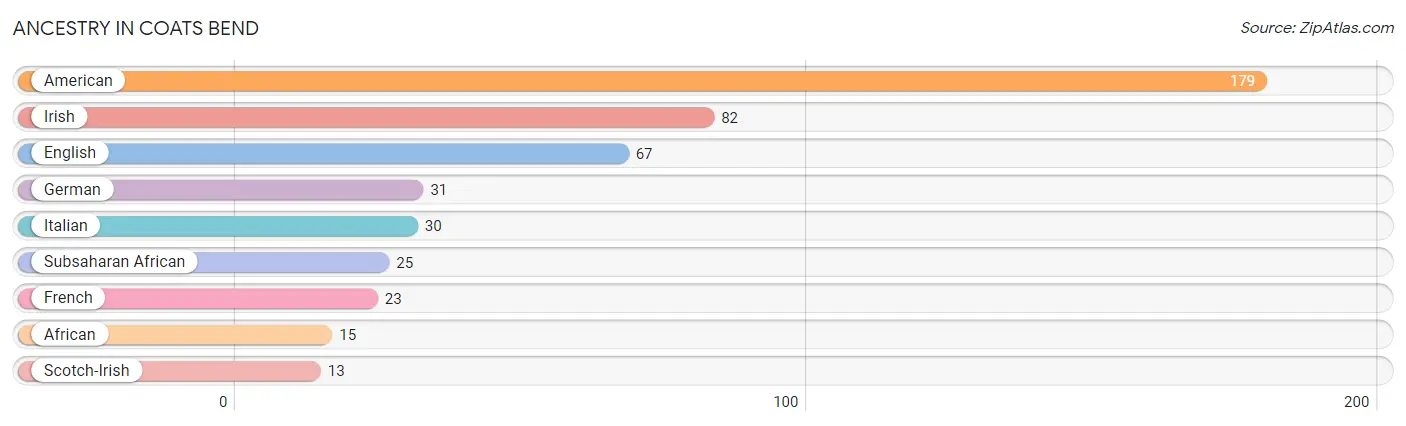
Ancestry in Coats Bend
The most populous ancestries reported in Coats Bend are American (179 | 13.2%), Irish (82 | 6.1%), English (67 | 5.0%), German (31 | 2.3%), and Italian (30 | 2.2%), together accounting for 28.7% of all Coats Bend residents.
| Ancestry | # Population | % Population |
| African | 15 | 1.1% |
| American | 179 | 13.2% |
| English | 67 | 5.0% |
| French | 23 | 1.7% |
| German | 31 | 2.3% |
| Irish | 82 | 6.1% |
| Italian | 30 | 2.2% |
| Scotch-Irish | 13 | 1.0% |
| Subsaharan African | 25 | 1.8% | View All 9 Rows |
Immigrants in Coats Bend
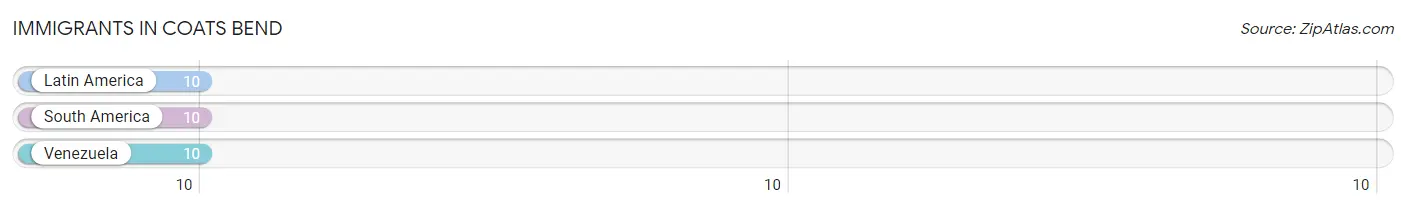
The most numerous immigrant groups reported in Coats Bend came from Latin America (10 | 0.7%), South America (10 | 0.7%), and Venezuela (10 | 0.7%), together accounting for 2.2% of all Coats Bend residents.
| Immigration Origin | # Population | % Population |
| Latin America | 10 | 0.7% |
| South America | 10 | 0.7% |
| Venezuela | 10 | 0.7% | View All 3 Rows |
Sex and Age in Coats Bend
Sex and Age in Coats Bend
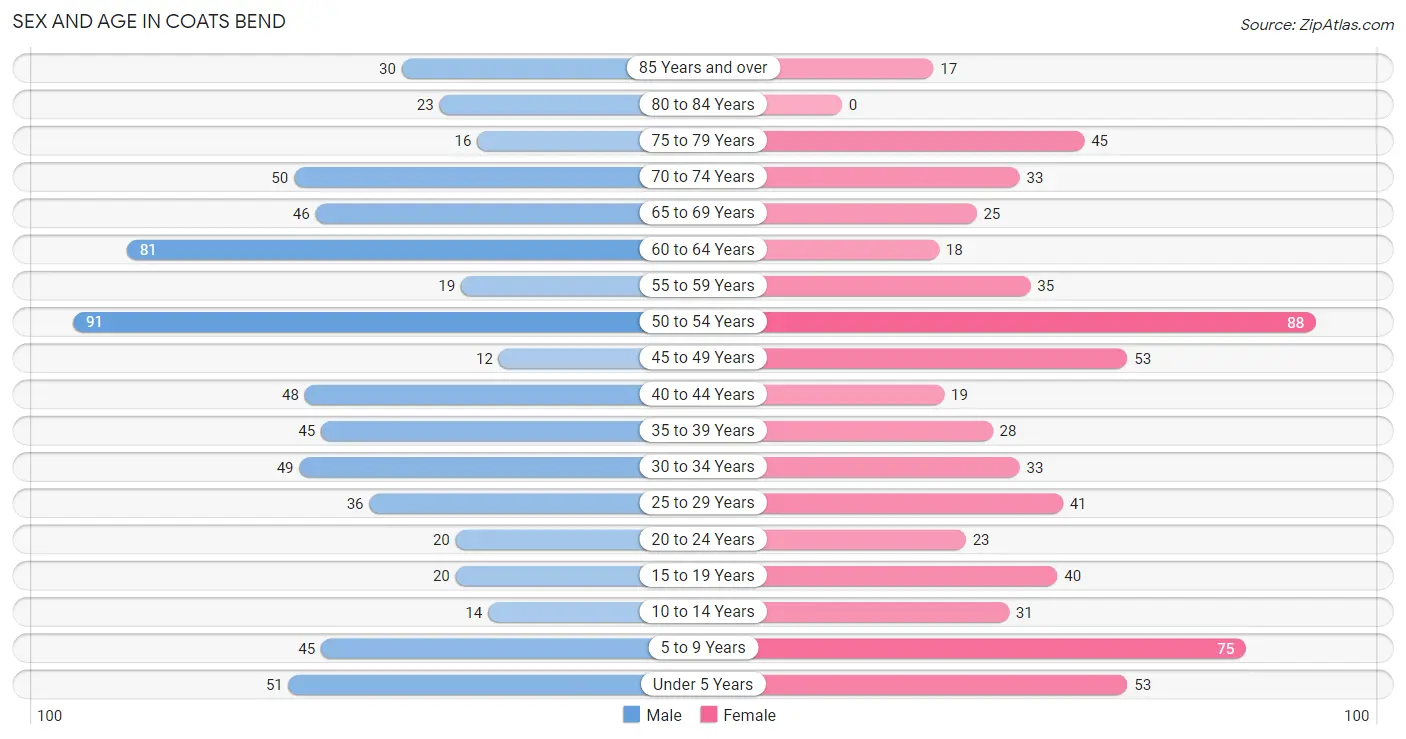
The most populous age groups in Coats Bend are 50 to 54 Years (91 | 13.1%) for men and 50 to 54 Years (88 | 13.4%) for women.
| Age Bracket | Male | Female |
| Under 5 Years | 51 (7.3%) | 53 (8.1%) |
| 5 to 9 Years | 45 (6.5%) | 75 (11.4%) |
| 10 to 14 Years | 14 (2.0%) | 31 (4.7%) |
| 15 to 19 Years | 20 (2.9%) | 40 (6.1%) |
| 20 to 24 Years | 20 (2.9%) | 23 (3.5%) |
| 25 to 29 Years | 36 (5.2%) | 41 (6.2%) |
| 30 to 34 Years | 49 (7.0%) | 33 (5.0%) |
| 35 to 39 Years | 45 (6.5%) | 28 (4.3%) |
| 40 to 44 Years | 48 (6.9%) | 19 (2.9%) |
| 45 to 49 Years | 12 (1.7%) | 53 (8.1%) |
| 50 to 54 Years | 91 (13.1%) | 88 (13.4%) |
| 55 to 59 Years | 19 (2.7%) | 35 (5.3%) |
| 60 to 64 Years | 81 (11.6%) | 18 (2.7%) |
| 65 to 69 Years | 46 (6.6%) | 25 (3.8%) |
| 70 to 74 Years | 50 (7.2%) | 33 (5.0%) |
| 75 to 79 Years | 16 (2.3%) | 45 (6.9%) |
| 80 to 84 Years | 23 (3.3%) | 0 (0.0%) |
| 85 Years and over | 30 (4.3%) | 17 (2.6%) |
| Total | 696 (100.0%) | 657 (100.0%) |
Families and Households in Coats Bend
Median Family Size in Coats Bend
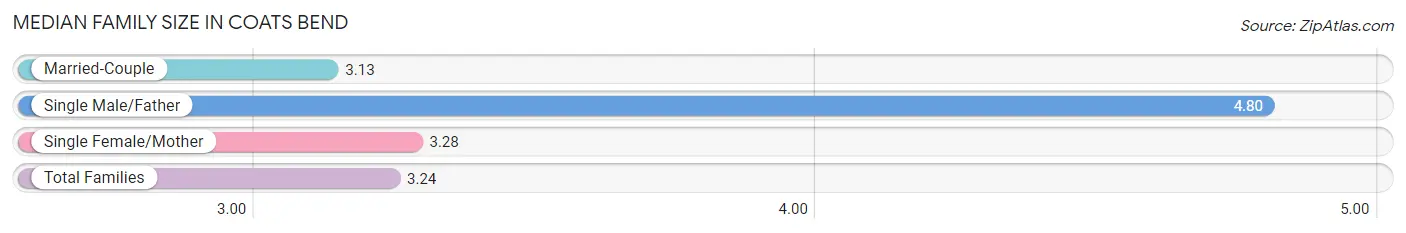
The median family size in Coats Bend is 3.24 persons per family, with single male/father families (20 | 5.7%) accounting for the largest median family size of 4.8 persons per family. On the other hand, married-couple families (292 | 83.2%) represent the smallest median family size with 3.13 persons per family.
| Family Type | # Families | Family Size |
| Married-Couple | 292 (83.2%) | 3.13 |
| Single Male/Father | 20 (5.7%) | 4.80 |
| Single Female/Mother | 39 (11.1%) | 3.28 |
| Total Families | 351 (100.0%) | 3.24 |
Median Household Size in Coats Bend
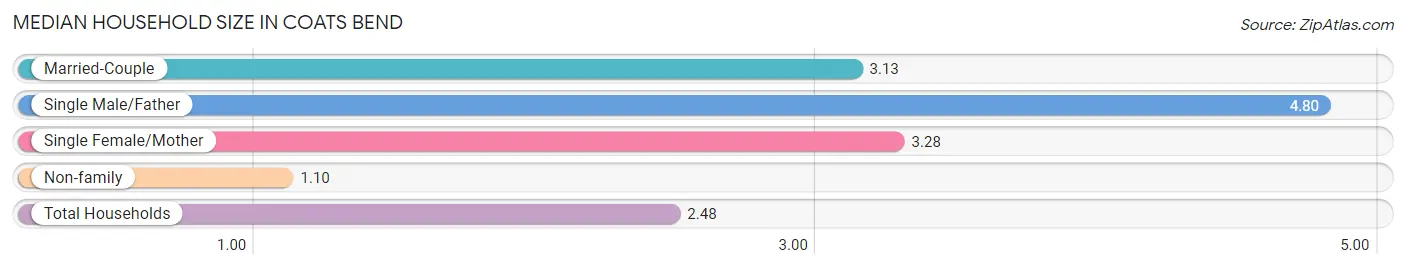
The median household size in Coats Bend is 2.48 persons per household, with single male/father households (20 | 3.7%) accounting for the largest median household size of 4.8 persons per household. non-family households (195 | 35.7%) represent the smallest median household size with 1.10 persons per household.
| Household Type | # Households | Household Size |
| Married-Couple | 292 (53.5%) | 3.13 |
| Single Male/Father | 20 (3.7%) | 4.80 |
| Single Female/Mother | 39 (7.1%) | 3.28 |
| Non-family | 195 (35.7%) | 1.10 |
| Total Households | 546 (100.0%) | 2.48 |
Household Size by Marriage Status in Coats Bend
Out of a total of 546 households in Coats Bend, 351 (64.3%) are family households, while 195 (35.7%) are nonfamily households. The most numerous type of family households are 2-person households, comprising 204, and the most common type of nonfamily households are 1-person households, comprising 185.
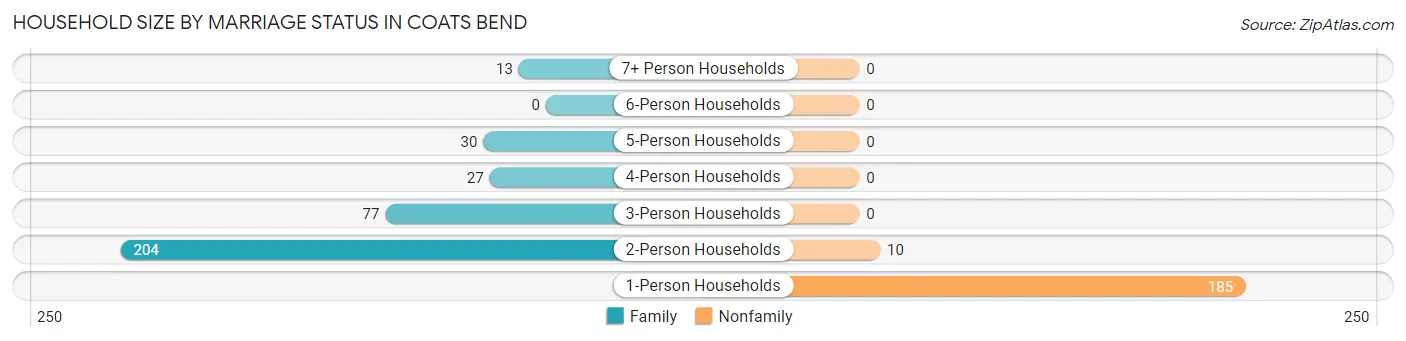
| Household Size | Family Households | Nonfamily Households |
| 1-Person Households | - | 185 (33.9%) |
| 2-Person Households | 204 (37.4%) | 10 (1.8%) |
| 3-Person Households | 77 (14.1%) | 0 (0.0%) |
| 4-Person Households | 27 (5.0%) | 0 (0.0%) |
| 5-Person Households | 30 (5.5%) | 0 (0.0%) |
| 6-Person Households | 0 (0.0%) | 0 (0.0%) |
| 7+ Person Households | 13 (2.4%) | 0 (0.0%) |
| Total | 351 (64.3%) | 195 (35.7%) |
Female Fertility in Coats Bend
Fertility by Age in Coats Bend
Average fertility rate in Coats Bend is 84.0 births per 1,000 women. Women in the age bracket of 20 to 34 years have the highest fertility rate with 237.0 births per 1,000 women. Women in the age bracket of 20 to 34 years acount for 100.0% of all women with births.
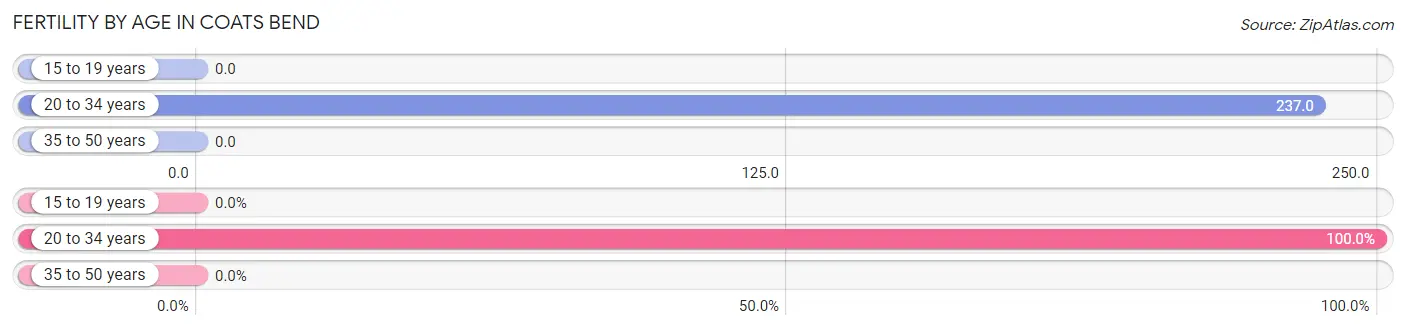
| Age Bracket | Women with Births | Births / 1,000 Women |
| 15 to 19 years | 0 (0.0%) | 0.0 |
| 20 to 34 years | 23 (100.0%) | 237.0 |
| 35 to 50 years | 0 (0.0%) | 0.0 |
| Total | 23 (100.0%) | 84.0 |
Fertility by Age by Marriage Status in Coats Bend
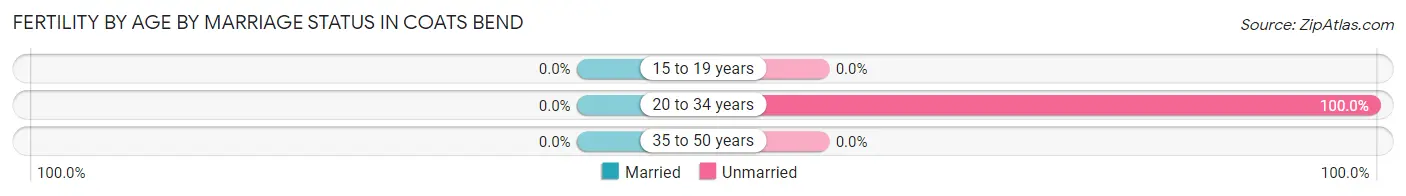
| Age Bracket | Married | Unmarried |
| 15 to 19 years | 0 (0.0%) | 0 (0.0%) |
| 20 to 34 years | 0 (0.0%) | 23 (100.0%) |
| 35 to 50 years | 0 (0.0%) | 0 (0.0%) |
| Total | 0 (0.0%) | 23 (100.0%) |
Fertility by Education in Coats Bend
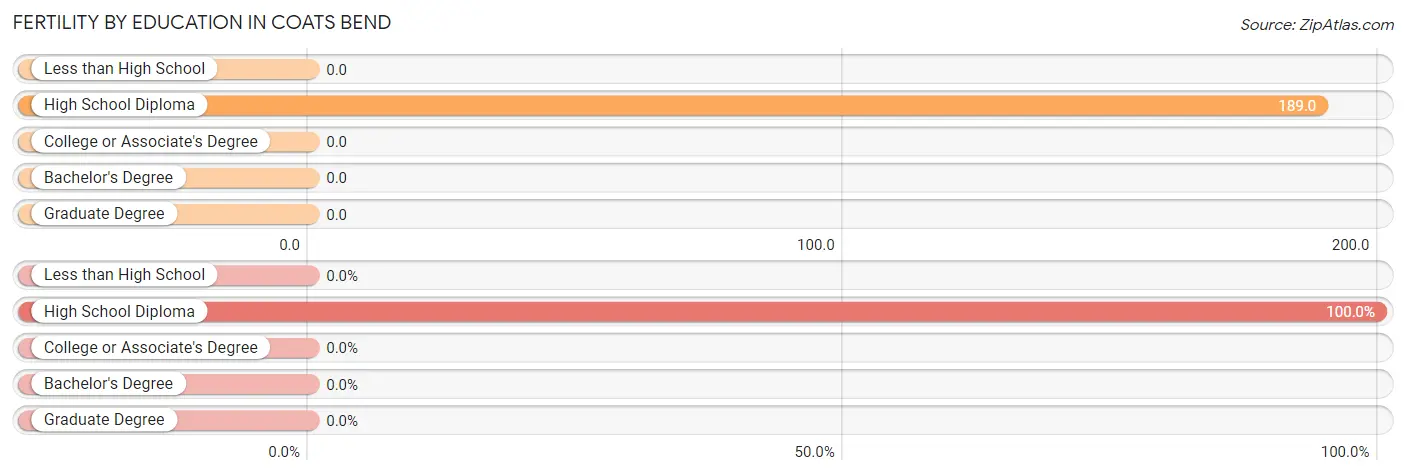
| Educational Attainment | Women with Births | Births / 1,000 Women |
| Less than High School | 0 (0.0%) | 0.0 |
| High School Diploma | 23 (100.0%) | 189.0 |
| College or Associate's Degree | 0 (0.0%) | 0.0 |
| Bachelor's Degree | 0 (0.0%) | 0.0 |
| Graduate Degree | 0 (0.0%) | 0.0 |
| Total | 23 (100.0%) | 84.0 |
Fertility by Education by Marriage Status in Coats Bend
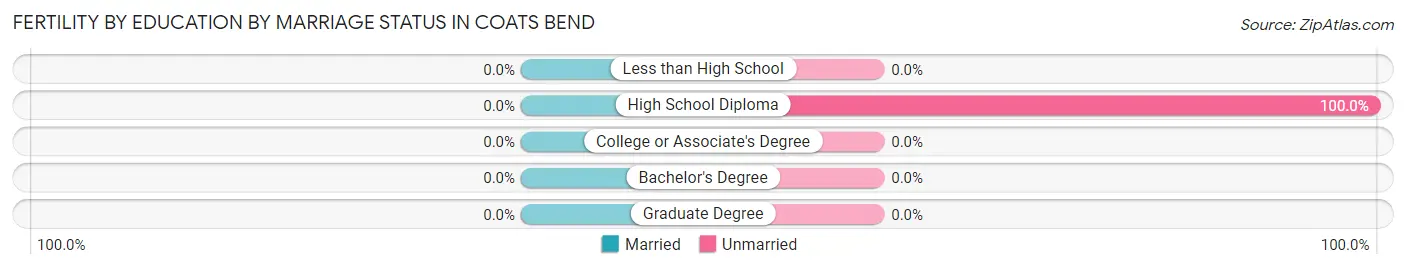
| Educational Attainment | Married | Unmarried |
| Less than High School | 0 (0.0%) | 0 (0.0%) |
| High School Diploma | 0 (0.0%) | 23 (100.0%) |
| College or Associate's Degree | 0 (0.0%) | 0 (0.0%) |
| Bachelor's Degree | 0 (0.0%) | 0 (0.0%) |
| Graduate Degree | 0 (0.0%) | 0 (0.0%) |
| Total | 0 (0.0%) | 23 (100.0%) |
Employment Characteristics in Coats Bend
Employment by Class of Employer in Coats Bend
Among the 624 employed individuals in Coats Bend, private company employees (481 | 77.1%), local government employees (57 | 9.1%), and self-employed (not incorporated) (28 | 4.5%) make up the most common classes of employment.
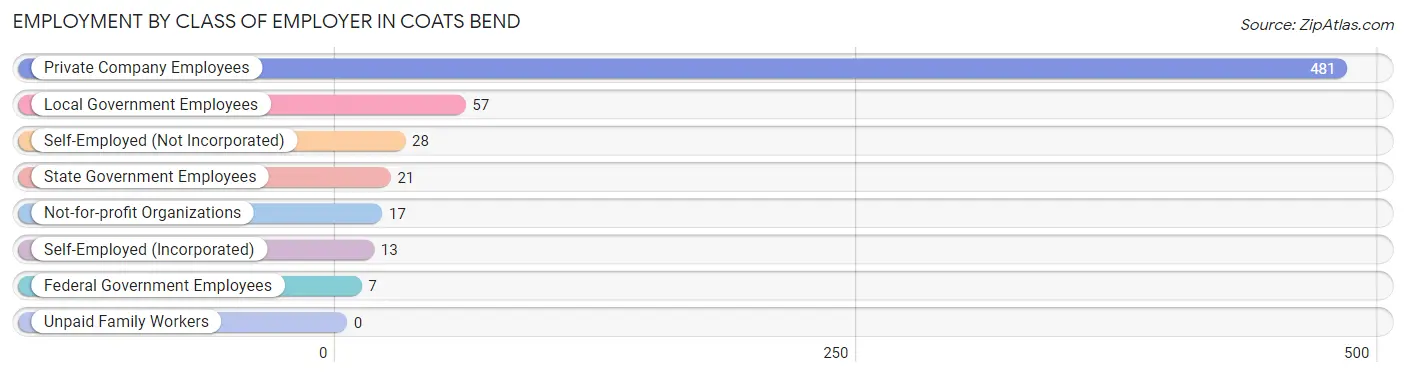
| Employer Class | # Employees | % Employees |
| Private Company Employees | 481 | 77.1% |
| Self-Employed (Incorporated) | 13 | 2.1% |
| Self-Employed (Not Incorporated) | 28 | 4.5% |
| Not-for-profit Organizations | 17 | 2.7% |
| Local Government Employees | 57 | 9.1% |
| State Government Employees | 21 | 3.4% |
| Federal Government Employees | 7 | 1.1% |
| Unpaid Family Workers | 0 | 0.0% |
| Total | 624 | 100.0% |
Employment Status by Age in Coats Bend
According to the labor force statistics for Coats Bend, out of the total population over 16 years of age (1,071), 59.9% or 642 individuals are in the labor force, with 2.3% or 15 of them unemployed. The age group with the highest labor force participation rate is 25 to 29 years, with 100.0% or 77 individuals in the labor force. Within the labor force, the 35 to 44 years age range has the highest percentage of unemployed individuals, with 11.9% or 15 of them being unemployed.
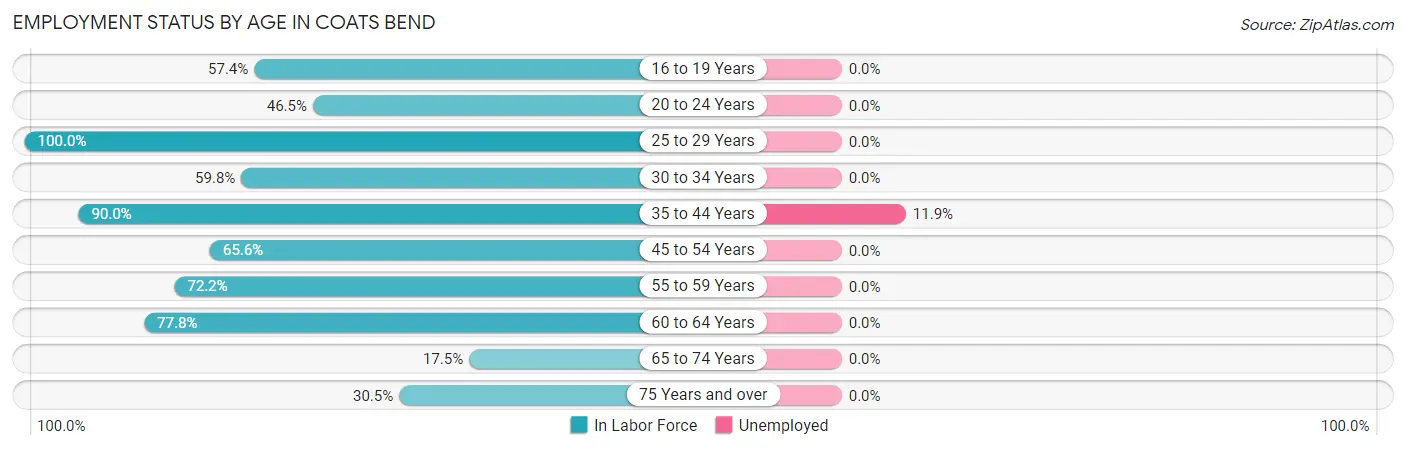
| Age Bracket | In Labor Force | Unemployed |
| 16 to 19 Years | 27 (57.4%) | 0 (0.0%) |
| 20 to 24 Years | 20 (46.5%) | 0 (0.0%) |
| 25 to 29 Years | 77 (100.0%) | 0 (0.0%) |
| 30 to 34 Years | 49 (59.8%) | 0 (0.0%) |
| 35 to 44 Years | 126 (90.0%) | 15 (11.9%) |
| 45 to 54 Years | 160 (65.6%) | 0 (0.0%) |
| 55 to 59 Years | 39 (72.2%) | 0 (0.0%) |
| 60 to 64 Years | 77 (77.8%) | 0 (0.0%) |
| 65 to 74 Years | 27 (17.5%) | 0 (0.0%) |
| 75 Years and over | 40 (30.5%) | 0 (0.0%) |
| Total | 642 (59.9%) | 15 (2.3%) |
Employment Status by Educational Attainment in Coats Bend
According to labor force statistics for Coats Bend, 75.9% of individuals (528) out of the total population between 25 and 64 years of age (696) are in the labor force, with 2.8% or 15 of them being unemployed. The group with the highest labor force participation rate are those with the educational attainment of bachelor's degree or higher, with 93.6% or 131 individuals in the labor force. Within the labor force, individuals with high school diploma education have the highest percentage of unemployment, with 6.0% or 15 of them being unemployed.
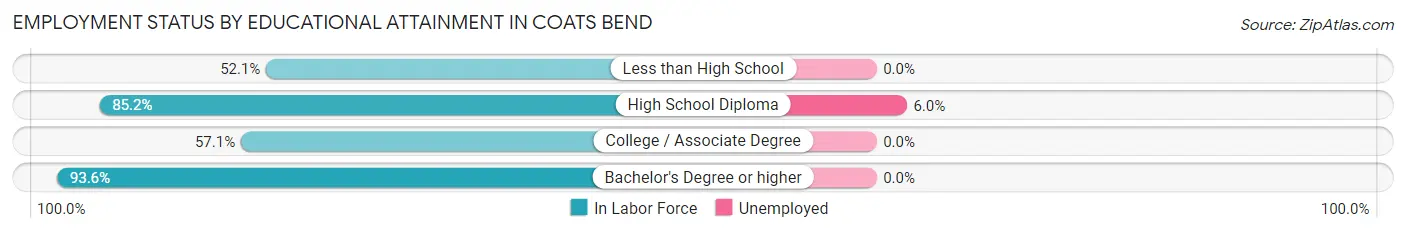
| Educational Attainment | In Labor Force | Unemployed |
| Less than High School | 25 (52.1%) | 0 (0.0%) |
| High School Diploma | 248 (85.2%) | 17 (6.0%) |
| College / Associate Degree | 124 (57.1%) | 0 (0.0%) |
| Bachelor's Degree or higher | 131 (93.6%) | 0 (0.0%) |
| Total | 528 (75.9%) | 19 (2.8%) |
Employment Occupations by Sex in Coats Bend
Management, Business, Science and Arts Occupations
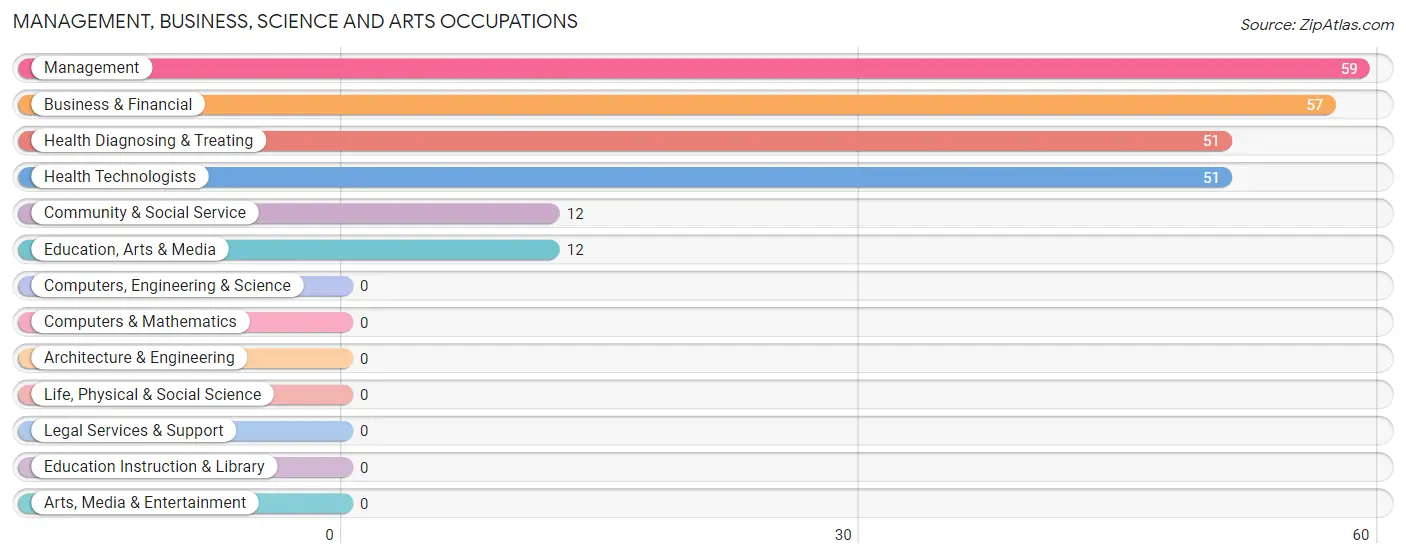
The most common Management, Business, Science and Arts occupations in Coats Bend are Management (59 | 9.4%), Business & Financial (57 | 9.1%), Health Diagnosing & Treating (51 | 8.1%), Health Technologists (51 | 8.1%), and Community & Social Service (12 | 1.9%).
Management, Business, Science and Arts Occupations by Sex
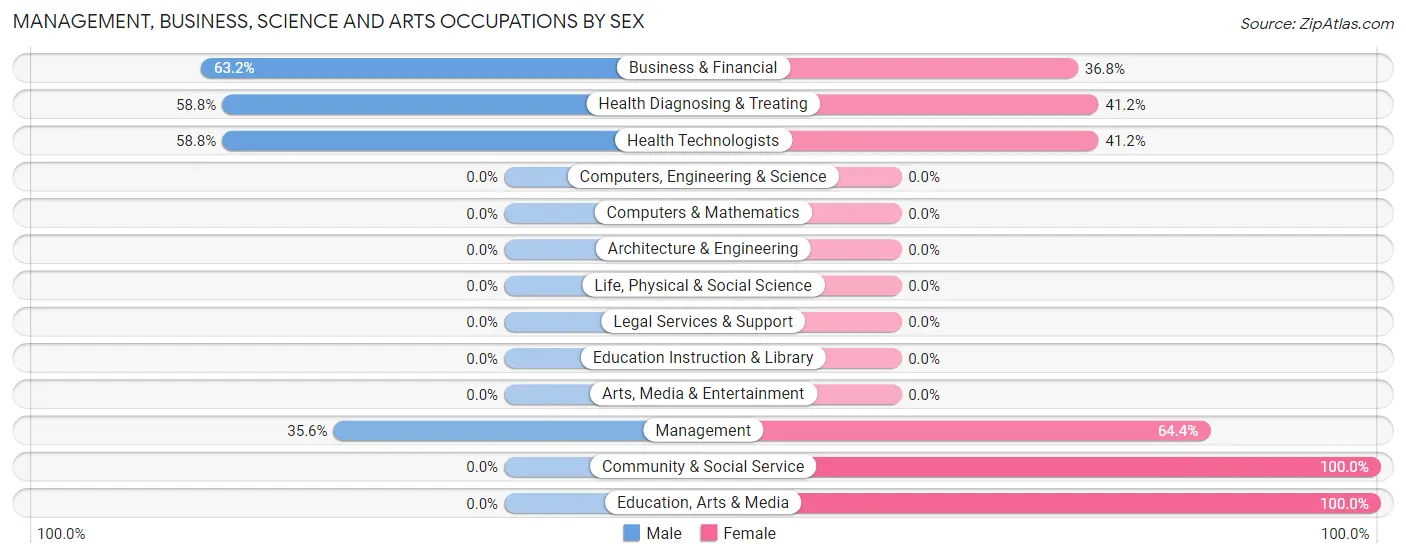
Within the Management, Business, Science and Arts occupations in Coats Bend, the most male-oriented occupations are Business & Financial (63.2%), Health Diagnosing & Treating (58.8%), and Health Technologists (58.8%), while the most female-oriented occupations are Community & Social Service (100.0%), Education, Arts & Media (100.0%), and Management (64.4%).
| Occupation | Male | Female |
| Management | 21 (35.6%) | 38 (64.4%) |
| Business & Financial | 36 (63.2%) | 21 (36.8%) |
| Computers, Engineering & Science | 0 (0.0%) | 0 (0.0%) |
| Computers & Mathematics | 0 (0.0%) | 0 (0.0%) |
| Architecture & Engineering | 0 (0.0%) | 0 (0.0%) |
| Life, Physical & Social Science | 0 (0.0%) | 0 (0.0%) |
| Community & Social Service | 0 (0.0%) | 12 (100.0%) |
| Education, Arts & Media | 0 (0.0%) | 12 (100.0%) |
| Legal Services & Support | 0 (0.0%) | 0 (0.0%) |
| Education Instruction & Library | 0 (0.0%) | 0 (0.0%) |
| Arts, Media & Entertainment | 0 (0.0%) | 0 (0.0%) |
| Health Diagnosing & Treating | 30 (58.8%) | 21 (41.2%) |
| Health Technologists | 30 (58.8%) | 21 (41.2%) |
| Total (Category) | 87 (48.6%) | 92 (51.4%) |
| Total (Overall) | 336 (53.6%) | 291 (46.4%) |
Services Occupations
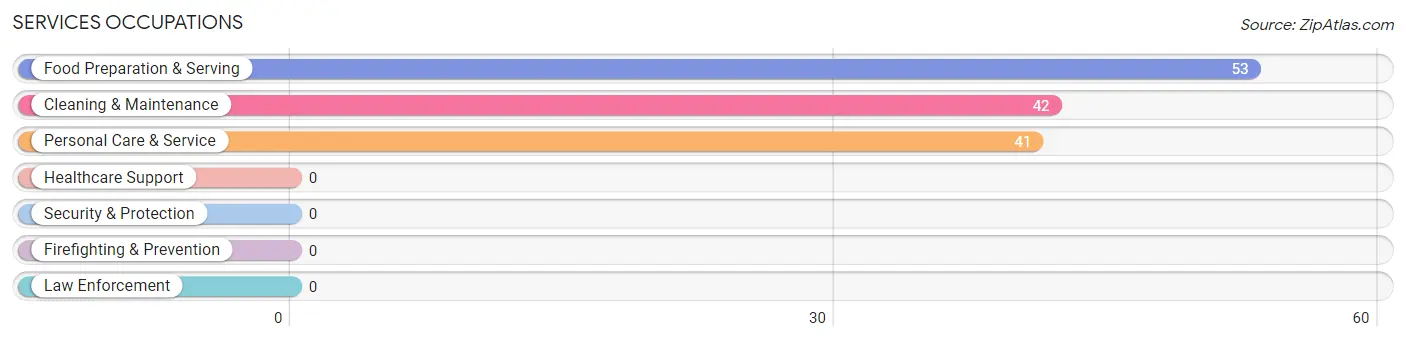
The most common Services occupations in Coats Bend are Food Preparation & Serving (53 | 8.5%), Cleaning & Maintenance (42 | 6.7%), and Personal Care & Service (41 | 6.5%).
Services Occupations by Sex
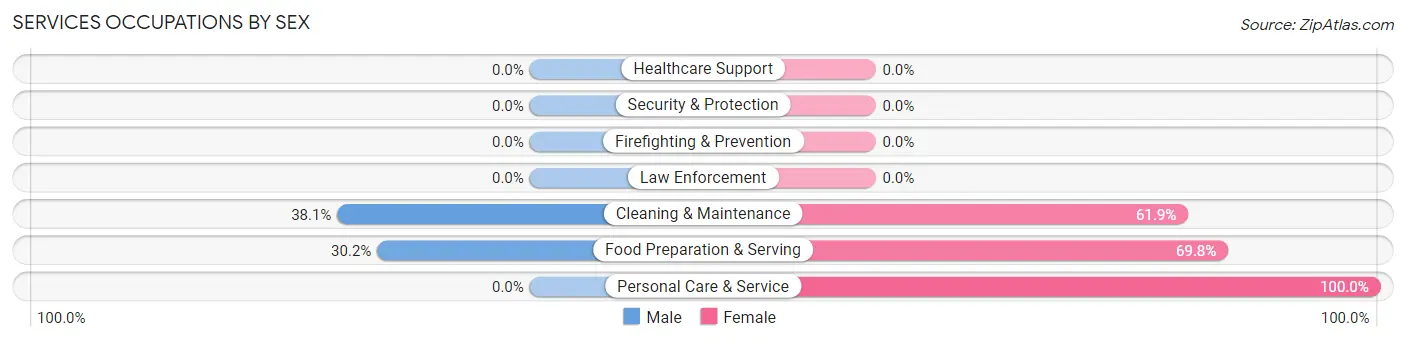
Within the Services occupations in Coats Bend, the most male-oriented occupations are Cleaning & Maintenance (38.1%), and Food Preparation & Serving (30.2%), while the most female-oriented occupations are Personal Care & Service (100.0%), Food Preparation & Serving (69.8%), and Cleaning & Maintenance (61.9%).
| Occupation | Male | Female |
| Healthcare Support | 0 (0.0%) | 0 (0.0%) |
| Security & Protection | 0 (0.0%) | 0 (0.0%) |
| Firefighting & Prevention | 0 (0.0%) | 0 (0.0%) |
| Law Enforcement | 0 (0.0%) | 0 (0.0%) |
| Food Preparation & Serving | 16 (30.2%) | 37 (69.8%) |
| Cleaning & Maintenance | 16 (38.1%) | 26 (61.9%) |
| Personal Care & Service | 0 (0.0%) | 41 (100.0%) |
| Total (Category) | 32 (23.5%) | 104 (76.5%) |
| Total (Overall) | 336 (53.6%) | 291 (46.4%) |
Sales and Office Occupations
The most common Sales and Office occupations in Coats Bend are Office & Administration (74 | 11.8%), and Sales & Related (49 | 7.8%).
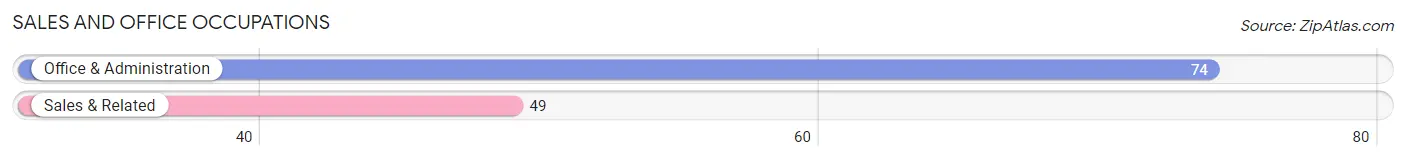
Sales and Office Occupations by Sex
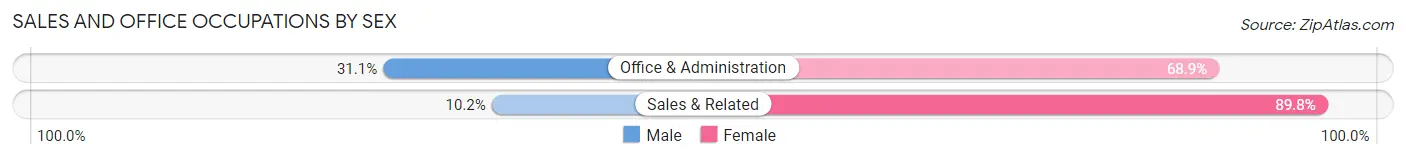
| Occupation | Male | Female |
| Sales & Related | 5 (10.2%) | 44 (89.8%) |
| Office & Administration | 23 (31.1%) | 51 (68.9%) |
| Total (Category) | 28 (22.8%) | 95 (77.2%) |
| Total (Overall) | 336 (53.6%) | 291 (46.4%) |
Natural Resources, Construction and Maintenance Occupations
The most common Natural Resources, Construction and Maintenance occupations in Coats Bend are Installation, Maintenance & Repair (40 | 6.4%), and Construction & Extraction (22 | 3.5%).
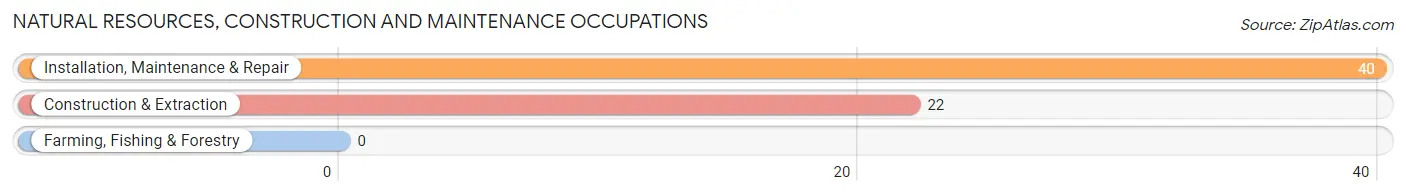
Natural Resources, Construction and Maintenance Occupations by Sex
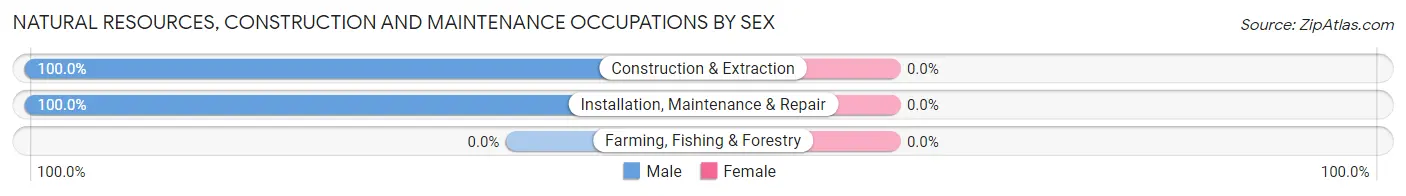
| Occupation | Male | Female |
| Farming, Fishing & Forestry | 0 (0.0%) | 0 (0.0%) |
| Construction & Extraction | 22 (100.0%) | 0 (0.0%) |
| Installation, Maintenance & Repair | 40 (100.0%) | 0 (0.0%) |
| Total (Category) | 62 (100.0%) | 0 (0.0%) |
| Total (Overall) | 336 (53.6%) | 291 (46.4%) |
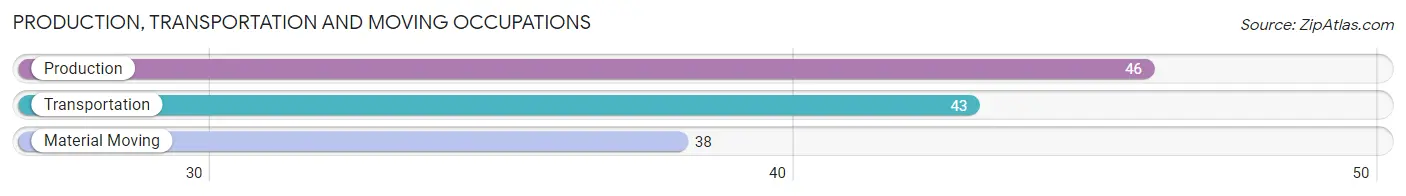
Production, Transportation and Moving Occupations
The most common Production, Transportation and Moving occupations in Coats Bend are Production (46 | 7.3%), Transportation (43 | 6.9%), and Material Moving (38 | 6.1%).
Production, Transportation and Moving Occupations by Sex
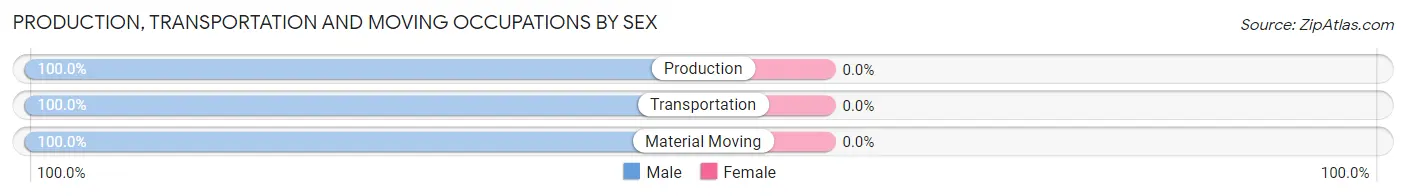
| Occupation | Male | Female |
| Production | 46 (100.0%) | 0 (0.0%) |
| Transportation | 43 (100.0%) | 0 (0.0%) |
| Material Moving | 38 (100.0%) | 0 (0.0%) |
| Total (Category) | 127 (100.0%) | 0 (0.0%) |
| Total (Overall) | 336 (53.6%) | 291 (46.4%) |
Employment Industries by Sex in Coats Bend
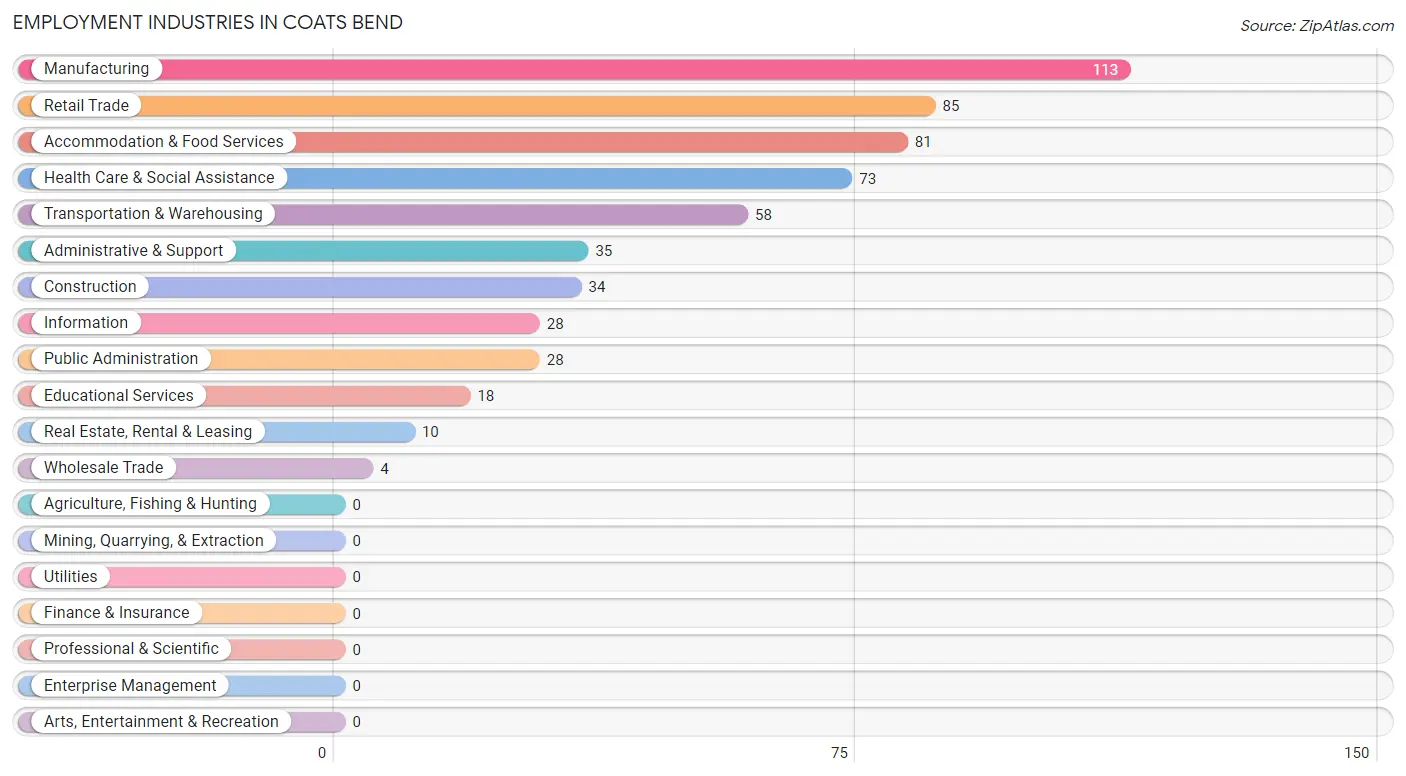
Employment Industries in Coats Bend
The major employment industries in Coats Bend include Manufacturing (113 | 18.0%), Retail Trade (85 | 13.6%), Accommodation & Food Services (81 | 12.9%), Health Care & Social Assistance (73 | 11.6%), and Transportation & Warehousing (58 | 9.2%).
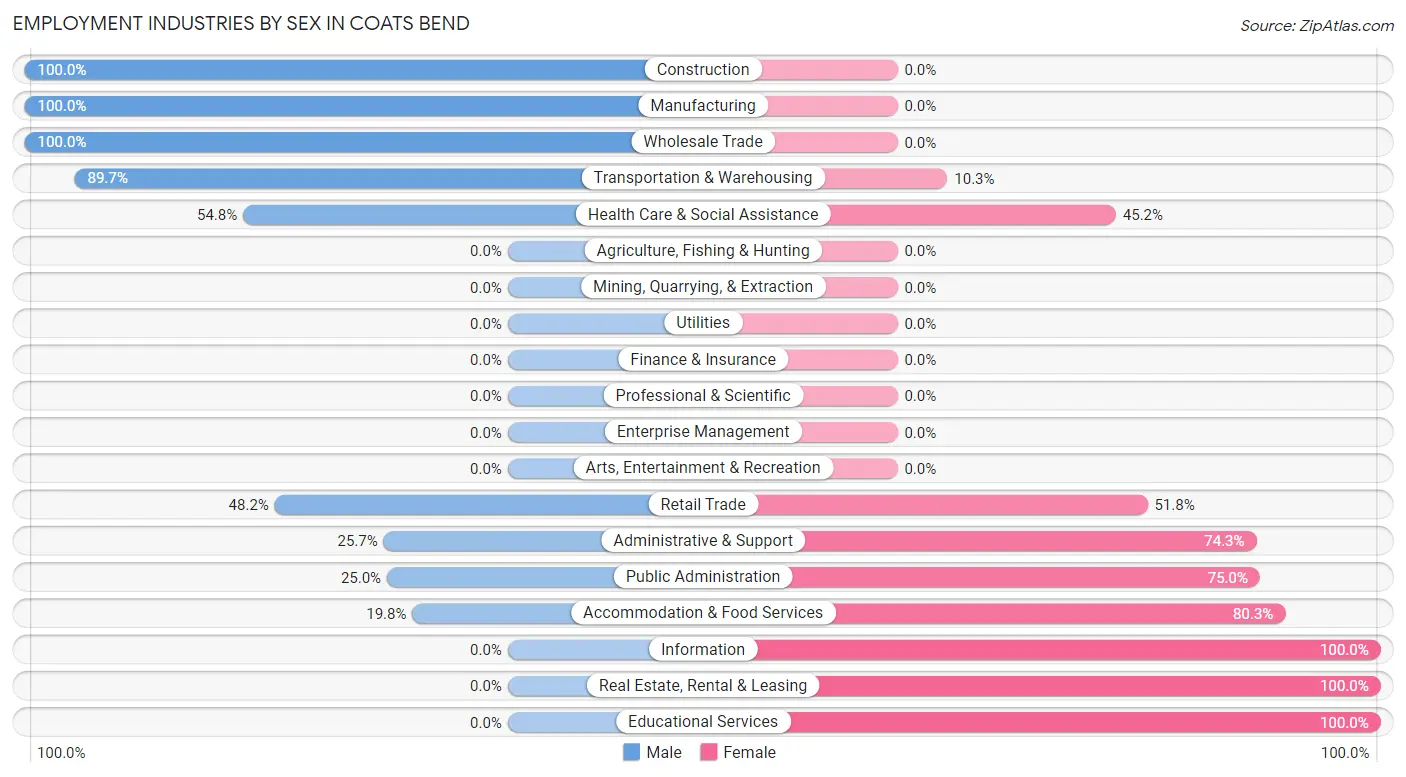
Employment Industries by Sex in Coats Bend
The Coats Bend industries that see more men than women are Construction (100.0%), Manufacturing (100.0%), and Wholesale Trade (100.0%), whereas the industries that tend to have a higher number of women are Information (100.0%), Real Estate, Rental & Leasing (100.0%), and Educational Services (100.0%).
| Industry | Male | Female |
| Agriculture, Fishing & Hunting | 0 (0.0%) | 0 (0.0%) |
| Mining, Quarrying, & Extraction | 0 (0.0%) | 0 (0.0%) |
| Construction | 34 (100.0%) | 0 (0.0%) |
| Manufacturing | 113 (100.0%) | 0 (0.0%) |
| Wholesale Trade | 4 (100.0%) | 0 (0.0%) |
| Retail Trade | 41 (48.2%) | 44 (51.8%) |
| Transportation & Warehousing | 52 (89.7%) | 6 (10.3%) |
| Utilities | 0 (0.0%) | 0 (0.0%) |
| Information | 0 (0.0%) | 28 (100.0%) |
| Finance & Insurance | 0 (0.0%) | 0 (0.0%) |
| Real Estate, Rental & Leasing | 0 (0.0%) | 10 (100.0%) |
| Professional & Scientific | 0 (0.0%) | 0 (0.0%) |
| Enterprise Management | 0 (0.0%) | 0 (0.0%) |
| Administrative & Support | 9 (25.7%) | 26 (74.3%) |
| Educational Services | 0 (0.0%) | 18 (100.0%) |
| Health Care & Social Assistance | 40 (54.8%) | 33 (45.2%) |
| Arts, Entertainment & Recreation | 0 (0.0%) | 0 (0.0%) |
| Accommodation & Food Services | 16 (19.8%) | 65 (80.2%) |
| Public Administration | 7 (25.0%) | 21 (75.0%) |
| Total | 336 (53.6%) | 291 (46.4%) |
Education in Coats Bend
School Enrollment in Coats Bend
The most common levels of schooling among the 250 students in Coats Bend are elementary school (82 | 32.8%), middle school (45 | 18.0%), and college / undergraduate (43 | 17.2%).
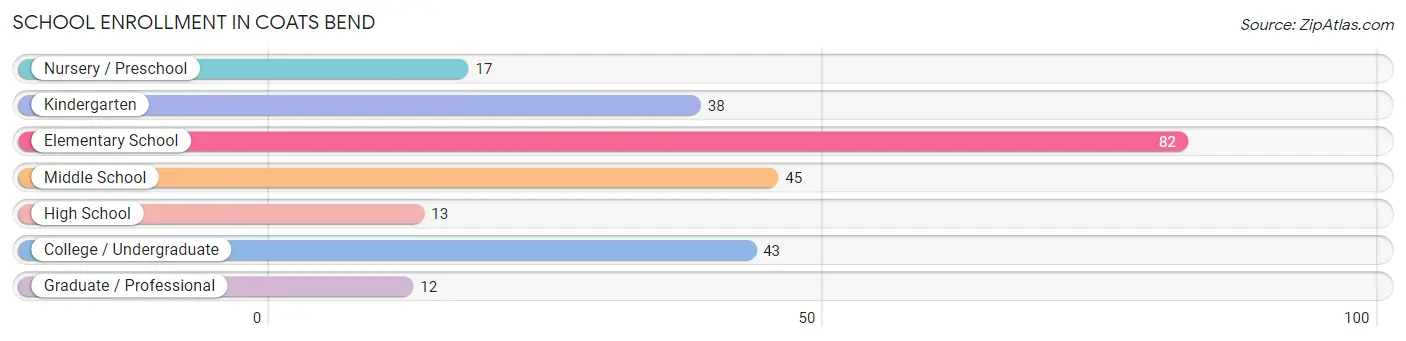
| School Level | # Students | % Students |
| Nursery / Preschool | 17 | 6.8% |
| Kindergarten | 38 | 15.2% |
| Elementary School | 82 | 32.8% |
| Middle School | 45 | 18.0% |
| High School | 13 | 5.2% |
| College / Undergraduate | 43 | 17.2% |
| Graduate / Professional | 12 | 4.8% |
| Total | 250 | 100.0% |
School Enrollment by Age by Funding Source in Coats Bend
Out of a total of 250 students who are enrolled in schools in Coats Bend, 19 (7.6%) attend a private institution, while the remaining 231 (92.4%) are enrolled in public schools. The age group of 5 to 9 year old has the highest likelihood of being enrolled in private schools, with 19 (15.8% in the age bracket) enrolled. Conversely, the age group of 3 to 4 year olds has the lowest likelihood of being enrolled in a private school, with 17 (100.0% in the age bracket) attending a public institution.
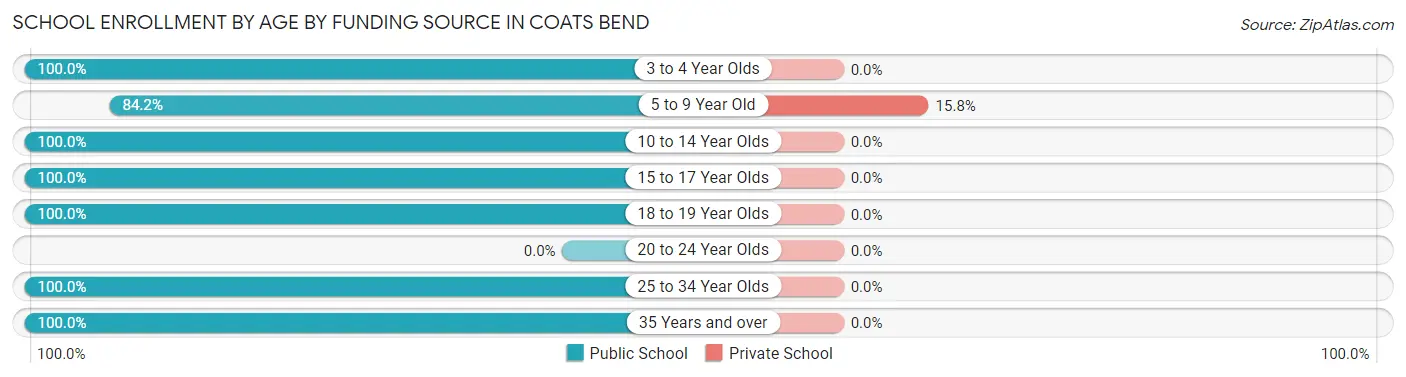
| Age Bracket | Public School | Private School |
| 3 to 4 Year Olds | 17 (100.0%) | 0 (0.0%) |
| 5 to 9 Year Old | 101 (84.2%) | 19 (15.8%) |
| 10 to 14 Year Olds | 45 (100.0%) | 0 (0.0%) |
| 15 to 17 Year Olds | 13 (100.0%) | 0 (0.0%) |
| 18 to 19 Year Olds | 37 (100.0%) | 0 (0.0%) |
| 20 to 24 Year Olds | 0 (0.0%) | 0 (0.0%) |
| 25 to 34 Year Olds | 6 (100.0%) | 0 (0.0%) |
| 35 Years and over | 12 (100.0%) | 0 (0.0%) |
| Total | 231 (92.4%) | 19 (7.6%) |
Educational Attainment by Field of Study in Coats Bend
Bio, nature & agricultural (57 | 25.5%), science & technology (51 | 22.8%), business (37 | 16.5%), physical & health sciences (36 | 16.1%), and social sciences (30 | 13.4%) are the most common fields of study among 224 individuals in Coats Bend who have obtained a bachelor's degree or higher.
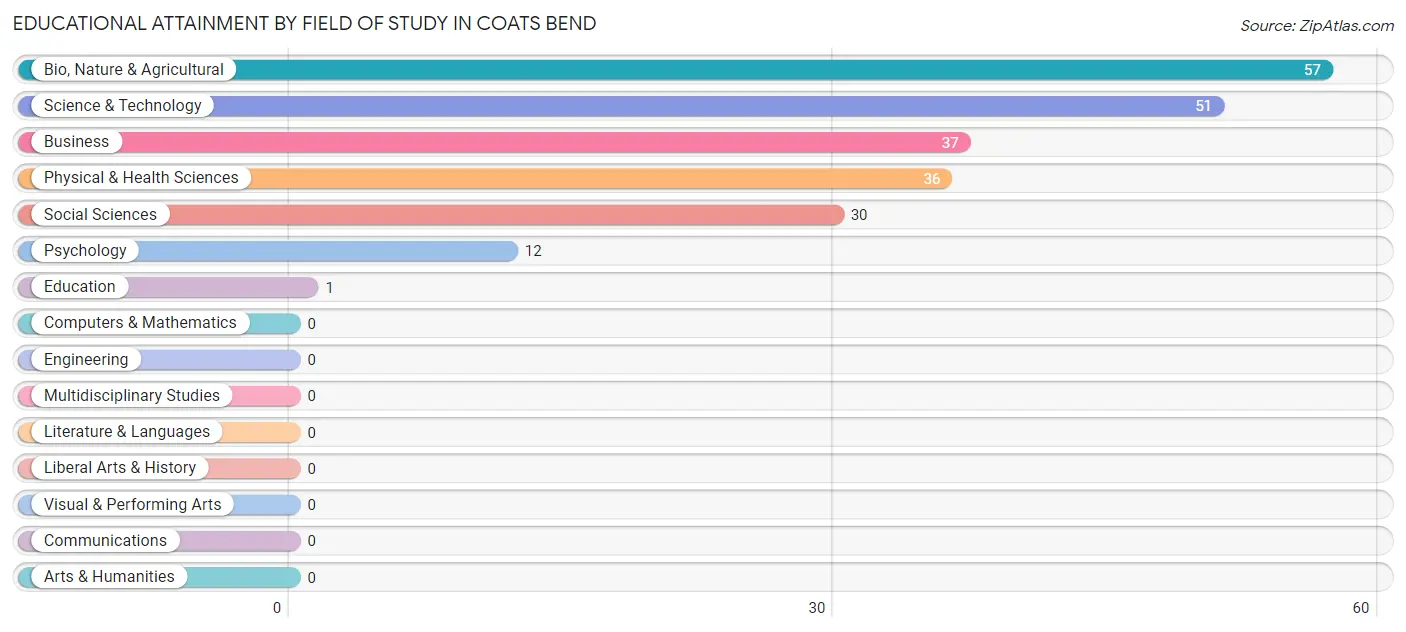
| Field of Study | # Graduates | % Graduates |
| Computers & Mathematics | 0 | 0.0% |
| Bio, Nature & Agricultural | 57 | 25.5% |
| Physical & Health Sciences | 36 | 16.1% |
| Psychology | 12 | 5.4% |
| Social Sciences | 30 | 13.4% |
| Engineering | 0 | 0.0% |
| Multidisciplinary Studies | 0 | 0.0% |
| Science & Technology | 51 | 22.8% |
| Business | 37 | 16.5% |
| Education | 1 | 0.4% |
| Literature & Languages | 0 | 0.0% |
| Liberal Arts & History | 0 | 0.0% |
| Visual & Performing Arts | 0 | 0.0% |
| Communications | 0 | 0.0% |
| Arts & Humanities | 0 | 0.0% |
| Total | 224 | 100.0% |
Transportation & Commute in Coats Bend
Vehicle Availability by Sex in Coats Bend
The most prevalent vehicle ownership categories in Coats Bend are males with 2 vehicles (131, accounting for 39.0%) and females with 2 vehicles (131, making up 45.5%).
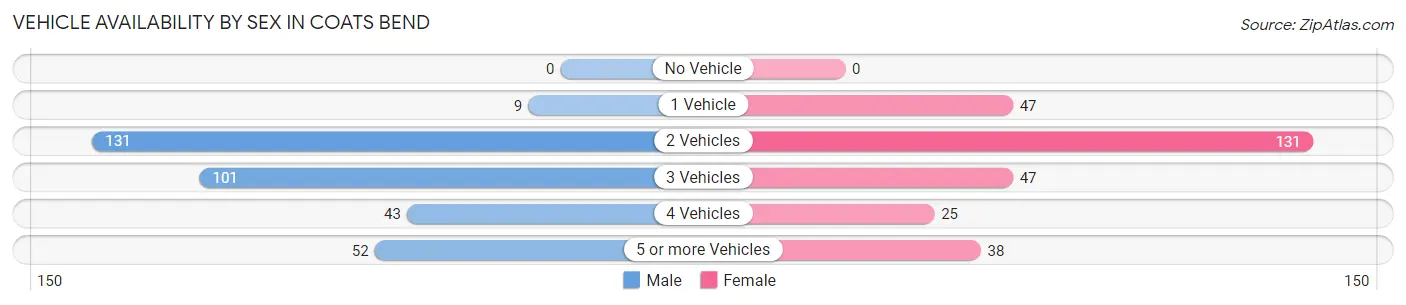
| Vehicles Available | Male | Female |
| No Vehicle | 0 (0.0%) | 0 (0.0%) |
| 1 Vehicle | 9 (2.7%) | 47 (16.3%) |
| 2 Vehicles | 131 (39.0%) | 131 (45.5%) |
| 3 Vehicles | 101 (30.1%) | 47 (16.3%) |
| 4 Vehicles | 43 (12.8%) | 25 (8.7%) |
| 5 or more Vehicles | 52 (15.5%) | 38 (13.2%) |
| Total | 336 (100.0%) | 288 (100.0%) |
Commute Time in Coats Bend
The most frequently occuring commute durations in Coats Bend are 15 to 19 minutes (165 commuters, 26.4%), 20 to 24 minutes (158 commuters, 25.3%), and 25 to 29 minutes (67 commuters, 10.7%).
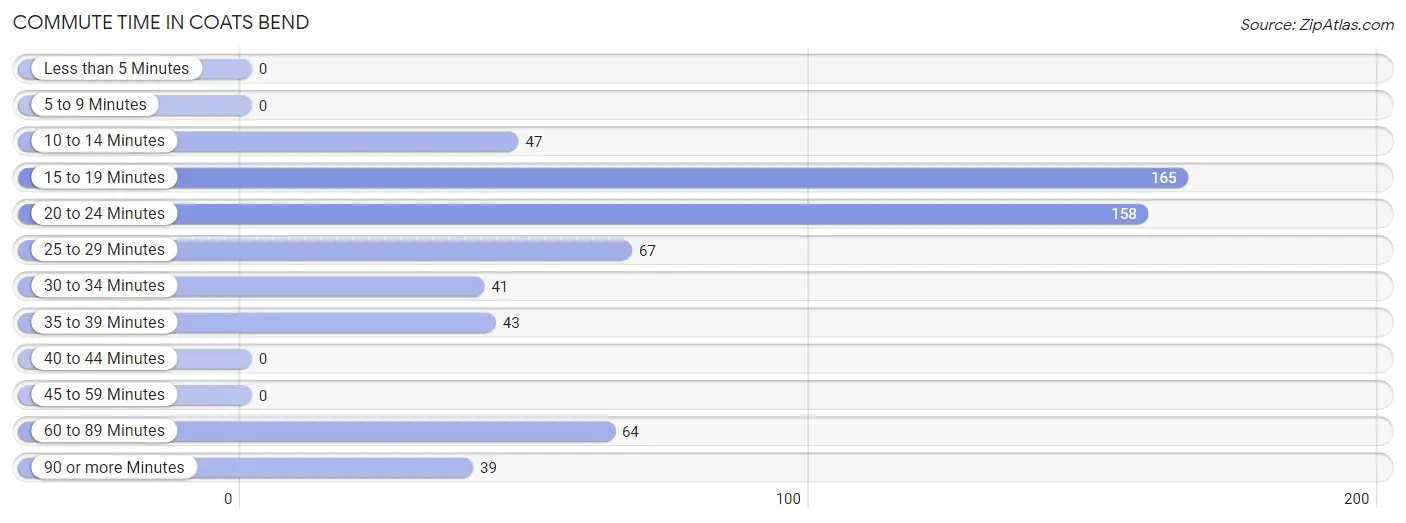
| Commute Time | # Commuters | % Commuters |
| Less than 5 Minutes | 0 | 0.0% |
| 5 to 9 Minutes | 0 | 0.0% |
| 10 to 14 Minutes | 47 | 7.5% |
| 15 to 19 Minutes | 165 | 26.4% |
| 20 to 24 Minutes | 158 | 25.3% |
| 25 to 29 Minutes | 67 | 10.7% |
| 30 to 34 Minutes | 41 | 6.6% |
| 35 to 39 Minutes | 43 | 6.9% |
| 40 to 44 Minutes | 0 | 0.0% |
| 45 to 59 Minutes | 0 | 0.0% |
| 60 to 89 Minutes | 64 | 10.3% |
| 90 or more Minutes | 39 | 6.2% |
Commute Time by Sex in Coats Bend
The most common commute times in Coats Bend are 15 to 19 minutes (88 commuters, 26.2%) for males and 20 to 24 minutes (84 commuters, 29.2%) for females.
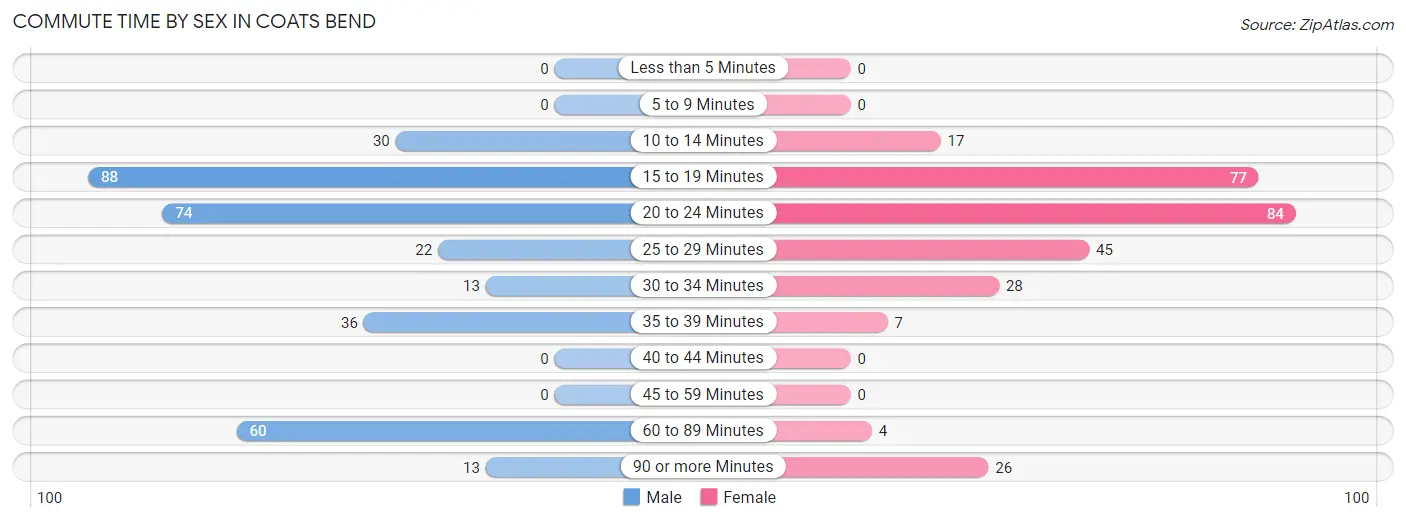
| Commute Time | Male | Female |
| Less than 5 Minutes | 0 (0.0%) | 0 (0.0%) |
| 5 to 9 Minutes | 0 (0.0%) | 0 (0.0%) |
| 10 to 14 Minutes | 30 (8.9%) | 17 (5.9%) |
| 15 to 19 Minutes | 88 (26.2%) | 77 (26.7%) |
| 20 to 24 Minutes | 74 (22.0%) | 84 (29.2%) |
| 25 to 29 Minutes | 22 (6.6%) | 45 (15.6%) |
| 30 to 34 Minutes | 13 (3.9%) | 28 (9.7%) |
| 35 to 39 Minutes | 36 (10.7%) | 7 (2.4%) |
| 40 to 44 Minutes | 0 (0.0%) | 0 (0.0%) |
| 45 to 59 Minutes | 0 (0.0%) | 0 (0.0%) |
| 60 to 89 Minutes | 60 (17.9%) | 4 (1.4%) |
| 90 or more Minutes | 13 (3.9%) | 26 (9.0%) |
Time of Departure to Work by Sex in Coats Bend
The most frequent times of departure to work in Coats Bend are 5:30 AM to 5:59 AM (110, 32.7%) for males and 7:00 AM to 7:29 AM (98, 34.0%) for females.
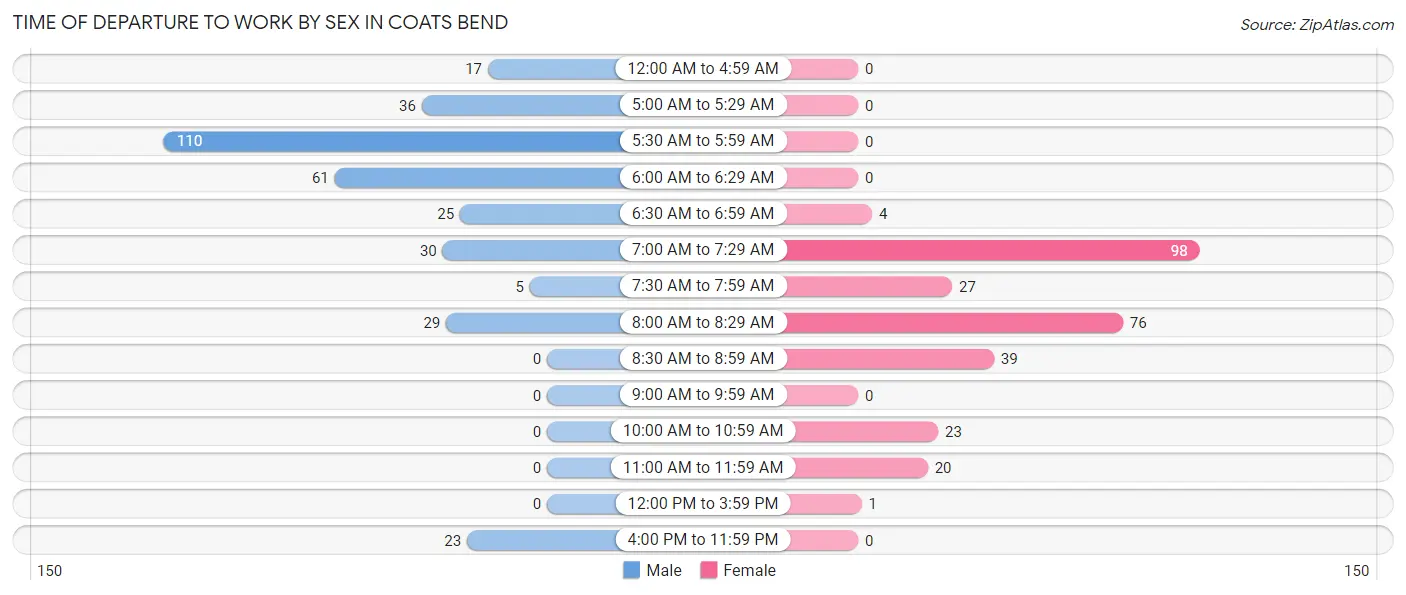
| Time of Departure | Male | Female |
| 12:00 AM to 4:59 AM | 17 (5.1%) | 0 (0.0%) |
| 5:00 AM to 5:29 AM | 36 (10.7%) | 0 (0.0%) |
| 5:30 AM to 5:59 AM | 110 (32.7%) | 0 (0.0%) |
| 6:00 AM to 6:29 AM | 61 (18.1%) | 0 (0.0%) |
| 6:30 AM to 6:59 AM | 25 (7.4%) | 4 (1.4%) |
| 7:00 AM to 7:29 AM | 30 (8.9%) | 98 (34.0%) |
| 7:30 AM to 7:59 AM | 5 (1.5%) | 27 (9.4%) |
| 8:00 AM to 8:29 AM | 29 (8.6%) | 76 (26.4%) |
| 8:30 AM to 8:59 AM | 0 (0.0%) | 39 (13.5%) |
| 9:00 AM to 9:59 AM | 0 (0.0%) | 0 (0.0%) |
| 10:00 AM to 10:59 AM | 0 (0.0%) | 23 (8.0%) |
| 11:00 AM to 11:59 AM | 0 (0.0%) | 20 (6.9%) |
| 12:00 PM to 3:59 PM | 0 (0.0%) | 1 (0.4%) |
| 4:00 PM to 11:59 PM | 23 (6.9%) | 0 (0.0%) |
| Total | 336 (100.0%) | 288 (100.0%) |
Housing Occupancy in Coats Bend
Occupancy by Ownership in Coats Bend
Of the total 546 dwellings in Coats Bend, owner-occupied units account for 457 (83.7%), while renter-occupied units make up 89 (16.3%).
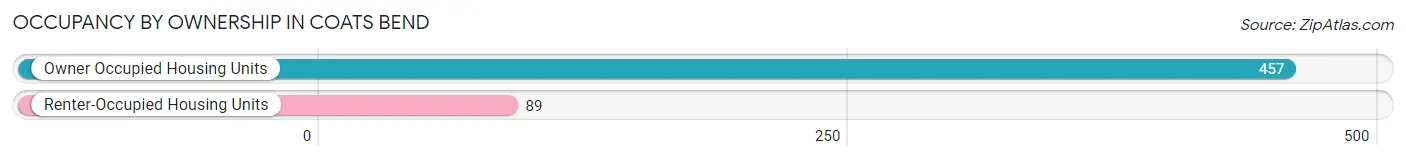
| Occupancy | # Housing Units | % Housing Units |
| Owner Occupied Housing Units | 457 | 83.7% |
| Renter-Occupied Housing Units | 89 | 16.3% |
| Total Occupied Housing Units | 546 | 100.0% |
Occupancy by Household Size in Coats Bend
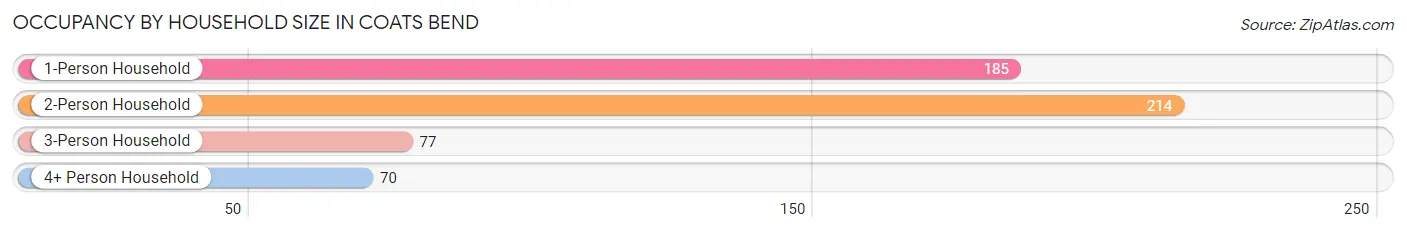
| Household Size | # Housing Units | % Housing Units |
| 1-Person Household | 185 | 33.9% |
| 2-Person Household | 214 | 39.2% |
| 3-Person Household | 77 | 14.1% |
| 4+ Person Household | 70 | 12.8% |
| Total Housing Units | 546 | 100.0% |
Occupancy by Ownership by Household Size in Coats Bend
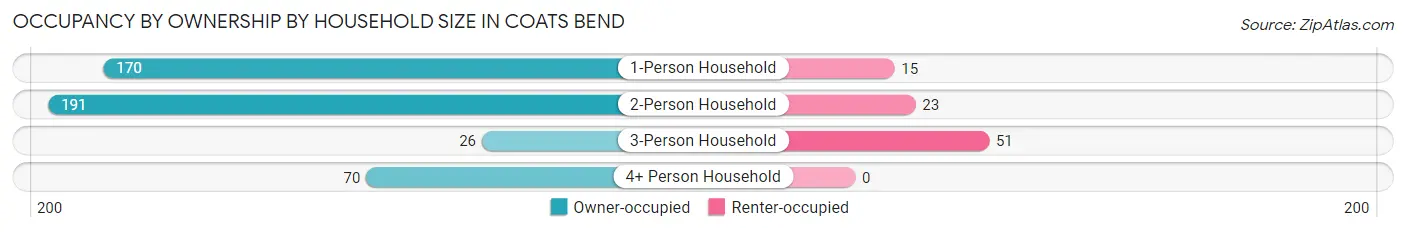
| Household Size | Owner-occupied | Renter-occupied |
| 1-Person Household | 170 (91.9%) | 15 (8.1%) |
| 2-Person Household | 191 (89.2%) | 23 (10.7%) |
| 3-Person Household | 26 (33.8%) | 51 (66.2%) |
| 4+ Person Household | 70 (100.0%) | 0 (0.0%) |
| Total Housing Units | 457 (83.7%) | 89 (16.3%) |
Occupancy by Educational Attainment in Coats Bend
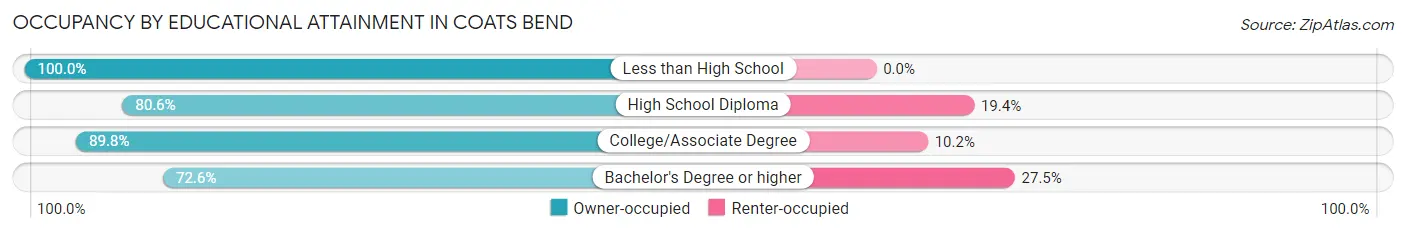
| Household Size | Owner-occupied | Renter-occupied |
| Less than High School | 23 (100.0%) | 0 (0.0%) |
| High School Diploma | 158 (80.6%) | 38 (19.4%) |
| College/Associate Degree | 202 (89.8%) | 23 (10.2%) |
| Bachelor's Degree or higher | 74 (72.6%) | 28 (27.5%) |
Occupancy by Age of Householder in Coats Bend
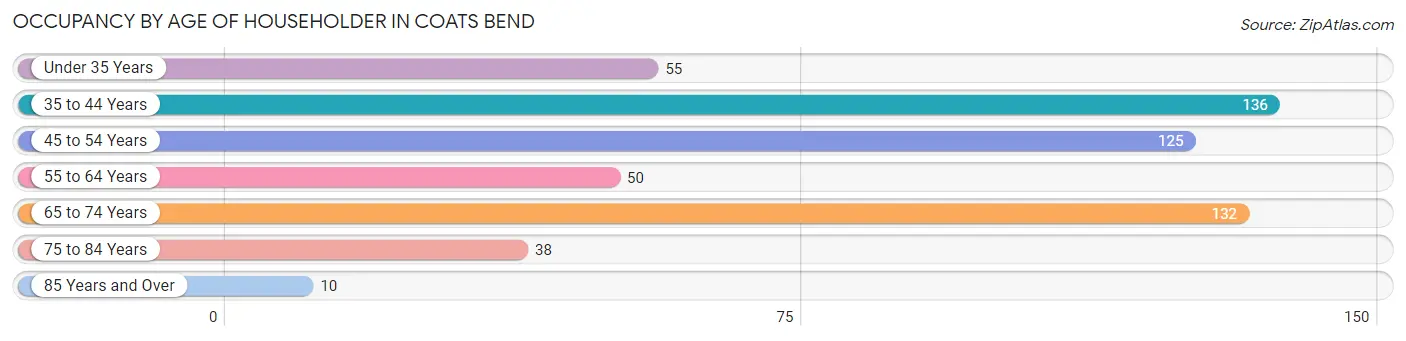
| Age Bracket | # Households | % Households |
| Under 35 Years | 55 | 10.1% |
| 35 to 44 Years | 136 | 24.9% |
| 45 to 54 Years | 125 | 22.9% |
| 55 to 64 Years | 50 | 9.2% |
| 65 to 74 Years | 132 | 24.2% |
| 75 to 84 Years | 38 | 7.0% |
| 85 Years and Over | 10 | 1.8% |
| Total | 546 | 100.0% |
Housing Finances in Coats Bend
Median Income by Occupancy in Coats Bend
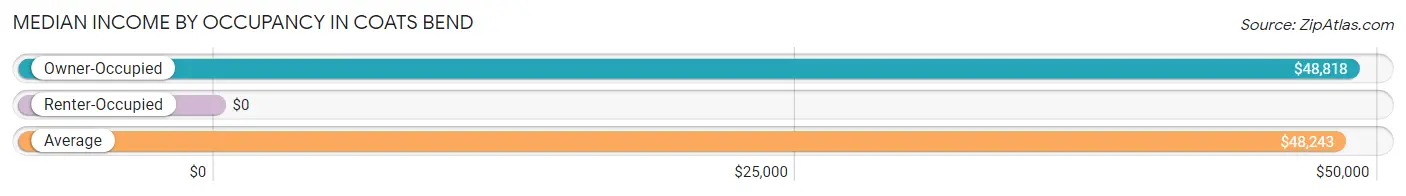
| Occupancy Type | # Households | Median Income |
| Owner-Occupied | 457 (83.7%) | $48,818 |
| Renter-Occupied | 89 (16.3%) | $0 |
| Average | 546 (100.0%) | $48,243 |
Occupancy by Householder Income Bracket in Coats Bend
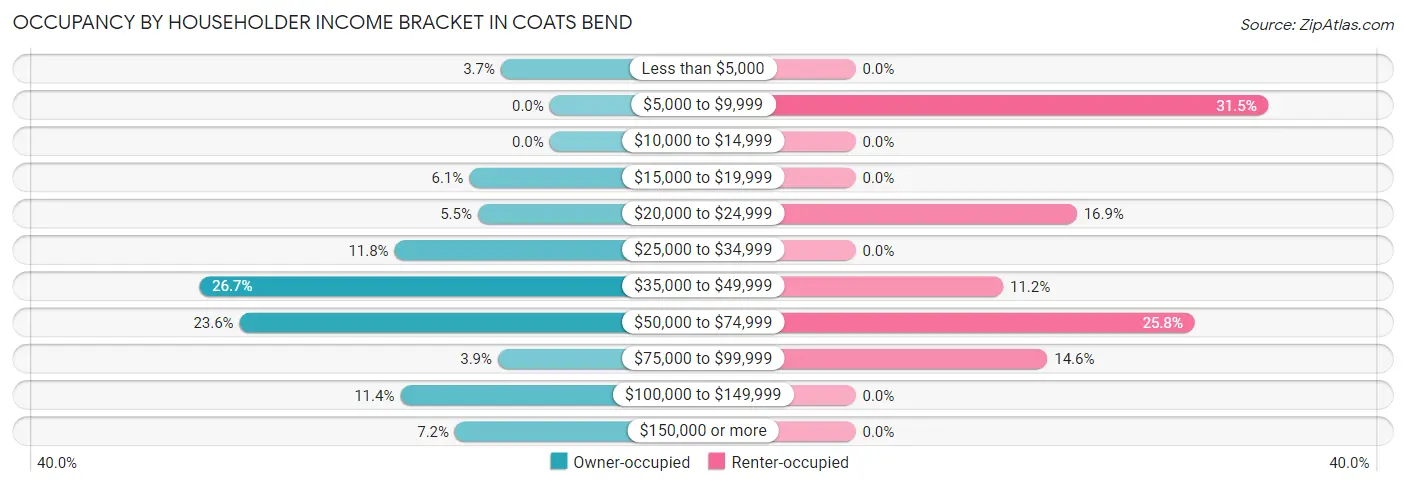
| Income Bracket | Owner-occupied | Renter-occupied |
| Less than $5,000 | 17 (3.7%) | 0 (0.0%) |
| $5,000 to $9,999 | 0 (0.0%) | 28 (31.5%) |
| $10,000 to $14,999 | 0 (0.0%) | 0 (0.0%) |
| $15,000 to $19,999 | 28 (6.1%) | 0 (0.0%) |
| $20,000 to $24,999 | 25 (5.5%) | 15 (16.9%) |
| $25,000 to $34,999 | 54 (11.8%) | 0 (0.0%) |
| $35,000 to $49,999 | 122 (26.7%) | 10 (11.2%) |
| $50,000 to $74,999 | 108 (23.6%) | 23 (25.8%) |
| $75,000 to $99,999 | 18 (3.9%) | 13 (14.6%) |
| $100,000 to $149,999 | 52 (11.4%) | 0 (0.0%) |
| $150,000 or more | 33 (7.2%) | 0 (0.0%) |
| Total | 457 (100.0%) | 89 (100.0%) |
Monthly Housing Cost Tiers in Coats Bend
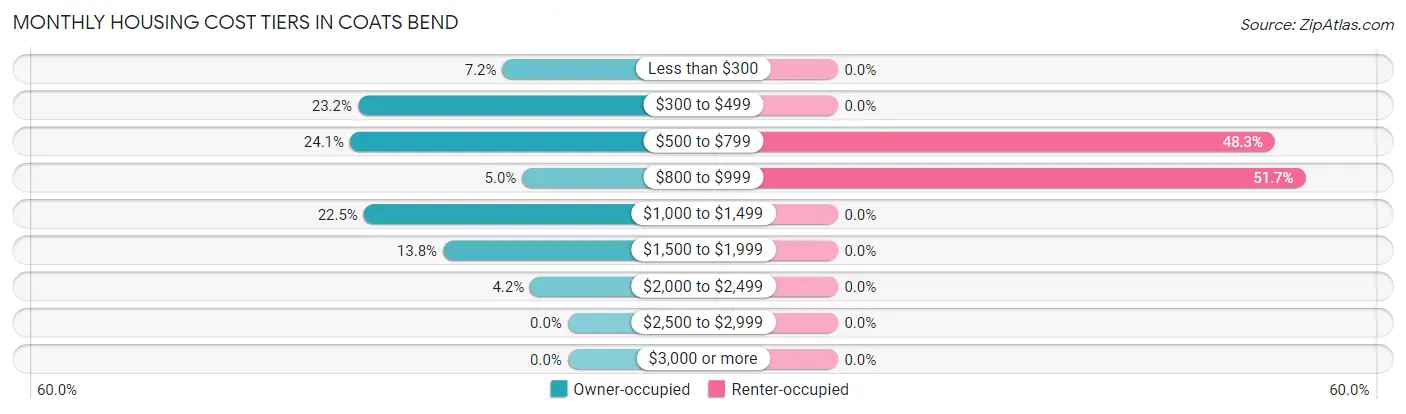
| Monthly Cost | Owner-occupied | Renter-occupied |
| Less than $300 | 33 (7.2%) | 0 (0.0%) |
| $300 to $499 | 106 (23.2%) | 0 (0.0%) |
| $500 to $799 | 110 (24.1%) | 43 (48.3%) |
| $800 to $999 | 23 (5.0%) | 46 (51.7%) |
| $1,000 to $1,499 | 103 (22.5%) | 0 (0.0%) |
| $1,500 to $1,999 | 63 (13.8%) | 0 (0.0%) |
| $2,000 to $2,499 | 19 (4.2%) | 0 (0.0%) |
| $2,500 to $2,999 | 0 (0.0%) | 0 (0.0%) |
| $3,000 or more | 0 (0.0%) | 0 (0.0%) |
| Total | 457 (100.0%) | 89 (100.0%) |
Physical Housing Characteristics in Coats Bend
Housing Structures in Coats Bend
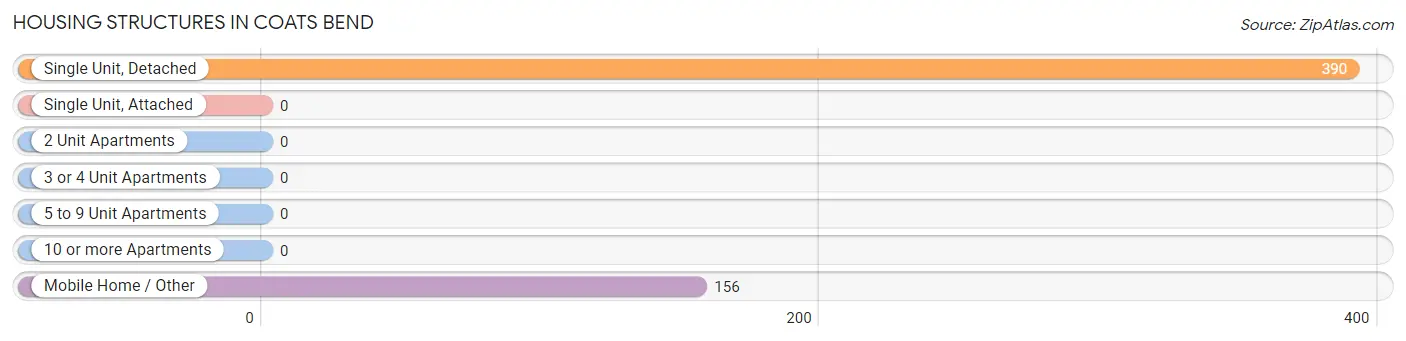
| Structure Type | # Housing Units | % Housing Units |
| Single Unit, Detached | 390 | 71.4% |
| Single Unit, Attached | 0 | 0.0% |
| 2 Unit Apartments | 0 | 0.0% |
| 3 or 4 Unit Apartments | 0 | 0.0% |
| 5 to 9 Unit Apartments | 0 | 0.0% |
| 10 or more Apartments | 0 | 0.0% |
| Mobile Home / Other | 156 | 28.6% |
| Total | 546 | 100.0% |
Housing Structures by Occupancy in Coats Bend
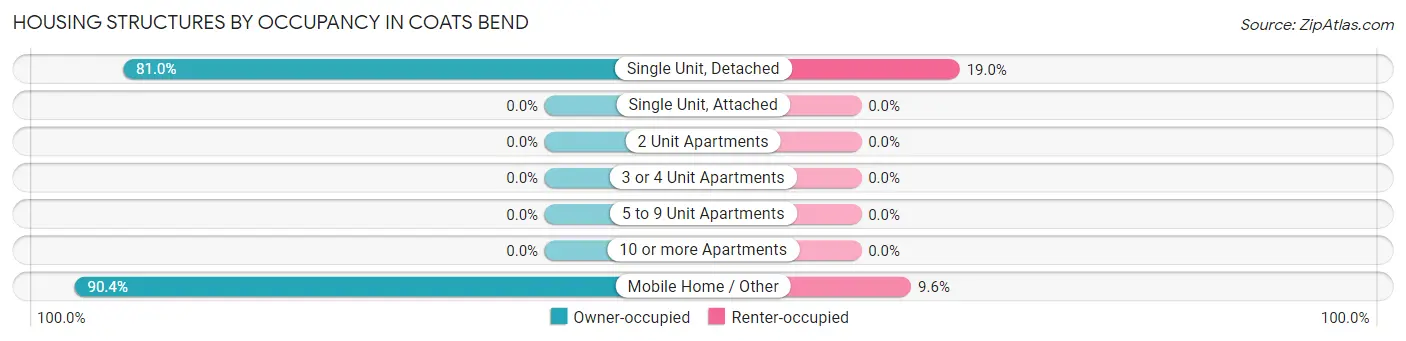
| Structure Type | Owner-occupied | Renter-occupied |
| Single Unit, Detached | 316 (81.0%) | 74 (19.0%) |
| Single Unit, Attached | 0 (0.0%) | 0 (0.0%) |
| 2 Unit Apartments | 0 (0.0%) | 0 (0.0%) |
| 3 or 4 Unit Apartments | 0 (0.0%) | 0 (0.0%) |
| 5 to 9 Unit Apartments | 0 (0.0%) | 0 (0.0%) |
| 10 or more Apartments | 0 (0.0%) | 0 (0.0%) |
| Mobile Home / Other | 141 (90.4%) | 15 (9.6%) |
| Total | 457 (83.7%) | 89 (16.3%) |
Housing Structures by Number of Rooms in Coats Bend
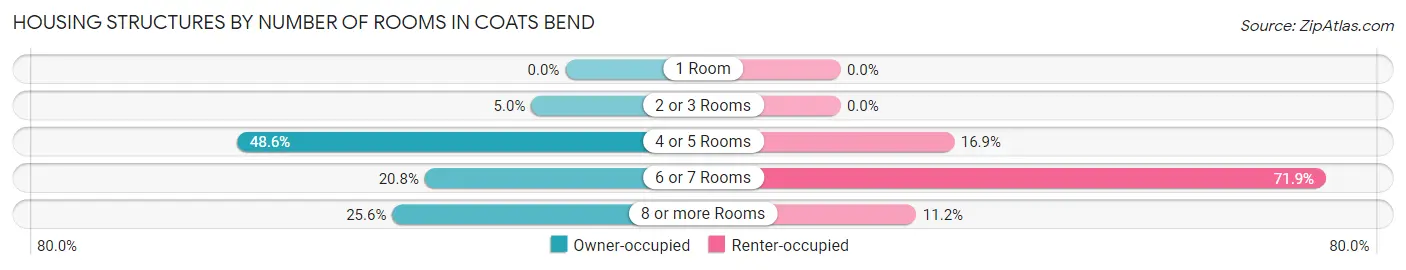
| Number of Rooms | Owner-occupied | Renter-occupied |
| 1 Room | 0 (0.0%) | 0 (0.0%) |
| 2 or 3 Rooms | 23 (5.0%) | 0 (0.0%) |
| 4 or 5 Rooms | 222 (48.6%) | 15 (16.9%) |
| 6 or 7 Rooms | 95 (20.8%) | 64 (71.9%) |
| 8 or more Rooms | 117 (25.6%) | 10 (11.2%) |
| Total | 457 (100.0%) | 89 (100.0%) |
Housing Structure by Heating Type in Coats Bend
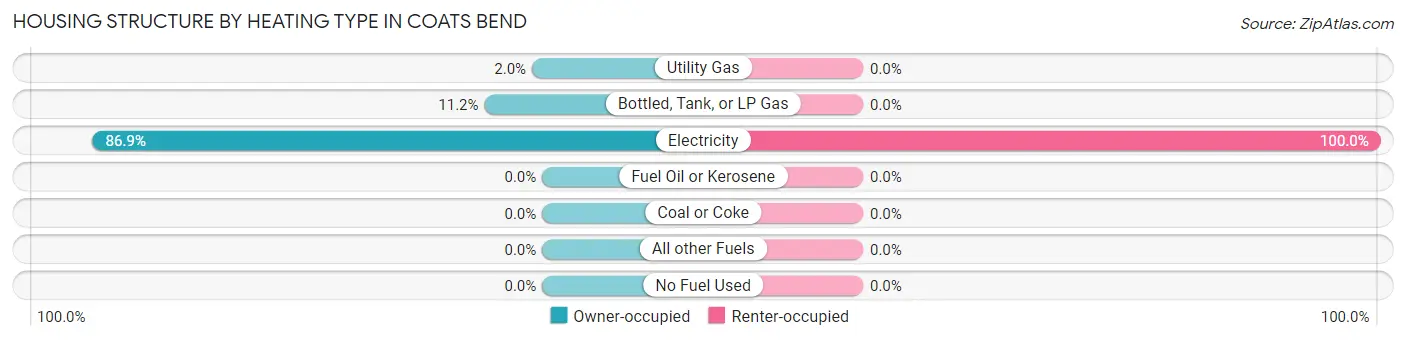
| Heating Type | Owner-occupied | Renter-occupied |
| Utility Gas | 9 (2.0%) | 0 (0.0%) |
| Bottled, Tank, or LP Gas | 51 (11.2%) | 0 (0.0%) |
| Electricity | 397 (86.9%) | 89 (100.0%) |
| Fuel Oil or Kerosene | 0 (0.0%) | 0 (0.0%) |
| Coal or Coke | 0 (0.0%) | 0 (0.0%) |
| All other Fuels | 0 (0.0%) | 0 (0.0%) |
| No Fuel Used | 0 (0.0%) | 0 (0.0%) |
| Total | 457 (100.0%) | 89 (100.0%) |
Household Vehicle Usage in Coats Bend
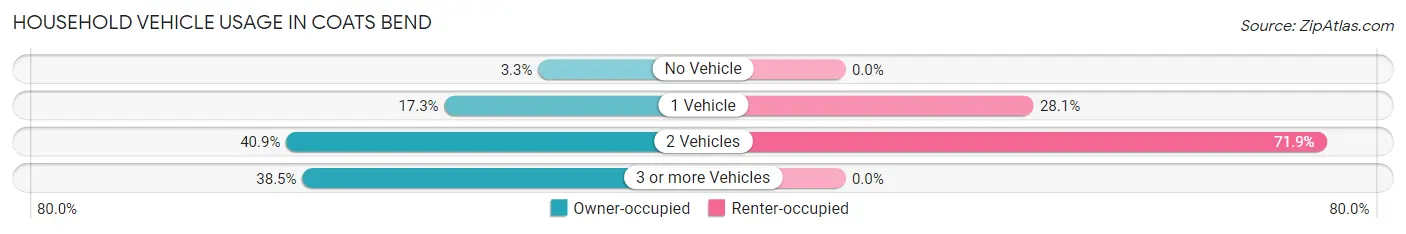
| Vehicles per Household | Owner-occupied | Renter-occupied |
| No Vehicle | 15 (3.3%) | 0 (0.0%) |
| 1 Vehicle | 79 (17.3%) | 25 (28.1%) |
| 2 Vehicles | 187 (40.9%) | 64 (71.9%) |
| 3 or more Vehicles | 176 (38.5%) | 0 (0.0%) |
| Total | 457 (100.0%) | 89 (100.0%) |
Real Estate & Mortgages in Coats Bend
Real Estate and Mortgage Overview in Coats Bend
| Characteristic | Without Mortgage | With Mortgage |
| Housing Units | 196 | 261 |
| Median Property Value | $176,600 | $124,000 |
| Median Household Income | $46,048 | $17 |
| Monthly Housing Costs | $433 | $0 |
| Real Estate Taxes | $580 | $17 |
Property Value by Mortgage Status in Coats Bend
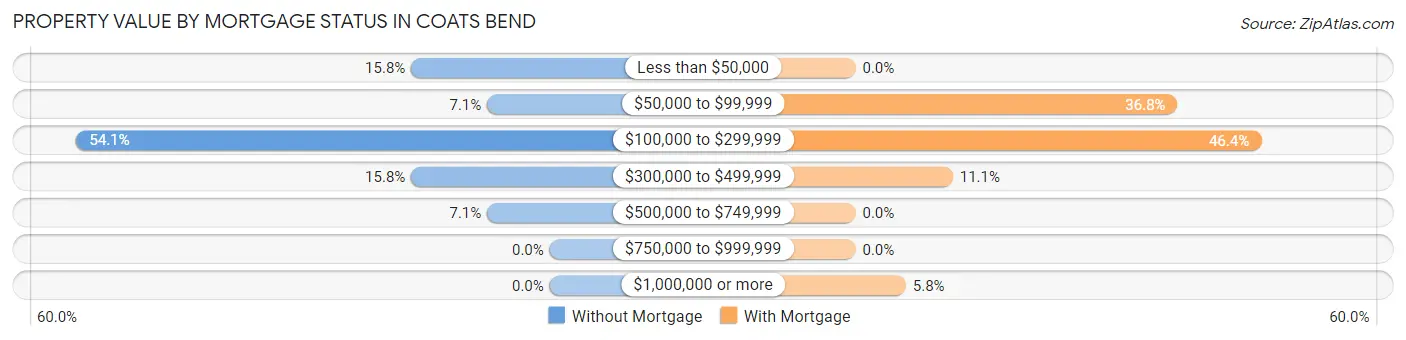
| Property Value | Without Mortgage | With Mortgage |
| Less than $50,000 | 31 (15.8%) | 0 (0.0%) |
| $50,000 to $99,999 | 14 (7.1%) | 96 (36.8%) |
| $100,000 to $299,999 | 106 (54.1%) | 121 (46.4%) |
| $300,000 to $499,999 | 31 (15.8%) | 29 (11.1%) |
| $500,000 to $749,999 | 14 (7.1%) | 0 (0.0%) |
| $750,000 to $999,999 | 0 (0.0%) | 0 (0.0%) |
| $1,000,000 or more | 0 (0.0%) | 15 (5.8%) |
| Total | 196 (100.0%) | 261 (100.0%) |
Household Income by Mortgage Status in Coats Bend
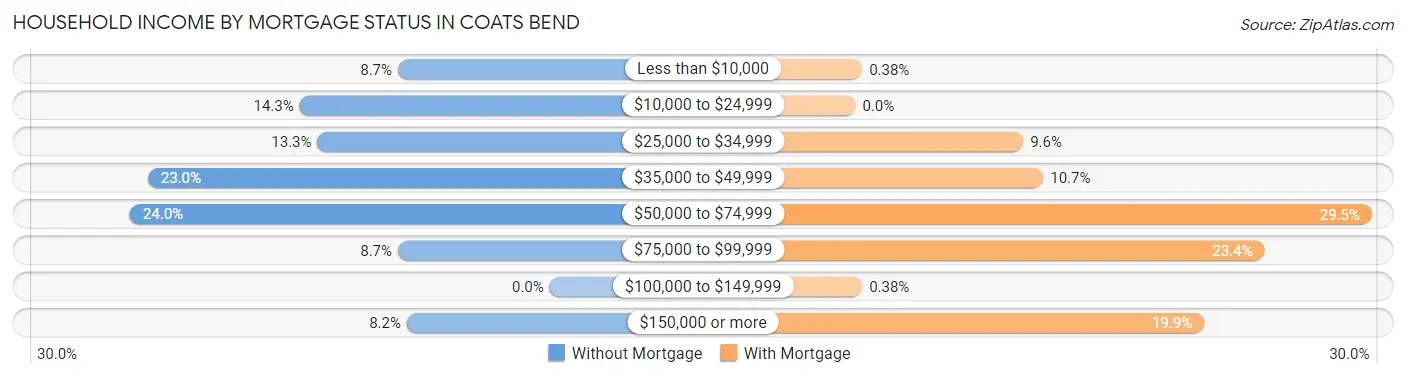
| Household Income | Without Mortgage | With Mortgage |
| Less than $10,000 | 17 (8.7%) | 1 (0.4%) |
| $10,000 to $24,999 | 28 (14.3%) | 0 (0.0%) |
| $25,000 to $34,999 | 26 (13.3%) | 25 (9.6%) |
| $35,000 to $49,999 | 45 (23.0%) | 28 (10.7%) |
| $50,000 to $74,999 | 47 (24.0%) | 77 (29.5%) |
| $75,000 to $99,999 | 17 (8.7%) | 61 (23.4%) |
| $100,000 to $149,999 | 0 (0.0%) | 1 (0.4%) |
| $150,000 or more | 16 (8.2%) | 52 (19.9%) |
| Total | 196 (100.0%) | 261 (100.0%) |
Property Value to Household Income Ratio in Coats Bend
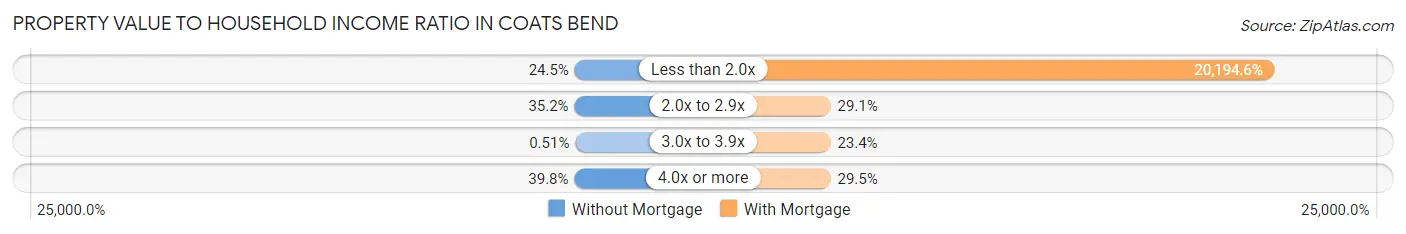
| Value-to-Income Ratio | Without Mortgage | With Mortgage |
| Less than 2.0x | 48 (24.5%) | 52,708 (20,194.6%) |
| 2.0x to 2.9x | 69 (35.2%) | 76 (29.1%) |
| 3.0x to 3.9x | 1 (0.5%) | 61 (23.4%) |
| 4.0x or more | 78 (39.8%) | 77 (29.5%) |
| Total | 196 (100.0%) | 261 (100.0%) |
Real Estate Taxes by Mortgage Status in Coats Bend
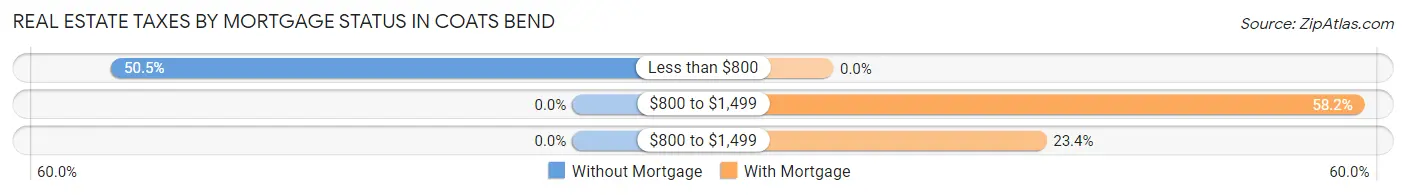
| Property Taxes | Without Mortgage | With Mortgage |
| Less than $800 | 99 (50.5%) | 0 (0.0%) |
| $800 to $1,499 | 0 (0.0%) | 152 (58.2%) |
| $800 to $1,499 | 0 (0.0%) | 61 (23.4%) |
| Total | 196 (100.0%) | 261 (100.0%) |
Health & Disability in Coats Bend
Health Insurance Coverage by Age in Coats Bend
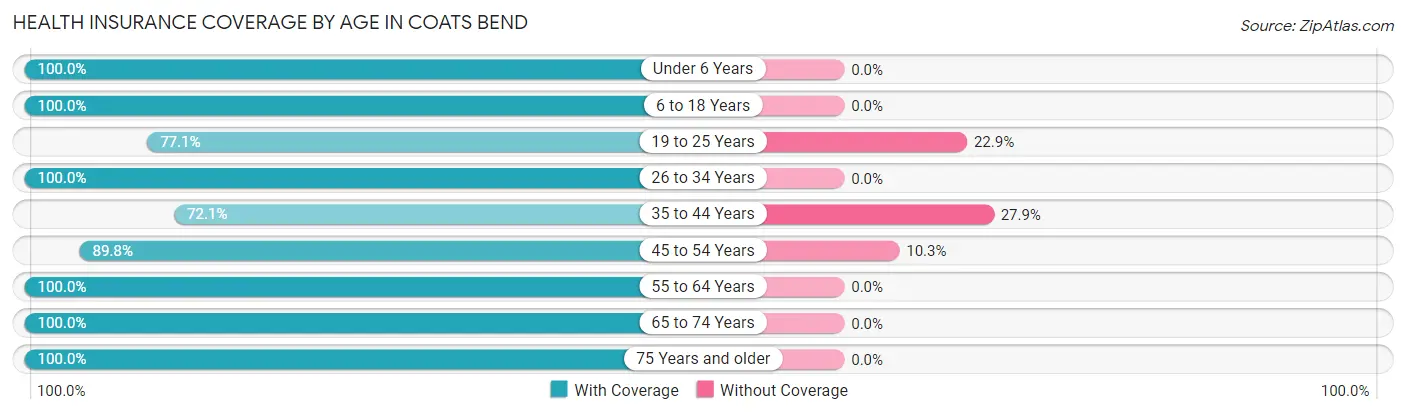
| Age Bracket | With Coverage | Without Coverage |
| Under 6 Years | 104 (100.0%) | 0 (0.0%) |
| 6 to 18 Years | 178 (100.0%) | 0 (0.0%) |
| 19 to 25 Years | 91 (77.1%) | 27 (22.9%) |
| 26 to 34 Years | 131 (100.0%) | 0 (0.0%) |
| 35 to 44 Years | 101 (72.1%) | 39 (27.9%) |
| 45 to 54 Years | 219 (89.7%) | 25 (10.2%) |
| 55 to 64 Years | 153 (100.0%) | 0 (0.0%) |
| 65 to 74 Years | 154 (100.0%) | 0 (0.0%) |
| 75 Years and older | 131 (100.0%) | 0 (0.0%) |
| Total | 1,262 (93.3%) | 91 (6.7%) |
Health Insurance Coverage by Citizenship Status in Coats Bend
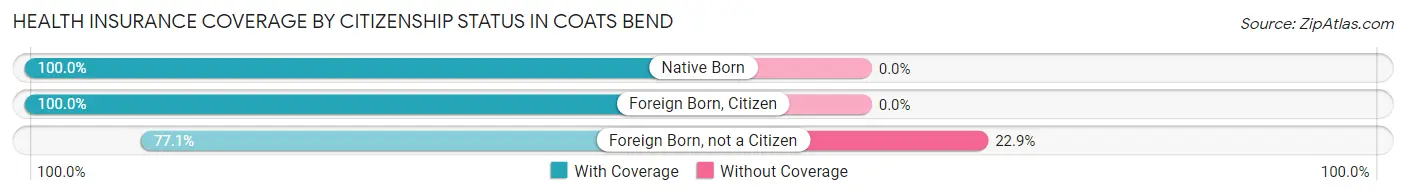
| Citizenship Status | With Coverage | Without Coverage |
| Native Born | 104 (100.0%) | 0 (0.0%) |
| Foreign Born, Citizen | 178 (100.0%) | 0 (0.0%) |
| Foreign Born, not a Citizen | 91 (77.1%) | 27 (22.9%) |
Health Insurance Coverage by Household Income in Coats Bend
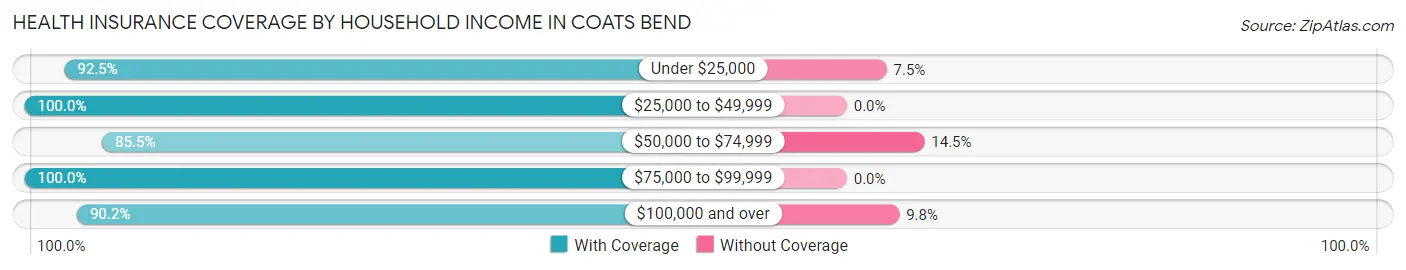
| Household Income | With Coverage | Without Coverage |
| Under $25,000 | 186 (92.5%) | 15 (7.5%) |
| $25,000 to $49,999 | 435 (100.0%) | 0 (0.0%) |
| $50,000 to $74,999 | 253 (85.5%) | 43 (14.5%) |
| $75,000 to $99,999 | 85 (100.0%) | 0 (0.0%) |
| $100,000 and over | 303 (90.2%) | 33 (9.8%) |
Public vs Private Health Insurance Coverage by Age in Coats Bend
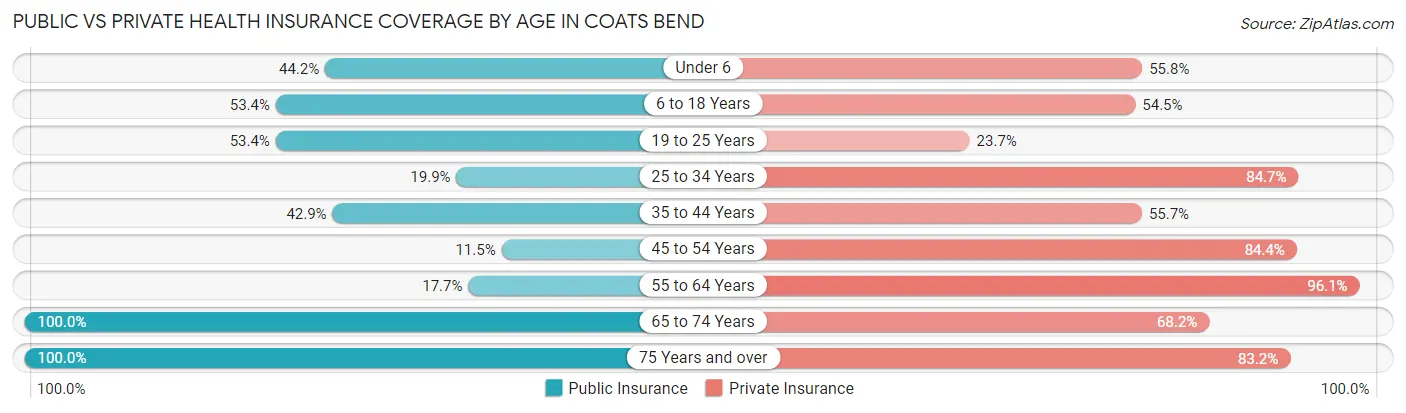
| Age Bracket | Public Insurance | Private Insurance |
| Under 6 | 46 (44.2%) | 58 (55.8%) |
| 6 to 18 Years | 95 (53.4%) | 97 (54.5%) |
| 19 to 25 Years | 63 (53.4%) | 28 (23.7%) |
| 25 to 34 Years | 26 (19.9%) | 111 (84.7%) |
| 35 to 44 Years | 60 (42.9%) | 78 (55.7%) |
| 45 to 54 Years | 28 (11.5%) | 206 (84.4%) |
| 55 to 64 Years | 27 (17.6%) | 147 (96.1%) |
| 65 to 74 Years | 154 (100.0%) | 105 (68.2%) |
| 75 Years and over | 131 (100.0%) | 109 (83.2%) |
| Total | 630 (46.6%) | 939 (69.4%) |
Disability Status by Sex by Age in Coats Bend
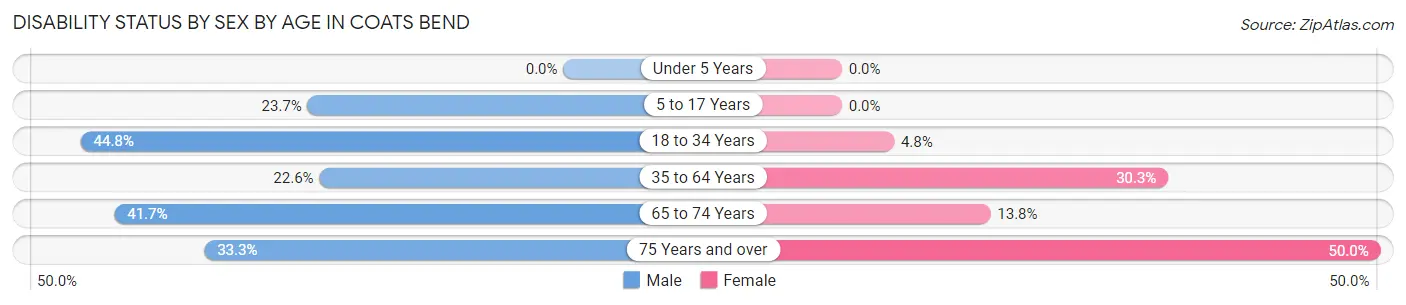
| Age Bracket | Male | Female |
| Under 5 Years | 0 (0.0%) | 0 (0.0%) |
| 5 to 17 Years | 14 (23.7%) | 0 (0.0%) |
| 18 to 34 Years | 56 (44.8%) | 6 (4.8%) |
| 35 to 64 Years | 67 (22.6%) | 73 (30.3%) |
| 65 to 74 Years | 40 (41.7%) | 8 (13.8%) |
| 75 Years and over | 23 (33.3%) | 31 (50.0%) |
Disability Class by Sex by Age in Coats Bend
Disability Class: Hearing Difficulty
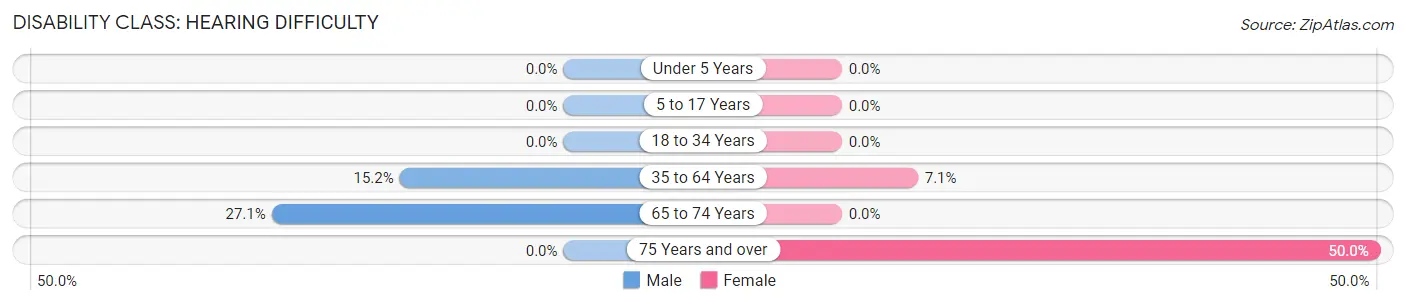
| Age Bracket | Male | Female |
| Under 5 Years | 0 (0.0%) | 0 (0.0%) |
| 5 to 17 Years | 0 (0.0%) | 0 (0.0%) |
| 18 to 34 Years | 0 (0.0%) | 0 (0.0%) |
| 35 to 64 Years | 45 (15.2%) | 17 (7.0%) |
| 65 to 74 Years | 26 (27.1%) | 0 (0.0%) |
| 75 Years and over | 0 (0.0%) | 31 (50.0%) |
Disability Class: Vision Difficulty
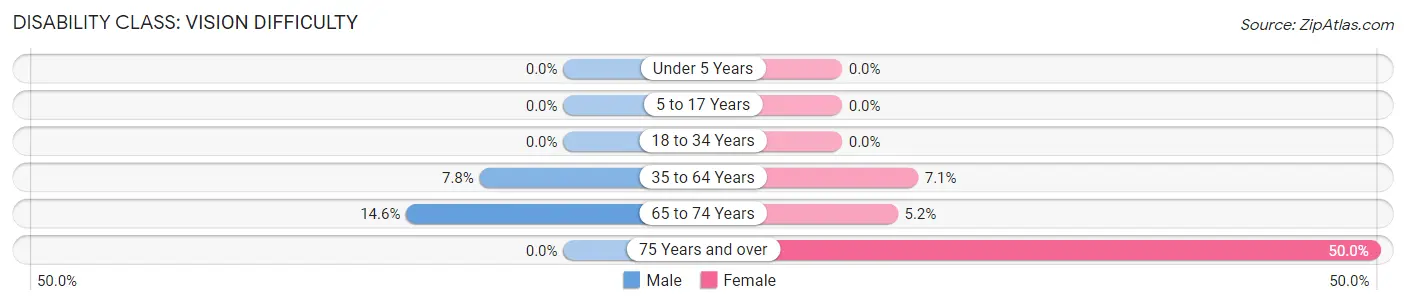
| Age Bracket | Male | Female |
| Under 5 Years | 0 (0.0%) | 0 (0.0%) |
| 5 to 17 Years | 0 (0.0%) | 0 (0.0%) |
| 18 to 34 Years | 0 (0.0%) | 0 (0.0%) |
| 35 to 64 Years | 23 (7.8%) | 17 (7.0%) |
| 65 to 74 Years | 14 (14.6%) | 3 (5.2%) |
| 75 Years and over | 0 (0.0%) | 31 (50.0%) |
Disability Class: Cognitive Difficulty
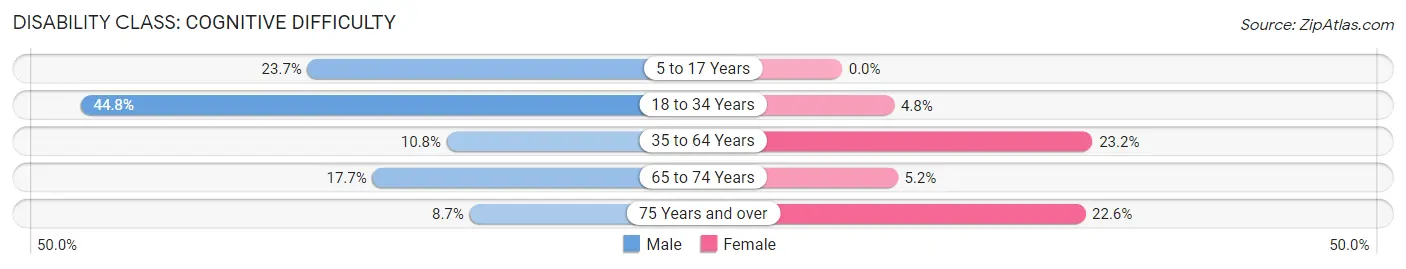
| Age Bracket | Male | Female |
| 5 to 17 Years | 14 (23.7%) | 0 (0.0%) |
| 18 to 34 Years | 56 (44.8%) | 6 (4.8%) |
| 35 to 64 Years | 32 (10.8%) | 56 (23.2%) |
| 65 to 74 Years | 17 (17.7%) | 3 (5.2%) |
| 75 Years and over | 6 (8.7%) | 14 (22.6%) |
Disability Class: Ambulatory Difficulty
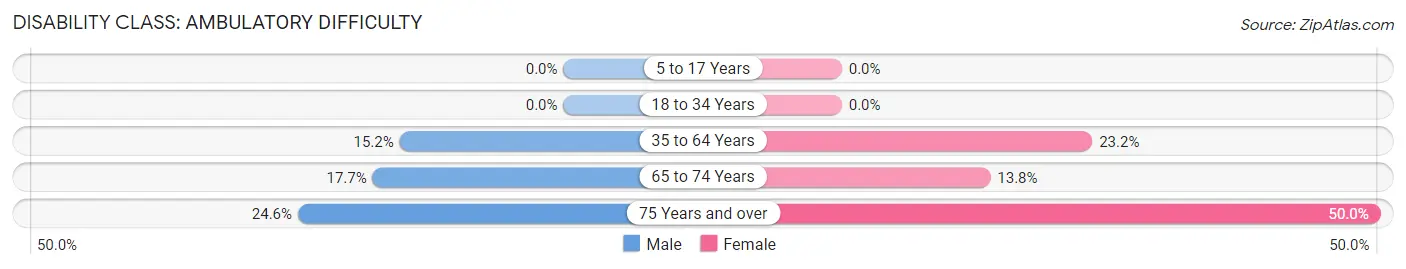
| Age Bracket | Male | Female |
| 5 to 17 Years | 0 (0.0%) | 0 (0.0%) |
| 18 to 34 Years | 0 (0.0%) | 0 (0.0%) |
| 35 to 64 Years | 45 (15.2%) | 56 (23.2%) |
| 65 to 74 Years | 17 (17.7%) | 8 (13.8%) |
| 75 Years and over | 17 (24.6%) | 31 (50.0%) |
Disability Class: Self-Care Difficulty
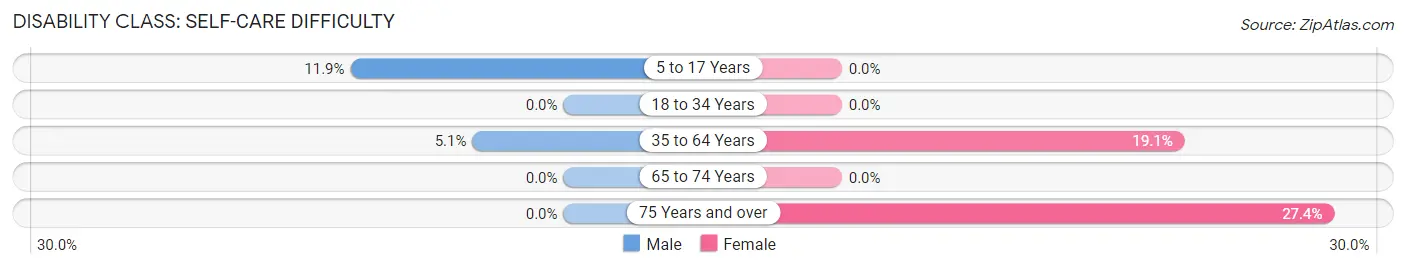
| Age Bracket | Male | Female |
| 5 to 17 Years | 7 (11.9%) | 0 (0.0%) |
| 18 to 34 Years | 0 (0.0%) | 0 (0.0%) |
| 35 to 64 Years | 15 (5.1%) | 46 (19.1%) |
| 65 to 74 Years | 0 (0.0%) | 0 (0.0%) |
| 75 Years and over | 0 (0.0%) | 17 (27.4%) |
Technology Access in Coats Bend
Computing Device Access in Coats Bend
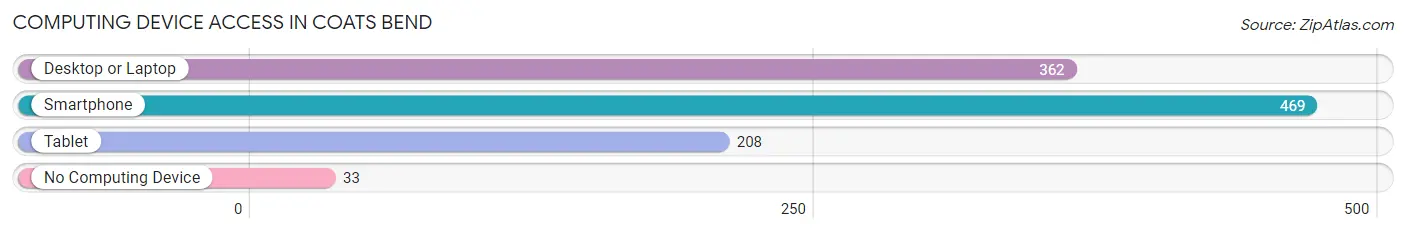
| Device Type | # Households | % Households |
| Desktop or Laptop | 362 | 66.3% |
| Smartphone | 469 | 85.9% |
| Tablet | 208 | 38.1% |
| No Computing Device | 33 | 6.0% |
| Total | 546 | 100.0% |
Internet Access in Coats Bend
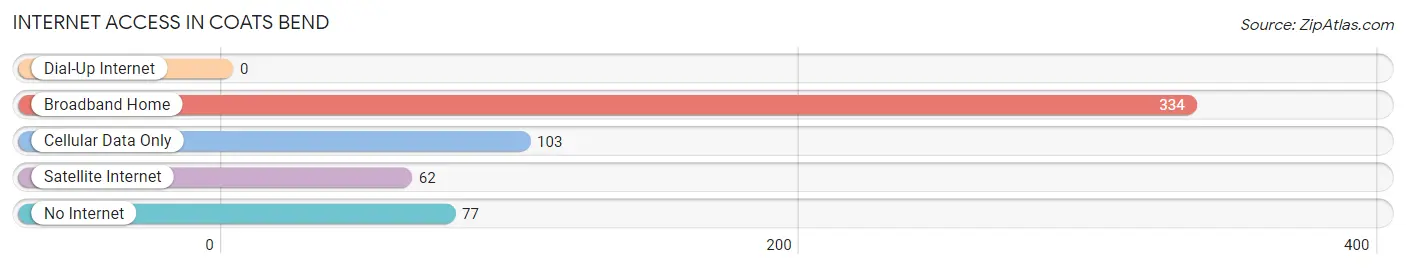
| Internet Type | # Households | % Households |
| Dial-Up Internet | 0 | 0.0% |
| Broadband Home | 334 | 61.2% |
| Cellular Data Only | 103 | 18.9% |
| Satellite Internet | 62 | 11.4% |
| No Internet | 77 | 14.1% |
| Total | 546 | 100.0% |
Coats Bend Summary
Coats Bend is a small unincorporated community located in Etowah County, Alabama. It is situated on the banks of the Coosa River, approximately 10 miles south of Gadsden. The community is named after the Coats family, who settled in the area in the early 1800s.
History
The Coats family first settled in the area in the early 1800s. The family was originally from North Carolina and had migrated to Alabama in search of better opportunities. The Coats family established a large plantation in the area and built a grist mill on the banks of the Coosa River. The mill was used to grind corn and wheat for the local community.
The Coats family also built a church in the area, which was used by the local community for religious services. The church was known as the Coats Bend Baptist Church and was the first church in the area.
The Coats family continued to live in the area until the early 1900s. In the 1920s, the Coats family sold their land to the Alabama Power Company. The company built a dam on the Coosa River, creating Lake Neely Henry. The lake provided hydroelectric power to the area and also created a recreational area for the local community.
Geography
Coats Bend is located in Etowah County, Alabama. It is situated on the banks of the Coosa River, approximately 10 miles south of Gadsden. The community is located in the foothills of the Appalachian Mountains and is surrounded by rolling hills and forests. The area is known for its scenic beauty and is a popular destination for outdoor recreation.
The climate in Coats Bend is humid subtropical, with hot summers and mild winters. The average annual temperature is around 68 degrees Fahrenheit. The average annual precipitation is around 50 inches.
Economy
The economy of Coats Bend is largely based on agriculture and tourism. The area is known for its scenic beauty and is a popular destination for outdoor recreation. The area is also home to several small businesses, including restaurants, convenience stores, and gas stations.
The Alabama Power Company also operates a hydroelectric power plant in the area. The plant provides electricity to the local community and is a major employer in the area.
Demographics
As of the 2010 census, the population of Coats Bend was 1,845. The racial makeup of the community was 97.3% White, 0.7% African American, 0.3% Native American, 0.2% Asian, and 1.5% from other races. The median household income was $37,917.
Coats Bend is a small, rural community with a close-knit community. The area is known for its scenic beauty and is a popular destination for outdoor recreation. The area is also home to several small businesses, providing employment opportunities for the local community.
Common Questions
What is Per Capita Income in Coats Bend?
Per Capita income in Coats Bend is $25,934.
What is the Median Family Income in Coats Bend?
Median Family Income in Coats Bend is $57,120.
What is the Median Household income in Coats Bend?
Median Household Income in Coats Bend is $48,243.
What is Income or Wage Gap in Coats Bend?
Income or Wage Gap in Coats Bend is 43.3%.
Women in Coats Bend earn 56.7 cents for every dollar earned by a man.
What is Inequality or Gini Index in Coats Bend?
Inequality or Gini Index in Coats Bend is 0.39.
What is the Total Population of Coats Bend?
Total Population of Coats Bend is 1,353.
What is the Total Male Population of Coats Bend?
Total Male Population of Coats Bend is 696.
What is the Total Female Population of Coats Bend?
Total Female Population of Coats Bend is 657.
What is the Ratio of Males per 100 Females in Coats Bend?
There are 105.94 Males per 100 Females in Coats Bend.
What is the Ratio of Females per 100 Males in Coats Bend?
There are 94.40 Females per 100 Males in Coats Bend.
What is the Median Population Age in Coats Bend?
Median Population Age in Coats Bend is 45.5 Years.
What is the Average Family Size in Coats Bend
Average Family Size in Coats Bend is 3.2 People.
What is the Average Household Size in Coats Bend
Average Household Size in Coats Bend is 2.5 People.
How Large is the Labor Force in Coats Bend?
There are 642 People in the Labor Forcein in Coats Bend.
What is the Percentage of People in the Labor Force in Coats Bend?
59.9% of People are in the Labor Force in Coats Bend.
What is the Unemployment Rate in Coats Bend?
Unemployment Rate in Coats Bend is 2.3%.