Zip Codes with the Highest Percentage of Families with Income Below $10,000 in West Virginia
RELATED REPORTS & OPTIONS
Family Income | $0-10k
West Virginia
Compare Zip Codes
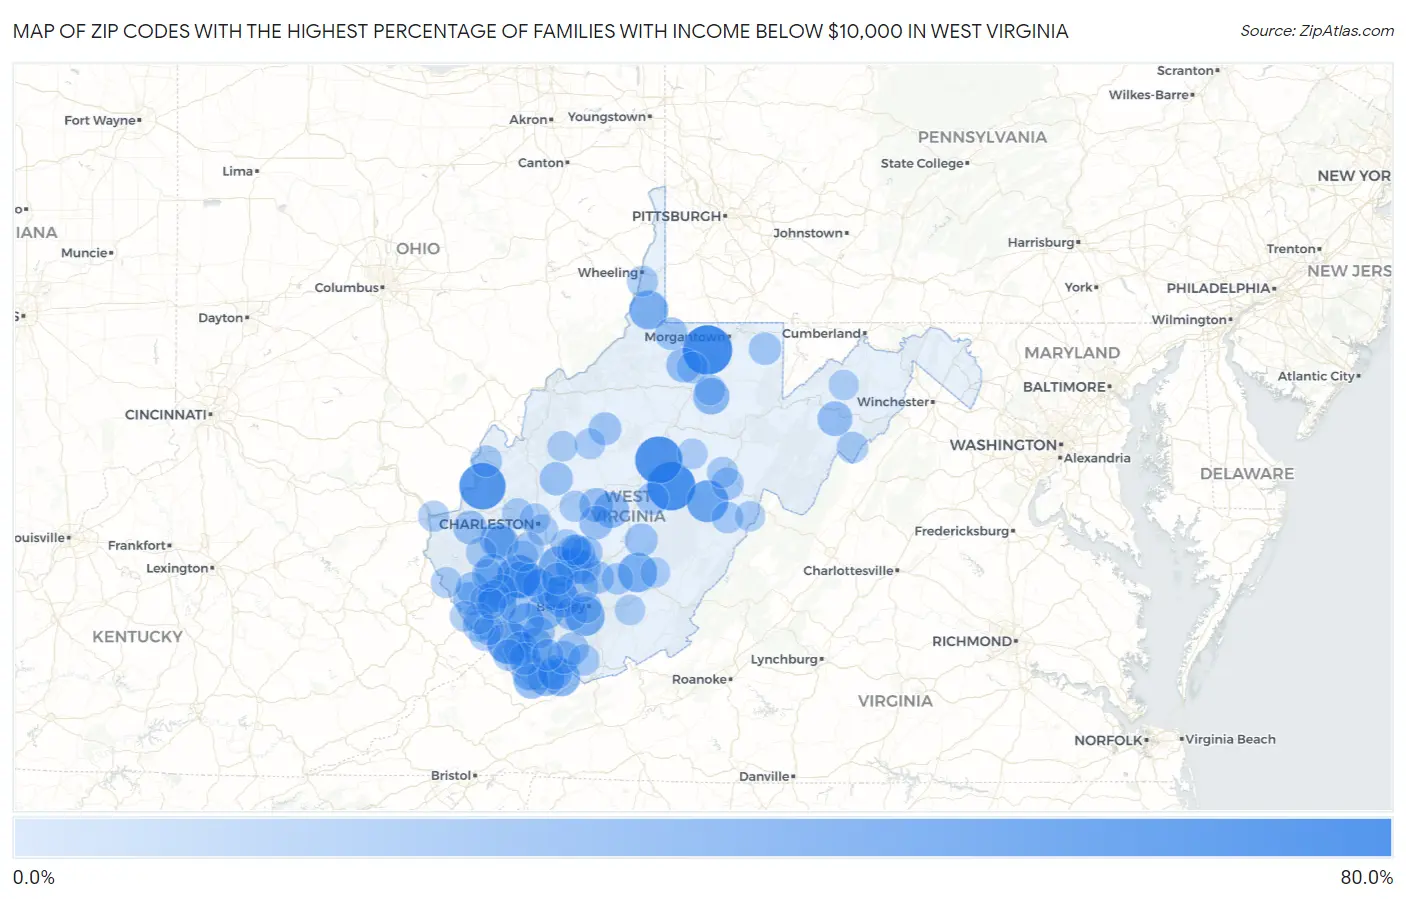
Map of Zip Codes with the Highest Percentage of Families with Income Below $10,000 in West Virginia
0.0%
80.0%
Zip Codes with the Highest Percentage of Families with Income Below $10,000 in West Virginia
| Zip Code | Families with Income < $10k | vs State | vs National | |
| 1. | 26560 | 75.6% | 4.2%(+71.4)#1 | 3.1%(+72.5)#20 |
| 2. | 26217 | 71.2% | 4.2%(+67.0)#2 | 3.1%(+68.1)#24 |
| 3. | 26631 | 67.3% | 4.2%(+63.1)#3 | 3.1%(+64.2)#27 |
| 4. | 25503 | 64.2% | 4.2%(+60.0)#4 | 3.1%(+61.1)#34 |
| 5. | 24846 | 52.9% | 4.2%(+48.7)#5 | 3.1%(+49.8)#55 |
| 6. | 25114 | 52.2% | 4.2%(+48.0)#6 | 3.1%(+49.1)#58 |
| 7. | 26282 | 48.7% | 4.2%(+44.5)#7 | 3.1%(+45.6)#70 |
| 8. | 25075 | 41.9% | 4.2%(+37.7)#8 | 3.1%(+38.8)#95 |
| 9. | 25878 | 40.6% | 4.2%(+36.4)#9 | 3.1%(+37.5)#103 |
| 10. | 25958 | 40.2% | 4.2%(+36.0)#10 | 3.1%(+37.1)#108 |
| 11. | 26039 | 38.5% | 4.2%(+34.3)#11 | 3.1%(+35.4)#124 |
| 12. | 25647 | 35.5% | 4.2%(+31.3)#12 | 3.1%(+32.4)#142 |
| 13. | 24848 | 34.4% | 4.2%(+30.2)#13 | 3.1%(+31.3)#153 |
| 14. | 24854 | 32.5% | 4.2%(+28.3)#14 | 3.1%(+29.4)#165 |
| 15. | 25149 | 32.5% | 4.2%(+28.3)#15 | 3.1%(+29.4)#166 |
| 16. | 24884 | 31.3% | 4.2%(+27.1)#16 | 3.1%(+28.2)#181 |
| 17. | 25161 | 30.7% | 4.2%(+26.5)#17 | 3.1%(+27.6)#187 |
| 18. | 26349 | 30.0% | 4.2%(+25.8)#18 | 3.1%(+26.9)#194 |
| 19. | 24823 | 28.8% | 4.2%(+24.6)#19 | 3.1%(+25.7)#214 |
| 20. | 25043 | 27.6% | 4.2%(+23.4)#20 | 3.1%(+24.5)#235 |
| 21. | 24892 | 27.4% | 4.2%(+23.2)#21 | 3.1%(+24.3)#240 |
| 22. | 25521 | 27.1% | 4.2%(+22.9)#22 | 3.1%(+24.0)#247 |
| 23. | 25007 | 26.8% | 4.2%(+22.6)#23 | 3.1%(+23.7)#259 |
| 24. | 24894 | 25.7% | 4.2%(+21.5)#24 | 3.1%(+22.6)#288 |
| 25. | 24828 | 25.4% | 4.2%(+21.2)#25 | 3.1%(+22.3)#294 |
| 26. | 26463 | 24.6% | 4.2%(+20.4)#26 | 3.1%(+21.5)#316 |
| 27. | 26818 | 24.5% | 4.2%(+20.3)#27 | 3.1%(+21.4)#318 |
| 28. | 25573 | 24.0% | 4.2%(+19.8)#28 | 3.1%(+20.9)#332 |
| 29. | 25204 | 24.0% | 4.2%(+19.8)#29 | 3.1%(+20.9)#335 |
| 30. | 24871 | 23.9% | 4.2%(+19.7)#30 | 3.1%(+20.8)#338 |
| 31. | 25505 | 23.7% | 4.2%(+19.5)#31 | 3.1%(+20.6)#347 |
| 32. | 24844 | 23.2% | 4.2%(+19.0)#32 | 3.1%(+20.1)#363 |
| 33. | 25133 | 21.1% | 4.2%(+16.9)#33 | 3.1%(+18.0)#433 |
| 34. | 25111 | 21.0% | 4.2%(+16.8)#34 | 3.1%(+17.9)#438 |
| 35. | 25559 | 20.8% | 4.2%(+16.6)#35 | 3.1%(+17.7)#443 |
| 36. | 25639 | 20.7% | 4.2%(+16.5)#36 | 3.1%(+17.6)#449 |
| 37. | 25676 | 20.6% | 4.2%(+16.4)#37 | 3.1%(+17.5)#451 |
| 38. | 25152 | 20.0% | 4.2%(+15.8)#38 | 3.1%(+16.9)#474 |
| 39. | 25243 | 19.6% | 4.2%(+15.4)#39 | 3.1%(+16.5)#500 |
| 40. | 25140 | 19.3% | 4.2%(+15.1)#40 | 3.1%(+16.2)#514 |
| 41. | 25671 | 19.0% | 4.2%(+14.8)#41 | 3.1%(+15.9)#526 |
| 42. | 24868 | 19.0% | 4.2%(+14.8)#42 | 3.1%(+15.9)#527 |
| 43. | 25031 | 18.9% | 4.2%(+14.7)#43 | 3.1%(+15.8)#534 |
| 44. | 25865 | 18.8% | 4.2%(+14.6)#44 | 3.1%(+15.7)#538 |
| 45. | 25062 | 18.8% | 4.2%(+14.6)#45 | 3.1%(+15.7)#544 |
| 46. | 26681 | 18.7% | 4.2%(+14.5)#46 | 3.1%(+15.6)#548 |
| 47. | 25136 | 18.5% | 4.2%(+14.3)#47 | 3.1%(+15.4)#558 |
| 48. | 25206 | 17.9% | 4.2%(+13.7)#48 | 3.1%(+14.8)#594 |
| 49. | 26137 | 17.6% | 4.2%(+13.4)#49 | 3.1%(+14.5)#615 |
| 50. | 25879 | 17.4% | 4.2%(+13.2)#50 | 3.1%(+14.3)#638 |
| 51. | 26562 | 17.2% | 4.2%(+13.0)#51 | 3.1%(+14.1)#648 |
| 52. | 26203 | 17.1% | 4.2%(+12.9)#52 | 3.1%(+14.0)#663 |
| 53. | 25090 | 17.1% | 4.2%(+12.9)#53 | 3.1%(+14.0)#665 |
| 54. | 24719 | 16.7% | 4.2%(+12.5)#54 | 3.1%(+13.6)#697 |
| 55. | 26519 | 16.6% | 4.2%(+12.4)#55 | 3.1%(+13.5)#699 |
| 56. | 24811 | 16.4% | 4.2%(+12.2)#56 | 3.1%(+13.3)#720 |
| 57. | 25625 | 16.3% | 4.2%(+12.1)#57 | 3.1%(+13.2)#729 |
| 58. | 25637 | 16.3% | 4.2%(+12.1)#58 | 3.1%(+13.2)#731 |
| 59. | 26273 | 16.0% | 4.2%(+11.8)#59 | 3.1%(+12.9)#747 |
| 60. | 25904 | 15.6% | 4.2%(+11.4)#60 | 3.1%(+12.5)#793 |
| 61. | 25060 | 15.4% | 4.2%(+11.2)#61 | 3.1%(+12.3)#821 |
| 62. | 24818 | 14.9% | 4.2%(+10.7)#62 | 3.1%(+11.8)#873 |
| 63. | 25524 | 14.4% | 4.2%(+10.2)#63 | 3.1%(+11.3)#922 |
| 64. | 24801 | 14.2% | 4.2%(+10.00)#64 | 3.1%(+11.1)#954 |
| 65. | 26568 | 13.9% | 4.2%(+9.70)#65 | 3.1%(+10.8)#992 |
| 66. | 25106 | 13.9% | 4.2%(+9.70)#66 | 3.1%(+10.8)#993 |
| 67. | 25672 | 13.9% | 4.2%(+9.70)#67 | 3.1%(+10.8)#994 |
| 68. | 24927 | 13.8% | 4.2%(+9.60)#68 | 3.1%(+10.7)#1,009 |
| 69. | 25688 | 13.8% | 4.2%(+9.60)#69 | 3.1%(+10.7)#1,010 |
| 70. | 25831 | 13.7% | 4.2%(+9.50)#70 | 3.1%(+10.6)#1,021 |
| 71. | 24747 | 13.6% | 4.2%(+9.40)#71 | 3.1%(+10.5)#1,032 |
| 72. | 26812 | 13.2% | 4.2%(+9.00)#72 | 3.1%(+10.1)#1,095 |
| 73. | 24872 | 13.1% | 4.2%(+8.90)#73 | 3.1%(+10.00)#1,109 |
| 74. | 25162 | 12.8% | 4.2%(+8.60)#74 | 3.1%(+9.70)#1,173 |
| 75. | 25169 | 12.6% | 4.2%(+8.40)#75 | 3.1%(+9.50)#1,207 |
| 76. | 26280 | 12.5% | 4.2%(+8.30)#76 | 3.1%(+9.40)#1,223 |
| 77. | 25871 | 12.2% | 4.2%(+8.00)#77 | 3.1%(+9.10)#1,286 |
| 78. | 25507 | 12.1% | 4.2%(+7.90)#78 | 3.1%(+9.00)#1,306 |
| 79. | 25143 | 12.0% | 4.2%(+7.80)#79 | 3.1%(+8.90)#1,322 |
| 80. | 25304 | 11.9% | 4.2%(+7.70)#80 | 3.1%(+8.80)#1,345 |
| 81. | 26031 | 11.9% | 4.2%(+7.70)#81 | 3.1%(+8.80)#1,354 |
| 82. | 25186 | 11.9% | 4.2%(+7.70)#82 | 3.1%(+8.80)#1,359 |
| 83. | 25045 | 11.7% | 4.2%(+7.50)#83 | 3.1%(+8.60)#1,396 |
| 84. | 25690 | 11.6% | 4.2%(+7.40)#84 | 3.1%(+8.50)#1,428 |
| 85. | 25606 | 11.6% | 4.2%(+7.40)#85 | 3.1%(+8.50)#1,432 |
| 86. | 26151 | 11.0% | 4.2%(+6.80)#86 | 3.1%(+7.90)#1,605 |
| 87. | 25669 | 10.9% | 4.2%(+6.70)#87 | 3.1%(+7.80)#1,632 |
| 88. | 25387 | 10.8% | 4.2%(+6.60)#88 | 3.1%(+7.70)#1,654 |
| 89. | 25540 | 10.5% | 4.2%(+6.30)#89 | 3.1%(+7.40)#1,762 |
| 90. | 26347 | 10.3% | 4.2%(+6.10)#90 | 3.1%(+7.20)#1,807 |
| 91. | 25667 | 10.3% | 4.2%(+6.10)#91 | 3.1%(+7.20)#1,817 |
| 92. | 25009 | 10.2% | 4.2%(+6.00)#92 | 3.1%(+7.10)#1,853 |
| 93. | 25270 | 10.1% | 4.2%(+5.90)#93 | 3.1%(+7.00)#1,888 |
| 94. | 25692 | 10.0% | 4.2%(+5.80)#94 | 3.1%(+6.90)#1,923 |
| 95. | 25652 | 10.0% | 4.2%(+5.80)#95 | 3.1%(+6.90)#1,925 |
| 96. | 26218 | 9.7% | 4.2%(+5.50)#96 | 3.1%(+6.60)#2,042 |
| 97. | 25984 | 9.7% | 4.2%(+5.50)#97 | 3.1%(+6.60)#2,049 |
| 98. | 24944 | 9.7% | 4.2%(+5.50)#98 | 3.1%(+6.60)#2,063 |
| 99. | 25985 | 9.6% | 4.2%(+5.40)#99 | 3.1%(+6.50)#2,096 |
| 100. | 26710 | 9.5% | 4.2%(+5.30)#100 | 3.1%(+6.40)#2,127 |
Common Questions
What are the Top 10 Zip Codes with the Highest Percentage of Families with Income Below $10,000 in West Virginia?
Top 10 Zip Codes with the Highest Percentage of Families with Income Below $10,000 in West Virginia are:
What zip code has the Highest Percentage of Families with Income Below $10,000 in West Virginia?
26560 has the Highest Percentage of Families with Income Below $10,000 in West Virginia with 75.6%.
What is the Percentage of Families with Income Below $10,000 in the State of West Virginia?
Percentage of Families with Income Below $10,000 in West Virginia is 4.2%.
What is the Percentage of Families with Income Below $10,000 in the United States?
Percentage of Families with Income Below $10,000 in the United States is 3.1%.