Mount Carbon, WV Map & Demographics
Mount Carbon Map
Mount Carbon Overview
$23,829
PER CAPITA INCOME
$56,941
AVG FAMILY INCOME
$56,596
AVG HOUSEHOLD INCOME
0.11
INEQUALITY / GINI INDEX
200
TOTAL POPULATION
114
MALE POPULATION
86
FEMALE POPULATION
132.56
MALES / 100 FEMALES
75.44
FEMALES / 100 MALES
63.9
MEDIAN AGE
2.6
AVG FAMILY SIZE
2.3
AVG HOUSEHOLD SIZE
66
LABOR FORCE [ PEOPLE ]
33.0%
PERCENT IN LABOR FORCE
Mount Carbon Zip Codes
Mount Carbon Area Codes
Income in Mount Carbon
Income Overview in Mount Carbon
Per Capita Income in Mount Carbon is $23,829, while median incomes of families and households are $56,941 and $56,596 respectively.
| Characteristic | Number | Measure |
| Per Capita Income | 200 | $23,829 |
| Median Family Income | 73 | $56,941 |
| Mean Family Income | 73 | $60,132 |
| Median Household Income | 86 | $56,596 |
| Mean Household Income | 86 | $55,040 |
| Income Deficit | 73 | $0 |
| Wage / Income Gap (%) | 200 | 0.00% |
| Wage / Income Gap ($) | 200 | 100.00¢ per $1 |
| Gini / Inequality Index | 200 | 0.11 |
Earnings by Sex in Mount Carbon
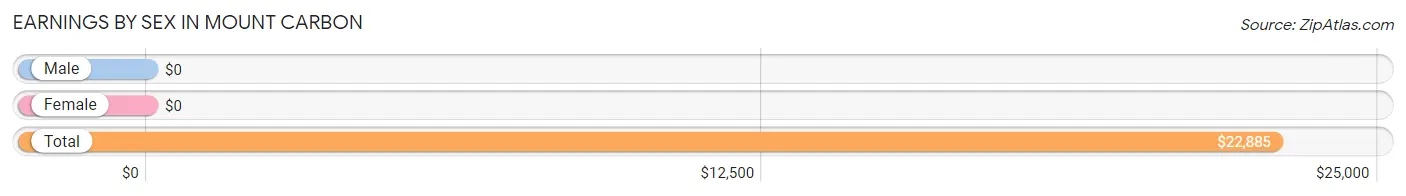
| Sex | Number | Average Earnings |
| Male | 62 (70.5%) | $0 |
| Female | 26 (29.5%) | $0 |
| Total | 88 (100.0%) | $22,885 |
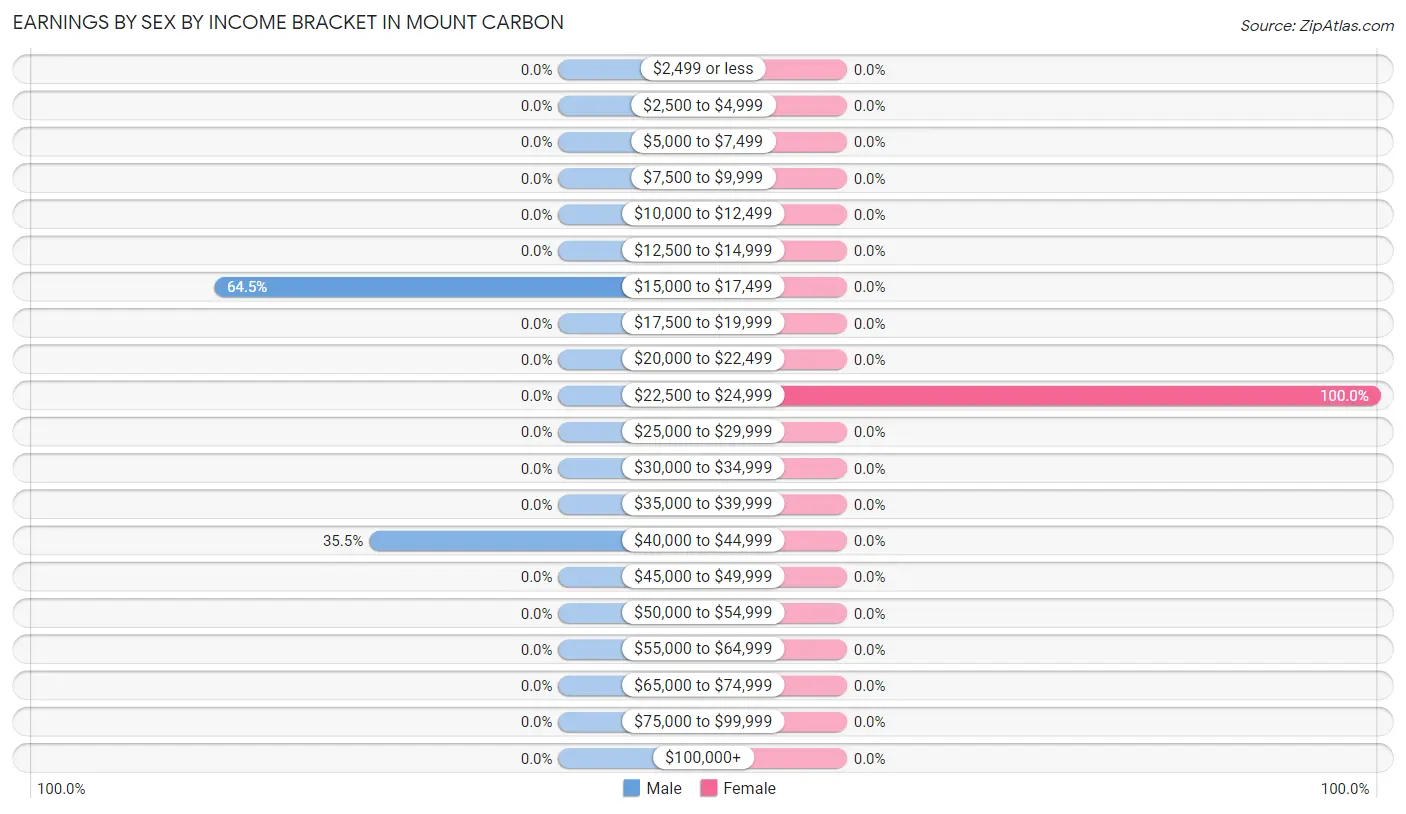
Earnings by Sex by Income Bracket in Mount Carbon
The most common earnings brackets in Mount Carbon are $15,000 to $17,499 for men (40 | 64.5%) and $22,500 to $24,999 for women (26 | 100.0%).
| Income | Male | Female |
| $2,499 or less | 0 (0.0%) | 0 (0.0%) |
| $2,500 to $4,999 | 0 (0.0%) | 0 (0.0%) |
| $5,000 to $7,499 | 0 (0.0%) | 0 (0.0%) |
| $7,500 to $9,999 | 0 (0.0%) | 0 (0.0%) |
| $10,000 to $12,499 | 0 (0.0%) | 0 (0.0%) |
| $12,500 to $14,999 | 0 (0.0%) | 0 (0.0%) |
| $15,000 to $17,499 | 40 (64.5%) | 0 (0.0%) |
| $17,500 to $19,999 | 0 (0.0%) | 0 (0.0%) |
| $20,000 to $22,499 | 0 (0.0%) | 0 (0.0%) |
| $22,500 to $24,999 | 0 (0.0%) | 26 (100.0%) |
| $25,000 to $29,999 | 0 (0.0%) | 0 (0.0%) |
| $30,000 to $34,999 | 0 (0.0%) | 0 (0.0%) |
| $35,000 to $39,999 | 0 (0.0%) | 0 (0.0%) |
| $40,000 to $44,999 | 22 (35.5%) | 0 (0.0%) |
| $45,000 to $49,999 | 0 (0.0%) | 0 (0.0%) |
| $50,000 to $54,999 | 0 (0.0%) | 0 (0.0%) |
| $55,000 to $64,999 | 0 (0.0%) | 0 (0.0%) |
| $65,000 to $74,999 | 0 (0.0%) | 0 (0.0%) |
| $75,000 to $99,999 | 0 (0.0%) | 0 (0.0%) |
| $100,000+ | 0 (0.0%) | 0 (0.0%) |
| Total | 62 (100.0%) | 26 (100.0%) |
Earnings by Sex by Educational Attainment in Mount Carbon
| Educational Attainment | Male Income | Female Income |
| Less than High School | - | - |
| High School Diploma | - | - |
| College or Associate's Degree | - | - |
| Bachelor's Degree | - | - |
| Graduate Degree | - | - |
| Total | - | - |
Family Income in Mount Carbon
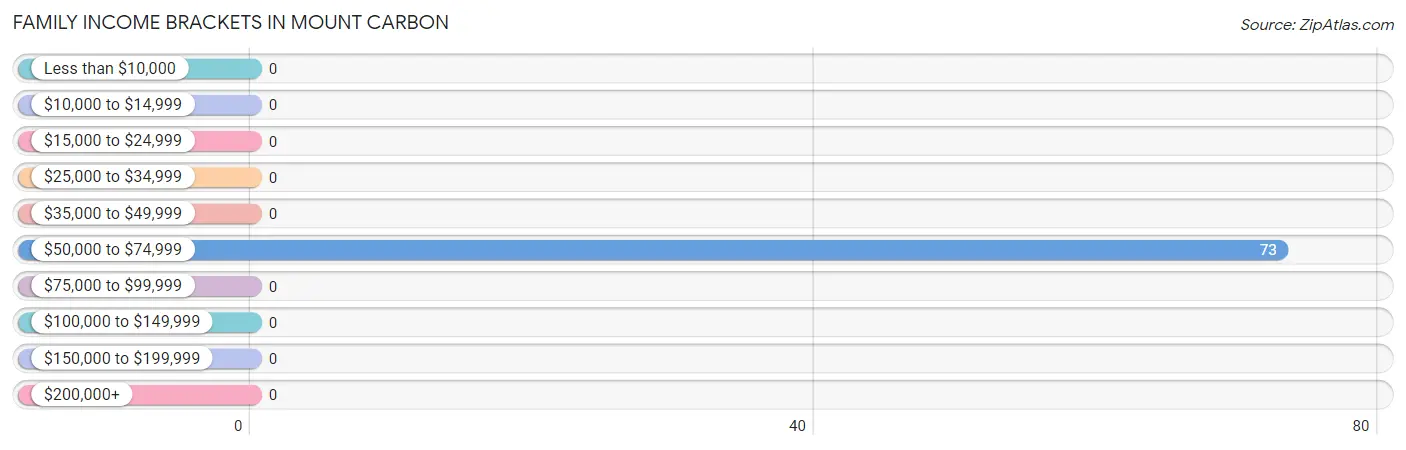
Family Income Brackets in Mount Carbon
According to the Mount Carbon family income data, there are 73 families falling into the $50,000 to $74,999 income range, which is the most common income bracket and makes up 100.0% of all families.
| Income Bracket | # Families | % Families |
| Less than $10,000 | 0 | 0.0% |
| $10,000 to $14,999 | 0 | 0.0% |
| $15,000 to $24,999 | 0 | 0.0% |
| $25,000 to $34,999 | 0 | 0.0% |
| $35,000 to $49,999 | 0 | 0.0% |
| $50,000 to $74,999 | 73 | 100.0% |
| $75,000 to $99,999 | 0 | 0.0% |
| $100,000 to $149,999 | 0 | 0.0% |
| $150,000 to $199,999 | 0 | 0.0% |
| $200,000+ | 0 | 0.0% |
Family Income by Famaliy Size in Mount Carbon
| Income Bracket | # Families | Median Income |
| 2-Person Families | 39 (53.4%) | $0 |
| 3-Person Families | 34 (46.6%) | $0 |
| 4-Person Families | 0 (0.0%) | $0 |
| 5-Person Families | 0 (0.0%) | $0 |
| 6-Person Families | 0 (0.0%) | $0 |
| 7+ Person Families | 0 (0.0%) | $0 |
| Total | 73 (100.0%) | $56,941 |
Family Income by Number of Earners in Mount Carbon
| Number of Earners | # Families | Median Income |
| No Earners | 13 (17.8%) | $0 |
| 1 Earner | 34 (46.6%) | $0 |
| 2 Earners | 26 (35.6%) | $0 |
| 3+ Earners | 0 (0.0%) | $0 |
| Total | 73 (100.0%) | $56,941 |
Household Income in Mount Carbon
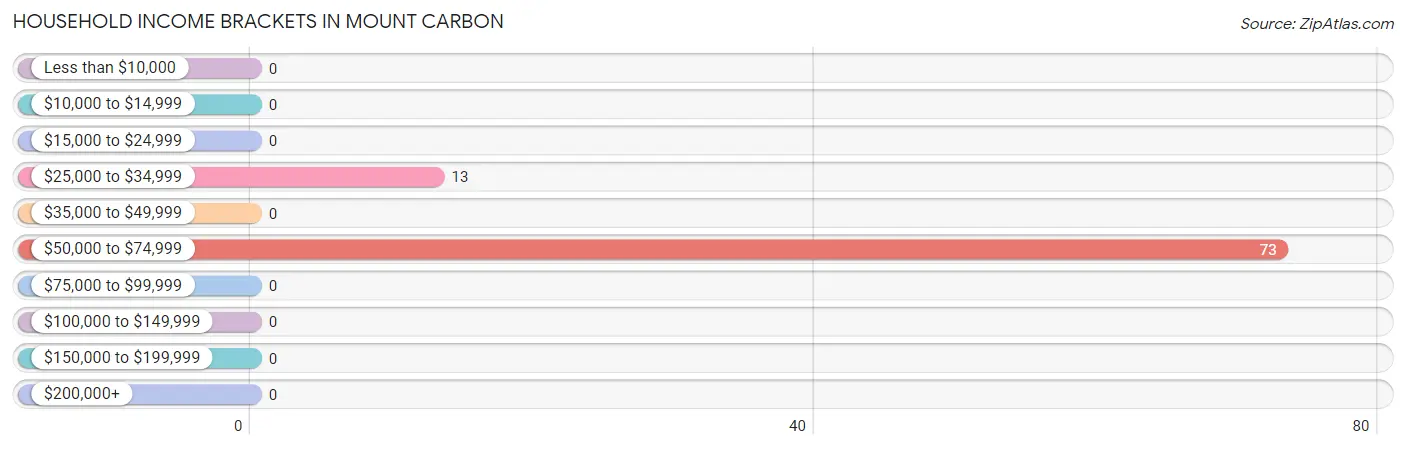
Household Income Brackets in Mount Carbon
With 73 households falling in the category, the $50,000 to $74,999 income range is the most frequent in Mount Carbon, accounting for 84.9% of all households.
| Income Bracket | # Households | % Households |
| Less than $10,000 | 0 | 0.0% |
| $10,000 to $14,999 | 0 | 0.0% |
| $15,000 to $24,999 | 0 | 0.0% |
| $25,000 to $34,999 | 13 | 15.1% |
| $35,000 to $49,999 | 0 | 0.0% |
| $50,000 to $74,999 | 73 | 84.9% |
| $75,000 to $99,999 | 0 | 0.0% |
| $100,000 to $149,999 | 0 | 0.0% |
| $150,000 to $199,999 | 0 | 0.0% |
| $200,000+ | 0 | 0.0% |
Household Income by Householder Age in Mount Carbon
| Income Bracket | # Households | Median Income |
| 15 to 24 Years | 0 (0.0%) | $0 |
| 25 to 44 Years | 0 (0.0%) | $0 |
| 45 to 64 Years | 39 (45.4%) | $0 |
| 65+ Years | 47 (54.6%) | $0 |
| Total | 86 (100.0%) | $56,596 |
Poverty in Mount Carbon
Income Below Poverty by Sex and Age in Mount Carbon
| Age Bracket | Male | Female |
| Under 5 Years | 0 (0.0%) | 0 (0.0%) |
| 5 Years | 0 (0.0%) | 0 (0.0%) |
| 6 to 11 Years | 0 (0.0%) | 0 (0.0%) |
| 12 to 14 Years | 0 (0.0%) | 0 (0.0%) |
| 15 Years | 0 (0.0%) | 0 (0.0%) |
| 16 and 17 Years | 0 (0.0%) | 0 (0.0%) |
| 18 to 24 Years | 0 (0.0%) | 0 (0.0%) |
| 25 to 34 Years | 0 (0.0%) | 0 (0.0%) |
| 35 to 44 Years | 0 (0.0%) | 0 (0.0%) |
| 45 to 54 Years | 0 (0.0%) | 0 (0.0%) |
| 55 to 64 Years | 0 (0.0%) | 0 (0.0%) |
| 65 to 74 Years | 0 (0.0%) | 0 (0.0%) |
| 75 Years and over | 0 (0.0%) | 0 (0.0%) |
| Total | 0 (0.0%) | 0 (0.0%) |
Income Above Poverty by Sex and Age in Mount Carbon
According to the poverty statistics in Mount Carbon, males aged 25 to 34 years and females aged 45 to 54 years are the age groups that are most secure financially, with 100.0% of males and 100.0% of females in these age groups living above the poverty line.
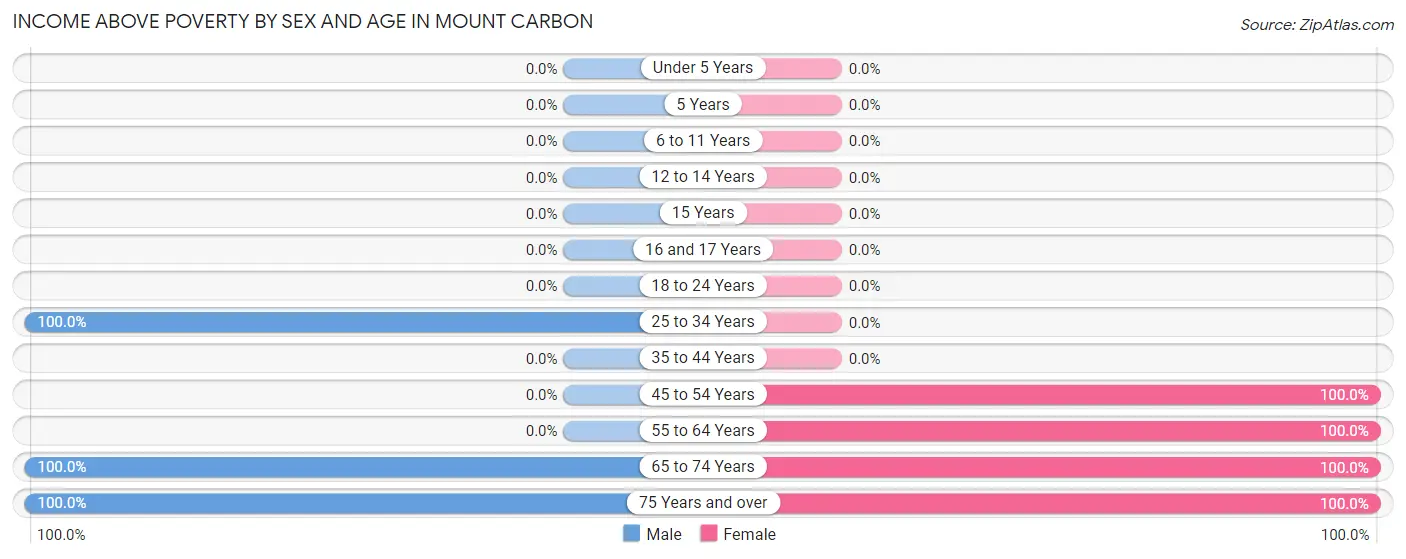
| Age Bracket | Male | Female |
| Under 5 Years | 0 (0.0%) | 0 (0.0%) |
| 5 Years | 0 (0.0%) | 0 (0.0%) |
| 6 to 11 Years | 0 (0.0%) | 0 (0.0%) |
| 12 to 14 Years | 0 (0.0%) | 0 (0.0%) |
| 15 Years | 0 (0.0%) | 0 (0.0%) |
| 16 and 17 Years | 0 (0.0%) | 0 (0.0%) |
| 18 to 24 Years | 0 (0.0%) | 0 (0.0%) |
| 25 to 34 Years | 62 (100.0%) | 0 (0.0%) |
| 35 to 44 Years | 0 (0.0%) | 0 (0.0%) |
| 45 to 54 Years | 0 (0.0%) | 26 (100.0%) |
| 55 to 64 Years | 0 (0.0%) | 13 (100.0%) |
| 65 to 74 Years | 11 (100.0%) | 13 (100.0%) |
| 75 Years and over | 41 (100.0%) | 34 (100.0%) |
| Total | 114 (100.0%) | 86 (100.0%) |
Income Below Poverty Among Married-Couple Families in Mount Carbon
| Children | Above Poverty | Below Poverty |
| No Children | 47 (100.0%) | 0 (0.0%) |
| 1 or 2 Children | 0 (0.0%) | 0 (0.0%) |
| 3 or 4 Children | 0 (0.0%) | 0 (0.0%) |
| 5 or more Children | 0 (0.0%) | 0 (0.0%) |
| Total | 47 (100.0%) | 0 (0.0%) |
Income Below Poverty Among Single-Parent Households in Mount Carbon
| Children | Single Father | Single Mother |
| No Children | 0 (0.0%) | 0 (0.0%) |
| 1 or 2 Children | 0 (0.0%) | 0 (0.0%) |
| 3 or 4 Children | 0 (0.0%) | 0 (0.0%) |
| 5 or more Children | 0 (0.0%) | 0 (0.0%) |
| Total | 0 (0.0%) | 0 (0.0%) |
Income Below Poverty Among Married-Couple vs Single-Parent Households in Mount Carbon
| Children | Married-Couple Families | Single-Parent Households |
| No Children | 0 (0.0%) | 0 (0.0%) |
| 1 or 2 Children | 0 (0.0%) | 0 (0.0%) |
| 3 or 4 Children | 0 (0.0%) | 0 (0.0%) |
| 5 or more Children | 0 (0.0%) | 0 (0.0%) |
| Total | 0 (0.0%) | 0 (0.0%) |
Race in Mount Carbon
The most populous races in Mount Carbon are White / Caucasian (187 | 93.5%), and Native / Alaskan (13 | 6.5%).
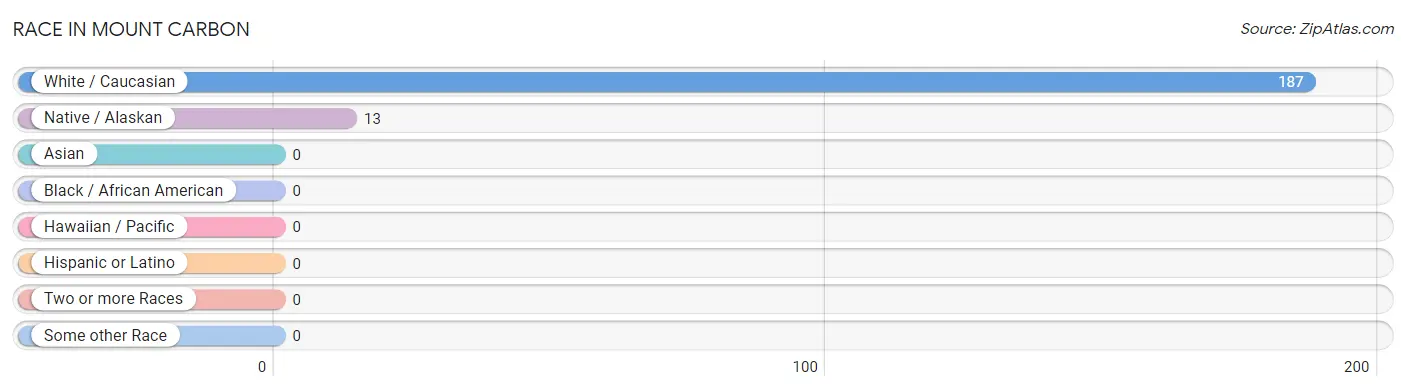
| Race | # Population | % Population |
| Asian | 0 | 0.0% |
| Black / African American | 0 | 0.0% |
| Hawaiian / Pacific | 0 | 0.0% |
| Hispanic or Latino | 0 | 0.0% |
| Native / Alaskan | 13 | 6.5% |
| White / Caucasian | 187 | 93.5% |
| Two or more Races | 0 | 0.0% |
| Some other Race | 0 | 0.0% |
| Total | 200 | 100.0% |
Ancestry in Mount Carbon
The most populous ancestries reported in Mount Carbon are Irish (81 | 40.5%), Cherokee (13 | 6.5%), Scottish (13 | 6.5%), and English (11 | 5.5%), together accounting for 59.0% of all Mount Carbon residents.
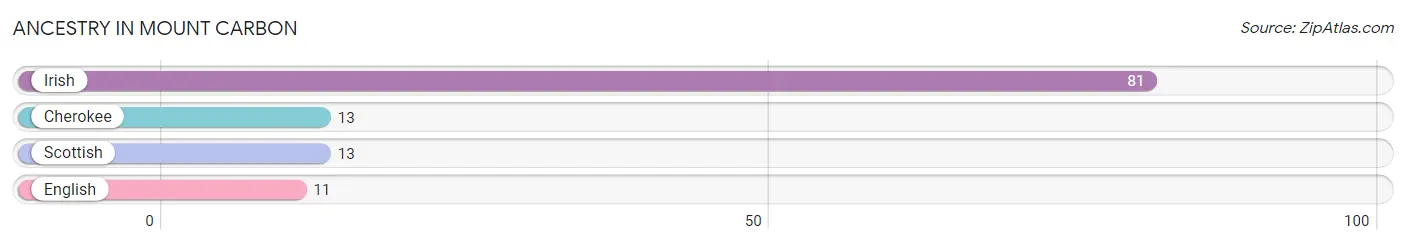
| Ancestry | # Population | % Population |
| Cherokee | 13 | 6.5% |
| English | 11 | 5.5% |
| Irish | 81 | 40.5% |
| Scottish | 13 | 6.5% | View All 4 Rows |
Immigrants in Mount Carbon

| Immigration Origin | # Population | % Population | View All 0 Rows |
Sex and Age in Mount Carbon
Sex and Age in Mount Carbon
The most populous age groups in Mount Carbon are 30 to 34 Years (62 | 54.4%) for men and 75 to 79 Years (34 | 39.5%) for women.
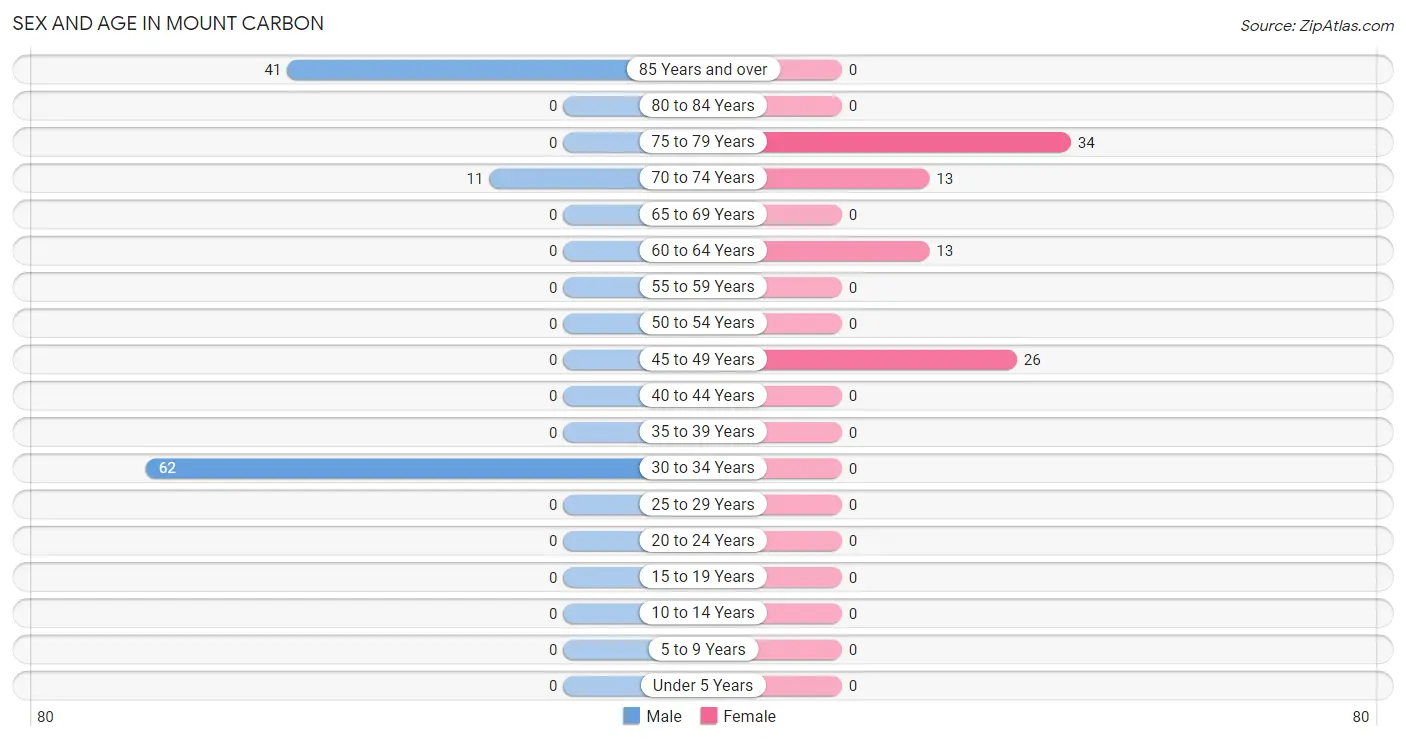
| Age Bracket | Male | Female |
| Under 5 Years | 0 (0.0%) | 0 (0.0%) |
| 5 to 9 Years | 0 (0.0%) | 0 (0.0%) |
| 10 to 14 Years | 0 (0.0%) | 0 (0.0%) |
| 15 to 19 Years | 0 (0.0%) | 0 (0.0%) |
| 20 to 24 Years | 0 (0.0%) | 0 (0.0%) |
| 25 to 29 Years | 0 (0.0%) | 0 (0.0%) |
| 30 to 34 Years | 62 (54.4%) | 0 (0.0%) |
| 35 to 39 Years | 0 (0.0%) | 0 (0.0%) |
| 40 to 44 Years | 0 (0.0%) | 0 (0.0%) |
| 45 to 49 Years | 0 (0.0%) | 26 (30.2%) |
| 50 to 54 Years | 0 (0.0%) | 0 (0.0%) |
| 55 to 59 Years | 0 (0.0%) | 0 (0.0%) |
| 60 to 64 Years | 0 (0.0%) | 13 (15.1%) |
| 65 to 69 Years | 0 (0.0%) | 0 (0.0%) |
| 70 to 74 Years | 11 (9.7%) | 13 (15.1%) |
| 75 to 79 Years | 0 (0.0%) | 34 (39.5%) |
| 80 to 84 Years | 0 (0.0%) | 0 (0.0%) |
| 85 Years and over | 41 (36.0%) | 0 (0.0%) |
| Total | 114 (100.0%) | 86 (100.0%) |
Families and Households in Mount Carbon
Median Family Size in Mount Carbon
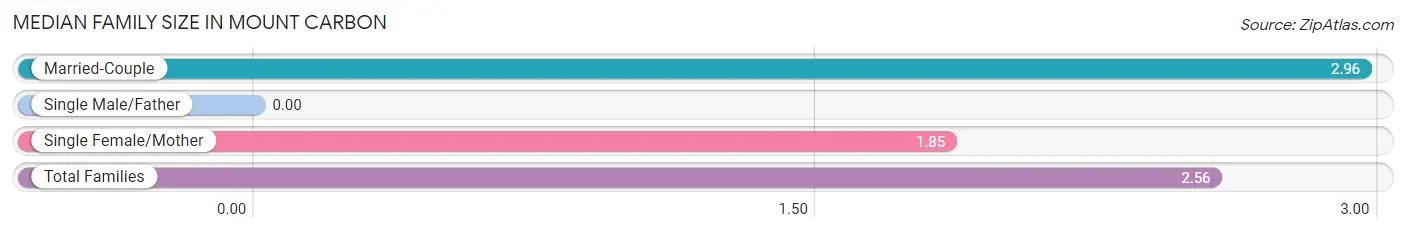
| Family Type | # Families | Family Size |
| Married-Couple | 47 (64.4%) | 2.96 |
| Single Male/Father | 0 (0.0%) | - |
| Single Female/Mother | 26 (35.6%) | 1.85 |
| Total Families | 73 (100.0%) | 2.56 |
Median Household Size in Mount Carbon
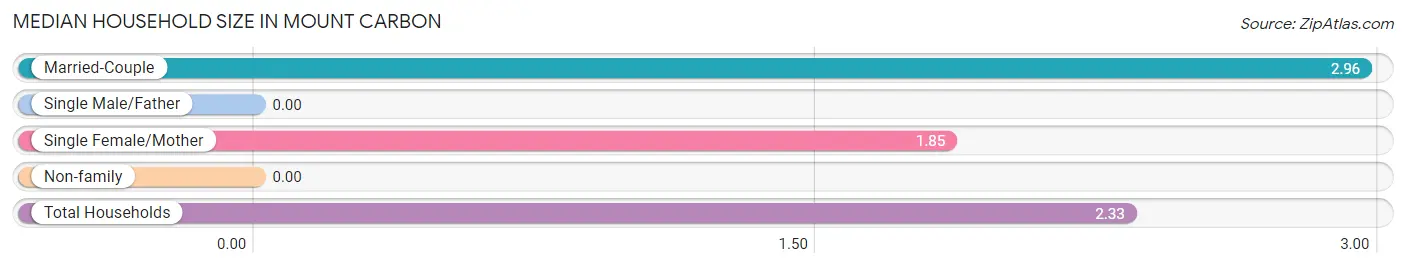
| Household Type | # Households | Household Size |
| Married-Couple | 47 (54.6%) | 2.96 |
| Single Male/Father | 0 (0.0%) | - |
| Single Female/Mother | 26 (30.2%) | 1.85 |
| Non-family | 13 (15.1%) | - |
| Total Households | 86 (100.0%) | 2.33 |
Household Size by Marriage Status in Mount Carbon
Out of a total of 86 households in Mount Carbon, 73 (84.9%) are family households, while 13 (15.1%) are nonfamily households. The most numerous type of family households are 2-person households, comprising 39, and the most common type of nonfamily households are 1-person households, comprising 13.
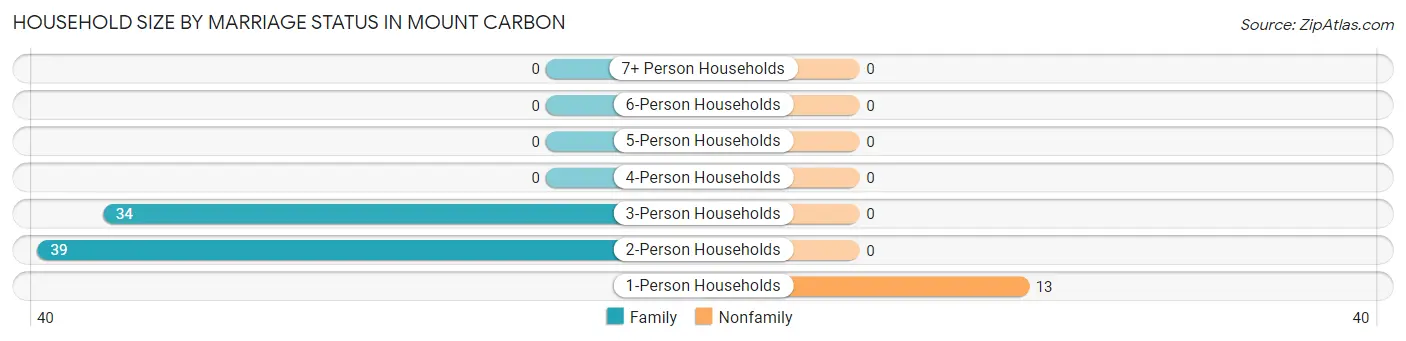
| Household Size | Family Households | Nonfamily Households |
| 1-Person Households | - | 13 (15.1%) |
| 2-Person Households | 39 (45.4%) | 0 (0.0%) |
| 3-Person Households | 34 (39.5%) | 0 (0.0%) |
| 4-Person Households | 0 (0.0%) | 0 (0.0%) |
| 5-Person Households | 0 (0.0%) | 0 (0.0%) |
| 6-Person Households | 0 (0.0%) | 0 (0.0%) |
| 7+ Person Households | 0 (0.0%) | 0 (0.0%) |
| Total | 73 (84.9%) | 13 (15.1%) |
Female Fertility in Mount Carbon
Fertility by Age in Mount Carbon
| Age Bracket | Women with Births | Births / 1,000 Women |
| 15 to 19 years | 0 (0.0%) | 0.0 |
| 20 to 34 years | 0 (0.0%) | 0.0 |
| 35 to 50 years | 0 (0.0%) | 0.0 |
| Total | 0 (0.0%) | 0.0 |
Fertility by Age by Marriage Status in Mount Carbon
| Age Bracket | Married | Unmarried |
| 15 to 19 years | 0 (0.0%) | 0 (0.0%) |
| 20 to 34 years | 0 (0.0%) | 0 (0.0%) |
| 35 to 50 years | 0 (0.0%) | 0 (0.0%) |
| Total | 0 (0.0%) | 0 (0.0%) |
Fertility by Education in Mount Carbon
| Educational Attainment | Women with Births | Births / 1,000 Women |
| Less than High School | 0 (0.0%) | 0.0 |
| High School Diploma | 0 (0.0%) | 0.0 |
| College or Associate's Degree | 0 (0.0%) | 0.0 |
| Bachelor's Degree | 0 (0.0%) | 0.0 |
| Graduate Degree | 0 (0.0%) | 0.0 |
| Total | 0 (0.0%) | 0.0 |
Fertility by Education by Marriage Status in Mount Carbon
| Educational Attainment | Married | Unmarried |
| Less than High School | 0 (0.0%) | 0 (0.0%) |
| High School Diploma | 0 (0.0%) | 0 (0.0%) |
| College or Associate's Degree | 0 (0.0%) | 0 (0.0%) |
| Bachelor's Degree | 0 (0.0%) | 0 (0.0%) |
| Graduate Degree | 0 (0.0%) | 0 (0.0%) |
| Total | 0 (0.0%) | 0 (0.0%) |
Employment Characteristics in Mount Carbon
Employment by Class of Employer in Mount Carbon
Among the 66 employed individuals in Mount Carbon, , and private company employees (66 | 100.0%) make up the most common classes of employment.
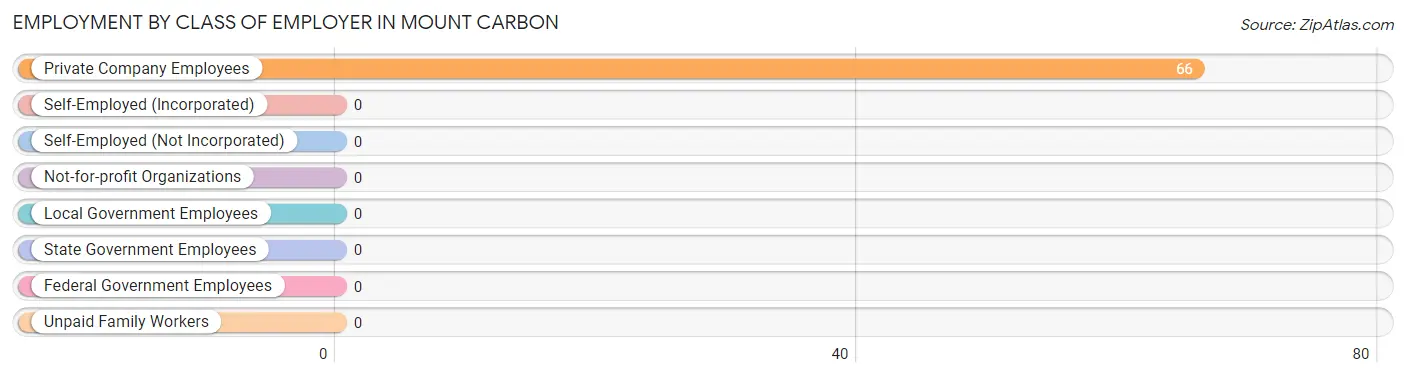
| Employer Class | # Employees | % Employees |
| Private Company Employees | 66 | 100.0% |
| Self-Employed (Incorporated) | 0 | 0.0% |
| Self-Employed (Not Incorporated) | 0 | 0.0% |
| Not-for-profit Organizations | 0 | 0.0% |
| Local Government Employees | 0 | 0.0% |
| State Government Employees | 0 | 0.0% |
| Federal Government Employees | 0 | 0.0% |
| Unpaid Family Workers | 0 | 0.0% |
| Total | 66 | 100.0% |
Employment Status by Age in Mount Carbon
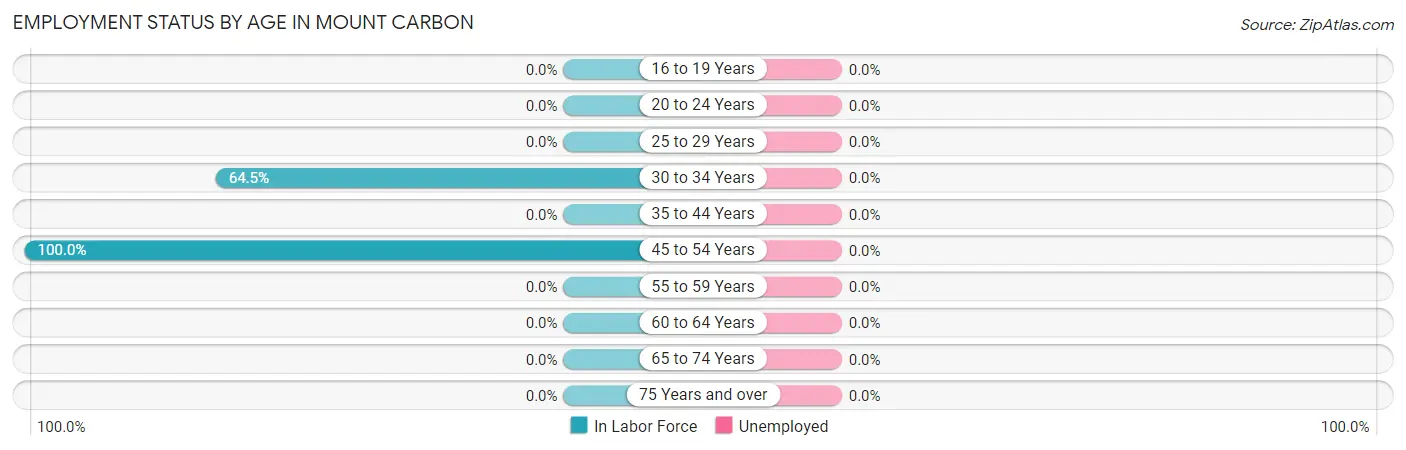
| Age Bracket | In Labor Force | Unemployed |
| 16 to 19 Years | 0 (0.0%) | 0 (0.0%) |
| 20 to 24 Years | 0 (0.0%) | 0 (0.0%) |
| 25 to 29 Years | 0 (0.0%) | 0 (0.0%) |
| 30 to 34 Years | 40 (64.5%) | 0 (0.0%) |
| 35 to 44 Years | 0 (0.0%) | 0 (0.0%) |
| 45 to 54 Years | 26 (100.0%) | 0 (0.0%) |
| 55 to 59 Years | 0 (0.0%) | 0 (0.0%) |
| 60 to 64 Years | 0 (0.0%) | 0 (0.0%) |
| 65 to 74 Years | 0 (0.0%) | 0 (0.0%) |
| 75 Years and over | 0 (0.0%) | 0 (0.0%) |
| Total | 66 (33.0%) | 0 (0.0%) |
Employment Status by Educational Attainment in Mount Carbon
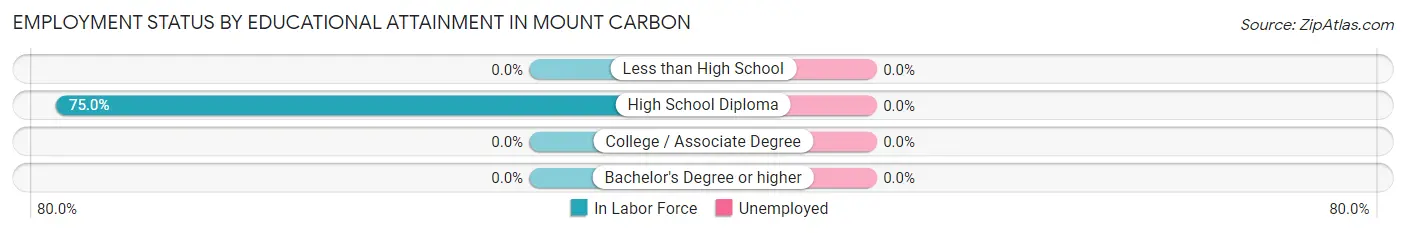
| Educational Attainment | In Labor Force | Unemployed |
| Less than High School | 0 (0.0%) | 0 (0.0%) |
| High School Diploma | 66 (75.0%) | 0 (0.0%) |
| College / Associate Degree | 0 (0.0%) | 0 (0.0%) |
| Bachelor's Degree or higher | 0 (0.0%) | 0 (0.0%) |
| Total | 66 (65.3%) | 0 (0.0%) |
Employment Occupations by Sex in Mount Carbon
Management, Business, Science and Arts Occupations
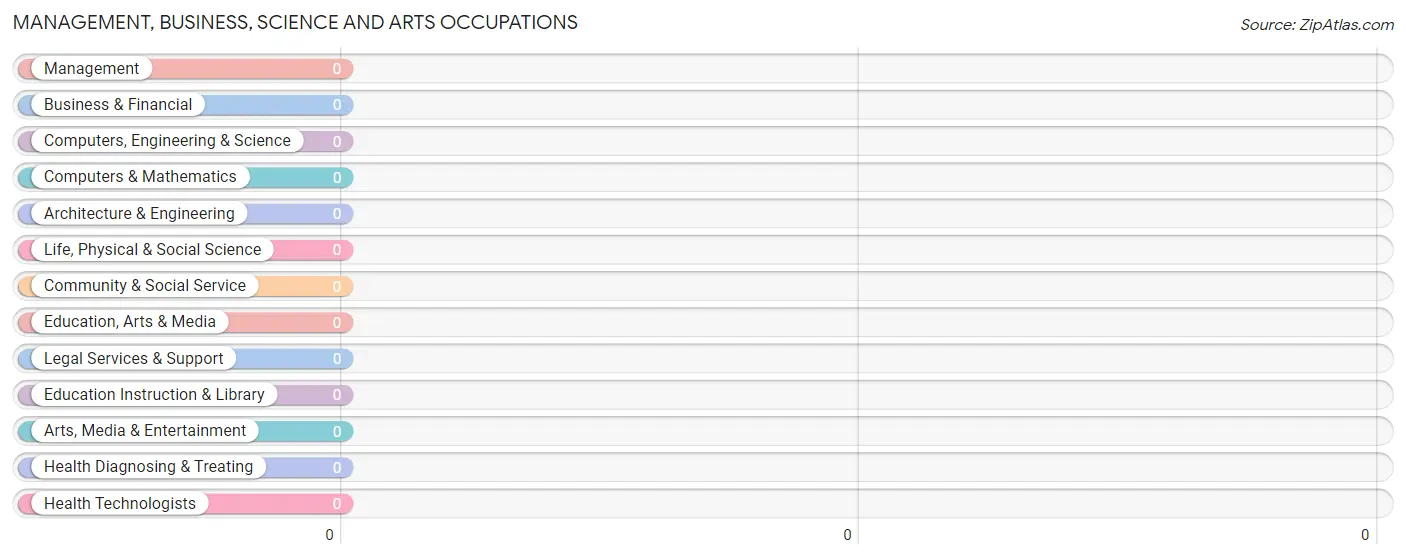
Management, Business, Science and Arts Occupations by Sex
| Occupation | Male | Female |
| Management | 0 (0.0%) | 0 (0.0%) |
| Business & Financial | 0 (0.0%) | 0 (0.0%) |
| Computers, Engineering & Science | 0 (0.0%) | 0 (0.0%) |
| Computers & Mathematics | 0 (0.0%) | 0 (0.0%) |
| Architecture & Engineering | 0 (0.0%) | 0 (0.0%) |
| Life, Physical & Social Science | 0 (0.0%) | 0 (0.0%) |
| Community & Social Service | 0 (0.0%) | 0 (0.0%) |
| Education, Arts & Media | 0 (0.0%) | 0 (0.0%) |
| Legal Services & Support | 0 (0.0%) | 0 (0.0%) |
| Education Instruction & Library | 0 (0.0%) | 0 (0.0%) |
| Arts, Media & Entertainment | 0 (0.0%) | 0 (0.0%) |
| Health Diagnosing & Treating | 0 (0.0%) | 0 (0.0%) |
| Health Technologists | 0 (0.0%) | 0 (0.0%) |
| Total (Category) | 0 (0.0%) | 0 (0.0%) |
| Total (Overall) | 40 (60.6%) | 26 (39.4%) |
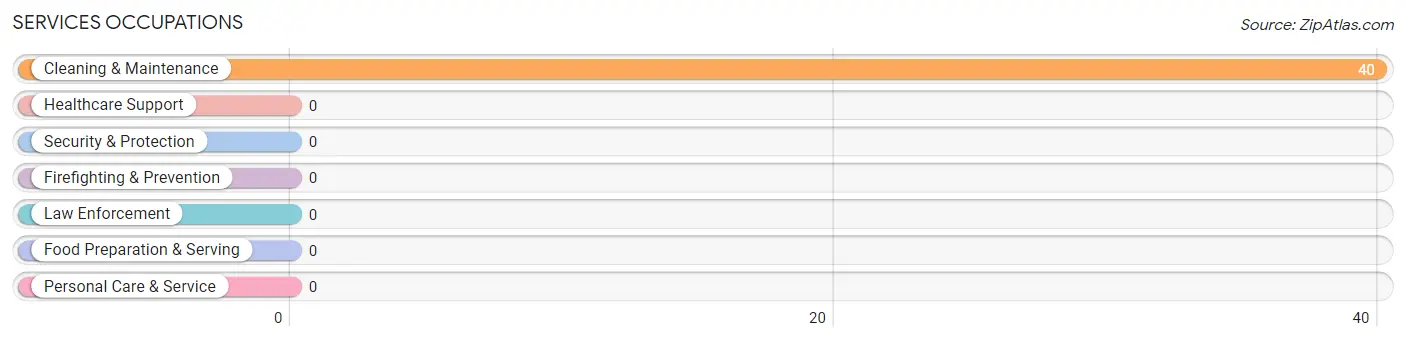
Services Occupations
The most common Services occupations in Mount Carbon are , and Cleaning & Maintenance (40 | 60.6%).
Services Occupations by Sex
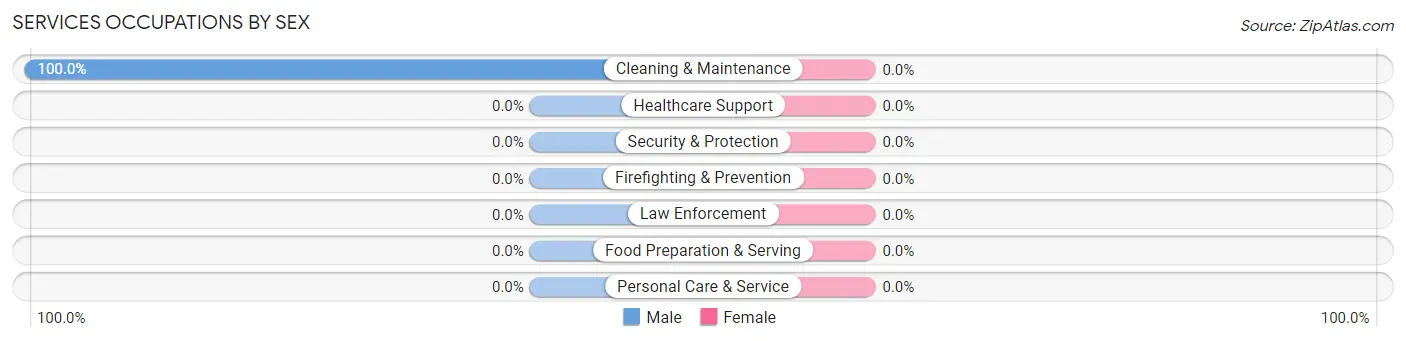
| Occupation | Male | Female |
| Healthcare Support | 0 (0.0%) | 0 (0.0%) |
| Security & Protection | 0 (0.0%) | 0 (0.0%) |
| Firefighting & Prevention | 0 (0.0%) | 0 (0.0%) |
| Law Enforcement | 0 (0.0%) | 0 (0.0%) |
| Food Preparation & Serving | 0 (0.0%) | 0 (0.0%) |
| Cleaning & Maintenance | 40 (100.0%) | 0 (0.0%) |
| Personal Care & Service | 0 (0.0%) | 0 (0.0%) |
| Total (Category) | 40 (100.0%) | 0 (0.0%) |
| Total (Overall) | 40 (60.6%) | 26 (39.4%) |
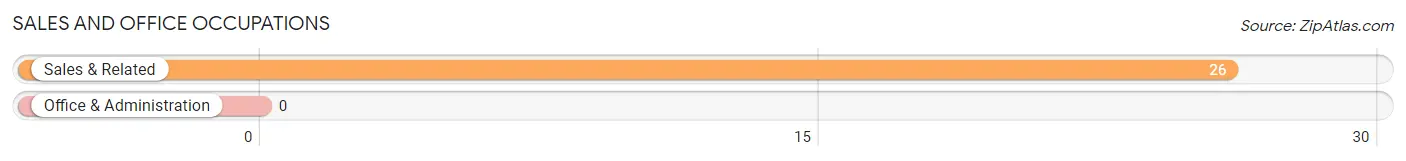
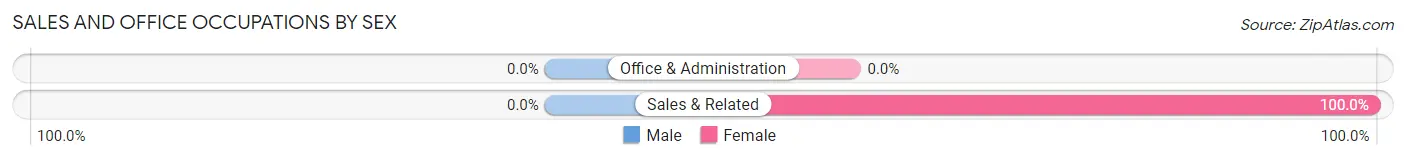
Sales and Office Occupations
The most common Sales and Office occupations in Mount Carbon are , and Sales & Related (26 | 39.4%).
Sales and Office Occupations by Sex
| Occupation | Male | Female |
| Sales & Related | 0 (0.0%) | 26 (100.0%) |
| Office & Administration | 0 (0.0%) | 0 (0.0%) |
| Total (Category) | 0 (0.0%) | 26 (100.0%) |
| Total (Overall) | 40 (60.6%) | 26 (39.4%) |
Natural Resources, Construction and Maintenance Occupations
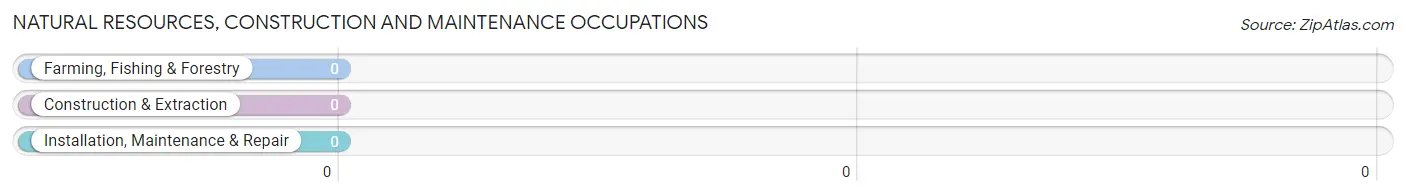
Natural Resources, Construction and Maintenance Occupations by Sex
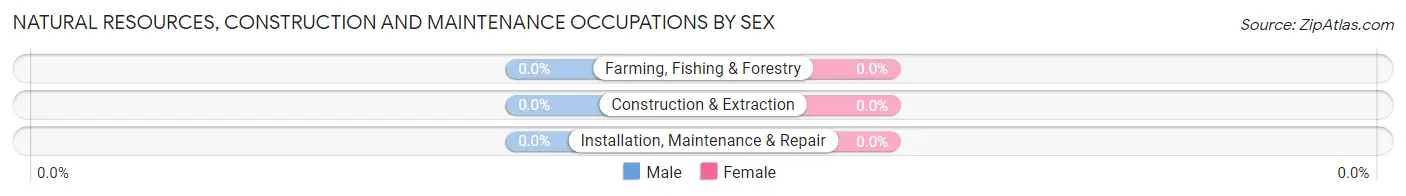
| Occupation | Male | Female |
| Farming, Fishing & Forestry | 0 (0.0%) | 0 (0.0%) |
| Construction & Extraction | 0 (0.0%) | 0 (0.0%) |
| Installation, Maintenance & Repair | 0 (0.0%) | 0 (0.0%) |
| Total (Category) | 0 (0.0%) | 0 (0.0%) |
| Total (Overall) | 40 (60.6%) | 26 (39.4%) |
Production, Transportation and Moving Occupations
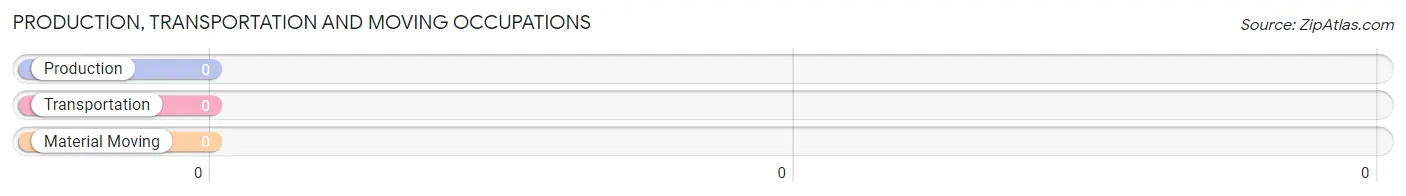
Production, Transportation and Moving Occupations by Sex
| Occupation | Male | Female |
| Production | 0 (0.0%) | 0 (0.0%) |
| Transportation | 0 (0.0%) | 0 (0.0%) |
| Material Moving | 0 (0.0%) | 0 (0.0%) |
| Total (Category) | 0 (0.0%) | 0 (0.0%) |
| Total (Overall) | 40 (60.6%) | 26 (39.4%) |
Employment Industries by Sex in Mount Carbon
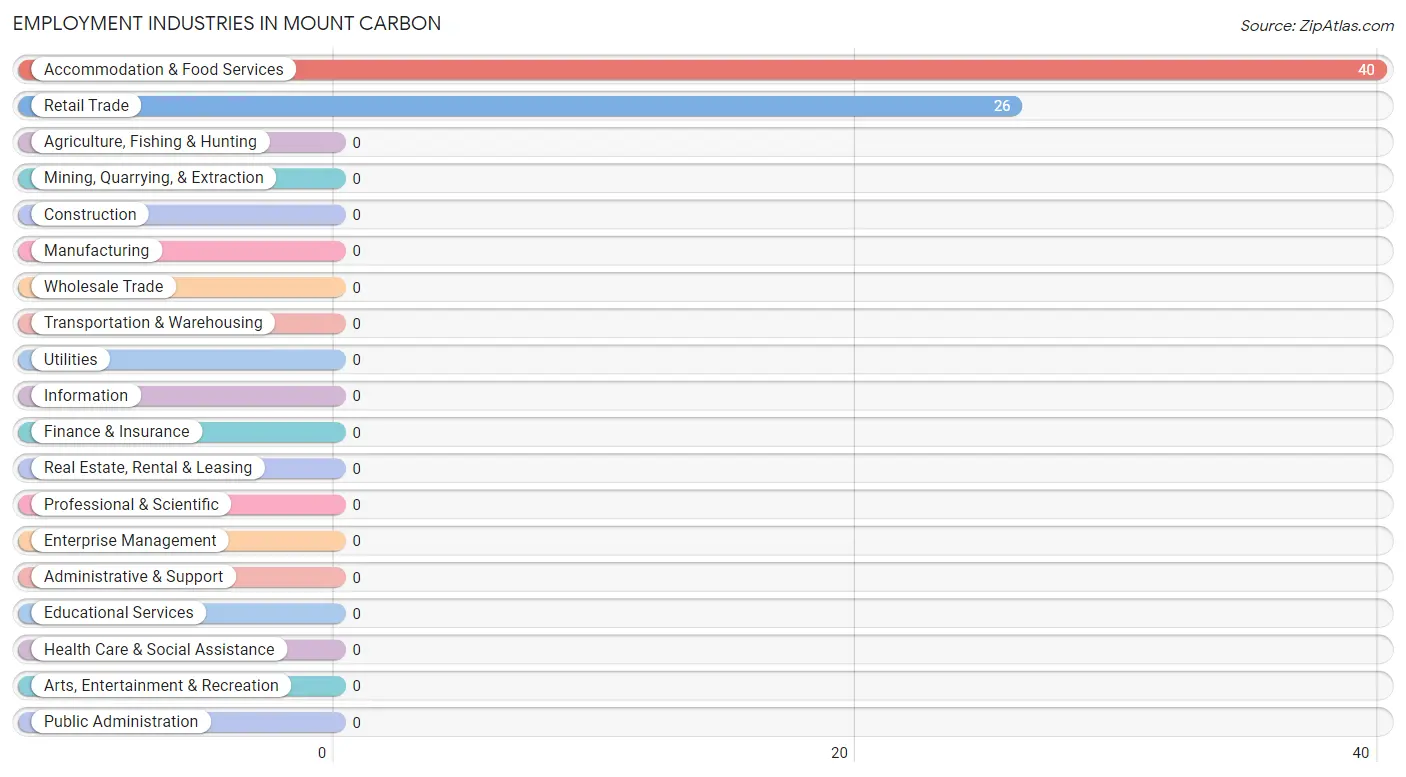
Employment Industries in Mount Carbon
The major employment industries in Mount Carbon include Accommodation & Food Services (40 | 60.6%), and Retail Trade (26 | 39.4%).
Employment Industries by Sex in Mount Carbon
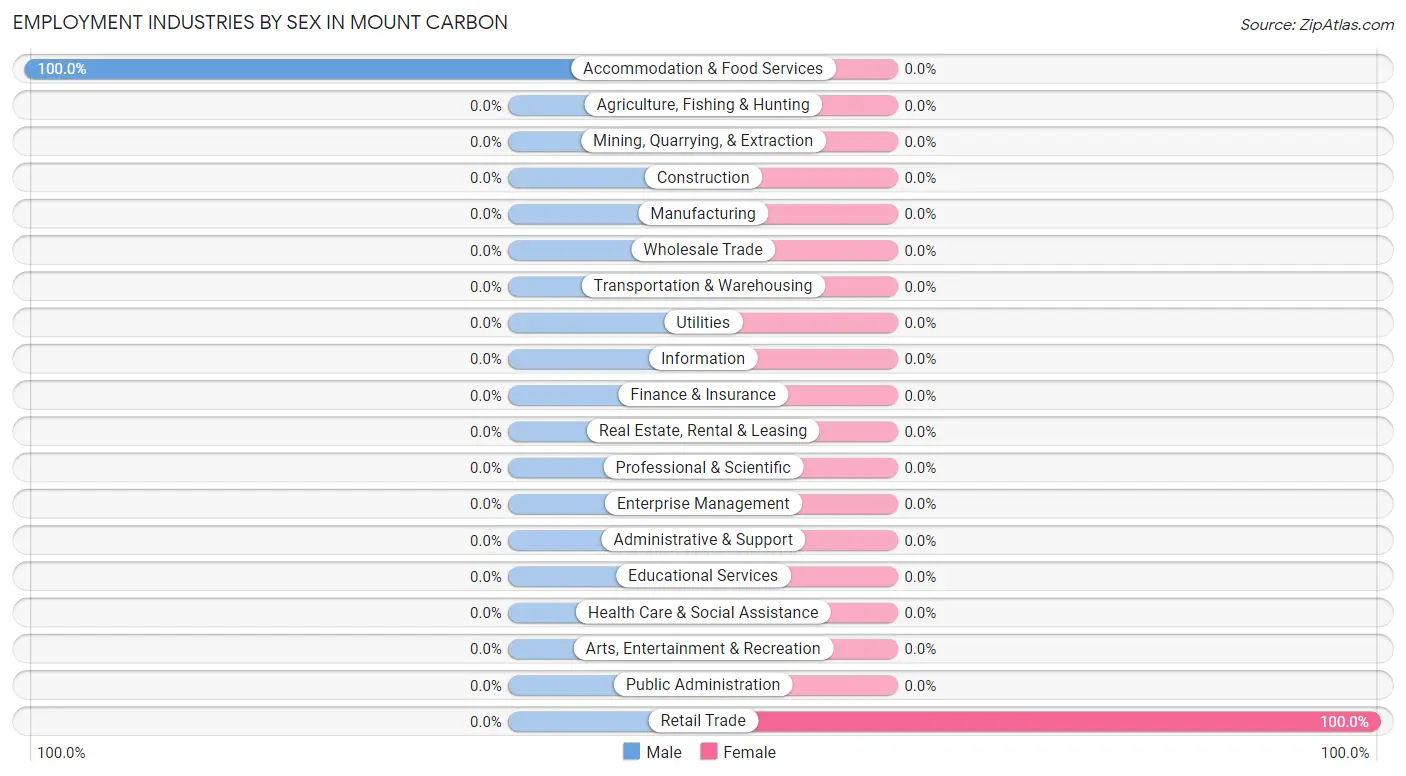
| Industry | Male | Female |
| Agriculture, Fishing & Hunting | 0 (0.0%) | 0 (0.0%) |
| Mining, Quarrying, & Extraction | 0 (0.0%) | 0 (0.0%) |
| Construction | 0 (0.0%) | 0 (0.0%) |
| Manufacturing | 0 (0.0%) | 0 (0.0%) |
| Wholesale Trade | 0 (0.0%) | 0 (0.0%) |
| Retail Trade | 0 (0.0%) | 26 (100.0%) |
| Transportation & Warehousing | 0 (0.0%) | 0 (0.0%) |
| Utilities | 0 (0.0%) | 0 (0.0%) |
| Information | 0 (0.0%) | 0 (0.0%) |
| Finance & Insurance | 0 (0.0%) | 0 (0.0%) |
| Real Estate, Rental & Leasing | 0 (0.0%) | 0 (0.0%) |
| Professional & Scientific | 0 (0.0%) | 0 (0.0%) |
| Enterprise Management | 0 (0.0%) | 0 (0.0%) |
| Administrative & Support | 0 (0.0%) | 0 (0.0%) |
| Educational Services | 0 (0.0%) | 0 (0.0%) |
| Health Care & Social Assistance | 0 (0.0%) | 0 (0.0%) |
| Arts, Entertainment & Recreation | 0 (0.0%) | 0 (0.0%) |
| Accommodation & Food Services | 40 (100.0%) | 0 (0.0%) |
| Public Administration | 0 (0.0%) | 0 (0.0%) |
| Total | 40 (60.6%) | 26 (39.4%) |
Education in Mount Carbon
School Enrollment in Mount Carbon
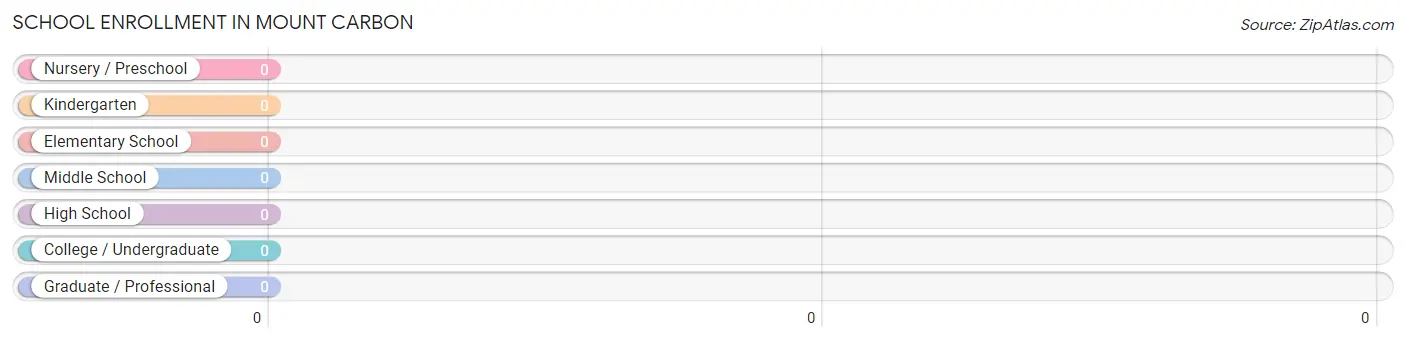
| School Level | # Students | % Students |
| Nursery / Preschool | 0 | 0.0% |
| Kindergarten | 0 | 0.0% |
| Elementary School | 0 | 0.0% |
| Middle School | 0 | 0.0% |
| High School | 0 | 0.0% |
| College / Undergraduate | 0 | 0.0% |
| Graduate / Professional | 0 | 0.0% |
| Total | 0 | 0.0% |
School Enrollment by Age by Funding Source in Mount Carbon
| Age Bracket | Public School | Private School |
| 3 to 4 Year Olds | 0 (0.0%) | 0 (0.0%) |
| 5 to 9 Year Old | 0 (0.0%) | 0 (0.0%) |
| 10 to 14 Year Olds | 0 (0.0%) | 0 (0.0%) |
| 15 to 17 Year Olds | 0 (0.0%) | 0 (0.0%) |
| 18 to 19 Year Olds | 0 (0.0%) | 0 (0.0%) |
| 20 to 24 Year Olds | 0 (0.0%) | 0 (0.0%) |
| 25 to 34 Year Olds | 0 (0.0%) | 0 (0.0%) |
| 35 Years and over | 0 (0.0%) | 0 (0.0%) |
| Total | 0 (0.0%) | 0 (0.0%) |
Educational Attainment by Field of Study in Mount Carbon
| Field of Study | # Graduates | % Graduates |
| Computers & Mathematics | 0 | 0.0% |
| Bio, Nature & Agricultural | 0 | 0.0% |
| Physical & Health Sciences | 0 | 0.0% |
| Psychology | 0 | 0.0% |
| Social Sciences | 0 | 0.0% |
| Engineering | 0 | 0.0% |
| Multidisciplinary Studies | 0 | 0.0% |
| Science & Technology | 0 | 0.0% |
| Business | 0 | 0.0% |
| Education | 0 | 0.0% |
| Literature & Languages | 0 | 0.0% |
| Liberal Arts & History | 0 | 0.0% |
| Visual & Performing Arts | 0 | 0.0% |
| Communications | 0 | 0.0% |
| Arts & Humanities | 0 | 0.0% |
| Total | 0 | 0.0% |
Transportation & Commute in Mount Carbon
Vehicle Availability by Sex in Mount Carbon
The most prevalent vehicle ownership categories in Mount Carbon are males with 2 vehicles (40, accounting for 100.0%) and females with 2 vehicles (0, making up 153.8%).
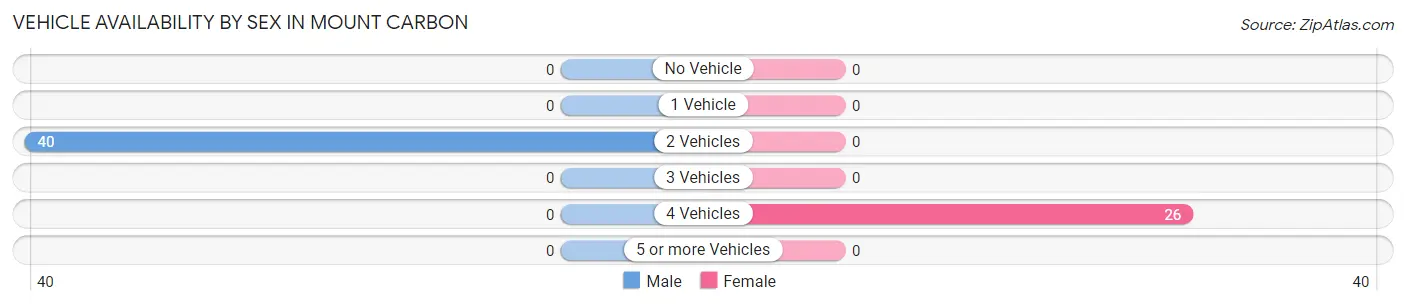
| Vehicles Available | Male | Female |
| No Vehicle | 0 (0.0%) | 0 (0.0%) |
| 1 Vehicle | 0 (0.0%) | 0 (0.0%) |
| 2 Vehicles | 40 (100.0%) | 0 (0.0%) |
| 3 Vehicles | 0 (0.0%) | 0 (0.0%) |
| 4 Vehicles | 0 (0.0%) | 26 (100.0%) |
| 5 or more Vehicles | 0 (0.0%) | 0 (0.0%) |
| Total | 40 (100.0%) | 26 (100.0%) |
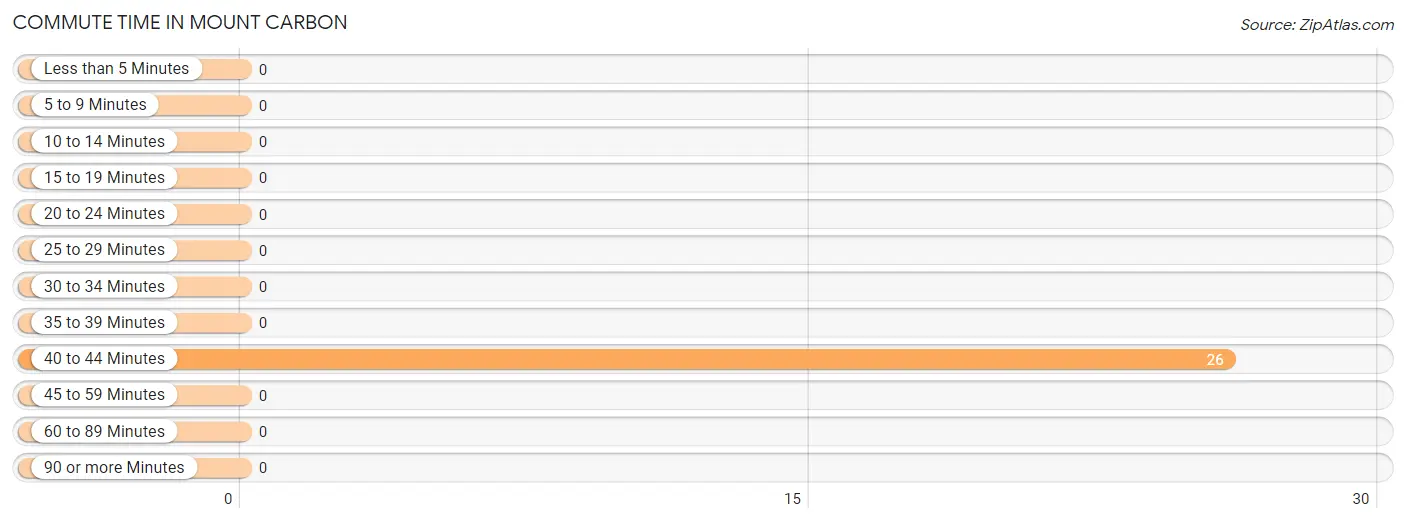
Commute Time in Mount Carbon
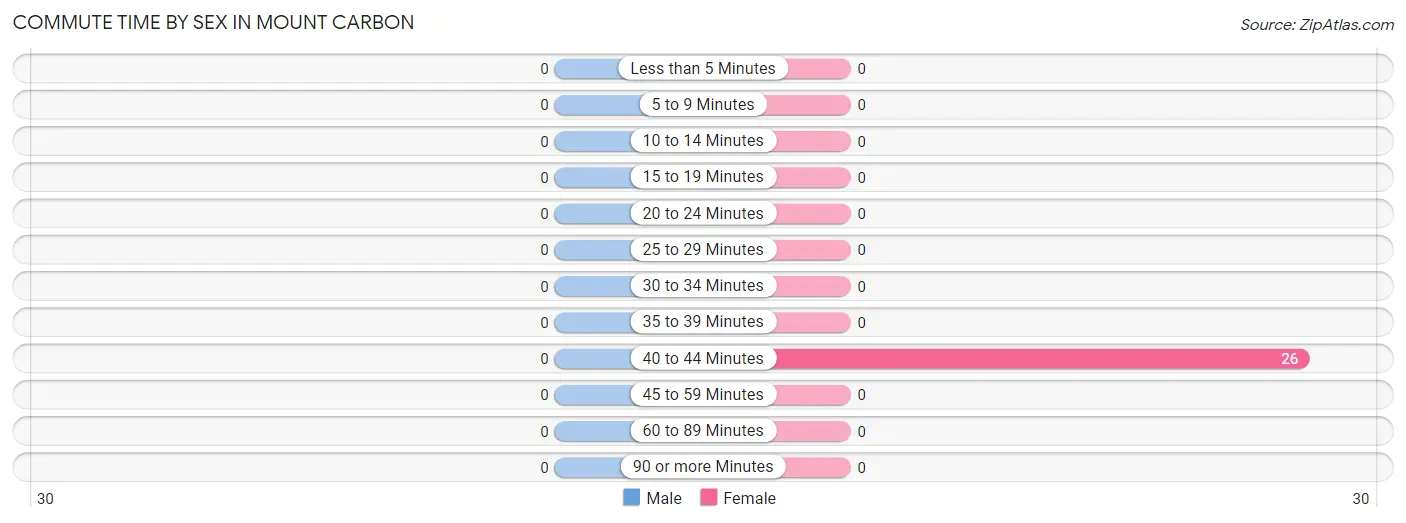
The most frequently occuring commute durations in Mount Carbon are 40 to 44 minutes (26 commuters, 100.0%), less than 5 minutes (0 commuters, 0.0%), and 5 to 9 minutes (0 commuters, 0.0%).
| Commute Time | # Commuters | % Commuters |
| Less than 5 Minutes | 0 | 0.0% |
| 5 to 9 Minutes | 0 | 0.0% |
| 10 to 14 Minutes | 0 | 0.0% |
| 15 to 19 Minutes | 0 | 0.0% |
| 20 to 24 Minutes | 0 | 0.0% |
| 25 to 29 Minutes | 0 | 0.0% |
| 30 to 34 Minutes | 0 | 0.0% |
| 35 to 39 Minutes | 0 | 0.0% |
| 40 to 44 Minutes | 26 | 100.0% |
| 45 to 59 Minutes | 0 | 0.0% |
| 60 to 89 Minutes | 0 | 0.0% |
| 90 or more Minutes | 0 | 0.0% |
Commute Time by Sex in Mount Carbon
| Commute Time | Male | Female |
| Less than 5 Minutes | 0 (0.0%) | 0 (0.0%) |
| 5 to 9 Minutes | 0 (0.0%) | 0 (0.0%) |
| 10 to 14 Minutes | 0 (0.0%) | 0 (0.0%) |
| 15 to 19 Minutes | 0 (0.0%) | 0 (0.0%) |
| 20 to 24 Minutes | 0 (0.0%) | 0 (0.0%) |
| 25 to 29 Minutes | 0 (0.0%) | 0 (0.0%) |
| 30 to 34 Minutes | 0 (0.0%) | 0 (0.0%) |
| 35 to 39 Minutes | 0 (0.0%) | 0 (0.0%) |
| 40 to 44 Minutes | 0 (0.0%) | 26 (100.0%) |
| 45 to 59 Minutes | 0 (0.0%) | 0 (0.0%) |
| 60 to 89 Minutes | 0 (0.0%) | 0 (0.0%) |
| 90 or more Minutes | 0 (0.0%) | 0 (0.0%) |
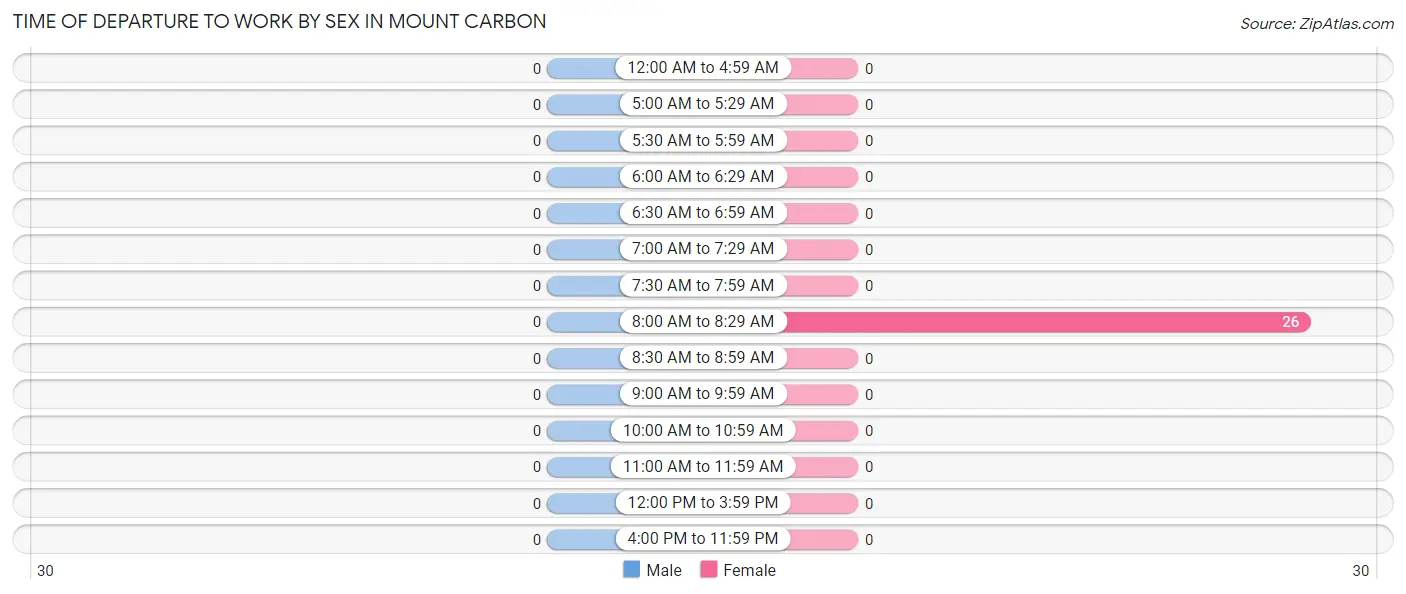
Time of Departure to Work by Sex in Mount Carbon
| Time of Departure | Male | Female |
| 12:00 AM to 4:59 AM | 0 (0.0%) | 0 (0.0%) |
| 5:00 AM to 5:29 AM | 0 (0.0%) | 0 (0.0%) |
| 5:30 AM to 5:59 AM | 0 (0.0%) | 0 (0.0%) |
| 6:00 AM to 6:29 AM | 0 (0.0%) | 0 (0.0%) |
| 6:30 AM to 6:59 AM | 0 (0.0%) | 0 (0.0%) |
| 7:00 AM to 7:29 AM | 0 (0.0%) | 0 (0.0%) |
| 7:30 AM to 7:59 AM | 0 (0.0%) | 0 (0.0%) |
| 8:00 AM to 8:29 AM | 0 (0.0%) | 26 (100.0%) |
| 8:30 AM to 8:59 AM | 0 (0.0%) | 0 (0.0%) |
| 9:00 AM to 9:59 AM | 0 (0.0%) | 0 (0.0%) |
| 10:00 AM to 10:59 AM | 0 (0.0%) | 0 (0.0%) |
| 11:00 AM to 11:59 AM | 0 (0.0%) | 0 (0.0%) |
| 12:00 PM to 3:59 PM | 0 (0.0%) | 0 (0.0%) |
| 4:00 PM to 11:59 PM | 0 (0.0%) | 0 (0.0%) |
| Total | 0 (0.0%) | 26 (100.0%) |
Housing Occupancy in Mount Carbon
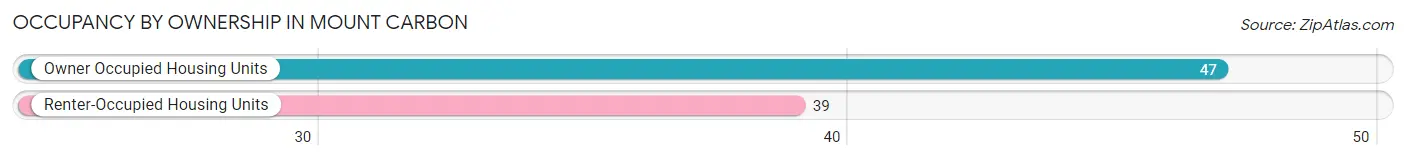
Occupancy by Ownership in Mount Carbon
Of the total 86 dwellings in Mount Carbon, owner-occupied units account for 47 (54.6%), while renter-occupied units make up 39 (45.4%).
| Occupancy | # Housing Units | % Housing Units |
| Owner Occupied Housing Units | 47 | 54.6% |
| Renter-Occupied Housing Units | 39 | 45.4% |
| Total Occupied Housing Units | 86 | 100.0% |
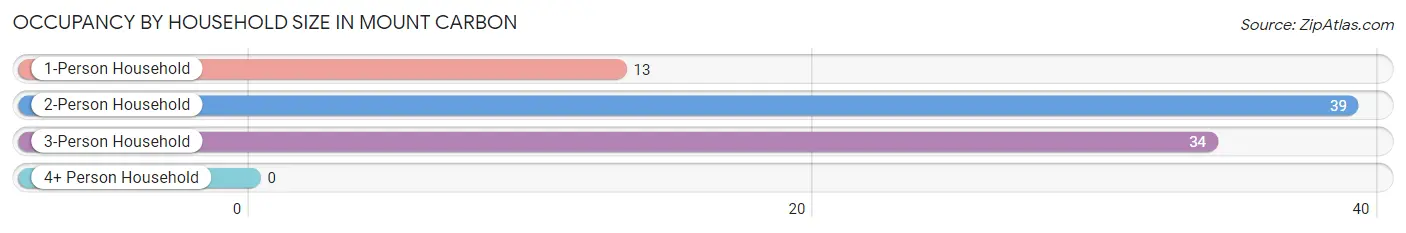
Occupancy by Household Size in Mount Carbon
| Household Size | # Housing Units | % Housing Units |
| 1-Person Household | 13 | 15.1% |
| 2-Person Household | 39 | 45.4% |
| 3-Person Household | 34 | 39.5% |
| 4+ Person Household | 0 | 0.0% |
| Total Housing Units | 86 | 100.0% |
Occupancy by Ownership by Household Size in Mount Carbon
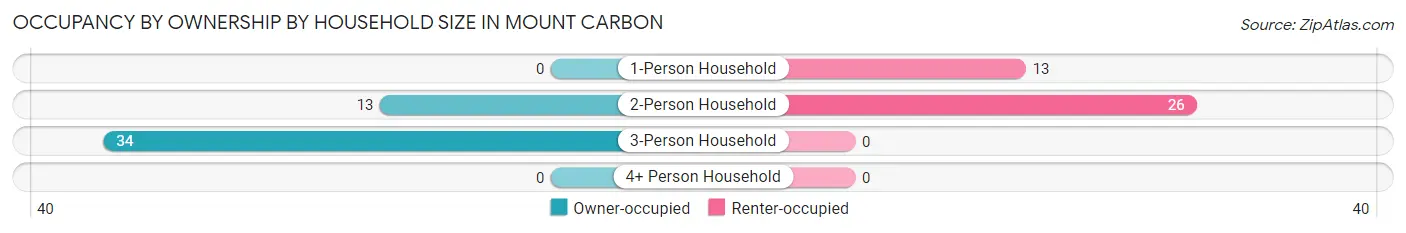
| Household Size | Owner-occupied | Renter-occupied |
| 1-Person Household | 0 (0.0%) | 13 (100.0%) |
| 2-Person Household | 13 (33.3%) | 26 (66.7%) |
| 3-Person Household | 34 (100.0%) | 0 (0.0%) |
| 4+ Person Household | 0 (0.0%) | 0 (0.0%) |
| Total Housing Units | 47 (54.6%) | 39 (45.4%) |
Occupancy by Educational Attainment in Mount Carbon
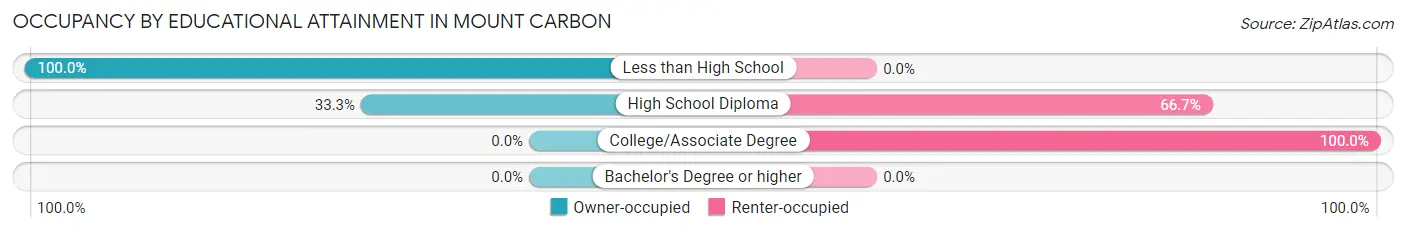
| Household Size | Owner-occupied | Renter-occupied |
| Less than High School | 34 (100.0%) | 0 (0.0%) |
| High School Diploma | 13 (33.3%) | 26 (66.7%) |
| College/Associate Degree | 0 (0.0%) | 13 (100.0%) |
| Bachelor's Degree or higher | 0 (0.0%) | 0 (0.0%) |
Occupancy by Age of Householder in Mount Carbon
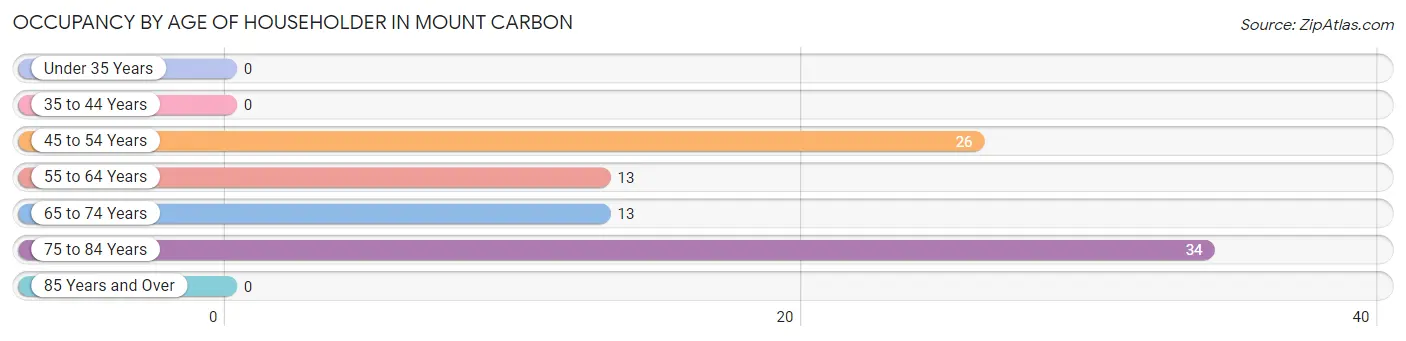
| Age Bracket | # Households | % Households |
| Under 35 Years | 0 | 0.0% |
| 35 to 44 Years | 0 | 0.0% |
| 45 to 54 Years | 26 | 30.2% |
| 55 to 64 Years | 13 | 15.1% |
| 65 to 74 Years | 13 | 15.1% |
| 75 to 84 Years | 34 | 39.5% |
| 85 Years and Over | 0 | 0.0% |
| Total | 86 | 100.0% |
Housing Finances in Mount Carbon
Median Income by Occupancy in Mount Carbon
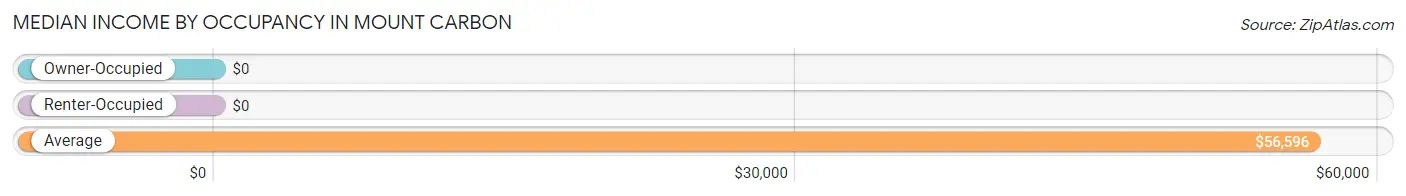
| Occupancy Type | # Households | Median Income |
| Owner-Occupied | 47 (54.6%) | $0 |
| Renter-Occupied | 39 (45.4%) | $0 |
| Average | 86 (100.0%) | $56,596 |
Occupancy by Householder Income Bracket in Mount Carbon
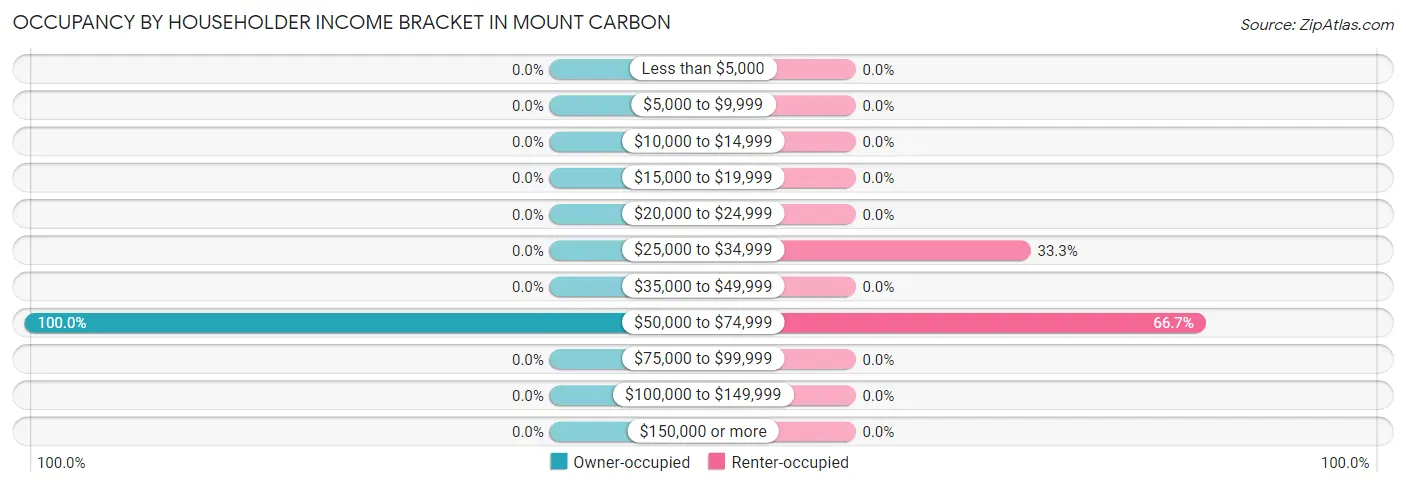
| Income Bracket | Owner-occupied | Renter-occupied |
| Less than $5,000 | 0 (0.0%) | 0 (0.0%) |
| $5,000 to $9,999 | 0 (0.0%) | 0 (0.0%) |
| $10,000 to $14,999 | 0 (0.0%) | 0 (0.0%) |
| $15,000 to $19,999 | 0 (0.0%) | 0 (0.0%) |
| $20,000 to $24,999 | 0 (0.0%) | 0 (0.0%) |
| $25,000 to $34,999 | 0 (0.0%) | 13 (33.3%) |
| $35,000 to $49,999 | 0 (0.0%) | 0 (0.0%) |
| $50,000 to $74,999 | 47 (100.0%) | 26 (66.7%) |
| $75,000 to $99,999 | 0 (0.0%) | 0 (0.0%) |
| $100,000 to $149,999 | 0 (0.0%) | 0 (0.0%) |
| $150,000 or more | 0 (0.0%) | 0 (0.0%) |
| Total | 47 (100.0%) | 39 (100.0%) |
Monthly Housing Cost Tiers in Mount Carbon
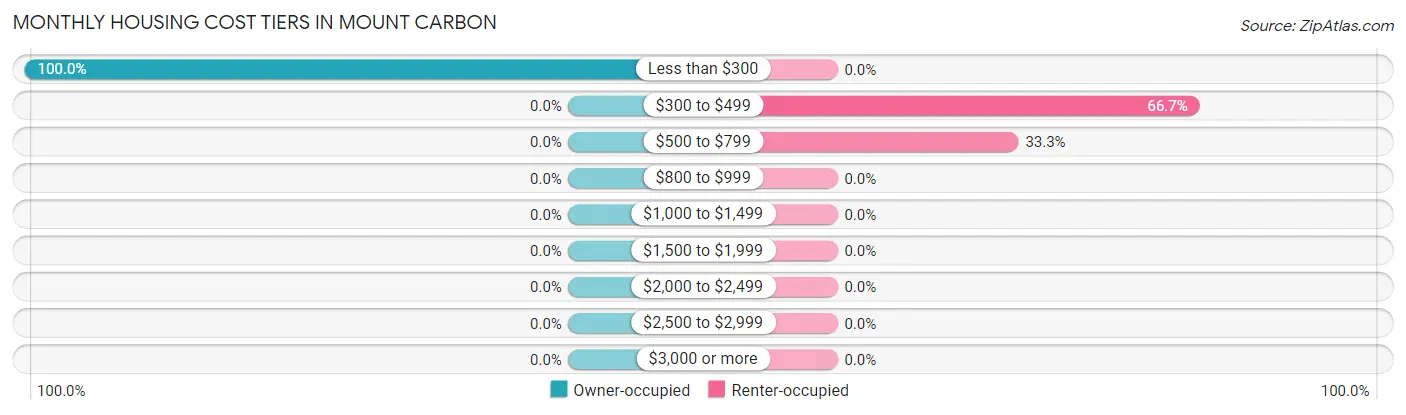
| Monthly Cost | Owner-occupied | Renter-occupied |
| Less than $300 | 47 (100.0%) | 0 (0.0%) |
| $300 to $499 | 0 (0.0%) | 26 (66.7%) |
| $500 to $799 | 0 (0.0%) | 13 (33.3%) |
| $800 to $999 | 0 (0.0%) | 0 (0.0%) |
| $1,000 to $1,499 | 0 (0.0%) | 0 (0.0%) |
| $1,500 to $1,999 | 0 (0.0%) | 0 (0.0%) |
| $2,000 to $2,499 | 0 (0.0%) | 0 (0.0%) |
| $2,500 to $2,999 | 0 (0.0%) | 0 (0.0%) |
| $3,000 or more | 0 (0.0%) | 0 (0.0%) |
| Total | 47 (100.0%) | 39 (100.0%) |
Physical Housing Characteristics in Mount Carbon
Housing Structures in Mount Carbon
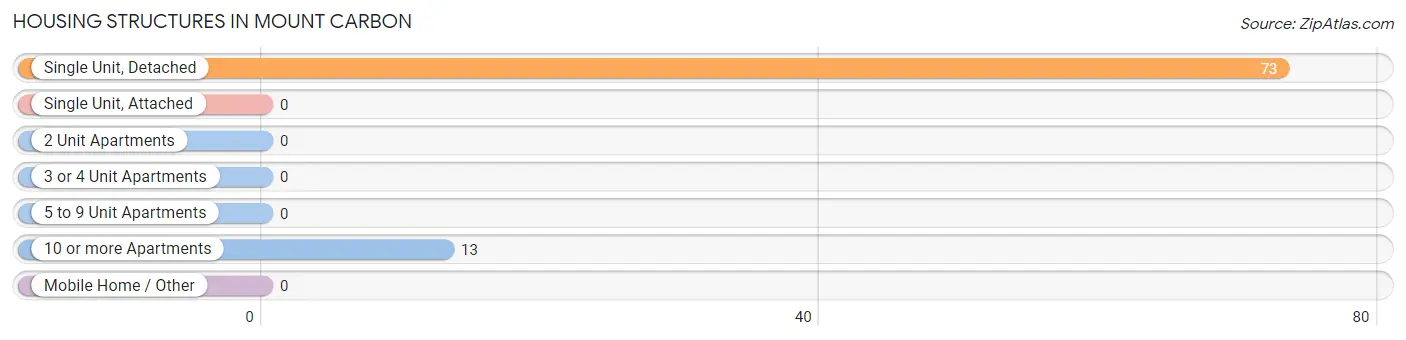
| Structure Type | # Housing Units | % Housing Units |
| Single Unit, Detached | 73 | 84.9% |
| Single Unit, Attached | 0 | 0.0% |
| 2 Unit Apartments | 0 | 0.0% |
| 3 or 4 Unit Apartments | 0 | 0.0% |
| 5 to 9 Unit Apartments | 0 | 0.0% |
| 10 or more Apartments | 13 | 15.1% |
| Mobile Home / Other | 0 | 0.0% |
| Total | 86 | 100.0% |
Housing Structures by Occupancy in Mount Carbon
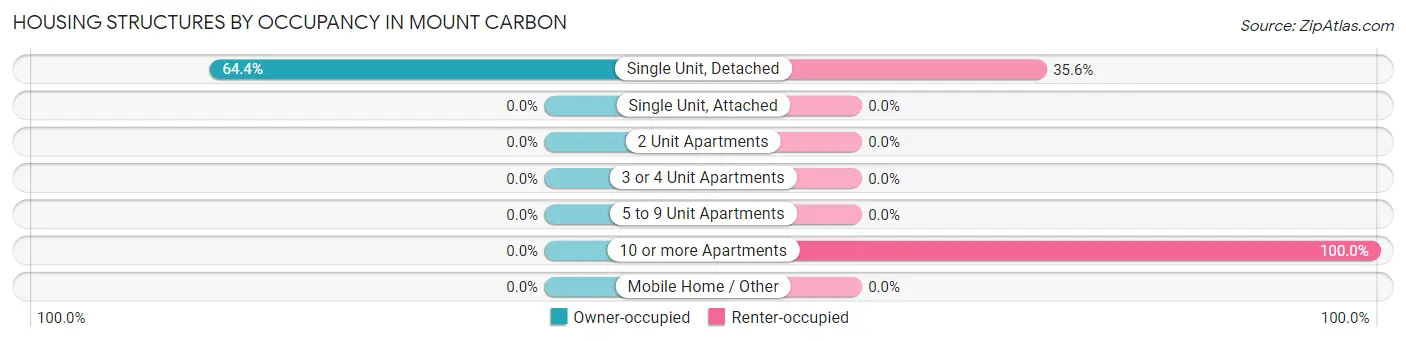
| Structure Type | Owner-occupied | Renter-occupied |
| Single Unit, Detached | 47 (64.4%) | 26 (35.6%) |
| Single Unit, Attached | 0 (0.0%) | 0 (0.0%) |
| 2 Unit Apartments | 0 (0.0%) | 0 (0.0%) |
| 3 or 4 Unit Apartments | 0 (0.0%) | 0 (0.0%) |
| 5 to 9 Unit Apartments | 0 (0.0%) | 0 (0.0%) |
| 10 or more Apartments | 0 (0.0%) | 13 (100.0%) |
| Mobile Home / Other | 0 (0.0%) | 0 (0.0%) |
| Total | 47 (54.6%) | 39 (45.4%) |
Housing Structures by Number of Rooms in Mount Carbon
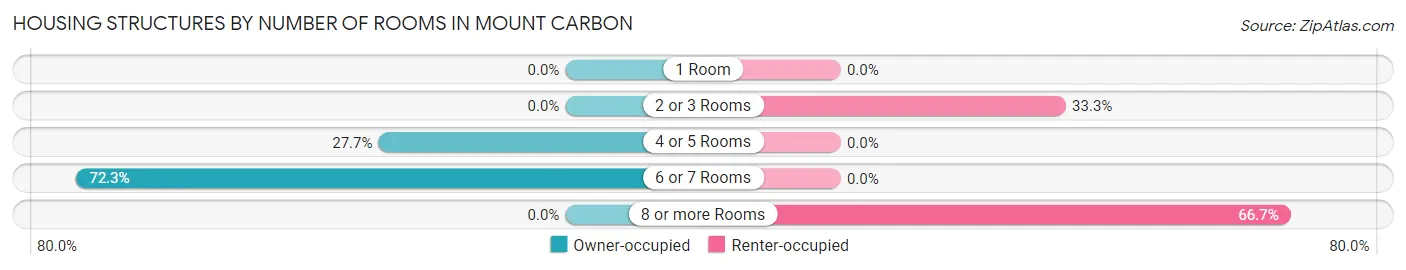
| Number of Rooms | Owner-occupied | Renter-occupied |
| 1 Room | 0 (0.0%) | 0 (0.0%) |
| 2 or 3 Rooms | 0 (0.0%) | 13 (33.3%) |
| 4 or 5 Rooms | 13 (27.7%) | 0 (0.0%) |
| 6 or 7 Rooms | 34 (72.3%) | 0 (0.0%) |
| 8 or more Rooms | 0 (0.0%) | 26 (66.7%) |
| Total | 47 (100.0%) | 39 (100.0%) |
Housing Structure by Heating Type in Mount Carbon
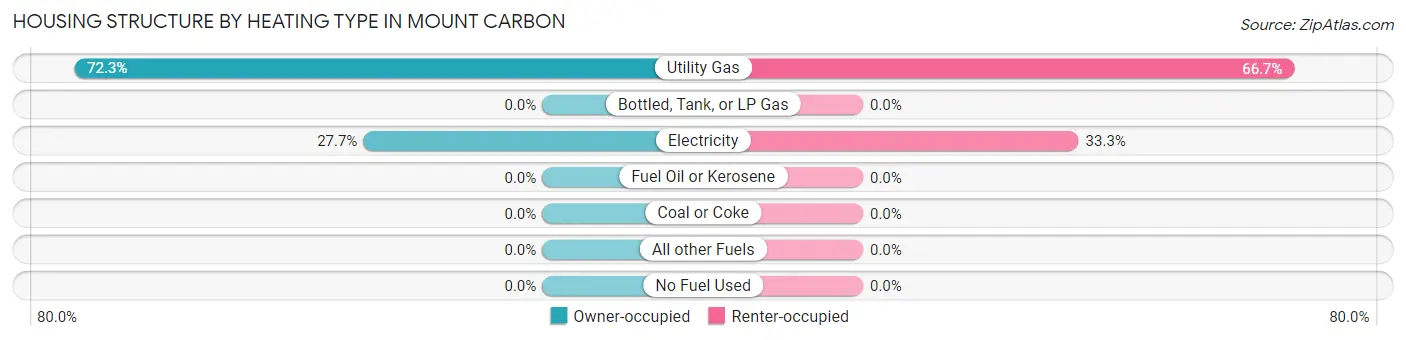
| Heating Type | Owner-occupied | Renter-occupied |
| Utility Gas | 34 (72.3%) | 26 (66.7%) |
| Bottled, Tank, or LP Gas | 0 (0.0%) | 0 (0.0%) |
| Electricity | 13 (27.7%) | 13 (33.3%) |
| Fuel Oil or Kerosene | 0 (0.0%) | 0 (0.0%) |
| Coal or Coke | 0 (0.0%) | 0 (0.0%) |
| All other Fuels | 0 (0.0%) | 0 (0.0%) |
| No Fuel Used | 0 (0.0%) | 0 (0.0%) |
| Total | 47 (100.0%) | 39 (100.0%) |
Household Vehicle Usage in Mount Carbon
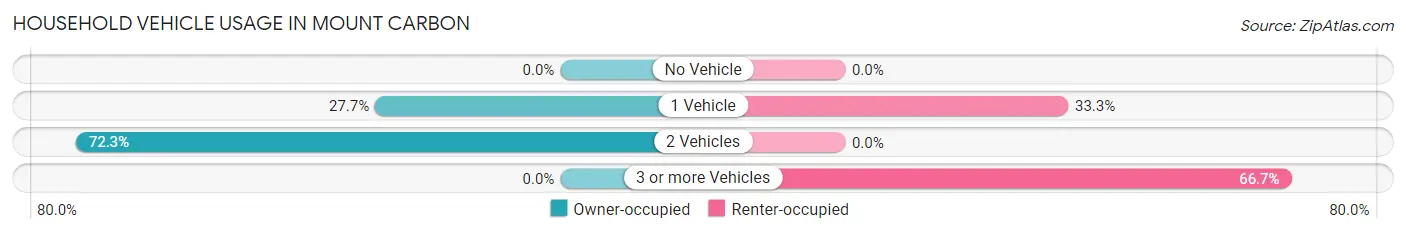
| Vehicles per Household | Owner-occupied | Renter-occupied |
| No Vehicle | 0 (0.0%) | 0 (0.0%) |
| 1 Vehicle | 13 (27.7%) | 13 (33.3%) |
| 2 Vehicles | 34 (72.3%) | 0 (0.0%) |
| 3 or more Vehicles | 0 (0.0%) | 26 (66.7%) |
| Total | 47 (100.0%) | 39 (100.0%) |
Real Estate & Mortgages in Mount Carbon
Real Estate and Mortgage Overview in Mount Carbon
| Characteristic | Without Mortgage | With Mortgage |
| Housing Units | 47 | 0 |
| Median Property Value | - | - |
| Median Household Income | - | - |
| Monthly Housing Costs | - | - |
| Real Estate Taxes | - | - |
Property Value by Mortgage Status in Mount Carbon
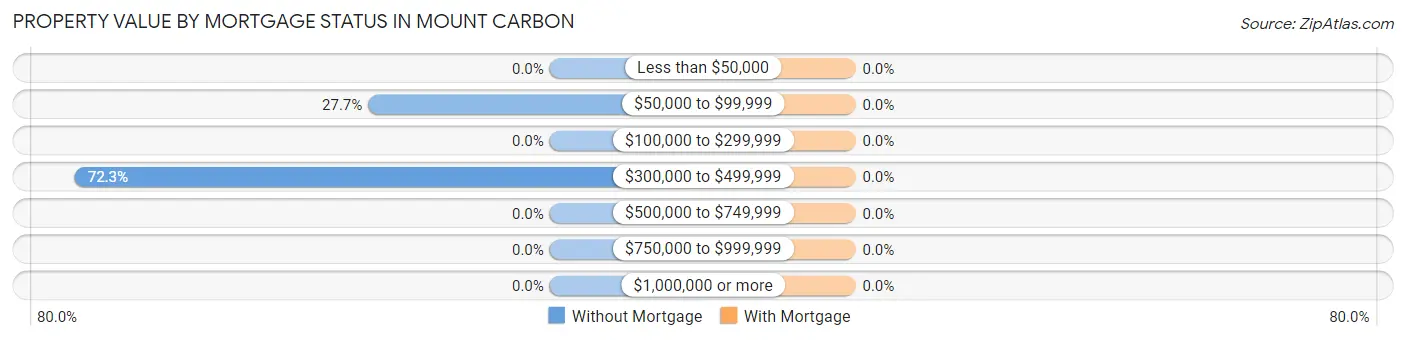
| Property Value | Without Mortgage | With Mortgage |
| Less than $50,000 | 0 (0.0%) | 0 (0.0%) |
| $50,000 to $99,999 | 13 (27.7%) | 0 (0.0%) |
| $100,000 to $299,999 | 0 (0.0%) | 0 (0.0%) |
| $300,000 to $499,999 | 34 (72.3%) | 0 (0.0%) |
| $500,000 to $749,999 | 0 (0.0%) | 0 (0.0%) |
| $750,000 to $999,999 | 0 (0.0%) | 0 (0.0%) |
| $1,000,000 or more | 0 (0.0%) | 0 (0.0%) |
| Total | 47 (100.0%) | 0 (0.0%) |
Household Income by Mortgage Status in Mount Carbon
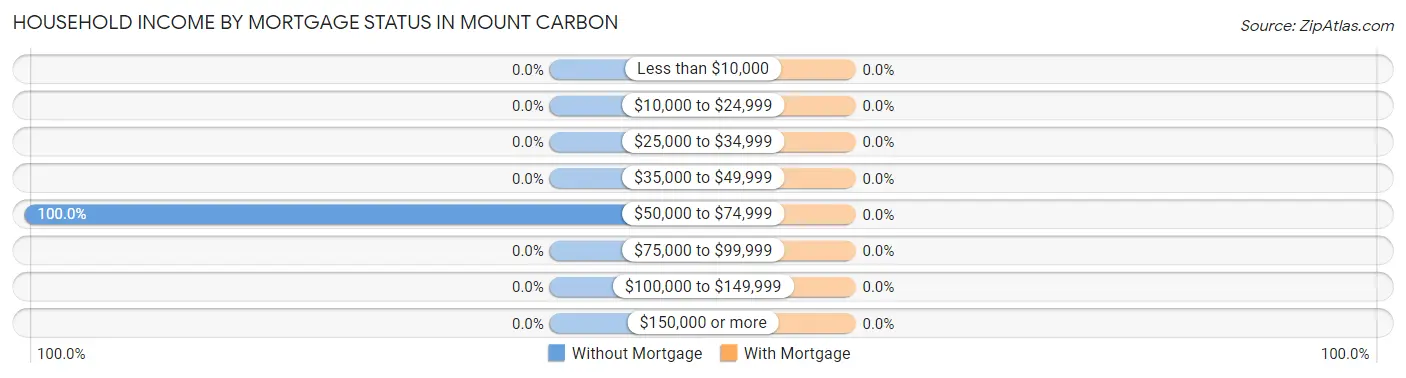
| Household Income | Without Mortgage | With Mortgage |
| Less than $10,000 | 0 (0.0%) | 0 (0.0%) |
| $10,000 to $24,999 | 0 (0.0%) | 0 (0.0%) |
| $25,000 to $34,999 | 0 (0.0%) | 0 (0.0%) |
| $35,000 to $49,999 | 0 (0.0%) | 0 (0.0%) |
| $50,000 to $74,999 | 47 (100.0%) | 0 (0.0%) |
| $75,000 to $99,999 | 0 (0.0%) | 0 (0.0%) |
| $100,000 to $149,999 | 0 (0.0%) | 0 (0.0%) |
| $150,000 or more | 0 (0.0%) | 0 (0.0%) |
| Total | 47 (100.0%) | 0 (0.0%) |
Property Value to Household Income Ratio in Mount Carbon
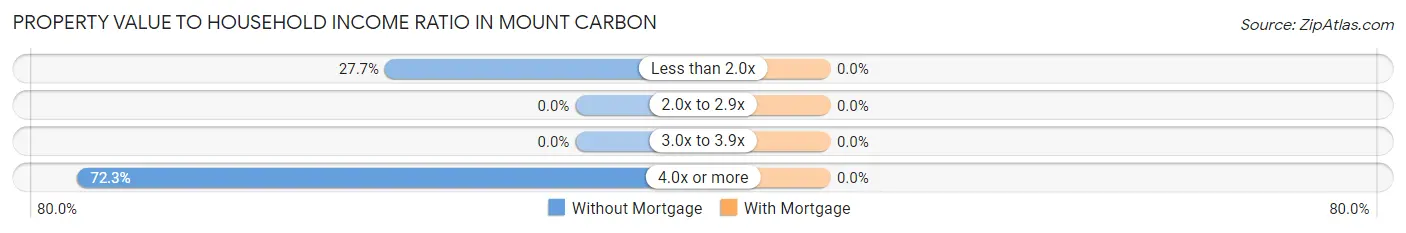
| Value-to-Income Ratio | Without Mortgage | With Mortgage |
| Less than 2.0x | 13 (27.7%) | 0 (0.0%) |
| 2.0x to 2.9x | 0 (0.0%) | 0 (0.0%) |
| 3.0x to 3.9x | 0 (0.0%) | 0 (0.0%) |
| 4.0x or more | 34 (72.3%) | 0 (0.0%) |
| Total | 47 (100.0%) | 0 (0.0%) |
Real Estate Taxes by Mortgage Status in Mount Carbon
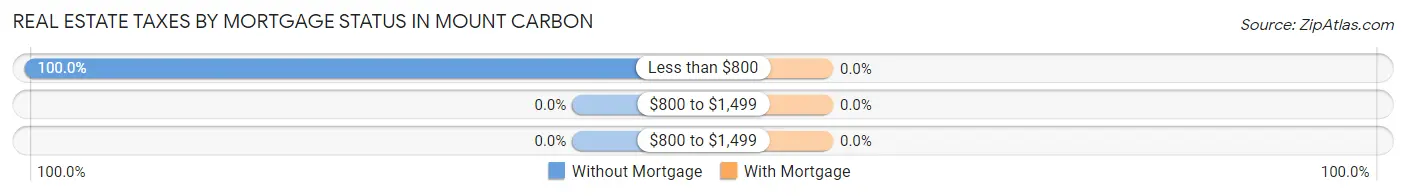
| Property Taxes | Without Mortgage | With Mortgage |
| Less than $800 | 47 (100.0%) | 0 (0.0%) |
| $800 to $1,499 | 0 (0.0%) | 0 (0.0%) |
| $800 to $1,499 | 0 (0.0%) | 0 (0.0%) |
| Total | 47 (100.0%) | 0 (0.0%) |
Health & Disability in Mount Carbon
Health Insurance Coverage by Age in Mount Carbon
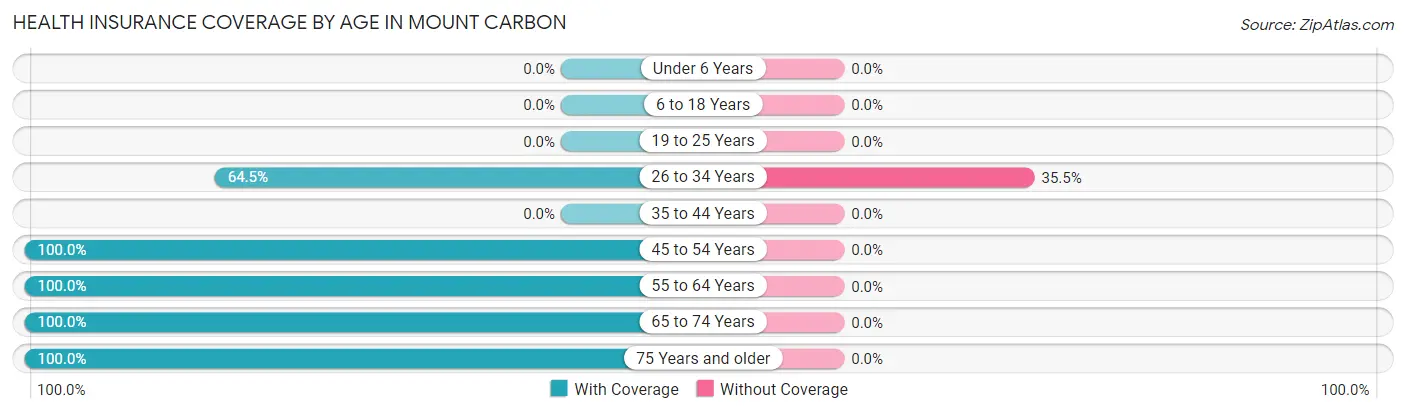
| Age Bracket | With Coverage | Without Coverage |
| Under 6 Years | 0 (0.0%) | 0 (0.0%) |
| 6 to 18 Years | 0 (0.0%) | 0 (0.0%) |
| 19 to 25 Years | 0 (0.0%) | 0 (0.0%) |
| 26 to 34 Years | 40 (64.5%) | 22 (35.5%) |
| 35 to 44 Years | 0 (0.0%) | 0 (0.0%) |
| 45 to 54 Years | 26 (100.0%) | 0 (0.0%) |
| 55 to 64 Years | 13 (100.0%) | 0 (0.0%) |
| 65 to 74 Years | 24 (100.0%) | 0 (0.0%) |
| 75 Years and older | 75 (100.0%) | 0 (0.0%) |
| Total | 178 (89.0%) | 22 (11.0%) |
Health Insurance Coverage by Citizenship Status in Mount Carbon
| Citizenship Status | With Coverage | Without Coverage |
| Native Born | 0 (0.0%) | 0 (0.0%) |
| Foreign Born, Citizen | 0 (0.0%) | 0 (0.0%) |
| Foreign Born, not a Citizen | 0 (0.0%) | 0 (0.0%) |
Health Insurance Coverage by Household Income in Mount Carbon
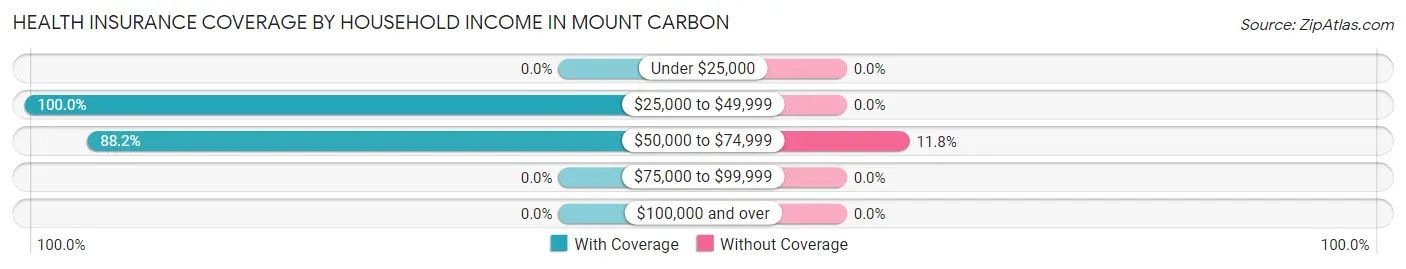
| Household Income | With Coverage | Without Coverage |
| Under $25,000 | 0 (0.0%) | 0 (0.0%) |
| $25,000 to $49,999 | 13 (100.0%) | 0 (0.0%) |
| $50,000 to $74,999 | 165 (88.2%) | 22 (11.8%) |
| $75,000 to $99,999 | 0 (0.0%) | 0 (0.0%) |
| $100,000 and over | 0 (0.0%) | 0 (0.0%) |
Public vs Private Health Insurance Coverage by Age in Mount Carbon
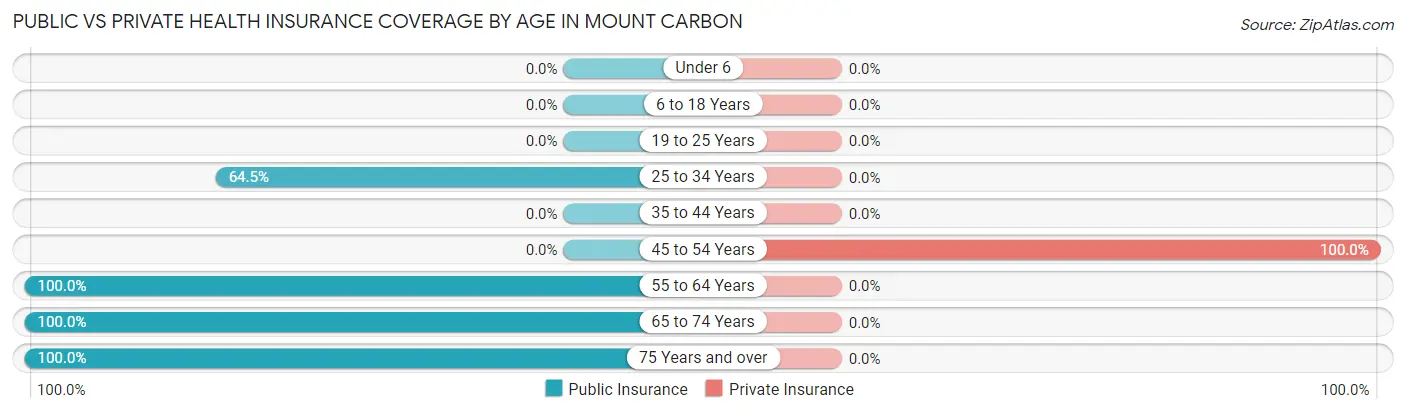
| Age Bracket | Public Insurance | Private Insurance |
| Under 6 | 0 (0.0%) | 0 (0.0%) |
| 6 to 18 Years | 0 (0.0%) | 0 (0.0%) |
| 19 to 25 Years | 0 (0.0%) | 0 (0.0%) |
| 25 to 34 Years | 40 (64.5%) | 0 (0.0%) |
| 35 to 44 Years | 0 (0.0%) | 0 (0.0%) |
| 45 to 54 Years | 0 (0.0%) | 26 (100.0%) |
| 55 to 64 Years | 13 (100.0%) | 0 (0.0%) |
| 65 to 74 Years | 24 (100.0%) | 0 (0.0%) |
| 75 Years and over | 75 (100.0%) | 0 (0.0%) |
| Total | 152 (76.0%) | 26 (13.0%) |
Disability Status by Sex by Age in Mount Carbon
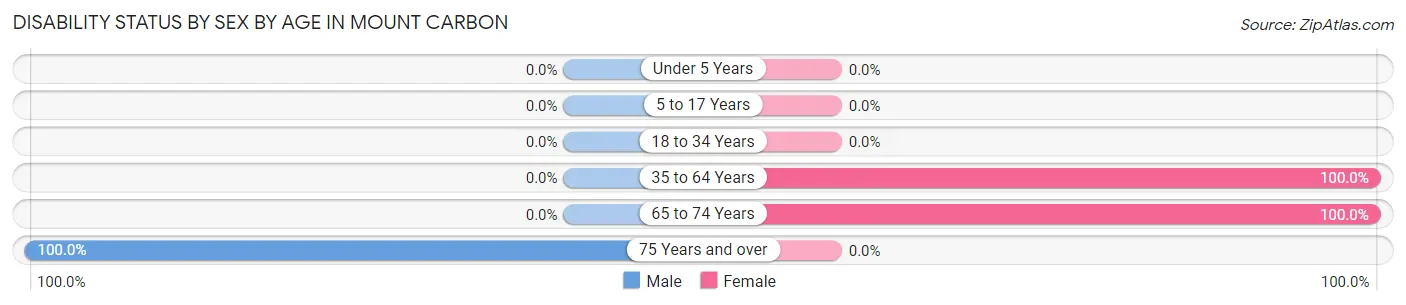
| Age Bracket | Male | Female |
| Under 5 Years | 0 (0.0%) | 0 (0.0%) |
| 5 to 17 Years | 0 (0.0%) | 0 (0.0%) |
| 18 to 34 Years | 0 (0.0%) | 0 (0.0%) |
| 35 to 64 Years | 0 (0.0%) | 39 (100.0%) |
| 65 to 74 Years | 0 (0.0%) | 13 (100.0%) |
| 75 Years and over | 41 (100.0%) | 0 (0.0%) |
Disability Class by Sex by Age in Mount Carbon
Disability Class: Hearing Difficulty
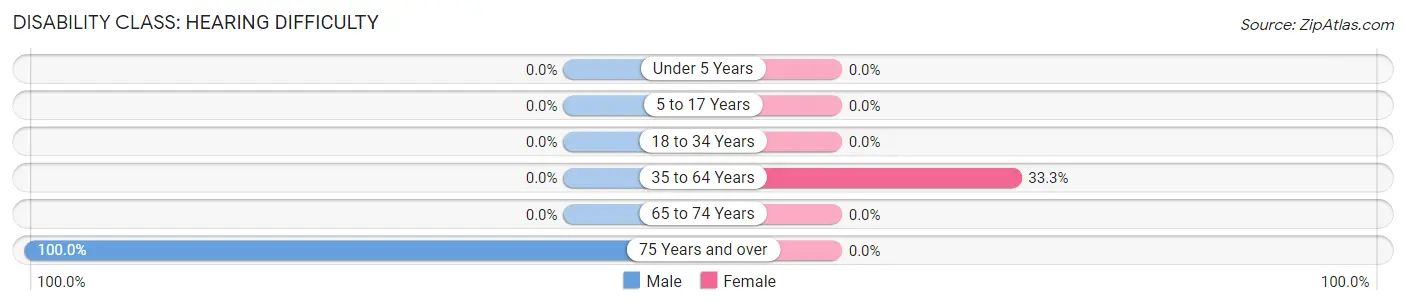
| Age Bracket | Male | Female |
| Under 5 Years | 0 (0.0%) | 0 (0.0%) |
| 5 to 17 Years | 0 (0.0%) | 0 (0.0%) |
| 18 to 34 Years | 0 (0.0%) | 0 (0.0%) |
| 35 to 64 Years | 0 (0.0%) | 13 (33.3%) |
| 65 to 74 Years | 0 (0.0%) | 0 (0.0%) |
| 75 Years and over | 41 (100.0%) | 0 (0.0%) |
Disability Class: Vision Difficulty
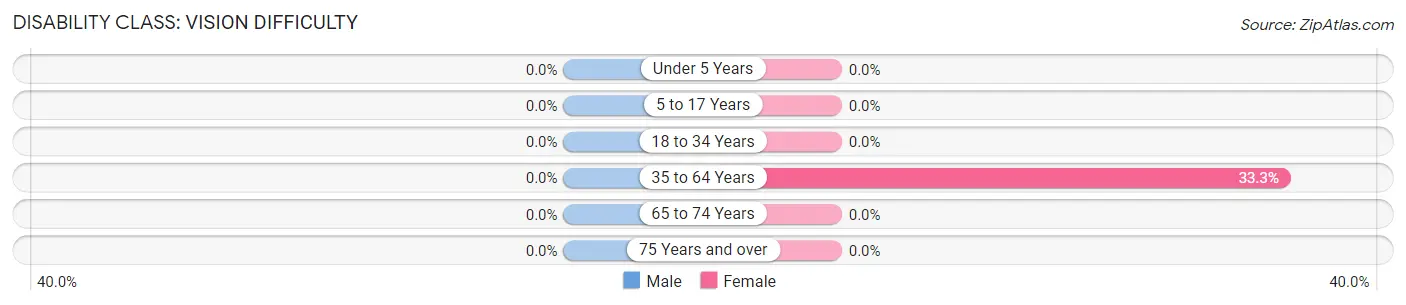
| Age Bracket | Male | Female |
| Under 5 Years | 0 (0.0%) | 0 (0.0%) |
| 5 to 17 Years | 0 (0.0%) | 0 (0.0%) |
| 18 to 34 Years | 0 (0.0%) | 0 (0.0%) |
| 35 to 64 Years | 0 (0.0%) | 13 (33.3%) |
| 65 to 74 Years | 0 (0.0%) | 0 (0.0%) |
| 75 Years and over | 0 (0.0%) | 0 (0.0%) |
Disability Class: Cognitive Difficulty
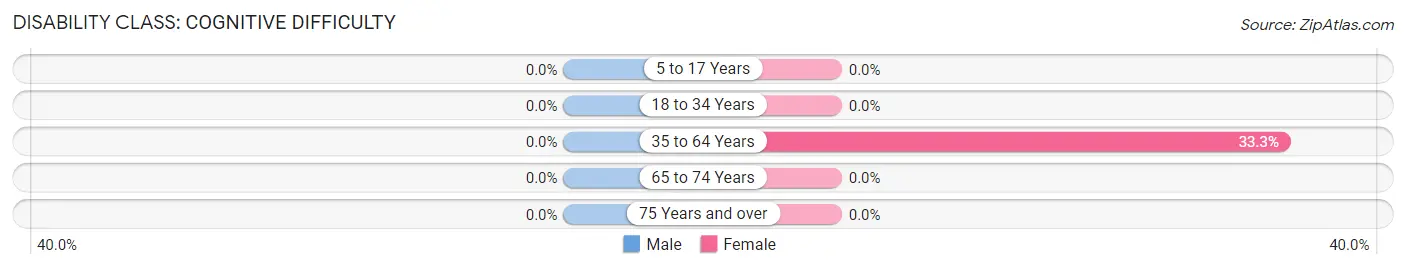
| Age Bracket | Male | Female |
| 5 to 17 Years | 0 (0.0%) | 0 (0.0%) |
| 18 to 34 Years | 0 (0.0%) | 0 (0.0%) |
| 35 to 64 Years | 0 (0.0%) | 13 (33.3%) |
| 65 to 74 Years | 0 (0.0%) | 0 (0.0%) |
| 75 Years and over | 0 (0.0%) | 0 (0.0%) |
Disability Class: Ambulatory Difficulty
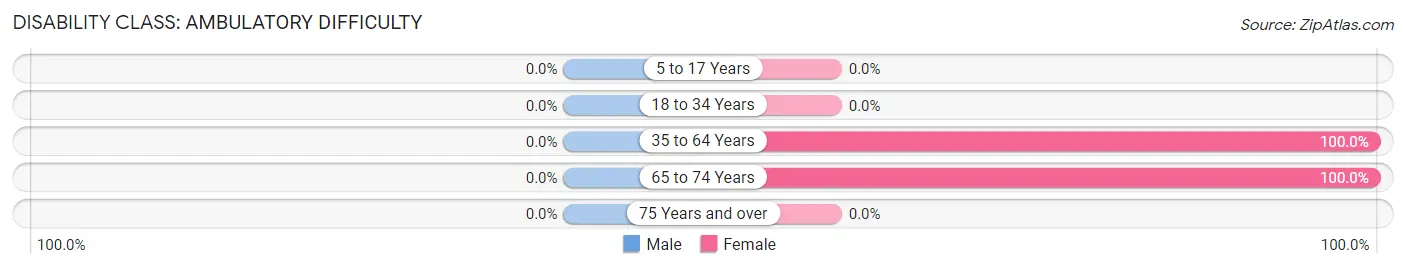
| Age Bracket | Male | Female |
| 5 to 17 Years | 0 (0.0%) | 0 (0.0%) |
| 18 to 34 Years | 0 (0.0%) | 0 (0.0%) |
| 35 to 64 Years | 0 (0.0%) | 39 (100.0%) |
| 65 to 74 Years | 0 (0.0%) | 13 (100.0%) |
| 75 Years and over | 0 (0.0%) | 0 (0.0%) |
Disability Class: Self-Care Difficulty
| Age Bracket | Male | Female |
| 5 to 17 Years | 0 (0.0%) | 0 (0.0%) |
| 18 to 34 Years | 0 (0.0%) | 0 (0.0%) |
| 35 to 64 Years | 0 (0.0%) | 0 (0.0%) |
| 65 to 74 Years | 0 (0.0%) | 0 (0.0%) |
| 75 Years and over | 0 (0.0%) | 0 (0.0%) |
Technology Access in Mount Carbon
Computing Device Access in Mount Carbon
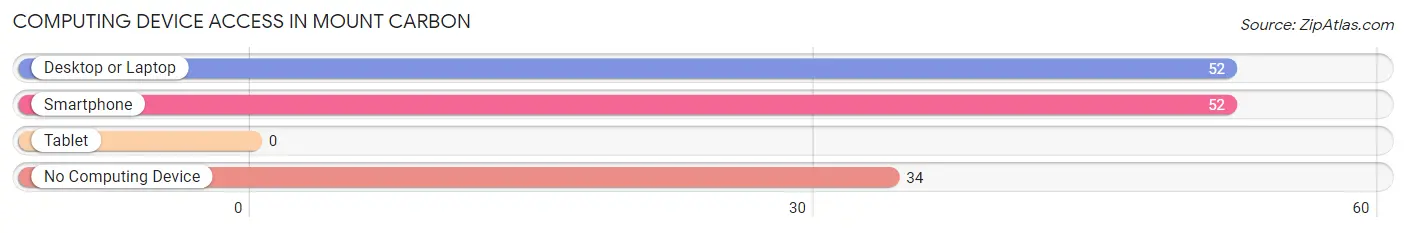
| Device Type | # Households | % Households |
| Desktop or Laptop | 52 | 60.5% |
| Smartphone | 52 | 60.5% |
| Tablet | 0 | 0.0% |
| No Computing Device | 34 | 39.5% |
| Total | 86 | 100.0% |
Internet Access in Mount Carbon
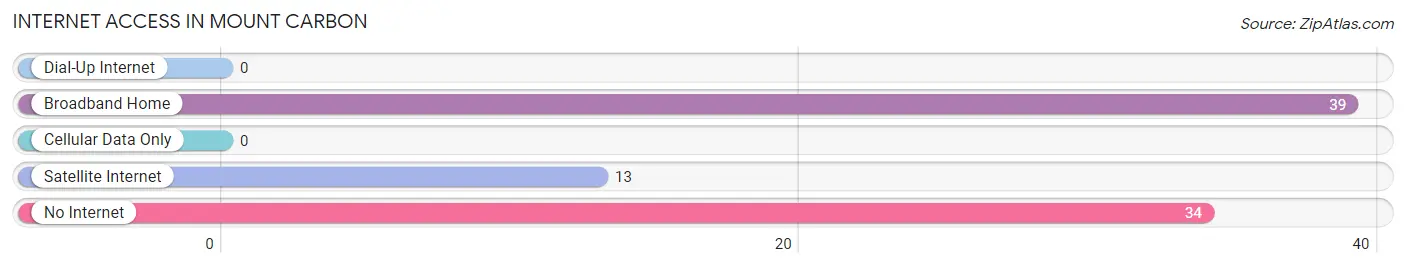
| Internet Type | # Households | % Households |
| Dial-Up Internet | 0 | 0.0% |
| Broadband Home | 39 | 45.4% |
| Cellular Data Only | 0 | 0.0% |
| Satellite Internet | 13 | 15.1% |
| No Internet | 34 | 39.5% |
| Total | 86 | 100.0% |
Mount Carbon Summary
Carbon, West Virginia is a small town located in the Appalachian Mountains of West Virginia. It is situated in the northern part of the state, in the county of Fayette. The town was founded in 1873 and was named after the nearby Carbon River. The town has a population of approximately 1,000 people and is located at an elevation of 1,400 feet.
History
The town of Carbon was founded in 1873 by a group of settlers from Pennsylvania. The settlers were looking for a place to settle and start a new life. The town was named after the nearby Carbon River, which was named after the coal deposits that were found in the area. The town was originally a coal mining town, and the coal industry was the main source of income for the town. The coal industry was the main source of employment for the town until the late 20th century.
The town of Carbon was also home to a number of other industries, including a sawmill, a gristmill, and a tannery. The town also had a number of stores, including a general store, a drug store, and a hardware store.
Geography
Carbon is located in the northern part of West Virginia, in the county of Fayette. The town is situated at an elevation of 1,400 feet and is surrounded by the Appalachian Mountains. The town is located near the Carbon River, which is a tributary of the New River. The town is also located near the Gauley River, which is a tributary of the Kanawha River.
The town of Carbon is located in a rural area and is surrounded by forests and mountains. The town is located approximately 30 miles from the city of Charleston, West Virginia.
Economy
The economy of Carbon is largely based on the coal industry. The town was originally a coal mining town, and the coal industry was the main source of income for the town until the late 20th century. The town is still home to a number of coal mines, and the coal industry is still a major source of employment for the town.
The town is also home to a number of other industries, including a sawmill, a gristmill, and a tannery. The town also has a number of stores, including a general store, a drug store, and a hardware store.
Demographics
The population of Carbon is approximately 1,000 people. The town is predominantly white, with approximately 95% of the population being white. The town also has a small African American population, with approximately 4% of the population being African American. The town also has a small Hispanic population, with approximately 1% of the population being Hispanic. The town also has a small Native American population, with approximately 0.5% of the population being Native American. The median household income in Carbon is approximately $30,000.
Common Questions
What is Per Capita Income in Mount Carbon?
Per Capita income in Mount Carbon is $23,829.
What is the Median Family Income in Mount Carbon?
Median Family Income in Mount Carbon is $56,941.
What is the Median Household income in Mount Carbon?
Median Household Income in Mount Carbon is $56,596.
What is Inequality or Gini Index in Mount Carbon?
Inequality or Gini Index in Mount Carbon is 0.11.
What is the Total Population of Mount Carbon?
Total Population of Mount Carbon is 200.
What is the Total Male Population of Mount Carbon?
Total Male Population of Mount Carbon is 114.
What is the Total Female Population of Mount Carbon?
Total Female Population of Mount Carbon is 86.
What is the Ratio of Males per 100 Females in Mount Carbon?
There are 132.56 Males per 100 Females in Mount Carbon.
What is the Ratio of Females per 100 Males in Mount Carbon?
There are 75.44 Females per 100 Males in Mount Carbon.
What is the Median Population Age in Mount Carbon?
Median Population Age in Mount Carbon is 63.9 Years.
What is the Average Family Size in Mount Carbon
Average Family Size in Mount Carbon is 2.6 People.
What is the Average Household Size in Mount Carbon
Average Household Size in Mount Carbon is 2.3 People.
How Large is the Labor Force in Mount Carbon?
There are 66 People in the Labor Forcein in Mount Carbon.
What is the Percentage of People in the Labor Force in Mount Carbon?
33.0% of People are in the Labor Force in Mount Carbon.