Golden Valley, NV Map & Demographics
Golden Valley Map
Golden Valley Overview
$39,368
PER CAPITA INCOME
$98,051
AVG FAMILY INCOME
$85,242
AVG HOUSEHOLD INCOME
17.6%
WAGE / INCOME GAP [ % ]
82.4¢/ $1
WAGE / INCOME GAP [ $ ]
0.34
INEQUALITY / GINI INDEX
1,184
TOTAL POPULATION
562
MALE POPULATION
622
FEMALE POPULATION
90.35
MALES / 100 FEMALES
110.68
FEMALES / 100 MALES
63.9
MEDIAN AGE
2.7
AVG FAMILY SIZE
2.4
AVG HOUSEHOLD SIZE
455
LABOR FORCE [ PEOPLE ]
43.8%
PERCENT IN LABOR FORCE
2.2%
UNEMPLOYMENT RATE
Income in Golden Valley
Income Overview in Golden Valley
Per Capita Income in Golden Valley is $39,368, while median incomes of families and households are $98,051 and $85,242 respectively.
| Characteristic | Number | Measure |
| Per Capita Income | 1,184 | $39,368 |
| Median Family Income | 362 | $98,051 |
| Mean Family Income | 362 | $106,141 |
| Median Household Income | 496 | $85,242 |
| Mean Household Income | 496 | $93,937 |
| Income Deficit | 362 | $0 |
| Wage / Income Gap (%) | 1,184 | 17.62% |
| Wage / Income Gap ($) | 1,184 | 82.38¢ per $1 |
| Gini / Inequality Index | 1,184 | 0.34 |
Earnings by Sex in Golden Valley
Average Earnings in Golden Valley are $40,300, $33,950 for men and $41,213 for women, a difference of 17.6%.
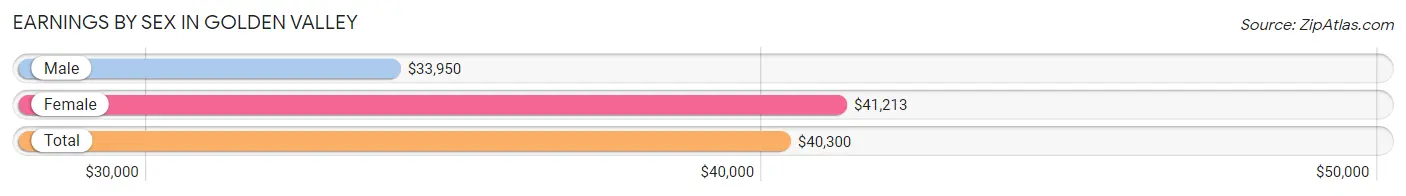
| Sex | Number | Average Earnings |
| Male | 175 (34.9%) | $33,950 |
| Female | 327 (65.1%) | $41,213 |
| Total | 502 (100.0%) | $40,300 |
Earnings by Sex by Income Bracket in Golden Valley
The most common earnings brackets in Golden Valley are $30,000 to $34,999 for men (44 | 25.1%) and $55,000 to $64,999 for women (67 | 20.5%).
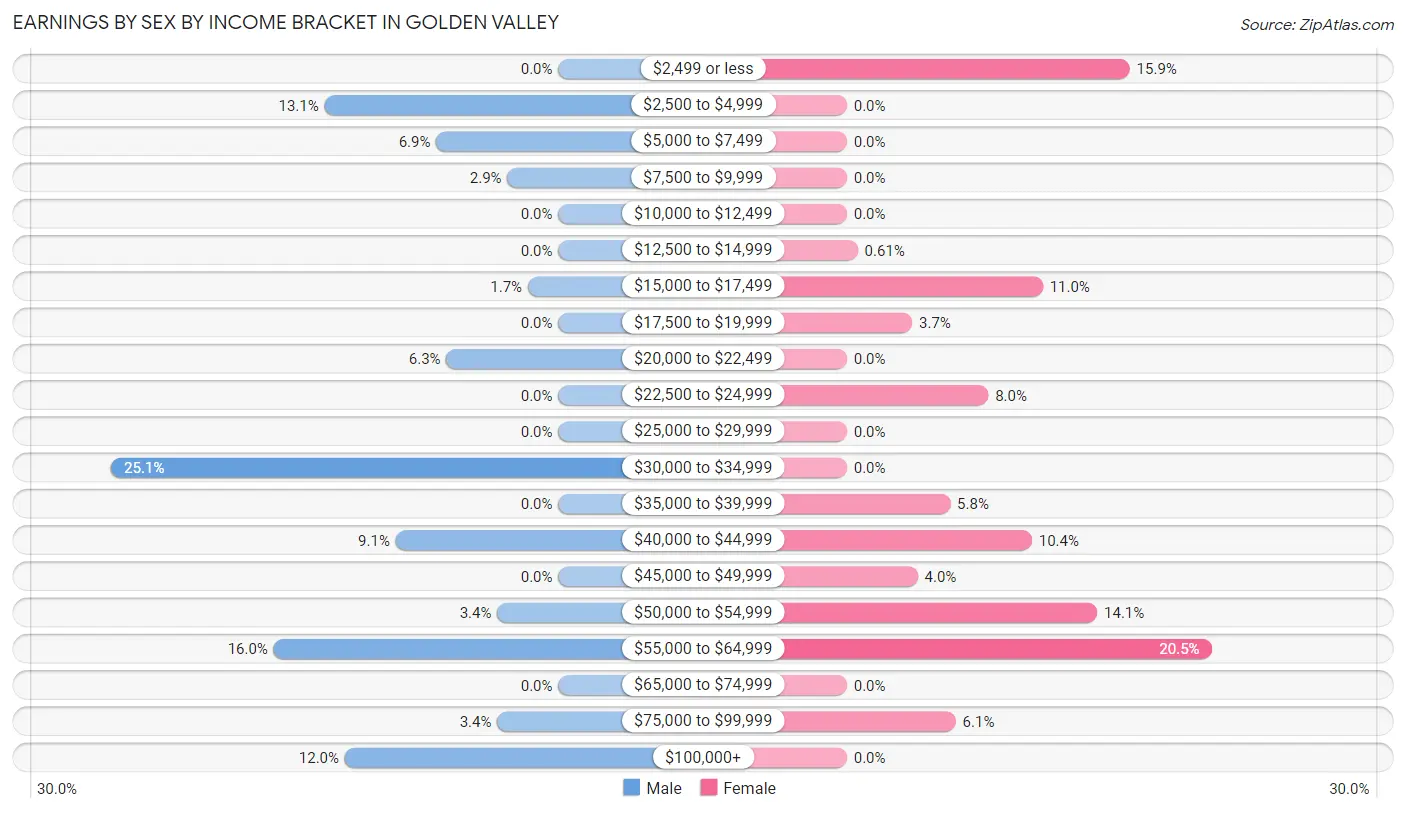
| Income | Male | Female |
| $2,499 or less | 0 (0.0%) | 52 (15.9%) |
| $2,500 to $4,999 | 23 (13.1%) | 0 (0.0%) |
| $5,000 to $7,499 | 12 (6.9%) | 0 (0.0%) |
| $7,500 to $9,999 | 5 (2.9%) | 0 (0.0%) |
| $10,000 to $12,499 | 0 (0.0%) | 0 (0.0%) |
| $12,500 to $14,999 | 0 (0.0%) | 2 (0.6%) |
| $15,000 to $17,499 | 3 (1.7%) | 36 (11.0%) |
| $17,500 to $19,999 | 0 (0.0%) | 12 (3.7%) |
| $20,000 to $22,499 | 11 (6.3%) | 0 (0.0%) |
| $22,500 to $24,999 | 0 (0.0%) | 26 (8.0%) |
| $25,000 to $29,999 | 0 (0.0%) | 0 (0.0%) |
| $30,000 to $34,999 | 44 (25.1%) | 0 (0.0%) |
| $35,000 to $39,999 | 0 (0.0%) | 19 (5.8%) |
| $40,000 to $44,999 | 16 (9.1%) | 34 (10.4%) |
| $45,000 to $49,999 | 0 (0.0%) | 13 (4.0%) |
| $50,000 to $54,999 | 6 (3.4%) | 46 (14.1%) |
| $55,000 to $64,999 | 28 (16.0%) | 67 (20.5%) |
| $65,000 to $74,999 | 0 (0.0%) | 0 (0.0%) |
| $75,000 to $99,999 | 6 (3.4%) | 20 (6.1%) |
| $100,000+ | 21 (12.0%) | 0 (0.0%) |
| Total | 175 (100.0%) | 327 (100.0%) |
Earnings by Sex by Educational Attainment in Golden Valley
Average earnings in Golden Valley are $34,550 for men and $41,654 for women, a difference of 17.1%. Men with an educational attainment of high school diploma enjoy the highest average annual earnings of $31,974, while those with high school diploma education earn the least with $31,974. Women with an educational attainment of college or associate's degree earn the most with the average annual earnings of $41,912, while those with college or associate's degree education have the smallest earnings of $41,912.
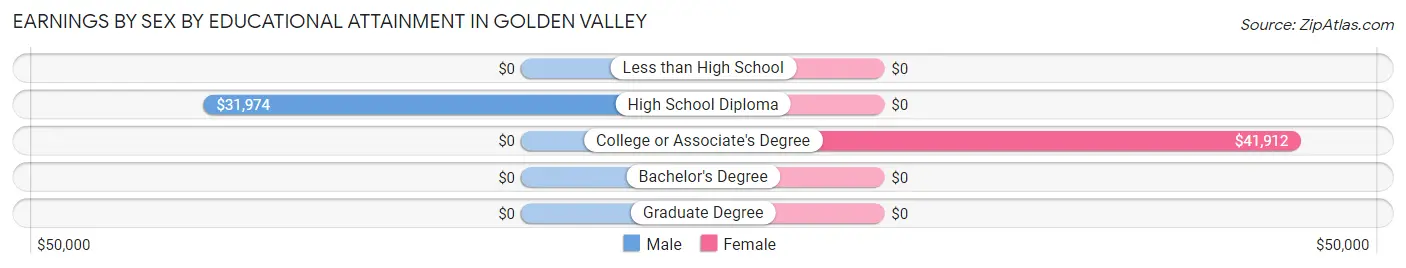
| Educational Attainment | Male Income | Female Income |
| Less than High School | - | - |
| High School Diploma | $31,974 | $0 |
| College or Associate's Degree | - | - |
| Bachelor's Degree | - | - |
| Graduate Degree | - | - |
| Total | $34,550 | $41,654 |
Family Income in Golden Valley
Family Income Brackets in Golden Valley
According to the Golden Valley family income data, there are 134 families falling into the $75,000 to $99,999 income range, which is the most common income bracket and makes up 37.0% of all families.
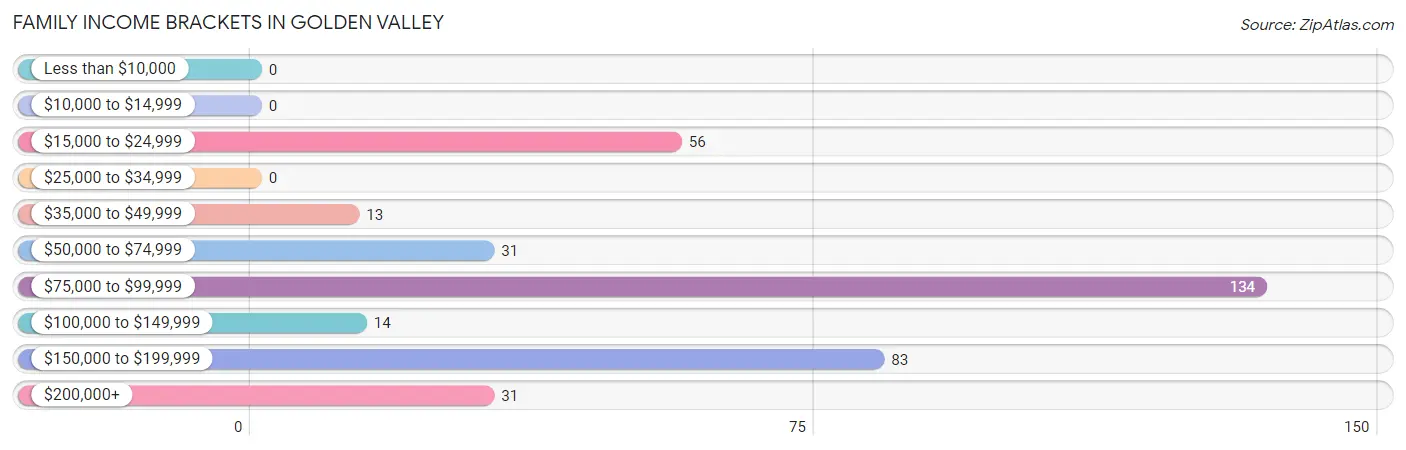
| Income Bracket | # Families | % Families |
| Less than $10,000 | 0 | 0.0% |
| $10,000 to $14,999 | 0 | 0.0% |
| $15,000 to $24,999 | 56 | 15.5% |
| $25,000 to $34,999 | 0 | 0.0% |
| $35,000 to $49,999 | 13 | 3.6% |
| $50,000 to $74,999 | 31 | 8.6% |
| $75,000 to $99,999 | 134 | 37.0% |
| $100,000 to $149,999 | 14 | 3.9% |
| $150,000 to $199,999 | 83 | 22.9% |
| $200,000+ | 31 | 8.6% |
Family Income by Famaliy Size in Golden Valley
2-person families (300 | 82.9%) account for the highest median family income in Golden Valley with $98,456 per family, while 2-person families (300 | 82.9%) have the highest median income of $49,228 per family member.
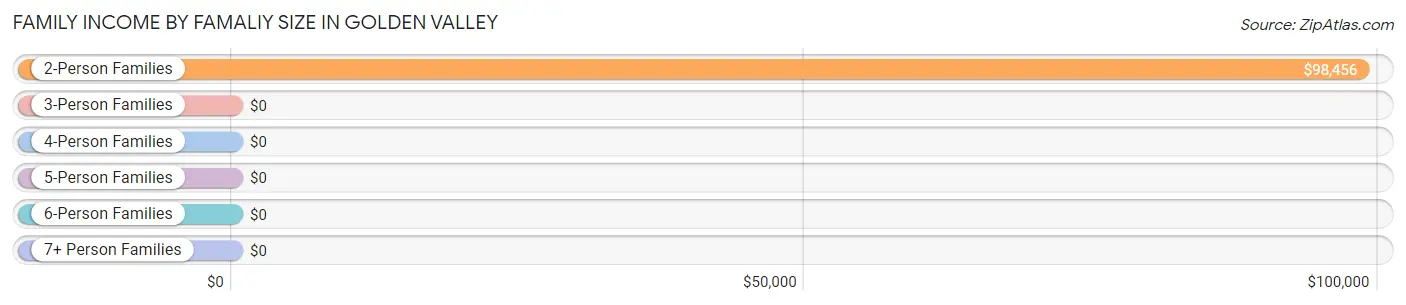
| Income Bracket | # Families | Median Income |
| 2-Person Families | 300 (82.9%) | $98,456 |
| 3-Person Families | 5 (1.4%) | $0 |
| 4-Person Families | 37 (10.2%) | $0 |
| 5-Person Families | 20 (5.5%) | $0 |
| 6-Person Families | 0 (0.0%) | $0 |
| 7+ Person Families | 0 (0.0%) | $0 |
| Total | 362 (100.0%) | $98,051 |
Family Income by Number of Earners in Golden Valley
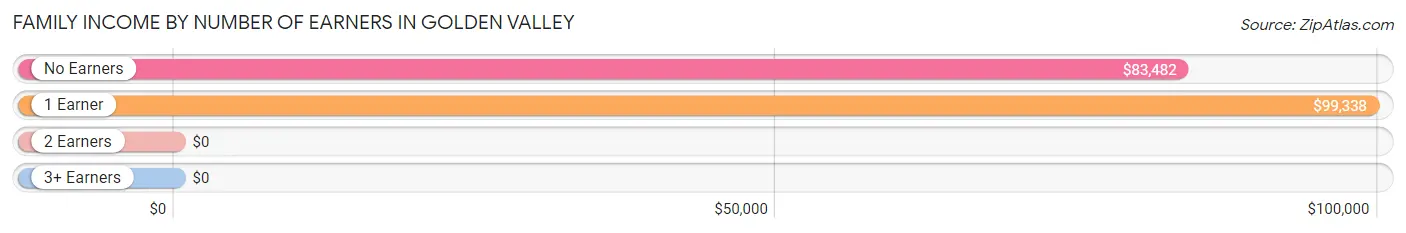
| Number of Earners | # Families | Median Income |
| No Earners | 105 (29.0%) | $83,482 |
| 1 Earner | 202 (55.8%) | $99,338 |
| 2 Earners | 55 (15.2%) | $0 |
| 3+ Earners | 0 (0.0%) | $0 |
| Total | 362 (100.0%) | $98,051 |
Household Income in Golden Valley
Household Income Brackets in Golden Valley
With 137 households falling in the category, the $75,000 to $99,999 income range is the most frequent in Golden Valley, accounting for 27.6% of all households.
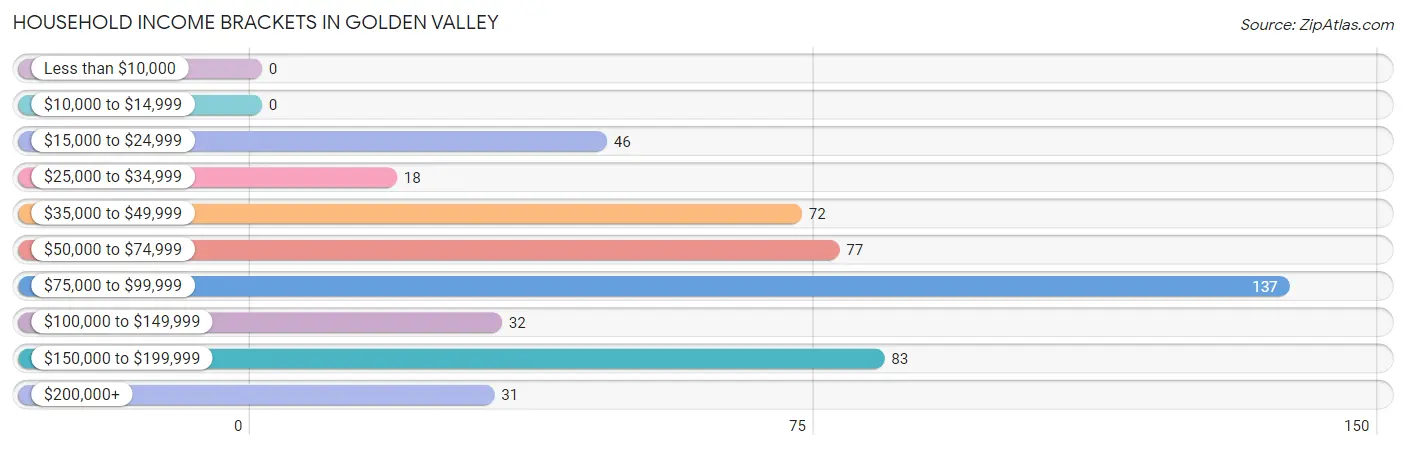
| Income Bracket | # Households | % Households |
| Less than $10,000 | 0 | 0.0% |
| $10,000 to $14,999 | 0 | 0.0% |
| $15,000 to $24,999 | 46 | 9.3% |
| $25,000 to $34,999 | 18 | 3.6% |
| $35,000 to $49,999 | 72 | 14.5% |
| $50,000 to $74,999 | 77 | 15.5% |
| $75,000 to $99,999 | 137 | 27.6% |
| $100,000 to $149,999 | 32 | 6.5% |
| $150,000 to $199,999 | 83 | 16.7% |
| $200,000+ | 31 | 6.3% |
Household Income by Householder Age in Golden Valley
The median household income in Golden Valley is $85,242, with the highest median household income of $83,482 found in the 65+ years age bracket for the primary householder. A total of 301 households (60.7%) fall into this category. Meanwhile, the 15 to 24 years age bracket for the primary householder has the lowest median household income of $0, with 12 households (2.4%) in this group.
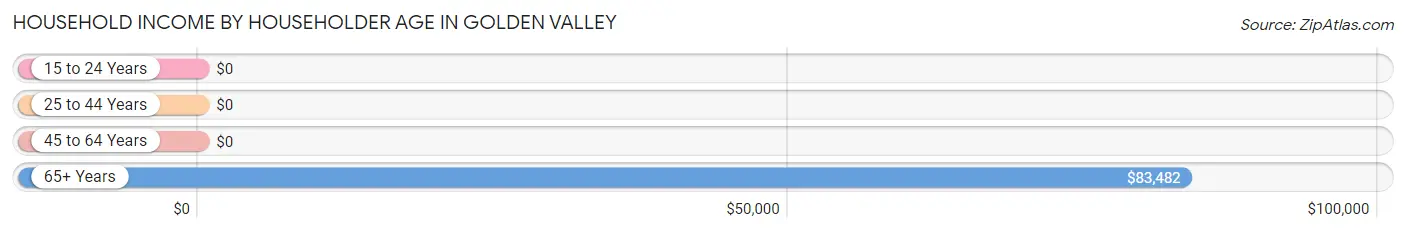
| Income Bracket | # Households | Median Income |
| 15 to 24 Years | 12 (2.4%) | $0 |
| 25 to 44 Years | 27 (5.4%) | $0 |
| 45 to 64 Years | 156 (31.5%) | $0 |
| 65+ Years | 301 (60.7%) | $83,482 |
| Total | 496 (100.0%) | $85,242 |
Poverty in Golden Valley
Income Below Poverty by Sex and Age in Golden Valley
With 15.1% poverty level for males and 19.3% for females among the residents of Golden Valley, under 5 year old males and 18 to 24 year old females are the most vulnerable to poverty, with 16 males (100.0%) and 12 females (100.0%) in their respective age groups living below the poverty level.
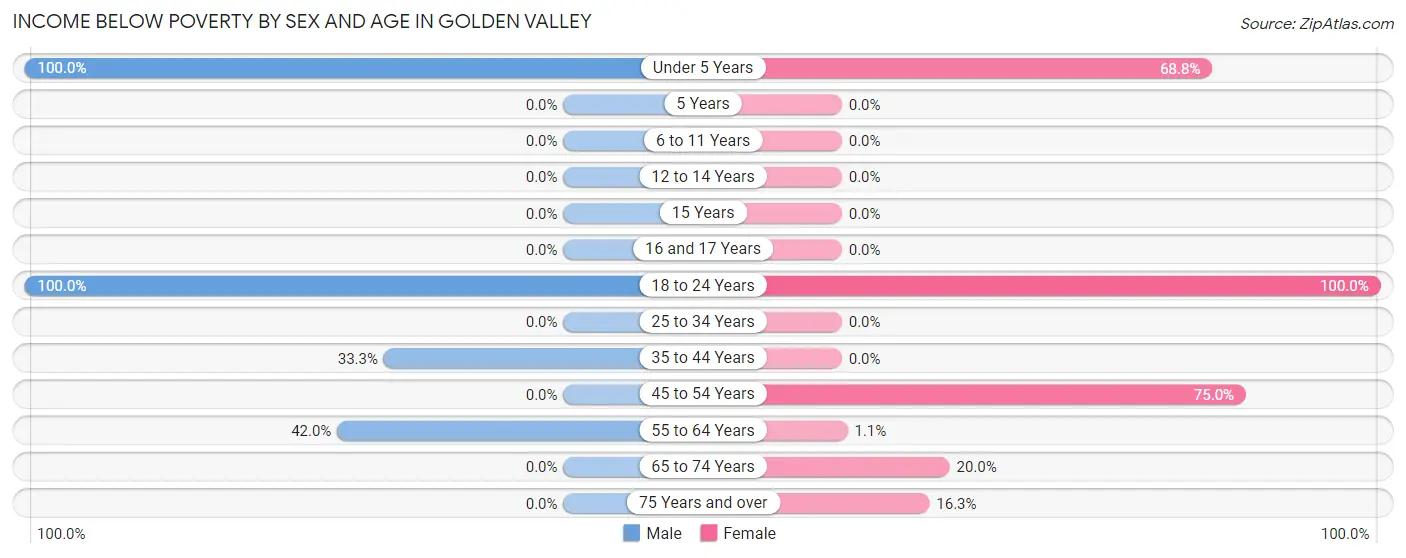
| Age Bracket | Male | Female |
| Under 5 Years | 16 (100.0%) | 55 (68.8%) |
| 5 Years | 0 (0.0%) | 0 (0.0%) |
| 6 to 11 Years | 0 (0.0%) | 0 (0.0%) |
| 12 to 14 Years | 0 (0.0%) | 0 (0.0%) |
| 15 Years | 0 (0.0%) | 0 (0.0%) |
| 16 and 17 Years | 0 (0.0%) | 0 (0.0%) |
| 18 to 24 Years | 12 (100.0%) | 12 (100.0%) |
| 25 to 34 Years | 0 (0.0%) | 0 (0.0%) |
| 35 to 44 Years | 23 (33.3%) | 0 (0.0%) |
| 45 to 54 Years | 0 (0.0%) | 6 (75.0%) |
| 55 to 64 Years | 34 (42.0%) | 2 (1.1%) |
| 65 to 74 Years | 0 (0.0%) | 32 (20.0%) |
| 75 Years and over | 0 (0.0%) | 13 (16.3%) |
| Total | 85 (15.1%) | 120 (19.3%) |
Income Above Poverty by Sex and Age in Golden Valley
According to the poverty statistics in Golden Valley, males aged 12 to 14 years and females aged 12 to 14 years are the age groups that are most secure financially, with 100.0% of males and 100.0% of females in these age groups living above the poverty line.
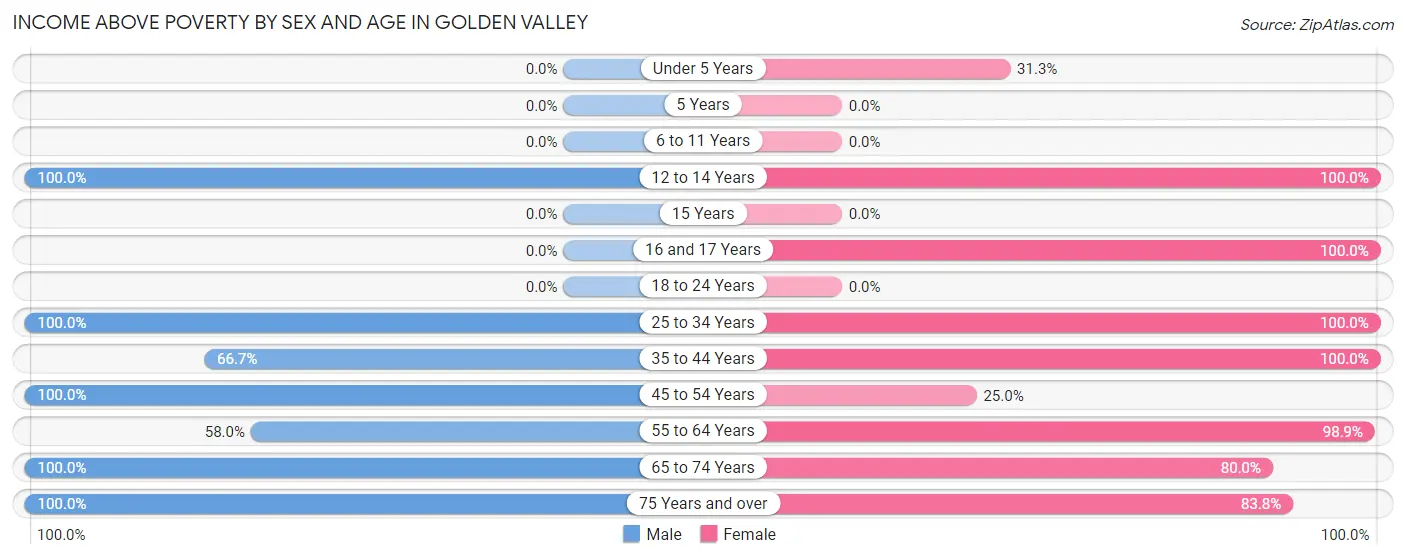
| Age Bracket | Male | Female |
| Under 5 Years | 0 (0.0%) | 25 (31.2%) |
| 5 Years | 0 (0.0%) | 0 (0.0%) |
| 6 to 11 Years | 0 (0.0%) | 0 (0.0%) |
| 12 to 14 Years | 28 (100.0%) | 21 (100.0%) |
| 15 Years | 0 (0.0%) | 0 (0.0%) |
| 16 and 17 Years | 0 (0.0%) | 7 (100.0%) |
| 18 to 24 Years | 0 (0.0%) | 0 (0.0%) |
| 25 to 34 Years | 33 (100.0%) | 19 (100.0%) |
| 35 to 44 Years | 46 (66.7%) | 46 (100.0%) |
| 45 to 54 Years | 5 (100.0%) | 2 (25.0%) |
| 55 to 64 Years | 47 (58.0%) | 187 (98.9%) |
| 65 to 74 Years | 233 (100.0%) | 128 (80.0%) |
| 75 Years and over | 85 (100.0%) | 67 (83.8%) |
| Total | 477 (84.9%) | 502 (80.7%) |
Income Below Poverty Among Married-Couple Families in Golden Valley
The poverty statistics for married-couple families in Golden Valley show that 10.6% or 34 of the total 320 families live below the poverty line. Families with no children have the highest poverty rate of 11.8%, comprising of 34 families. On the other hand, families with 1 or 2 children have the lowest poverty rate of 0.0%, which includes 0 families.
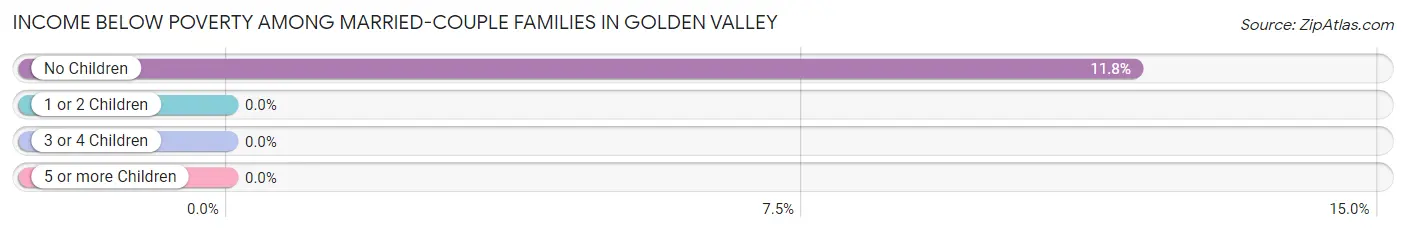
| Children | Above Poverty | Below Poverty |
| No Children | 254 (88.2%) | 34 (11.8%) |
| 1 or 2 Children | 32 (100.0%) | 0 (0.0%) |
| 3 or 4 Children | 0 (0.0%) | 0 (0.0%) |
| 5 or more Children | 0 (0.0%) | 0 (0.0%) |
| Total | 286 (89.4%) | 34 (10.6%) |
Income Below Poverty Among Single-Parent Households in Golden Valley
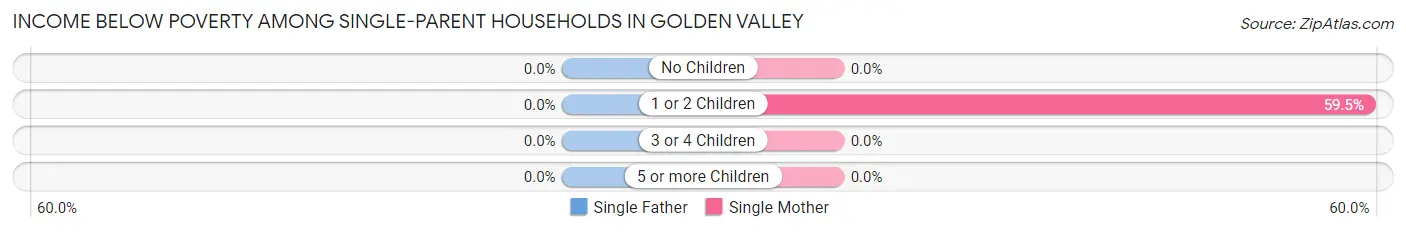
| Children | Single Father | Single Mother |
| No Children | 0 (0.0%) | 0 (0.0%) |
| 1 or 2 Children | 0 (0.0%) | 22 (59.5%) |
| 3 or 4 Children | 0 (0.0%) | 0 (0.0%) |
| 5 or more Children | 0 (0.0%) | 0 (0.0%) |
| Total | 0 (0.0%) | 22 (52.4%) |
Income Below Poverty Among Married-Couple vs Single-Parent Households in Golden Valley
The poverty data for Golden Valley shows that 34 of the married-couple family households (10.6%) and 22 of the single-parent households (52.4%) are living below the poverty level. Within the married-couple family households, those with no children have the highest poverty rate, with 34 households (11.8%) falling below the poverty line. Among the single-parent households, those with 1 or 2 children have the highest poverty rate, with 22 household (59.5%) living below poverty.
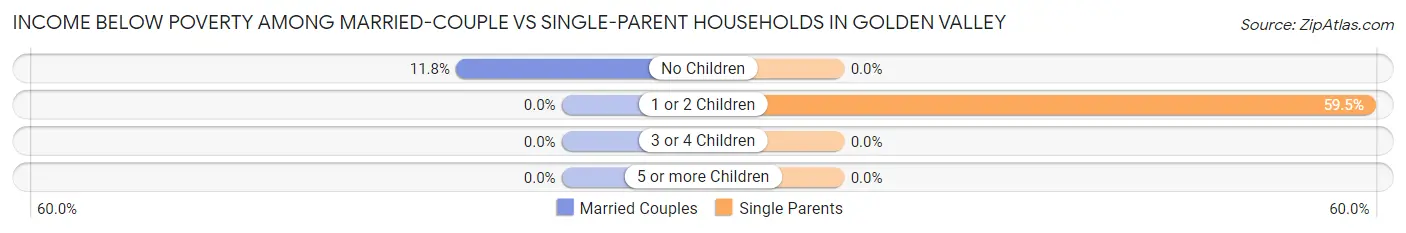
| Children | Married-Couple Families | Single-Parent Households |
| No Children | 34 (11.8%) | 0 (0.0%) |
| 1 or 2 Children | 0 (0.0%) | 22 (59.5%) |
| 3 or 4 Children | 0 (0.0%) | 0 (0.0%) |
| 5 or more Children | 0 (0.0%) | 0 (0.0%) |
| Total | 34 (10.6%) | 22 (52.4%) |
Race in Golden Valley
The most populous races in Golden Valley are White / Caucasian (956 | 80.7%), Two or more Races (136 | 11.5%), and Hispanic or Latino (128 | 10.8%).
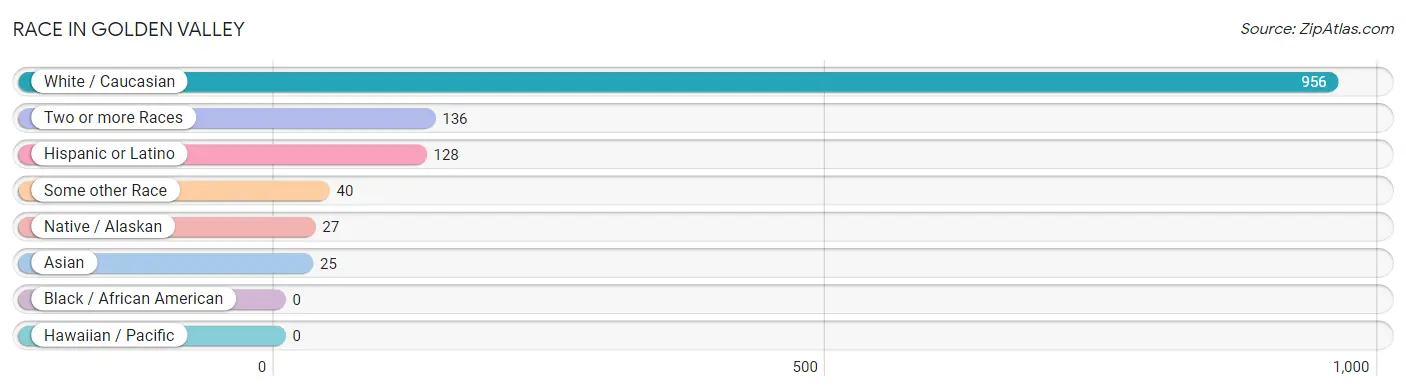
| Race | # Population | % Population |
| Asian | 25 | 2.1% |
| Black / African American | 0 | 0.0% |
| Hawaiian / Pacific | 0 | 0.0% |
| Hispanic or Latino | 128 | 10.8% |
| Native / Alaskan | 27 | 2.3% |
| White / Caucasian | 956 | 80.7% |
| Two or more Races | 136 | 11.5% |
| Some other Race | 40 | 3.4% |
| Total | 1,184 | 100.0% |
Ancestry in Golden Valley
The most populous ancestries reported in Golden Valley are Irish (391 | 33.0%), German (302 | 25.5%), English (176 | 14.9%), Danish (81 | 6.8%), and Norwegian (72 | 6.1%), together accounting for 86.3% of all Golden Valley residents.
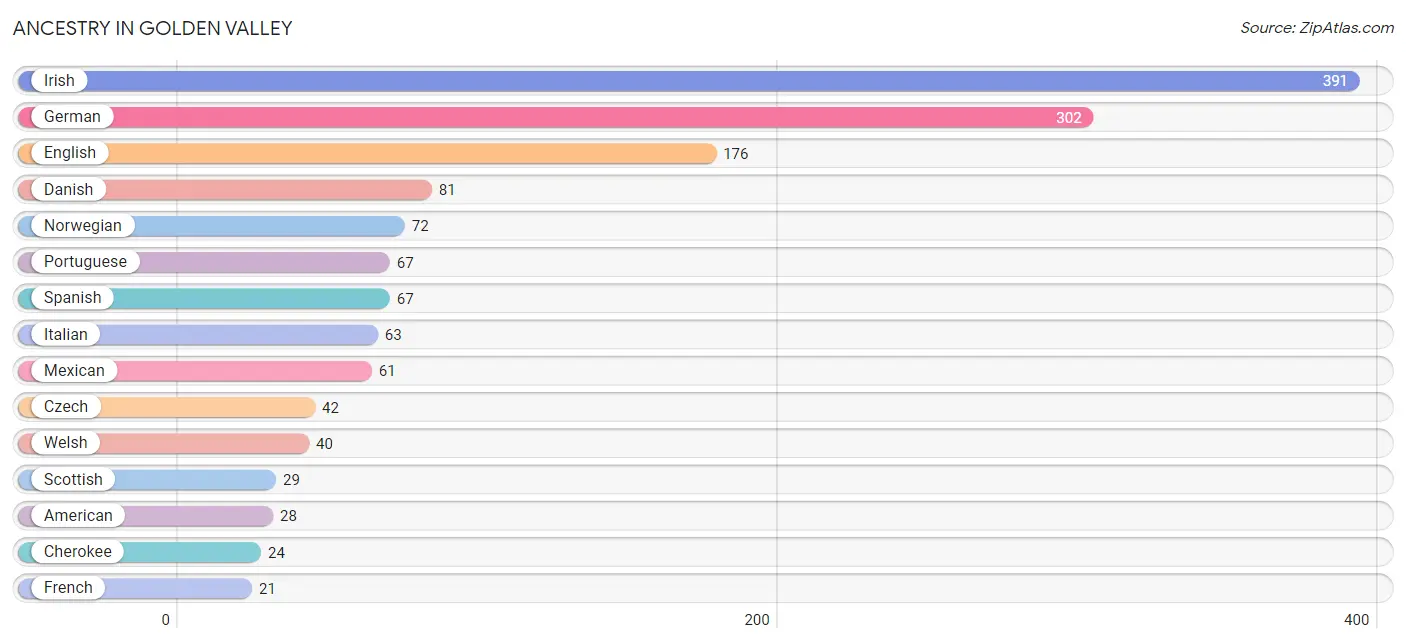
| Ancestry | # Population | % Population |
| American | 28 | 2.4% |
| Austrian | 15 | 1.3% |
| Canadian | 16 | 1.3% |
| Cherokee | 24 | 2.0% |
| Czech | 42 | 3.5% |
| Danish | 81 | 6.8% |
| Dutch | 5 | 0.4% |
| English | 176 | 14.9% |
| European | 13 | 1.1% |
| French | 21 | 1.8% |
| German | 302 | 25.5% |
| Indian (Asian) | 21 | 1.8% |
| Irish | 391 | 33.0% |
| Italian | 63 | 5.3% |
| Korean | 4 | 0.3% |
| Mexican | 61 | 5.1% |
| Mexican American Indian | 10 | 0.8% |
| Norwegian | 72 | 6.1% |
| Pakistani | 19 | 1.6% |
| Portuguese | 67 | 5.7% |
| Scottish | 29 | 2.5% |
| Shoshone | 4 | 0.3% |
| Spanish | 67 | 5.7% |
| Welsh | 40 | 3.4% | View All 24 Rows |
Immigrants in Golden Valley
The most numerous immigrant groups reported in Golden Valley came from Asia (23 | 1.9%), South Eastern Asia (23 | 1.9%), Thailand (19 | 1.6%), Canada (16 | 1.3%), and Philippines (4 | 0.3%), together accounting for 7.2% of all Golden Valley residents.
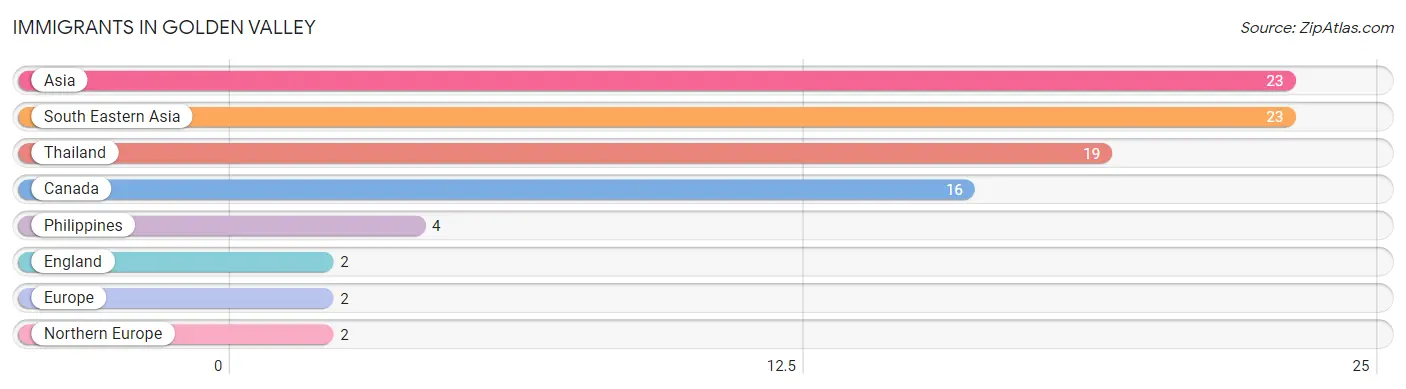
| Immigration Origin | # Population | % Population |
| Asia | 23 | 1.9% |
| Canada | 16 | 1.3% |
| England | 2 | 0.2% |
| Europe | 2 | 0.2% |
| Northern Europe | 2 | 0.2% |
| Philippines | 4 | 0.3% |
| South Eastern Asia | 23 | 1.9% |
| Thailand | 19 | 1.6% | View All 8 Rows |
Sex and Age in Golden Valley
Sex and Age in Golden Valley
The most populous age groups in Golden Valley are 65 to 69 Years (165 | 29.4%) for men and 60 to 64 Years (166 | 26.7%) for women.
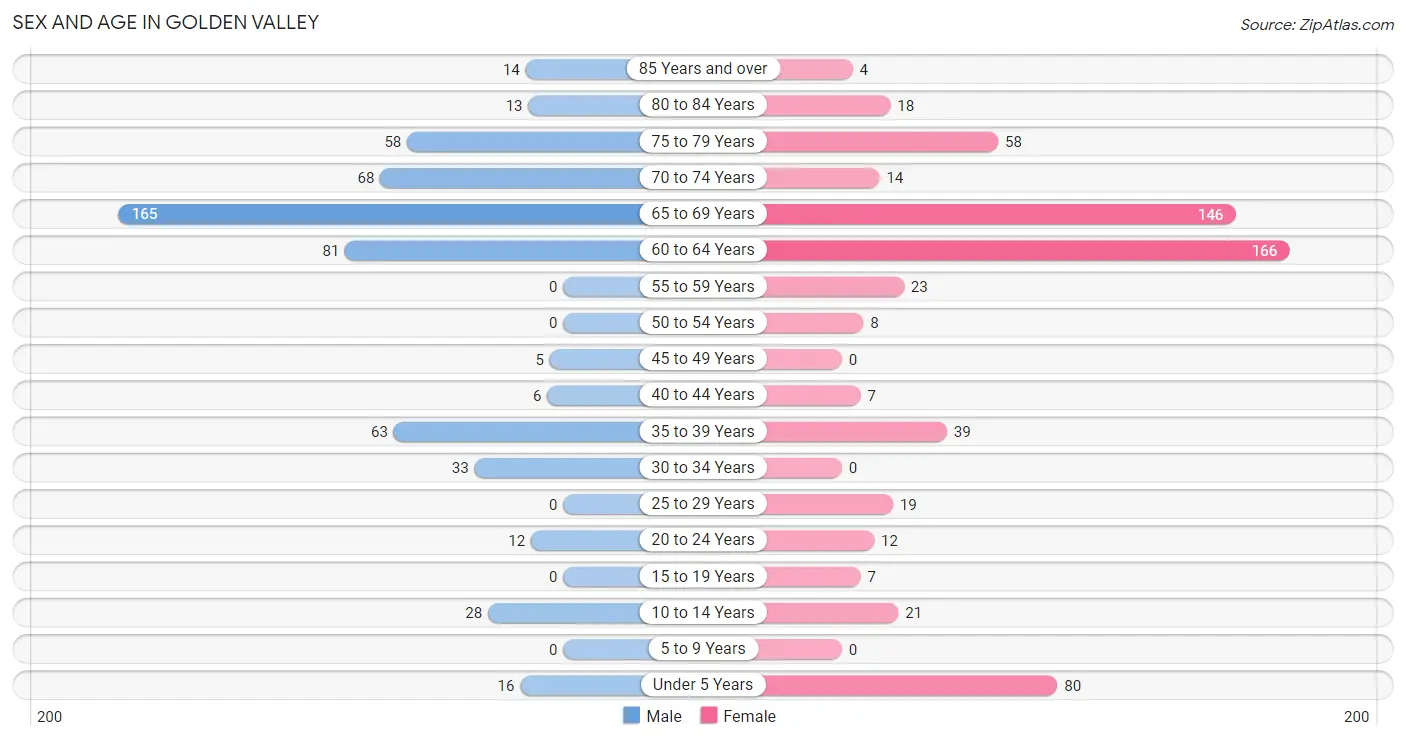
| Age Bracket | Male | Female |
| Under 5 Years | 16 (2.9%) | 80 (12.9%) |
| 5 to 9 Years | 0 (0.0%) | 0 (0.0%) |
| 10 to 14 Years | 28 (5.0%) | 21 (3.4%) |
| 15 to 19 Years | 0 (0.0%) | 7 (1.1%) |
| 20 to 24 Years | 12 (2.1%) | 12 (1.9%) |
| 25 to 29 Years | 0 (0.0%) | 19 (3.0%) |
| 30 to 34 Years | 33 (5.9%) | 0 (0.0%) |
| 35 to 39 Years | 63 (11.2%) | 39 (6.3%) |
| 40 to 44 Years | 6 (1.1%) | 7 (1.1%) |
| 45 to 49 Years | 5 (0.9%) | 0 (0.0%) |
| 50 to 54 Years | 0 (0.0%) | 8 (1.3%) |
| 55 to 59 Years | 0 (0.0%) | 23 (3.7%) |
| 60 to 64 Years | 81 (14.4%) | 166 (26.7%) |
| 65 to 69 Years | 165 (29.4%) | 146 (23.5%) |
| 70 to 74 Years | 68 (12.1%) | 14 (2.2%) |
| 75 to 79 Years | 58 (10.3%) | 58 (9.3%) |
| 80 to 84 Years | 13 (2.3%) | 18 (2.9%) |
| 85 Years and over | 14 (2.5%) | 4 (0.6%) |
| Total | 562 (100.0%) | 622 (100.0%) |
Families and Households in Golden Valley
Median Family Size in Golden Valley
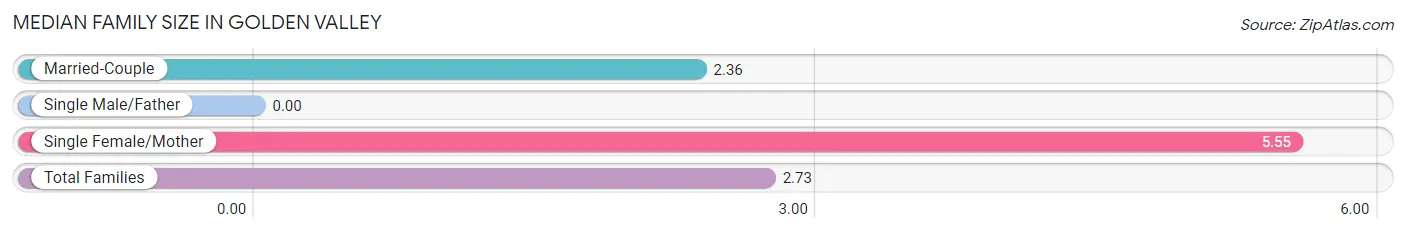
| Family Type | # Families | Family Size |
| Married-Couple | 320 (88.4%) | 2.36 |
| Single Male/Father | 0 (0.0%) | - |
| Single Female/Mother | 42 (11.6%) | 5.55 |
| Total Families | 362 (100.0%) | 2.73 |
Median Household Size in Golden Valley
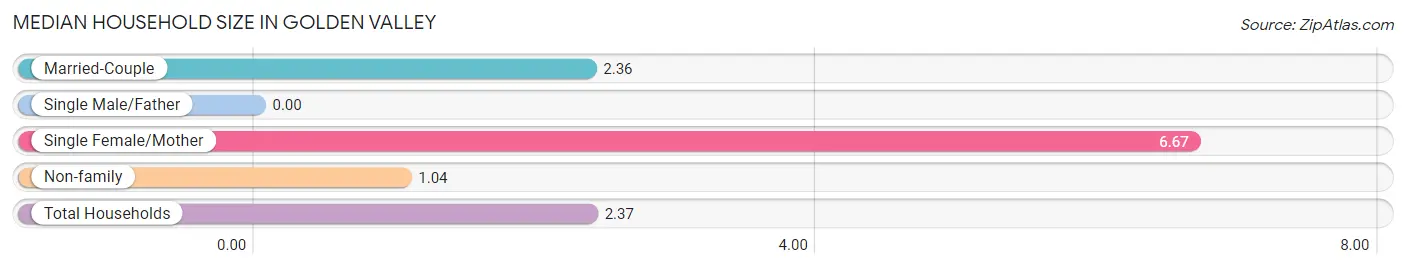
| Household Type | # Households | Household Size |
| Married-Couple | 320 (64.5%) | 2.36 |
| Single Male/Father | 0 (0.0%) | - |
| Single Female/Mother | 42 (8.5%) | 6.67 |
| Non-family | 134 (27.0%) | 1.04 |
| Total Households | 496 (100.0%) | 2.37 |
Household Size by Marriage Status in Golden Valley
Out of a total of 496 households in Golden Valley, 362 (73.0%) are family households, while 134 (27.0%) are nonfamily households. The most numerous type of family households are 2-person households, comprising 288, and the most common type of nonfamily households are 1-person households, comprising 128.
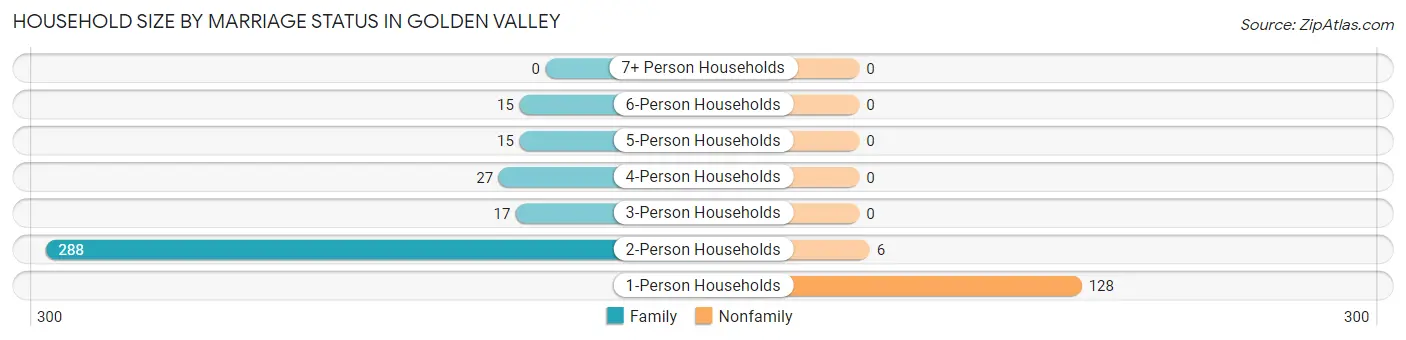
| Household Size | Family Households | Nonfamily Households |
| 1-Person Households | - | 128 (25.8%) |
| 2-Person Households | 288 (58.1%) | 6 (1.2%) |
| 3-Person Households | 17 (3.4%) | 0 (0.0%) |
| 4-Person Households | 27 (5.4%) | 0 (0.0%) |
| 5-Person Households | 15 (3.0%) | 0 (0.0%) |
| 6-Person Households | 15 (3.0%) | 0 (0.0%) |
| 7+ Person Households | 0 (0.0%) | 0 (0.0%) |
| Total | 362 (73.0%) | 134 (27.0%) |
Female Fertility in Golden Valley
Fertility by Age in Golden Valley
| Age Bracket | Women with Births | Births / 1,000 Women |
| 15 to 19 years | 0 (0.0%) | 0.0 |
| 20 to 34 years | 0 (0.0%) | 0.0 |
| 35 to 50 years | 0 (0.0%) | 0.0 |
| Total | 0 (0.0%) | 0.0 |
Fertility by Age by Marriage Status in Golden Valley
| Age Bracket | Married | Unmarried |
| 15 to 19 years | 0 (0.0%) | 0 (0.0%) |
| 20 to 34 years | 0 (0.0%) | 0 (0.0%) |
| 35 to 50 years | 0 (0.0%) | 0 (0.0%) |
| Total | 0 (0.0%) | 0 (0.0%) |
Fertility by Education in Golden Valley
| Educational Attainment | Women with Births | Births / 1,000 Women |
| Less than High School | 0 (0.0%) | 0.0 |
| High School Diploma | 0 (0.0%) | 0.0 |
| College or Associate's Degree | 0 (0.0%) | 0.0 |
| Bachelor's Degree | 0 (0.0%) | 0.0 |
| Graduate Degree | 0 (0.0%) | 0.0 |
| Total | 0 (0.0%) | 0.0 |
Fertility by Education by Marriage Status in Golden Valley
| Educational Attainment | Married | Unmarried |
| Less than High School | 0 (0.0%) | 0 (0.0%) |
| High School Diploma | 0 (0.0%) | 0 (0.0%) |
| College or Associate's Degree | 0 (0.0%) | 0 (0.0%) |
| Bachelor's Degree | 0 (0.0%) | 0 (0.0%) |
| Graduate Degree | 0 (0.0%) | 0 (0.0%) |
| Total | 0 (0.0%) | 0 (0.0%) |
Employment Characteristics in Golden Valley
Employment by Class of Employer in Golden Valley
Among the 445 employed individuals in Golden Valley, private company employees (341 | 76.6%), self-employed (not incorporated) (57 | 12.8%), and self-employed (incorporated) (28 | 6.3%) make up the most common classes of employment.
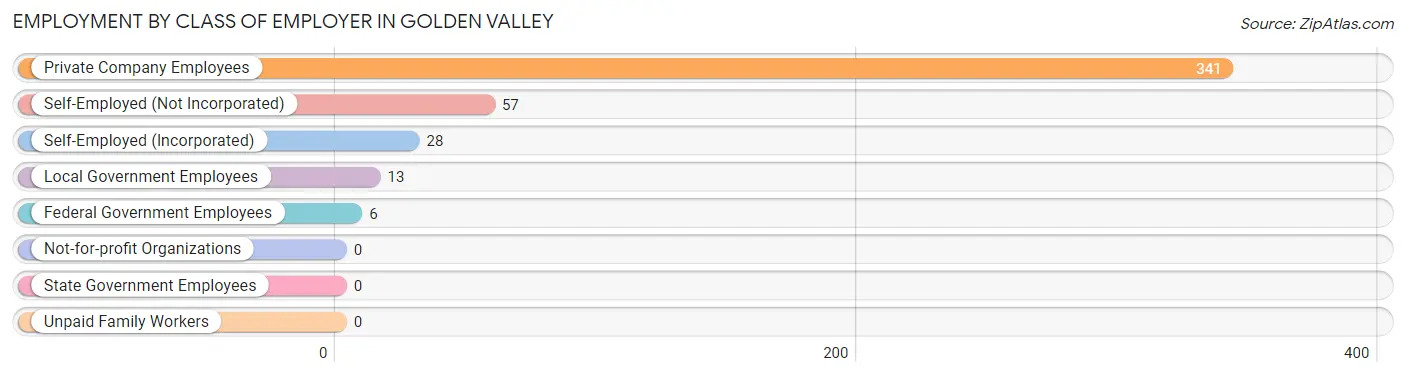
| Employer Class | # Employees | % Employees |
| Private Company Employees | 341 | 76.6% |
| Self-Employed (Incorporated) | 28 | 6.3% |
| Self-Employed (Not Incorporated) | 57 | 12.8% |
| Not-for-profit Organizations | 0 | 0.0% |
| Local Government Employees | 13 | 2.9% |
| State Government Employees | 0 | 0.0% |
| Federal Government Employees | 6 | 1.3% |
| Unpaid Family Workers | 0 | 0.0% |
| Total | 445 | 100.0% |
Employment Status by Age in Golden Valley
According to the labor force statistics for Golden Valley, out of the total population over 16 years of age (1,039), 43.8% or 455 individuals are in the labor force, with 2.2% or 10 of them unemployed. The age group with the highest labor force participation rate is 20 to 24 years, with 100.0% or 24 individuals in the labor force. Within the labor force, the 45 to 54 years age range has the highest percentage of unemployed individuals, with 100.0% or 5 of them being unemployed.
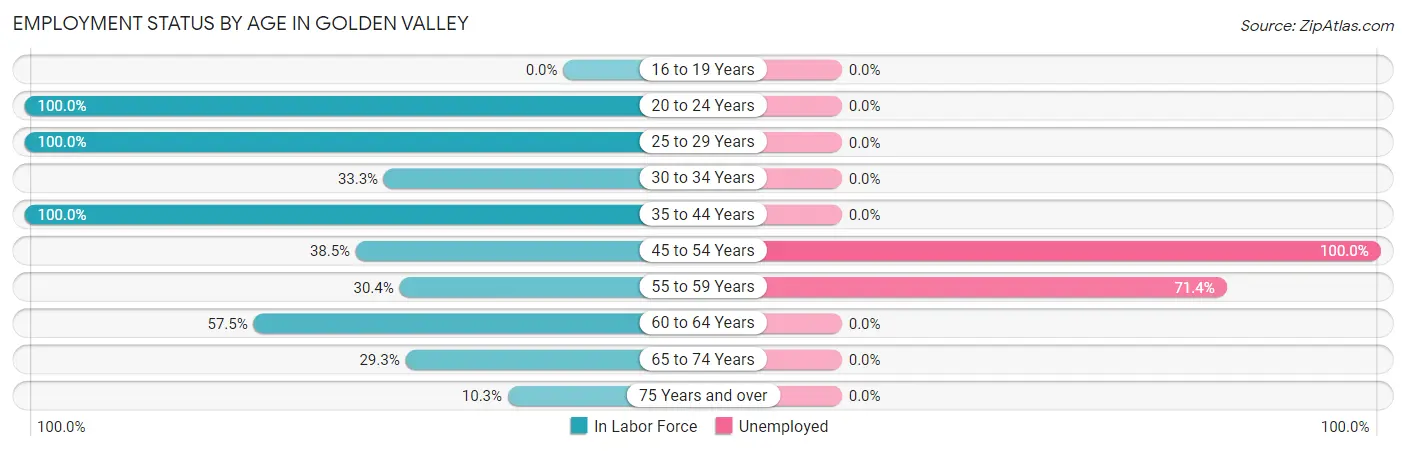
| Age Bracket | In Labor Force | Unemployed |
| 16 to 19 Years | 0 (0.0%) | 0 (0.0%) |
| 20 to 24 Years | 24 (100.0%) | 0 (0.0%) |
| 25 to 29 Years | 19 (100.0%) | 0 (0.0%) |
| 30 to 34 Years | 11 (33.3%) | 0 (0.0%) |
| 35 to 44 Years | 115 (100.0%) | 0 (0.0%) |
| 45 to 54 Years | 5 (38.5%) | 5 (100.0%) |
| 55 to 59 Years | 7 (30.4%) | 5 (71.4%) |
| 60 to 64 Years | 142 (57.5%) | 0 (0.0%) |
| 65 to 74 Years | 115 (29.3%) | 0 (0.0%) |
| 75 Years and over | 17 (10.3%) | 0 (0.0%) |
| Total | 455 (43.8%) | 10 (2.2%) |
Employment Status by Educational Attainment in Golden Valley
According to labor force statistics for Golden Valley, 66.4% of individuals (299) out of the total population between 25 and 64 years of age (450) are in the labor force, with 3.3% or 10 of them being unemployed. The group with the highest labor force participation rate are those with the educational attainment of less than high school, with 100.0% or 35 individuals in the labor force. Within the labor force, individuals with less than high school education have the highest percentage of unemployment, with 14.3% or 5 of them being unemployed.
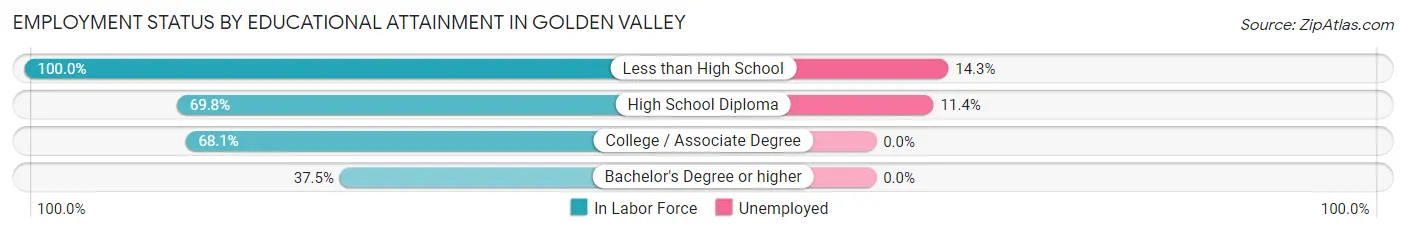
| Educational Attainment | In Labor Force | Unemployed |
| Less than High School | 35 (100.0%) | 5 (14.3%) |
| High School Diploma | 44 (69.8%) | 7 (11.4%) |
| College / Associate Degree | 196 (68.1%) | 0 (0.0%) |
| Bachelor's Degree or higher | 24 (37.5%) | 0 (0.0%) |
| Total | 299 (66.4%) | 15 (3.3%) |
Employment Occupations by Sex in Golden Valley
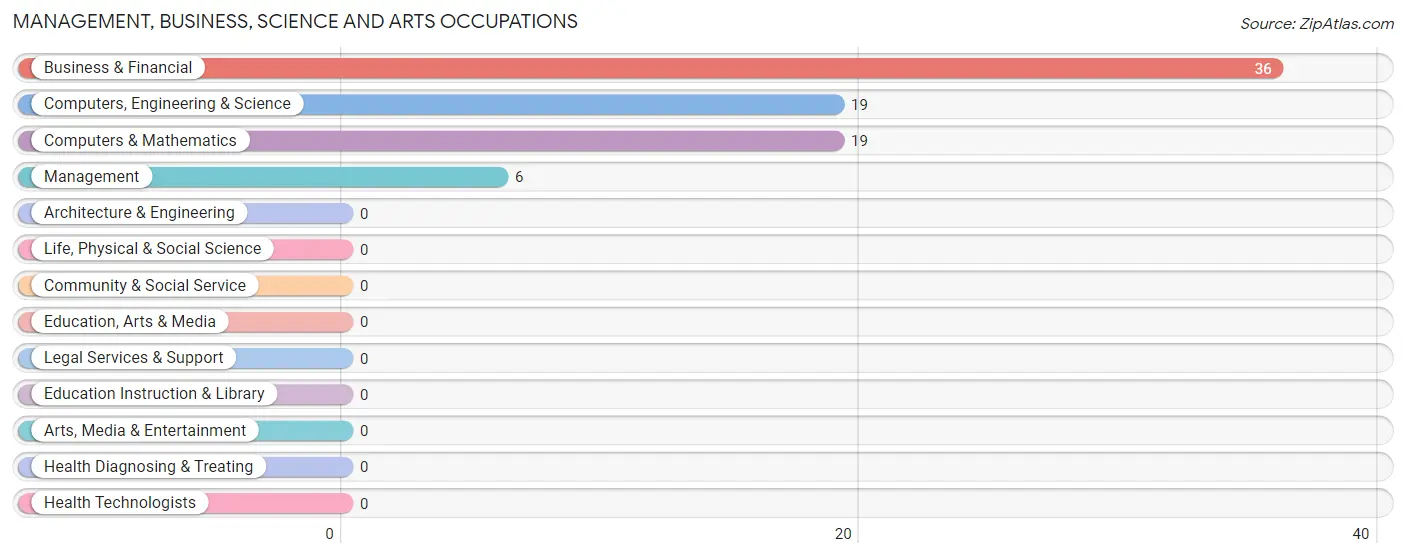
Management, Business, Science and Arts Occupations
The most common Management, Business, Science and Arts occupations in Golden Valley are Business & Financial (36 | 8.1%), Computers, Engineering & Science (19 | 4.3%), Computers & Mathematics (19 | 4.3%), and Management (6 | 1.3%).
Management, Business, Science and Arts Occupations by Sex
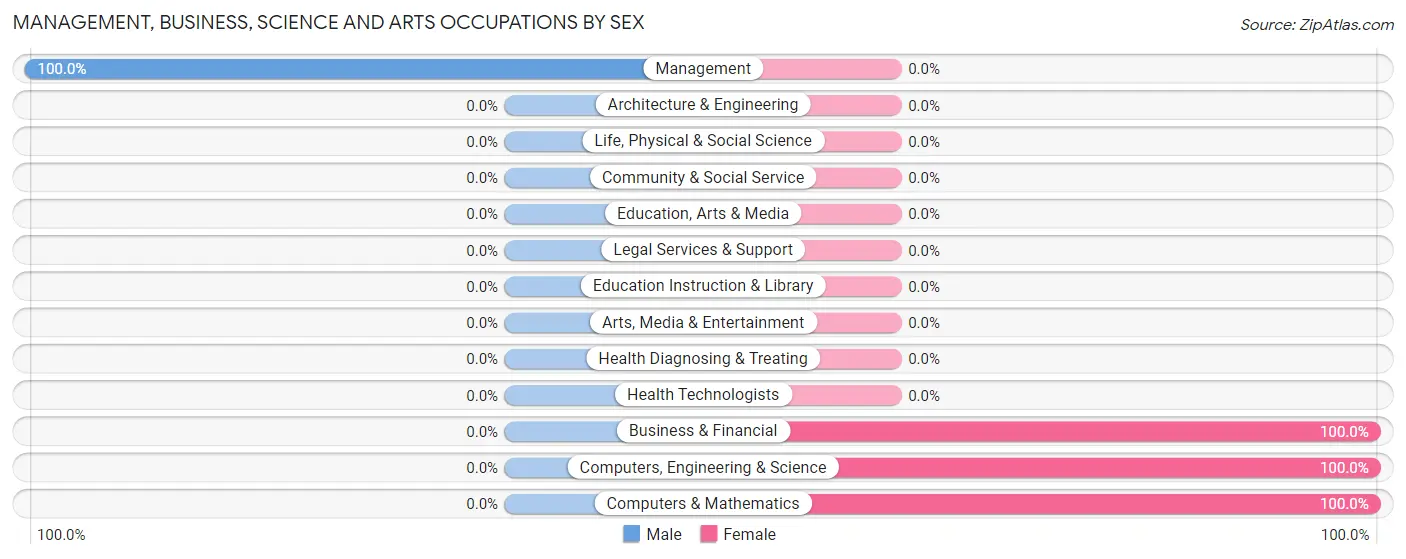
| Occupation | Male | Female |
| Management | 6 (100.0%) | 0 (0.0%) |
| Business & Financial | 0 (0.0%) | 36 (100.0%) |
| Computers, Engineering & Science | 0 (0.0%) | 19 (100.0%) |
| Computers & Mathematics | 0 (0.0%) | 19 (100.0%) |
| Architecture & Engineering | 0 (0.0%) | 0 (0.0%) |
| Life, Physical & Social Science | 0 (0.0%) | 0 (0.0%) |
| Community & Social Service | 0 (0.0%) | 0 (0.0%) |
| Education, Arts & Media | 0 (0.0%) | 0 (0.0%) |
| Legal Services & Support | 0 (0.0%) | 0 (0.0%) |
| Education Instruction & Library | 0 (0.0%) | 0 (0.0%) |
| Arts, Media & Entertainment | 0 (0.0%) | 0 (0.0%) |
| Health Diagnosing & Treating | 0 (0.0%) | 0 (0.0%) |
| Health Technologists | 0 (0.0%) | 0 (0.0%) |
| Total (Category) | 6 (9.8%) | 55 (90.2%) |
| Total (Overall) | 170 (38.2%) | 275 (61.8%) |
Services Occupations
The most common Services occupations in Golden Valley are Food Preparation & Serving (26 | 5.8%), and Healthcare Support (14 | 3.2%).
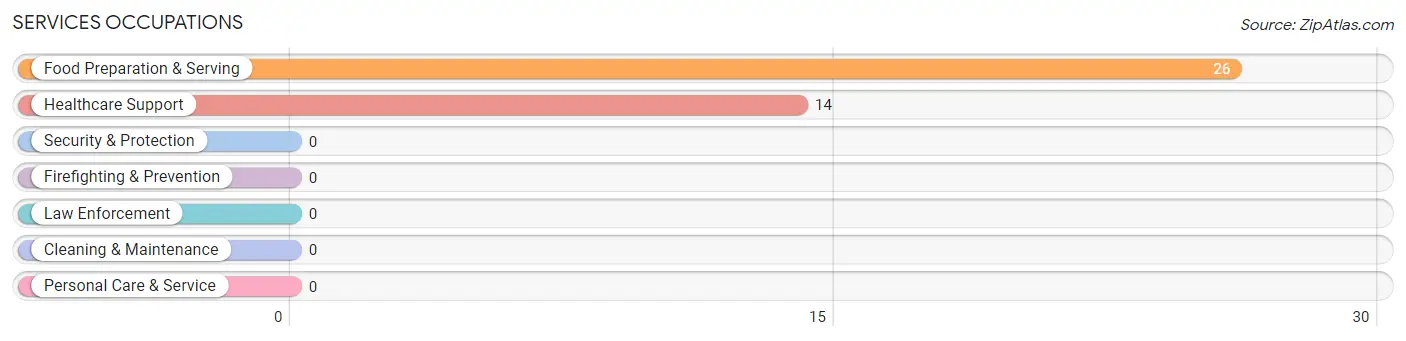
Services Occupations by Sex
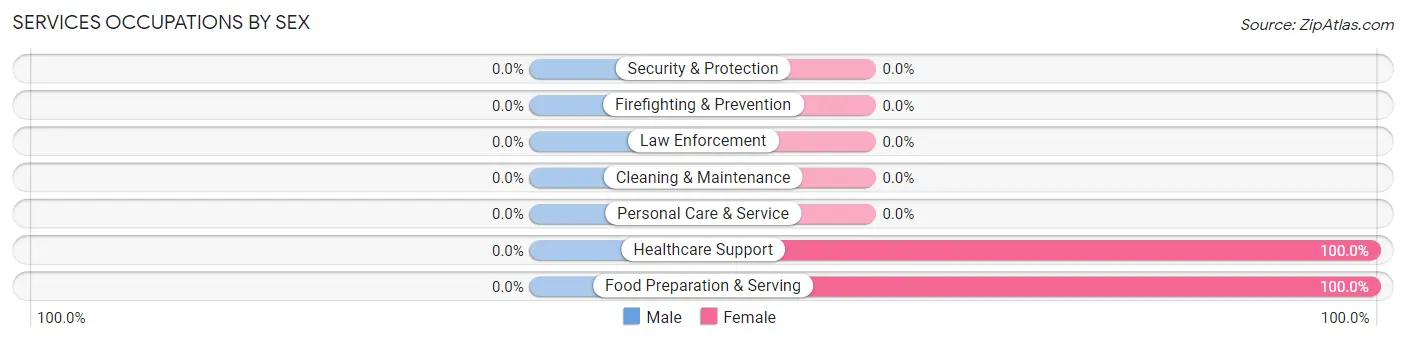
| Occupation | Male | Female |
| Healthcare Support | 0 (0.0%) | 14 (100.0%) |
| Security & Protection | 0 (0.0%) | 0 (0.0%) |
| Firefighting & Prevention | 0 (0.0%) | 0 (0.0%) |
| Law Enforcement | 0 (0.0%) | 0 (0.0%) |
| Food Preparation & Serving | 0 (0.0%) | 26 (100.0%) |
| Cleaning & Maintenance | 0 (0.0%) | 0 (0.0%) |
| Personal Care & Service | 0 (0.0%) | 0 (0.0%) |
| Total (Category) | 0 (0.0%) | 40 (100.0%) |
| Total (Overall) | 170 (38.2%) | 275 (61.8%) |
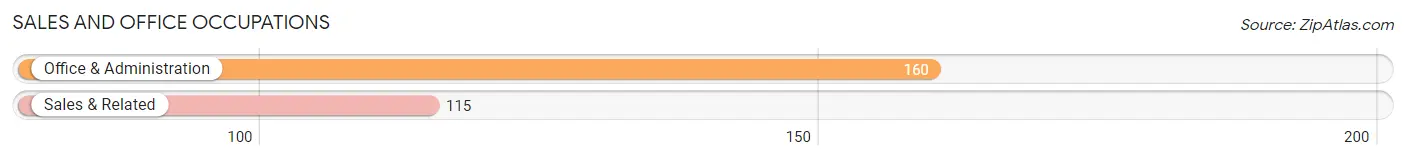
Sales and Office Occupations
The most common Sales and Office occupations in Golden Valley are Office & Administration (160 | 36.0%), and Sales & Related (115 | 25.8%).
Sales and Office Occupations by Sex
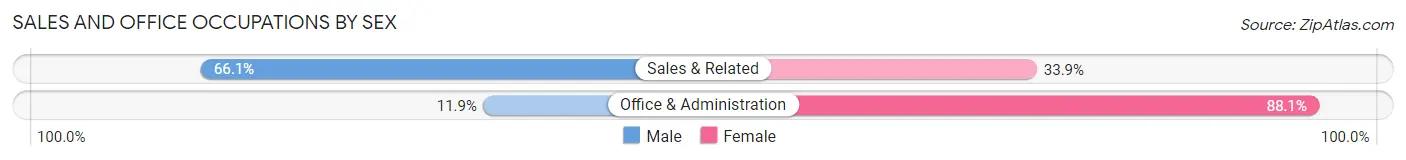
| Occupation | Male | Female |
| Sales & Related | 76 (66.1%) | 39 (33.9%) |
| Office & Administration | 19 (11.9%) | 141 (88.1%) |
| Total (Category) | 95 (34.5%) | 180 (65.4%) |
| Total (Overall) | 170 (38.2%) | 275 (61.8%) |
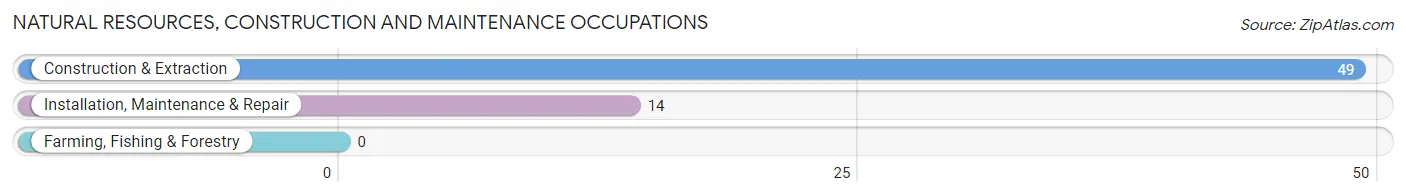
Natural Resources, Construction and Maintenance Occupations
The most common Natural Resources, Construction and Maintenance occupations in Golden Valley are Construction & Extraction (49 | 11.0%), and Installation, Maintenance & Repair (14 | 3.2%).
Natural Resources, Construction and Maintenance Occupations by Sex
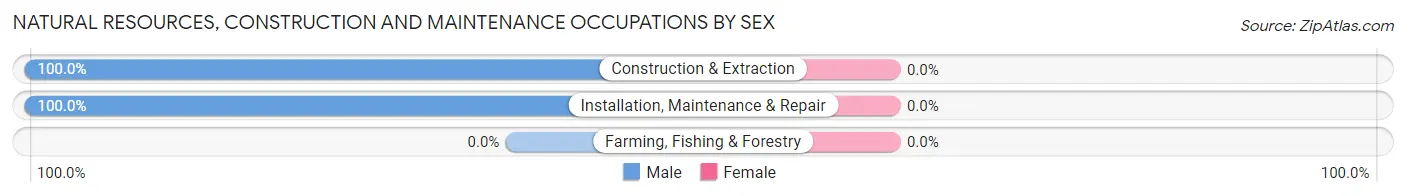
| Occupation | Male | Female |
| Farming, Fishing & Forestry | 0 (0.0%) | 0 (0.0%) |
| Construction & Extraction | 49 (100.0%) | 0 (0.0%) |
| Installation, Maintenance & Repair | 14 (100.0%) | 0 (0.0%) |
| Total (Category) | 63 (100.0%) | 0 (0.0%) |
| Total (Overall) | 170 (38.2%) | 275 (61.8%) |
Production, Transportation and Moving Occupations
The most common Production, Transportation and Moving occupations in Golden Valley are , and Production (6 | 1.3%).
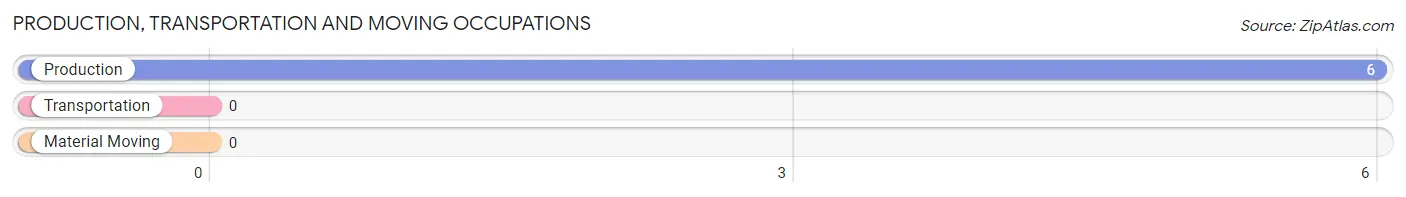
Production, Transportation and Moving Occupations by Sex
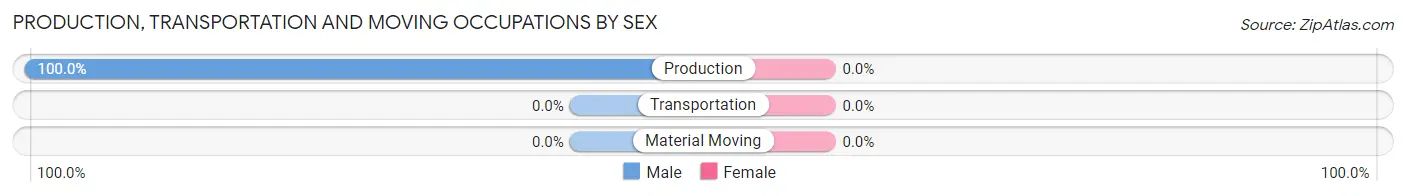
| Occupation | Male | Female |
| Production | 6 (100.0%) | 0 (0.0%) |
| Transportation | 0 (0.0%) | 0 (0.0%) |
| Material Moving | 0 (0.0%) | 0 (0.0%) |
| Total (Category) | 6 (100.0%) | 0 (0.0%) |
| Total (Overall) | 170 (38.2%) | 275 (61.8%) |
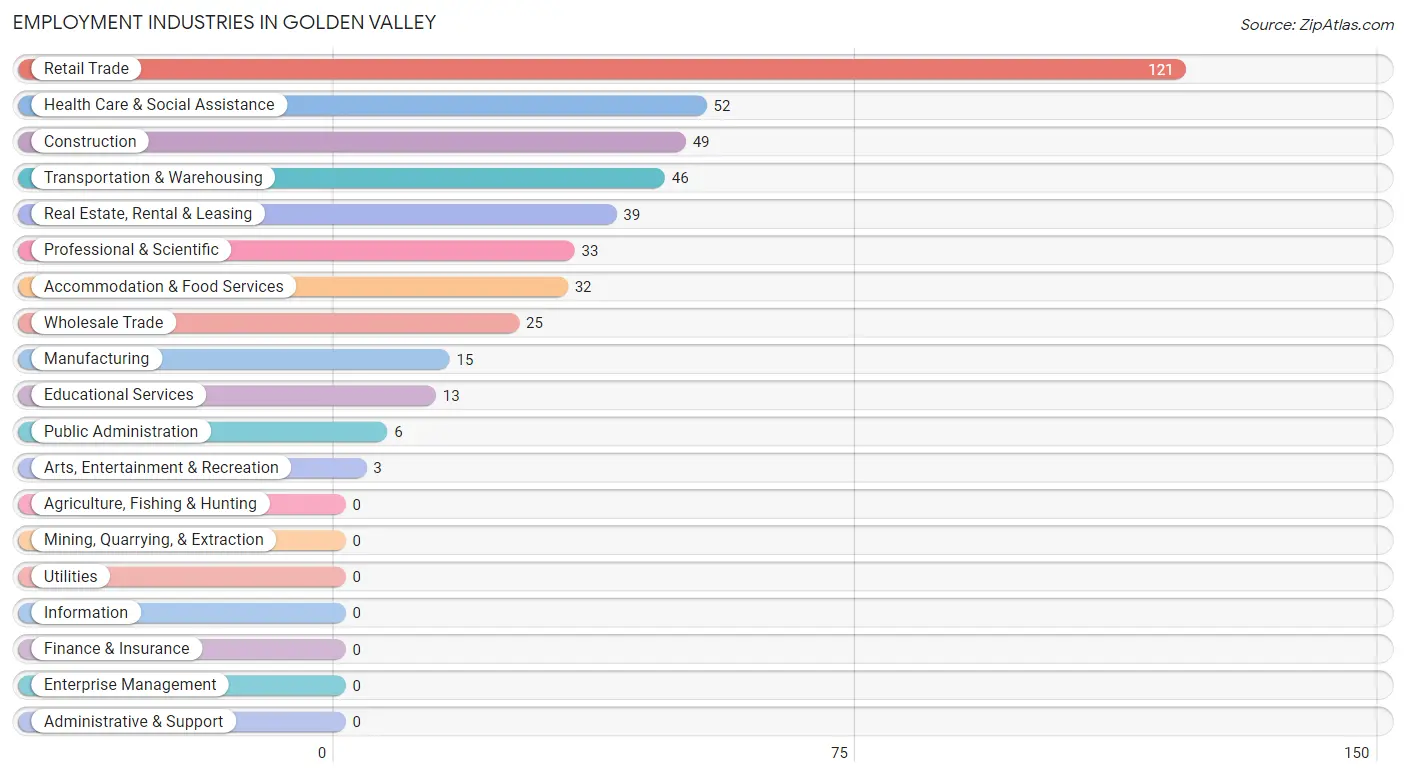
Employment Industries by Sex in Golden Valley
Employment Industries in Golden Valley
The major employment industries in Golden Valley include Retail Trade (121 | 27.2%), Health Care & Social Assistance (52 | 11.7%), Construction (49 | 11.0%), Transportation & Warehousing (46 | 10.3%), and Real Estate, Rental & Leasing (39 | 8.8%).
Employment Industries by Sex in Golden Valley
The Golden Valley industries that see more men than women are Construction (100.0%), Wholesale Trade (100.0%), and Arts, Entertainment & Recreation (100.0%), whereas the industries that tend to have a higher number of women are Manufacturing (100.0%), Transportation & Warehousing (100.0%), and Real Estate, Rental & Leasing (100.0%).
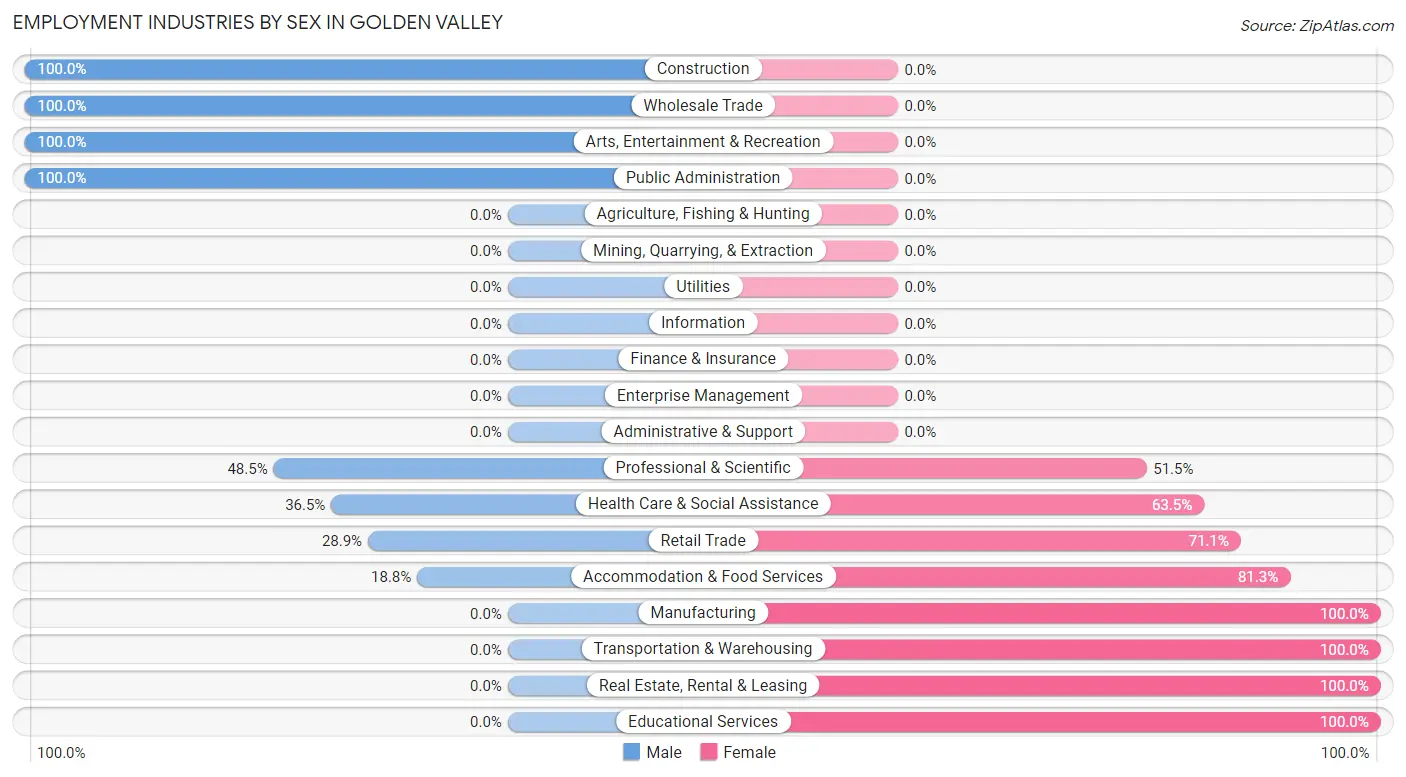
| Industry | Male | Female |
| Agriculture, Fishing & Hunting | 0 (0.0%) | 0 (0.0%) |
| Mining, Quarrying, & Extraction | 0 (0.0%) | 0 (0.0%) |
| Construction | 49 (100.0%) | 0 (0.0%) |
| Manufacturing | 0 (0.0%) | 15 (100.0%) |
| Wholesale Trade | 25 (100.0%) | 0 (0.0%) |
| Retail Trade | 35 (28.9%) | 86 (71.1%) |
| Transportation & Warehousing | 0 (0.0%) | 46 (100.0%) |
| Utilities | 0 (0.0%) | 0 (0.0%) |
| Information | 0 (0.0%) | 0 (0.0%) |
| Finance & Insurance | 0 (0.0%) | 0 (0.0%) |
| Real Estate, Rental & Leasing | 0 (0.0%) | 39 (100.0%) |
| Professional & Scientific | 16 (48.5%) | 17 (51.5%) |
| Enterprise Management | 0 (0.0%) | 0 (0.0%) |
| Administrative & Support | 0 (0.0%) | 0 (0.0%) |
| Educational Services | 0 (0.0%) | 13 (100.0%) |
| Health Care & Social Assistance | 19 (36.5%) | 33 (63.5%) |
| Arts, Entertainment & Recreation | 3 (100.0%) | 0 (0.0%) |
| Accommodation & Food Services | 6 (18.8%) | 26 (81.2%) |
| Public Administration | 6 (100.0%) | 0 (0.0%) |
| Total | 170 (38.2%) | 275 (61.8%) |
Education in Golden Valley
School Enrollment in Golden Valley
The most common levels of schooling among the 56 students in Golden Valley are middle school (49 | 87.5%), and high school (7 | 12.5%).
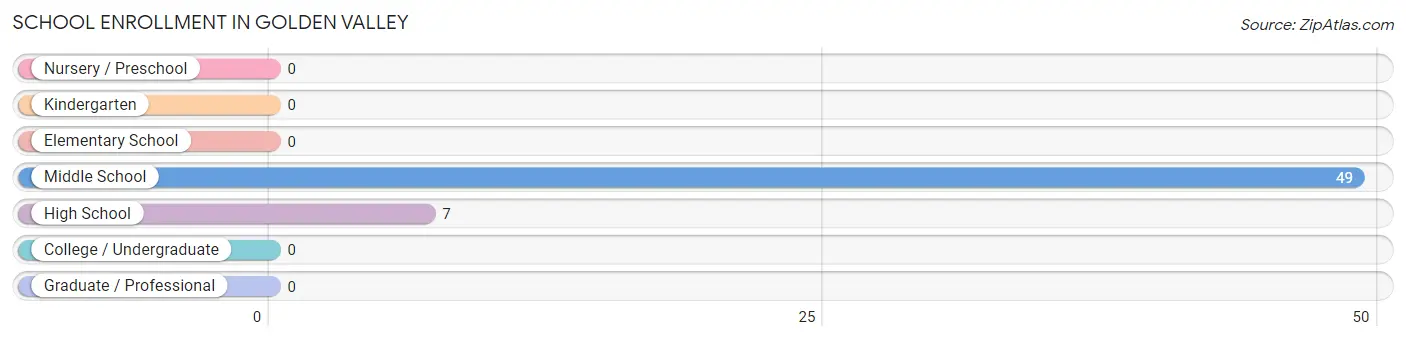
| School Level | # Students | % Students |
| Nursery / Preschool | 0 | 0.0% |
| Kindergarten | 0 | 0.0% |
| Elementary School | 0 | 0.0% |
| Middle School | 49 | 87.5% |
| High School | 7 | 12.5% |
| College / Undergraduate | 0 | 0.0% |
| Graduate / Professional | 0 | 0.0% |
| Total | 56 | 100.0% |
School Enrollment by Age by Funding Source in Golden Valley
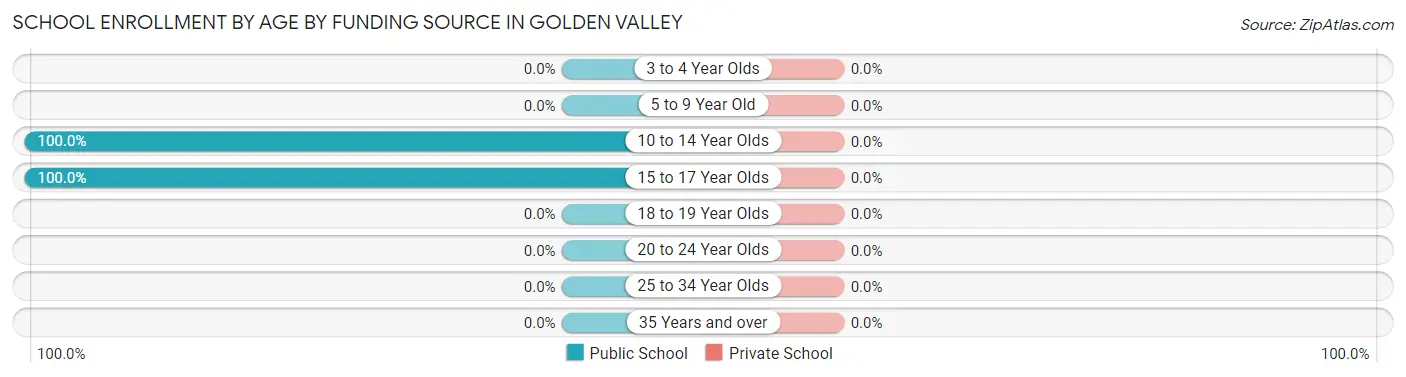
| Age Bracket | Public School | Private School |
| 3 to 4 Year Olds | 0 (0.0%) | 0 (0.0%) |
| 5 to 9 Year Old | 0 (0.0%) | 0 (0.0%) |
| 10 to 14 Year Olds | 49 (100.0%) | 0 (0.0%) |
| 15 to 17 Year Olds | 7 (100.0%) | 0 (0.0%) |
| 18 to 19 Year Olds | 0 (0.0%) | 0 (0.0%) |
| 20 to 24 Year Olds | 0 (0.0%) | 0 (0.0%) |
| 25 to 34 Year Olds | 0 (0.0%) | 0 (0.0%) |
| 35 Years and over | 0 (0.0%) | 0 (0.0%) |
| Total | 56 (100.0%) | 0 (0.0%) |
Educational Attainment by Field of Study in Golden Valley
Science & technology (103 | 38.9%), education (62 | 23.4%), bio, nature & agricultural (24 | 9.1%), psychology (22 | 8.3%), and computers & mathematics (17 | 6.4%) are the most common fields of study among 265 individuals in Golden Valley who have obtained a bachelor's degree or higher.
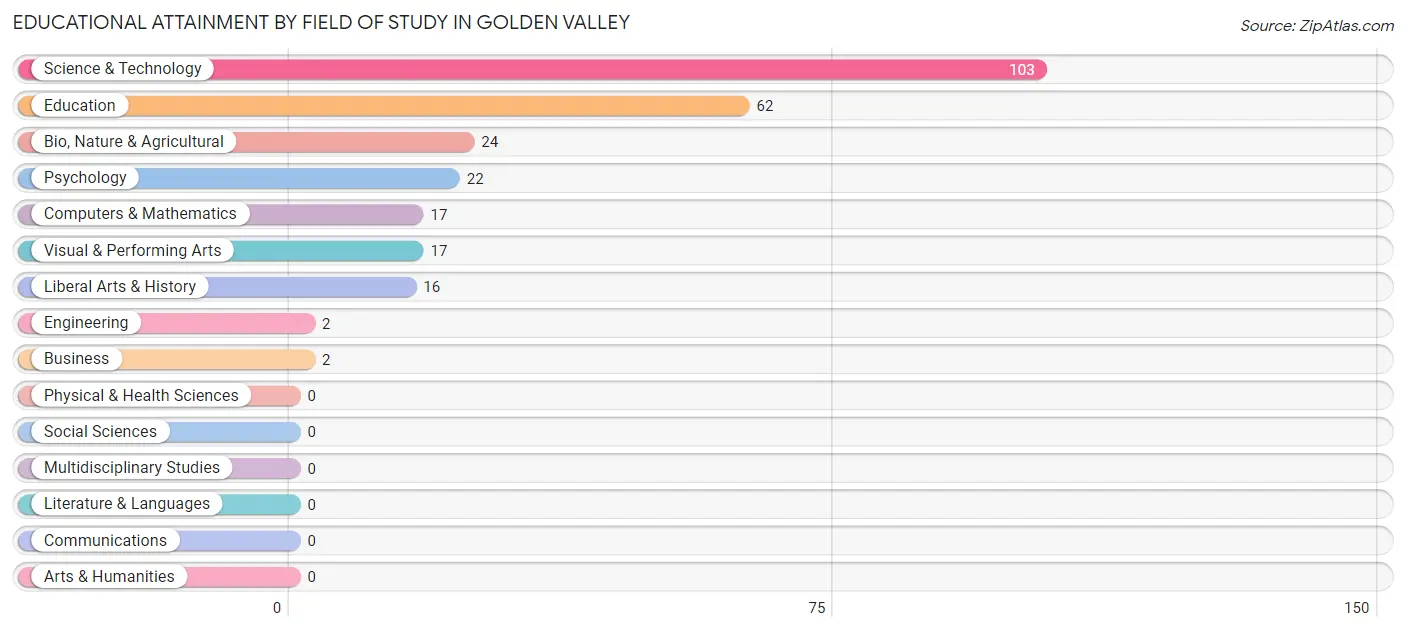
| Field of Study | # Graduates | % Graduates |
| Computers & Mathematics | 17 | 6.4% |
| Bio, Nature & Agricultural | 24 | 9.1% |
| Physical & Health Sciences | 0 | 0.0% |
| Psychology | 22 | 8.3% |
| Social Sciences | 0 | 0.0% |
| Engineering | 2 | 0.7% |
| Multidisciplinary Studies | 0 | 0.0% |
| Science & Technology | 103 | 38.9% |
| Business | 2 | 0.7% |
| Education | 62 | 23.4% |
| Literature & Languages | 0 | 0.0% |
| Liberal Arts & History | 16 | 6.0% |
| Visual & Performing Arts | 17 | 6.4% |
| Communications | 0 | 0.0% |
| Arts & Humanities | 0 | 0.0% |
| Total | 265 | 100.0% |
Transportation & Commute in Golden Valley
Vehicle Availability by Sex in Golden Valley
The most prevalent vehicle ownership categories in Golden Valley are males with 2 vehicles (86, accounting for 50.6%) and females with 2 vehicles (102, making up 31.5%).
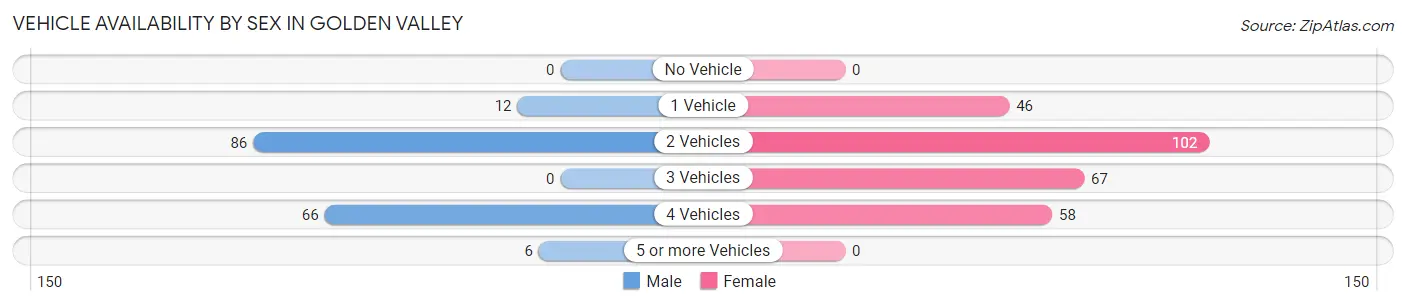
| Vehicles Available | Male | Female |
| No Vehicle | 0 (0.0%) | 0 (0.0%) |
| 1 Vehicle | 12 (7.1%) | 46 (16.9%) |
| 2 Vehicles | 86 (50.6%) | 102 (37.4%) |
| 3 Vehicles | 0 (0.0%) | 67 (24.5%) |
| 4 Vehicles | 66 (38.8%) | 58 (21.2%) |
| 5 or more Vehicles | 6 (3.5%) | 0 (0.0%) |
| Total | 170 (100.0%) | 273 (100.0%) |
Commute Time in Golden Valley
The most frequently occuring commute durations in Golden Valley are 20 to 24 minutes (126 commuters, 30.0%), 10 to 14 minutes (89 commuters, 21.2%), and 45 to 59 minutes (65 commuters, 15.5%).
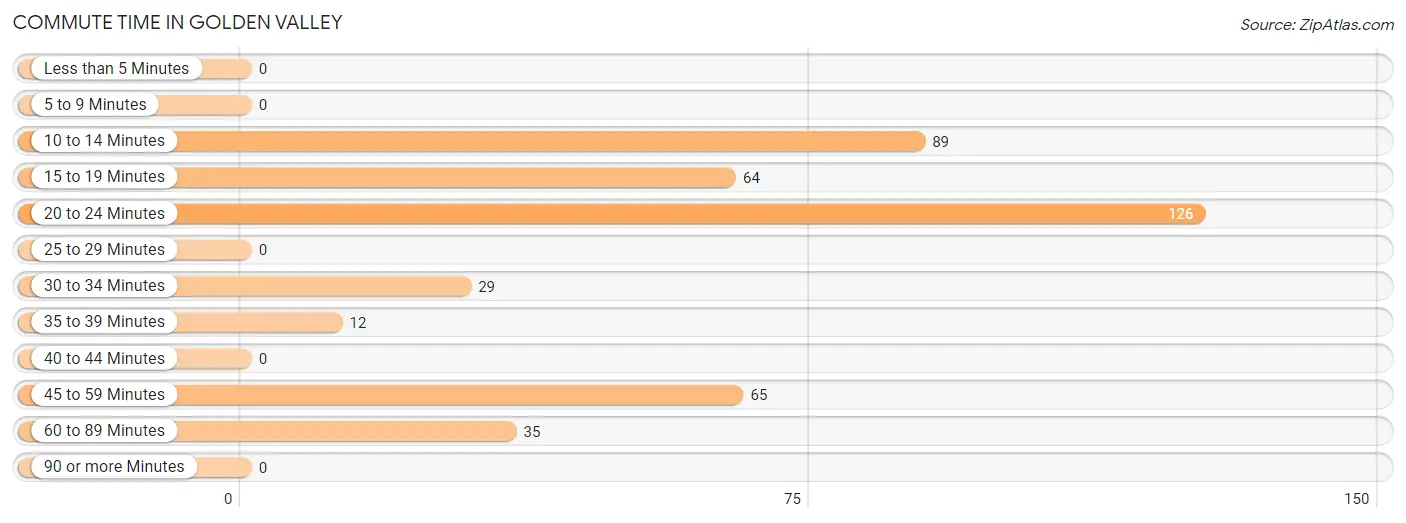
| Commute Time | # Commuters | % Commuters |
| Less than 5 Minutes | 0 | 0.0% |
| 5 to 9 Minutes | 0 | 0.0% |
| 10 to 14 Minutes | 89 | 21.2% |
| 15 to 19 Minutes | 64 | 15.2% |
| 20 to 24 Minutes | 126 | 30.0% |
| 25 to 29 Minutes | 0 | 0.0% |
| 30 to 34 Minutes | 29 | 6.9% |
| 35 to 39 Minutes | 12 | 2.9% |
| 40 to 44 Minutes | 0 | 0.0% |
| 45 to 59 Minutes | 65 | 15.5% |
| 60 to 89 Minutes | 35 | 8.3% |
| 90 or more Minutes | 0 | 0.0% |
Commute Time by Sex in Golden Valley
The most common commute times in Golden Valley are 20 to 24 minutes (72 commuters, 43.9%) for males and 10 to 14 minutes (86 commuters, 33.6%) for females.
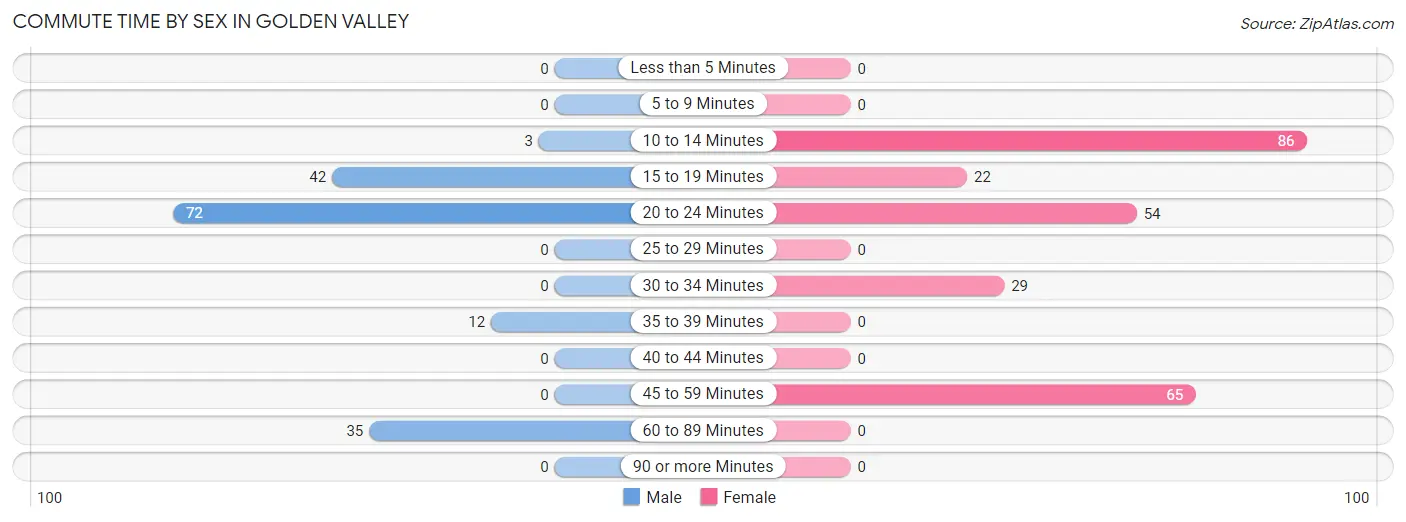
| Commute Time | Male | Female |
| Less than 5 Minutes | 0 (0.0%) | 0 (0.0%) |
| 5 to 9 Minutes | 0 (0.0%) | 0 (0.0%) |
| 10 to 14 Minutes | 3 (1.8%) | 86 (33.6%) |
| 15 to 19 Minutes | 42 (25.6%) | 22 (8.6%) |
| 20 to 24 Minutes | 72 (43.9%) | 54 (21.1%) |
| 25 to 29 Minutes | 0 (0.0%) | 0 (0.0%) |
| 30 to 34 Minutes | 0 (0.0%) | 29 (11.3%) |
| 35 to 39 Minutes | 12 (7.3%) | 0 (0.0%) |
| 40 to 44 Minutes | 0 (0.0%) | 0 (0.0%) |
| 45 to 59 Minutes | 0 (0.0%) | 65 (25.4%) |
| 60 to 89 Minutes | 35 (21.3%) | 0 (0.0%) |
| 90 or more Minutes | 0 (0.0%) | 0 (0.0%) |
Time of Departure to Work by Sex in Golden Valley
The most frequent times of departure to work in Golden Valley are 8:00 AM to 8:29 AM (35, 21.3%) for males and 7:00 AM to 7:29 AM (125, 48.8%) for females.
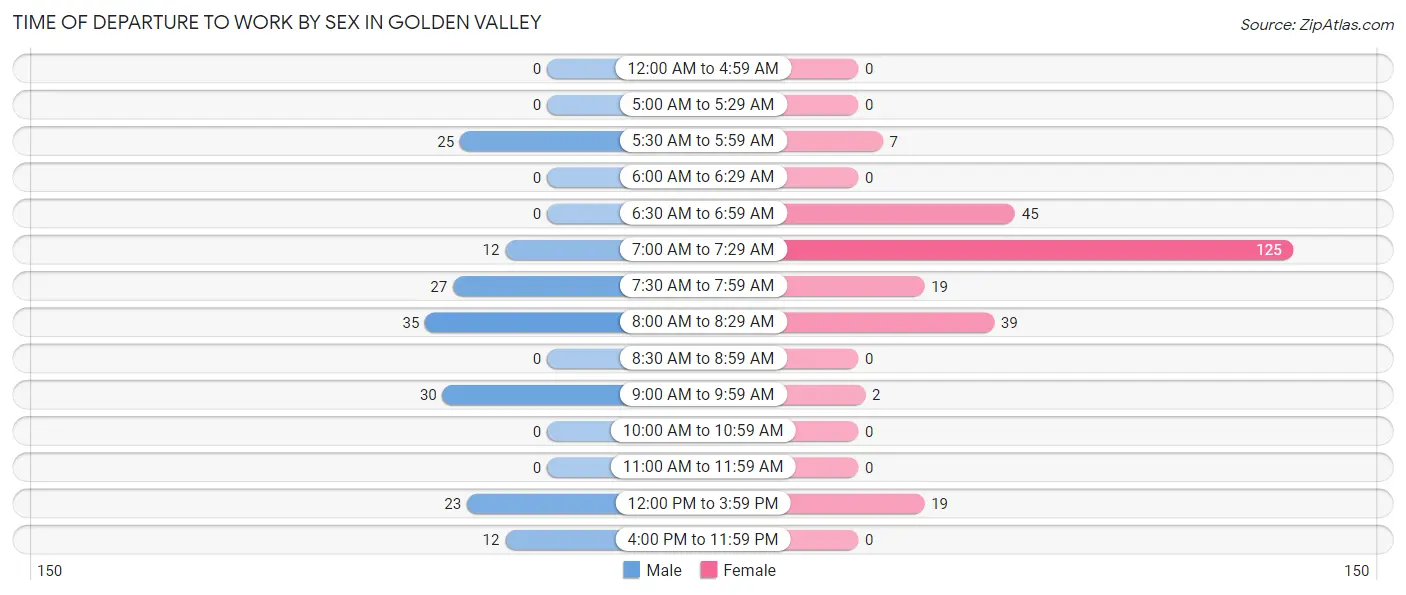
| Time of Departure | Male | Female |
| 12:00 AM to 4:59 AM | 0 (0.0%) | 0 (0.0%) |
| 5:00 AM to 5:29 AM | 0 (0.0%) | 0 (0.0%) |
| 5:30 AM to 5:59 AM | 25 (15.2%) | 7 (2.7%) |
| 6:00 AM to 6:29 AM | 0 (0.0%) | 0 (0.0%) |
| 6:30 AM to 6:59 AM | 0 (0.0%) | 45 (17.6%) |
| 7:00 AM to 7:29 AM | 12 (7.3%) | 125 (48.8%) |
| 7:30 AM to 7:59 AM | 27 (16.5%) | 19 (7.4%) |
| 8:00 AM to 8:29 AM | 35 (21.3%) | 39 (15.2%) |
| 8:30 AM to 8:59 AM | 0 (0.0%) | 0 (0.0%) |
| 9:00 AM to 9:59 AM | 30 (18.3%) | 2 (0.8%) |
| 10:00 AM to 10:59 AM | 0 (0.0%) | 0 (0.0%) |
| 11:00 AM to 11:59 AM | 0 (0.0%) | 0 (0.0%) |
| 12:00 PM to 3:59 PM | 23 (14.0%) | 19 (7.4%) |
| 4:00 PM to 11:59 PM | 12 (7.3%) | 0 (0.0%) |
| Total | 164 (100.0%) | 256 (100.0%) |
Housing Occupancy in Golden Valley
Occupancy by Ownership in Golden Valley
Of the total 496 dwellings in Golden Valley, owner-occupied units account for 443 (89.3%), while renter-occupied units make up 53 (10.7%).
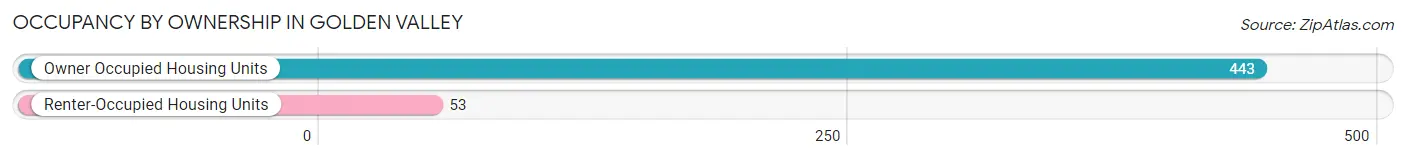
| Occupancy | # Housing Units | % Housing Units |
| Owner Occupied Housing Units | 443 | 89.3% |
| Renter-Occupied Housing Units | 53 | 10.7% |
| Total Occupied Housing Units | 496 | 100.0% |
Occupancy by Household Size in Golden Valley
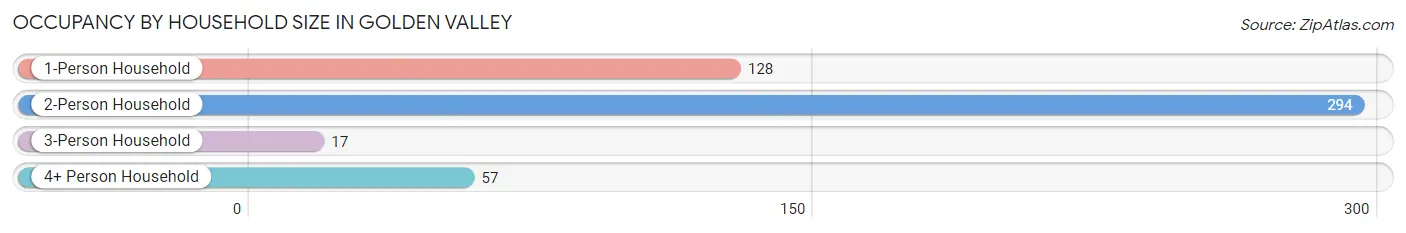
| Household Size | # Housing Units | % Housing Units |
| 1-Person Household | 128 | 25.8% |
| 2-Person Household | 294 | 59.3% |
| 3-Person Household | 17 | 3.4% |
| 4+ Person Household | 57 | 11.5% |
| Total Housing Units | 496 | 100.0% |
Occupancy by Ownership by Household Size in Golden Valley
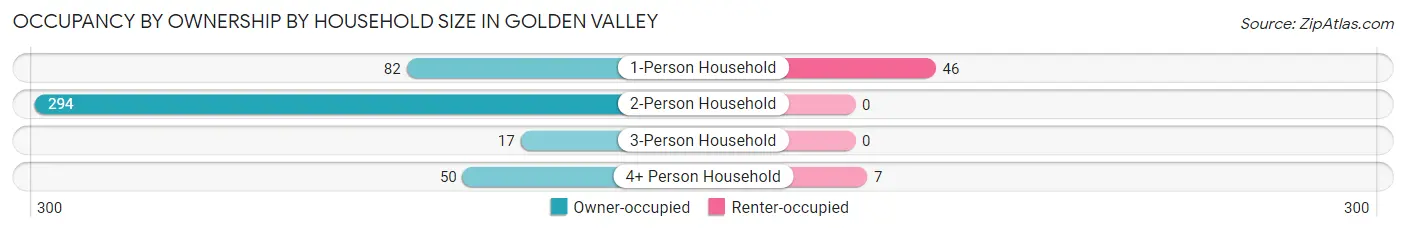
| Household Size | Owner-occupied | Renter-occupied |
| 1-Person Household | 82 (64.1%) | 46 (35.9%) |
| 2-Person Household | 294 (100.0%) | 0 (0.0%) |
| 3-Person Household | 17 (100.0%) | 0 (0.0%) |
| 4+ Person Household | 50 (87.7%) | 7 (12.3%) |
| Total Housing Units | 443 (89.3%) | 53 (10.7%) |
Occupancy by Educational Attainment in Golden Valley
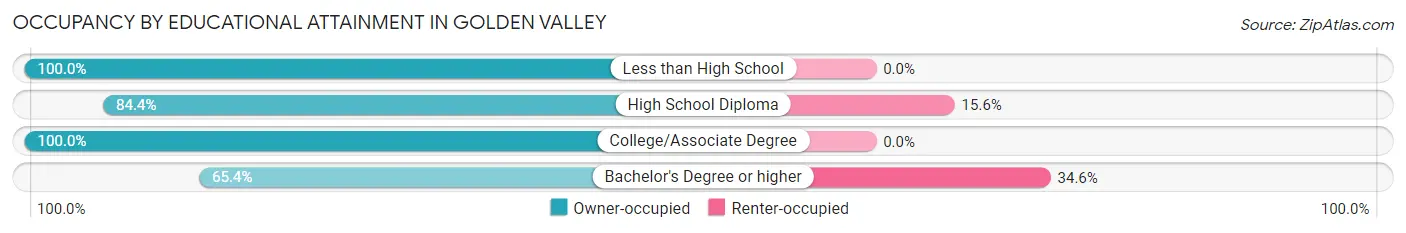
| Household Size | Owner-occupied | Renter-occupied |
| Less than High School | 15 (100.0%) | 0 (0.0%) |
| High School Diploma | 38 (84.4%) | 7 (15.6%) |
| College/Associate Degree | 303 (100.0%) | 0 (0.0%) |
| Bachelor's Degree or higher | 87 (65.4%) | 46 (34.6%) |
Occupancy by Age of Householder in Golden Valley
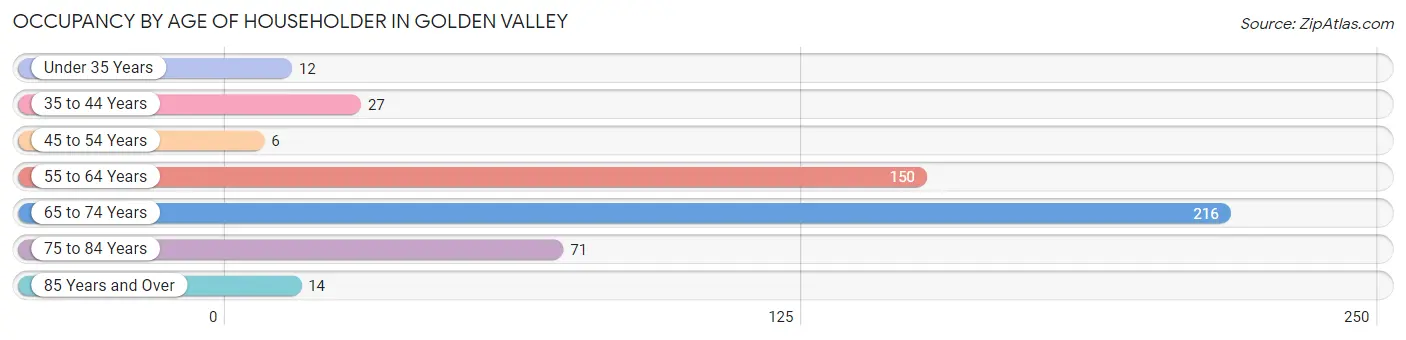
| Age Bracket | # Households | % Households |
| Under 35 Years | 12 | 2.4% |
| 35 to 44 Years | 27 | 5.4% |
| 45 to 54 Years | 6 | 1.2% |
| 55 to 64 Years | 150 | 30.2% |
| 65 to 74 Years | 216 | 43.5% |
| 75 to 84 Years | 71 | 14.3% |
| 85 Years and Over | 14 | 2.8% |
| Total | 496 | 100.0% |
Housing Finances in Golden Valley
Median Income by Occupancy in Golden Valley
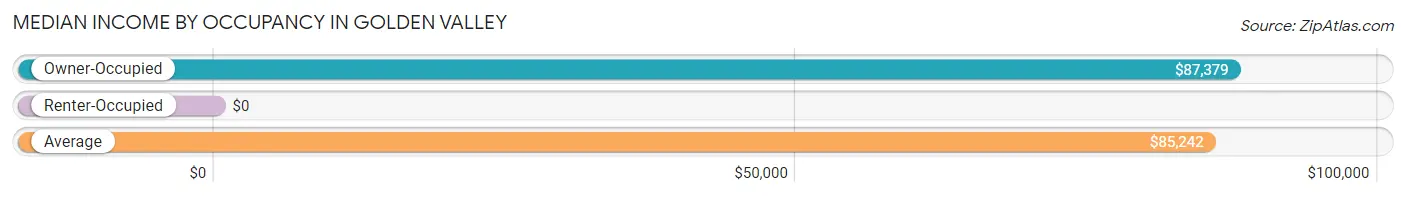
| Occupancy Type | # Households | Median Income |
| Owner-Occupied | 443 (89.3%) | $87,379 |
| Renter-Occupied | 53 (10.7%) | $0 |
| Average | 496 (100.0%) | $85,242 |
Occupancy by Householder Income Bracket in Golden Valley
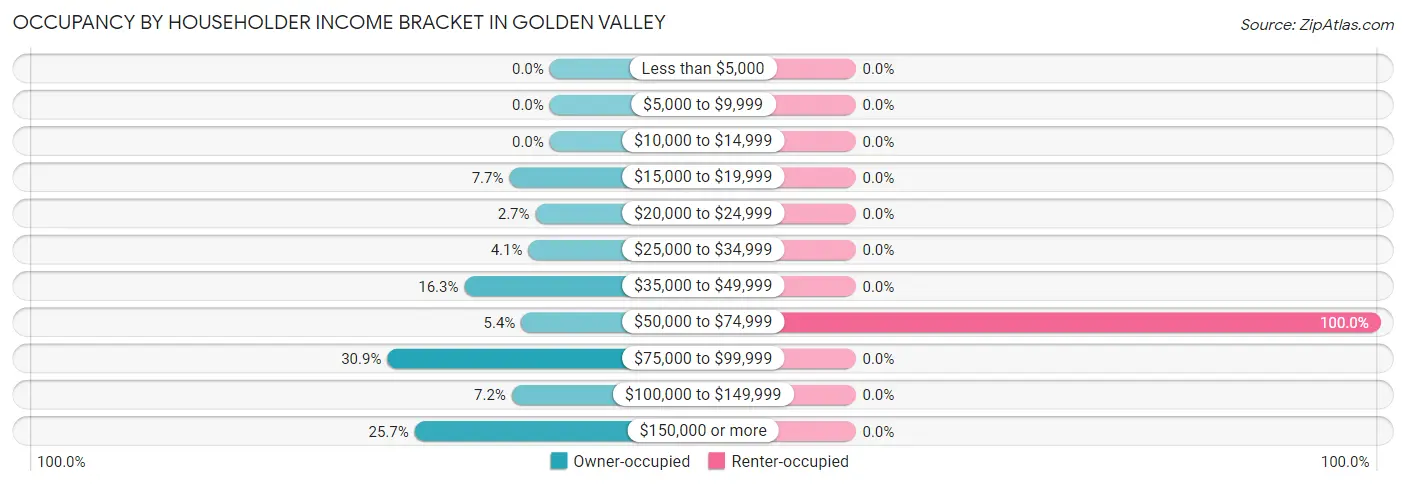
| Income Bracket | Owner-occupied | Renter-occupied |
| Less than $5,000 | 0 (0.0%) | 0 (0.0%) |
| $5,000 to $9,999 | 0 (0.0%) | 0 (0.0%) |
| $10,000 to $14,999 | 0 (0.0%) | 0 (0.0%) |
| $15,000 to $19,999 | 34 (7.7%) | 0 (0.0%) |
| $20,000 to $24,999 | 12 (2.7%) | 0 (0.0%) |
| $25,000 to $34,999 | 18 (4.1%) | 0 (0.0%) |
| $35,000 to $49,999 | 72 (16.3%) | 0 (0.0%) |
| $50,000 to $74,999 | 24 (5.4%) | 53 (100.0%) |
| $75,000 to $99,999 | 137 (30.9%) | 0 (0.0%) |
| $100,000 to $149,999 | 32 (7.2%) | 0 (0.0%) |
| $150,000 or more | 114 (25.7%) | 0 (0.0%) |
| Total | 443 (100.0%) | 53 (100.0%) |
Monthly Housing Cost Tiers in Golden Valley
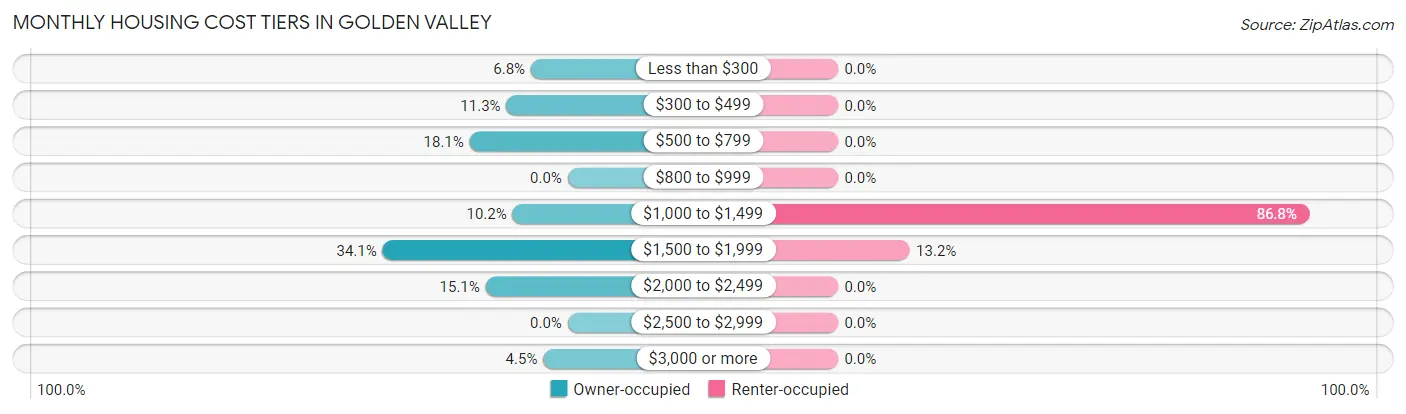
| Monthly Cost | Owner-occupied | Renter-occupied |
| Less than $300 | 30 (6.8%) | 0 (0.0%) |
| $300 to $499 | 50 (11.3%) | 0 (0.0%) |
| $500 to $799 | 80 (18.1%) | 0 (0.0%) |
| $800 to $999 | 0 (0.0%) | 0 (0.0%) |
| $1,000 to $1,499 | 45 (10.2%) | 46 (86.8%) |
| $1,500 to $1,999 | 151 (34.1%) | 7 (13.2%) |
| $2,000 to $2,499 | 67 (15.1%) | 0 (0.0%) |
| $2,500 to $2,999 | 0 (0.0%) | 0 (0.0%) |
| $3,000 or more | 20 (4.5%) | 0 (0.0%) |
| Total | 443 (100.0%) | 53 (100.0%) |
Physical Housing Characteristics in Golden Valley
Housing Structures in Golden Valley
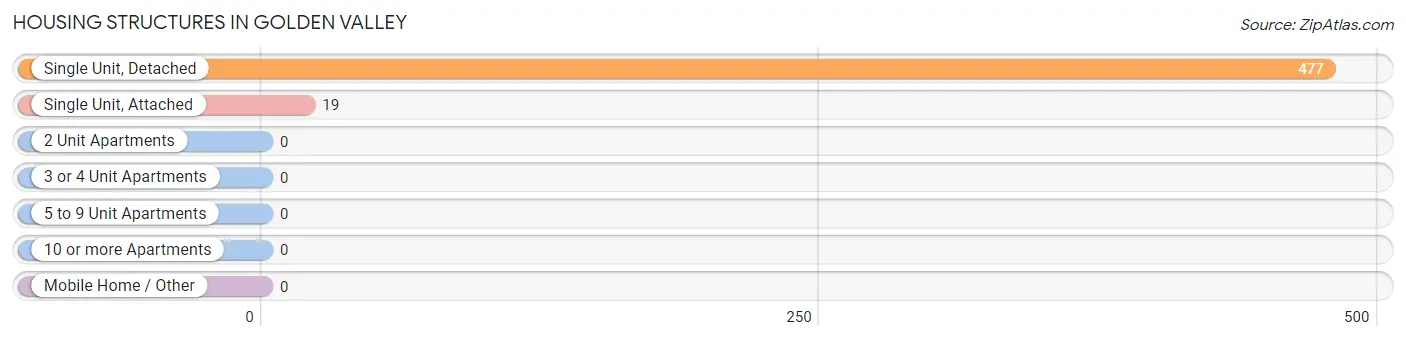
| Structure Type | # Housing Units | % Housing Units |
| Single Unit, Detached | 477 | 96.2% |
| Single Unit, Attached | 19 | 3.8% |
| 2 Unit Apartments | 0 | 0.0% |
| 3 or 4 Unit Apartments | 0 | 0.0% |
| 5 to 9 Unit Apartments | 0 | 0.0% |
| 10 or more Apartments | 0 | 0.0% |
| Mobile Home / Other | 0 | 0.0% |
| Total | 496 | 100.0% |
Housing Structures by Occupancy in Golden Valley
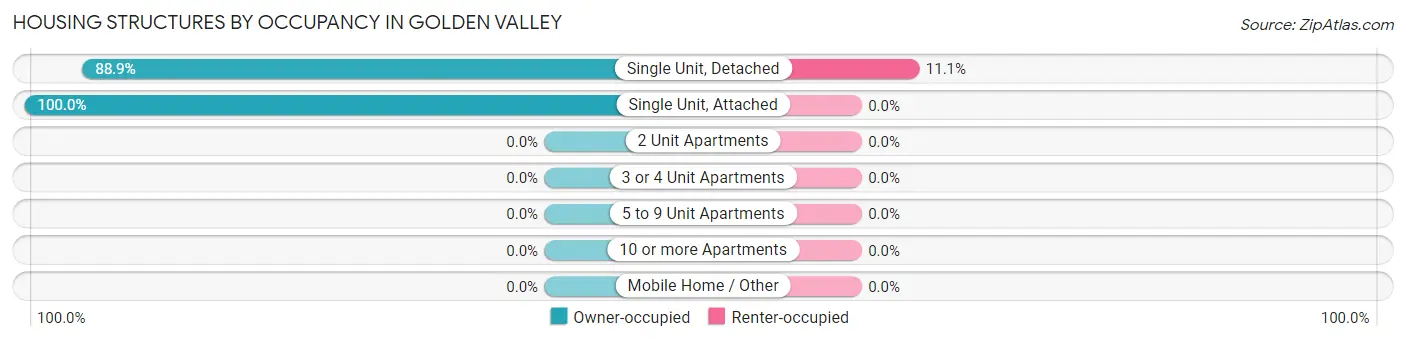
| Structure Type | Owner-occupied | Renter-occupied |
| Single Unit, Detached | 424 (88.9%) | 53 (11.1%) |
| Single Unit, Attached | 19 (100.0%) | 0 (0.0%) |
| 2 Unit Apartments | 0 (0.0%) | 0 (0.0%) |
| 3 or 4 Unit Apartments | 0 (0.0%) | 0 (0.0%) |
| 5 to 9 Unit Apartments | 0 (0.0%) | 0 (0.0%) |
| 10 or more Apartments | 0 (0.0%) | 0 (0.0%) |
| Mobile Home / Other | 0 (0.0%) | 0 (0.0%) |
| Total | 443 (89.3%) | 53 (10.7%) |
Housing Structures by Number of Rooms in Golden Valley
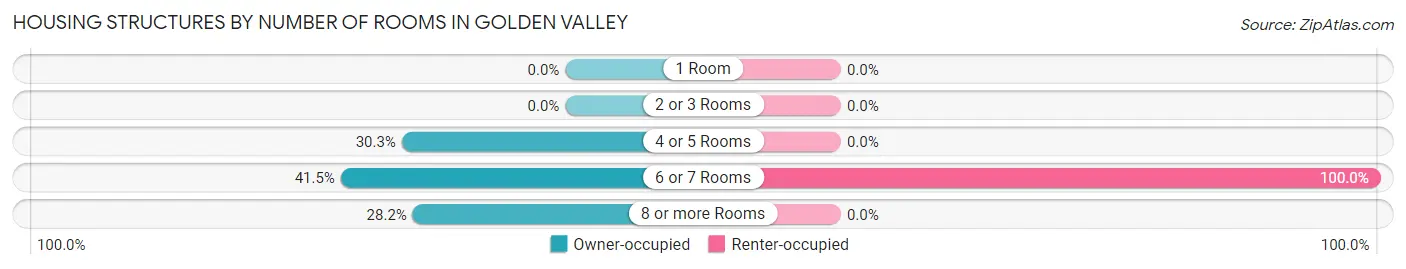
| Number of Rooms | Owner-occupied | Renter-occupied |
| 1 Room | 0 (0.0%) | 0 (0.0%) |
| 2 or 3 Rooms | 0 (0.0%) | 0 (0.0%) |
| 4 or 5 Rooms | 134 (30.2%) | 0 (0.0%) |
| 6 or 7 Rooms | 184 (41.5%) | 53 (100.0%) |
| 8 or more Rooms | 125 (28.2%) | 0 (0.0%) |
| Total | 443 (100.0%) | 53 (100.0%) |
Housing Structure by Heating Type in Golden Valley
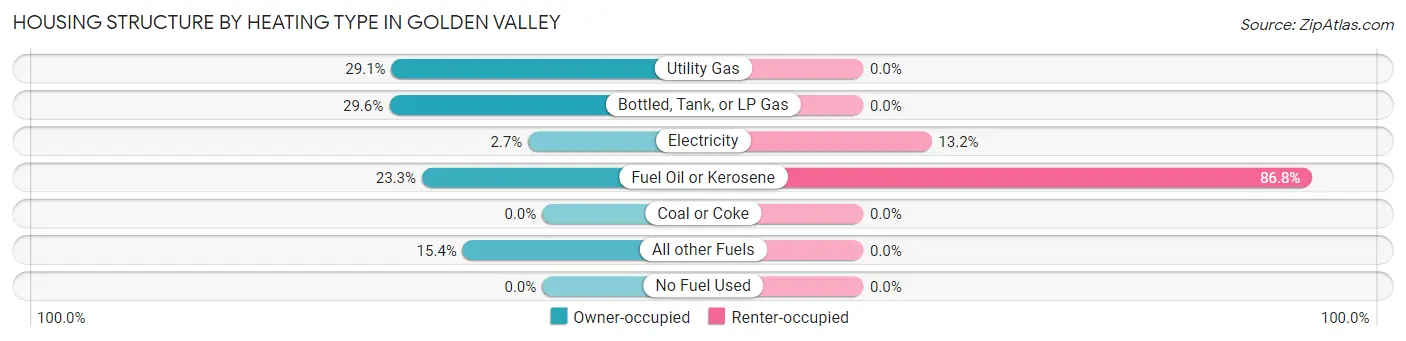
| Heating Type | Owner-occupied | Renter-occupied |
| Utility Gas | 129 (29.1%) | 0 (0.0%) |
| Bottled, Tank, or LP Gas | 131 (29.6%) | 0 (0.0%) |
| Electricity | 12 (2.7%) | 7 (13.2%) |
| Fuel Oil or Kerosene | 103 (23.3%) | 46 (86.8%) |
| Coal or Coke | 0 (0.0%) | 0 (0.0%) |
| All other Fuels | 68 (15.3%) | 0 (0.0%) |
| No Fuel Used | 0 (0.0%) | 0 (0.0%) |
| Total | 443 (100.0%) | 53 (100.0%) |
Household Vehicle Usage in Golden Valley
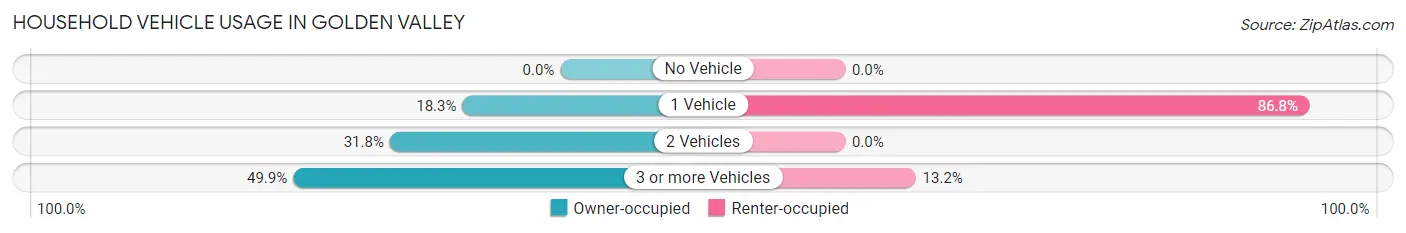
| Vehicles per Household | Owner-occupied | Renter-occupied |
| No Vehicle | 0 (0.0%) | 0 (0.0%) |
| 1 Vehicle | 81 (18.3%) | 46 (86.8%) |
| 2 Vehicles | 141 (31.8%) | 0 (0.0%) |
| 3 or more Vehicles | 221 (49.9%) | 7 (13.2%) |
| Total | 443 (100.0%) | 53 (100.0%) |
Real Estate & Mortgages in Golden Valley
Real Estate and Mortgage Overview in Golden Valley
| Characteristic | Without Mortgage | With Mortgage |
| Housing Units | 147 | 296 |
| Median Property Value | $425,000 | $503,300 |
| Median Household Income | $75,750 | $103 |
| Monthly Housing Costs | $482 | $20 |
| Real Estate Taxes | $1,884 | $0 |
Property Value by Mortgage Status in Golden Valley
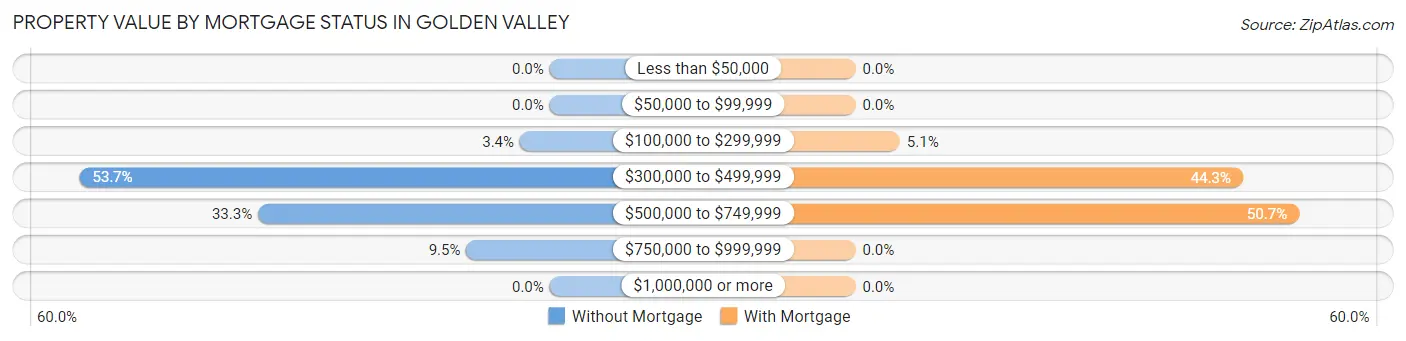
| Property Value | Without Mortgage | With Mortgage |
| Less than $50,000 | 0 (0.0%) | 0 (0.0%) |
| $50,000 to $99,999 | 0 (0.0%) | 0 (0.0%) |
| $100,000 to $299,999 | 5 (3.4%) | 15 (5.1%) |
| $300,000 to $499,999 | 79 (53.7%) | 131 (44.3%) |
| $500,000 to $749,999 | 49 (33.3%) | 150 (50.7%) |
| $750,000 to $999,999 | 14 (9.5%) | 0 (0.0%) |
| $1,000,000 or more | 0 (0.0%) | 0 (0.0%) |
| Total | 147 (100.0%) | 296 (100.0%) |
Household Income by Mortgage Status in Golden Valley
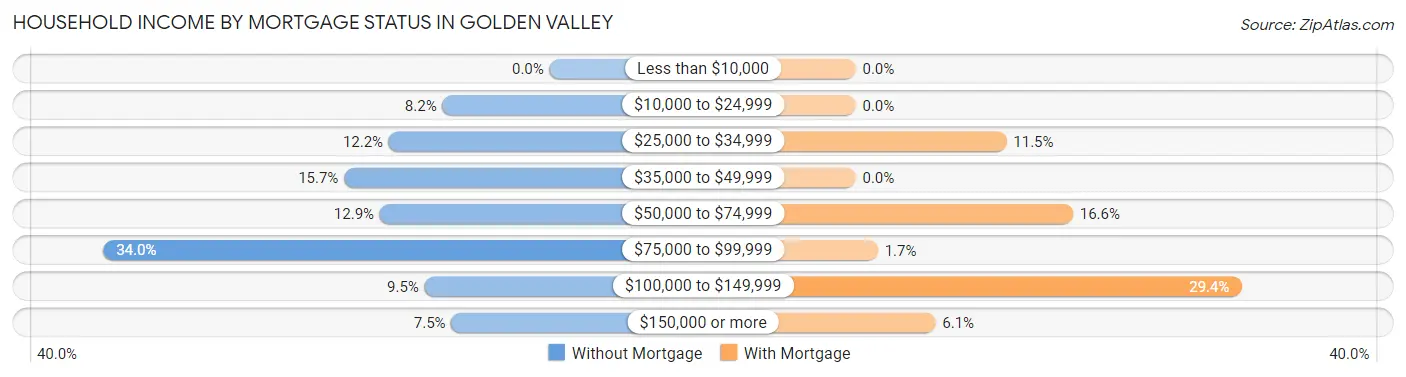
| Household Income | Without Mortgage | With Mortgage |
| Less than $10,000 | 0 (0.0%) | 0 (0.0%) |
| $10,000 to $24,999 | 12 (8.2%) | 0 (0.0%) |
| $25,000 to $34,999 | 18 (12.2%) | 34 (11.5%) |
| $35,000 to $49,999 | 23 (15.7%) | 0 (0.0%) |
| $50,000 to $74,999 | 19 (12.9%) | 49 (16.6%) |
| $75,000 to $99,999 | 50 (34.0%) | 5 (1.7%) |
| $100,000 to $149,999 | 14 (9.5%) | 87 (29.4%) |
| $150,000 or more | 11 (7.5%) | 18 (6.1%) |
| Total | 147 (100.0%) | 296 (100.0%) |
Property Value to Household Income Ratio in Golden Valley
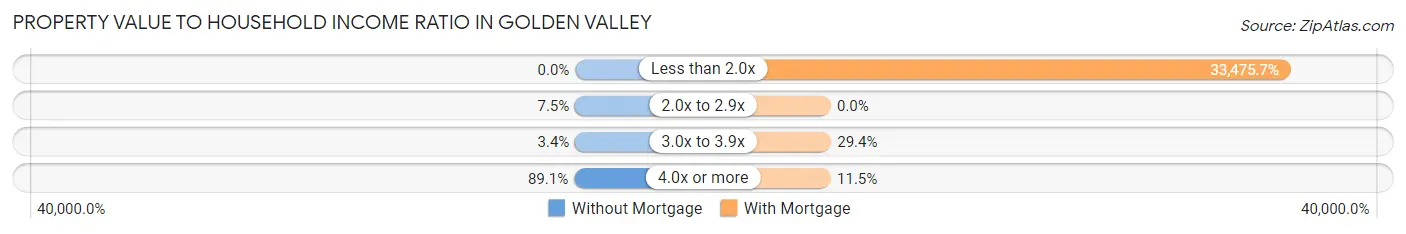
| Value-to-Income Ratio | Without Mortgage | With Mortgage |
| Less than 2.0x | 0 (0.0%) | 99,088 (33,475.7%) |
| 2.0x to 2.9x | 11 (7.5%) | 0 (0.0%) |
| 3.0x to 3.9x | 5 (3.4%) | 87 (29.4%) |
| 4.0x or more | 131 (89.1%) | 34 (11.5%) |
| Total | 147 (100.0%) | 296 (100.0%) |
Real Estate Taxes by Mortgage Status in Golden Valley
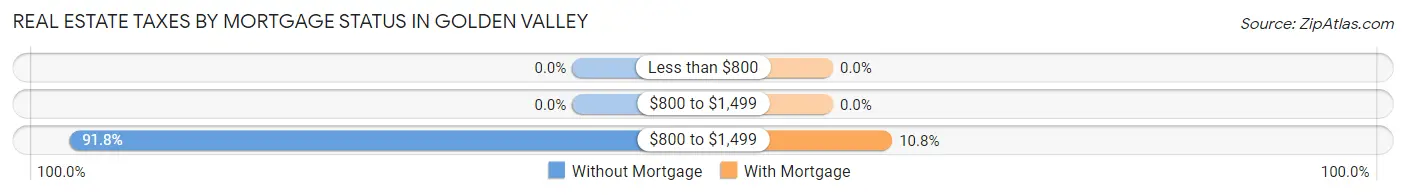
| Property Taxes | Without Mortgage | With Mortgage |
| Less than $800 | 0 (0.0%) | 0 (0.0%) |
| $800 to $1,499 | 0 (0.0%) | 0 (0.0%) |
| $800 to $1,499 | 135 (91.8%) | 32 (10.8%) |
| Total | 147 (100.0%) | 296 (100.0%) |
Health & Disability in Golden Valley
Health Insurance Coverage by Age in Golden Valley
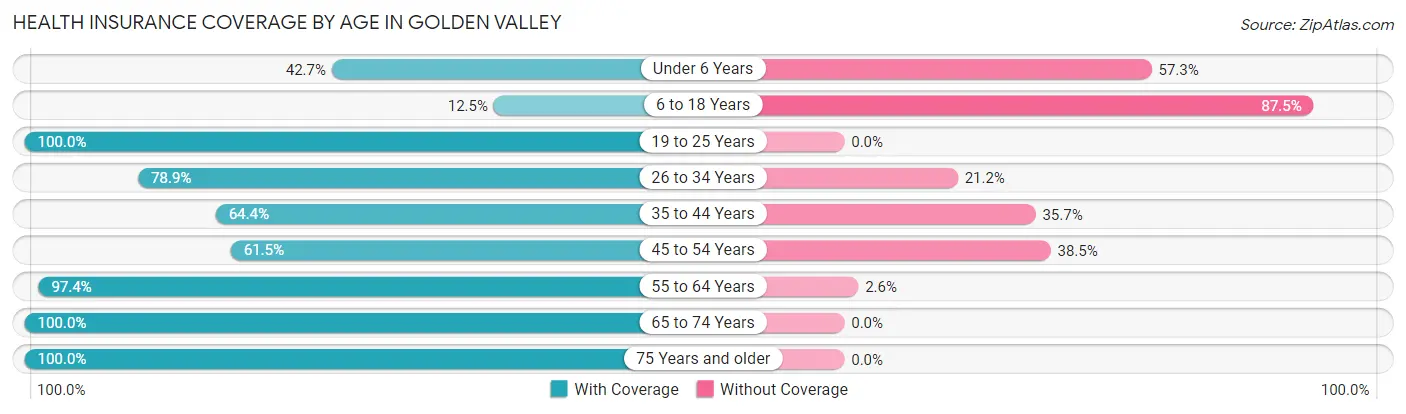
| Age Bracket | With Coverage | Without Coverage |
| Under 6 Years | 41 (42.7%) | 55 (57.3%) |
| 6 to 18 Years | 7 (12.5%) | 49 (87.5%) |
| 19 to 25 Years | 24 (100.0%) | 0 (0.0%) |
| 26 to 34 Years | 41 (78.8%) | 11 (21.1%) |
| 35 to 44 Years | 74 (64.3%) | 41 (35.6%) |
| 45 to 54 Years | 8 (61.5%) | 5 (38.5%) |
| 55 to 64 Years | 263 (97.4%) | 7 (2.6%) |
| 65 to 74 Years | 393 (100.0%) | 0 (0.0%) |
| 75 Years and older | 165 (100.0%) | 0 (0.0%) |
| Total | 1,016 (85.8%) | 168 (14.2%) |
Health Insurance Coverage by Citizenship Status in Golden Valley
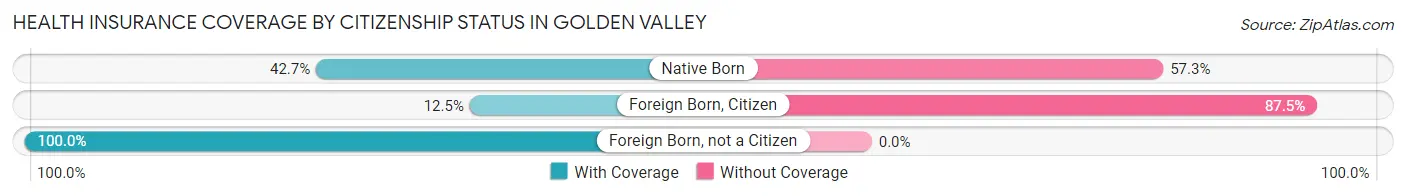
| Citizenship Status | With Coverage | Without Coverage |
| Native Born | 41 (42.7%) | 55 (57.3%) |
| Foreign Born, Citizen | 7 (12.5%) | 49 (87.5%) |
| Foreign Born, not a Citizen | 24 (100.0%) | 0 (0.0%) |
Health Insurance Coverage by Household Income in Golden Valley
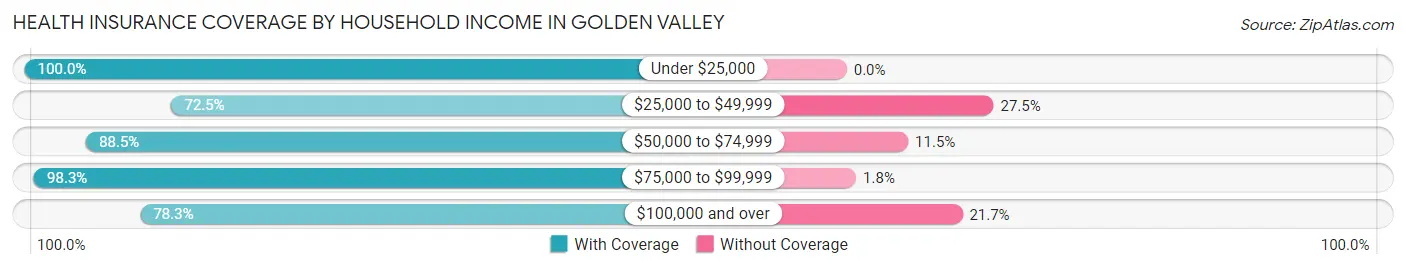
| Household Income | With Coverage | Without Coverage |
| Under $25,000 | 106 (100.0%) | 0 (0.0%) |
| $25,000 to $49,999 | 145 (72.5%) | 55 (27.5%) |
| $50,000 to $74,999 | 177 (88.5%) | 23 (11.5%) |
| $75,000 to $99,999 | 280 (98.3%) | 5 (1.8%) |
| $100,000 and over | 300 (78.3%) | 83 (21.7%) |
Public vs Private Health Insurance Coverage by Age in Golden Valley
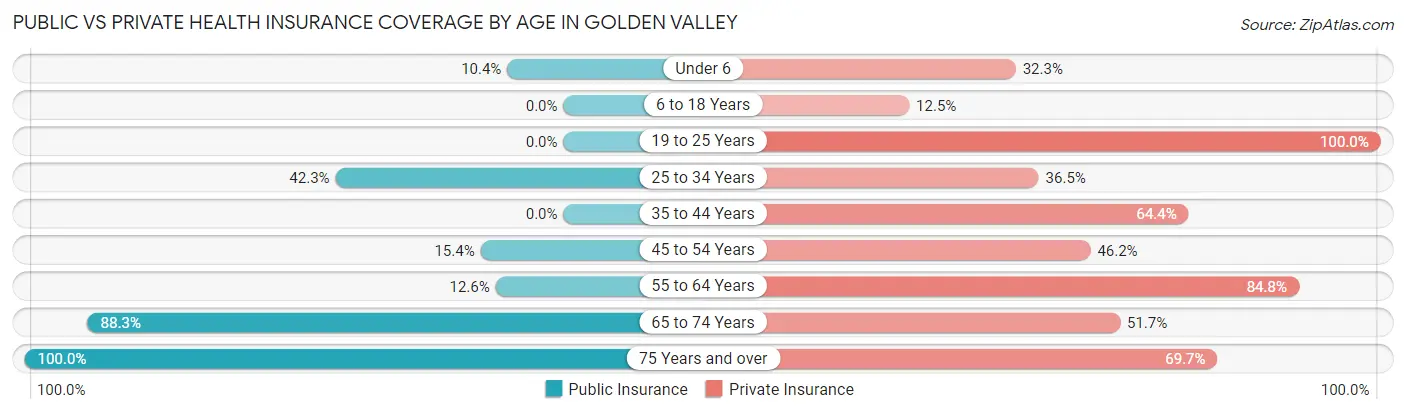
| Age Bracket | Public Insurance | Private Insurance |
| Under 6 | 10 (10.4%) | 31 (32.3%) |
| 6 to 18 Years | 0 (0.0%) | 7 (12.5%) |
| 19 to 25 Years | 0 (0.0%) | 24 (100.0%) |
| 25 to 34 Years | 22 (42.3%) | 19 (36.5%) |
| 35 to 44 Years | 0 (0.0%) | 74 (64.3%) |
| 45 to 54 Years | 2 (15.4%) | 6 (46.2%) |
| 55 to 64 Years | 34 (12.6%) | 229 (84.8%) |
| 65 to 74 Years | 347 (88.3%) | 203 (51.6%) |
| 75 Years and over | 165 (100.0%) | 115 (69.7%) |
| Total | 580 (49.0%) | 708 (59.8%) |
Disability Status by Sex by Age in Golden Valley
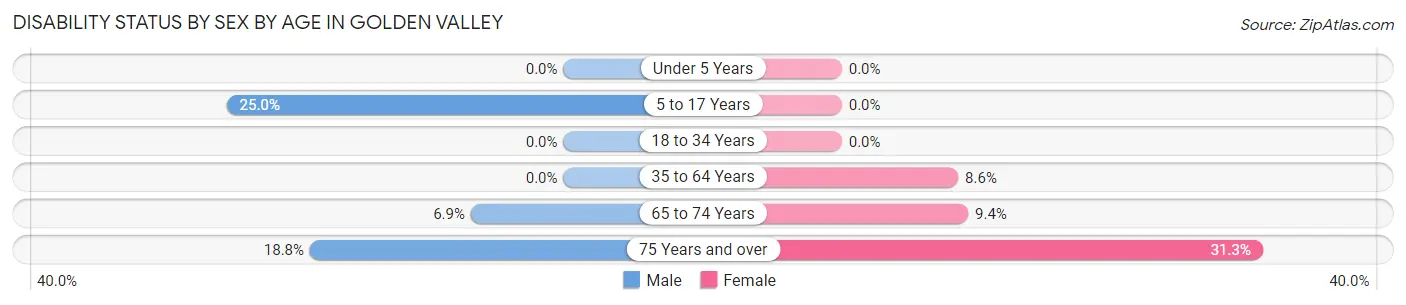
| Age Bracket | Male | Female |
| Under 5 Years | 0 (0.0%) | 0 (0.0%) |
| 5 to 17 Years | 7 (25.0%) | 0 (0.0%) |
| 18 to 34 Years | 0 (0.0%) | 0 (0.0%) |
| 35 to 64 Years | 0 (0.0%) | 21 (8.6%) |
| 65 to 74 Years | 16 (6.9%) | 15 (9.4%) |
| 75 Years and over | 16 (18.8%) | 25 (31.2%) |
Disability Class by Sex by Age in Golden Valley
Disability Class: Hearing Difficulty
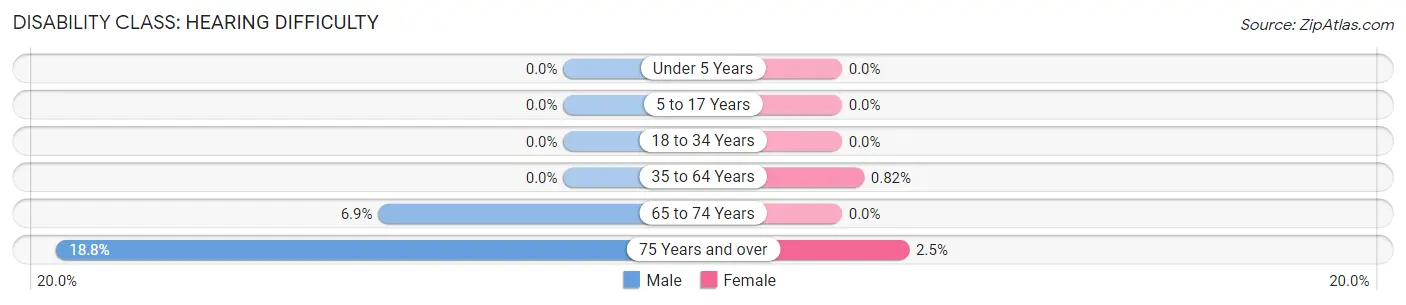
| Age Bracket | Male | Female |
| Under 5 Years | 0 (0.0%) | 0 (0.0%) |
| 5 to 17 Years | 0 (0.0%) | 0 (0.0%) |
| 18 to 34 Years | 0 (0.0%) | 0 (0.0%) |
| 35 to 64 Years | 0 (0.0%) | 2 (0.8%) |
| 65 to 74 Years | 16 (6.9%) | 0 (0.0%) |
| 75 Years and over | 16 (18.8%) | 2 (2.5%) |
Disability Class: Vision Difficulty
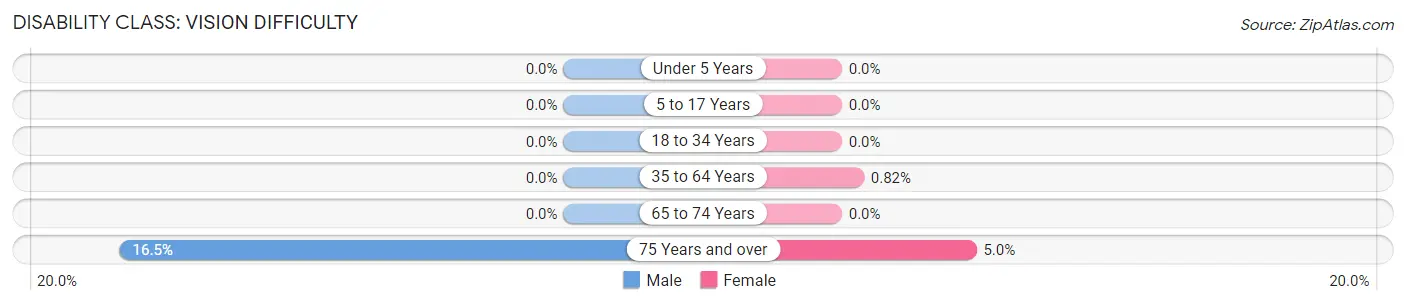
| Age Bracket | Male | Female |
| Under 5 Years | 0 (0.0%) | 0 (0.0%) |
| 5 to 17 Years | 0 (0.0%) | 0 (0.0%) |
| 18 to 34 Years | 0 (0.0%) | 0 (0.0%) |
| 35 to 64 Years | 0 (0.0%) | 2 (0.8%) |
| 65 to 74 Years | 0 (0.0%) | 0 (0.0%) |
| 75 Years and over | 14 (16.5%) | 4 (5.0%) |
Disability Class: Cognitive Difficulty
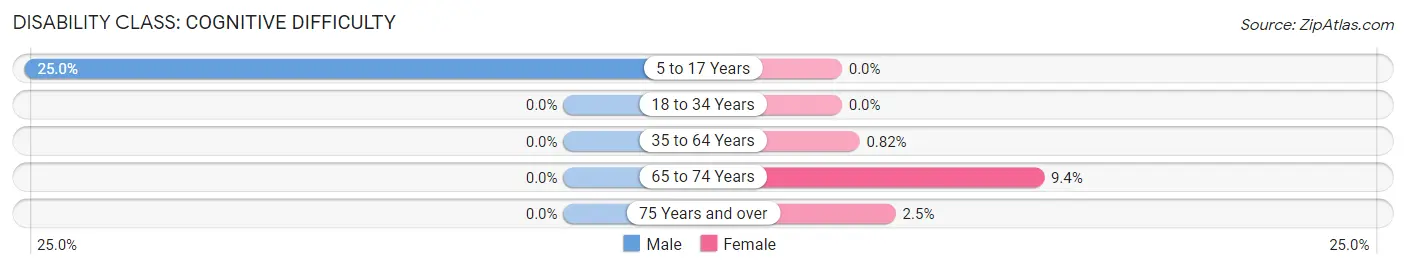
| Age Bracket | Male | Female |
| 5 to 17 Years | 7 (25.0%) | 0 (0.0%) |
| 18 to 34 Years | 0 (0.0%) | 0 (0.0%) |
| 35 to 64 Years | 0 (0.0%) | 2 (0.8%) |
| 65 to 74 Years | 0 (0.0%) | 15 (9.4%) |
| 75 Years and over | 0 (0.0%) | 2 (2.5%) |
Disability Class: Ambulatory Difficulty
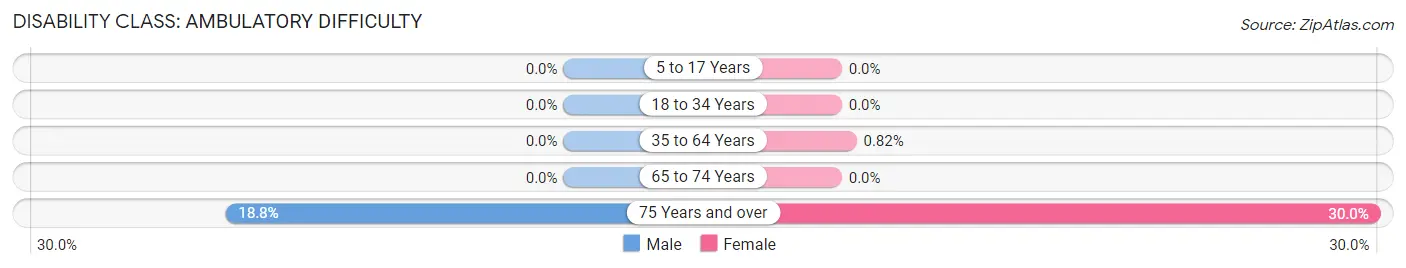
| Age Bracket | Male | Female |
| 5 to 17 Years | 0 (0.0%) | 0 (0.0%) |
| 18 to 34 Years | 0 (0.0%) | 0 (0.0%) |
| 35 to 64 Years | 0 (0.0%) | 2 (0.8%) |
| 65 to 74 Years | 0 (0.0%) | 0 (0.0%) |
| 75 Years and over | 16 (18.8%) | 24 (30.0%) |
Disability Class: Self-Care Difficulty
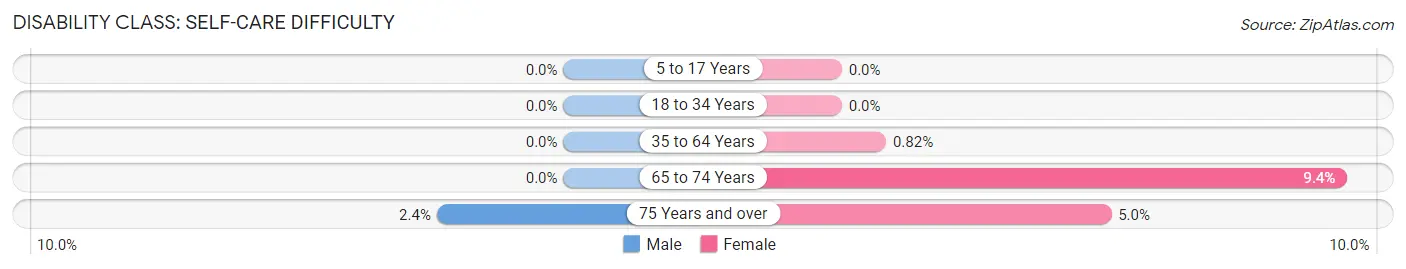
| Age Bracket | Male | Female |
| 5 to 17 Years | 0 (0.0%) | 0 (0.0%) |
| 18 to 34 Years | 0 (0.0%) | 0 (0.0%) |
| 35 to 64 Years | 0 (0.0%) | 2 (0.8%) |
| 65 to 74 Years | 0 (0.0%) | 15 (9.4%) |
| 75 Years and over | 2 (2.4%) | 4 (5.0%) |
Technology Access in Golden Valley
Computing Device Access in Golden Valley
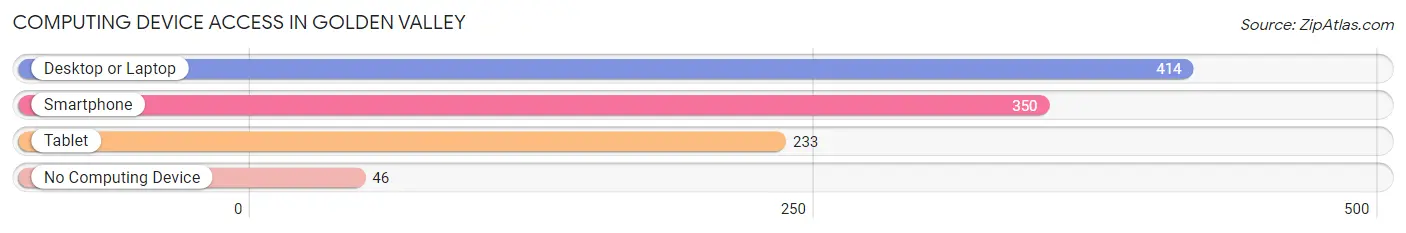
| Device Type | # Households | % Households |
| Desktop or Laptop | 414 | 83.5% |
| Smartphone | 350 | 70.6% |
| Tablet | 233 | 47.0% |
| No Computing Device | 46 | 9.3% |
| Total | 496 | 100.0% |
Internet Access in Golden Valley
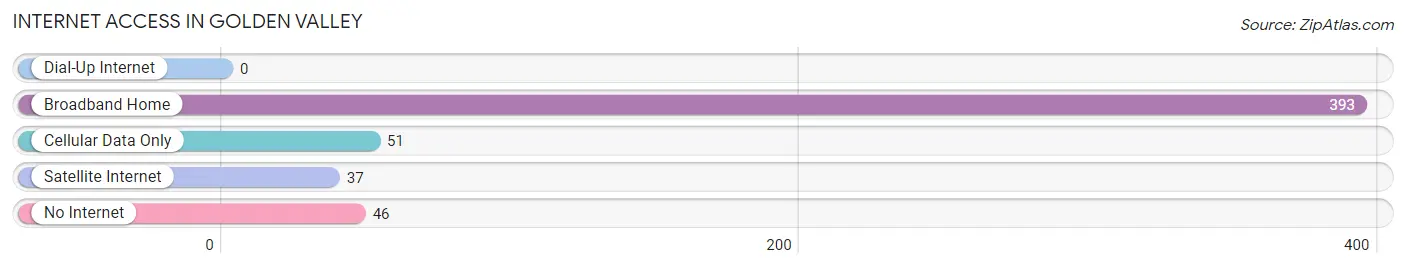
| Internet Type | # Households | % Households |
| Dial-Up Internet | 0 | 0.0% |
| Broadband Home | 393 | 79.2% |
| Cellular Data Only | 51 | 10.3% |
| Satellite Internet | 37 | 7.5% |
| No Internet | 46 | 9.3% |
| Total | 496 | 100.0% |
Golden Valley Summary
Geography
Golden Valley is a small unincorporated town located in the northern part of Nevada, in Humboldt County. It is situated in the Humboldt Valley, which is a large, flat valley surrounded by mountains. The town is located at the intersection of U.S. Route 95 and Nevada State Route 318, and is about 30 miles north of Winnemucca. The town is located at an elevation of 4,400 feet, and the surrounding area is mostly desert.
History
Golden Valley was founded in 1868 by a group of miners who were searching for gold in the area. The town was originally called “Golden Gate”, but the name was changed to Golden Valley in 1871. The town quickly grew, and by the 1880s it had become a bustling mining town with a population of over 1,000 people.
The town was home to several saloons, hotels, and stores, and was a popular stop for travelers on their way to California. The town also had a post office, a school, and a newspaper.
In the early 1900s, the town began to decline as the gold rush ended and the population began to dwindle. By the 1950s, the population had dropped to just over 200 people.
Economy
Today, Golden Valley’s economy is largely based on agriculture and tourism. The town is home to several farms and ranches, and is a popular destination for hunters and fishermen. The town also has a few small businesses, including a gas station, a restaurant, and a motel.
Demographics
As of the 2010 census, the population of Golden Valley was 545 people. The racial makeup of the town was 94.3% White, 0.7% Native American, 0.2% Asian, 0.2% Pacific Islander, 0.2% from other races, and 4.6% from two or more races. The median household income was $37,500, and the median family income was $41,250.
Conclusion
Golden Valley is a small, unincorporated town located in the northern part of Nevada. It was founded in 1868 by miners searching for gold, and quickly grew into a bustling mining town. Today, the town’s economy is largely based on agriculture and tourism, and the population is just over 500 people. Golden Valley is a popular destination for hunters and fishermen, and is a great place to visit for those looking for a quiet, rural getaway.
Common Questions
What is Per Capita Income in Golden Valley?
Per Capita income in Golden Valley is $39,368.
What is the Median Family Income in Golden Valley?
Median Family Income in Golden Valley is $98,051.
What is the Median Household income in Golden Valley?
Median Household Income in Golden Valley is $85,242.
What is Income or Wage Gap in Golden Valley?
Income or Wage Gap in Golden Valley is 17.6%.
Women in Golden Valley earn 82.4 cents for every dollar earned by a man.
What is Inequality or Gini Index in Golden Valley?
Inequality or Gini Index in Golden Valley is 0.34.
What is the Total Population of Golden Valley?
Total Population of Golden Valley is 1,184.
What is the Total Male Population of Golden Valley?
Total Male Population of Golden Valley is 562.
What is the Total Female Population of Golden Valley?
Total Female Population of Golden Valley is 622.
What is the Ratio of Males per 100 Females in Golden Valley?
There are 90.35 Males per 100 Females in Golden Valley.
What is the Ratio of Females per 100 Males in Golden Valley?
There are 110.68 Females per 100 Males in Golden Valley.
What is the Median Population Age in Golden Valley?
Median Population Age in Golden Valley is 63.9 Years.
What is the Average Family Size in Golden Valley
Average Family Size in Golden Valley is 2.7 People.
What is the Average Household Size in Golden Valley
Average Household Size in Golden Valley is 2.4 People.
How Large is the Labor Force in Golden Valley?
There are 455 People in the Labor Forcein in Golden Valley.
What is the Percentage of People in the Labor Force in Golden Valley?
43.8% of People are in the Labor Force in Golden Valley.
What is the Unemployment Rate in Golden Valley?
Unemployment Rate in Golden Valley is 2.2%.