Mogul, NV Map & Demographics
Mogul Map
Mogul Overview
$46,794
PER CAPITA INCOME
$143,103
AVG FAMILY INCOME
$131,838
AVG HOUSEHOLD INCOME
0.32
INEQUALITY / GINI INDEX
1,315
TOTAL POPULATION
716
MALE POPULATION
599
FEMALE POPULATION
119.53
MALES / 100 FEMALES
83.66
FEMALES / 100 MALES
48.7
MEDIAN AGE
2.7
AVG FAMILY SIZE
2.5
AVG HOUSEHOLD SIZE
567
LABOR FORCE [ PEOPLE ]
54.9%
PERCENT IN LABOR FORCE
2.5%
UNEMPLOYMENT RATE
Income in Mogul
Income Overview in Mogul
Per Capita Income in Mogul is $46,794, while median incomes of families and households are $143,103 and $131,838 respectively.
| Characteristic | Number | Measure |
| Per Capita Income | 1,315 | $46,794 |
| Median Family Income | 426 | $143,103 |
| Mean Family Income | 426 | $136,445 |
| Median Household Income | 515 | $131,838 |
| Mean Household Income | 515 | $124,392 |
| Income Deficit | 426 | $0 |
| Wage / Income Gap (%) | 1,315 | 0.00% |
| Wage / Income Gap ($) | 1,315 | 100.00¢ per $1 |
| Gini / Inequality Index | 1,315 | 0.32 |
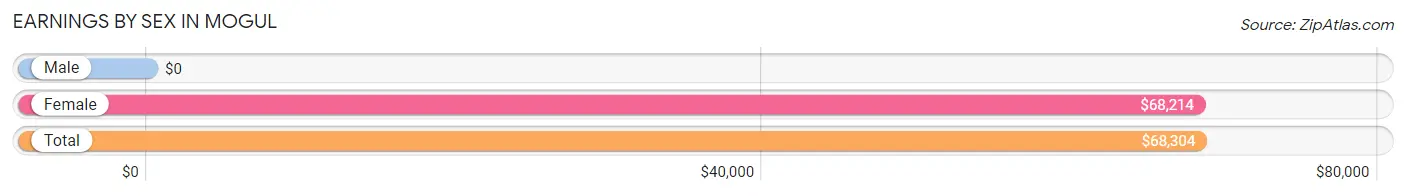
Earnings by Sex in Mogul
| Sex | Number | Average Earnings |
| Male | 297 (49.7%) | $0 |
| Female | 300 (50.2%) | $68,214 |
| Total | 597 (100.0%) | $68,304 |
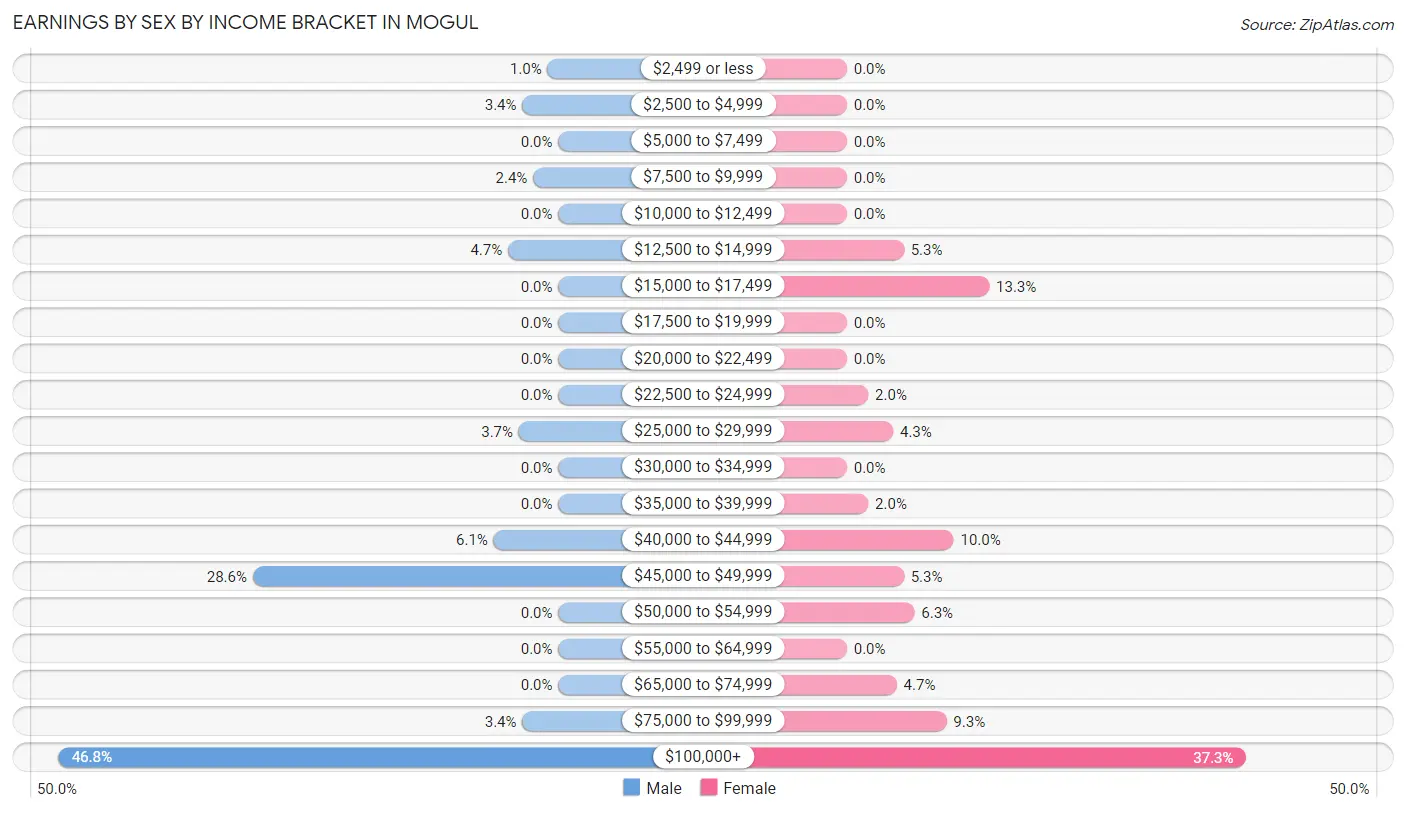
Earnings by Sex by Income Bracket in Mogul
The most common earnings brackets in Mogul are $100,000+ for men (139 | 46.8%) and $100,000+ for women (112 | 37.3%).
| Income | Male | Female |
| $2,499 or less | 3 (1.0%) | 0 (0.0%) |
| $2,500 to $4,999 | 10 (3.4%) | 0 (0.0%) |
| $5,000 to $7,499 | 0 (0.0%) | 0 (0.0%) |
| $7,500 to $9,999 | 7 (2.4%) | 0 (0.0%) |
| $10,000 to $12,499 | 0 (0.0%) | 0 (0.0%) |
| $12,500 to $14,999 | 14 (4.7%) | 16 (5.3%) |
| $15,000 to $17,499 | 0 (0.0%) | 40 (13.3%) |
| $17,500 to $19,999 | 0 (0.0%) | 0 (0.0%) |
| $20,000 to $22,499 | 0 (0.0%) | 0 (0.0%) |
| $22,500 to $24,999 | 0 (0.0%) | 6 (2.0%) |
| $25,000 to $29,999 | 11 (3.7%) | 13 (4.3%) |
| $30,000 to $34,999 | 0 (0.0%) | 0 (0.0%) |
| $35,000 to $39,999 | 0 (0.0%) | 6 (2.0%) |
| $40,000 to $44,999 | 18 (6.1%) | 30 (10.0%) |
| $45,000 to $49,999 | 85 (28.6%) | 16 (5.3%) |
| $50,000 to $54,999 | 0 (0.0%) | 19 (6.3%) |
| $55,000 to $64,999 | 0 (0.0%) | 0 (0.0%) |
| $65,000 to $74,999 | 0 (0.0%) | 14 (4.7%) |
| $75,000 to $99,999 | 10 (3.4%) | 28 (9.3%) |
| $100,000+ | 139 (46.8%) | 112 (37.3%) |
| Total | 297 (100.0%) | 300 (100.0%) |
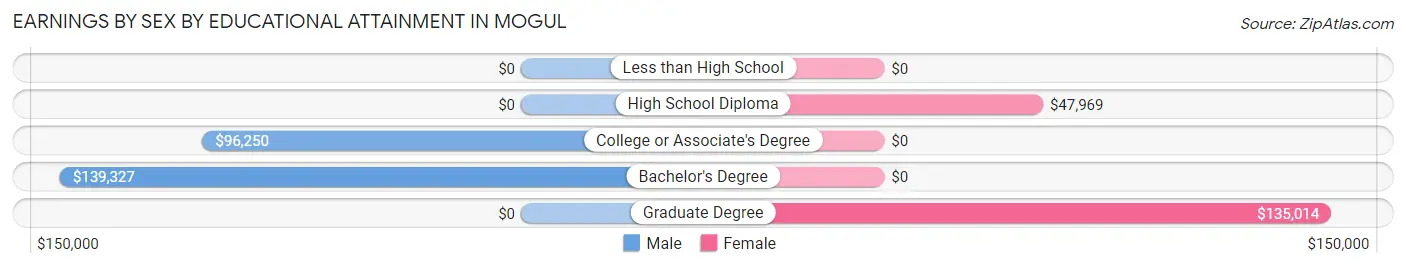
Earnings by Sex by Educational Attainment in Mogul
| Educational Attainment | Male Income | Female Income |
| Less than High School | - | - |
| High School Diploma | - | - |
| College or Associate's Degree | $96,250 | $0 |
| Bachelor's Degree | $139,327 | $0 |
| Graduate Degree | - | - |
| Total | - | - |
Family Income in Mogul
Family Income Brackets in Mogul
According to the Mogul family income data, there are 165 families falling into the $150,000 to $199,999 income range, which is the most common income bracket and makes up 38.7% of all families.
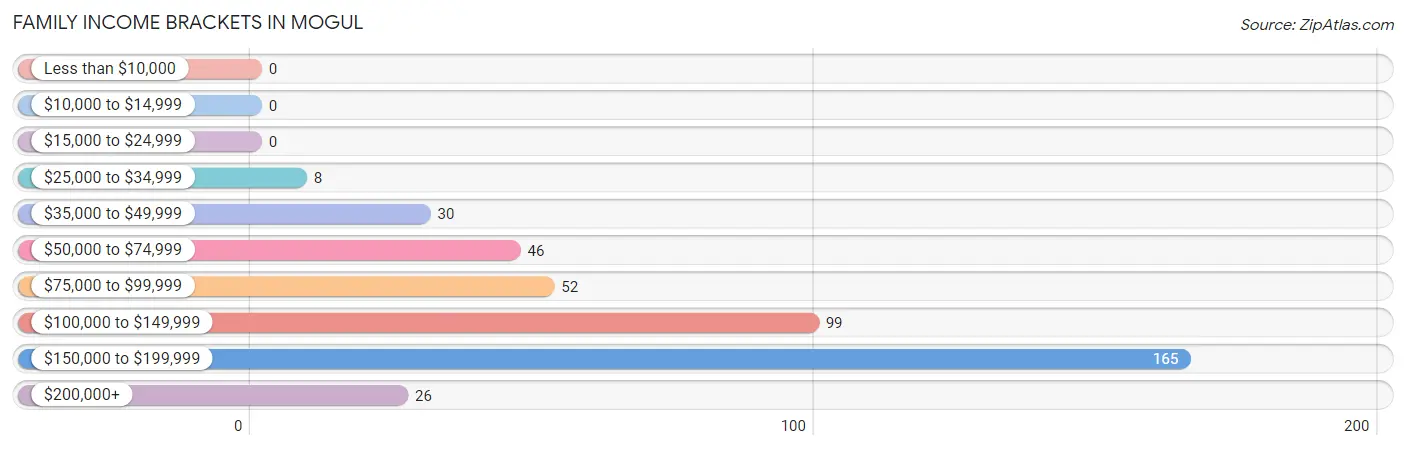
| Income Bracket | # Families | % Families |
| Less than $10,000 | 0 | 0.0% |
| $10,000 to $14,999 | 0 | 0.0% |
| $15,000 to $24,999 | 0 | 0.0% |
| $25,000 to $34,999 | 8 | 1.9% |
| $35,000 to $49,999 | 30 | 7.0% |
| $50,000 to $74,999 | 46 | 10.8% |
| $75,000 to $99,999 | 52 | 12.2% |
| $100,000 to $149,999 | 99 | 23.2% |
| $150,000 to $199,999 | 165 | 38.7% |
| $200,000+ | 26 | 6.1% |
Family Income by Famaliy Size in Mogul
4-person families (138 | 32.4%) account for the highest median family income in Mogul with $180,070 per family, while 2-person families (232 | 54.5%) have the highest median income of $45,893 per family member.
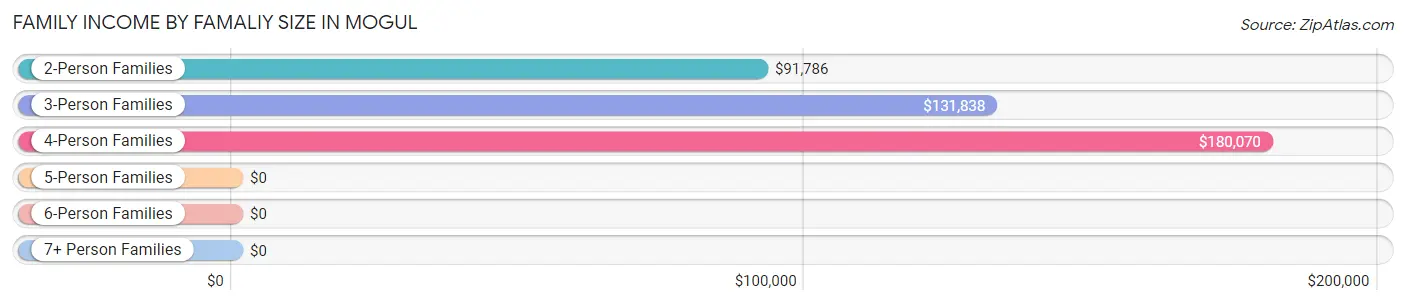
| Income Bracket | # Families | Median Income |
| 2-Person Families | 232 (54.5%) | $91,786 |
| 3-Person Families | 53 (12.4%) | $131,838 |
| 4-Person Families | 138 (32.4%) | $180,070 |
| 5-Person Families | 0 (0.0%) | $0 |
| 6-Person Families | 0 (0.0%) | $0 |
| 7+ Person Families | 3 (0.7%) | $0 |
| Total | 426 (100.0%) | $143,103 |
Family Income by Number of Earners in Mogul
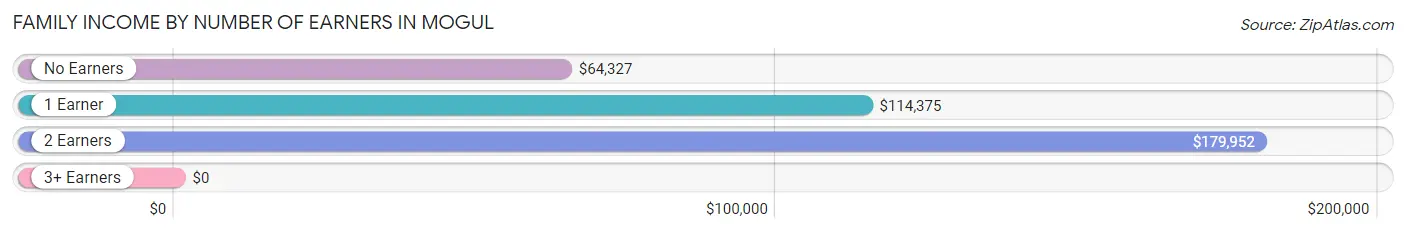
| Number of Earners | # Families | Median Income |
| No Earners | 83 (19.5%) | $64,327 |
| 1 Earner | 101 (23.7%) | $114,375 |
| 2 Earners | 239 (56.1%) | $179,952 |
| 3+ Earners | 3 (0.7%) | $0 |
| Total | 426 (100.0%) | $143,103 |
Household Income in Mogul
Household Income Brackets in Mogul
With 165 households falling in the category, the $150,000 to $199,999 income range is the most frequent in Mogul, accounting for 32.0% of all households.
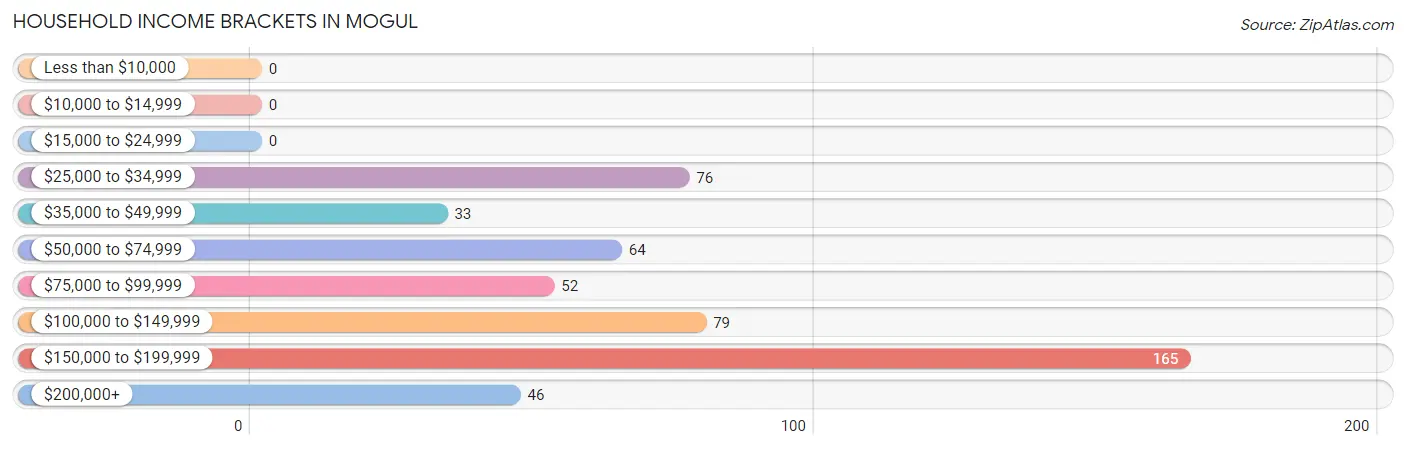
| Income Bracket | # Households | % Households |
| Less than $10,000 | 0 | 0.0% |
| $10,000 to $14,999 | 0 | 0.0% |
| $15,000 to $24,999 | 0 | 0.0% |
| $25,000 to $34,999 | 76 | 14.8% |
| $35,000 to $49,999 | 33 | 6.4% |
| $50,000 to $74,999 | 64 | 12.4% |
| $75,000 to $99,999 | 52 | 10.1% |
| $100,000 to $149,999 | 79 | 15.3% |
| $150,000 to $199,999 | 165 | 32.0% |
| $200,000+ | 46 | 8.9% |
Household Income by Householder Age in Mogul
The median household income in Mogul is $131,838, with the highest median household income of $180,563 found in the 45 to 64 years age bracket for the primary householder. A total of 246 households (47.8%) fall into this category.
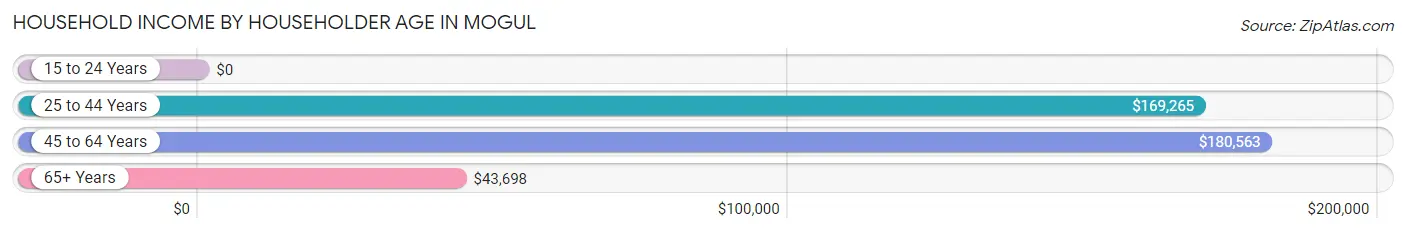
| Income Bracket | # Households | Median Income |
| 15 to 24 Years | 0 (0.0%) | $0 |
| 25 to 44 Years | 94 (18.2%) | $169,265 |
| 45 to 64 Years | 246 (47.8%) | $180,563 |
| 65+ Years | 175 (34.0%) | $43,698 |
| Total | 515 (100.0%) | $131,838 |
Poverty in Mogul
Income Below Poverty by Sex and Age in Mogul
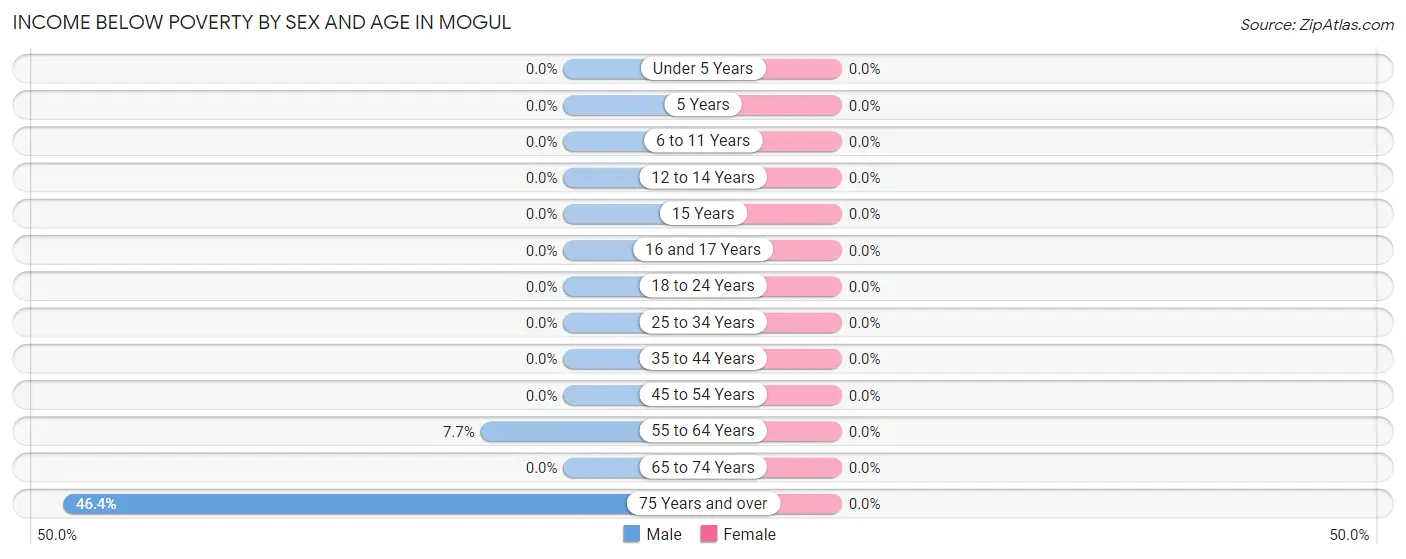
| Age Bracket | Male | Female |
| Under 5 Years | 0 (0.0%) | 0 (0.0%) |
| 5 Years | 0 (0.0%) | 0 (0.0%) |
| 6 to 11 Years | 0 (0.0%) | 0 (0.0%) |
| 12 to 14 Years | 0 (0.0%) | 0 (0.0%) |
| 15 Years | 0 (0.0%) | 0 (0.0%) |
| 16 and 17 Years | 0 (0.0%) | 0 (0.0%) |
| 18 to 24 Years | 0 (0.0%) | 0 (0.0%) |
| 25 to 34 Years | 0 (0.0%) | 0 (0.0%) |
| 35 to 44 Years | 0 (0.0%) | 0 (0.0%) |
| 45 to 54 Years | 0 (0.0%) | 0 (0.0%) |
| 55 to 64 Years | 7 (7.7%) | 0 (0.0%) |
| 65 to 74 Years | 0 (0.0%) | 0 (0.0%) |
| 75 Years and over | 39 (46.4%) | 0 (0.0%) |
| Total | 46 (6.4%) | 0 (0.0%) |
Income Above Poverty by Sex and Age in Mogul
According to the poverty statistics in Mogul, males aged under 5 years and females aged under 5 years are the age groups that are most secure financially, with 100.0% of males and 100.0% of females in these age groups living above the poverty line.
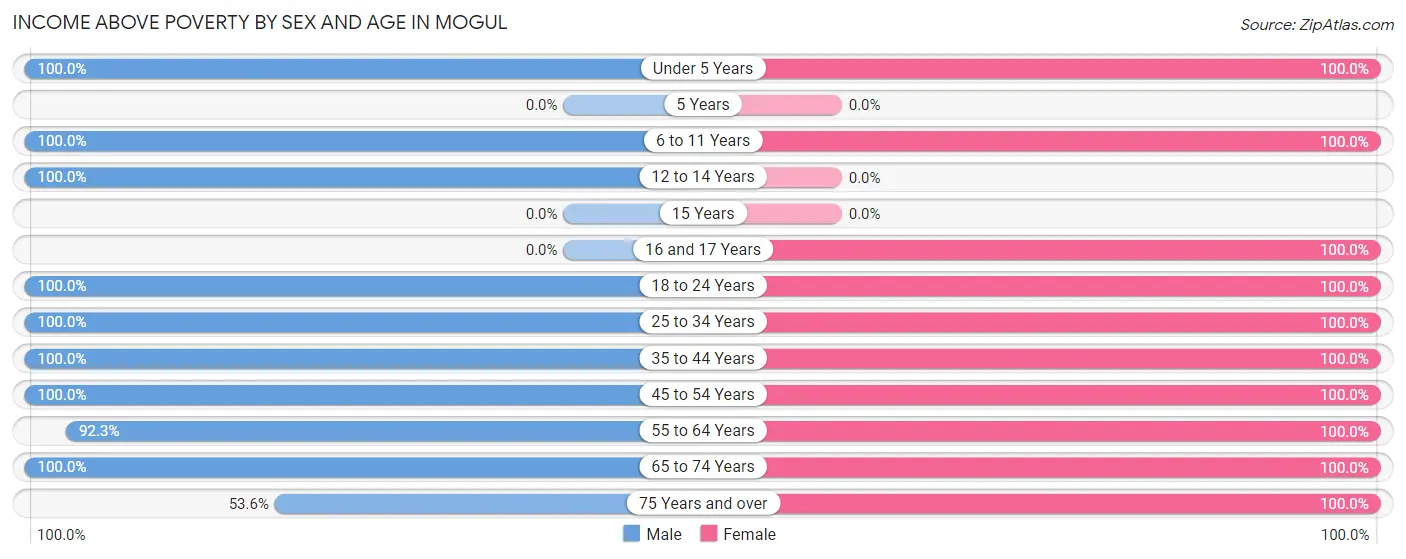
| Age Bracket | Male | Female |
| Under 5 Years | 30 (100.0%) | 43 (100.0%) |
| 5 Years | 0 (0.0%) | 0 (0.0%) |
| 6 to 11 Years | 41 (100.0%) | 21 (100.0%) |
| 12 to 14 Years | 147 (100.0%) | 0 (0.0%) |
| 15 Years | 0 (0.0%) | 0 (0.0%) |
| 16 and 17 Years | 0 (0.0%) | 5 (100.0%) |
| 18 to 24 Years | 17 (100.0%) | 7 (100.0%) |
| 25 to 34 Years | 35 (100.0%) | 67 (100.0%) |
| 35 to 44 Years | 65 (100.0%) | 47 (100.0%) |
| 45 to 54 Years | 104 (100.0%) | 97 (100.0%) |
| 55 to 64 Years | 84 (92.3%) | 142 (100.0%) |
| 65 to 74 Years | 102 (100.0%) | 75 (100.0%) |
| 75 Years and over | 45 (53.6%) | 95 (100.0%) |
| Total | 670 (93.6%) | 599 (100.0%) |
Income Below Poverty Among Married-Couple Families in Mogul
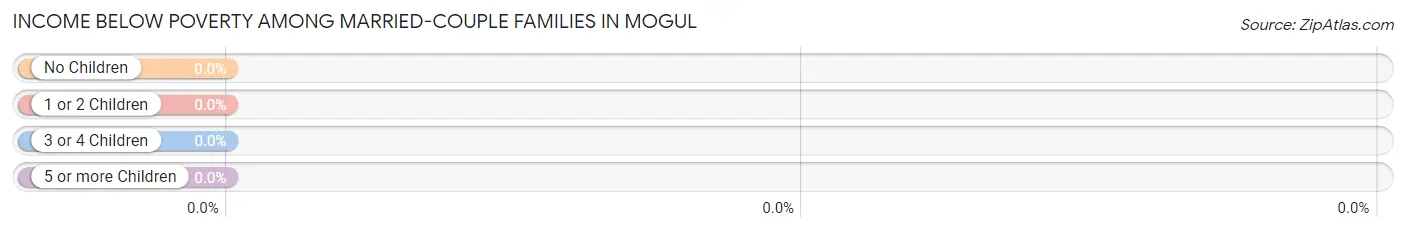
| Children | Above Poverty | Below Poverty |
| No Children | 257 (100.0%) | 0 (0.0%) |
| 1 or 2 Children | 141 (100.0%) | 0 (0.0%) |
| 3 or 4 Children | 0 (0.0%) | 0 (0.0%) |
| 5 or more Children | 0 (0.0%) | 0 (0.0%) |
| Total | 398 (100.0%) | 0 (0.0%) |
Income Below Poverty Among Single-Parent Households in Mogul
| Children | Single Father | Single Mother |
| No Children | 0 (0.0%) | 0 (0.0%) |
| 1 or 2 Children | 0 (0.0%) | 0 (0.0%) |
| 3 or 4 Children | 0 (0.0%) | 0 (0.0%) |
| 5 or more Children | 0 (0.0%) | 0 (0.0%) |
| Total | 0 (0.0%) | 0 (0.0%) |
Income Below Poverty Among Married-Couple vs Single-Parent Households in Mogul
| Children | Married-Couple Families | Single-Parent Households |
| No Children | 0 (0.0%) | 0 (0.0%) |
| 1 or 2 Children | 0 (0.0%) | 0 (0.0%) |
| 3 or 4 Children | 0 (0.0%) | 0 (0.0%) |
| 5 or more Children | 0 (0.0%) | 0 (0.0%) |
| Total | 0 (0.0%) | 0 (0.0%) |
Race in Mogul
The most populous races in Mogul are White / Caucasian (1,192 | 90.6%), Hispanic or Latino (154 | 11.7%), and Two or more Races (89 | 6.8%).
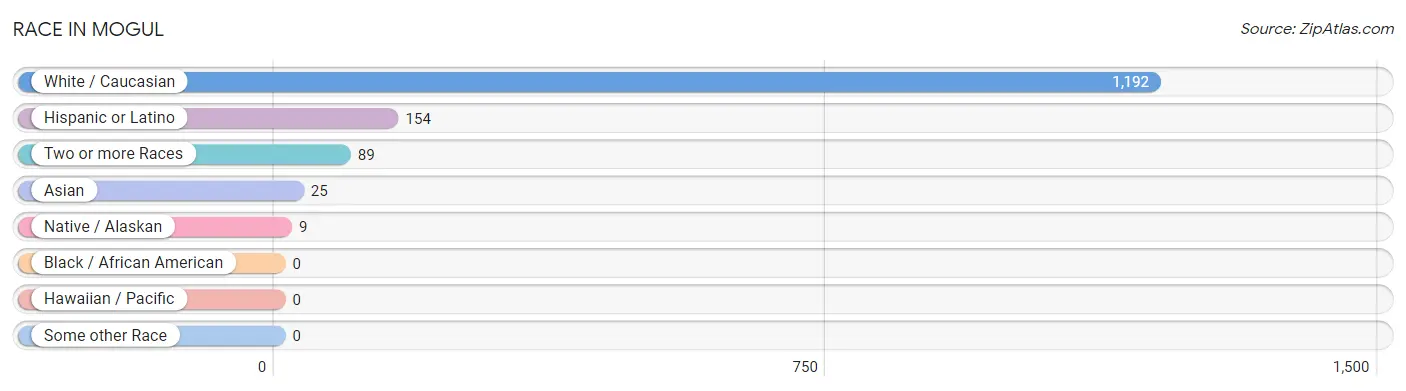
| Race | # Population | % Population |
| Asian | 25 | 1.9% |
| Black / African American | 0 | 0.0% |
| Hawaiian / Pacific | 0 | 0.0% |
| Hispanic or Latino | 154 | 11.7% |
| Native / Alaskan | 9 | 0.7% |
| White / Caucasian | 1,192 | 90.6% |
| Two or more Races | 89 | 6.8% |
| Some other Race | 0 | 0.0% |
| Total | 1,315 | 100.0% |
Ancestry in Mogul
The most populous ancestries reported in Mogul are Irish (255 | 19.4%), Italian (228 | 17.3%), English (210 | 16.0%), Spanish (154 | 11.7%), and German (136 | 10.3%), together accounting for 74.7% of all Mogul residents.
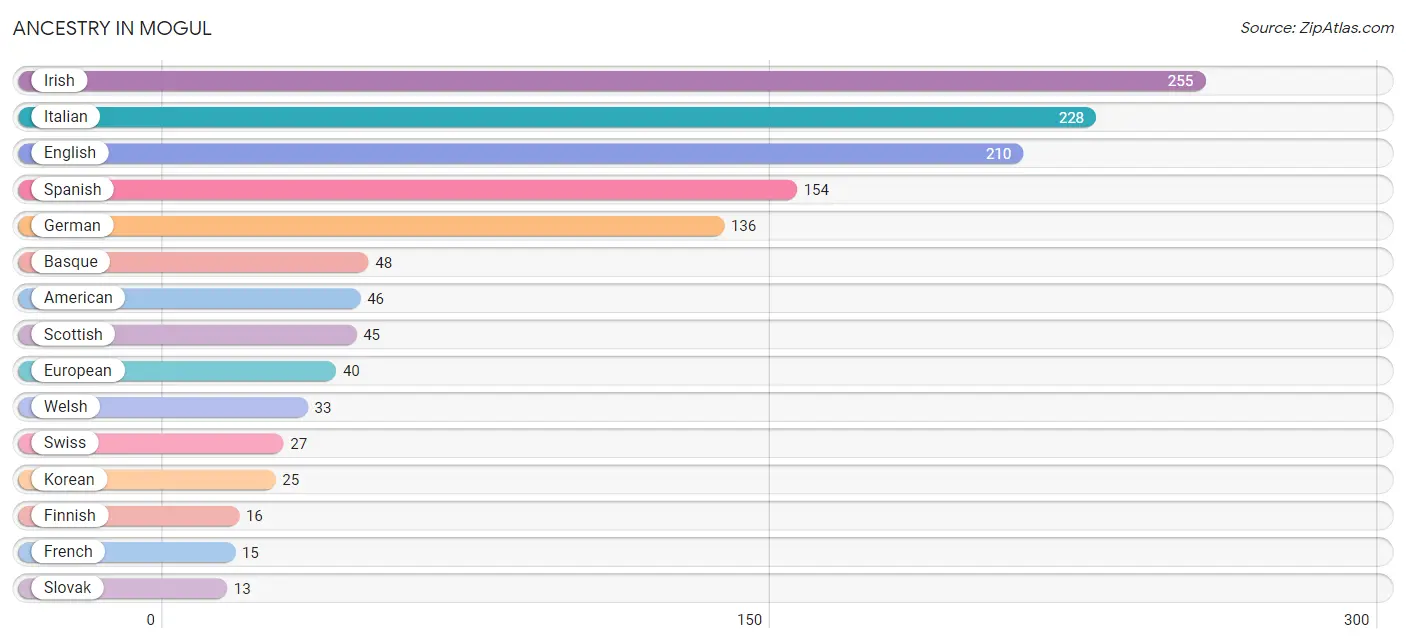
| Ancestry | # Population | % Population |
| American | 46 | 3.5% |
| Basque | 48 | 3.6% |
| Cherokee | 9 | 0.7% |
| Croatian | 8 | 0.6% |
| Dutch | 7 | 0.5% |
| English | 210 | 16.0% |
| European | 40 | 3.0% |
| Finnish | 16 | 1.2% |
| French | 15 | 1.1% |
| German | 136 | 10.3% |
| Irish | 255 | 19.4% |
| Italian | 228 | 17.3% |
| Korean | 25 | 1.9% |
| Polish | 12 | 0.9% |
| Scottish | 45 | 3.4% |
| Slovak | 13 | 1.0% |
| Spanish | 154 | 11.7% |
| Swedish | 10 | 0.8% |
| Swiss | 27 | 2.1% |
| Welsh | 33 | 2.5% | View All 20 Rows |
Immigrants in Mogul
The most numerous immigrant groups reported in Mogul came from Asia (25 | 1.9%), Philippines (25 | 1.9%), South Eastern Asia (25 | 1.9%), Canada (12 | 0.9%), and Europe (9 | 0.7%), together accounting for 7.3% of all Mogul residents.
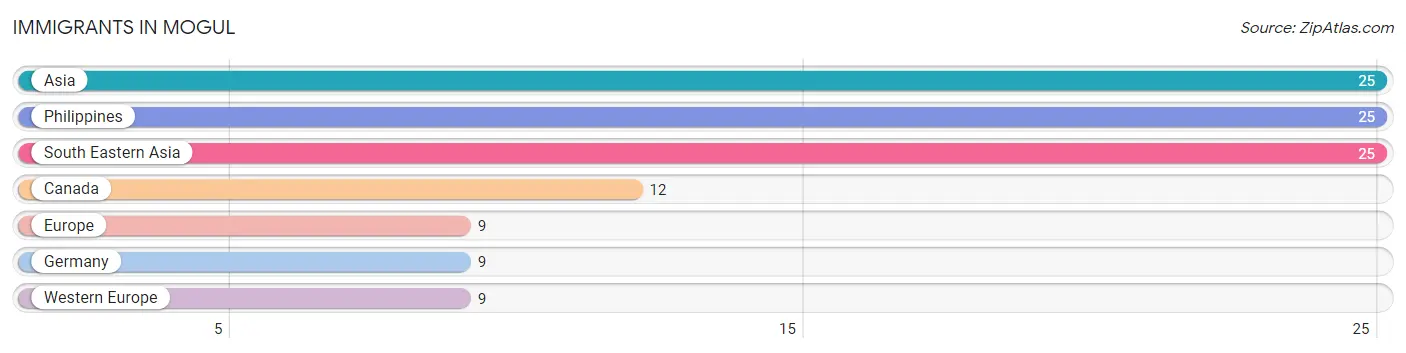
| Immigration Origin | # Population | % Population |
| Asia | 25 | 1.9% |
| Canada | 12 | 0.9% |
| Europe | 9 | 0.7% |
| Germany | 9 | 0.7% |
| Philippines | 25 | 1.9% |
| South Eastern Asia | 25 | 1.9% |
| Western Europe | 9 | 0.7% | View All 7 Rows |
Sex and Age in Mogul
Sex and Age in Mogul
The most populous age groups in Mogul are 10 to 14 Years (164 | 22.9%) for men and 55 to 59 Years (106 | 17.7%) for women.
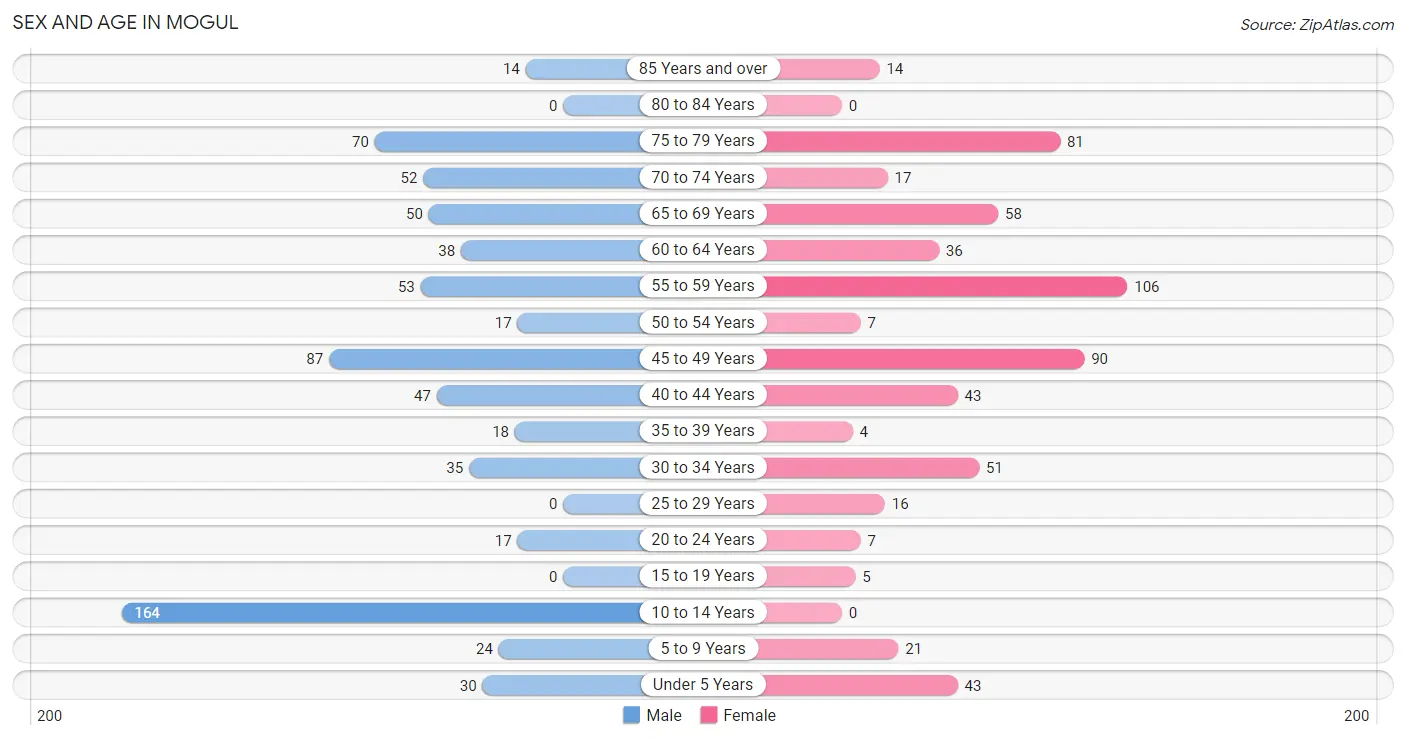
| Age Bracket | Male | Female |
| Under 5 Years | 30 (4.2%) | 43 (7.2%) |
| 5 to 9 Years | 24 (3.4%) | 21 (3.5%) |
| 10 to 14 Years | 164 (22.9%) | 0 (0.0%) |
| 15 to 19 Years | 0 (0.0%) | 5 (0.8%) |
| 20 to 24 Years | 17 (2.4%) | 7 (1.2%) |
| 25 to 29 Years | 0 (0.0%) | 16 (2.7%) |
| 30 to 34 Years | 35 (4.9%) | 51 (8.5%) |
| 35 to 39 Years | 18 (2.5%) | 4 (0.7%) |
| 40 to 44 Years | 47 (6.6%) | 43 (7.2%) |
| 45 to 49 Years | 87 (12.1%) | 90 (15.0%) |
| 50 to 54 Years | 17 (2.4%) | 7 (1.2%) |
| 55 to 59 Years | 53 (7.4%) | 106 (17.7%) |
| 60 to 64 Years | 38 (5.3%) | 36 (6.0%) |
| 65 to 69 Years | 50 (7.0%) | 58 (9.7%) |
| 70 to 74 Years | 52 (7.3%) | 17 (2.8%) |
| 75 to 79 Years | 70 (9.8%) | 81 (13.5%) |
| 80 to 84 Years | 0 (0.0%) | 0 (0.0%) |
| 85 Years and over | 14 (2.0%) | 14 (2.3%) |
| Total | 716 (100.0%) | 599 (100.0%) |
Families and Households in Mogul
Median Family Size in Mogul
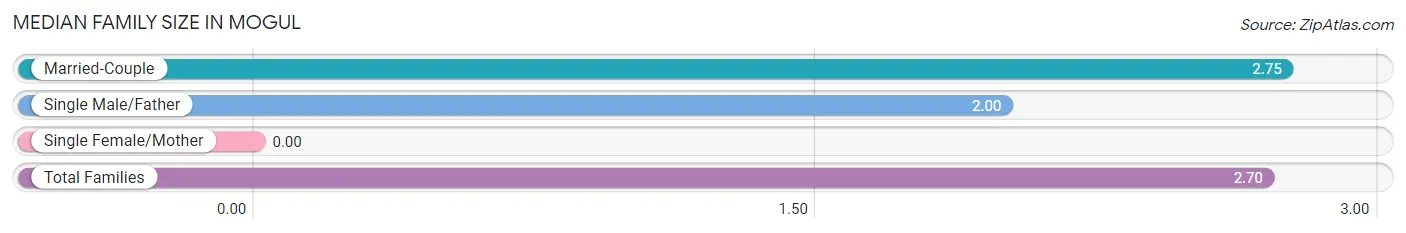
| Family Type | # Families | Family Size |
| Married-Couple | 398 (93.4%) | 2.75 |
| Single Male/Father | 28 (6.6%) | 2.00 |
| Single Female/Mother | 0 (0.0%) | - |
| Total Families | 426 (100.0%) | 2.70 |
Median Household Size in Mogul
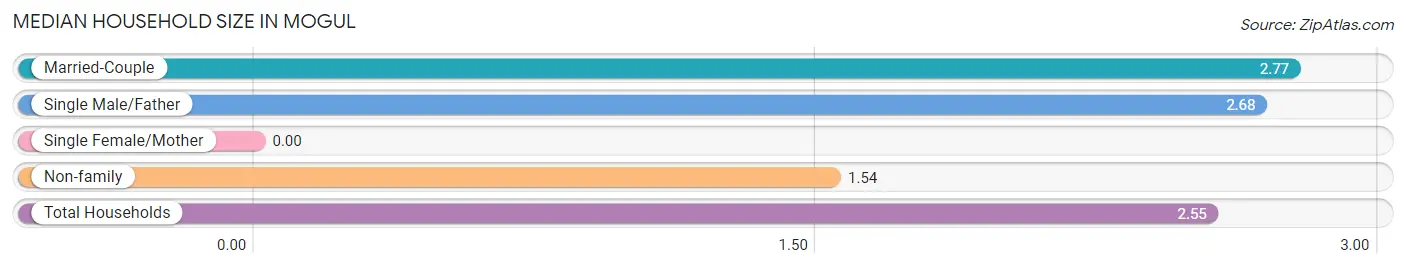
| Household Type | # Households | Household Size |
| Married-Couple | 398 (77.3%) | 2.77 |
| Single Male/Father | 28 (5.4%) | 2.68 |
| Single Female/Mother | 0 (0.0%) | - |
| Non-family | 89 (17.3%) | 1.54 |
| Total Households | 515 (100.0%) | 2.55 |
Household Size by Marriage Status in Mogul
Out of a total of 515 households in Mogul, 426 (82.7%) are family households, while 89 (17.3%) are nonfamily households. The most numerous type of family households are 2-person households, comprising 206, and the most common type of nonfamily households are 2-person households, comprising 48.
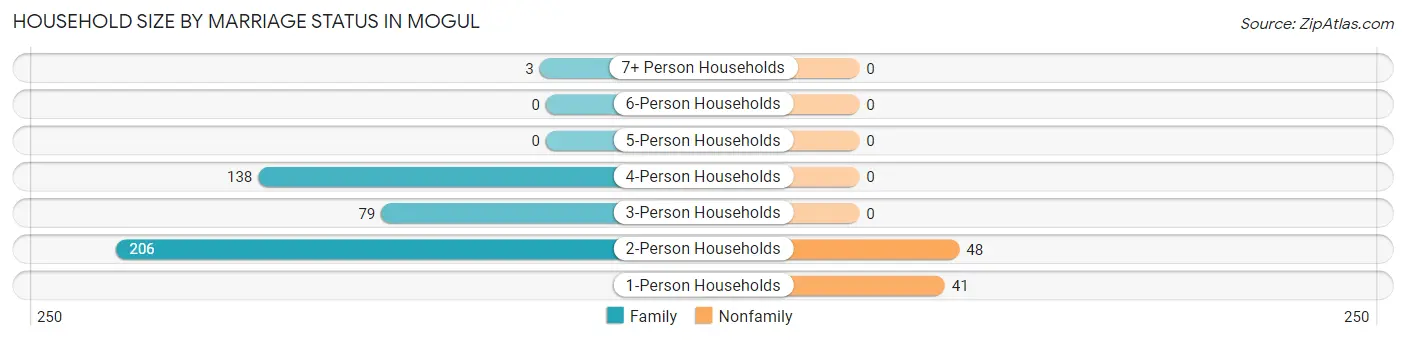
| Household Size | Family Households | Nonfamily Households |
| 1-Person Households | - | 41 (8.0%) |
| 2-Person Households | 206 (40.0%) | 48 (9.3%) |
| 3-Person Households | 79 (15.3%) | 0 (0.0%) |
| 4-Person Households | 138 (26.8%) | 0 (0.0%) |
| 5-Person Households | 0 (0.0%) | 0 (0.0%) |
| 6-Person Households | 0 (0.0%) | 0 (0.0%) |
| 7+ Person Households | 3 (0.6%) | 0 (0.0%) |
| Total | 426 (82.7%) | 89 (17.3%) |
Female Fertility in Mogul
Fertility by Age in Mogul
| Age Bracket | Women with Births | Births / 1,000 Women |
| 15 to 19 years | 0 (0.0%) | 0.0 |
| 20 to 34 years | 0 (0.0%) | 0.0 |
| 35 to 50 years | 0 (0.0%) | 0.0 |
| Total | 0 (0.0%) | 0.0 |
Fertility by Age by Marriage Status in Mogul
| Age Bracket | Married | Unmarried |
| 15 to 19 years | 0 (0.0%) | 0 (0.0%) |
| 20 to 34 years | 0 (0.0%) | 0 (0.0%) |
| 35 to 50 years | 0 (0.0%) | 0 (0.0%) |
| Total | 0 (0.0%) | 0 (0.0%) |
Fertility by Education in Mogul
| Educational Attainment | Women with Births | Births / 1,000 Women |
| Less than High School | 0 (0.0%) | 0.0 |
| High School Diploma | 0 (0.0%) | 0.0 |
| College or Associate's Degree | 0 (0.0%) | 0.0 |
| Bachelor's Degree | 0 (0.0%) | 0.0 |
| Graduate Degree | 0 (0.0%) | 0.0 |
| Total | 0 (0.0%) | 0.0 |
Fertility by Education by Marriage Status in Mogul
| Educational Attainment | Married | Unmarried |
| Less than High School | 0 (0.0%) | 0 (0.0%) |
| High School Diploma | 0 (0.0%) | 0 (0.0%) |
| College or Associate's Degree | 0 (0.0%) | 0 (0.0%) |
| Bachelor's Degree | 0 (0.0%) | 0 (0.0%) |
| Graduate Degree | 0 (0.0%) | 0 (0.0%) |
| Total | 0 (0.0%) | 0 (0.0%) |
Employment Characteristics in Mogul
Employment by Class of Employer in Mogul
Among the 544 employed individuals in Mogul, private company employees (268 | 49.3%), local government employees (168 | 30.9%), and not-for-profit organizations (48 | 8.8%) make up the most common classes of employment.
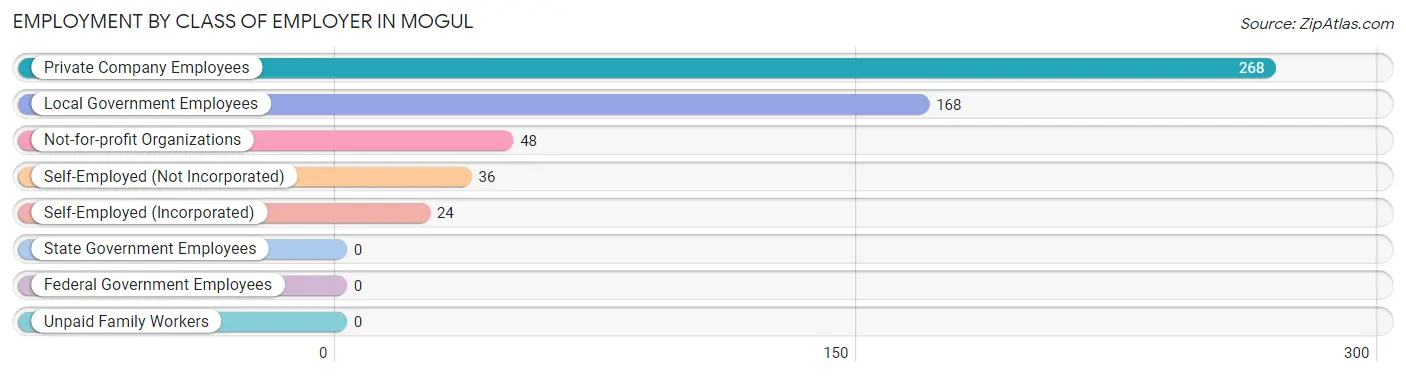
| Employer Class | # Employees | % Employees |
| Private Company Employees | 268 | 49.3% |
| Self-Employed (Incorporated) | 24 | 4.4% |
| Self-Employed (Not Incorporated) | 36 | 6.6% |
| Not-for-profit Organizations | 48 | 8.8% |
| Local Government Employees | 168 | 30.9% |
| State Government Employees | 0 | 0.0% |
| Federal Government Employees | 0 | 0.0% |
| Unpaid Family Workers | 0 | 0.0% |
| Total | 544 | 100.0% |
Employment Status by Age in Mogul
According to the labor force statistics for Mogul, out of the total population over 16 years of age (1,033), 54.9% or 567 individuals are in the labor force, with 2.5% or 14 of them unemployed. The age group with the highest labor force participation rate is 35 to 44 years, with 100.0% or 112 individuals in the labor force. Within the labor force, the 20 to 24 years age range has the highest percentage of unemployed individuals, with 70.0% or 7 of them being unemployed.
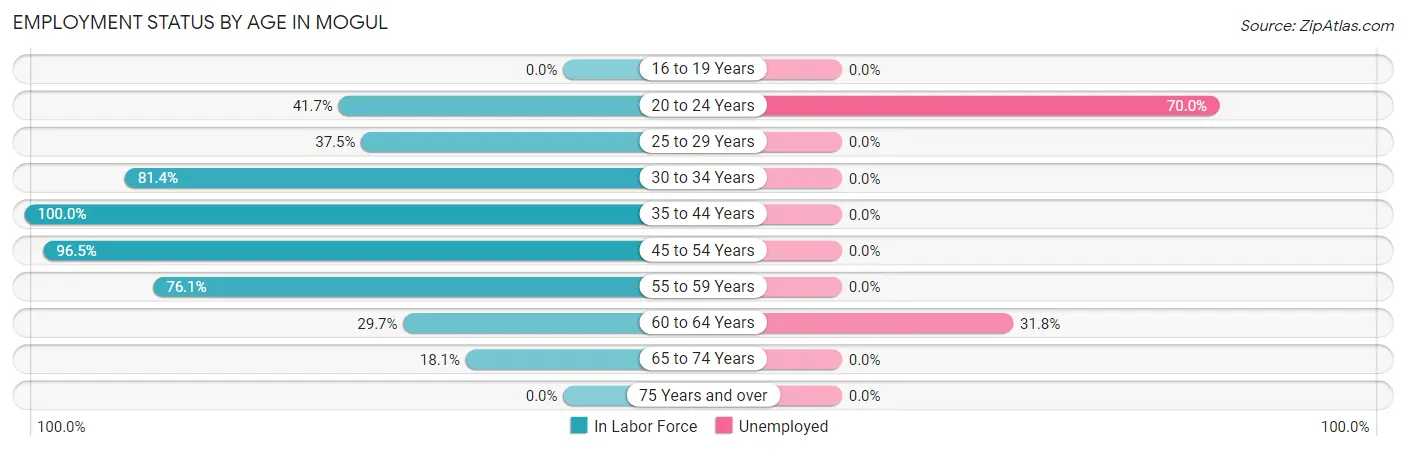
| Age Bracket | In Labor Force | Unemployed |
| 16 to 19 Years | 0 (0.0%) | 0 (0.0%) |
| 20 to 24 Years | 10 (41.7%) | 7 (70.0%) |
| 25 to 29 Years | 6 (37.5%) | 0 (0.0%) |
| 30 to 34 Years | 70 (81.4%) | 0 (0.0%) |
| 35 to 44 Years | 112 (100.0%) | 0 (0.0%) |
| 45 to 54 Years | 194 (96.5%) | 0 (0.0%) |
| 55 to 59 Years | 121 (76.1%) | 0 (0.0%) |
| 60 to 64 Years | 22 (29.7%) | 7 (31.8%) |
| 65 to 74 Years | 32 (18.1%) | 0 (0.0%) |
| 75 Years and over | 0 (0.0%) | 0 (0.0%) |
| Total | 567 (54.9%) | 14 (2.5%) |
Employment Status by Educational Attainment in Mogul
According to labor force statistics for Mogul, 81.0% of individuals (525) out of the total population between 25 and 64 years of age (648) are in the labor force, with 1.3% or 7 of them being unemployed. The group with the highest labor force participation rate are those with the educational attainment of bachelor's degree or higher, with 89.3% or 366 individuals in the labor force. Within the labor force, individuals with high school diploma education have the highest percentage of unemployment, with 13.7% or 7 of them being unemployed.
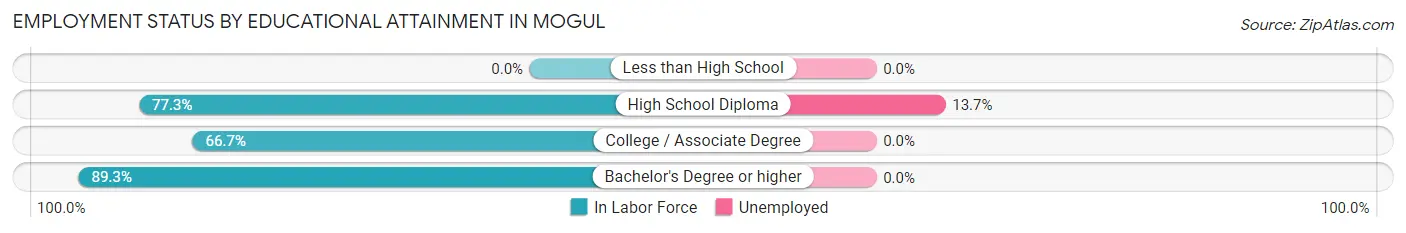
| Educational Attainment | In Labor Force | Unemployed |
| Less than High School | 0 (0.0%) | 0 (0.0%) |
| High School Diploma | 51 (77.3%) | 9 (13.7%) |
| College / Associate Degree | 108 (66.7%) | 0 (0.0%) |
| Bachelor's Degree or higher | 366 (89.3%) | 0 (0.0%) |
| Total | 525 (81.0%) | 8 (1.3%) |
Employment Occupations by Sex in Mogul
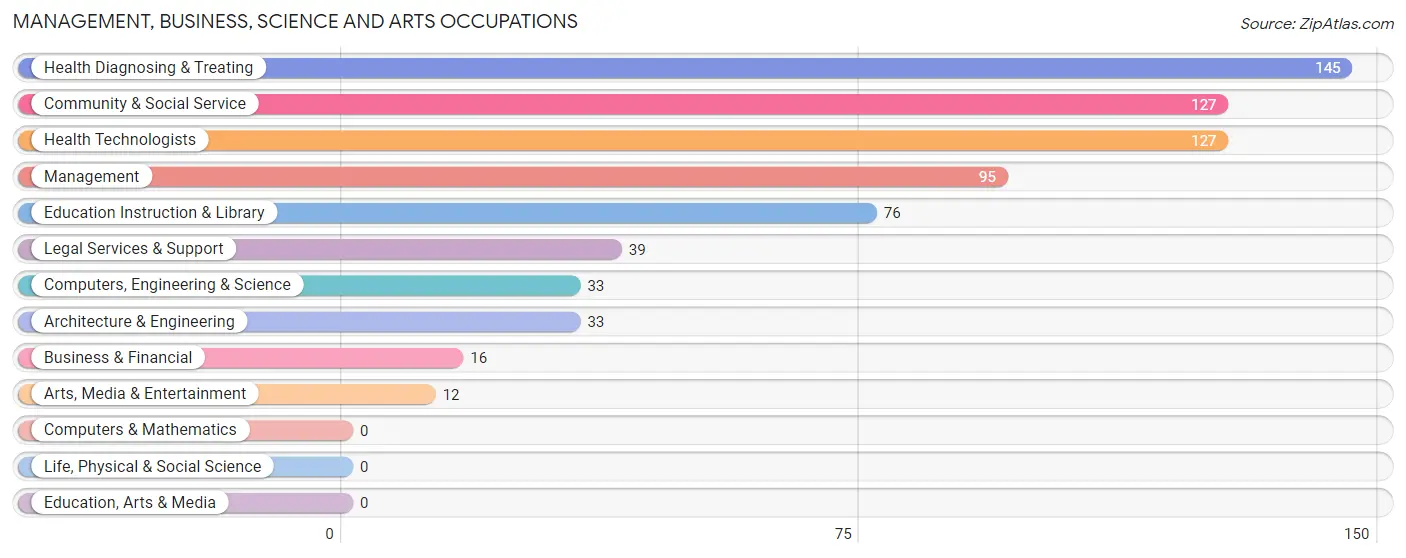
Management, Business, Science and Arts Occupations
The most common Management, Business, Science and Arts occupations in Mogul are Health Diagnosing & Treating (145 | 26.2%), Community & Social Service (127 | 23.0%), Health Technologists (127 | 23.0%), Management (95 | 17.2%), and Education Instruction & Library (76 | 13.7%).
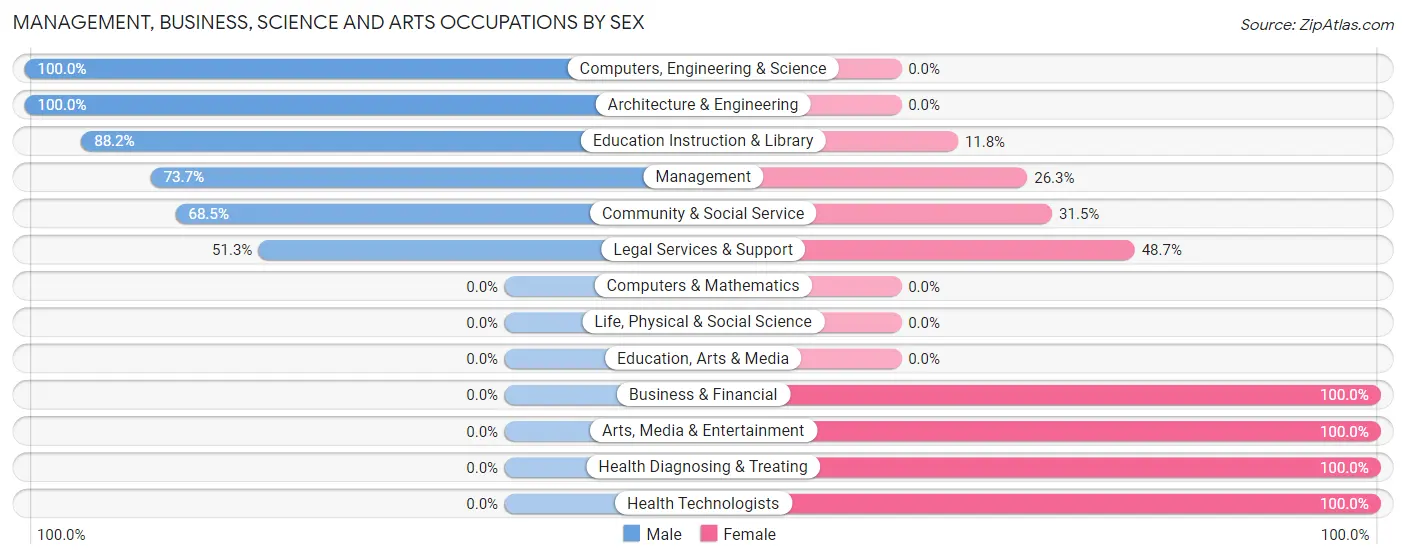
Management, Business, Science and Arts Occupations by Sex
Within the Management, Business, Science and Arts occupations in Mogul, the most male-oriented occupations are Computers, Engineering & Science (100.0%), Architecture & Engineering (100.0%), and Education Instruction & Library (88.2%), while the most female-oriented occupations are Business & Financial (100.0%), Arts, Media & Entertainment (100.0%), and Health Diagnosing & Treating (100.0%).
| Occupation | Male | Female |
| Management | 70 (73.7%) | 25 (26.3%) |
| Business & Financial | 0 (0.0%) | 16 (100.0%) |
| Computers, Engineering & Science | 33 (100.0%) | 0 (0.0%) |
| Computers & Mathematics | 0 (0.0%) | 0 (0.0%) |
| Architecture & Engineering | 33 (100.0%) | 0 (0.0%) |
| Life, Physical & Social Science | 0 (0.0%) | 0 (0.0%) |
| Community & Social Service | 87 (68.5%) | 40 (31.5%) |
| Education, Arts & Media | 0 (0.0%) | 0 (0.0%) |
| Legal Services & Support | 20 (51.3%) | 19 (48.7%) |
| Education Instruction & Library | 67 (88.2%) | 9 (11.8%) |
| Arts, Media & Entertainment | 0 (0.0%) | 12 (100.0%) |
| Health Diagnosing & Treating | 0 (0.0%) | 145 (100.0%) |
| Health Technologists | 0 (0.0%) | 127 (100.0%) |
| Total (Category) | 190 (45.7%) | 226 (54.3%) |
| Total (Overall) | 276 (49.9%) | 277 (50.1%) |
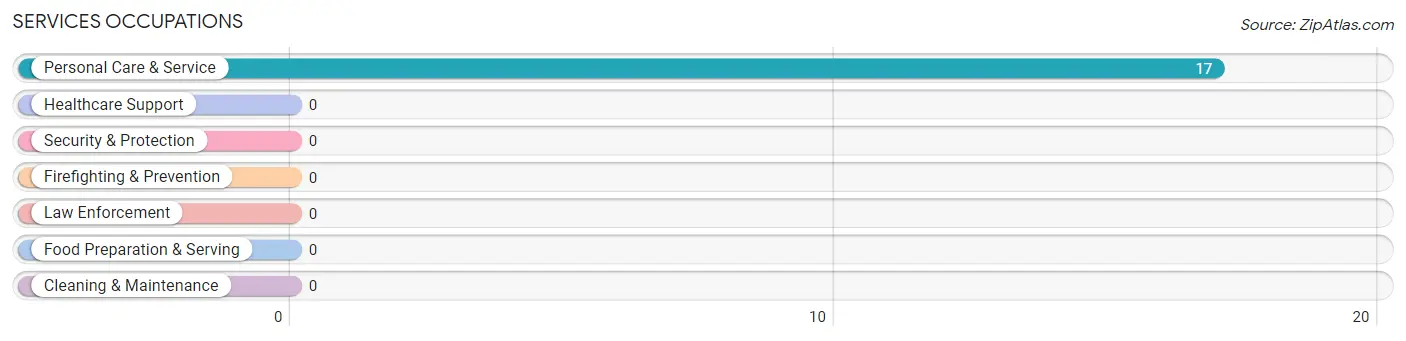
Services Occupations
The most common Services occupations in Mogul are , and Personal Care & Service (17 | 3.1%).
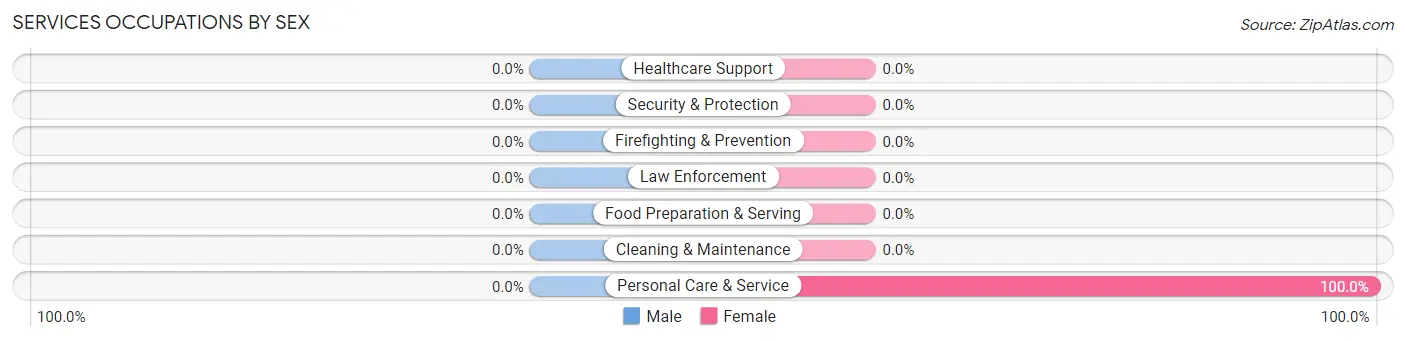
Services Occupations by Sex
| Occupation | Male | Female |
| Healthcare Support | 0 (0.0%) | 0 (0.0%) |
| Security & Protection | 0 (0.0%) | 0 (0.0%) |
| Firefighting & Prevention | 0 (0.0%) | 0 (0.0%) |
| Law Enforcement | 0 (0.0%) | 0 (0.0%) |
| Food Preparation & Serving | 0 (0.0%) | 0 (0.0%) |
| Cleaning & Maintenance | 0 (0.0%) | 0 (0.0%) |
| Personal Care & Service | 0 (0.0%) | 17 (100.0%) |
| Total (Category) | 0 (0.0%) | 17 (100.0%) |
| Total (Overall) | 276 (49.9%) | 277 (50.1%) |
Sales and Office Occupations
The most common Sales and Office occupations in Mogul are Office & Administration (30 | 5.4%), and Sales & Related (5 | 0.9%).
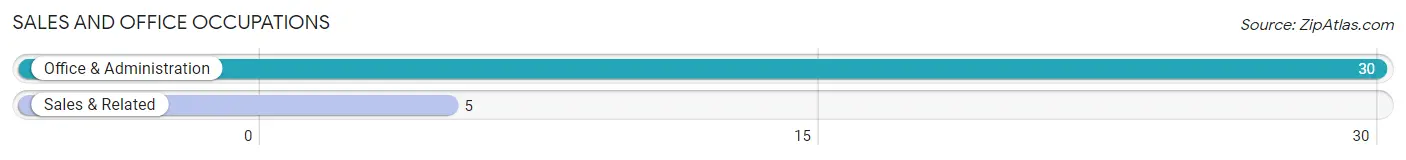
Sales and Office Occupations by Sex

| Occupation | Male | Female |
| Sales & Related | 5 (100.0%) | 0 (0.0%) |
| Office & Administration | 0 (0.0%) | 30 (100.0%) |
| Total (Category) | 5 (14.3%) | 30 (85.7%) |
| Total (Overall) | 276 (49.9%) | 277 (50.1%) |
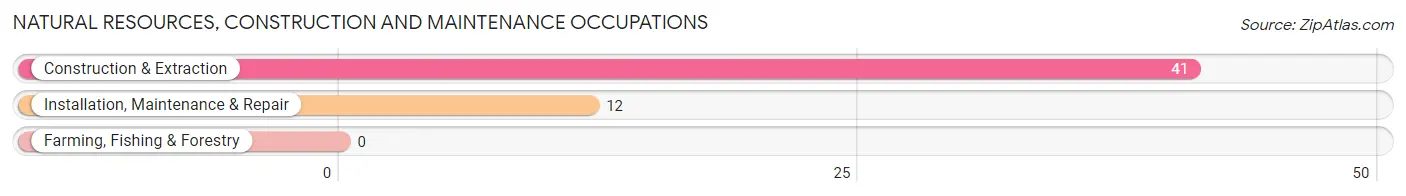
Natural Resources, Construction and Maintenance Occupations
The most common Natural Resources, Construction and Maintenance occupations in Mogul are Construction & Extraction (41 | 7.4%), and Installation, Maintenance & Repair (12 | 2.2%).
Natural Resources, Construction and Maintenance Occupations by Sex
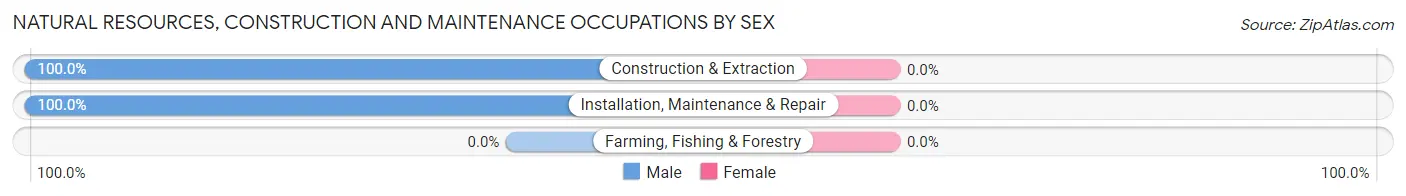
| Occupation | Male | Female |
| Farming, Fishing & Forestry | 0 (0.0%) | 0 (0.0%) |
| Construction & Extraction | 41 (100.0%) | 0 (0.0%) |
| Installation, Maintenance & Repair | 12 (100.0%) | 0 (0.0%) |
| Total (Category) | 53 (100.0%) | 0 (0.0%) |
| Total (Overall) | 276 (49.9%) | 277 (50.1%) |
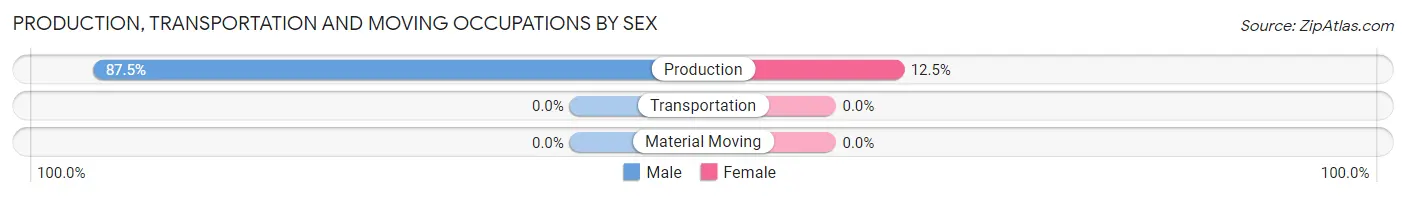
Production, Transportation and Moving Occupations
The most common Production, Transportation and Moving occupations in Mogul are , and Production (32 | 5.8%).
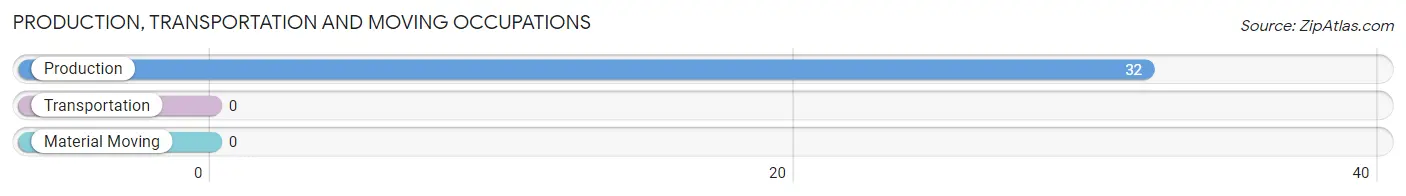
Production, Transportation and Moving Occupations by Sex
| Occupation | Male | Female |
| Production | 28 (87.5%) | 4 (12.5%) |
| Transportation | 0 (0.0%) | 0 (0.0%) |
| Material Moving | 0 (0.0%) | 0 (0.0%) |
| Total (Category) | 28 (87.5%) | 4 (12.5%) |
| Total (Overall) | 276 (49.9%) | 277 (50.1%) |
Employment Industries by Sex in Mogul
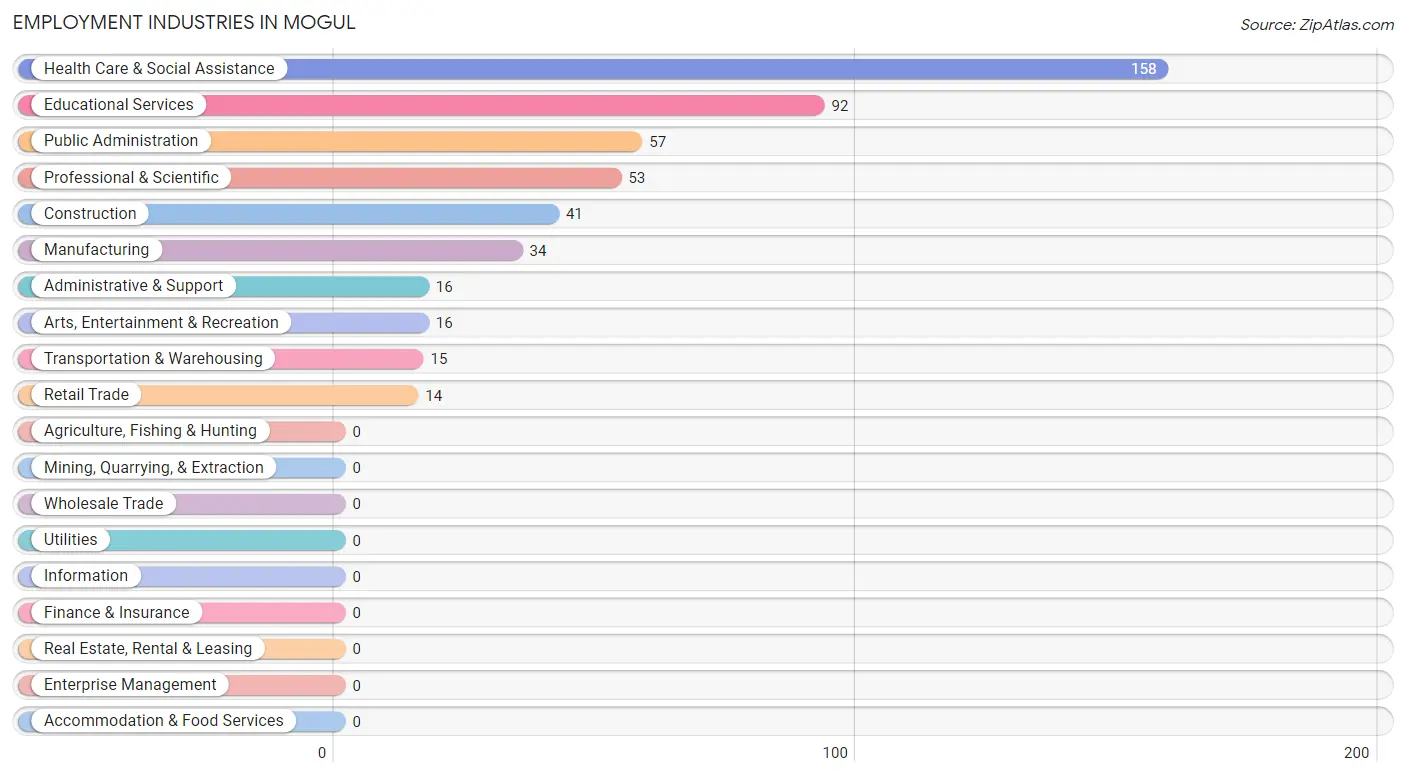
Employment Industries in Mogul
The major employment industries in Mogul include Health Care & Social Assistance (158 | 28.6%), Educational Services (92 | 16.6%), Public Administration (57 | 10.3%), Professional & Scientific (53 | 9.6%), and Construction (41 | 7.4%).
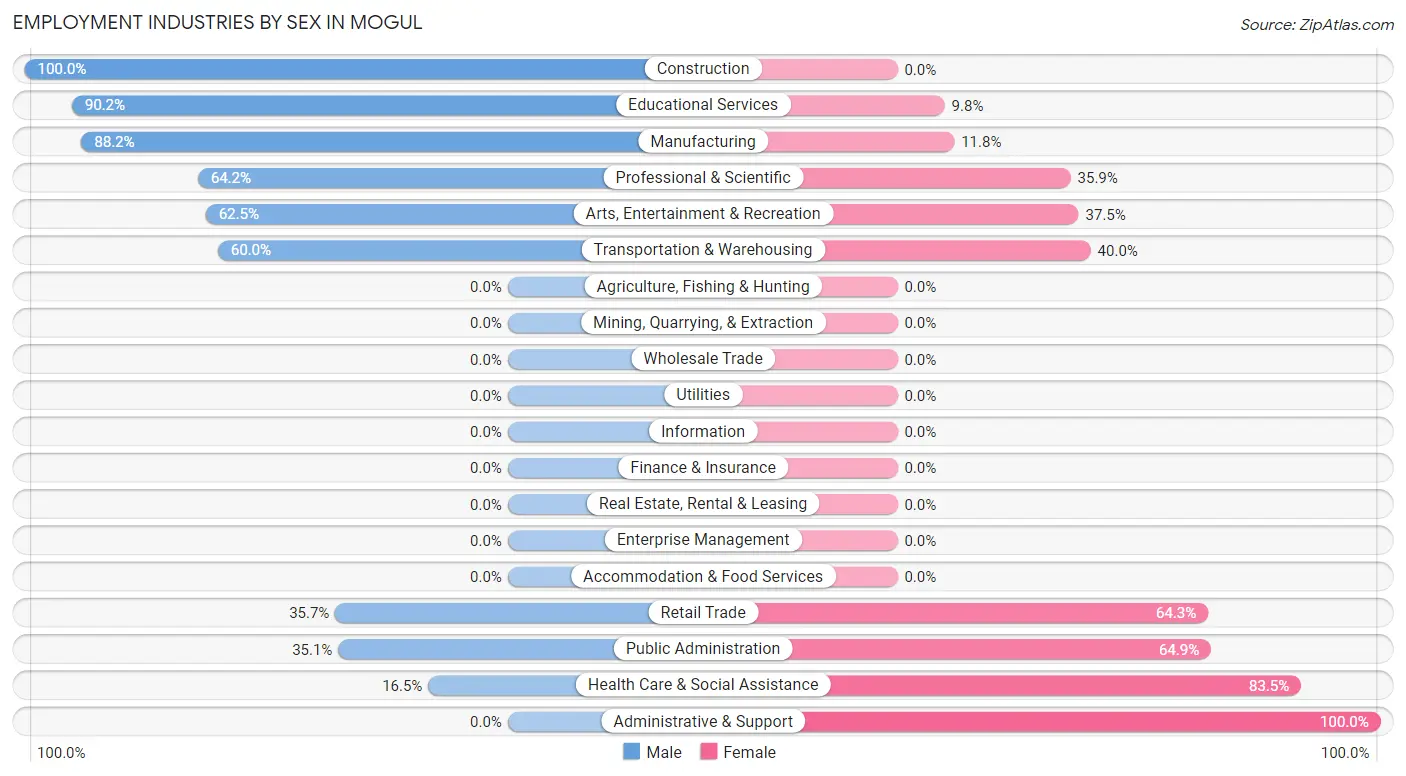
Employment Industries by Sex in Mogul
The Mogul industries that see more men than women are Construction (100.0%), Educational Services (90.2%), and Manufacturing (88.2%), whereas the industries that tend to have a higher number of women are Administrative & Support (100.0%), Health Care & Social Assistance (83.5%), and Public Administration (64.9%).
| Industry | Male | Female |
| Agriculture, Fishing & Hunting | 0 (0.0%) | 0 (0.0%) |
| Mining, Quarrying, & Extraction | 0 (0.0%) | 0 (0.0%) |
| Construction | 41 (100.0%) | 0 (0.0%) |
| Manufacturing | 30 (88.2%) | 4 (11.8%) |
| Wholesale Trade | 0 (0.0%) | 0 (0.0%) |
| Retail Trade | 5 (35.7%) | 9 (64.3%) |
| Transportation & Warehousing | 9 (60.0%) | 6 (40.0%) |
| Utilities | 0 (0.0%) | 0 (0.0%) |
| Information | 0 (0.0%) | 0 (0.0%) |
| Finance & Insurance | 0 (0.0%) | 0 (0.0%) |
| Real Estate, Rental & Leasing | 0 (0.0%) | 0 (0.0%) |
| Professional & Scientific | 34 (64.1%) | 19 (35.8%) |
| Enterprise Management | 0 (0.0%) | 0 (0.0%) |
| Administrative & Support | 0 (0.0%) | 16 (100.0%) |
| Educational Services | 83 (90.2%) | 9 (9.8%) |
| Health Care & Social Assistance | 26 (16.5%) | 132 (83.5%) |
| Arts, Entertainment & Recreation | 10 (62.5%) | 6 (37.5%) |
| Accommodation & Food Services | 0 (0.0%) | 0 (0.0%) |
| Public Administration | 20 (35.1%) | 37 (64.9%) |
| Total | 276 (49.9%) | 277 (50.1%) |
Education in Mogul
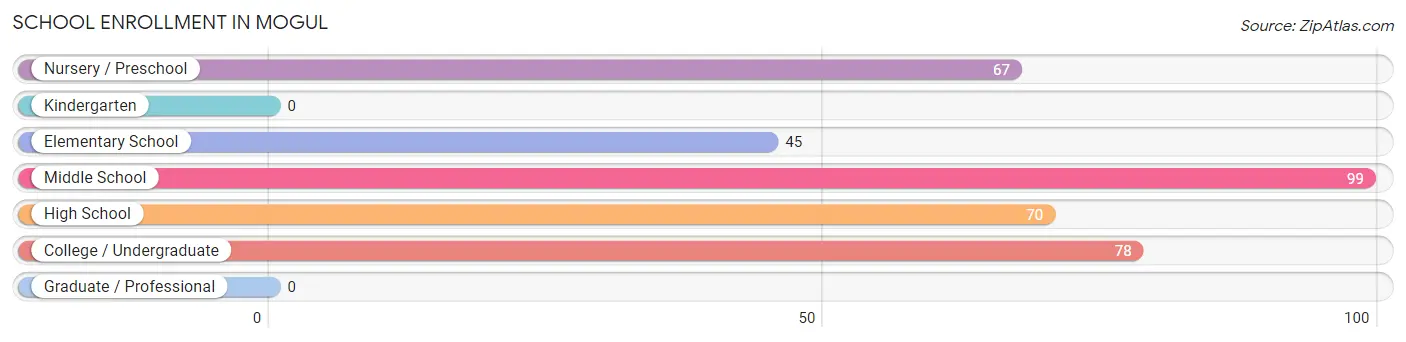
School Enrollment in Mogul
The most common levels of schooling among the 359 students in Mogul are middle school (99 | 27.6%), college / undergraduate (78 | 21.7%), and high school (70 | 19.5%).
| School Level | # Students | % Students |
| Nursery / Preschool | 67 | 18.7% |
| Kindergarten | 0 | 0.0% |
| Elementary School | 45 | 12.5% |
| Middle School | 99 | 27.6% |
| High School | 70 | 19.5% |
| College / Undergraduate | 78 | 21.7% |
| Graduate / Professional | 0 | 0.0% |
| Total | 359 | 100.0% |
School Enrollment by Age by Funding Source in Mogul
Out of a total of 359 students who are enrolled in schools in Mogul, 74 (20.6%) attend a private institution, while the remaining 285 (79.4%) are enrolled in public schools. The age group of 3 to 4 year olds has the highest likelihood of being enrolled in private schools, with 67 (100.0% in the age bracket) enrolled. Conversely, the age group of 5 to 9 year old has the lowest likelihood of being enrolled in a private school, with 45 (100.0% in the age bracket) attending a public institution.
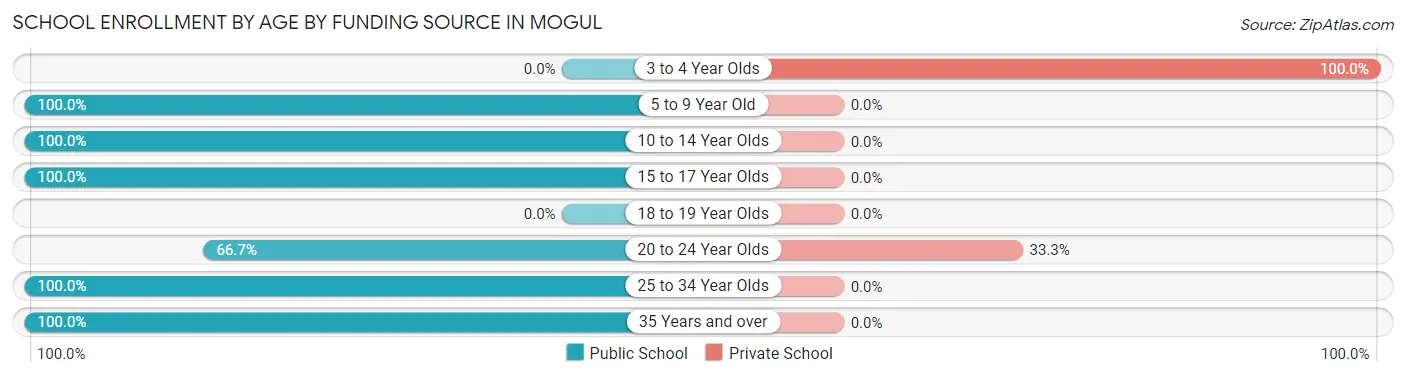
| Age Bracket | Public School | Private School |
| 3 to 4 Year Olds | 0 (0.0%) | 67 (100.0%) |
| 5 to 9 Year Old | 45 (100.0%) | 0 (0.0%) |
| 10 to 14 Year Olds | 164 (100.0%) | 0 (0.0%) |
| 15 to 17 Year Olds | 5 (100.0%) | 0 (0.0%) |
| 18 to 19 Year Olds | 0 (0.0%) | 0 (0.0%) |
| 20 to 24 Year Olds | 14 (66.7%) | 7 (33.3%) |
| 25 to 34 Year Olds | 43 (100.0%) | 0 (0.0%) |
| 35 Years and over | 14 (100.0%) | 0 (0.0%) |
| Total | 285 (79.4%) | 74 (20.6%) |
Educational Attainment by Field of Study in Mogul
Arts & humanities (107 | 20.3%), liberal arts & history (94 | 17.9%), science & technology (86 | 16.4%), engineering (44 | 8.4%), and bio, nature & agricultural (42 | 8.0%) are the most common fields of study among 526 individuals in Mogul who have obtained a bachelor's degree or higher.
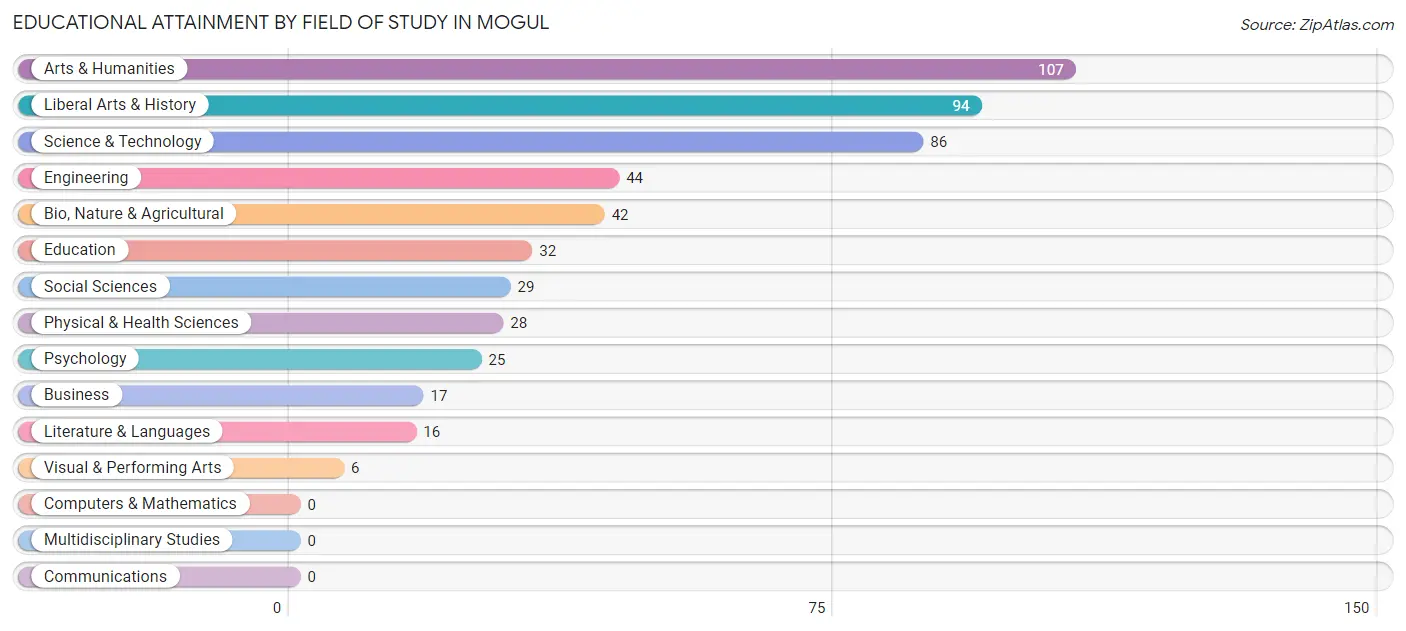
| Field of Study | # Graduates | % Graduates |
| Computers & Mathematics | 0 | 0.0% |
| Bio, Nature & Agricultural | 42 | 8.0% |
| Physical & Health Sciences | 28 | 5.3% |
| Psychology | 25 | 4.8% |
| Social Sciences | 29 | 5.5% |
| Engineering | 44 | 8.4% |
| Multidisciplinary Studies | 0 | 0.0% |
| Science & Technology | 86 | 16.4% |
| Business | 17 | 3.2% |
| Education | 32 | 6.1% |
| Literature & Languages | 16 | 3.0% |
| Liberal Arts & History | 94 | 17.9% |
| Visual & Performing Arts | 6 | 1.1% |
| Communications | 0 | 0.0% |
| Arts & Humanities | 107 | 20.3% |
| Total | 526 | 100.0% |
Transportation & Commute in Mogul
Vehicle Availability by Sex in Mogul
The most prevalent vehicle ownership categories in Mogul are males with 3 vehicles (188, accounting for 68.9%) and females with 3 vehicles (170, making up 69.4%).
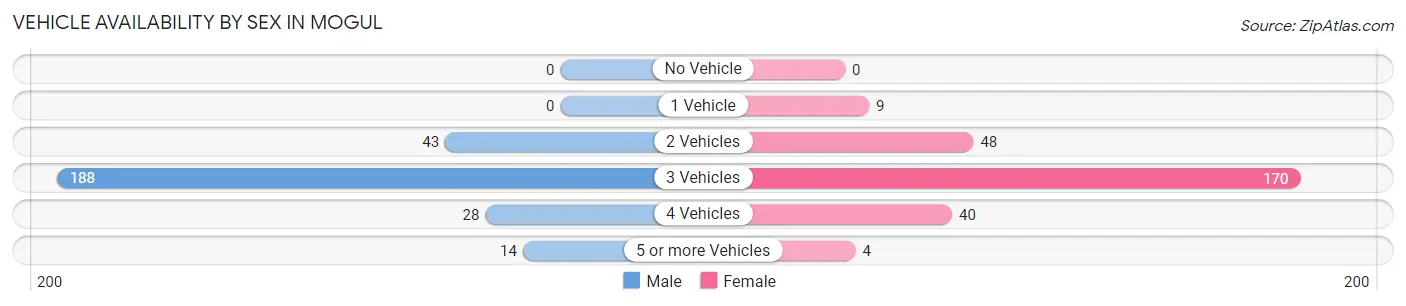
| Vehicles Available | Male | Female |
| No Vehicle | 0 (0.0%) | 0 (0.0%) |
| 1 Vehicle | 0 (0.0%) | 9 (3.3%) |
| 2 Vehicles | 43 (15.8%) | 48 (17.7%) |
| 3 Vehicles | 188 (68.9%) | 170 (62.7%) |
| 4 Vehicles | 28 (10.3%) | 40 (14.8%) |
| 5 or more Vehicles | 14 (5.1%) | 4 (1.5%) |
| Total | 273 (100.0%) | 271 (100.0%) |
Commute Time in Mogul
The most frequently occuring commute durations in Mogul are 15 to 19 minutes (169 commuters, 32.4%), 10 to 14 minutes (131 commuters, 25.1%), and 30 to 34 minutes (76 commuters, 14.6%).
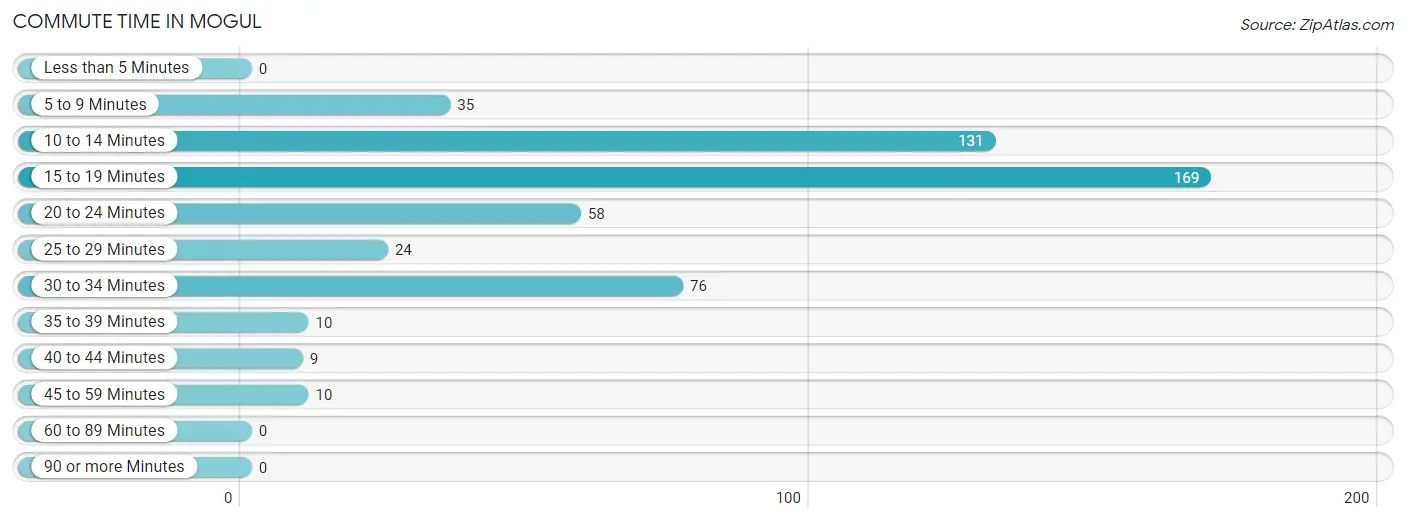
| Commute Time | # Commuters | % Commuters |
| Less than 5 Minutes | 0 | 0.0% |
| 5 to 9 Minutes | 35 | 6.7% |
| 10 to 14 Minutes | 131 | 25.1% |
| 15 to 19 Minutes | 169 | 32.4% |
| 20 to 24 Minutes | 58 | 11.1% |
| 25 to 29 Minutes | 24 | 4.6% |
| 30 to 34 Minutes | 76 | 14.6% |
| 35 to 39 Minutes | 10 | 1.9% |
| 40 to 44 Minutes | 9 | 1.7% |
| 45 to 59 Minutes | 10 | 1.9% |
| 60 to 89 Minutes | 0 | 0.0% |
| 90 or more Minutes | 0 | 0.0% |
Commute Time by Sex in Mogul
The most common commute times in Mogul are 15 to 19 minutes (121 commuters, 48.2%) for males and 10 to 14 minutes (131 commuters, 48.3%) for females.
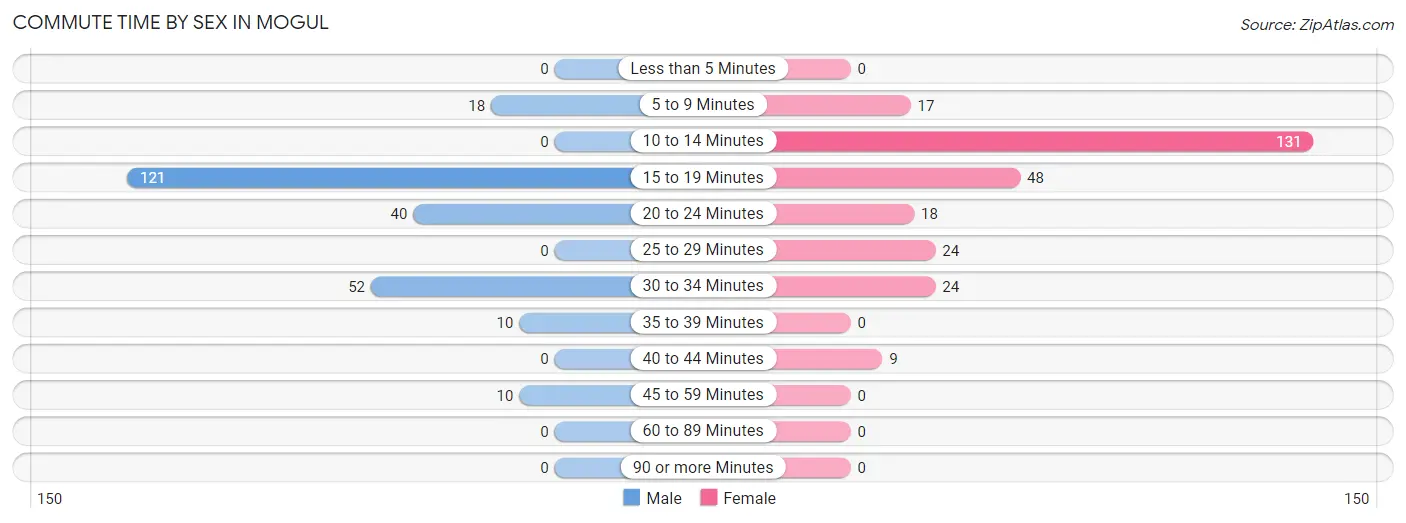
| Commute Time | Male | Female |
| Less than 5 Minutes | 0 (0.0%) | 0 (0.0%) |
| 5 to 9 Minutes | 18 (7.2%) | 17 (6.3%) |
| 10 to 14 Minutes | 0 (0.0%) | 131 (48.3%) |
| 15 to 19 Minutes | 121 (48.2%) | 48 (17.7%) |
| 20 to 24 Minutes | 40 (15.9%) | 18 (6.6%) |
| 25 to 29 Minutes | 0 (0.0%) | 24 (8.9%) |
| 30 to 34 Minutes | 52 (20.7%) | 24 (8.9%) |
| 35 to 39 Minutes | 10 (4.0%) | 0 (0.0%) |
| 40 to 44 Minutes | 0 (0.0%) | 9 (3.3%) |
| 45 to 59 Minutes | 10 (4.0%) | 0 (0.0%) |
| 60 to 89 Minutes | 0 (0.0%) | 0 (0.0%) |
| 90 or more Minutes | 0 (0.0%) | 0 (0.0%) |
Time of Departure to Work by Sex in Mogul
The most frequent times of departure to work in Mogul are 7:00 AM to 7:29 AM (93, 37.0%) for males and 5:30 AM to 5:59 AM (93, 34.3%) for females.
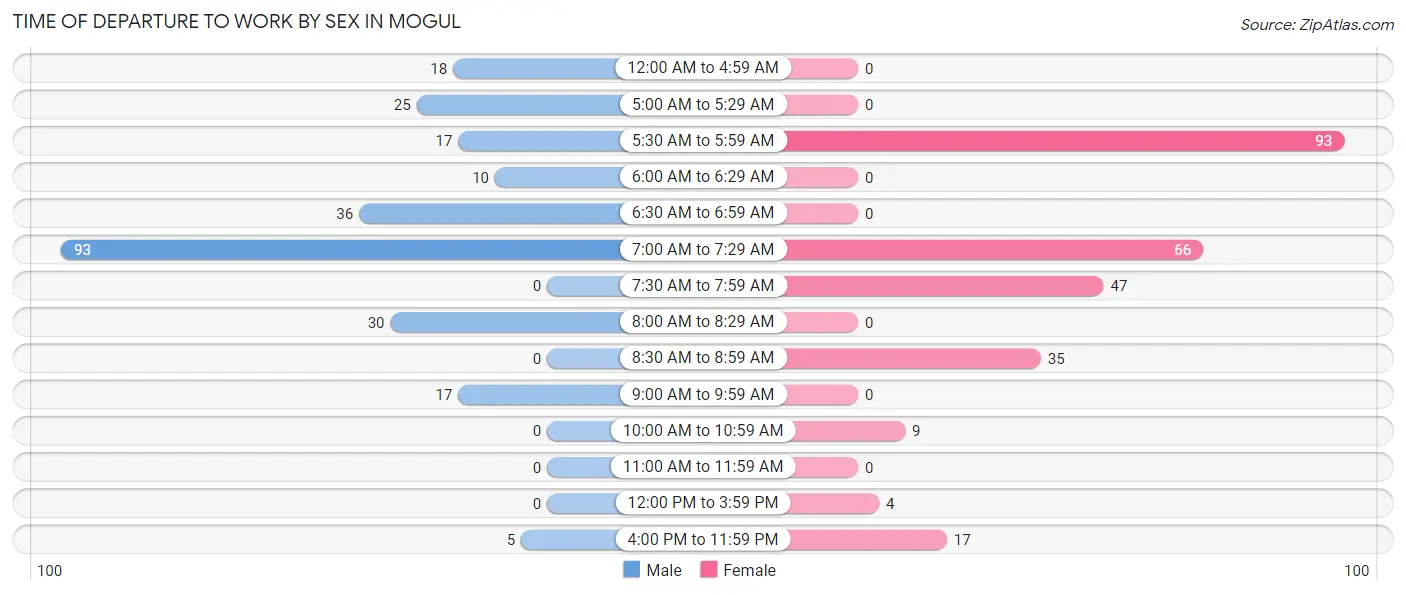
| Time of Departure | Male | Female |
| 12:00 AM to 4:59 AM | 18 (7.2%) | 0 (0.0%) |
| 5:00 AM to 5:29 AM | 25 (10.0%) | 0 (0.0%) |
| 5:30 AM to 5:59 AM | 17 (6.8%) | 93 (34.3%) |
| 6:00 AM to 6:29 AM | 10 (4.0%) | 0 (0.0%) |
| 6:30 AM to 6:59 AM | 36 (14.3%) | 0 (0.0%) |
| 7:00 AM to 7:29 AM | 93 (37.0%) | 66 (24.3%) |
| 7:30 AM to 7:59 AM | 0 (0.0%) | 47 (17.3%) |
| 8:00 AM to 8:29 AM | 30 (11.9%) | 0 (0.0%) |
| 8:30 AM to 8:59 AM | 0 (0.0%) | 35 (12.9%) |
| 9:00 AM to 9:59 AM | 17 (6.8%) | 0 (0.0%) |
| 10:00 AM to 10:59 AM | 0 (0.0%) | 9 (3.3%) |
| 11:00 AM to 11:59 AM | 0 (0.0%) | 0 (0.0%) |
| 12:00 PM to 3:59 PM | 0 (0.0%) | 4 (1.5%) |
| 4:00 PM to 11:59 PM | 5 (2.0%) | 17 (6.3%) |
| Total | 251 (100.0%) | 271 (100.0%) |
Housing Occupancy in Mogul
Occupancy by Ownership in Mogul
Of the total 515 dwellings in Mogul, owner-occupied units account for 471 (91.5%), while renter-occupied units make up 44 (8.5%).
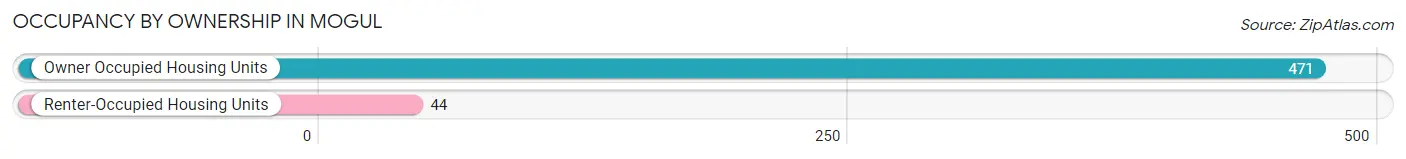
| Occupancy | # Housing Units | % Housing Units |
| Owner Occupied Housing Units | 471 | 91.5% |
| Renter-Occupied Housing Units | 44 | 8.5% |
| Total Occupied Housing Units | 515 | 100.0% |
Occupancy by Household Size in Mogul
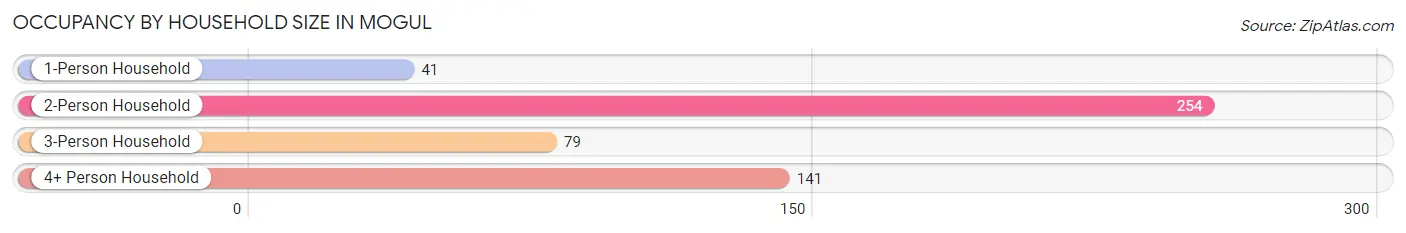
| Household Size | # Housing Units | % Housing Units |
| 1-Person Household | 41 | 8.0% |
| 2-Person Household | 254 | 49.3% |
| 3-Person Household | 79 | 15.3% |
| 4+ Person Household | 141 | 27.4% |
| Total Housing Units | 515 | 100.0% |
Occupancy by Ownership by Household Size in Mogul
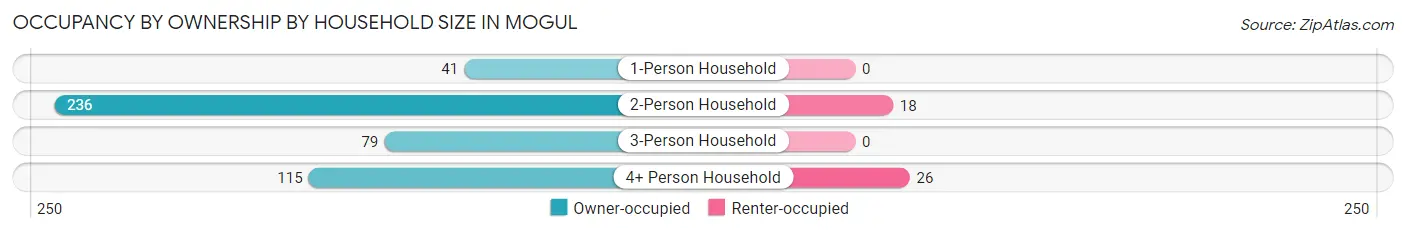
| Household Size | Owner-occupied | Renter-occupied |
| 1-Person Household | 41 (100.0%) | 0 (0.0%) |
| 2-Person Household | 236 (92.9%) | 18 (7.1%) |
| 3-Person Household | 79 (100.0%) | 0 (0.0%) |
| 4+ Person Household | 115 (81.6%) | 26 (18.4%) |
| Total Housing Units | 471 (91.5%) | 44 (8.5%) |
Occupancy by Educational Attainment in Mogul
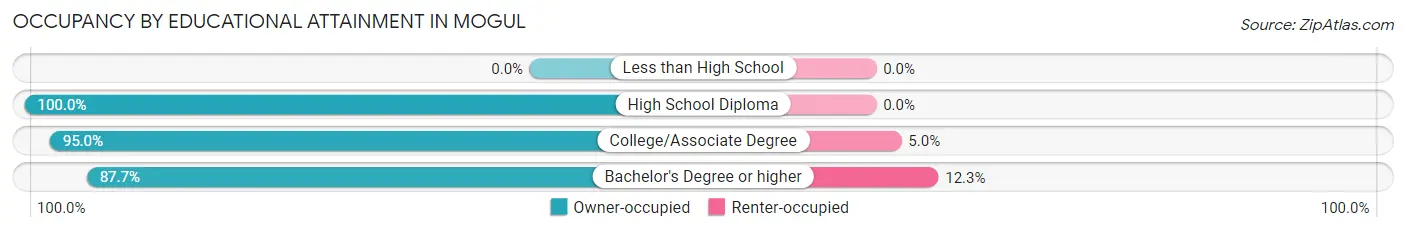
| Household Size | Owner-occupied | Renter-occupied |
| Less than High School | 0 (0.0%) | 0 (0.0%) |
| High School Diploma | 39 (100.0%) | 0 (0.0%) |
| College/Associate Degree | 190 (95.0%) | 10 (5.0%) |
| Bachelor's Degree or higher | 242 (87.7%) | 34 (12.3%) |
Occupancy by Age of Householder in Mogul
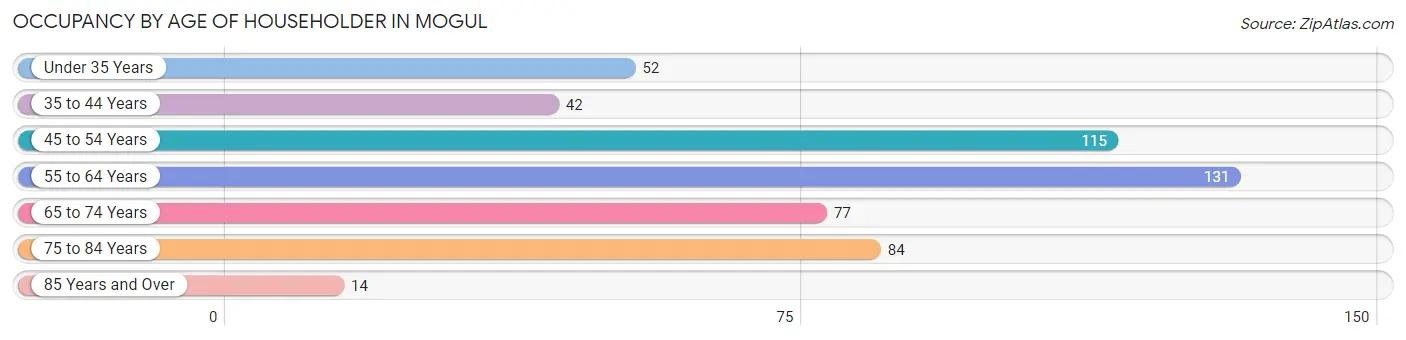
| Age Bracket | # Households | % Households |
| Under 35 Years | 52 | 10.1% |
| 35 to 44 Years | 42 | 8.2% |
| 45 to 54 Years | 115 | 22.3% |
| 55 to 64 Years | 131 | 25.4% |
| 65 to 74 Years | 77 | 14.9% |
| 75 to 84 Years | 84 | 16.3% |
| 85 Years and Over | 14 | 2.7% |
| Total | 515 | 100.0% |
Housing Finances in Mogul
Median Income by Occupancy in Mogul
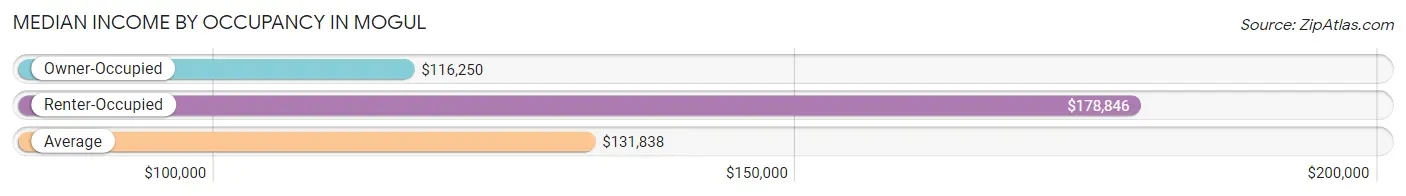
| Occupancy Type | # Households | Median Income |
| Owner-Occupied | 471 (91.5%) | $116,250 |
| Renter-Occupied | 44 (8.5%) | $178,846 |
| Average | 515 (100.0%) | $131,838 |
Occupancy by Householder Income Bracket in Mogul
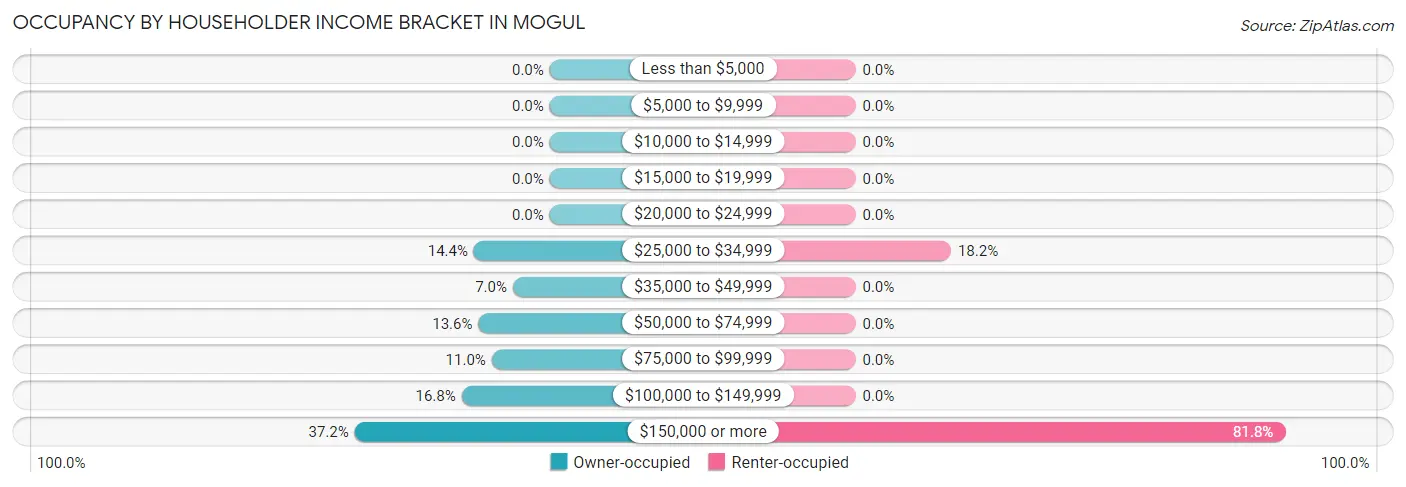
| Income Bracket | Owner-occupied | Renter-occupied |
| Less than $5,000 | 0 (0.0%) | 0 (0.0%) |
| $5,000 to $9,999 | 0 (0.0%) | 0 (0.0%) |
| $10,000 to $14,999 | 0 (0.0%) | 0 (0.0%) |
| $15,000 to $19,999 | 0 (0.0%) | 0 (0.0%) |
| $20,000 to $24,999 | 0 (0.0%) | 0 (0.0%) |
| $25,000 to $34,999 | 68 (14.4%) | 8 (18.2%) |
| $35,000 to $49,999 | 33 (7.0%) | 0 (0.0%) |
| $50,000 to $74,999 | 64 (13.6%) | 0 (0.0%) |
| $75,000 to $99,999 | 52 (11.0%) | 0 (0.0%) |
| $100,000 to $149,999 | 79 (16.8%) | 0 (0.0%) |
| $150,000 or more | 175 (37.1%) | 36 (81.8%) |
| Total | 471 (100.0%) | 44 (100.0%) |
Monthly Housing Cost Tiers in Mogul
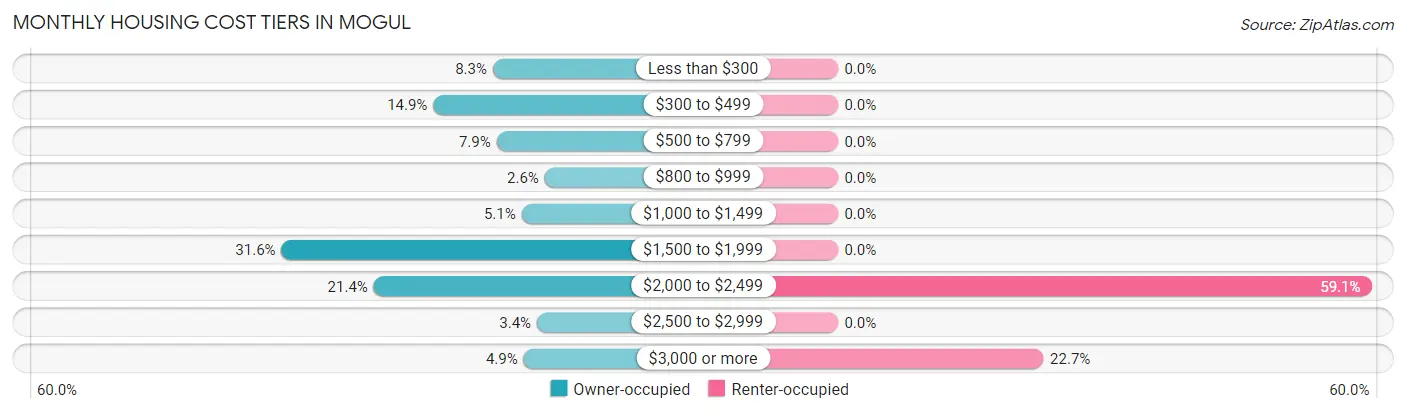
| Monthly Cost | Owner-occupied | Renter-occupied |
| Less than $300 | 39 (8.3%) | 0 (0.0%) |
| $300 to $499 | 70 (14.9%) | 0 (0.0%) |
| $500 to $799 | 37 (7.9%) | 0 (0.0%) |
| $800 to $999 | 12 (2.5%) | 0 (0.0%) |
| $1,000 to $1,499 | 24 (5.1%) | 0 (0.0%) |
| $1,500 to $1,999 | 149 (31.6%) | 0 (0.0%) |
| $2,000 to $2,499 | 101 (21.4%) | 26 (59.1%) |
| $2,500 to $2,999 | 16 (3.4%) | 0 (0.0%) |
| $3,000 or more | 23 (4.9%) | 10 (22.7%) |
| Total | 471 (100.0%) | 44 (100.0%) |
Physical Housing Characteristics in Mogul
Housing Structures in Mogul
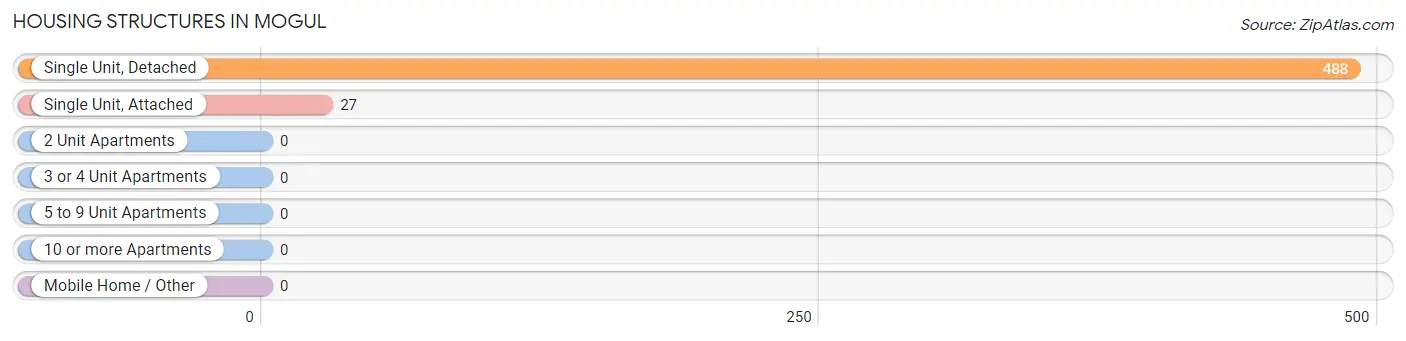
| Structure Type | # Housing Units | % Housing Units |
| Single Unit, Detached | 488 | 94.8% |
| Single Unit, Attached | 27 | 5.2% |
| 2 Unit Apartments | 0 | 0.0% |
| 3 or 4 Unit Apartments | 0 | 0.0% |
| 5 to 9 Unit Apartments | 0 | 0.0% |
| 10 or more Apartments | 0 | 0.0% |
| Mobile Home / Other | 0 | 0.0% |
| Total | 515 | 100.0% |
Housing Structures by Occupancy in Mogul
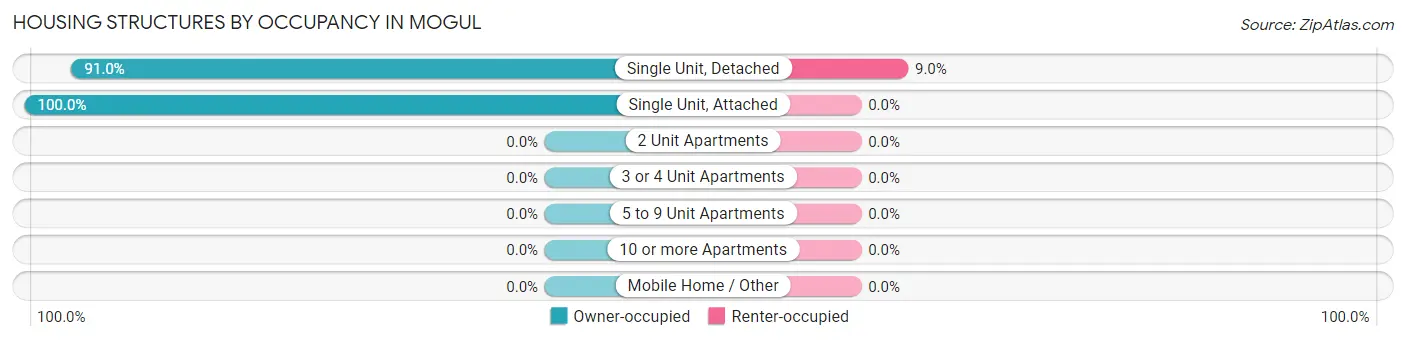
| Structure Type | Owner-occupied | Renter-occupied |
| Single Unit, Detached | 444 (91.0%) | 44 (9.0%) |
| Single Unit, Attached | 27 (100.0%) | 0 (0.0%) |
| 2 Unit Apartments | 0 (0.0%) | 0 (0.0%) |
| 3 or 4 Unit Apartments | 0 (0.0%) | 0 (0.0%) |
| 5 to 9 Unit Apartments | 0 (0.0%) | 0 (0.0%) |
| 10 or more Apartments | 0 (0.0%) | 0 (0.0%) |
| Mobile Home / Other | 0 (0.0%) | 0 (0.0%) |
| Total | 471 (91.5%) | 44 (8.5%) |
Housing Structures by Number of Rooms in Mogul
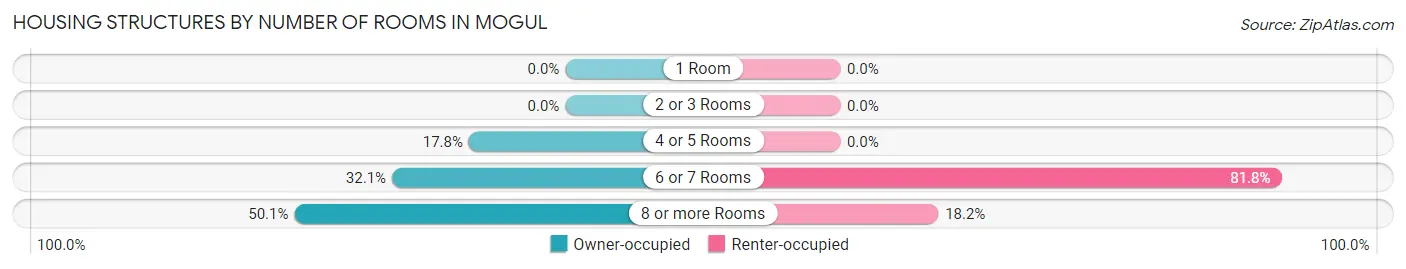
| Number of Rooms | Owner-occupied | Renter-occupied |
| 1 Room | 0 (0.0%) | 0 (0.0%) |
| 2 or 3 Rooms | 0 (0.0%) | 0 (0.0%) |
| 4 or 5 Rooms | 84 (17.8%) | 0 (0.0%) |
| 6 or 7 Rooms | 151 (32.1%) | 36 (81.8%) |
| 8 or more Rooms | 236 (50.1%) | 8 (18.2%) |
| Total | 471 (100.0%) | 44 (100.0%) |
Housing Structure by Heating Type in Mogul
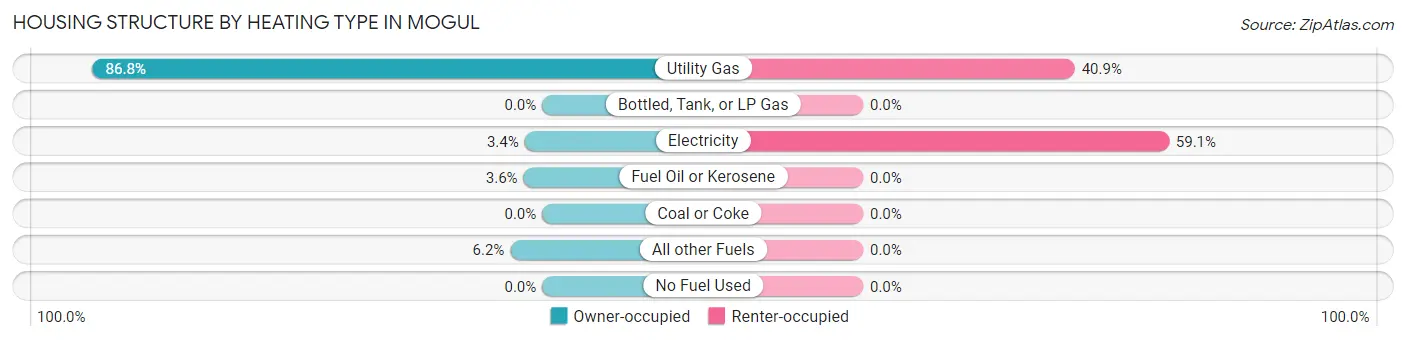
| Heating Type | Owner-occupied | Renter-occupied |
| Utility Gas | 409 (86.8%) | 18 (40.9%) |
| Bottled, Tank, or LP Gas | 0 (0.0%) | 0 (0.0%) |
| Electricity | 16 (3.4%) | 26 (59.1%) |
| Fuel Oil or Kerosene | 17 (3.6%) | 0 (0.0%) |
| Coal or Coke | 0 (0.0%) | 0 (0.0%) |
| All other Fuels | 29 (6.2%) | 0 (0.0%) |
| No Fuel Used | 0 (0.0%) | 0 (0.0%) |
| Total | 471 (100.0%) | 44 (100.0%) |
Household Vehicle Usage in Mogul
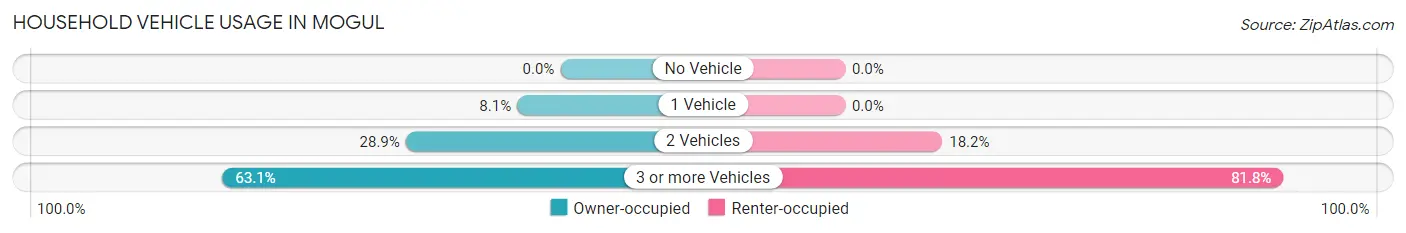
| Vehicles per Household | Owner-occupied | Renter-occupied |
| No Vehicle | 0 (0.0%) | 0 (0.0%) |
| 1 Vehicle | 38 (8.1%) | 0 (0.0%) |
| 2 Vehicles | 136 (28.9%) | 8 (18.2%) |
| 3 or more Vehicles | 297 (63.1%) | 36 (81.8%) |
| Total | 471 (100.0%) | 44 (100.0%) |
Real Estate & Mortgages in Mogul
Real Estate and Mortgage Overview in Mogul
| Characteristic | Without Mortgage | With Mortgage |
| Housing Units | 158 | 313 |
| Median Property Value | $509,100 | $598,200 |
| Median Household Income | $64,600 | $162 |
| Monthly Housing Costs | $452 | $23 |
| Real Estate Taxes | $2,216 | $17 |
Property Value by Mortgage Status in Mogul
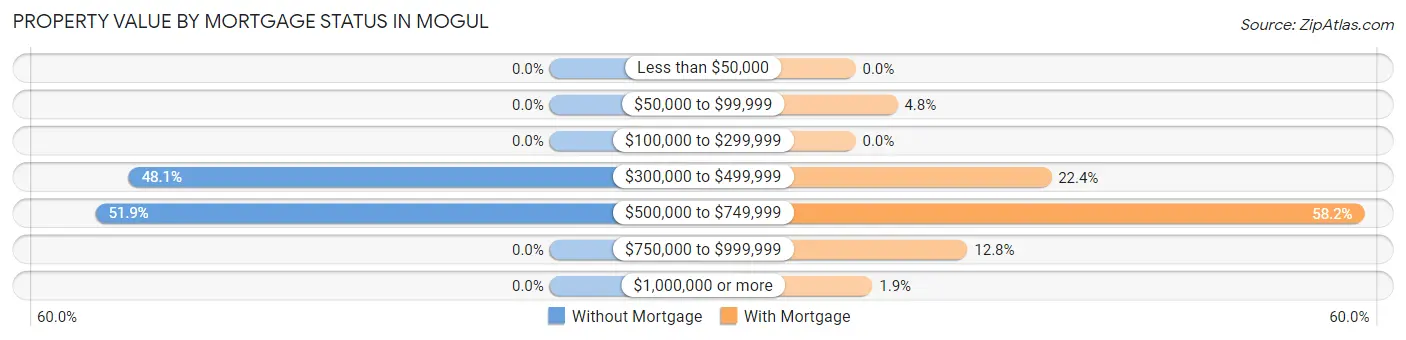
| Property Value | Without Mortgage | With Mortgage |
| Less than $50,000 | 0 (0.0%) | 0 (0.0%) |
| $50,000 to $99,999 | 0 (0.0%) | 15 (4.8%) |
| $100,000 to $299,999 | 0 (0.0%) | 0 (0.0%) |
| $300,000 to $499,999 | 76 (48.1%) | 70 (22.4%) |
| $500,000 to $749,999 | 82 (51.9%) | 182 (58.2%) |
| $750,000 to $999,999 | 0 (0.0%) | 40 (12.8%) |
| $1,000,000 or more | 0 (0.0%) | 6 (1.9%) |
| Total | 158 (100.0%) | 313 (100.0%) |
Household Income by Mortgage Status in Mogul
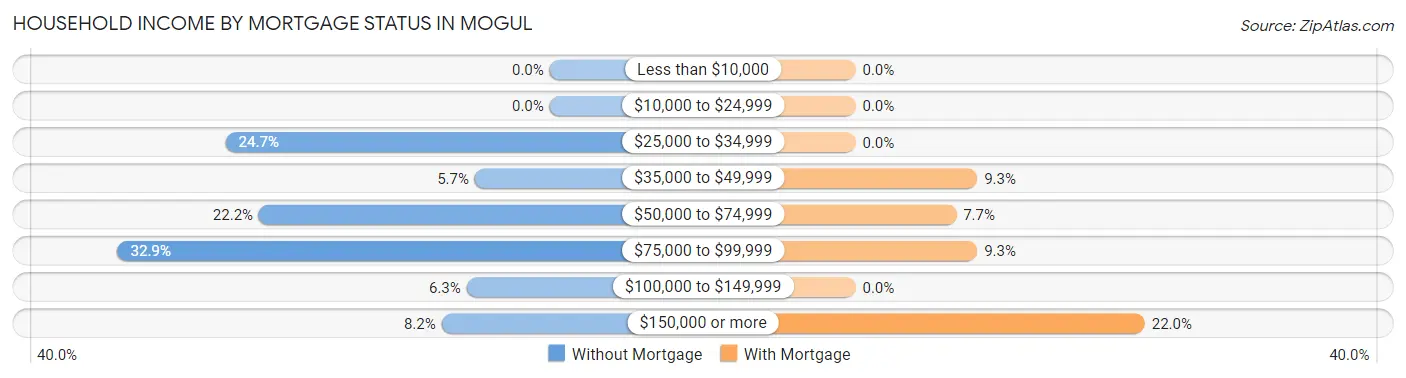
| Household Income | Without Mortgage | With Mortgage |
| Less than $10,000 | 0 (0.0%) | 0 (0.0%) |
| $10,000 to $24,999 | 0 (0.0%) | 0 (0.0%) |
| $25,000 to $34,999 | 39 (24.7%) | 0 (0.0%) |
| $35,000 to $49,999 | 9 (5.7%) | 29 (9.3%) |
| $50,000 to $74,999 | 35 (22.2%) | 24 (7.7%) |
| $75,000 to $99,999 | 52 (32.9%) | 29 (9.3%) |
| $100,000 to $149,999 | 10 (6.3%) | 0 (0.0%) |
| $150,000 or more | 13 (8.2%) | 69 (22.0%) |
| Total | 158 (100.0%) | 313 (100.0%) |
Property Value to Household Income Ratio in Mogul
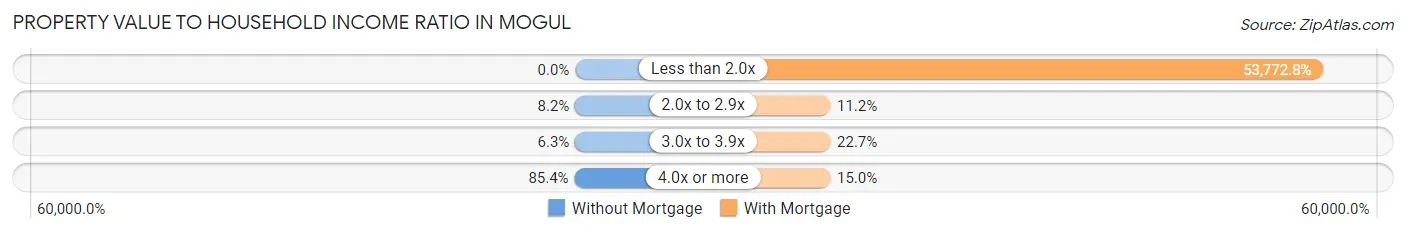
| Value-to-Income Ratio | Without Mortgage | With Mortgage |
| Less than 2.0x | 0 (0.0%) | 168,309 (53,772.8%) |
| 2.0x to 2.9x | 13 (8.2%) | 35 (11.2%) |
| 3.0x to 3.9x | 10 (6.3%) | 71 (22.7%) |
| 4.0x or more | 135 (85.4%) | 47 (15.0%) |
| Total | 158 (100.0%) | 313 (100.0%) |
Real Estate Taxes by Mortgage Status in Mogul
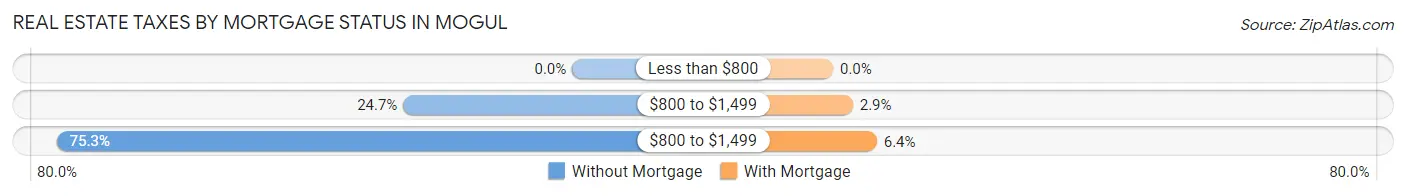
| Property Taxes | Without Mortgage | With Mortgage |
| Less than $800 | 0 (0.0%) | 0 (0.0%) |
| $800 to $1,499 | 39 (24.7%) | 9 (2.9%) |
| $800 to $1,499 | 119 (75.3%) | 20 (6.4%) |
| Total | 158 (100.0%) | 313 (100.0%) |
Health & Disability in Mogul
Health Insurance Coverage by Age in Mogul
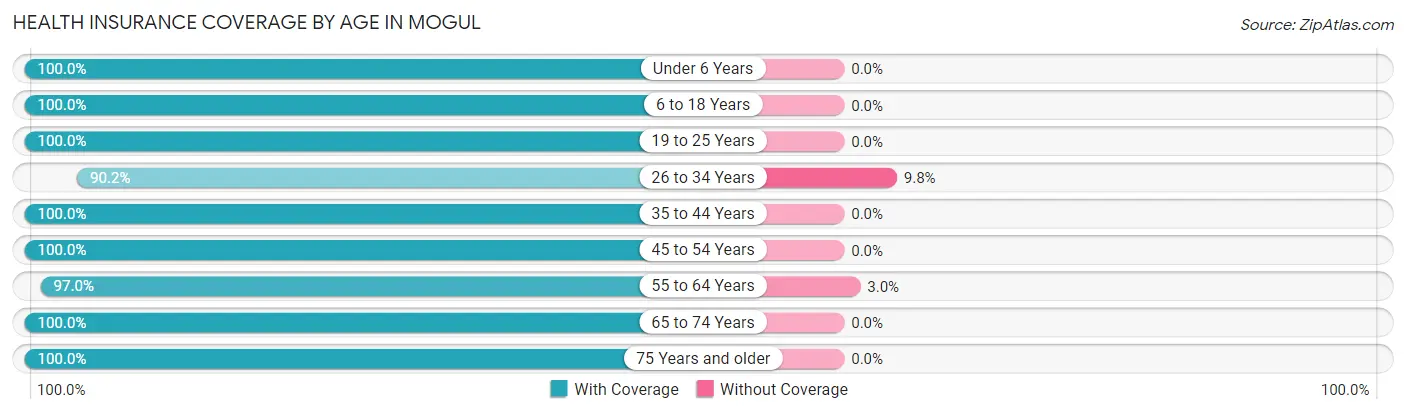
| Age Bracket | With Coverage | Without Coverage |
| Under 6 Years | 73 (100.0%) | 0 (0.0%) |
| 6 to 18 Years | 214 (100.0%) | 0 (0.0%) |
| 19 to 25 Years | 24 (100.0%) | 0 (0.0%) |
| 26 to 34 Years | 92 (90.2%) | 10 (9.8%) |
| 35 to 44 Years | 112 (100.0%) | 0 (0.0%) |
| 45 to 54 Years | 201 (100.0%) | 0 (0.0%) |
| 55 to 64 Years | 226 (97.0%) | 7 (3.0%) |
| 65 to 74 Years | 177 (100.0%) | 0 (0.0%) |
| 75 Years and older | 179 (100.0%) | 0 (0.0%) |
| Total | 1,298 (98.7%) | 17 (1.3%) |
Health Insurance Coverage by Citizenship Status in Mogul
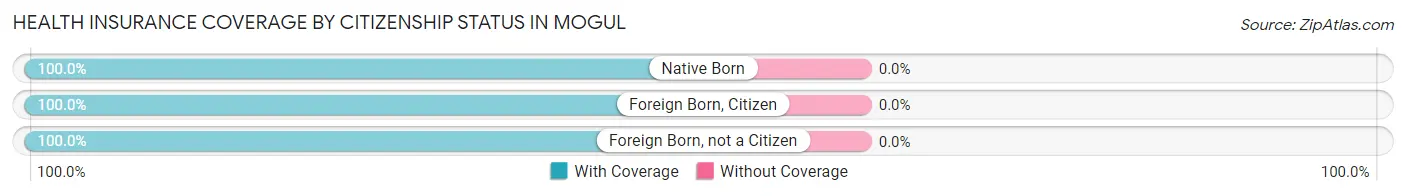
| Citizenship Status | With Coverage | Without Coverage |
| Native Born | 73 (100.0%) | 0 (0.0%) |
| Foreign Born, Citizen | 214 (100.0%) | 0 (0.0%) |
| Foreign Born, not a Citizen | 24 (100.0%) | 0 (0.0%) |
Health Insurance Coverage by Household Income in Mogul
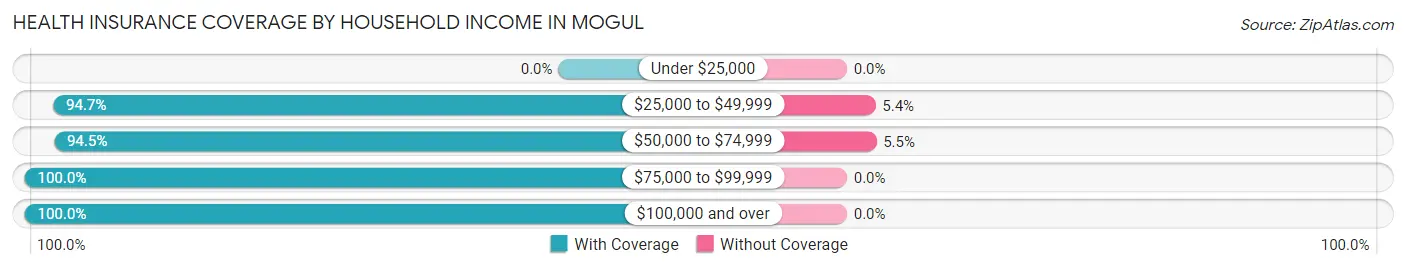
| Household Income | With Coverage | Without Coverage |
| Under $25,000 | 0 (0.0%) | 0 (0.0%) |
| $25,000 to $49,999 | 177 (94.7%) | 10 (5.3%) |
| $50,000 to $74,999 | 120 (94.5%) | 7 (5.5%) |
| $75,000 to $99,999 | 110 (100.0%) | 0 (0.0%) |
| $100,000 and over | 891 (100.0%) | 0 (0.0%) |
Public vs Private Health Insurance Coverage by Age in Mogul
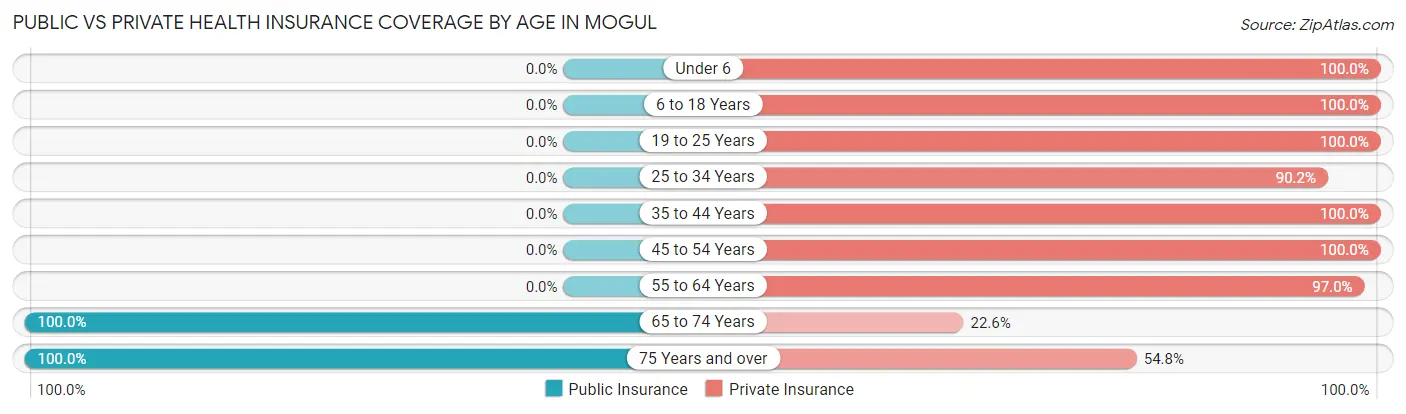
| Age Bracket | Public Insurance | Private Insurance |
| Under 6 | 0 (0.0%) | 73 (100.0%) |
| 6 to 18 Years | 0 (0.0%) | 214 (100.0%) |
| 19 to 25 Years | 0 (0.0%) | 24 (100.0%) |
| 25 to 34 Years | 0 (0.0%) | 92 (90.2%) |
| 35 to 44 Years | 0 (0.0%) | 112 (100.0%) |
| 45 to 54 Years | 0 (0.0%) | 201 (100.0%) |
| 55 to 64 Years | 0 (0.0%) | 226 (97.0%) |
| 65 to 74 Years | 177 (100.0%) | 40 (22.6%) |
| 75 Years and over | 179 (100.0%) | 98 (54.7%) |
| Total | 356 (27.1%) | 1,080 (82.1%) |
Disability Status by Sex by Age in Mogul
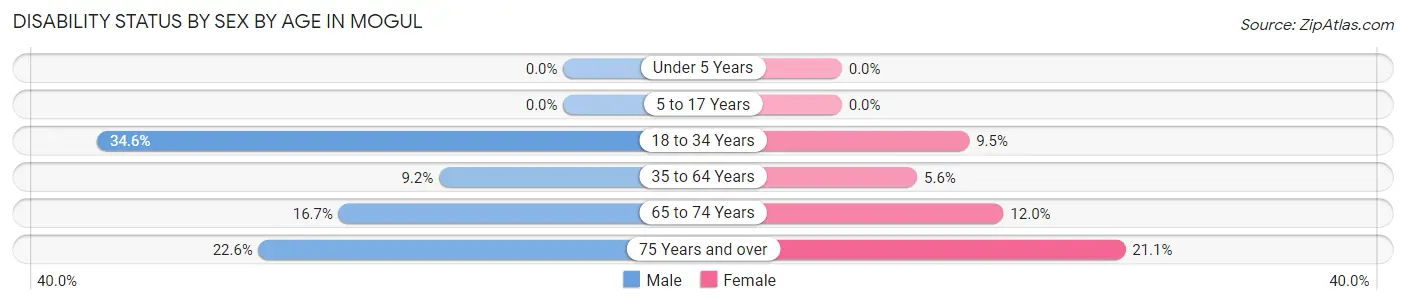
| Age Bracket | Male | Female |
| Under 5 Years | 0 (0.0%) | 0 (0.0%) |
| 5 to 17 Years | 0 (0.0%) | 0 (0.0%) |
| 18 to 34 Years | 18 (34.6%) | 7 (9.5%) |
| 35 to 64 Years | 24 (9.2%) | 16 (5.6%) |
| 65 to 74 Years | 17 (16.7%) | 9 (12.0%) |
| 75 Years and over | 19 (22.6%) | 20 (21.0%) |
Disability Class by Sex by Age in Mogul
Disability Class: Hearing Difficulty
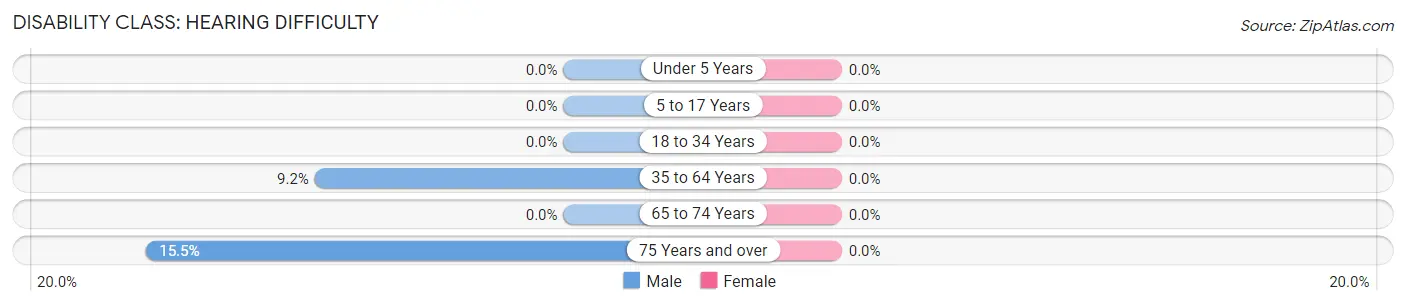
| Age Bracket | Male | Female |
| Under 5 Years | 0 (0.0%) | 0 (0.0%) |
| 5 to 17 Years | 0 (0.0%) | 0 (0.0%) |
| 18 to 34 Years | 0 (0.0%) | 0 (0.0%) |
| 35 to 64 Years | 24 (9.2%) | 0 (0.0%) |
| 65 to 74 Years | 0 (0.0%) | 0 (0.0%) |
| 75 Years and over | 13 (15.5%) | 0 (0.0%) |
Disability Class: Vision Difficulty
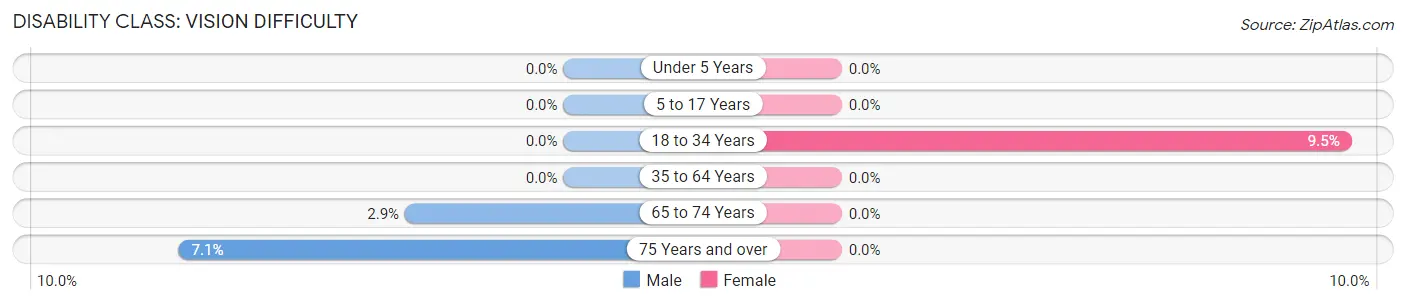
| Age Bracket | Male | Female |
| Under 5 Years | 0 (0.0%) | 0 (0.0%) |
| 5 to 17 Years | 0 (0.0%) | 0 (0.0%) |
| 18 to 34 Years | 0 (0.0%) | 7 (9.5%) |
| 35 to 64 Years | 0 (0.0%) | 0 (0.0%) |
| 65 to 74 Years | 3 (2.9%) | 0 (0.0%) |
| 75 Years and over | 6 (7.1%) | 0 (0.0%) |
Disability Class: Cognitive Difficulty
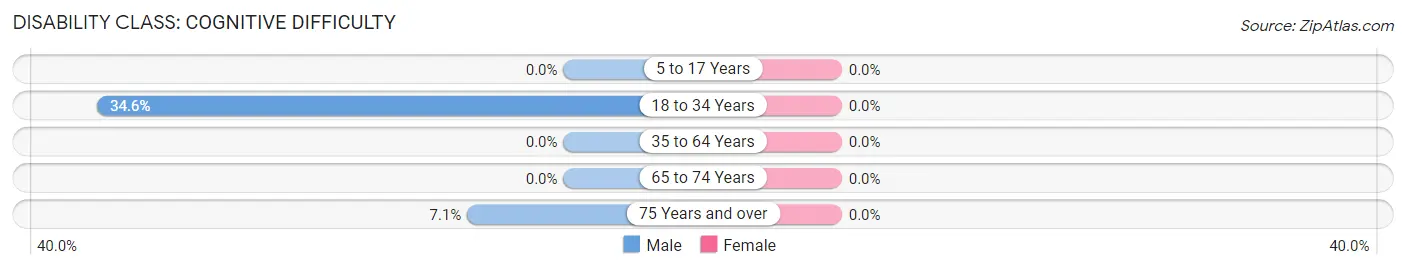
| Age Bracket | Male | Female |
| 5 to 17 Years | 0 (0.0%) | 0 (0.0%) |
| 18 to 34 Years | 18 (34.6%) | 0 (0.0%) |
| 35 to 64 Years | 0 (0.0%) | 0 (0.0%) |
| 65 to 74 Years | 0 (0.0%) | 0 (0.0%) |
| 75 Years and over | 6 (7.1%) | 0 (0.0%) |
Disability Class: Ambulatory Difficulty
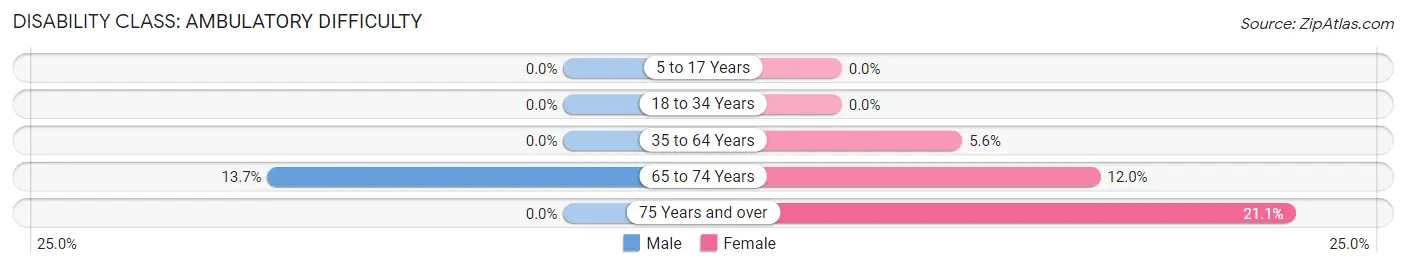
| Age Bracket | Male | Female |
| 5 to 17 Years | 0 (0.0%) | 0 (0.0%) |
| 18 to 34 Years | 0 (0.0%) | 0 (0.0%) |
| 35 to 64 Years | 0 (0.0%) | 16 (5.6%) |
| 65 to 74 Years | 14 (13.7%) | 9 (12.0%) |
| 75 Years and over | 0 (0.0%) | 20 (21.0%) |
Disability Class: Self-Care Difficulty
| Age Bracket | Male | Female |
| 5 to 17 Years | 0 (0.0%) | 0 (0.0%) |
| 18 to 34 Years | 0 (0.0%) | 0 (0.0%) |
| 35 to 64 Years | 0 (0.0%) | 0 (0.0%) |
| 65 to 74 Years | 0 (0.0%) | 0 (0.0%) |
| 75 Years and over | 0 (0.0%) | 0 (0.0%) |
Technology Access in Mogul
Computing Device Access in Mogul
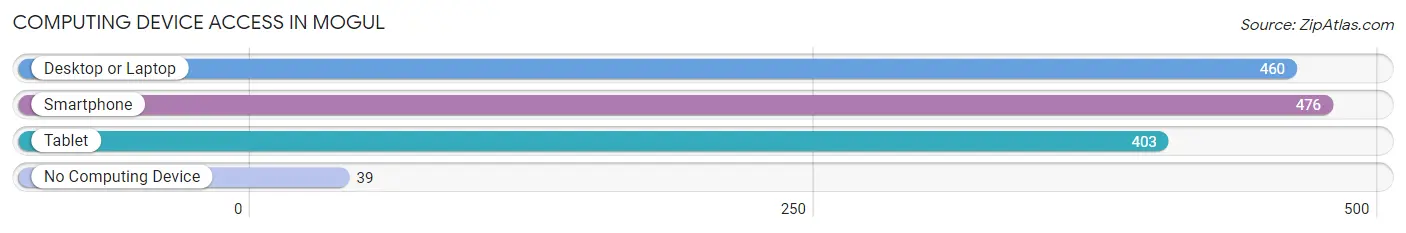
| Device Type | # Households | % Households |
| Desktop or Laptop | 460 | 89.3% |
| Smartphone | 476 | 92.4% |
| Tablet | 403 | 78.2% |
| No Computing Device | 39 | 7.6% |
| Total | 515 | 100.0% |
Internet Access in Mogul
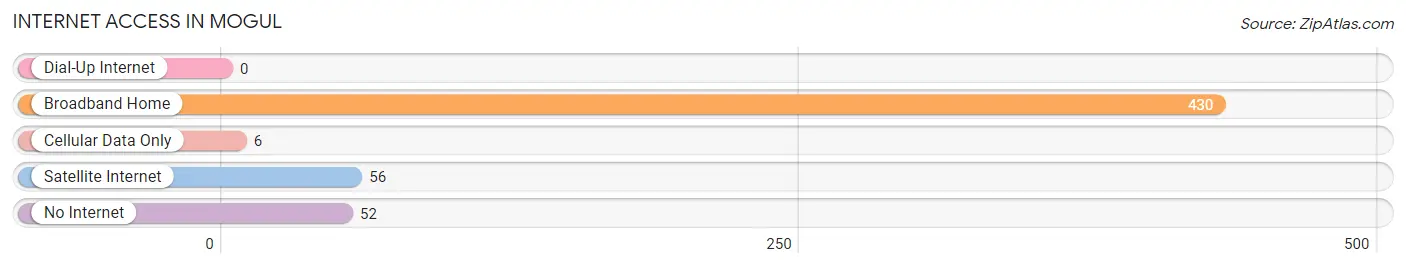
| Internet Type | # Households | % Households |
| Dial-Up Internet | 0 | 0.0% |
| Broadband Home | 430 | 83.5% |
| Cellular Data Only | 6 | 1.2% |
| Satellite Internet | 56 | 10.9% |
| No Internet | 52 | 10.1% |
| Total | 515 | 100.0% |
Mogul Summary
Mogul is an unincorporated town located in Washoe County, Nevada. It is situated in the Truckee Meadows area of the Reno-Sparks metropolitan area, approximately 8 miles east of Reno. The town is located in the foothills of the Sierra Nevada mountain range, and is surrounded by the Truckee River to the north and the Steamboat Creek to the south.
Geography
Mogul is located in the foothills of the Sierra Nevada mountain range, at an elevation of 4,890 feet. The town is situated in the Truckee Meadows area of the Reno-Sparks metropolitan area, approximately 8 miles east of Reno. The town is surrounded by the Truckee River to the north and the Steamboat Creek to the south. The terrain is mostly flat, with some rolling hills. The climate is semi-arid, with hot summers and cold winters.
Economy
Mogul’s economy is largely based on tourism and gaming. The town is home to several casinos, including the Grand Sierra Resort and Casino, the Silver Legacy Resort and Casino, and the Peppermill Casino. The town also has several restaurants, bars, and shops. In addition, Mogul is home to several industrial and manufacturing businesses, including a large paper mill and a plastics factory.
Demographics
As of the 2010 census, Mogul had a population of 1,845. The racial makeup of the town was 79.3% White, 8.2% Hispanic or Latino, 6.2% Asian, 4.2% African American, and 2.1% Native American. The median household income was $50,945, and the median family income was $60,945. The per capita income was $25,945.
History
Mogul was founded in the late 19th century as a mining town. The town was named after the Mogul Mine, which was located nearby. The mine was established in 1872 and was one of the largest producers of silver and gold in the area. The town grew rapidly in the early 20th century, and by the 1950s it had become a popular tourist destination. In the late 20th century, the town began to transition to a more service-based economy, with the opening of several casinos and other businesses.
Common Questions
What is Per Capita Income in Mogul?
Per Capita income in Mogul is $46,794.
What is the Median Family Income in Mogul?
Median Family Income in Mogul is $143,103.
What is the Median Household income in Mogul?
Median Household Income in Mogul is $131,838.
What is Inequality or Gini Index in Mogul?
Inequality or Gini Index in Mogul is 0.32.
What is the Total Population of Mogul?
Total Population of Mogul is 1,315.
What is the Total Male Population of Mogul?
Total Male Population of Mogul is 716.
What is the Total Female Population of Mogul?
Total Female Population of Mogul is 599.
What is the Ratio of Males per 100 Females in Mogul?
There are 119.53 Males per 100 Females in Mogul.
What is the Ratio of Females per 100 Males in Mogul?
There are 83.66 Females per 100 Males in Mogul.
What is the Median Population Age in Mogul?
Median Population Age in Mogul is 48.7 Years.
What is the Average Family Size in Mogul
Average Family Size in Mogul is 2.7 People.
What is the Average Household Size in Mogul
Average Household Size in Mogul is 2.5 People.
How Large is the Labor Force in Mogul?
There are 567 People in the Labor Forcein in Mogul.
What is the Percentage of People in the Labor Force in Mogul?
54.9% of People are in the Labor Force in Mogul.
What is the Unemployment Rate in Mogul?
Unemployment Rate in Mogul is 2.5%.