Osino, NV Map & Demographics
Osino Map
Osino Overview
$30,816
PER CAPITA INCOME
$111,442
AVG FAMILY INCOME
$101,532
AVG HOUSEHOLD INCOME
0.28
INEQUALITY / GINI INDEX
1,051
TOTAL POPULATION
567
MALE POPULATION
484
FEMALE POPULATION
117.15
MALES / 100 FEMALES
85.36
FEMALES / 100 MALES
25.1
MEDIAN AGE
3.5
AVG FAMILY SIZE
3.2
AVG HOUSEHOLD SIZE
277
LABOR FORCE [ PEOPLE ]
46.6%
PERCENT IN LABOR FORCE
Income in Osino
Income Overview in Osino
Per Capita Income in Osino is $30,816, while median incomes of families and households are $111,442 and $101,532 respectively.
| Characteristic | Number | Measure |
| Per Capita Income | 1,051 | $30,816 |
| Median Family Income | 285 | $111,442 |
| Mean Family Income | 285 | $103,882 |
| Median Household Income | 324 | $101,532 |
| Mean Household Income | 324 | $93,929 |
| Income Deficit | 285 | $0 |
| Wage / Income Gap (%) | 1,051 | 0.00% |
| Wage / Income Gap ($) | 1,051 | 100.00¢ per $1 |
| Gini / Inequality Index | 1,051 | 0.28 |
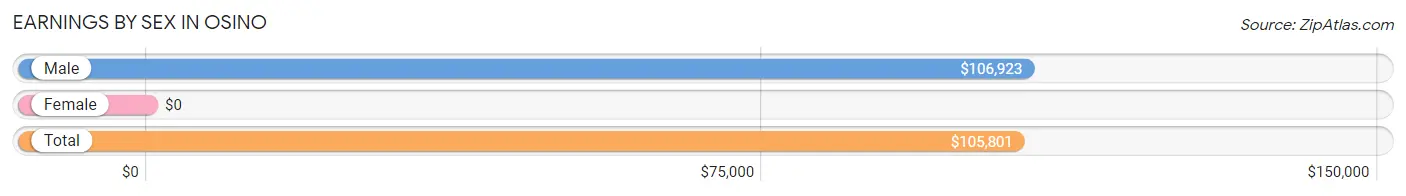
Earnings by Sex in Osino
| Sex | Number | Average Earnings |
| Male | 242 (87.4%) | $106,923 |
| Female | 35 (12.6%) | $0 |
| Total | 277 (100.0%) | $105,801 |
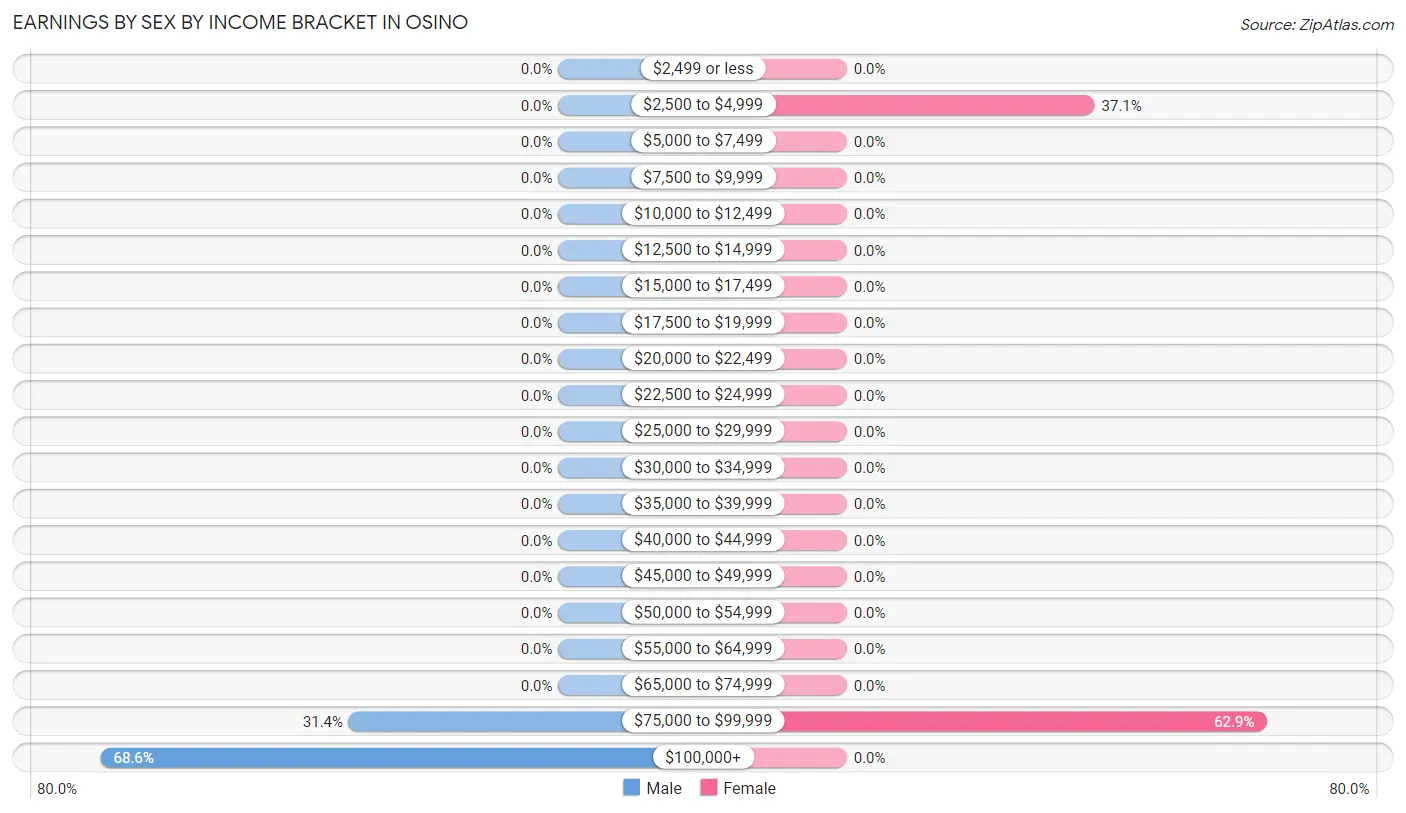
Earnings by Sex by Income Bracket in Osino
The most common earnings brackets in Osino are $100,000+ for men (166 | 68.6%) and $75,000 to $99,999 for women (22 | 62.9%).
| Income | Male | Female |
| $2,499 or less | 0 (0.0%) | 0 (0.0%) |
| $2,500 to $4,999 | 0 (0.0%) | 13 (37.1%) |
| $5,000 to $7,499 | 0 (0.0%) | 0 (0.0%) |
| $7,500 to $9,999 | 0 (0.0%) | 0 (0.0%) |
| $10,000 to $12,499 | 0 (0.0%) | 0 (0.0%) |
| $12,500 to $14,999 | 0 (0.0%) | 0 (0.0%) |
| $15,000 to $17,499 | 0 (0.0%) | 0 (0.0%) |
| $17,500 to $19,999 | 0 (0.0%) | 0 (0.0%) |
| $20,000 to $22,499 | 0 (0.0%) | 0 (0.0%) |
| $22,500 to $24,999 | 0 (0.0%) | 0 (0.0%) |
| $25,000 to $29,999 | 0 (0.0%) | 0 (0.0%) |
| $30,000 to $34,999 | 0 (0.0%) | 0 (0.0%) |
| $35,000 to $39,999 | 0 (0.0%) | 0 (0.0%) |
| $40,000 to $44,999 | 0 (0.0%) | 0 (0.0%) |
| $45,000 to $49,999 | 0 (0.0%) | 0 (0.0%) |
| $50,000 to $54,999 | 0 (0.0%) | 0 (0.0%) |
| $55,000 to $64,999 | 0 (0.0%) | 0 (0.0%) |
| $65,000 to $74,999 | 0 (0.0%) | 0 (0.0%) |
| $75,000 to $99,999 | 76 (31.4%) | 22 (62.9%) |
| $100,000+ | 166 (68.6%) | 0 (0.0%) |
| Total | 242 (100.0%) | 35 (100.0%) |
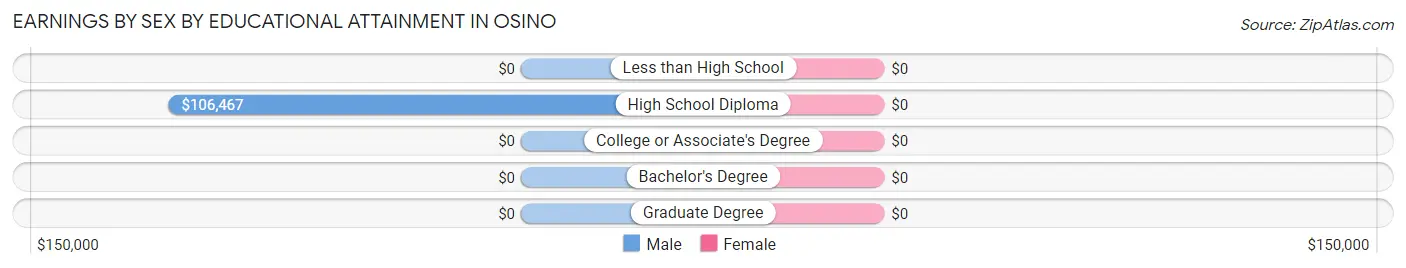
Earnings by Sex by Educational Attainment in Osino
| Educational Attainment | Male Income | Female Income |
| Less than High School | - | - |
| High School Diploma | $106,467 | $0 |
| College or Associate's Degree | - | - |
| Bachelor's Degree | - | - |
| Graduate Degree | - | - |
| Total | $106,923 | $0 |
Family Income in Osino
Family Income Brackets in Osino
According to the Osino family income data, there are 158 families falling into the $100,000 to $149,999 income range, which is the most common income bracket and makes up 55.4% of all families.
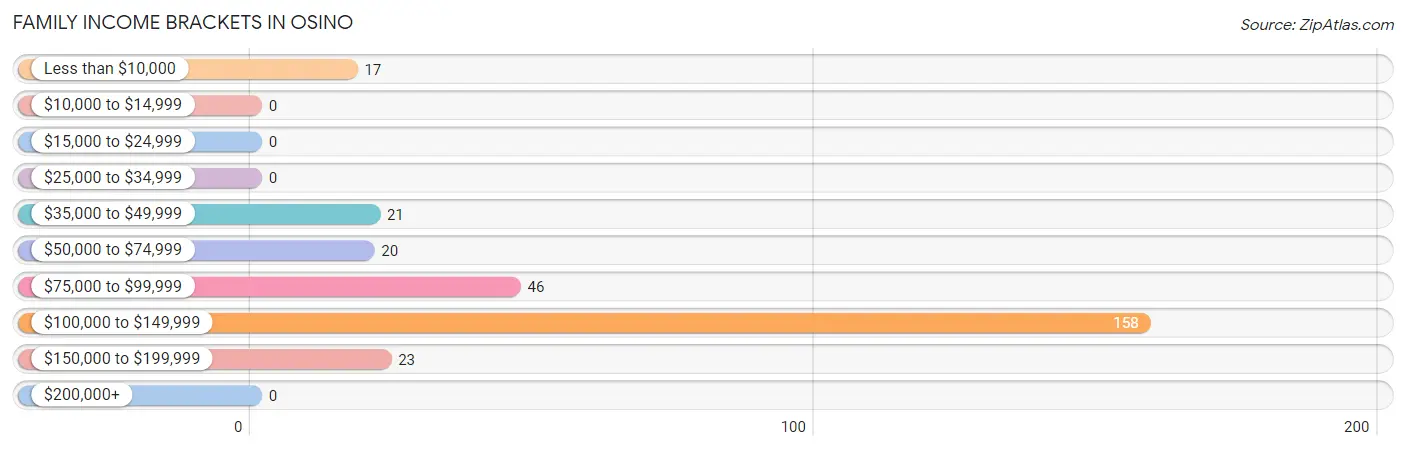
| Income Bracket | # Families | % Families |
| Less than $10,000 | 17 | 6.0% |
| $10,000 to $14,999 | 0 | 0.0% |
| $15,000 to $24,999 | 0 | 0.0% |
| $25,000 to $34,999 | 0 | 0.0% |
| $35,000 to $49,999 | 21 | 7.4% |
| $50,000 to $74,999 | 20 | 7.0% |
| $75,000 to $99,999 | 46 | 16.1% |
| $100,000 to $149,999 | 158 | 55.4% |
| $150,000 to $199,999 | 23 | 8.1% |
| $200,000+ | 0 | 0.0% |
Family Income by Famaliy Size in Osino
3-person families (149 | 52.3%) account for the highest median family income in Osino with $128,645 per family, while 3-person families (149 | 52.3%) have the highest median income of $42,882 per family member.
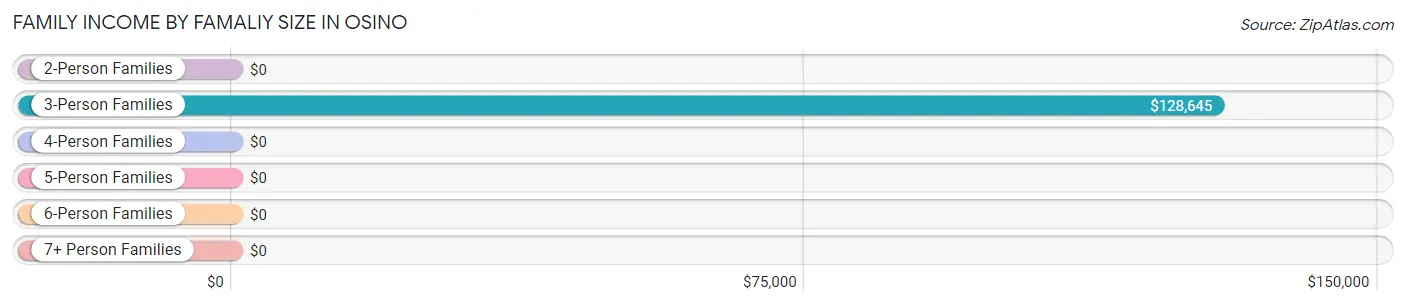
| Income Bracket | # Families | Median Income |
| 2-Person Families | 56 (19.7%) | $0 |
| 3-Person Families | 149 (52.3%) | $128,645 |
| 4-Person Families | 59 (20.7%) | $0 |
| 5-Person Families | 0 (0.0%) | $0 |
| 6-Person Families | 21 (7.4%) | $0 |
| 7+ Person Families | 0 (0.0%) | $0 |
| Total | 285 (100.0%) | $111,442 |
Family Income by Number of Earners in Osino
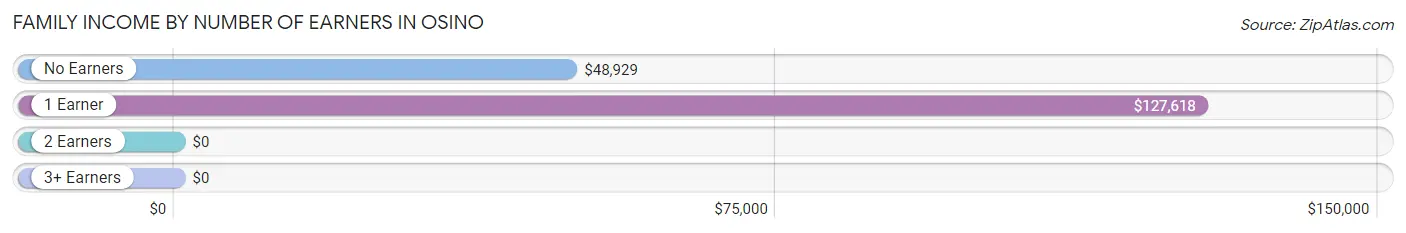
| Number of Earners | # Families | Median Income |
| No Earners | 58 (20.3%) | $48,929 |
| 1 Earner | 191 (67.0%) | $127,618 |
| 2 Earners | 36 (12.6%) | $0 |
| 3+ Earners | 0 (0.0%) | $0 |
| Total | 285 (100.0%) | $111,442 |
Household Income in Osino
Household Income Brackets in Osino
With 158 households falling in the category, the $100,000 to $149,999 income range is the most frequent in Osino, accounting for 48.8% of all households.
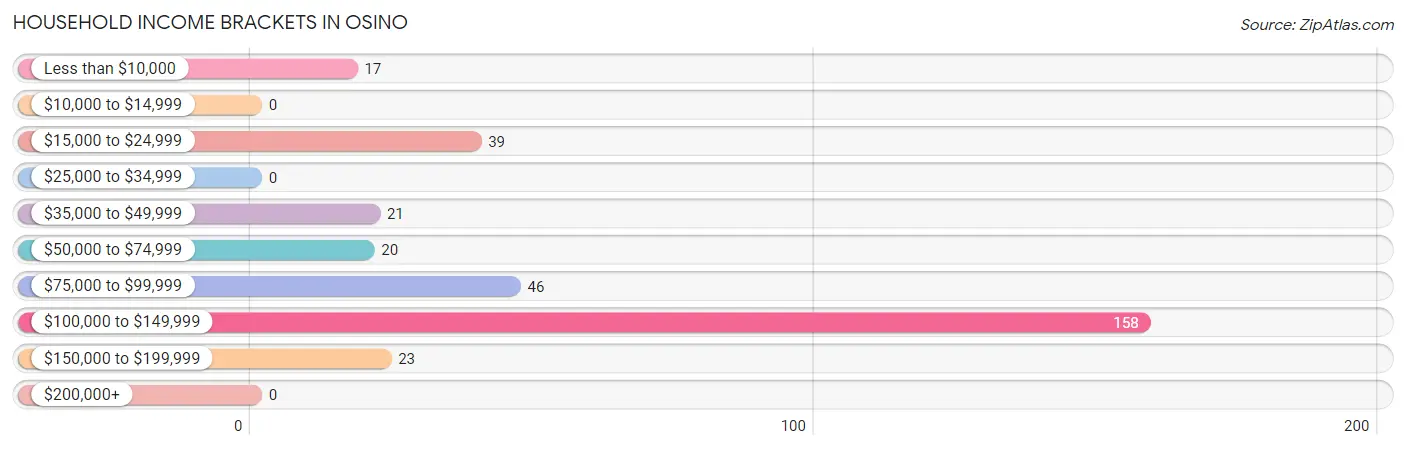
| Income Bracket | # Households | % Households |
| Less than $10,000 | 17 | 5.2% |
| $10,000 to $14,999 | 0 | 0.0% |
| $15,000 to $24,999 | 39 | 12.0% |
| $25,000 to $34,999 | 0 | 0.0% |
| $35,000 to $49,999 | 21 | 6.5% |
| $50,000 to $74,999 | 20 | 6.2% |
| $75,000 to $99,999 | 46 | 14.2% |
| $100,000 to $149,999 | 158 | 48.8% |
| $150,000 to $199,999 | 23 | 7.1% |
| $200,000+ | 0 | 0.0% |
Household Income by Householder Age in Osino
The median household income in Osino is $101,532, with the highest median household income of $127,921 found in the 25 to 44 years age bracket for the primary householder. A total of 158 households (48.8%) fall into this category.
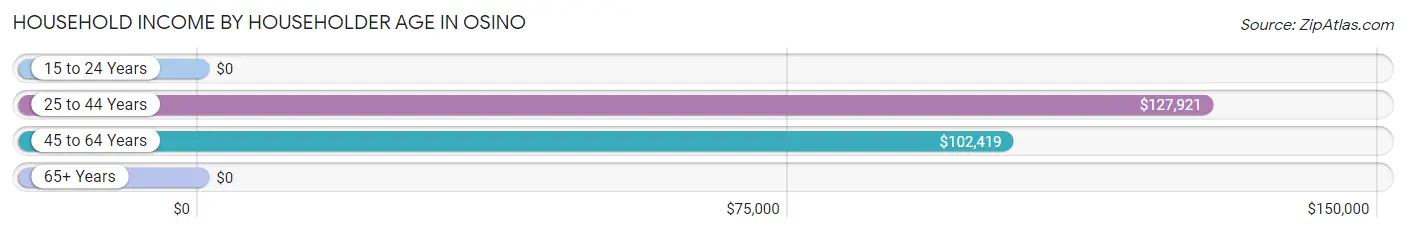
| Income Bracket | # Households | Median Income |
| 15 to 24 Years | 0 (0.0%) | $0 |
| 25 to 44 Years | 158 (48.8%) | $127,921 |
| 45 to 64 Years | 102 (31.5%) | $102,419 |
| 65+ Years | 64 (19.8%) | $0 |
| Total | 324 (100.0%) | $101,532 |
Poverty in Osino
Income Below Poverty by Sex and Age in Osino
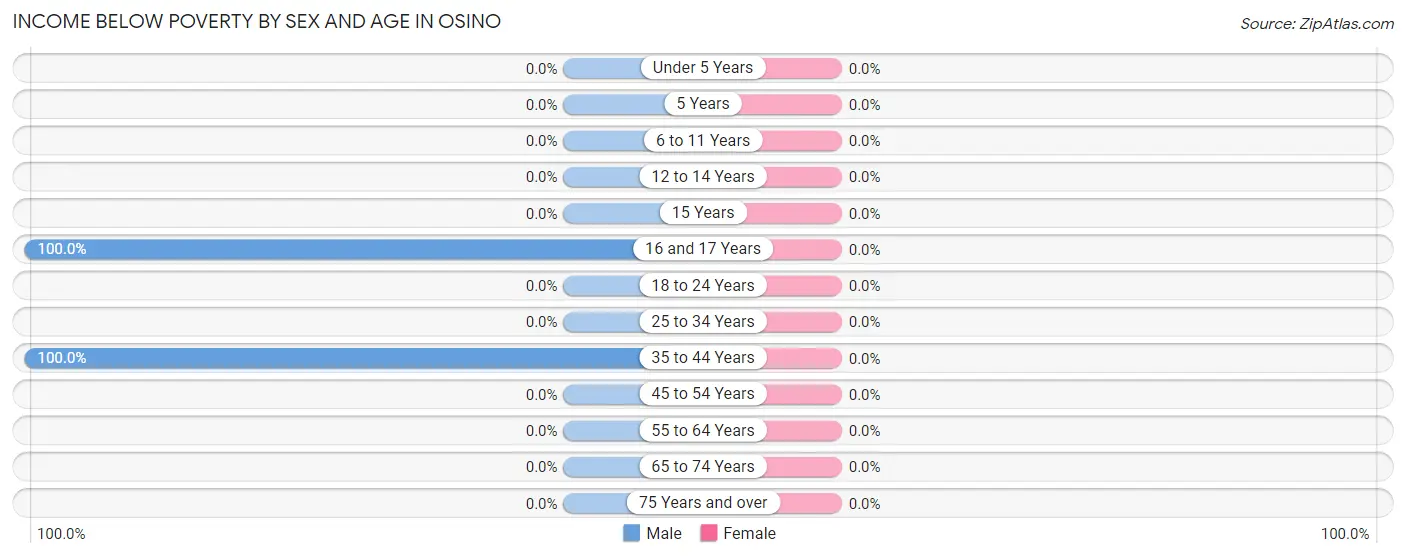
| Age Bracket | Male | Female |
| Under 5 Years | 0 (0.0%) | 0 (0.0%) |
| 5 Years | 0 (0.0%) | 0 (0.0%) |
| 6 to 11 Years | 0 (0.0%) | 0 (0.0%) |
| 12 to 14 Years | 0 (0.0%) | 0 (0.0%) |
| 15 Years | 0 (0.0%) | 0 (0.0%) |
| 16 and 17 Years | 6 (100.0%) | 0 (0.0%) |
| 18 to 24 Years | 0 (0.0%) | 0 (0.0%) |
| 25 to 34 Years | 0 (0.0%) | 0 (0.0%) |
| 35 to 44 Years | 17 (100.0%) | 0 (0.0%) |
| 45 to 54 Years | 0 (0.0%) | 0 (0.0%) |
| 55 to 64 Years | 0 (0.0%) | 0 (0.0%) |
| 65 to 74 Years | 0 (0.0%) | 0 (0.0%) |
| 75 Years and over | 0 (0.0%) | 0 (0.0%) |
| Total | 23 (4.1%) | 0 (0.0%) |
Income Above Poverty by Sex and Age in Osino
According to the poverty statistics in Osino, males aged under 5 years and females aged under 5 years are the age groups that are most secure financially, with 100.0% of males and 100.0% of females in these age groups living above the poverty line.
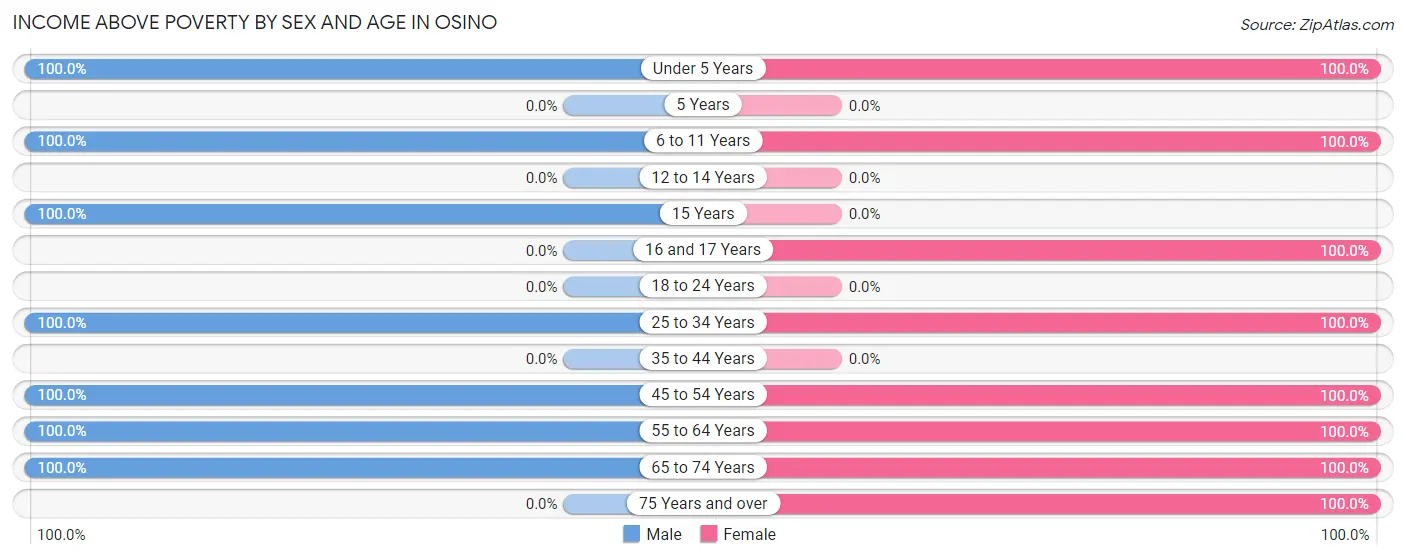
| Age Bracket | Male | Female |
| Under 5 Years | 24 (100.0%) | 127 (100.0%) |
| 5 Years | 0 (0.0%) | 0 (0.0%) |
| 6 to 11 Years | 214 (100.0%) | 73 (100.0%) |
| 12 to 14 Years | 0 (0.0%) | 0 (0.0%) |
| 15 Years | 19 (100.0%) | 0 (0.0%) |
| 16 and 17 Years | 0 (0.0%) | 47 (100.0%) |
| 18 to 24 Years | 0 (0.0%) | 0 (0.0%) |
| 25 to 34 Years | 141 (100.0%) | 74 (100.0%) |
| 35 to 44 Years | 0 (0.0%) | 0 (0.0%) |
| 45 to 54 Years | 69 (100.0%) | 66 (100.0%) |
| 55 to 64 Years | 42 (100.0%) | 35 (100.0%) |
| 65 to 74 Years | 35 (100.0%) | 23 (100.0%) |
| 75 Years and over | 0 (0.0%) | 39 (100.0%) |
| Total | 544 (95.9%) | 484 (100.0%) |
Income Below Poverty Among Married-Couple Families in Osino
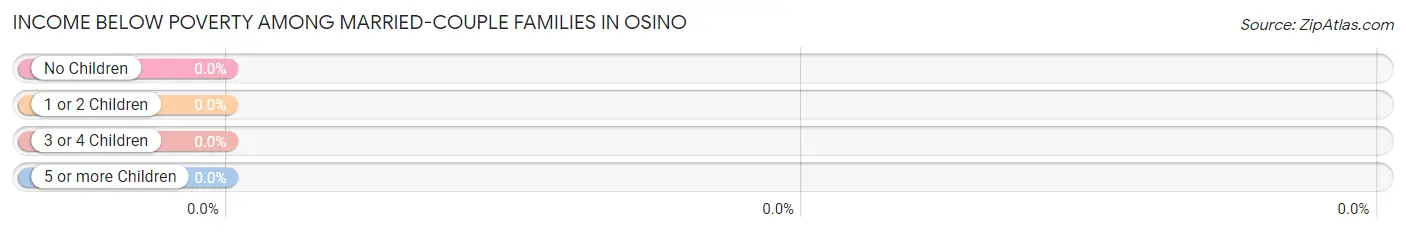
| Children | Above Poverty | Below Poverty |
| No Children | 39 (100.0%) | 0 (0.0%) |
| 1 or 2 Children | 113 (100.0%) | 0 (0.0%) |
| 3 or 4 Children | 21 (100.0%) | 0 (0.0%) |
| 5 or more Children | 0 (0.0%) | 0 (0.0%) |
| Total | 173 (100.0%) | 0 (0.0%) |
Income Below Poverty Among Single-Parent Households in Osino
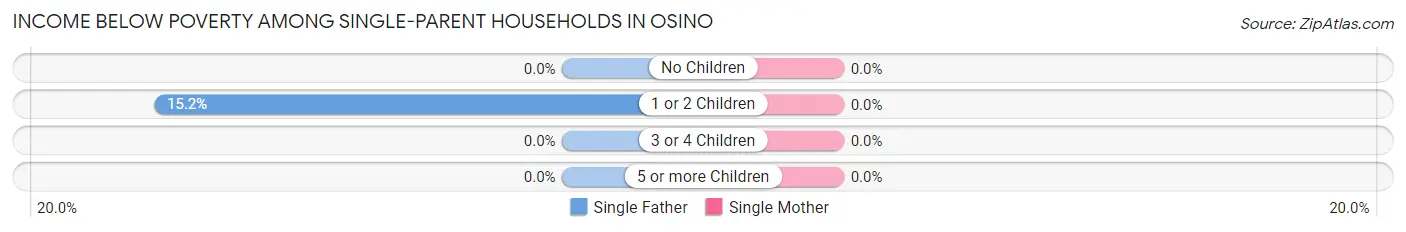
| Children | Single Father | Single Mother |
| No Children | 0 (0.0%) | 0 (0.0%) |
| 1 or 2 Children | 17 (15.2%) | 0 (0.0%) |
| 3 or 4 Children | 0 (0.0%) | 0 (0.0%) |
| 5 or more Children | 0 (0.0%) | 0 (0.0%) |
| Total | 17 (15.2%) | 0 (0.0%) |
Income Below Poverty Among Married-Couple vs Single-Parent Households in Osino
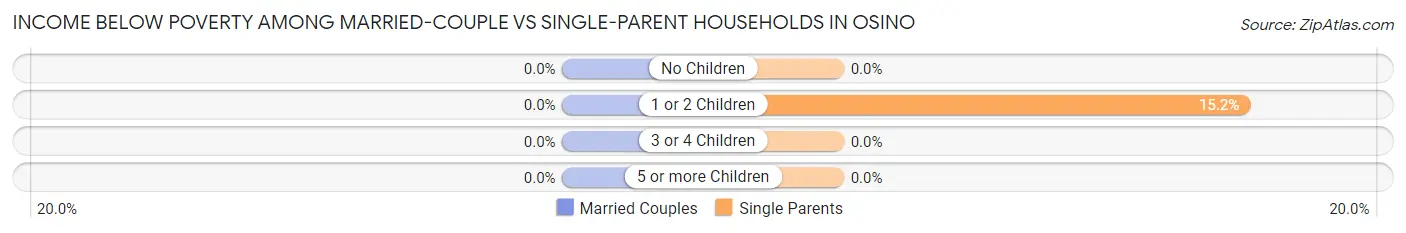
| Children | Married-Couple Families | Single-Parent Households |
| No Children | 0 (0.0%) | 0 (0.0%) |
| 1 or 2 Children | 0 (0.0%) | 17 (15.2%) |
| 3 or 4 Children | 0 (0.0%) | 0 (0.0%) |
| 5 or more Children | 0 (0.0%) | 0 (0.0%) |
| Total | 0 (0.0%) | 17 (15.2%) |
Race in Osino
The most populous races in Osino are Hispanic or Latino (534 | 50.8%), Two or more Races (458 | 43.6%), and White / Caucasian (448 | 42.6%).
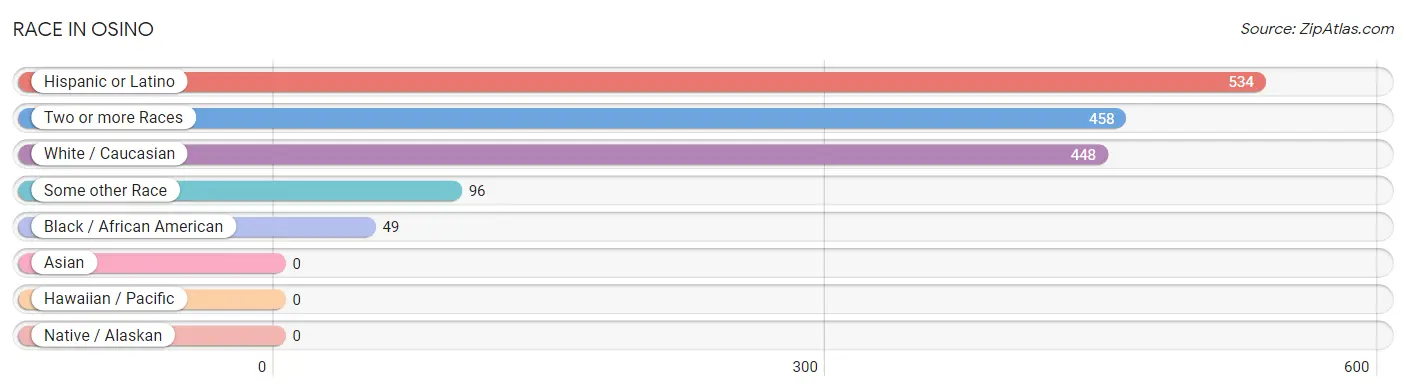
| Race | # Population | % Population |
| Asian | 0 | 0.0% |
| Black / African American | 49 | 4.7% |
| Hawaiian / Pacific | 0 | 0.0% |
| Hispanic or Latino | 534 | 50.8% |
| Native / Alaskan | 0 | 0.0% |
| White / Caucasian | 448 | 42.6% |
| Two or more Races | 458 | 43.6% |
| Some other Race | 96 | 9.1% |
| Total | 1,051 | 100.0% |
Ancestry in Osino
The most populous ancestries reported in Osino are Mexican (519 | 49.4%), German (194 | 18.5%), English (64 | 6.1%), Irish (64 | 6.1%), and French Canadian (45 | 4.3%), together accounting for 84.3% of all Osino residents.
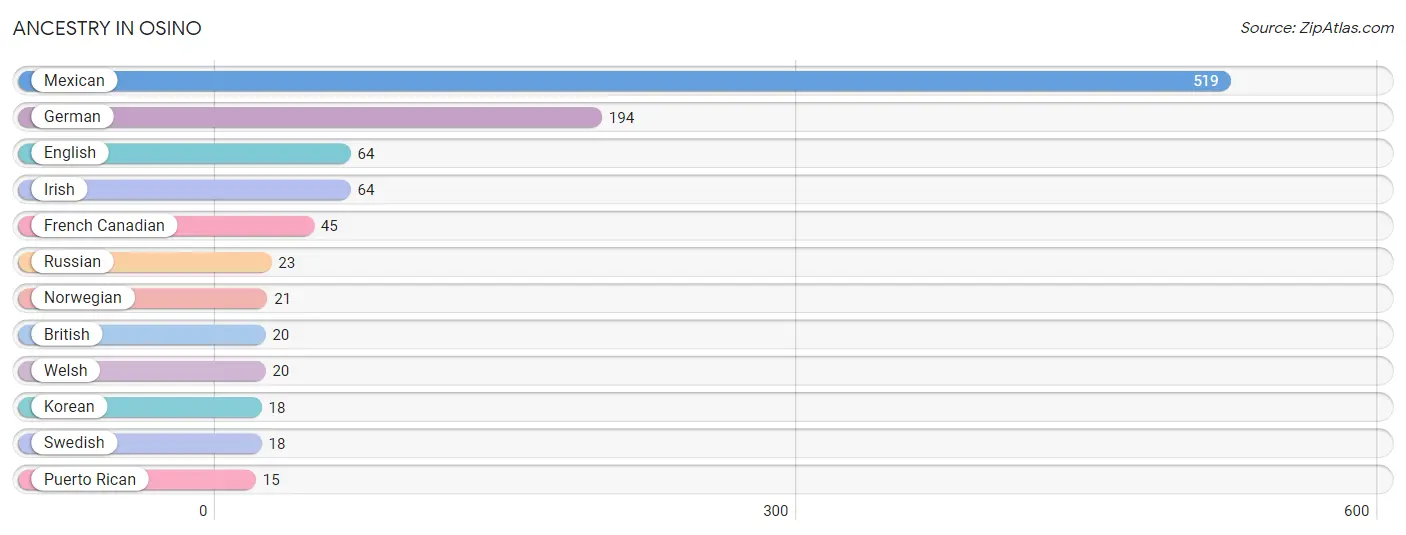
| Ancestry | # Population | % Population |
| British | 20 | 1.9% |
| English | 64 | 6.1% |
| French Canadian | 45 | 4.3% |
| German | 194 | 18.5% |
| Irish | 64 | 6.1% |
| Korean | 18 | 1.7% |
| Mexican | 519 | 49.4% |
| Norwegian | 21 | 2.0% |
| Puerto Rican | 15 | 1.4% |
| Russian | 23 | 2.2% |
| Swedish | 18 | 1.7% |
| Welsh | 20 | 1.9% | View All 12 Rows |
Immigrants in Osino
The most numerous immigrant groups reported in Osino came from Central America (30 | 2.9%), Latin America (30 | 2.9%), and Mexico (30 | 2.9%), together accounting for 8.6% of all Osino residents.
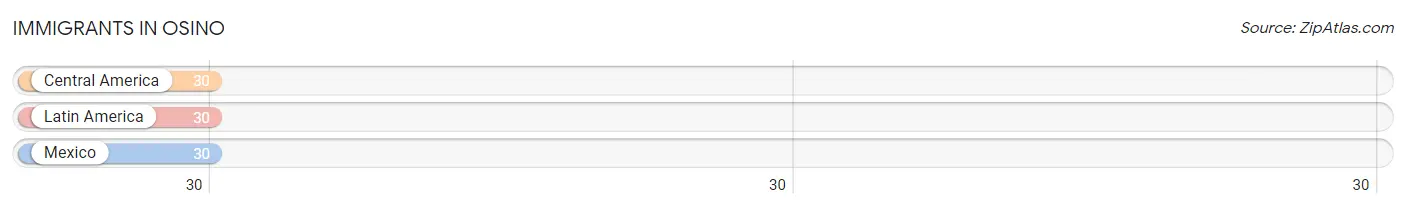
| Immigration Origin | # Population | % Population |
| Central America | 30 | 2.9% |
| Latin America | 30 | 2.9% |
| Mexico | 30 | 2.9% | View All 3 Rows |
Sex and Age in Osino
Sex and Age in Osino
The most populous age groups in Osino are 5 to 9 Years (214 | 37.7%) for men and Under 5 Years (127 | 26.2%) for women.
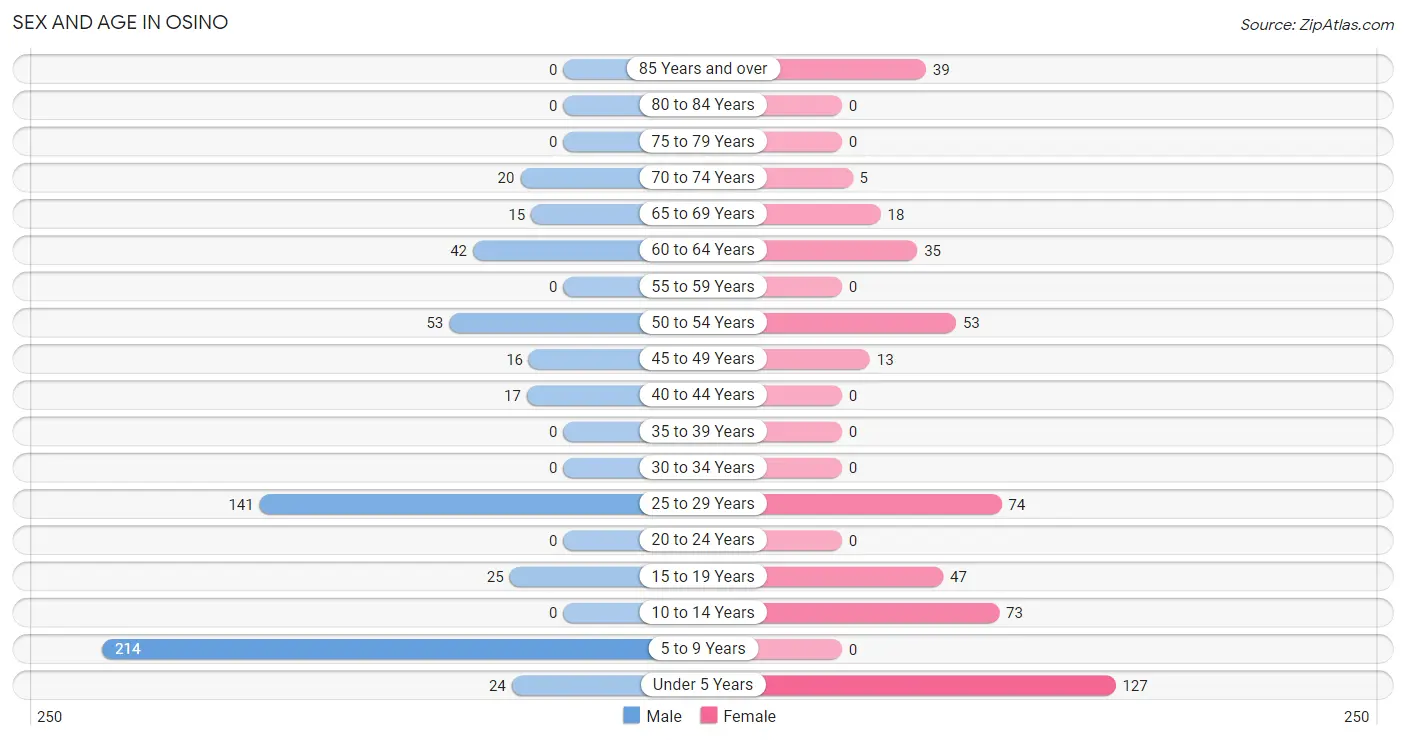
| Age Bracket | Male | Female |
| Under 5 Years | 24 (4.2%) | 127 (26.2%) |
| 5 to 9 Years | 214 (37.7%) | 0 (0.0%) |
| 10 to 14 Years | 0 (0.0%) | 73 (15.1%) |
| 15 to 19 Years | 25 (4.4%) | 47 (9.7%) |
| 20 to 24 Years | 0 (0.0%) | 0 (0.0%) |
| 25 to 29 Years | 141 (24.9%) | 74 (15.3%) |
| 30 to 34 Years | 0 (0.0%) | 0 (0.0%) |
| 35 to 39 Years | 0 (0.0%) | 0 (0.0%) |
| 40 to 44 Years | 17 (3.0%) | 0 (0.0%) |
| 45 to 49 Years | 16 (2.8%) | 13 (2.7%) |
| 50 to 54 Years | 53 (9.3%) | 53 (11.0%) |
| 55 to 59 Years | 0 (0.0%) | 0 (0.0%) |
| 60 to 64 Years | 42 (7.4%) | 35 (7.2%) |
| 65 to 69 Years | 15 (2.6%) | 18 (3.7%) |
| 70 to 74 Years | 20 (3.5%) | 5 (1.0%) |
| 75 to 79 Years | 0 (0.0%) | 0 (0.0%) |
| 80 to 84 Years | 0 (0.0%) | 0 (0.0%) |
| 85 Years and over | 0 (0.0%) | 39 (8.1%) |
| Total | 567 (100.0%) | 484 (100.0%) |
Families and Households in Osino
Median Family Size in Osino
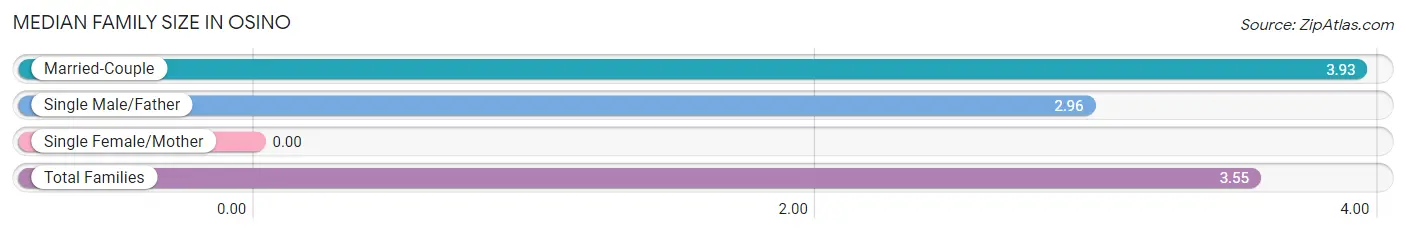
| Family Type | # Families | Family Size |
| Married-Couple | 173 (60.7%) | 3.93 |
| Single Male/Father | 112 (39.3%) | 2.96 |
| Single Female/Mother | 0 (0.0%) | - |
| Total Families | 285 (100.0%) | 3.55 |
Median Household Size in Osino
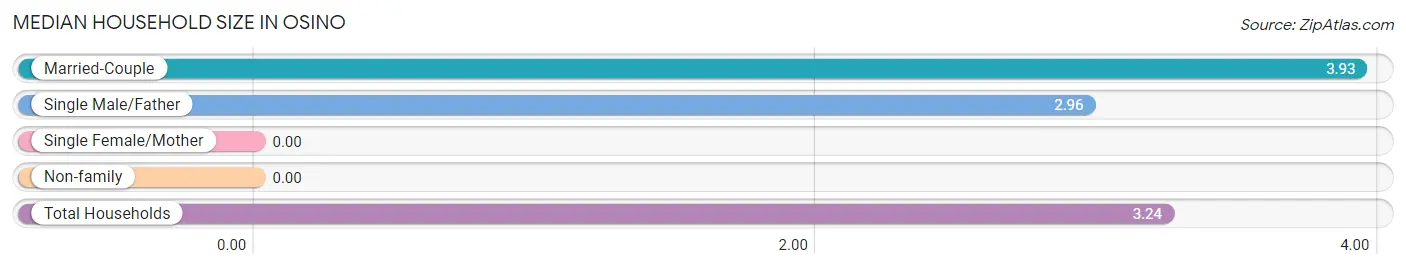
| Household Type | # Households | Household Size |
| Married-Couple | 173 (53.4%) | 3.93 |
| Single Male/Father | 112 (34.6%) | 2.96 |
| Single Female/Mother | 0 (0.0%) | - |
| Non-family | 39 (12.0%) | - |
| Total Households | 324 (100.0%) | 3.24 |
Household Size by Marriage Status in Osino
Out of a total of 324 households in Osino, 285 (88.0%) are family households, while 39 (12.0%) are nonfamily households. The most numerous type of family households are 3-person households, comprising 149, and the most common type of nonfamily households are 1-person households, comprising 39.
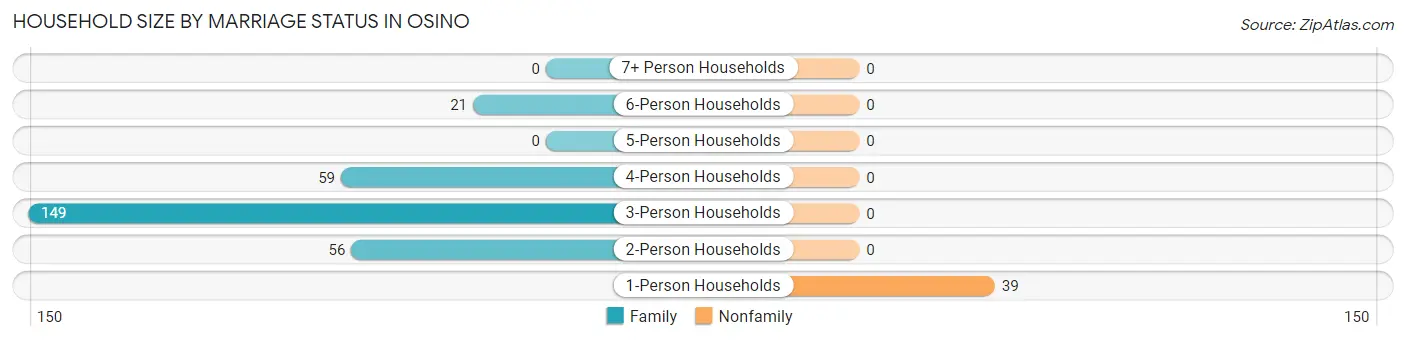
| Household Size | Family Households | Nonfamily Households |
| 1-Person Households | - | 39 (12.0%) |
| 2-Person Households | 56 (17.3%) | 0 (0.0%) |
| 3-Person Households | 149 (46.0%) | 0 (0.0%) |
| 4-Person Households | 59 (18.2%) | 0 (0.0%) |
| 5-Person Households | 0 (0.0%) | 0 (0.0%) |
| 6-Person Households | 21 (6.5%) | 0 (0.0%) |
| 7+ Person Households | 0 (0.0%) | 0 (0.0%) |
| Total | 285 (88.0%) | 39 (12.0%) |
Female Fertility in Osino
Fertility by Age in Osino
| Age Bracket | Women with Births | Births / 1,000 Women |
| 15 to 19 years | 0 (0.0%) | 0.0 |
| 20 to 34 years | 0 (0.0%) | 0.0 |
| 35 to 50 years | 0 (0.0%) | 0.0 |
| Total | 0 (0.0%) | 0.0 |
Fertility by Age by Marriage Status in Osino
| Age Bracket | Married | Unmarried |
| 15 to 19 years | 0 (0.0%) | 0 (0.0%) |
| 20 to 34 years | 0 (0.0%) | 0 (0.0%) |
| 35 to 50 years | 0 (0.0%) | 0 (0.0%) |
| Total | 0 (0.0%) | 0 (0.0%) |
Fertility by Education in Osino
| Educational Attainment | Women with Births | Births / 1,000 Women |
| Less than High School | 0 (0.0%) | 0.0 |
| High School Diploma | 0 (0.0%) | 0.0 |
| College or Associate's Degree | 0 (0.0%) | 0.0 |
| Bachelor's Degree | 0 (0.0%) | 0.0 |
| Graduate Degree | 0 (0.0%) | 0.0 |
| Total | 0 (0.0%) | 0.0 |
Fertility by Education by Marriage Status in Osino
| Educational Attainment | Married | Unmarried |
| Less than High School | 0 (0.0%) | 0 (0.0%) |
| High School Diploma | 0 (0.0%) | 0 (0.0%) |
| College or Associate's Degree | 0 (0.0%) | 0 (0.0%) |
| Bachelor's Degree | 0 (0.0%) | 0 (0.0%) |
| Graduate Degree | 0 (0.0%) | 0 (0.0%) |
| Total | 0 (0.0%) | 0 (0.0%) |
Employment Characteristics in Osino
Employment by Class of Employer in Osino
Among the 277 employed individuals in Osino, private company employees (264 | 95.3%), and self-employed (not incorporated) (13 | 4.7%) make up the most common classes of employment.
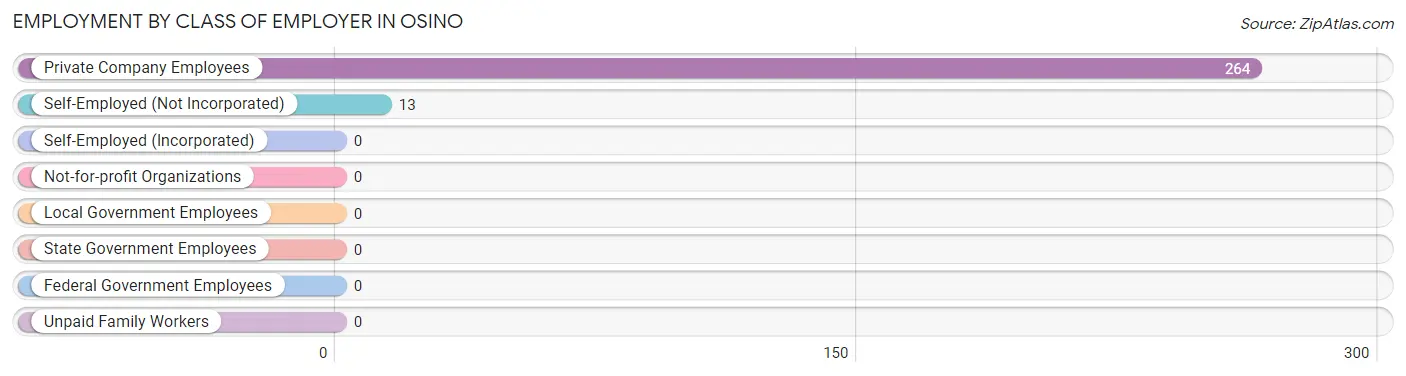
| Employer Class | # Employees | % Employees |
| Private Company Employees | 264 | 95.3% |
| Self-Employed (Incorporated) | 0 | 0.0% |
| Self-Employed (Not Incorporated) | 13 | 4.7% |
| Not-for-profit Organizations | 0 | 0.0% |
| Local Government Employees | 0 | 0.0% |
| State Government Employees | 0 | 0.0% |
| Federal Government Employees | 0 | 0.0% |
| Unpaid Family Workers | 0 | 0.0% |
| Total | 277 | 100.0% |
Employment Status by Age in Osino
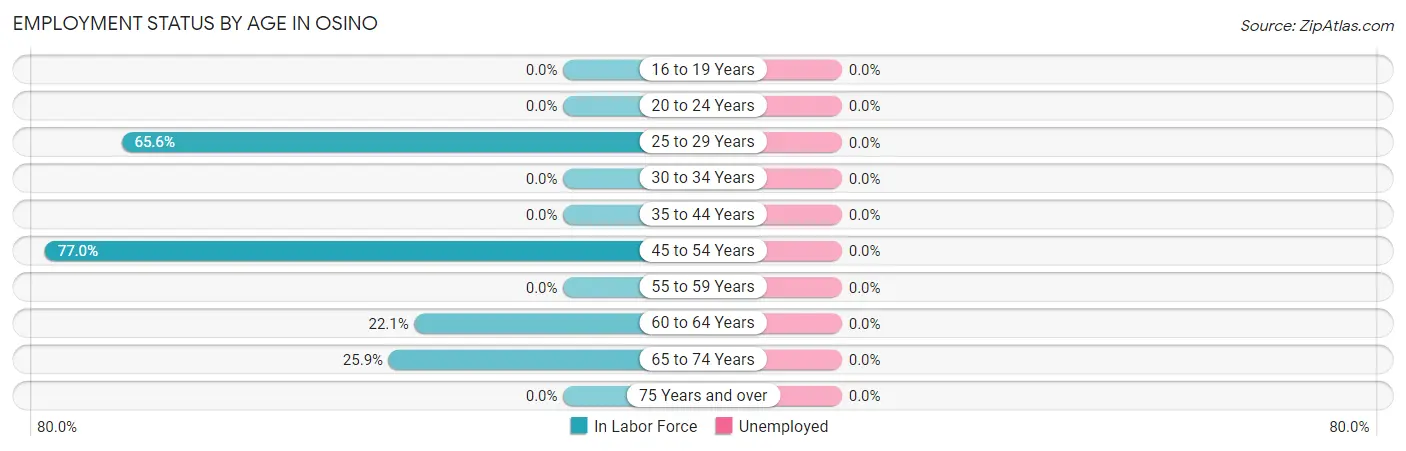
| Age Bracket | In Labor Force | Unemployed |
| 16 to 19 Years | 0 (0.0%) | 0 (0.0%) |
| 20 to 24 Years | 0 (0.0%) | 0 (0.0%) |
| 25 to 29 Years | 141 (65.6%) | 0 (0.0%) |
| 30 to 34 Years | 0 (0.0%) | 0 (0.0%) |
| 35 to 44 Years | 0 (0.0%) | 0 (0.0%) |
| 45 to 54 Years | 104 (77.0%) | 0 (0.0%) |
| 55 to 59 Years | 0 (0.0%) | 0 (0.0%) |
| 60 to 64 Years | 17 (22.1%) | 0 (0.0%) |
| 65 to 74 Years | 15 (25.9%) | 0 (0.0%) |
| 75 Years and over | 0 (0.0%) | 0 (0.0%) |
| Total | 277 (46.6%) | 0 (0.0%) |
Employment Status by Educational Attainment in Osino
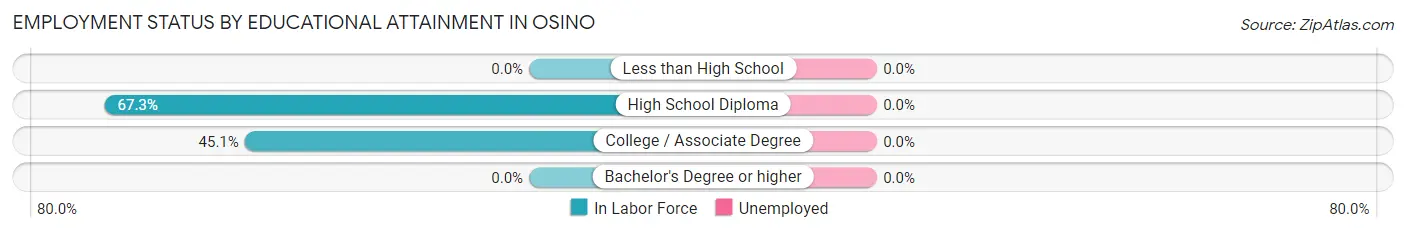
| Educational Attainment | In Labor Force | Unemployed |
| Less than High School | 0 (0.0%) | 0 (0.0%) |
| High School Diploma | 216 (67.3%) | 0 (0.0%) |
| College / Associate Degree | 46 (45.1%) | 0 (0.0%) |
| Bachelor's Degree or higher | 0 (0.0%) | 0 (0.0%) |
| Total | 262 (59.0%) | 0 (0.0%) |
Employment Occupations by Sex in Osino
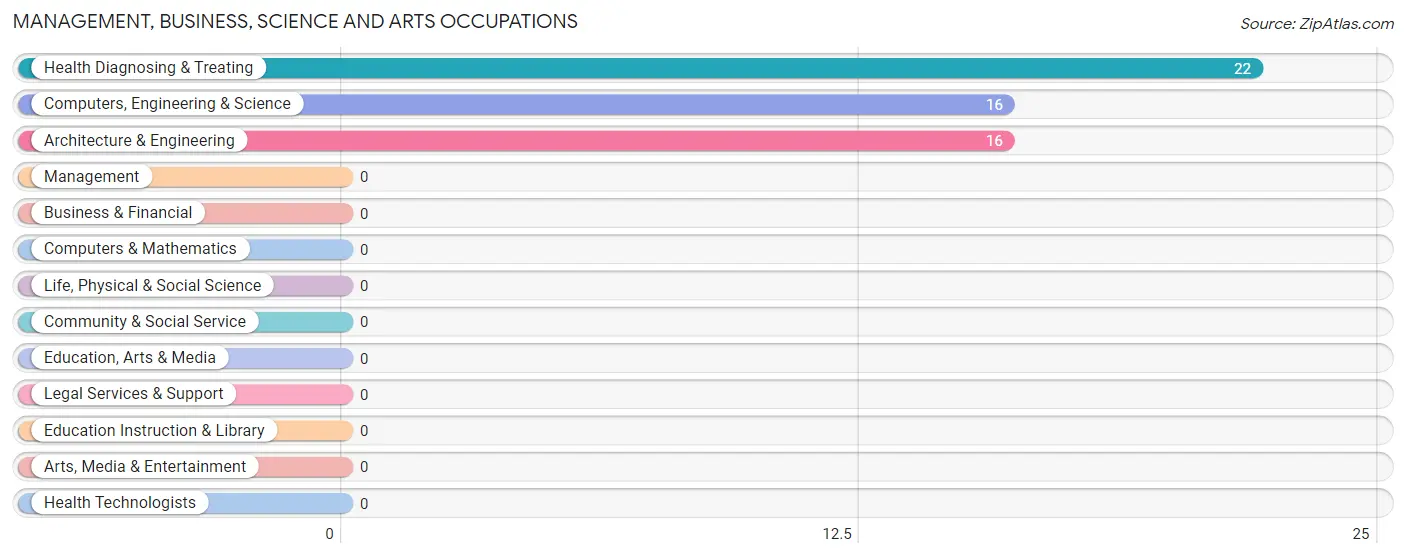
Management, Business, Science and Arts Occupations
The most common Management, Business, Science and Arts occupations in Osino are Health Diagnosing & Treating (22 | 7.9%), Computers, Engineering & Science (16 | 5.8%), and Architecture & Engineering (16 | 5.8%).
Management, Business, Science and Arts Occupations by Sex
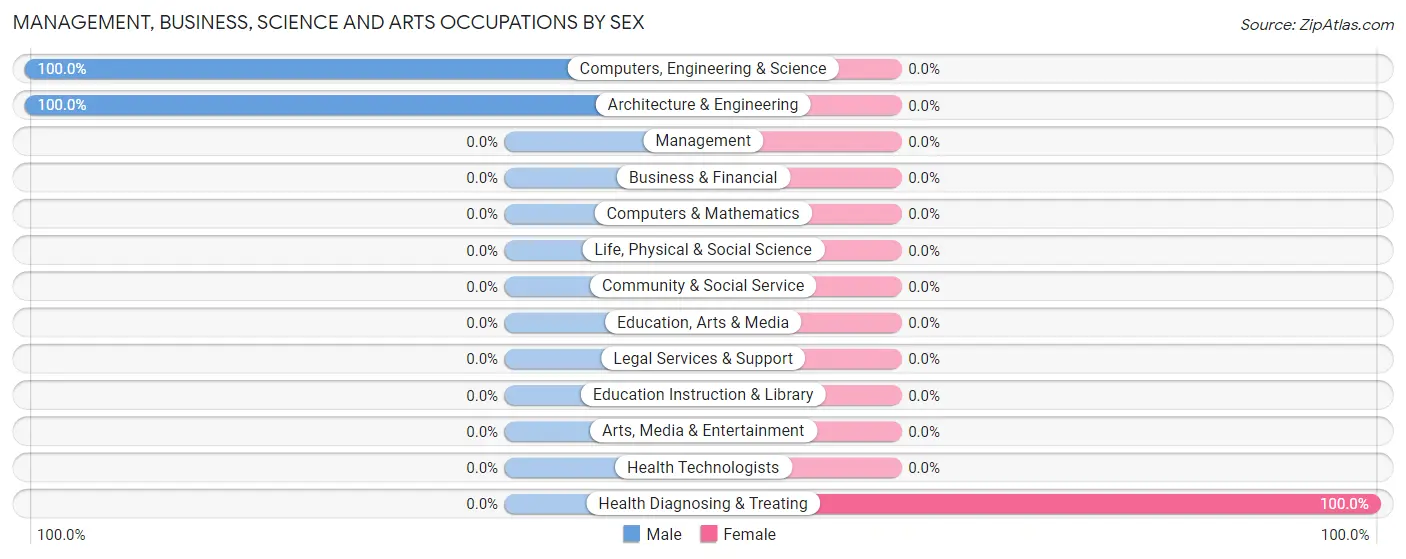
| Occupation | Male | Female |
| Management | 0 (0.0%) | 0 (0.0%) |
| Business & Financial | 0 (0.0%) | 0 (0.0%) |
| Computers, Engineering & Science | 16 (100.0%) | 0 (0.0%) |
| Computers & Mathematics | 0 (0.0%) | 0 (0.0%) |
| Architecture & Engineering | 16 (100.0%) | 0 (0.0%) |
| Life, Physical & Social Science | 0 (0.0%) | 0 (0.0%) |
| Community & Social Service | 0 (0.0%) | 0 (0.0%) |
| Education, Arts & Media | 0 (0.0%) | 0 (0.0%) |
| Legal Services & Support | 0 (0.0%) | 0 (0.0%) |
| Education Instruction & Library | 0 (0.0%) | 0 (0.0%) |
| Arts, Media & Entertainment | 0 (0.0%) | 0 (0.0%) |
| Health Diagnosing & Treating | 0 (0.0%) | 22 (100.0%) |
| Health Technologists | 0 (0.0%) | 0 (0.0%) |
| Total (Category) | 16 (42.1%) | 22 (57.9%) |
| Total (Overall) | 242 (87.4%) | 35 (12.6%) |
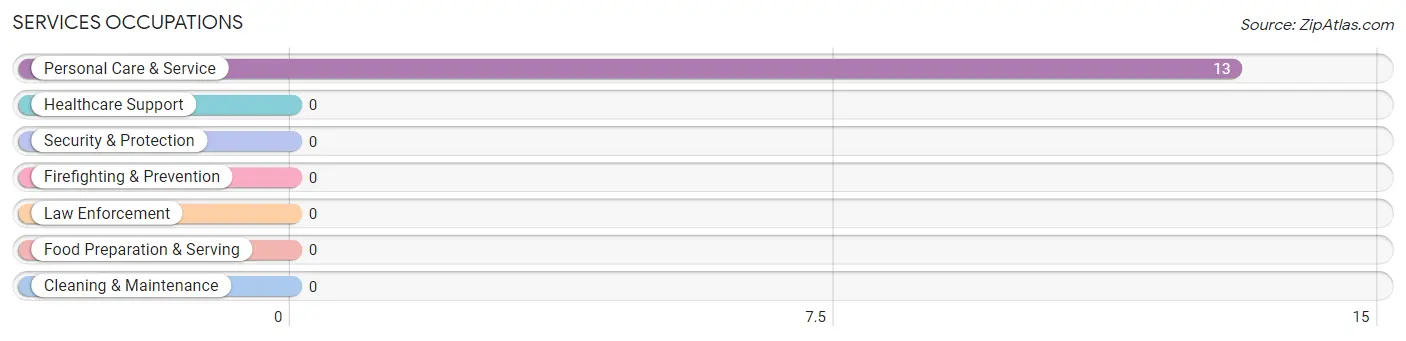
Services Occupations
The most common Services occupations in Osino are , and Personal Care & Service (13 | 4.7%).
Services Occupations by Sex
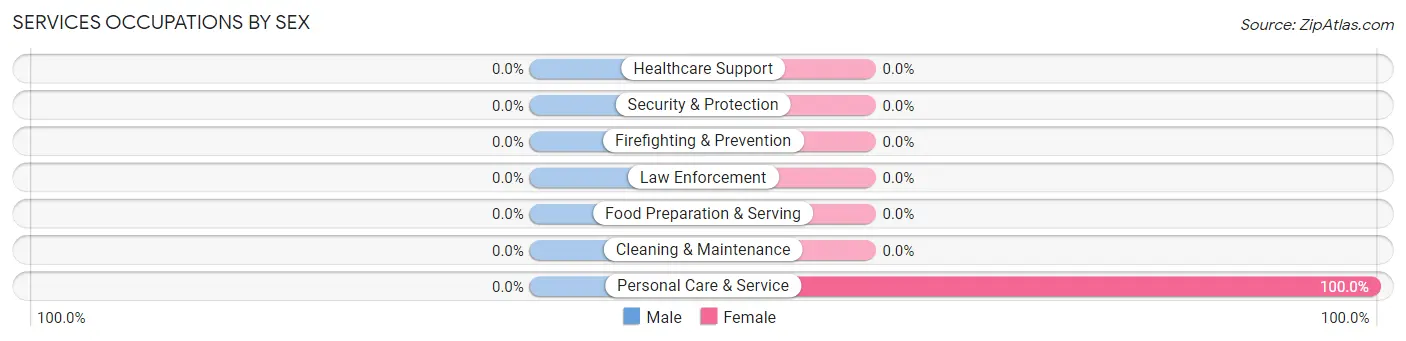
| Occupation | Male | Female |
| Healthcare Support | 0 (0.0%) | 0 (0.0%) |
| Security & Protection | 0 (0.0%) | 0 (0.0%) |
| Firefighting & Prevention | 0 (0.0%) | 0 (0.0%) |
| Law Enforcement | 0 (0.0%) | 0 (0.0%) |
| Food Preparation & Serving | 0 (0.0%) | 0 (0.0%) |
| Cleaning & Maintenance | 0 (0.0%) | 0 (0.0%) |
| Personal Care & Service | 0 (0.0%) | 13 (100.0%) |
| Total (Category) | 0 (0.0%) | 13 (100.0%) |
| Total (Overall) | 242 (87.4%) | 35 (12.6%) |
Sales and Office Occupations
The most common Sales and Office occupations in Osino are , and Office & Administration (23 | 8.3%).
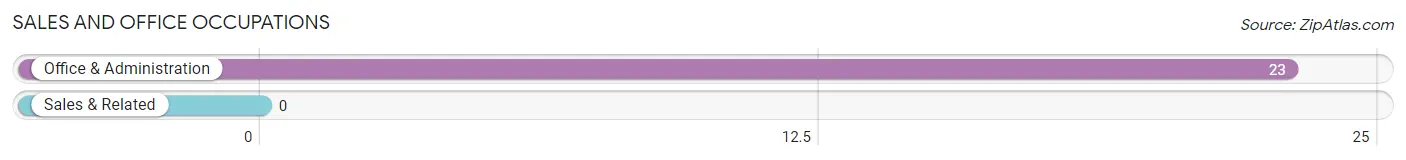
Sales and Office Occupations by Sex

| Occupation | Male | Female |
| Sales & Related | 0 (0.0%) | 0 (0.0%) |
| Office & Administration | 23 (100.0%) | 0 (0.0%) |
| Total (Category) | 23 (100.0%) | 0 (0.0%) |
| Total (Overall) | 242 (87.4%) | 35 (12.6%) |
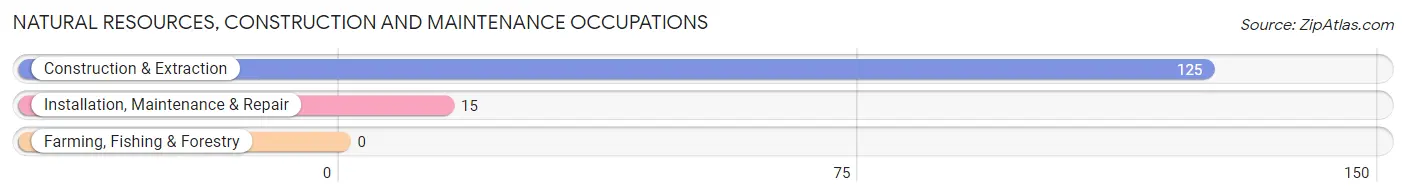
Natural Resources, Construction and Maintenance Occupations
The most common Natural Resources, Construction and Maintenance occupations in Osino are Construction & Extraction (125 | 45.1%), and Installation, Maintenance & Repair (15 | 5.4%).
Natural Resources, Construction and Maintenance Occupations by Sex
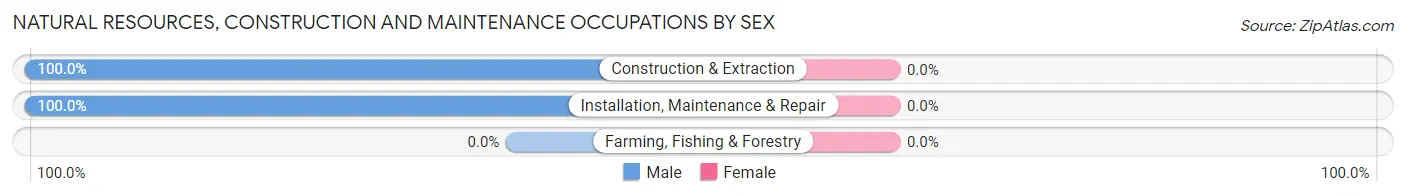
| Occupation | Male | Female |
| Farming, Fishing & Forestry | 0 (0.0%) | 0 (0.0%) |
| Construction & Extraction | 125 (100.0%) | 0 (0.0%) |
| Installation, Maintenance & Repair | 15 (100.0%) | 0 (0.0%) |
| Total (Category) | 140 (100.0%) | 0 (0.0%) |
| Total (Overall) | 242 (87.4%) | 35 (12.6%) |
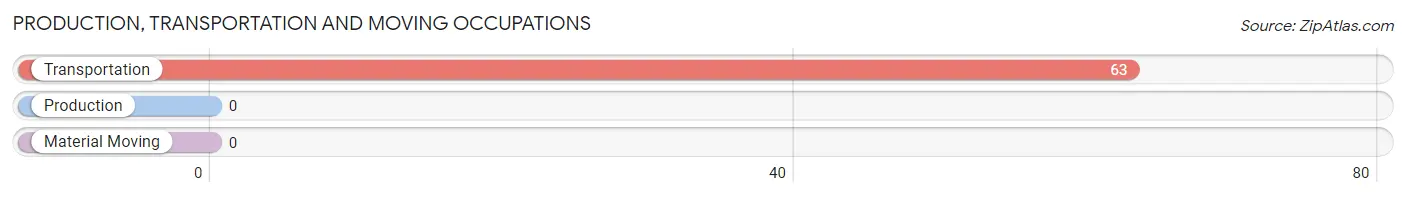
Production, Transportation and Moving Occupations
The most common Production, Transportation and Moving occupations in Osino are , and Transportation (63 | 22.7%).
Production, Transportation and Moving Occupations by Sex
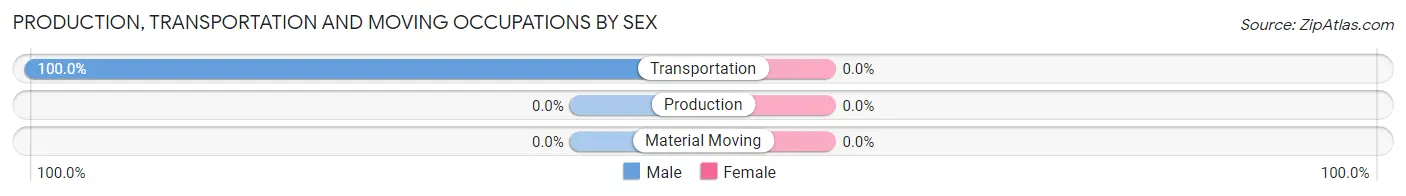
| Occupation | Male | Female |
| Production | 0 (0.0%) | 0 (0.0%) |
| Transportation | 63 (100.0%) | 0 (0.0%) |
| Material Moving | 0 (0.0%) | 0 (0.0%) |
| Total (Category) | 63 (100.0%) | 0 (0.0%) |
| Total (Overall) | 242 (87.4%) | 35 (12.6%) |
Employment Industries by Sex in Osino
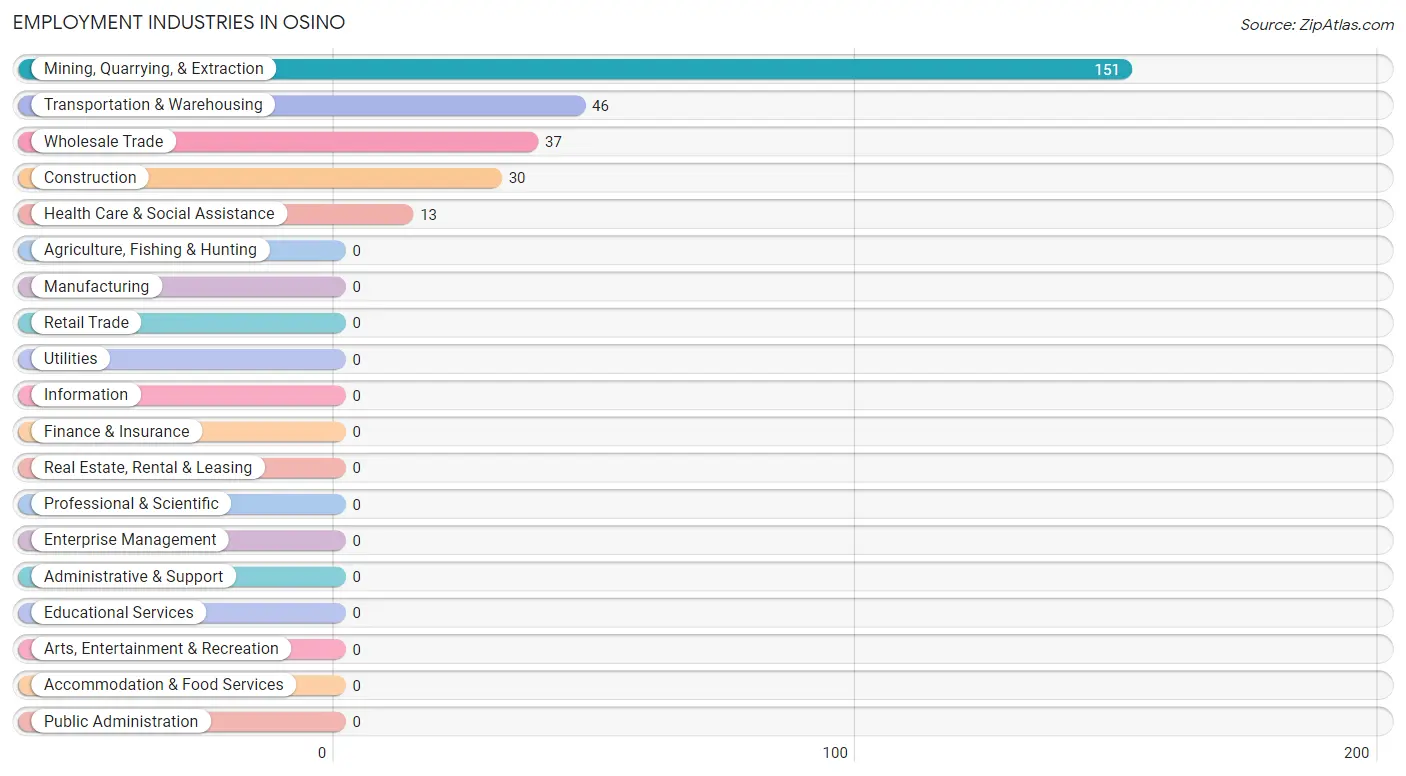
Employment Industries in Osino
The major employment industries in Osino include Mining, Quarrying, & Extraction (151 | 54.5%), Transportation & Warehousing (46 | 16.6%), Wholesale Trade (37 | 13.4%), Construction (30 | 10.8%), and Health Care & Social Assistance (13 | 4.7%).
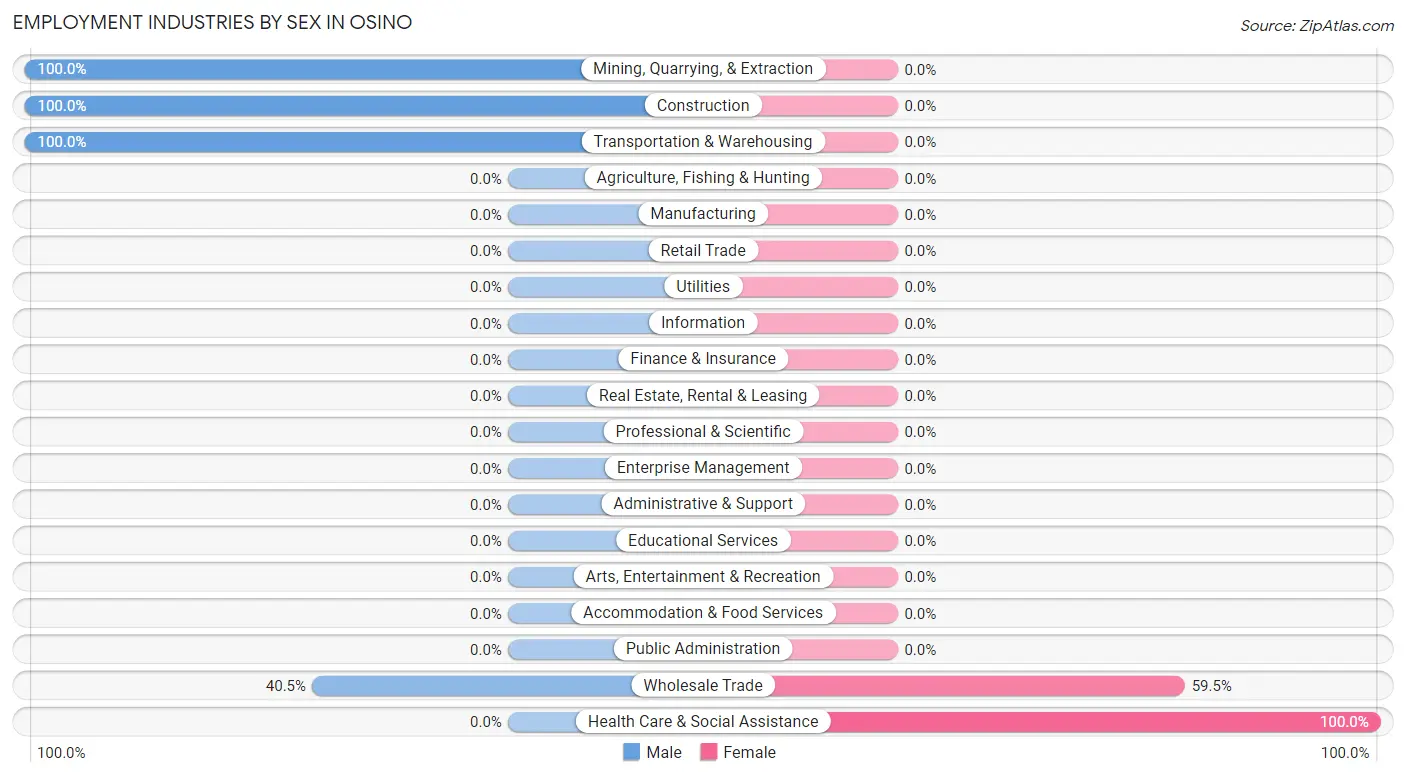
Employment Industries by Sex in Osino
The Osino industries that see more men than women are Mining, Quarrying, & Extraction (100.0%), Construction (100.0%), and Transportation & Warehousing (100.0%), whereas the industries that tend to have a higher number of women are Health Care & Social Assistance (100.0%), and Wholesale Trade (59.5%).
| Industry | Male | Female |
| Agriculture, Fishing & Hunting | 0 (0.0%) | 0 (0.0%) |
| Mining, Quarrying, & Extraction | 151 (100.0%) | 0 (0.0%) |
| Construction | 30 (100.0%) | 0 (0.0%) |
| Manufacturing | 0 (0.0%) | 0 (0.0%) |
| Wholesale Trade | 15 (40.5%) | 22 (59.5%) |
| Retail Trade | 0 (0.0%) | 0 (0.0%) |
| Transportation & Warehousing | 46 (100.0%) | 0 (0.0%) |
| Utilities | 0 (0.0%) | 0 (0.0%) |
| Information | 0 (0.0%) | 0 (0.0%) |
| Finance & Insurance | 0 (0.0%) | 0 (0.0%) |
| Real Estate, Rental & Leasing | 0 (0.0%) | 0 (0.0%) |
| Professional & Scientific | 0 (0.0%) | 0 (0.0%) |
| Enterprise Management | 0 (0.0%) | 0 (0.0%) |
| Administrative & Support | 0 (0.0%) | 0 (0.0%) |
| Educational Services | 0 (0.0%) | 0 (0.0%) |
| Health Care & Social Assistance | 0 (0.0%) | 13 (100.0%) |
| Arts, Entertainment & Recreation | 0 (0.0%) | 0 (0.0%) |
| Accommodation & Food Services | 0 (0.0%) | 0 (0.0%) |
| Public Administration | 0 (0.0%) | 0 (0.0%) |
| Total | 242 (87.4%) | 35 (12.6%) |
Education in Osino
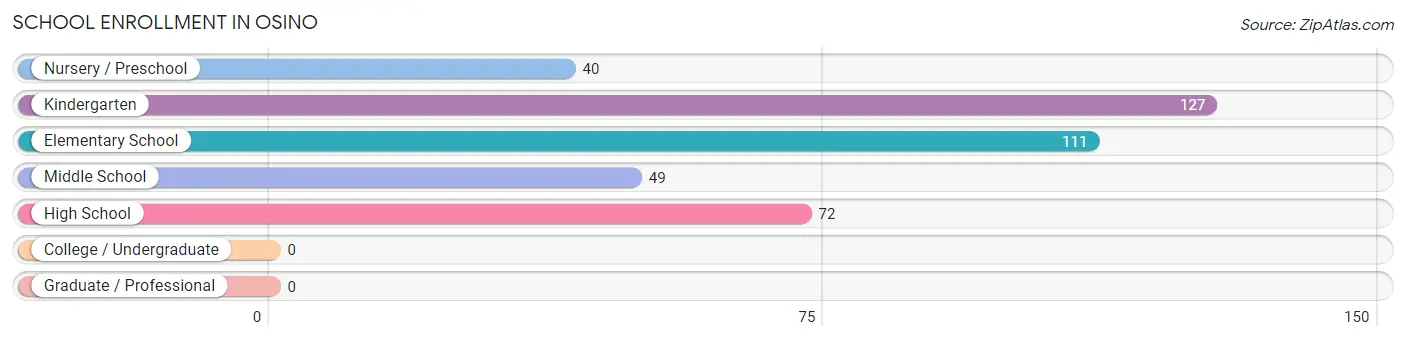
School Enrollment in Osino
The most common levels of schooling among the 399 students in Osino are kindergarten (127 | 31.8%), elementary school (111 | 27.8%), and high school (72 | 18.0%).
| School Level | # Students | % Students |
| Nursery / Preschool | 40 | 10.0% |
| Kindergarten | 127 | 31.8% |
| Elementary School | 111 | 27.8% |
| Middle School | 49 | 12.3% |
| High School | 72 | 18.0% |
| College / Undergraduate | 0 | 0.0% |
| Graduate / Professional | 0 | 0.0% |
| Total | 399 | 100.0% |
School Enrollment by Age by Funding Source in Osino
Out of a total of 399 students who are enrolled in schools in Osino, 128 (32.1%) attend a private institution, while the remaining 271 (67.9%) are enrolled in public schools. The age group of 10 to 14 year olds has the highest likelihood of being enrolled in private schools, with 73 (100.0% in the age bracket) enrolled. Conversely, the age group of 3 to 4 year olds has the lowest likelihood of being enrolled in a private school, with 40 (100.0% in the age bracket) attending a public institution.
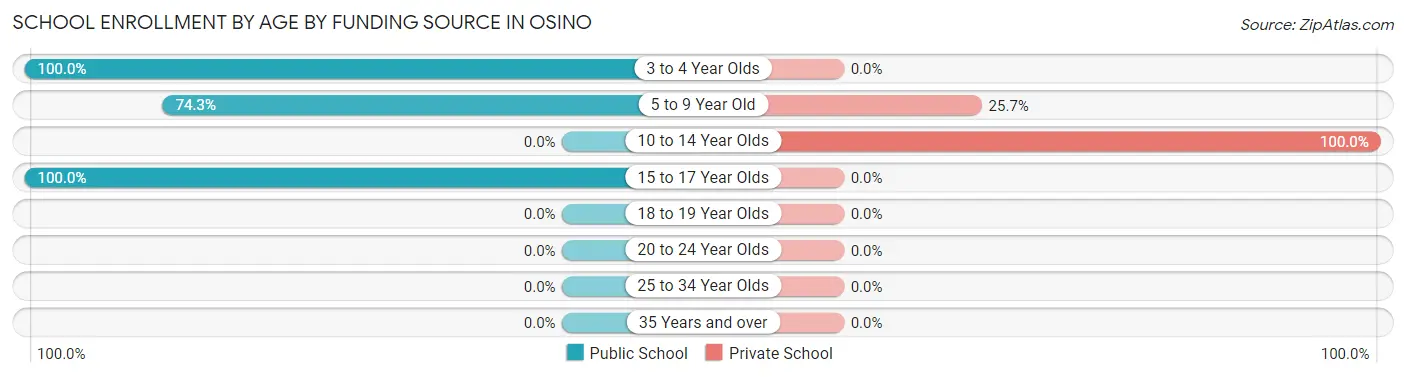
| Age Bracket | Public School | Private School |
| 3 to 4 Year Olds | 40 (100.0%) | 0 (0.0%) |
| 5 to 9 Year Old | 159 (74.3%) | 55 (25.7%) |
| 10 to 14 Year Olds | 0 (0.0%) | 73 (100.0%) |
| 15 to 17 Year Olds | 72 (100.0%) | 0 (0.0%) |
| 18 to 19 Year Olds | 0 (0.0%) | 0 (0.0%) |
| 20 to 24 Year Olds | 0 (0.0%) | 0 (0.0%) |
| 25 to 34 Year Olds | 0 (0.0%) | 0 (0.0%) |
| 35 Years and over | 0 (0.0%) | 0 (0.0%) |
| Total | 271 (67.9%) | 128 (32.1%) |
Educational Attainment by Field of Study in Osino
, and bio, nature & agricultural (21 | 100.0%) are the most common fields of study among 21 individuals in Osino who have obtained a bachelor's degree or higher.
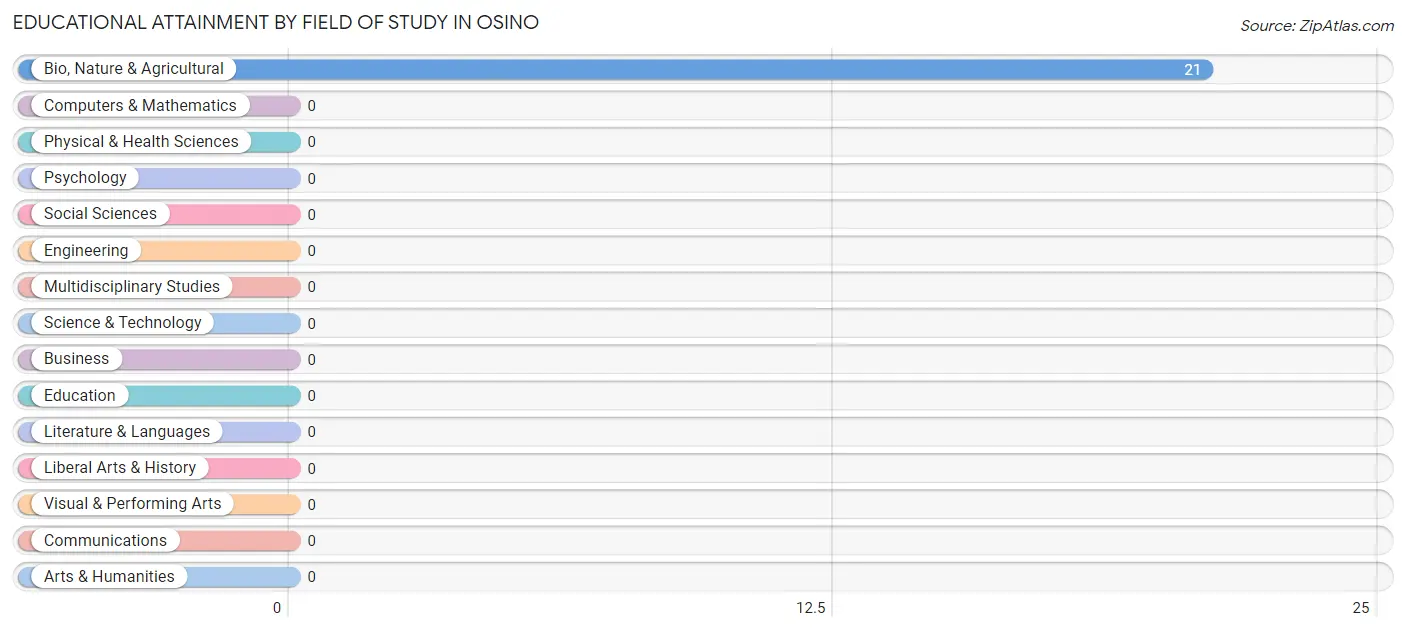
| Field of Study | # Graduates | % Graduates |
| Computers & Mathematics | 0 | 0.0% |
| Bio, Nature & Agricultural | 21 | 100.0% |
| Physical & Health Sciences | 0 | 0.0% |
| Psychology | 0 | 0.0% |
| Social Sciences | 0 | 0.0% |
| Engineering | 0 | 0.0% |
| Multidisciplinary Studies | 0 | 0.0% |
| Science & Technology | 0 | 0.0% |
| Business | 0 | 0.0% |
| Education | 0 | 0.0% |
| Literature & Languages | 0 | 0.0% |
| Liberal Arts & History | 0 | 0.0% |
| Visual & Performing Arts | 0 | 0.0% |
| Communications | 0 | 0.0% |
| Arts & Humanities | 0 | 0.0% |
| Total | 21 | 100.0% |
Transportation & Commute in Osino
Vehicle Availability by Sex in Osino
The most prevalent vehicle ownership categories in Osino are males with 1 vehicle (95, accounting for 39.3%) and females with 1 vehicle (0, making up 271.4%).
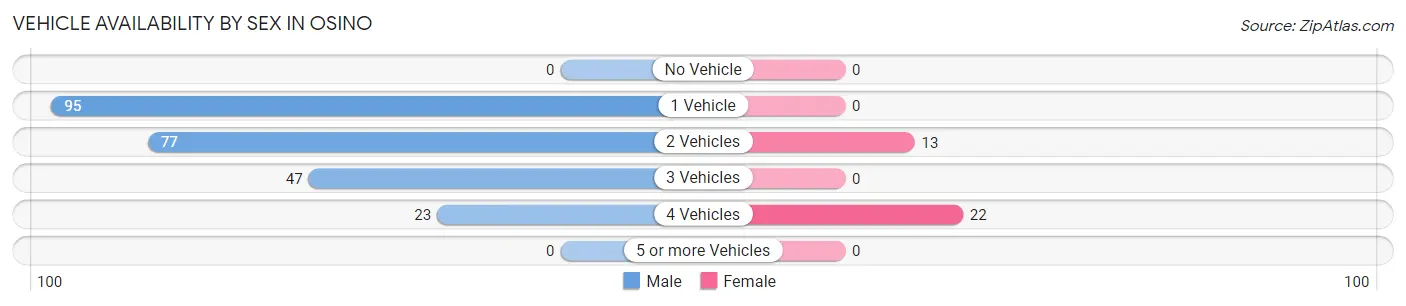
| Vehicles Available | Male | Female |
| No Vehicle | 0 (0.0%) | 0 (0.0%) |
| 1 Vehicle | 95 (39.3%) | 0 (0.0%) |
| 2 Vehicles | 77 (31.8%) | 13 (37.1%) |
| 3 Vehicles | 47 (19.4%) | 0 (0.0%) |
| 4 Vehicles | 23 (9.5%) | 22 (62.9%) |
| 5 or more Vehicles | 0 (0.0%) | 0 (0.0%) |
| Total | 242 (100.0%) | 35 (100.0%) |
Commute Time in Osino
The most frequently occuring commute durations in Osino are 60 to 89 minutes (111 commuters, 42.0%), 5 to 9 minutes (46 commuters, 17.4%), and 15 to 19 minutes (45 commuters, 17.1%).
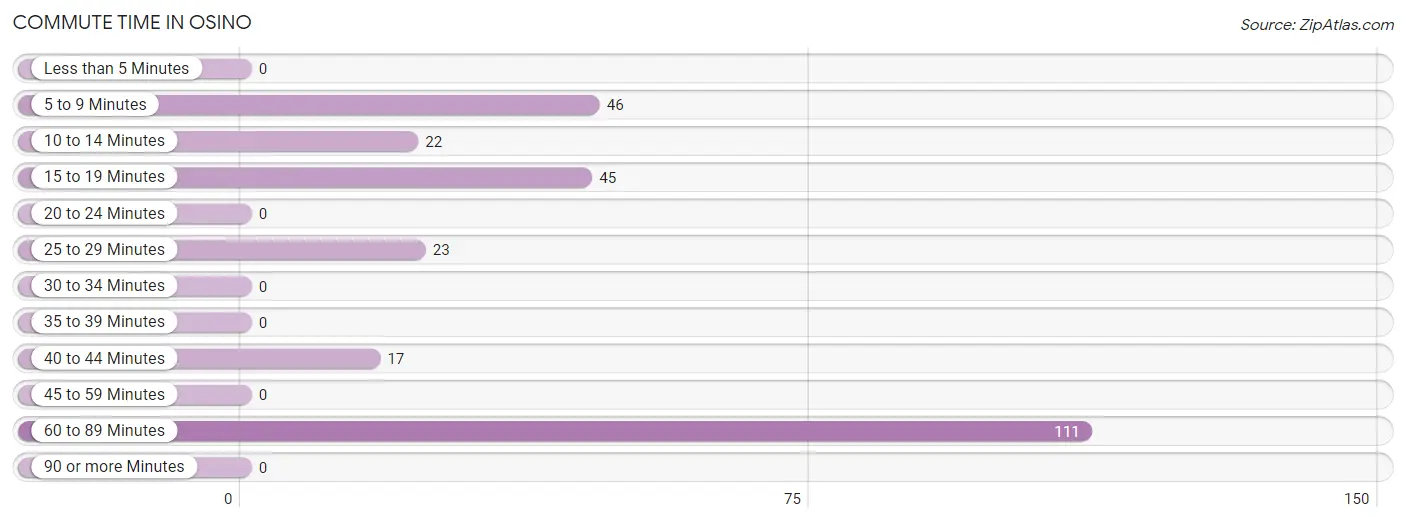
| Commute Time | # Commuters | % Commuters |
| Less than 5 Minutes | 0 | 0.0% |
| 5 to 9 Minutes | 46 | 17.4% |
| 10 to 14 Minutes | 22 | 8.3% |
| 15 to 19 Minutes | 45 | 17.1% |
| 20 to 24 Minutes | 0 | 0.0% |
| 25 to 29 Minutes | 23 | 8.7% |
| 30 to 34 Minutes | 0 | 0.0% |
| 35 to 39 Minutes | 0 | 0.0% |
| 40 to 44 Minutes | 17 | 6.4% |
| 45 to 59 Minutes | 0 | 0.0% |
| 60 to 89 Minutes | 111 | 42.0% |
| 90 or more Minutes | 0 | 0.0% |
Commute Time by Sex in Osino
The most common commute times in Osino are 60 to 89 minutes (111 commuters, 45.9%) for males and 10 to 14 minutes (22 commuters, 100.0%) for females.
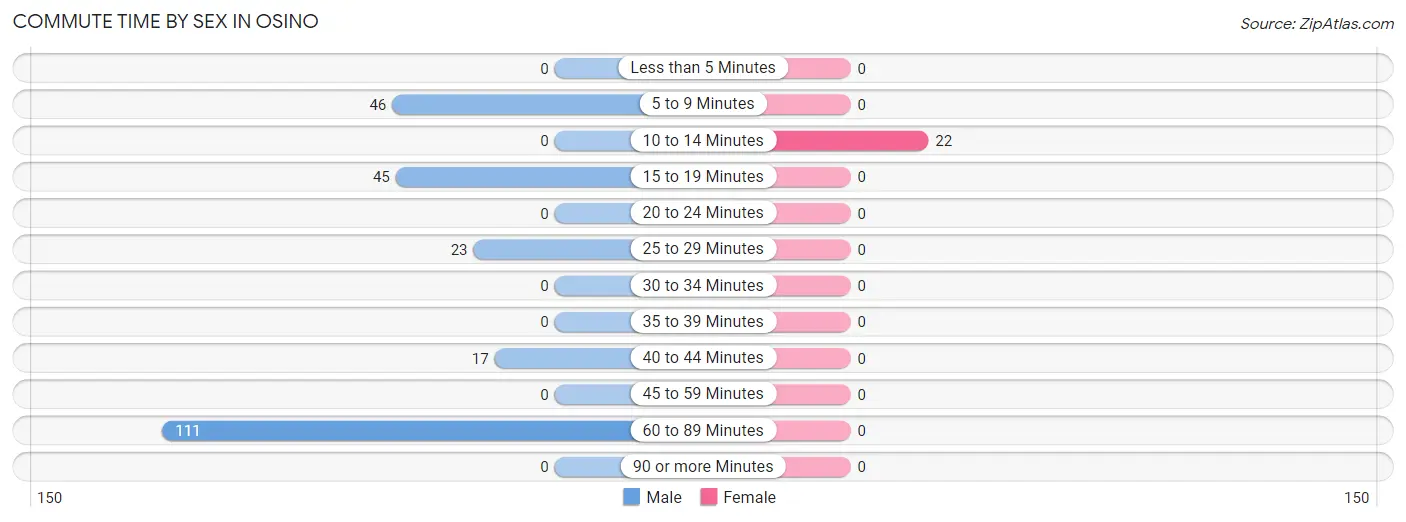
| Commute Time | Male | Female |
| Less than 5 Minutes | 0 (0.0%) | 0 (0.0%) |
| 5 to 9 Minutes | 46 (19.0%) | 0 (0.0%) |
| 10 to 14 Minutes | 0 (0.0%) | 22 (100.0%) |
| 15 to 19 Minutes | 45 (18.6%) | 0 (0.0%) |
| 20 to 24 Minutes | 0 (0.0%) | 0 (0.0%) |
| 25 to 29 Minutes | 23 (9.5%) | 0 (0.0%) |
| 30 to 34 Minutes | 0 (0.0%) | 0 (0.0%) |
| 35 to 39 Minutes | 0 (0.0%) | 0 (0.0%) |
| 40 to 44 Minutes | 17 (7.0%) | 0 (0.0%) |
| 45 to 59 Minutes | 0 (0.0%) | 0 (0.0%) |
| 60 to 89 Minutes | 111 (45.9%) | 0 (0.0%) |
| 90 or more Minutes | 0 (0.0%) | 0 (0.0%) |
Time of Departure to Work by Sex in Osino
The most frequent times of departure to work in Osino are 5:30 AM to 5:59 AM (95, 39.3%) for males and 8:00 AM to 8:29 AM (22, 100.0%) for females.
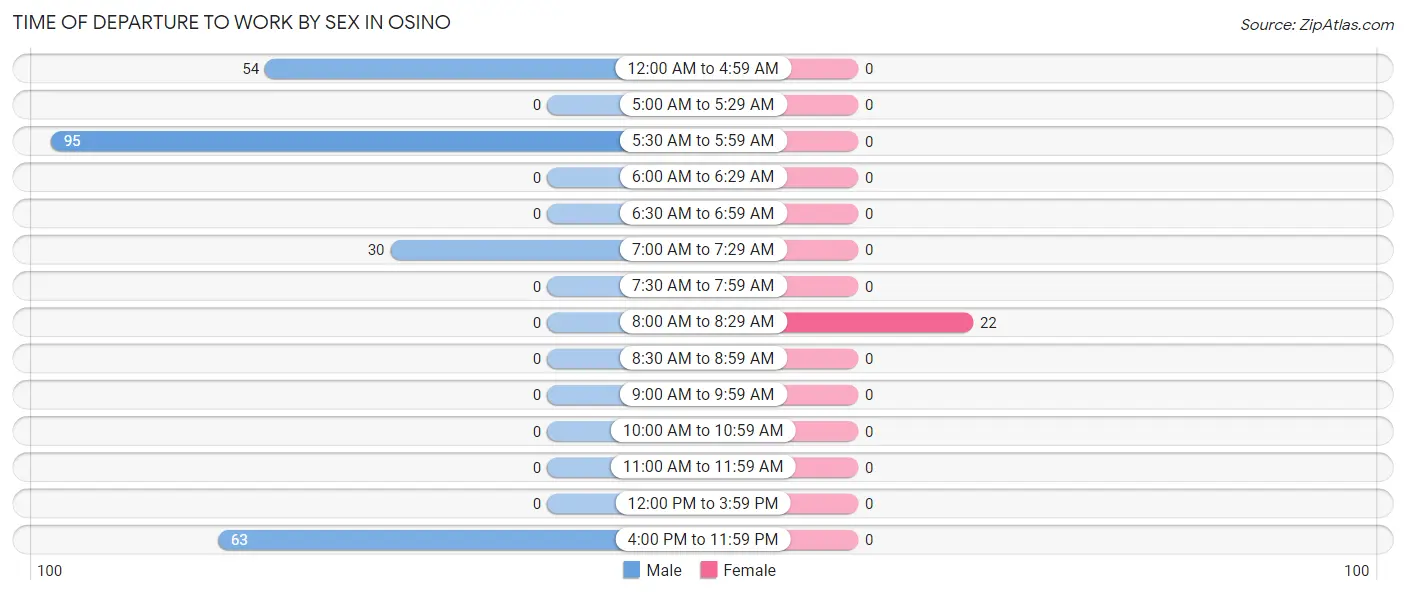
| Time of Departure | Male | Female |
| 12:00 AM to 4:59 AM | 54 (22.3%) | 0 (0.0%) |
| 5:00 AM to 5:29 AM | 0 (0.0%) | 0 (0.0%) |
| 5:30 AM to 5:59 AM | 95 (39.3%) | 0 (0.0%) |
| 6:00 AM to 6:29 AM | 0 (0.0%) | 0 (0.0%) |
| 6:30 AM to 6:59 AM | 0 (0.0%) | 0 (0.0%) |
| 7:00 AM to 7:29 AM | 30 (12.4%) | 0 (0.0%) |
| 7:30 AM to 7:59 AM | 0 (0.0%) | 0 (0.0%) |
| 8:00 AM to 8:29 AM | 0 (0.0%) | 22 (100.0%) |
| 8:30 AM to 8:59 AM | 0 (0.0%) | 0 (0.0%) |
| 9:00 AM to 9:59 AM | 0 (0.0%) | 0 (0.0%) |
| 10:00 AM to 10:59 AM | 0 (0.0%) | 0 (0.0%) |
| 11:00 AM to 11:59 AM | 0 (0.0%) | 0 (0.0%) |
| 12:00 PM to 3:59 PM | 0 (0.0%) | 0 (0.0%) |
| 4:00 PM to 11:59 PM | 63 (26.0%) | 0 (0.0%) |
| Total | 242 (100.0%) | 22 (100.0%) |
Housing Occupancy in Osino
Occupancy by Ownership in Osino
Of the total 324 dwellings in Osino, owner-occupied units account for 183 (56.5%), while renter-occupied units make up 141 (43.5%).
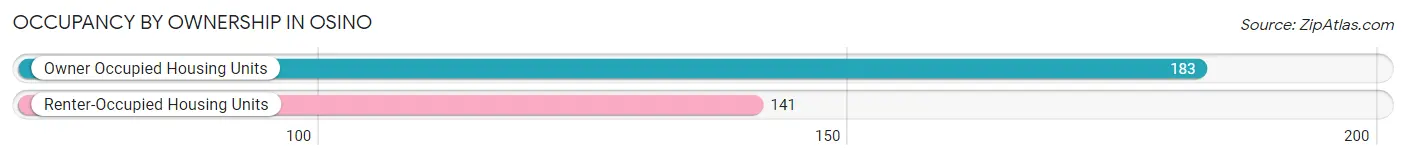
| Occupancy | # Housing Units | % Housing Units |
| Owner Occupied Housing Units | 183 | 56.5% |
| Renter-Occupied Housing Units | 141 | 43.5% |
| Total Occupied Housing Units | 324 | 100.0% |
Occupancy by Household Size in Osino
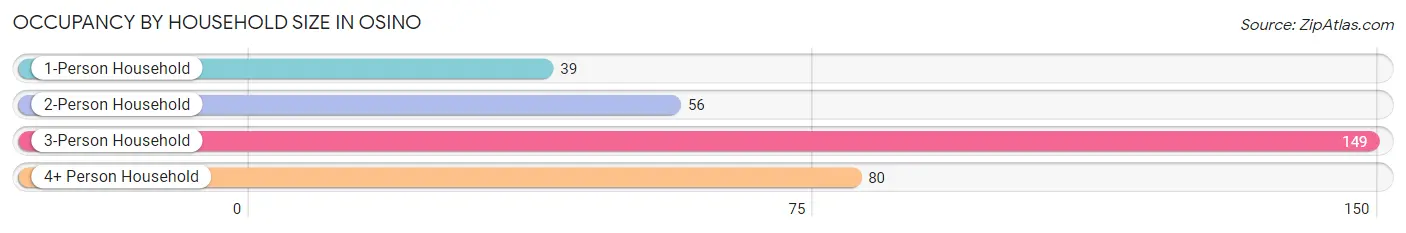
| Household Size | # Housing Units | % Housing Units |
| 1-Person Household | 39 | 12.0% |
| 2-Person Household | 56 | 17.3% |
| 3-Person Household | 149 | 46.0% |
| 4+ Person Household | 80 | 24.7% |
| Total Housing Units | 324 | 100.0% |
Occupancy by Ownership by Household Size in Osino
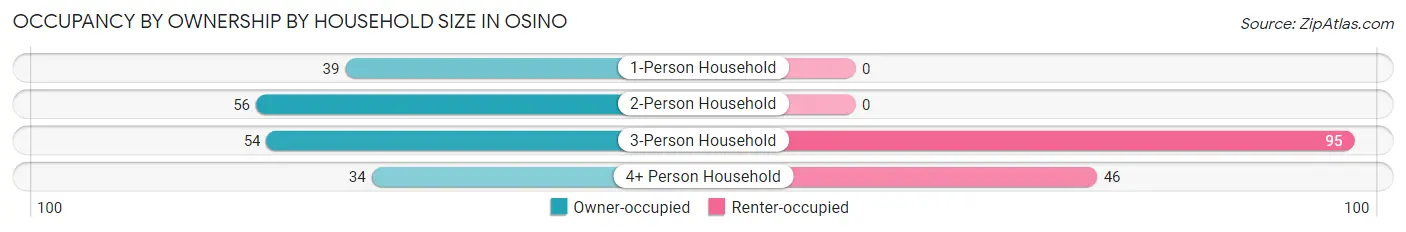
| Household Size | Owner-occupied | Renter-occupied |
| 1-Person Household | 39 (100.0%) | 0 (0.0%) |
| 2-Person Household | 56 (100.0%) | 0 (0.0%) |
| 3-Person Household | 54 (36.2%) | 95 (63.8%) |
| 4+ Person Household | 34 (42.5%) | 46 (57.5%) |
| Total Housing Units | 183 (56.5%) | 141 (43.5%) |
Occupancy by Educational Attainment in Osino
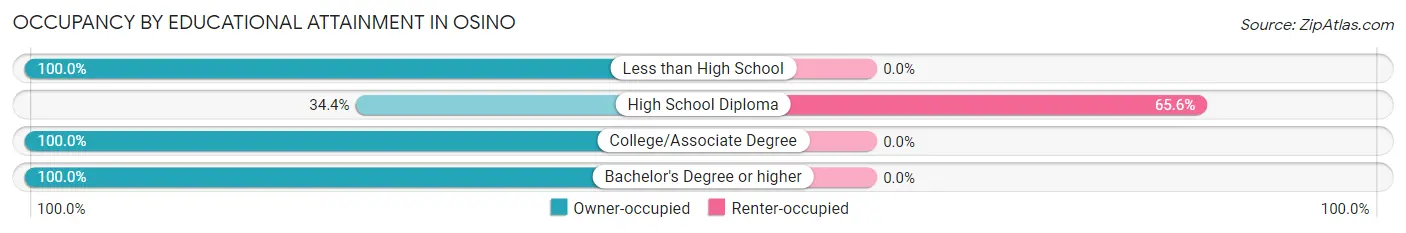
| Household Size | Owner-occupied | Renter-occupied |
| Less than High School | 5 (100.0%) | 0 (0.0%) |
| High School Diploma | 74 (34.4%) | 141 (65.6%) |
| College/Associate Degree | 83 (100.0%) | 0 (0.0%) |
| Bachelor's Degree or higher | 21 (100.0%) | 0 (0.0%) |
Occupancy by Age of Householder in Osino
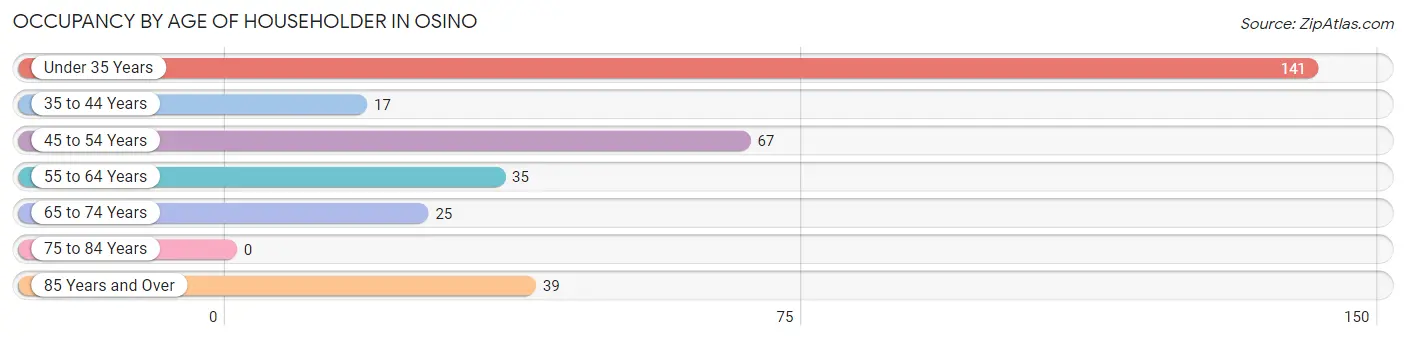
| Age Bracket | # Households | % Households |
| Under 35 Years | 141 | 43.5% |
| 35 to 44 Years | 17 | 5.2% |
| 45 to 54 Years | 67 | 20.7% |
| 55 to 64 Years | 35 | 10.8% |
| 65 to 74 Years | 25 | 7.7% |
| 75 to 84 Years | 0 | 0.0% |
| 85 Years and Over | 39 | 12.0% |
| Total | 324 | 100.0% |
Housing Finances in Osino
Median Income by Occupancy in Osino
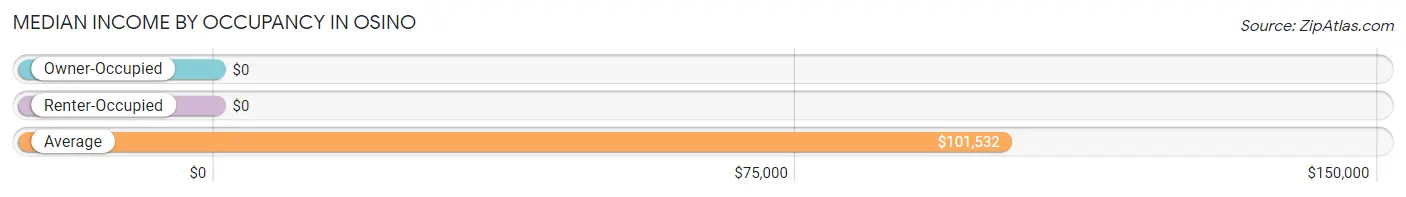
| Occupancy Type | # Households | Median Income |
| Owner-Occupied | 183 (56.5%) | $0 |
| Renter-Occupied | 141 (43.5%) | $0 |
| Average | 324 (100.0%) | $101,532 |
Occupancy by Householder Income Bracket in Osino
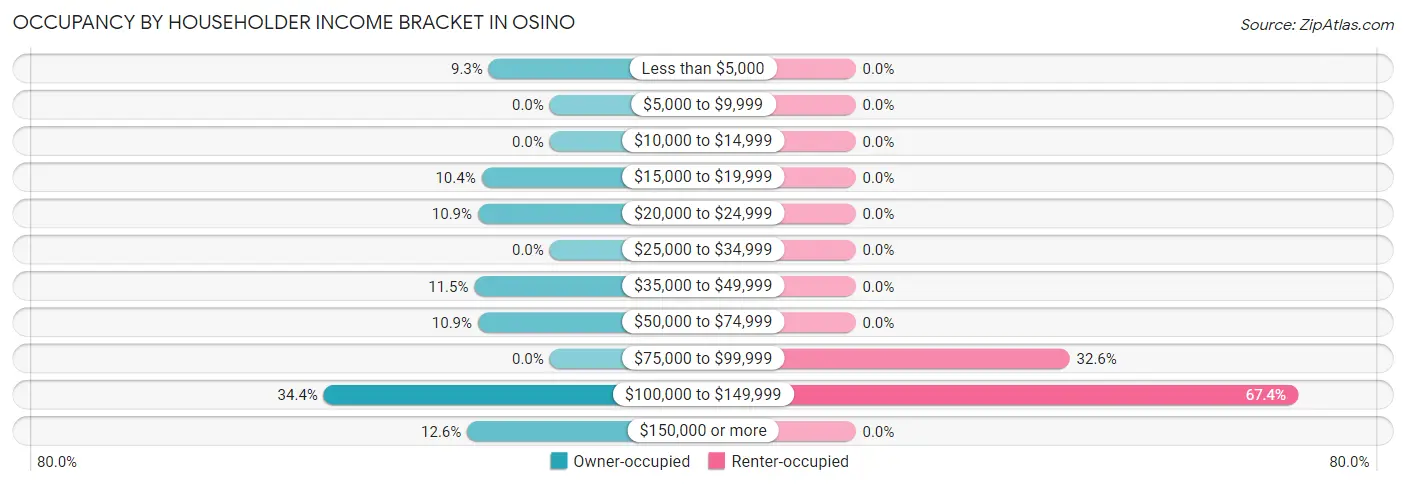
| Income Bracket | Owner-occupied | Renter-occupied |
| Less than $5,000 | 17 (9.3%) | 0 (0.0%) |
| $5,000 to $9,999 | 0 (0.0%) | 0 (0.0%) |
| $10,000 to $14,999 | 0 (0.0%) | 0 (0.0%) |
| $15,000 to $19,999 | 19 (10.4%) | 0 (0.0%) |
| $20,000 to $24,999 | 20 (10.9%) | 0 (0.0%) |
| $25,000 to $34,999 | 0 (0.0%) | 0 (0.0%) |
| $35,000 to $49,999 | 21 (11.5%) | 0 (0.0%) |
| $50,000 to $74,999 | 20 (10.9%) | 0 (0.0%) |
| $75,000 to $99,999 | 0 (0.0%) | 46 (32.6%) |
| $100,000 to $149,999 | 63 (34.4%) | 95 (67.4%) |
| $150,000 or more | 23 (12.6%) | 0 (0.0%) |
| Total | 183 (100.0%) | 141 (100.0%) |
Monthly Housing Cost Tiers in Osino
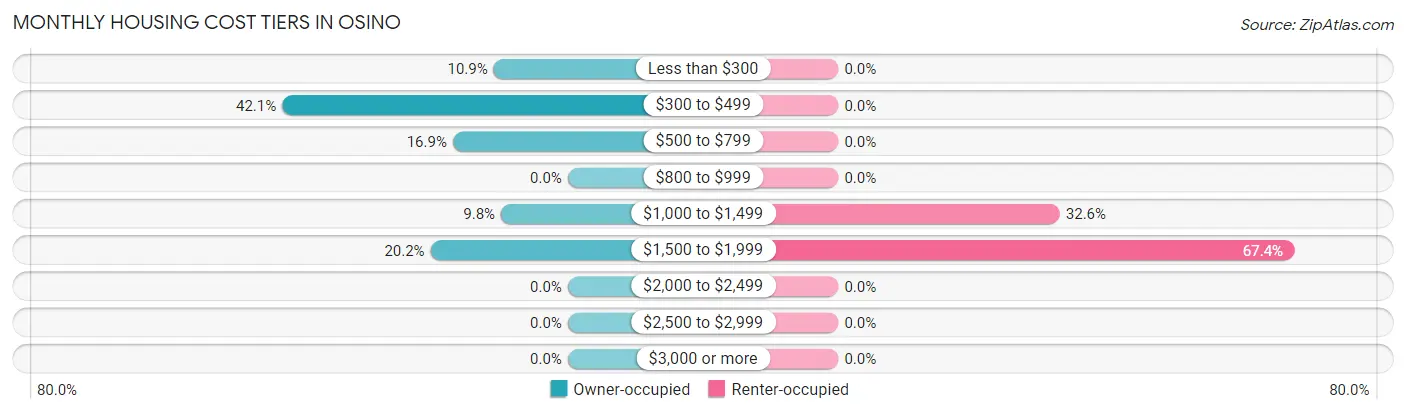
| Monthly Cost | Owner-occupied | Renter-occupied |
| Less than $300 | 20 (10.9%) | 0 (0.0%) |
| $300 to $499 | 77 (42.1%) | 0 (0.0%) |
| $500 to $799 | 31 (16.9%) | 0 (0.0%) |
| $800 to $999 | 0 (0.0%) | 0 (0.0%) |
| $1,000 to $1,499 | 18 (9.8%) | 46 (32.6%) |
| $1,500 to $1,999 | 37 (20.2%) | 95 (67.4%) |
| $2,000 to $2,499 | 0 (0.0%) | 0 (0.0%) |
| $2,500 to $2,999 | 0 (0.0%) | 0 (0.0%) |
| $3,000 or more | 0 (0.0%) | 0 (0.0%) |
| Total | 183 (100.0%) | 141 (100.0%) |
Physical Housing Characteristics in Osino
Housing Structures in Osino
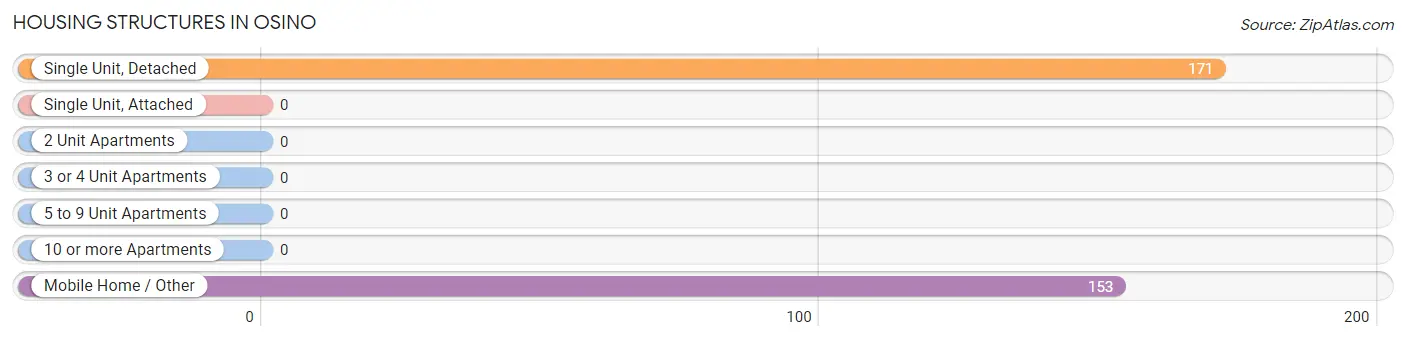
| Structure Type | # Housing Units | % Housing Units |
| Single Unit, Detached | 171 | 52.8% |
| Single Unit, Attached | 0 | 0.0% |
| 2 Unit Apartments | 0 | 0.0% |
| 3 or 4 Unit Apartments | 0 | 0.0% |
| 5 to 9 Unit Apartments | 0 | 0.0% |
| 10 or more Apartments | 0 | 0.0% |
| Mobile Home / Other | 153 | 47.2% |
| Total | 324 | 100.0% |
Housing Structures by Occupancy in Osino
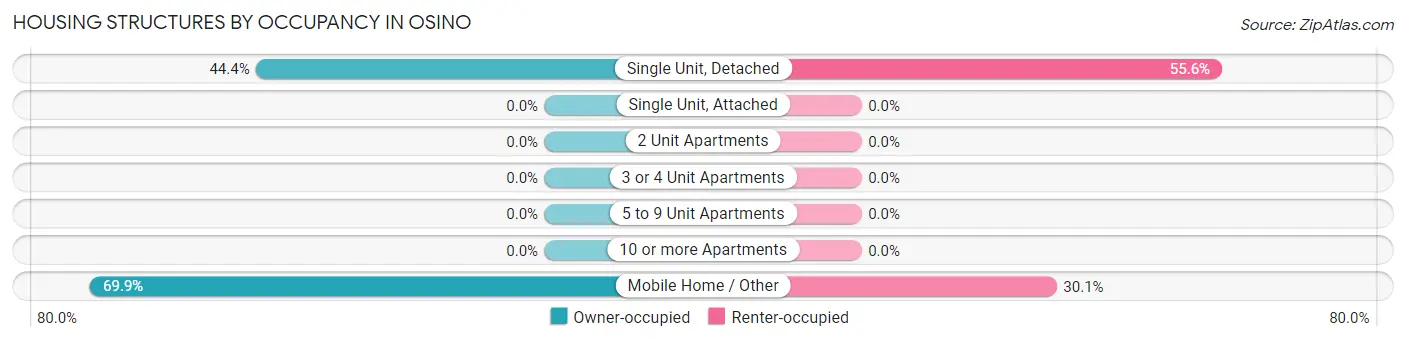
| Structure Type | Owner-occupied | Renter-occupied |
| Single Unit, Detached | 76 (44.4%) | 95 (55.6%) |
| Single Unit, Attached | 0 (0.0%) | 0 (0.0%) |
| 2 Unit Apartments | 0 (0.0%) | 0 (0.0%) |
| 3 or 4 Unit Apartments | 0 (0.0%) | 0 (0.0%) |
| 5 to 9 Unit Apartments | 0 (0.0%) | 0 (0.0%) |
| 10 or more Apartments | 0 (0.0%) | 0 (0.0%) |
| Mobile Home / Other | 107 (69.9%) | 46 (30.1%) |
| Total | 183 (56.5%) | 141 (43.5%) |
Housing Structures by Number of Rooms in Osino
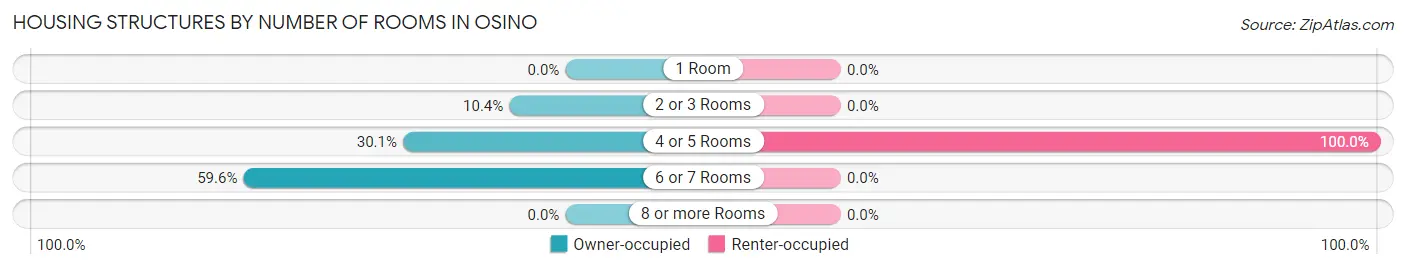
| Number of Rooms | Owner-occupied | Renter-occupied |
| 1 Room | 0 (0.0%) | 0 (0.0%) |
| 2 or 3 Rooms | 19 (10.4%) | 0 (0.0%) |
| 4 or 5 Rooms | 55 (30.0%) | 141 (100.0%) |
| 6 or 7 Rooms | 109 (59.6%) | 0 (0.0%) |
| 8 or more Rooms | 0 (0.0%) | 0 (0.0%) |
| Total | 183 (100.0%) | 141 (100.0%) |
Housing Structure by Heating Type in Osino
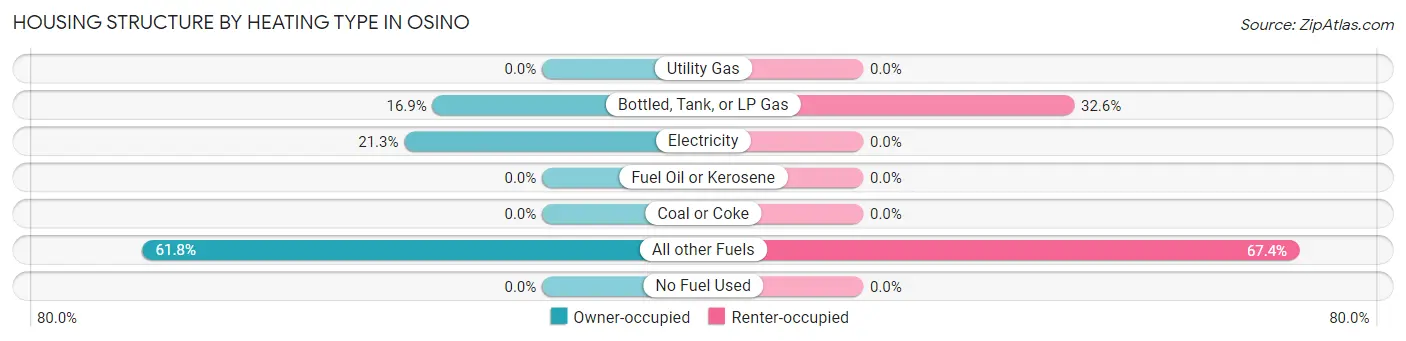
| Heating Type | Owner-occupied | Renter-occupied |
| Utility Gas | 0 (0.0%) | 0 (0.0%) |
| Bottled, Tank, or LP Gas | 31 (16.9%) | 46 (32.6%) |
| Electricity | 39 (21.3%) | 0 (0.0%) |
| Fuel Oil or Kerosene | 0 (0.0%) | 0 (0.0%) |
| Coal or Coke | 0 (0.0%) | 0 (0.0%) |
| All other Fuels | 113 (61.8%) | 95 (67.4%) |
| No Fuel Used | 0 (0.0%) | 0 (0.0%) |
| Total | 183 (100.0%) | 141 (100.0%) |
Household Vehicle Usage in Osino
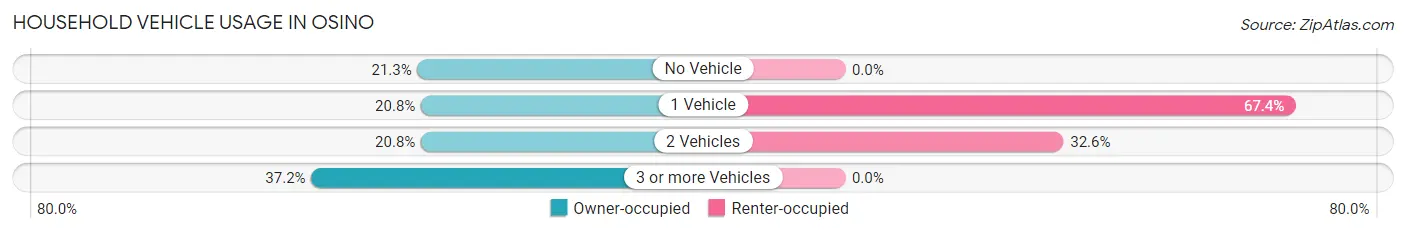
| Vehicles per Household | Owner-occupied | Renter-occupied |
| No Vehicle | 39 (21.3%) | 0 (0.0%) |
| 1 Vehicle | 38 (20.8%) | 95 (67.4%) |
| 2 Vehicles | 38 (20.8%) | 46 (32.6%) |
| 3 or more Vehicles | 68 (37.2%) | 0 (0.0%) |
| Total | 183 (100.0%) | 141 (100.0%) |
Real Estate & Mortgages in Osino
Real Estate and Mortgage Overview in Osino
| Characteristic | Without Mortgage | With Mortgage |
| Housing Units | 128 | 55 |
| Median Property Value | $119,300 | $195,800 |
| Median Household Income | $48,452 | $23 |
| Monthly Housing Costs | $442 | $0 |
| Real Estate Taxes | - | - |
Property Value by Mortgage Status in Osino
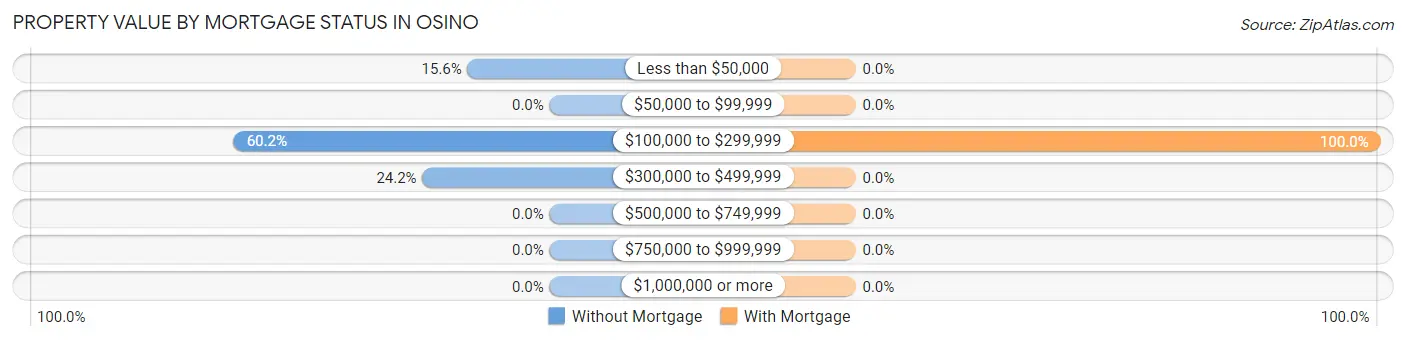
| Property Value | Without Mortgage | With Mortgage |
| Less than $50,000 | 20 (15.6%) | 0 (0.0%) |
| $50,000 to $99,999 | 0 (0.0%) | 0 (0.0%) |
| $100,000 to $299,999 | 77 (60.2%) | 55 (100.0%) |
| $300,000 to $499,999 | 31 (24.2%) | 0 (0.0%) |
| $500,000 to $749,999 | 0 (0.0%) | 0 (0.0%) |
| $750,000 to $999,999 | 0 (0.0%) | 0 (0.0%) |
| $1,000,000 or more | 0 (0.0%) | 0 (0.0%) |
| Total | 128 (100.0%) | 55 (100.0%) |
Household Income by Mortgage Status in Osino
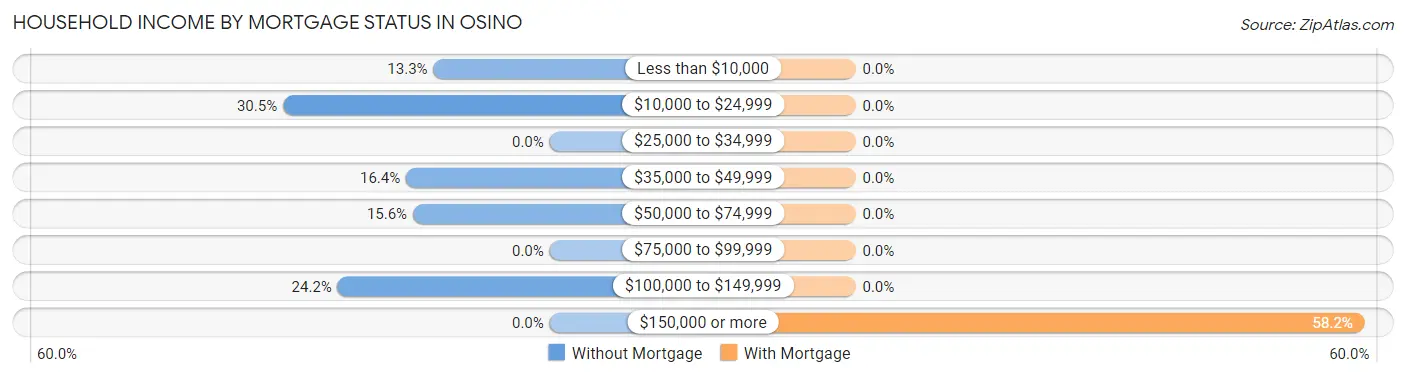
| Household Income | Without Mortgage | With Mortgage |
| Less than $10,000 | 17 (13.3%) | 0 (0.0%) |
| $10,000 to $24,999 | 39 (30.5%) | 0 (0.0%) |
| $25,000 to $34,999 | 0 (0.0%) | 0 (0.0%) |
| $35,000 to $49,999 | 21 (16.4%) | 0 (0.0%) |
| $50,000 to $74,999 | 20 (15.6%) | 0 (0.0%) |
| $75,000 to $99,999 | 0 (0.0%) | 0 (0.0%) |
| $100,000 to $149,999 | 31 (24.2%) | 0 (0.0%) |
| $150,000 or more | 0 (0.0%) | 32 (58.2%) |
| Total | 128 (100.0%) | 55 (100.0%) |
Property Value to Household Income Ratio in Osino
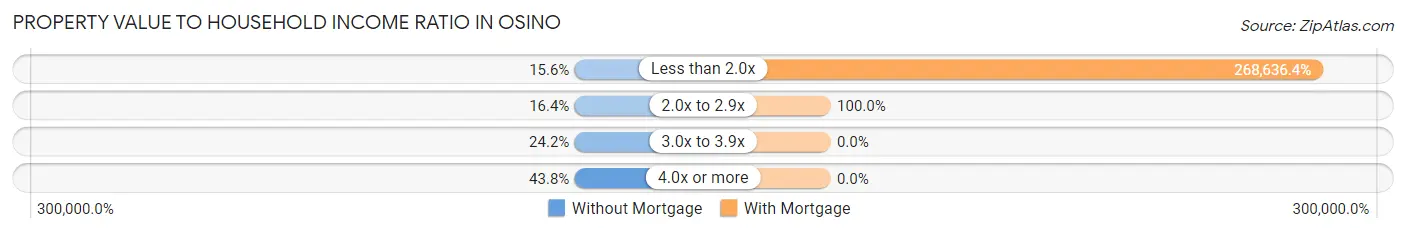
| Value-to-Income Ratio | Without Mortgage | With Mortgage |
| Less than 2.0x | 20 (15.6%) | 147,750 (268,636.4%) |
| 2.0x to 2.9x | 21 (16.4%) | 55 (100.0%) |
| 3.0x to 3.9x | 31 (24.2%) | 0 (0.0%) |
| 4.0x or more | 56 (43.8%) | 0 (0.0%) |
| Total | 128 (100.0%) | 55 (100.0%) |
Real Estate Taxes by Mortgage Status in Osino
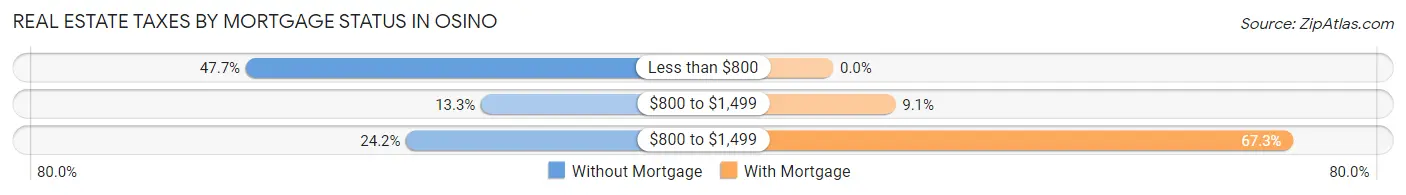
| Property Taxes | Without Mortgage | With Mortgage |
| Less than $800 | 61 (47.7%) | 0 (0.0%) |
| $800 to $1,499 | 17 (13.3%) | 5 (9.1%) |
| $800 to $1,499 | 31 (24.2%) | 37 (67.3%) |
| Total | 128 (100.0%) | 55 (100.0%) |
Health & Disability in Osino
Health Insurance Coverage by Age in Osino
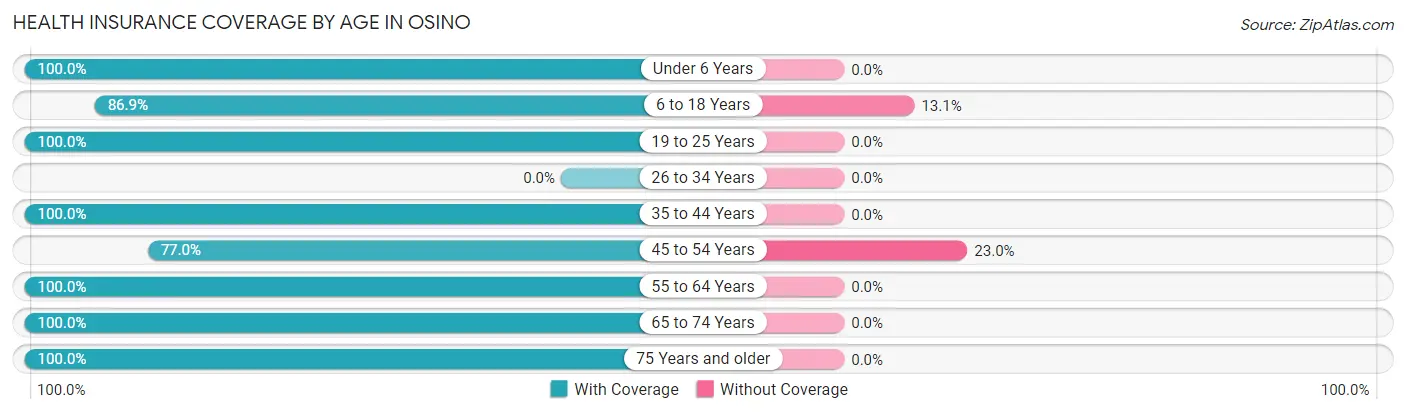
| Age Bracket | With Coverage | Without Coverage |
| Under 6 Years | 151 (100.0%) | 0 (0.0%) |
| 6 to 18 Years | 312 (86.9%) | 47 (13.1%) |
| 19 to 25 Years | 215 (100.0%) | 0 (0.0%) |
| 26 to 34 Years | 0 (0.0%) | 0 (0.0%) |
| 35 to 44 Years | 17 (100.0%) | 0 (0.0%) |
| 45 to 54 Years | 104 (77.0%) | 31 (23.0%) |
| 55 to 64 Years | 77 (100.0%) | 0 (0.0%) |
| 65 to 74 Years | 58 (100.0%) | 0 (0.0%) |
| 75 Years and older | 39 (100.0%) | 0 (0.0%) |
| Total | 973 (92.6%) | 78 (7.4%) |
Health Insurance Coverage by Citizenship Status in Osino
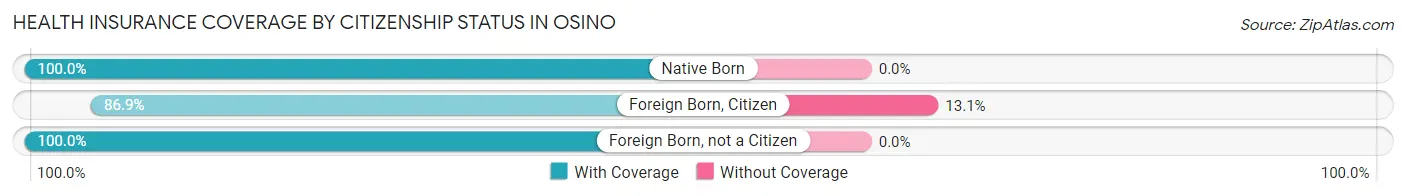
| Citizenship Status | With Coverage | Without Coverage |
| Native Born | 151 (100.0%) | 0 (0.0%) |
| Foreign Born, Citizen | 312 (86.9%) | 47 (13.1%) |
| Foreign Born, not a Citizen | 215 (100.0%) | 0 (0.0%) |
Health Insurance Coverage by Household Income in Osino
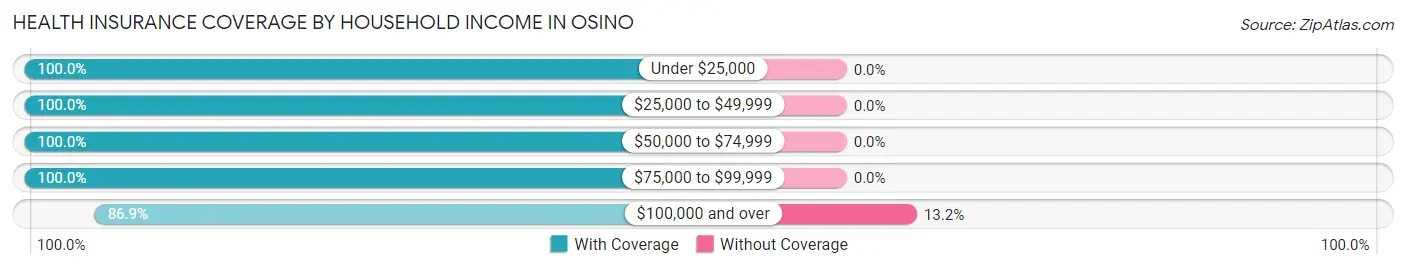
| Household Income | With Coverage | Without Coverage |
| Under $25,000 | 62 (100.0%) | 0 (0.0%) |
| $25,000 to $49,999 | 174 (100.0%) | 0 (0.0%) |
| $50,000 to $74,999 | 38 (100.0%) | 0 (0.0%) |
| $75,000 to $99,999 | 184 (100.0%) | 0 (0.0%) |
| $100,000 and over | 515 (86.9%) | 78 (13.2%) |
Public vs Private Health Insurance Coverage by Age in Osino
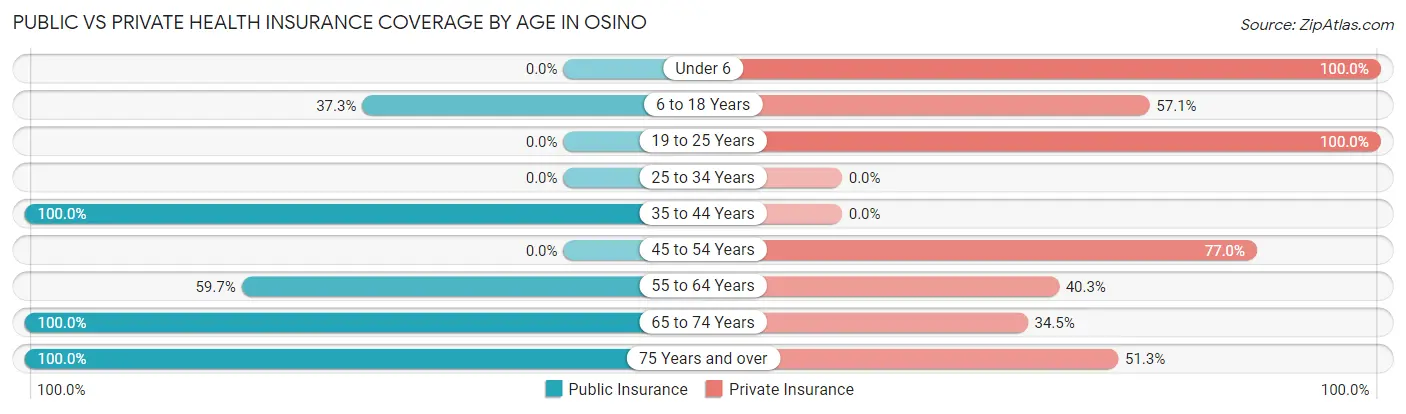
| Age Bracket | Public Insurance | Private Insurance |
| Under 6 | 0 (0.0%) | 151 (100.0%) |
| 6 to 18 Years | 134 (37.3%) | 205 (57.1%) |
| 19 to 25 Years | 0 (0.0%) | 215 (100.0%) |
| 25 to 34 Years | 0 (0.0%) | 0 (0.0%) |
| 35 to 44 Years | 17 (100.0%) | 0 (0.0%) |
| 45 to 54 Years | 0 (0.0%) | 104 (77.0%) |
| 55 to 64 Years | 46 (59.7%) | 31 (40.3%) |
| 65 to 74 Years | 58 (100.0%) | 20 (34.5%) |
| 75 Years and over | 39 (100.0%) | 20 (51.3%) |
| Total | 294 (28.0%) | 746 (71.0%) |
Disability Status by Sex by Age in Osino
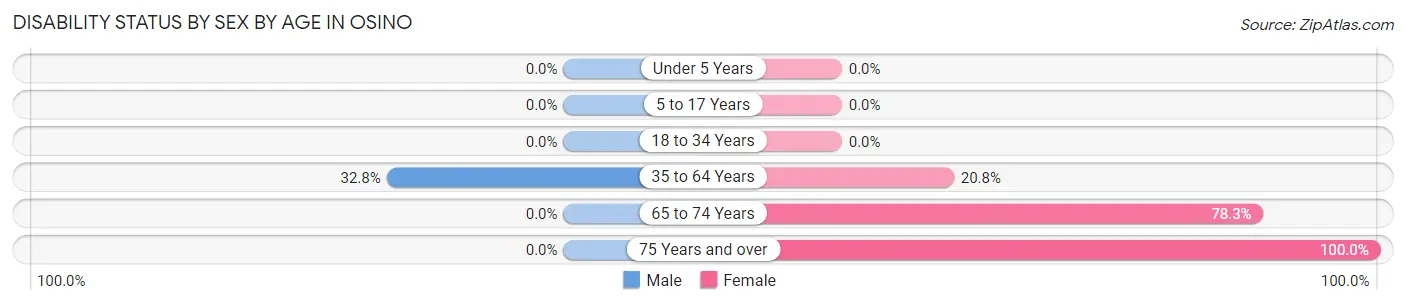
| Age Bracket | Male | Female |
| Under 5 Years | 0 (0.0%) | 0 (0.0%) |
| 5 to 17 Years | 0 (0.0%) | 0 (0.0%) |
| 18 to 34 Years | 0 (0.0%) | 0 (0.0%) |
| 35 to 64 Years | 42 (32.8%) | 21 (20.8%) |
| 65 to 74 Years | 0 (0.0%) | 18 (78.3%) |
| 75 Years and over | 0 (0.0%) | 39 (100.0%) |
Disability Class by Sex by Age in Osino
Disability Class: Hearing Difficulty
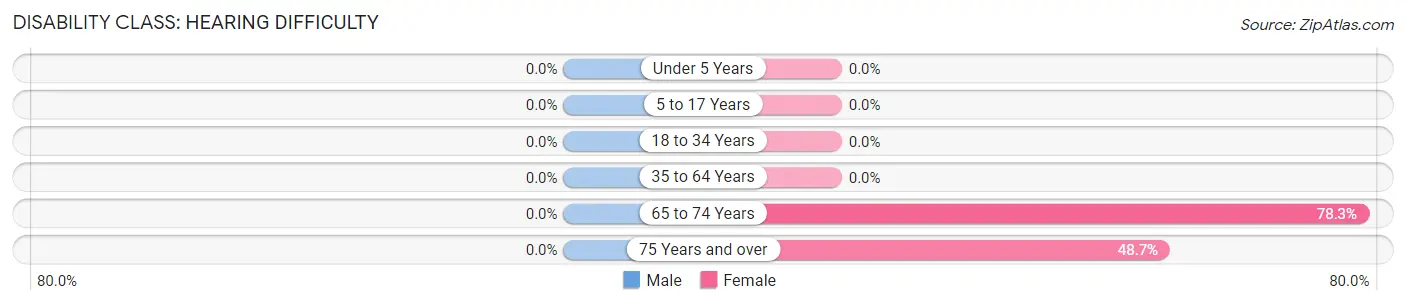
| Age Bracket | Male | Female |
| Under 5 Years | 0 (0.0%) | 0 (0.0%) |
| 5 to 17 Years | 0 (0.0%) | 0 (0.0%) |
| 18 to 34 Years | 0 (0.0%) | 0 (0.0%) |
| 35 to 64 Years | 0 (0.0%) | 0 (0.0%) |
| 65 to 74 Years | 0 (0.0%) | 18 (78.3%) |
| 75 Years and over | 0 (0.0%) | 19 (48.7%) |
Disability Class: Vision Difficulty
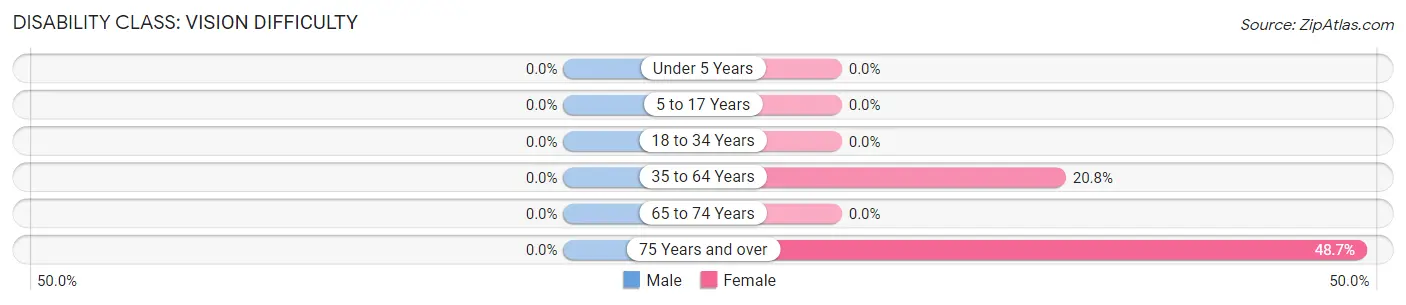
| Age Bracket | Male | Female |
| Under 5 Years | 0 (0.0%) | 0 (0.0%) |
| 5 to 17 Years | 0 (0.0%) | 0 (0.0%) |
| 18 to 34 Years | 0 (0.0%) | 0 (0.0%) |
| 35 to 64 Years | 0 (0.0%) | 21 (20.8%) |
| 65 to 74 Years | 0 (0.0%) | 0 (0.0%) |
| 75 Years and over | 0 (0.0%) | 19 (48.7%) |
Disability Class: Cognitive Difficulty
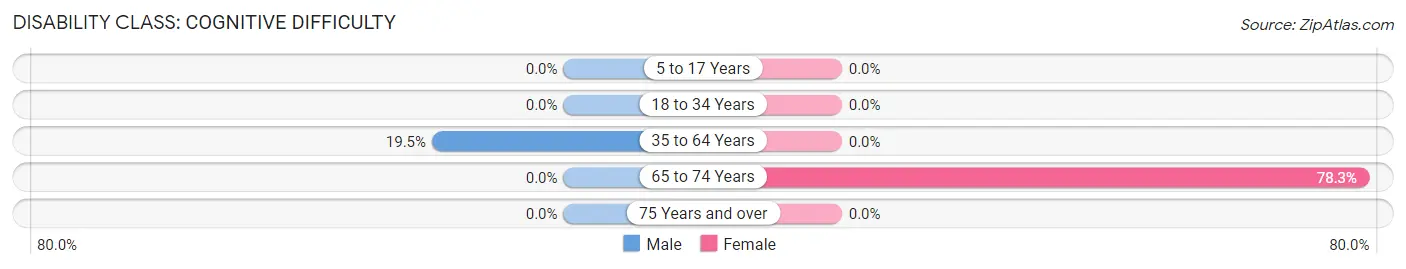
| Age Bracket | Male | Female |
| 5 to 17 Years | 0 (0.0%) | 0 (0.0%) |
| 18 to 34 Years | 0 (0.0%) | 0 (0.0%) |
| 35 to 64 Years | 25 (19.5%) | 0 (0.0%) |
| 65 to 74 Years | 0 (0.0%) | 18 (78.3%) |
| 75 Years and over | 0 (0.0%) | 0 (0.0%) |
Disability Class: Ambulatory Difficulty
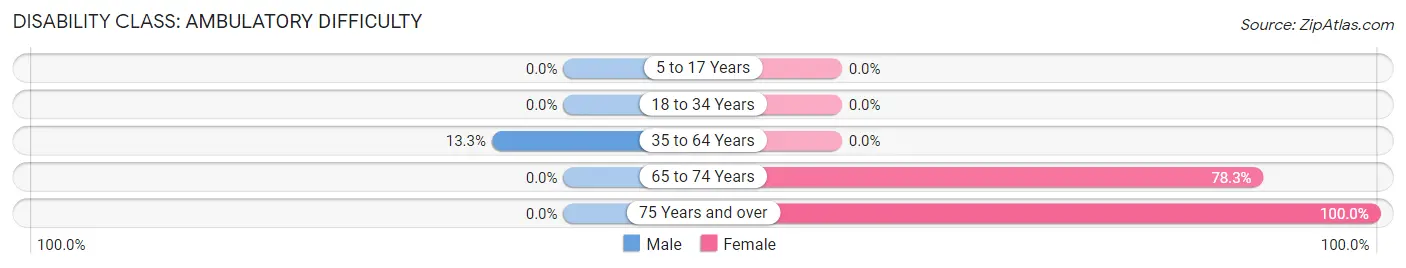
| Age Bracket | Male | Female |
| 5 to 17 Years | 0 (0.0%) | 0 (0.0%) |
| 18 to 34 Years | 0 (0.0%) | 0 (0.0%) |
| 35 to 64 Years | 17 (13.3%) | 0 (0.0%) |
| 65 to 74 Years | 0 (0.0%) | 18 (78.3%) |
| 75 Years and over | 0 (0.0%) | 39 (100.0%) |
Disability Class: Self-Care Difficulty
| Age Bracket | Male | Female |
| 5 to 17 Years | 0 (0.0%) | 0 (0.0%) |
| 18 to 34 Years | 0 (0.0%) | 0 (0.0%) |
| 35 to 64 Years | 0 (0.0%) | 0 (0.0%) |
| 65 to 74 Years | 0 (0.0%) | 0 (0.0%) |
| 75 Years and over | 0 (0.0%) | 0 (0.0%) |
Technology Access in Osino
Computing Device Access in Osino
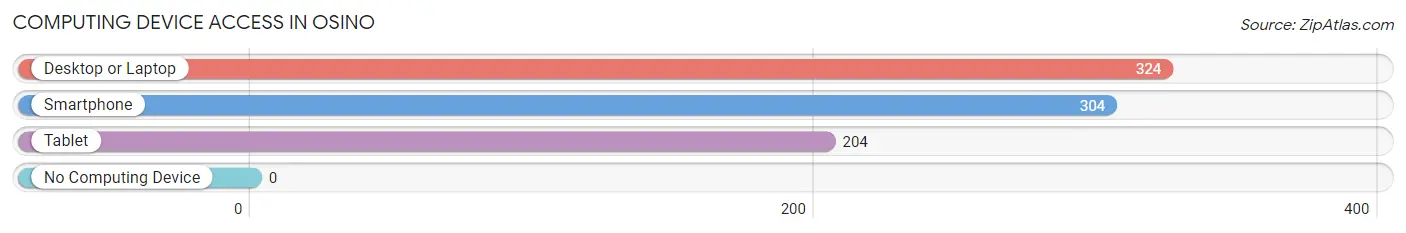
| Device Type | # Households | % Households |
| Desktop or Laptop | 324 | 100.0% |
| Smartphone | 304 | 93.8% |
| Tablet | 204 | 63.0% |
| No Computing Device | 0 | 0.0% |
| Total | 324 | 100.0% |
Internet Access in Osino
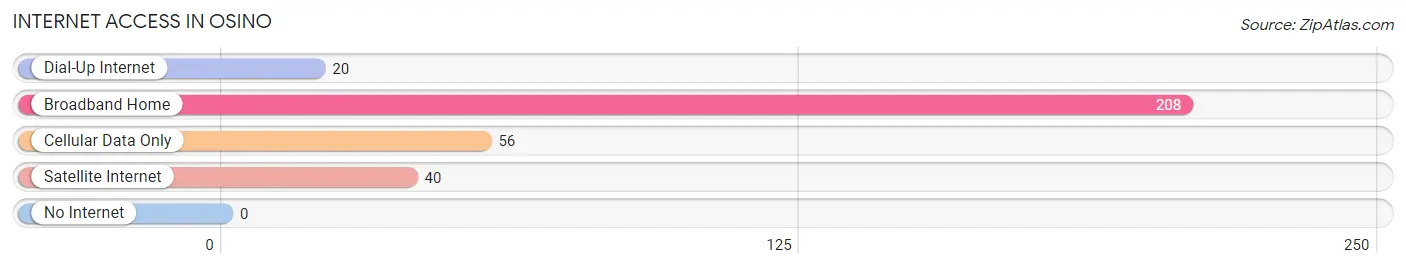
| Internet Type | # Households | % Households |
| Dial-Up Internet | 20 | 6.2% |
| Broadband Home | 208 | 64.2% |
| Cellular Data Only | 56 | 17.3% |
| Satellite Internet | 40 | 12.3% |
| No Internet | 0 | 0.0% |
| Total | 324 | 100.0% |
Osino Summary
Osino is a small unincorporated community located in Elko County, Nevada. It is situated in the northeastern part of the state, approximately 20 miles south of the Utah border. The population of Osino was estimated to be around 200 people in 2020.
History
Osino was founded in 1869 by a group of prospectors who were searching for gold in the area. The town was named after the nearby Osino Creek, which was named after a Paiute chief who lived in the area. The town quickly grew and by the early 1900s, it had become a bustling mining town with a population of over 1,000 people.
The town was home to several businesses, including a general store, a saloon, a hotel, and a post office. The town also had a school, a church, and a cemetery.
In the early 1900s, the town began to decline as the gold rush ended and the population began to dwindle. By the 1950s, the population had dropped to around 200 people.
Geography
Osino is located in the northeastern part of Nevada, approximately 20 miles south of the Utah border. The town is situated in the Great Basin Desert, which is characterized by its dry climate and sparse vegetation.
The town is located in the Osino Valley, which is surrounded by the Ruby Mountains to the east and the Jarbidge Mountains to the west. The valley is home to several small creeks and streams, including Osino Creek, which is the namesake of the town.
Economy
The economy of Osino is largely based on agriculture and ranching. The town is home to several farms and ranches, which produce a variety of crops and livestock.
The town is also home to several small businesses, including a general store, a saloon, and a post office.
Demographics
As of 2020, the population of Osino was estimated to be around 200 people. The town is predominantly white, with a small Hispanic population. The median household income in Osino is around $35,000, which is lower than the national average.
Conclusion
Osino is a small unincorporated community located in Elko County, Nevada. It was founded in 1869 by a group of prospectors who were searching for gold in the area. The town is situated in the Great Basin Desert and is home to several farms and ranches, as well as a few small businesses. The population of Osino was estimated to be around 200 people in 2020. The town is predominantly white, with a small Hispanic population, and the median household income is around $35,000.
Common Questions
What is Per Capita Income in Osino?
Per Capita income in Osino is $30,816.
What is the Median Family Income in Osino?
Median Family Income in Osino is $111,442.
What is the Median Household income in Osino?
Median Household Income in Osino is $101,532.
What is Inequality or Gini Index in Osino?
Inequality or Gini Index in Osino is 0.28.
What is the Total Population of Osino?
Total Population of Osino is 1,051.
What is the Total Male Population of Osino?
Total Male Population of Osino is 567.
What is the Total Female Population of Osino?
Total Female Population of Osino is 484.
What is the Ratio of Males per 100 Females in Osino?
There are 117.15 Males per 100 Females in Osino.
What is the Ratio of Females per 100 Males in Osino?
There are 85.36 Females per 100 Males in Osino.
What is the Median Population Age in Osino?
Median Population Age in Osino is 25.1 Years.
What is the Average Family Size in Osino
Average Family Size in Osino is 3.5 People.
What is the Average Household Size in Osino
Average Household Size in Osino is 3.2 People.
How Large is the Labor Force in Osino?
There are 277 People in the Labor Forcein in Osino.
What is the Percentage of People in the Labor Force in Osino?
46.6% of People are in the Labor Force in Osino.