Zip Codes with the Highest Percentage of Families with Income Below $10,000 in North Dakota
RELATED REPORTS & OPTIONS
Family Income | $0-10k
North Dakota
Compare Zip Codes
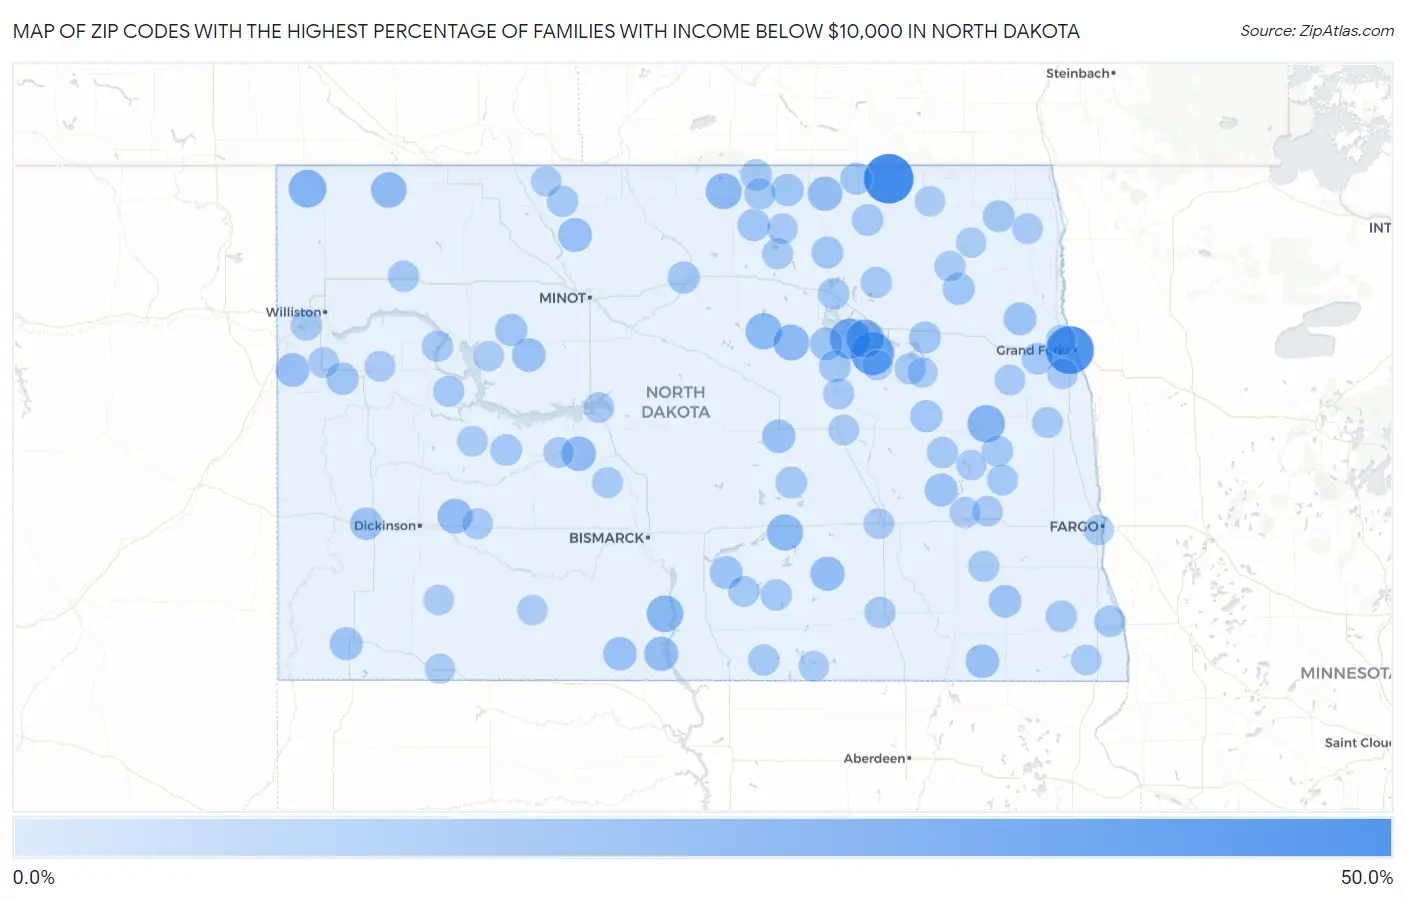
Map of Zip Codes with the Highest Percentage of Families with Income Below $10,000 in North Dakota
0.0%
50.0%
Zip Codes with the Highest Percentage of Families with Income Below $10,000 in North Dakota
| Zip Code | Families with Income < $10k | vs State | vs National | |
| 1. | 58239 | 50.0% | 2.0%(+48.0)#1 | 3.1%(+46.9)#68 |
| 2. | 58202 | 45.5% | 2.0%(+43.5)#2 | 3.1%(+42.4)#79 |
| 3. | 58379 | 33.3% | 2.0%(+31.3)#3 | 3.1%(+30.2)#156 |
| 4. | 58335 | 27.2% | 2.0%(+25.2)#4 | 3.1%(+24.1)#245 |
| 5. | 58370 | 22.2% | 2.0%(+20.2)#5 | 3.1%(+19.1)#396 |
| 6. | 58844 | 20.8% | 2.0%(+18.8)#6 | 3.1%(+17.7)#446 |
| 7. | 58230 | 19.9% | 2.0%(+17.9)#7 | 3.1%(+16.8)#488 |
| 8. | 58528 | 17.9% | 2.0%(+15.9)#8 | 3.1%(+14.8)#591 |
| 9. | 58332 | 17.1% | 2.0%(+15.1)#9 | 3.1%(+14.0)#664 |
| 10. | 58487 | 16.8% | 2.0%(+14.8)#10 | 3.1%(+13.7)#685 |
| 11. | 58329 | 16.4% | 2.0%(+14.4)#11 | 3.1%(+13.3)#713 |
| 12. | 58348 | 16.2% | 2.0%(+14.2)#12 | 3.1%(+13.1)#738 |
| 13. | 58765 | 15.4% | 2.0%(+13.4)#13 | 3.1%(+12.3)#820 |
| 14. | 58656 | 13.6% | 2.0%(+11.6)#14 | 3.1%(+10.5)#1,039 |
| 15. | 58571 | 13.0% | 2.0%(+11.0)#15 | 3.1%(+9.90)#1,124 |
| 16. | 58365 | 12.7% | 2.0%(+10.7)#16 | 3.1%(+9.60)#1,194 |
| 17. | 58442 | 12.2% | 2.0%(+10.2)#17 | 3.1%(+9.10)#1,292 |
| 18. | 58538 | 12.1% | 2.0%(+10.1)#18 | 3.1%(+9.00)#1,303 |
| 19. | 58750 | 11.3% | 2.0%(+9.30)#19 | 3.1%(+8.20)#1,522 |
| 20. | 58838 | 11.1% | 2.0%(+9.10)#20 | 3.1%(+8.00)#1,576 |
| 21. | 58779 | 10.7% | 2.0%(+8.70)#21 | 3.1%(+7.60)#1,695 |
| 22. | 58017 | 10.5% | 2.0%(+8.50)#22 | 3.1%(+7.40)#1,764 |
| 23. | 58418 | 10.3% | 2.0%(+8.30)#23 | 3.1%(+7.20)#1,818 |
| 24. | 58568 | 10.1% | 2.0%(+8.10)#24 | 3.1%(+7.00)#1,897 |
| 25. | 58479 | 9.3% | 2.0%(+7.30)#25 | 3.1%(+6.20)#2,236 |
| 26. | 58524 | 9.1% | 2.0%(+7.10)#26 | 3.1%(+6.00)#2,351 |
| 27. | 58623 | 9.0% | 2.0%(+7.00)#27 | 3.1%(+5.90)#2,382 |
| 28. | 58235 | 8.9% | 2.0%(+6.90)#28 | 3.1%(+5.80)#2,442 |
| 29. | 58357 | 8.7% | 2.0%(+6.70)#29 | 3.1%(+5.60)#2,546 |
| 30. | 58054 | 8.2% | 2.0%(+6.20)#30 | 3.1%(+5.10)#2,865 |
| 31. | 58622 | 8.1% | 2.0%(+6.10)#31 | 3.1%(+5.00)#2,927 |
| 32. | 58367 | 7.7% | 2.0%(+5.70)#32 | 3.1%(+4.60)#3,158 |
| 33. | 58366 | 7.7% | 2.0%(+5.70)#33 | 3.1%(+4.60)#3,168 |
| 34. | 58771 | 7.6% | 2.0%(+5.60)#34 | 3.1%(+4.50)#3,253 |
| 35. | 58250 | 7.5% | 2.0%(+5.50)#35 | 3.1%(+4.40)#3,326 |
| 36. | 58835 | 7.4% | 2.0%(+5.40)#36 | 3.1%(+4.30)#3,375 |
| 37. | 58416 | 7.1% | 2.0%(+5.10)#37 | 3.1%(+4.00)#3,611 |
| 38. | 58788 | 6.7% | 2.0%(+4.70)#38 | 3.1%(+3.60)#3,962 |
| 39. | 58374 | 6.7% | 2.0%(+4.70)#39 | 3.1%(+3.60)#3,970 |
| 40. | 58324 | 6.5% | 2.0%(+4.50)#40 | 3.1%(+3.40)#4,171 |
| 41. | 58372 | 6.5% | 2.0%(+4.50)#41 | 3.1%(+3.40)#4,193 |
| 42. | 58344 | 6.4% | 2.0%(+4.40)#42 | 3.1%(+3.30)#4,270 |
| 43. | 58241 | 6.3% | 2.0%(+4.30)#43 | 3.1%(+3.20)#4,411 |
| 44. | 58228 | 6.1% | 2.0%(+4.10)#44 | 3.1%(+3.00)#4,617 |
| 45. | 58541 | 6.0% | 2.0%(+4.00)#45 | 3.1%(+2.90)#4,752 |
| 46. | 58369 | 5.9% | 2.0%(+3.90)#46 | 3.1%(+2.80)#4,865 |
| 47. | 58475 | 5.9% | 2.0%(+3.90)#47 | 3.1%(+2.80)#4,888 |
| 48. | 58352 | 5.7% | 2.0%(+3.70)#48 | 3.1%(+2.60)#5,120 |
| 49. | 58081 | 5.6% | 2.0%(+3.60)#49 | 3.1%(+2.50)#5,264 |
| 50. | 58325 | 5.6% | 2.0%(+3.60)#50 | 3.1%(+2.50)#5,289 |
| 51. | 58075 | 5.4% | 2.0%(+3.40)#51 | 3.1%(+2.30)#5,494 |
| 52. | 58761 | 5.4% | 2.0%(+3.40)#52 | 3.1%(+2.30)#5,565 |
| 53. | 58316 | 5.2% | 2.0%(+3.20)#53 | 3.1%(+2.10)#5,822 |
| 54. | 58561 | 5.2% | 2.0%(+3.20)#54 | 3.1%(+2.10)#5,886 |
| 55. | 58046 | 5.1% | 2.0%(+3.10)#55 | 3.1%(+2.00)#6,046 |
| 56. | 58853 | 5.1% | 2.0%(+3.10)#56 | 3.1%(+2.00)#6,055 |
| 57. | 58380 | 5.1% | 2.0%(+3.10)#57 | 3.1%(+2.00)#6,057 |
| 58. | 58448 | 5.1% | 2.0%(+3.10)#58 | 3.1%(+2.00)#6,061 |
| 59. | 58382 | 5.1% | 2.0%(+3.10)#59 | 3.1%(+2.00)#6,069 |
| 60. | 58763 | 4.9% | 2.0%(+2.90)#60 | 3.1%(+1.80)#6,347 |
| 61. | 58062 | 4.9% | 2.0%(+2.90)#61 | 3.1%(+1.80)#6,407 |
| 62. | 58852 | 4.8% | 2.0%(+2.80)#62 | 3.1%(+1.70)#6,543 |
| 63. | 58433 | 4.8% | 2.0%(+2.80)#63 | 3.1%(+1.70)#6,558 |
| 64. | 58757 | 4.8% | 2.0%(+2.80)#64 | 3.1%(+1.70)#6,560 |
| 65. | 58581 | 4.8% | 2.0%(+2.80)#65 | 3.1%(+1.70)#6,589 |
| 66. | 58356 | 4.7% | 2.0%(+2.70)#66 | 3.1%(+1.60)#6,746 |
| 67. | 58064 | 4.5% | 2.0%(+2.50)#67 | 3.1%(+1.40)#7,169 |
| 68. | 58549 | 4.5% | 2.0%(+2.50)#68 | 3.1%(+1.40)#7,174 |
| 69. | 58257 | 4.3% | 2.0%(+2.30)#69 | 3.1%(+1.20)#7,539 |
| 70. | 58385 | 4.3% | 2.0%(+2.30)#70 | 3.1%(+1.20)#7,610 |
| 71. | 58072 | 4.2% | 2.0%(+2.20)#71 | 3.1%(+1.10)#7,737 |
| 72. | 58652 | 4.2% | 2.0%(+2.20)#72 | 3.1%(+1.10)#7,833 |
| 73. | 58210 | 4.2% | 2.0%(+2.20)#73 | 3.1%(+1.10)#7,856 |
| 74. | 58854 | 4.0% | 2.0%(+2.00)#74 | 3.1%(+0.900)#8,231 |
| 75. | 58267 | 4.0% | 2.0%(+2.00)#75 | 3.1%(+0.900)#8,312 |
| 76. | 58530 | 4.0% | 2.0%(+2.00)#76 | 3.1%(+0.900)#8,322 |
| 77. | 58353 | 4.0% | 2.0%(+2.00)#77 | 3.1%(+0.900)#8,363 |
| 78. | 58831 | 3.9% | 2.0%(+1.90)#78 | 3.1%(+0.800)#8,600 |
| 79. | 58636 | 3.8% | 2.0%(+1.80)#79 | 3.1%(+0.700)#8,865 |
| 80. | 58063 | 3.8% | 2.0%(+1.80)#80 | 3.1%(+0.700)#8,903 |
| 81. | 58531 | 3.8% | 2.0%(+1.80)#81 | 3.1%(+0.700)#8,909 |
| 82. | 58276 | 3.7% | 2.0%(+1.70)#82 | 3.1%(+0.600)#9,195 |
| 83. | 58545 | 3.6% | 2.0%(+1.60)#83 | 3.1%(+0.500)#9,376 |
| 84. | 58278 | 3.6% | 2.0%(+1.60)#84 | 3.1%(+0.500)#9,399 |
| 85. | 58041 | 3.5% | 2.0%(+1.50)#85 | 3.1%(+0.400)#9,702 |
| 86. | 58413 | 3.4% | 2.0%(+1.40)#86 | 3.1%(+0.300)#10,051 |
| 87. | 58401 | 3.3% | 2.0%(+1.30)#87 | 3.1%(+0.200)#10,186 |
| 88. | 58421 | 3.3% | 2.0%(+1.30)#88 | 3.1%(+0.200)#10,306 |
| 89. | 58782 | 3.3% | 2.0%(+1.30)#89 | 3.1%(+0.200)#10,381 |
| 90. | 58650 | 3.3% | 2.0%(+1.30)#90 | 3.1%(+0.200)#10,384 |
| 91. | 58249 | 3.2% | 2.0%(+1.20)#91 | 3.1%(+0.100)#10,649 |
| 92. | 58533 | 3.1% | 2.0%(+1.10)#92 | 3.1%(=0.000)#11,031 |
| 93. | 58381 | 3.1% | 2.0%(+1.10)#93 | 3.1%(=0.000)#11,052 |
| 94. | 58203 | 3.0% | 2.0%(+1.000)#94 | 3.1%(-0.100)#11,184 |
| 95. | 58770 | 3.0% | 2.0%(+1.000)#95 | 3.1%(-0.100)#11,345 |
| 96. | 58639 | 2.9% | 2.0%(+0.900)#96 | 3.1%(-0.200)#11,697 |
| 97. | 58361 | 2.9% | 2.0%(+0.900)#97 | 3.1%(-0.200)#11,791 |
| 98. | 58056 | 2.9% | 2.0%(+0.900)#98 | 3.1%(-0.200)#11,797 |
| 99. | 58103 | 2.8% | 2.0%(+0.800)#99 | 3.1%(-0.300)#11,822 |
| 100. | 58227 | 2.8% | 2.0%(+0.800)#100 | 3.1%(-0.300)#12,162 |
Common Questions
What are the Top 10 Zip Codes with the Highest Percentage of Families with Income Below $10,000 in North Dakota?
Top 10 Zip Codes with the Highest Percentage of Families with Income Below $10,000 in North Dakota are:
What zip code has the Highest Percentage of Families with Income Below $10,000 in North Dakota?
58239 has the Highest Percentage of Families with Income Below $10,000 in North Dakota with 50.0%.
What is the Percentage of Families with Income Below $10,000 in the State of North Dakota?
Percentage of Families with Income Below $10,000 in North Dakota is 2.0%.
What is the Percentage of Families with Income Below $10,000 in the United States?
Percentage of Families with Income Below $10,000 in the United States is 3.1%.