Leal, ND Map & Demographics
Leal Map
Leal Overview
$34,500
PER CAPITA INCOME
0.51
INEQUALITY / GINI INDEX
9
TOTAL POPULATION
6
MALE POPULATION
3
FEMALE POPULATION
200.00
MALES / 100 FEMALES
50.00
FEMALES / 100 MALES
63.3
MEDIAN AGE
2.0
AVG FAMILY SIZE
1.5
AVG HOUSEHOLD SIZE
3
LABOR FORCE [ PEOPLE ]
33.3%
PERCENT IN LABOR FORCE
Leal Area Codes
Income in Leal
Income Overview in Leal
| Characteristic | Number | Measure |
| Per Capita Income | 9 | $34,500 |
| Median Family Income | 3 | $0 |
| Mean Family Income | 3 | $68,500 |
| Median Household Income | 6 | $0 |
| Mean Household Income | 6 | $51,750 |
| Income Deficit | 3 | $0 |
| Wage / Income Gap (%) | 9 | 0.00% |
| Wage / Income Gap ($) | 9 | 100.00¢ per $1 |
| Gini / Inequality Index | 9 | 0.51 |
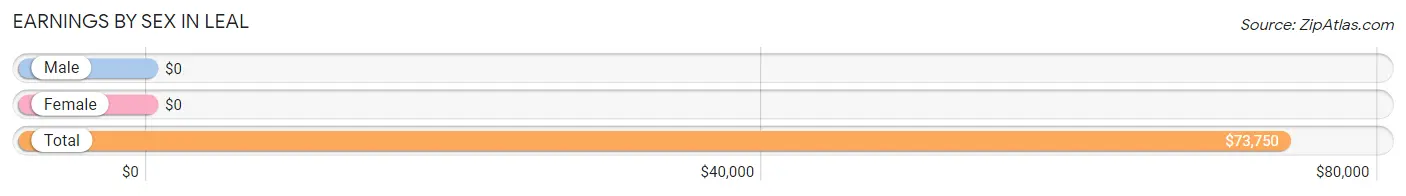
Earnings by Sex in Leal
| Sex | Number | Average Earnings |
| Male | 2 (66.7%) | $0 |
| Female | 1 (33.3%) | $0 |
| Total | 3 (100.0%) | $73,750 |
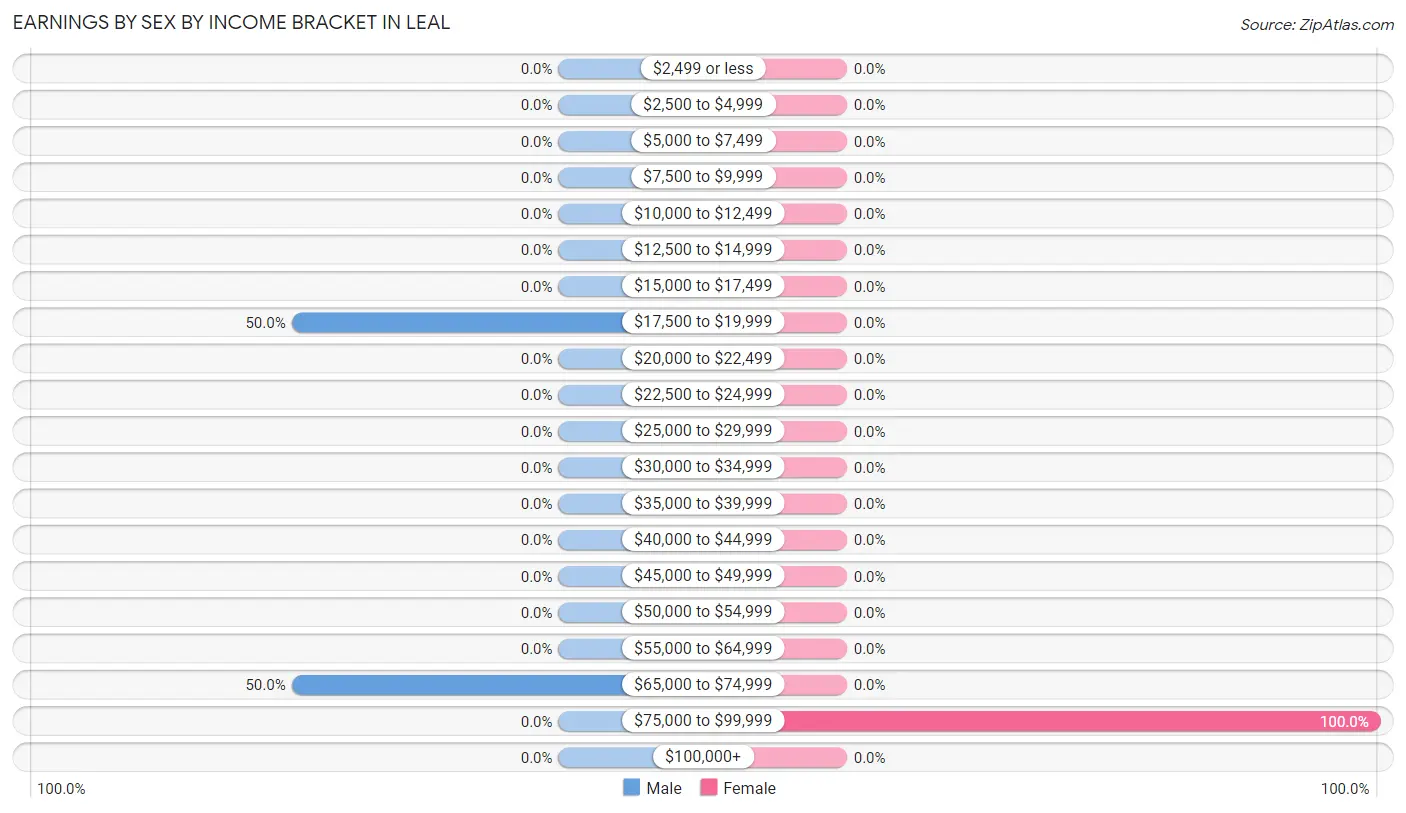
Earnings by Sex by Income Bracket in Leal
The most common earnings brackets in Leal are $17,500 to $19,999 for men (1 | 50.0%) and $75,000 to $99,999 for women (1 | 100.0%).
| Income | Male | Female |
| $2,499 or less | 0 (0.0%) | 0 (0.0%) |
| $2,500 to $4,999 | 0 (0.0%) | 0 (0.0%) |
| $5,000 to $7,499 | 0 (0.0%) | 0 (0.0%) |
| $7,500 to $9,999 | 0 (0.0%) | 0 (0.0%) |
| $10,000 to $12,499 | 0 (0.0%) | 0 (0.0%) |
| $12,500 to $14,999 | 0 (0.0%) | 0 (0.0%) |
| $15,000 to $17,499 | 0 (0.0%) | 0 (0.0%) |
| $17,500 to $19,999 | 1 (50.0%) | 0 (0.0%) |
| $20,000 to $22,499 | 0 (0.0%) | 0 (0.0%) |
| $22,500 to $24,999 | 0 (0.0%) | 0 (0.0%) |
| $25,000 to $29,999 | 0 (0.0%) | 0 (0.0%) |
| $30,000 to $34,999 | 0 (0.0%) | 0 (0.0%) |
| $35,000 to $39,999 | 0 (0.0%) | 0 (0.0%) |
| $40,000 to $44,999 | 0 (0.0%) | 0 (0.0%) |
| $45,000 to $49,999 | 0 (0.0%) | 0 (0.0%) |
| $50,000 to $54,999 | 0 (0.0%) | 0 (0.0%) |
| $55,000 to $64,999 | 0 (0.0%) | 0 (0.0%) |
| $65,000 to $74,999 | 1 (50.0%) | 0 (0.0%) |
| $75,000 to $99,999 | 0 (0.0%) | 1 (100.0%) |
| $100,000+ | 0 (0.0%) | 0 (0.0%) |
| Total | 2 (100.0%) | 1 (100.0%) |
Earnings by Sex by Educational Attainment in Leal
| Educational Attainment | Male Income | Female Income |
| Less than High School | - | - |
| High School Diploma | - | - |
| College or Associate's Degree | - | - |
| Bachelor's Degree | - | - |
| Graduate Degree | - | - |
| Total | - | - |
Family Income in Leal
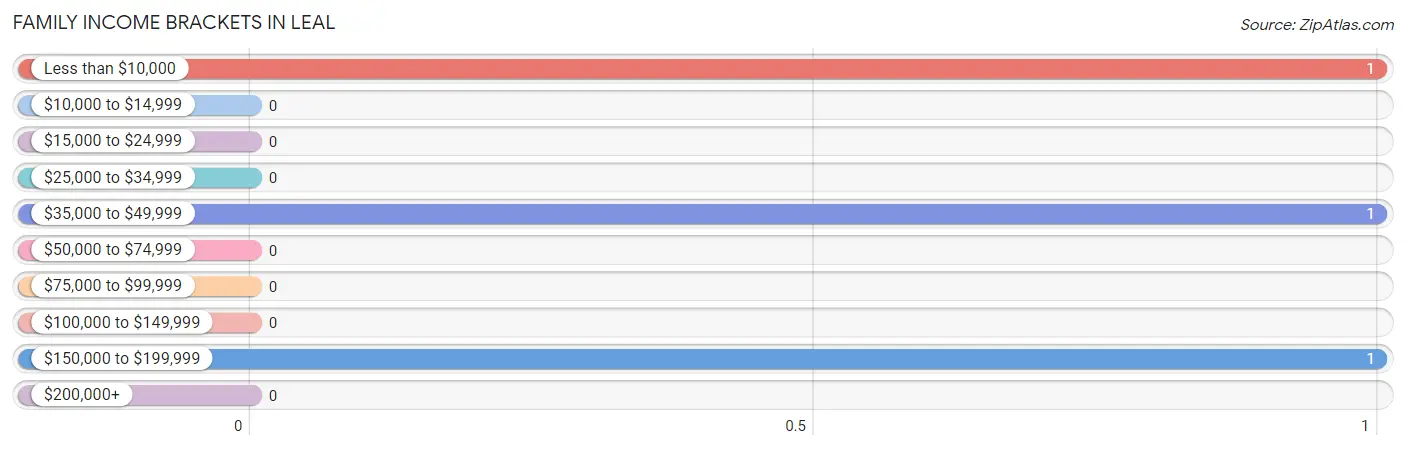
Family Income Brackets in Leal
According to the Leal family income data, there are 1 families falling into the less than $10,000 income range, which is the most common income bracket and makes up 33.3% of all families.
| Income Bracket | # Families | % Families |
| Less than $10,000 | 1 | 33.3% |
| $10,000 to $14,999 | 0 | 0.0% |
| $15,000 to $24,999 | 0 | 0.0% |
| $25,000 to $34,999 | 0 | 0.0% |
| $35,000 to $49,999 | 1 | 33.3% |
| $50,000 to $74,999 | 0 | 0.0% |
| $75,000 to $99,999 | 0 | 0.0% |
| $100,000 to $149,999 | 0 | 0.0% |
| $150,000 to $199,999 | 1 | 33.3% |
| $200,000+ | 0 | 0.0% |
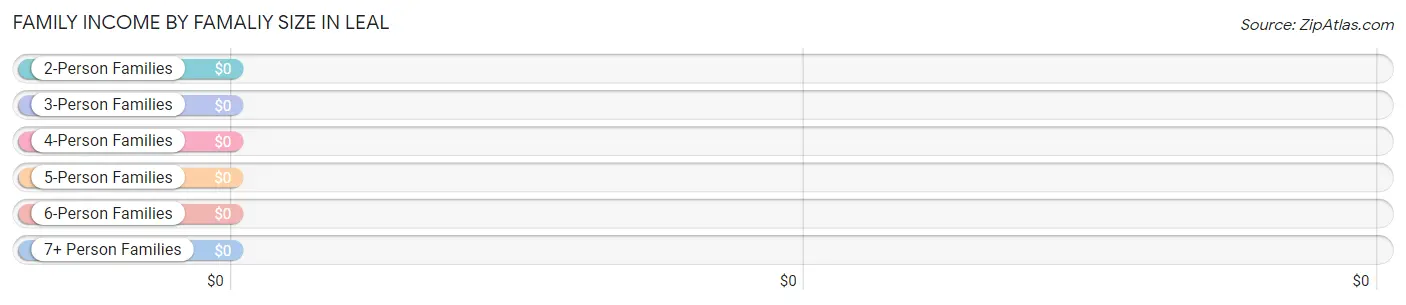
Family Income by Famaliy Size in Leal
| Income Bracket | # Families | Median Income |
| 2-Person Families | 3 (100.0%) | $0 |
| 3-Person Families | 0 (0.0%) | $0 |
| 4-Person Families | 0 (0.0%) | $0 |
| 5-Person Families | 0 (0.0%) | $0 |
| 6-Person Families | 0 (0.0%) | $0 |
| 7+ Person Families | 0 (0.0%) | $0 |
| Total | 3 (100.0%) | $0 |
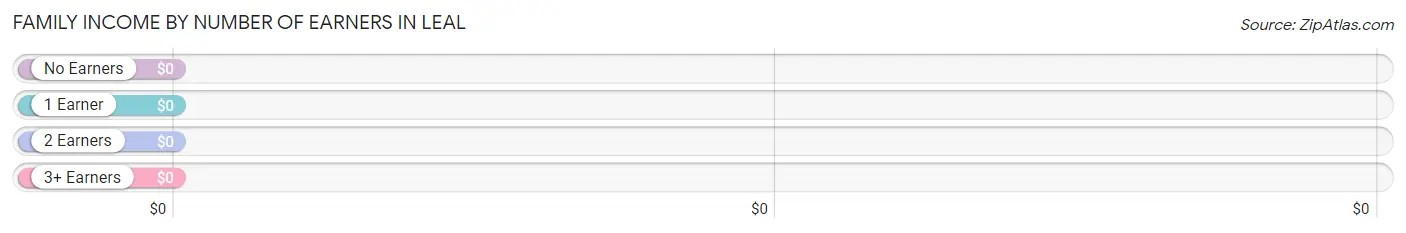
Family Income by Number of Earners in Leal
| Number of Earners | # Families | Median Income |
| No Earners | 1 (33.3%) | $0 |
| 1 Earner | 1 (33.3%) | $0 |
| 2 Earners | 1 (33.3%) | $0 |
| 3+ Earners | 0 (0.0%) | $0 |
| Total | 3 (100.0%) | $0 |
Household Income in Leal
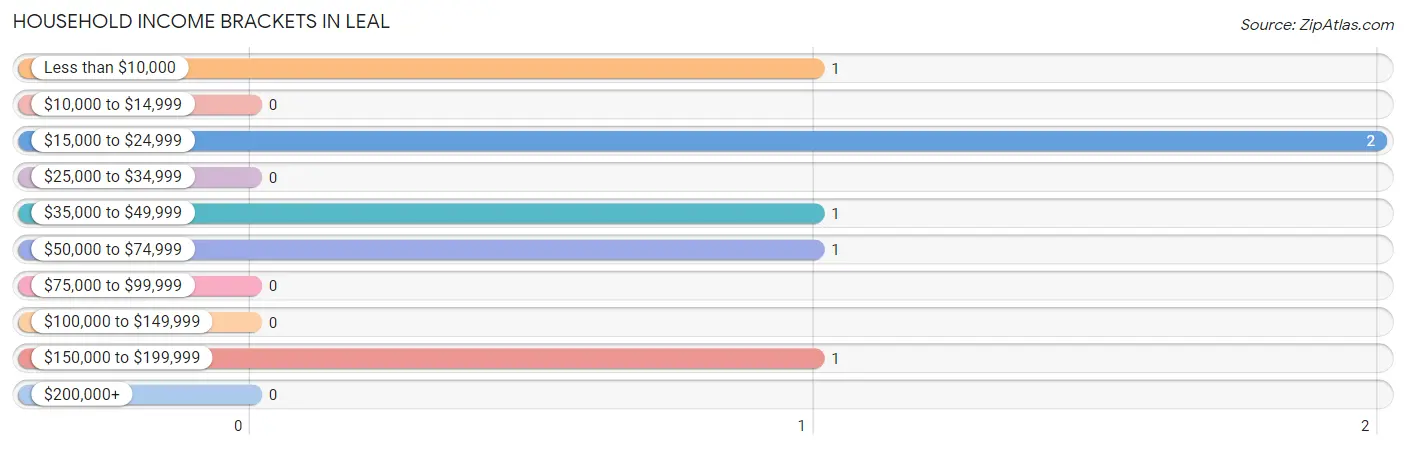
Household Income Brackets in Leal
With 2 households falling in the category, the $15,000 to $24,999 income range is the most frequent in Leal, accounting for 33.3% of all households.
| Income Bracket | # Households | % Households |
| Less than $10,000 | 1 | 16.7% |
| $10,000 to $14,999 | 0 | 0.0% |
| $15,000 to $24,999 | 2 | 33.3% |
| $25,000 to $34,999 | 0 | 0.0% |
| $35,000 to $49,999 | 1 | 16.7% |
| $50,000 to $74,999 | 1 | 16.7% |
| $75,000 to $99,999 | 0 | 0.0% |
| $100,000 to $149,999 | 0 | 0.0% |
| $150,000 to $199,999 | 1 | 16.7% |
| $200,000+ | 0 | 0.0% |
Household Income by Householder Age in Leal
| Income Bracket | # Households | Median Income |
| 15 to 24 Years | 0 (0.0%) | $0 |
| 25 to 44 Years | 0 (0.0%) | $0 |
| 45 to 64 Years | 3 (50.0%) | $0 |
| 65+ Years | 3 (50.0%) | $0 |
| Total | 6 (100.0%) | $0 |
Poverty in Leal
Income Below Poverty by Sex and Age in Leal
With 16.7% poverty level for males and 33.3% for females among the residents of Leal, 55 to 64 year old males and 55 to 64 year old females are the most vulnerable to poverty, with 1 males (50.0%) and 1 females (33.3%) in their respective age groups living below the poverty level.
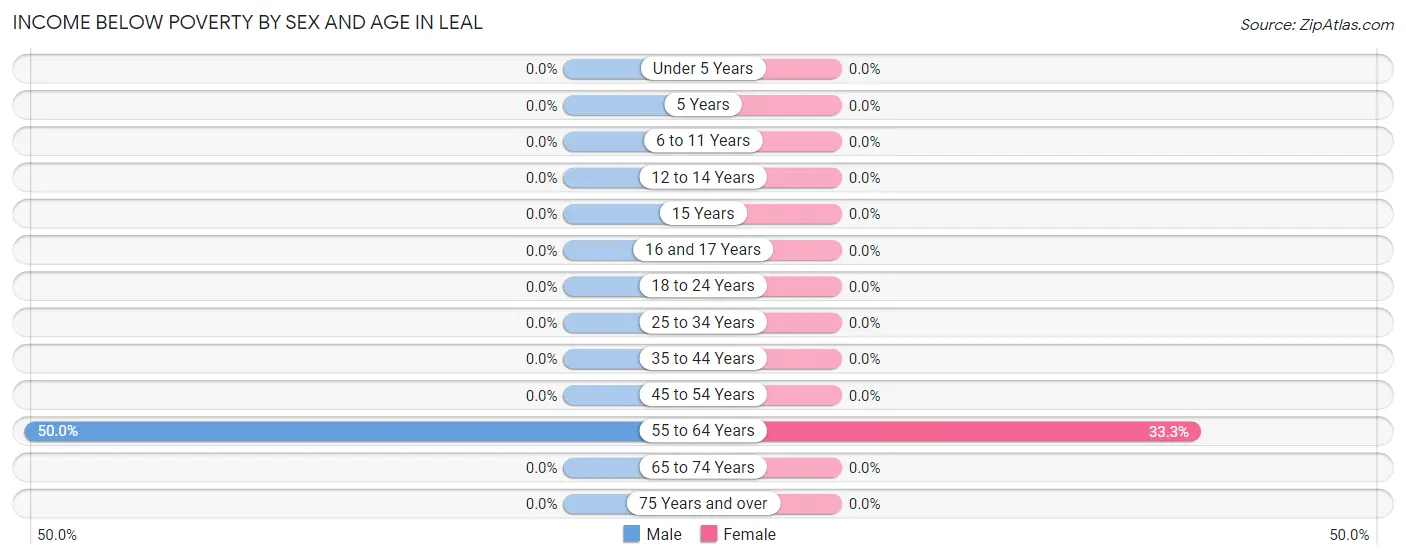
| Age Bracket | Male | Female |
| Under 5 Years | 0 (0.0%) | 0 (0.0%) |
| 5 Years | 0 (0.0%) | 0 (0.0%) |
| 6 to 11 Years | 0 (0.0%) | 0 (0.0%) |
| 12 to 14 Years | 0 (0.0%) | 0 (0.0%) |
| 15 Years | 0 (0.0%) | 0 (0.0%) |
| 16 and 17 Years | 0 (0.0%) | 0 (0.0%) |
| 18 to 24 Years | 0 (0.0%) | 0 (0.0%) |
| 25 to 34 Years | 0 (0.0%) | 0 (0.0%) |
| 35 to 44 Years | 0 (0.0%) | 0 (0.0%) |
| 45 to 54 Years | 0 (0.0%) | 0 (0.0%) |
| 55 to 64 Years | 1 (50.0%) | 1 (33.3%) |
| 65 to 74 Years | 0 (0.0%) | 0 (0.0%) |
| 75 Years and over | 0 (0.0%) | 0 (0.0%) |
| Total | 1 (16.7%) | 1 (33.3%) |
Income Above Poverty by Sex and Age in Leal
According to the poverty statistics in Leal, males aged 45 to 54 years and females aged 55 to 64 years are the age groups that are most secure financially, with 100.0% of males and 66.7% of females in these age groups living above the poverty line.
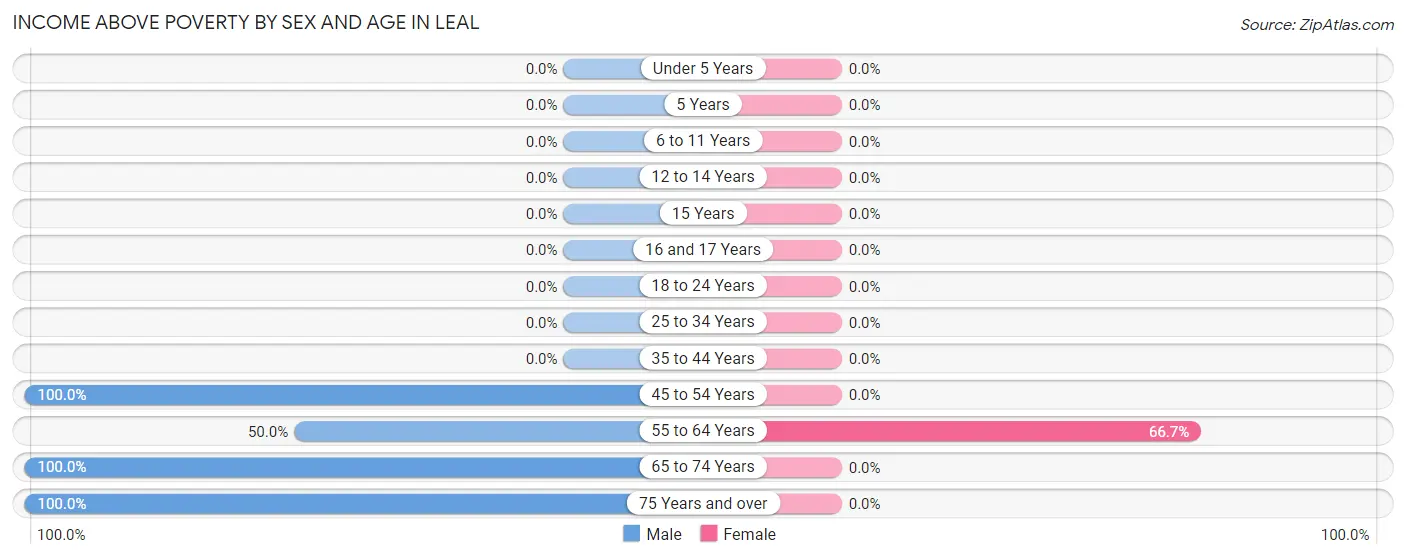
| Age Bracket | Male | Female |
| Under 5 Years | 0 (0.0%) | 0 (0.0%) |
| 5 Years | 0 (0.0%) | 0 (0.0%) |
| 6 to 11 Years | 0 (0.0%) | 0 (0.0%) |
| 12 to 14 Years | 0 (0.0%) | 0 (0.0%) |
| 15 Years | 0 (0.0%) | 0 (0.0%) |
| 16 and 17 Years | 0 (0.0%) | 0 (0.0%) |
| 18 to 24 Years | 0 (0.0%) | 0 (0.0%) |
| 25 to 34 Years | 0 (0.0%) | 0 (0.0%) |
| 35 to 44 Years | 0 (0.0%) | 0 (0.0%) |
| 45 to 54 Years | 1 (100.0%) | 0 (0.0%) |
| 55 to 64 Years | 1 (50.0%) | 2 (66.7%) |
| 65 to 74 Years | 1 (100.0%) | 0 (0.0%) |
| 75 Years and over | 2 (100.0%) | 0 (0.0%) |
| Total | 5 (83.3%) | 2 (66.7%) |
Income Below Poverty Among Married-Couple Families in Leal
The poverty statistics for married-couple families in Leal show that 33.3% or 1 of the total 3 families live below the poverty line. Families with no children have the highest poverty rate of 33.3%, comprising of 1 families. On the other hand, families with no children have the lowest poverty rate of 33.3%, which includes 1 families.
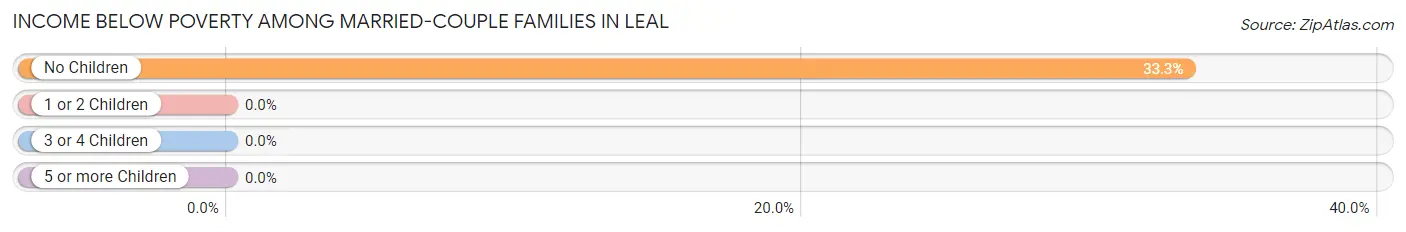
| Children | Above Poverty | Below Poverty |
| No Children | 2 (66.7%) | 1 (33.3%) |
| 1 or 2 Children | 0 (0.0%) | 0 (0.0%) |
| 3 or 4 Children | 0 (0.0%) | 0 (0.0%) |
| 5 or more Children | 0 (0.0%) | 0 (0.0%) |
| Total | 2 (66.7%) | 1 (33.3%) |
Income Below Poverty Among Single-Parent Households in Leal
| Children | Single Father | Single Mother |
| No Children | 0 (0.0%) | 0 (0.0%) |
| 1 or 2 Children | 0 (0.0%) | 0 (0.0%) |
| 3 or 4 Children | 0 (0.0%) | 0 (0.0%) |
| 5 or more Children | 0 (0.0%) | 0 (0.0%) |
| Total | 0 (0.0%) | 0 (0.0%) |
Income Below Poverty Among Married-Couple vs Single-Parent Households in Leal
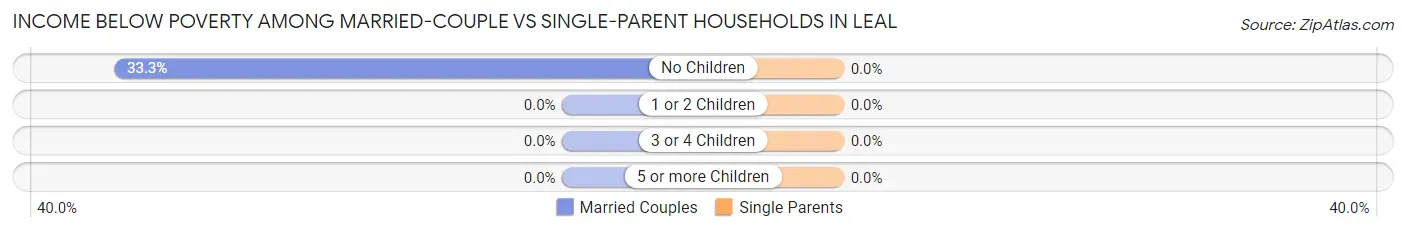
| Children | Married-Couple Families | Single-Parent Households |
| No Children | 1 (33.3%) | 0 (0.0%) |
| 1 or 2 Children | 0 (0.0%) | 0 (0.0%) |
| 3 or 4 Children | 0 (0.0%) | 0 (0.0%) |
| 5 or more Children | 0 (0.0%) | 0 (0.0%) |
| Total | 1 (33.3%) | 0 (0.0%) |
Race in Leal
The most populous races in Leal are , and White / Caucasian (9 | 100.0%).
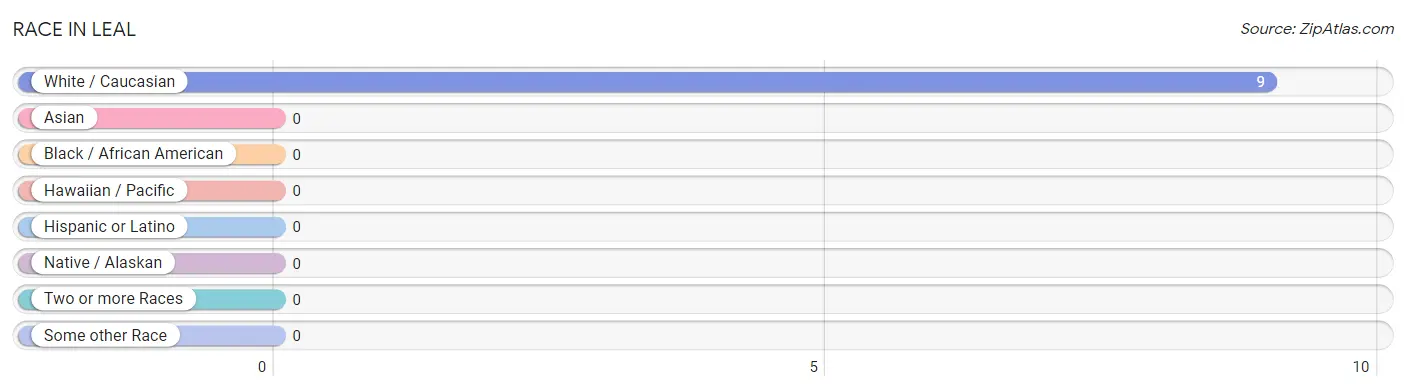
| Race | # Population | % Population |
| Asian | 0 | 0.0% |
| Black / African American | 0 | 0.0% |
| Hawaiian / Pacific | 0 | 0.0% |
| Hispanic or Latino | 0 | 0.0% |
| Native / Alaskan | 0 | 0.0% |
| White / Caucasian | 9 | 100.0% |
| Two or more Races | 0 | 0.0% |
| Some other Race | 0 | 0.0% |
| Total | 9 | 100.0% |
Ancestry in Leal
The most populous ancestries reported in Leal are German (5 | 55.6%), Norwegian (3 | 33.3%), English (1 | 11.1%), Irish (1 | 11.1%), and Russian (1 | 11.1%), together accounting for 122.2% of all Leal residents.
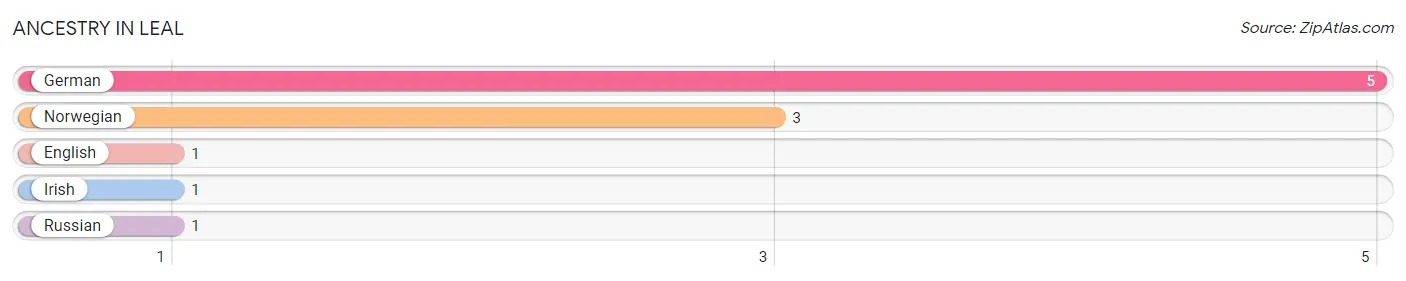
| Ancestry | # Population | % Population |
| English | 1 | 11.1% |
| German | 5 | 55.6% |
| Irish | 1 | 11.1% |
| Norwegian | 3 | 33.3% |
| Russian | 1 | 11.1% | View All 5 Rows |
Immigrants in Leal

| Immigration Origin | # Population | % Population | View All 0 Rows |
Sex and Age in Leal
Sex and Age in Leal
The most populous age groups in Leal are 60 to 64 Years (2 | 33.3%) for men and 60 to 64 Years (2 | 66.7%) for women.
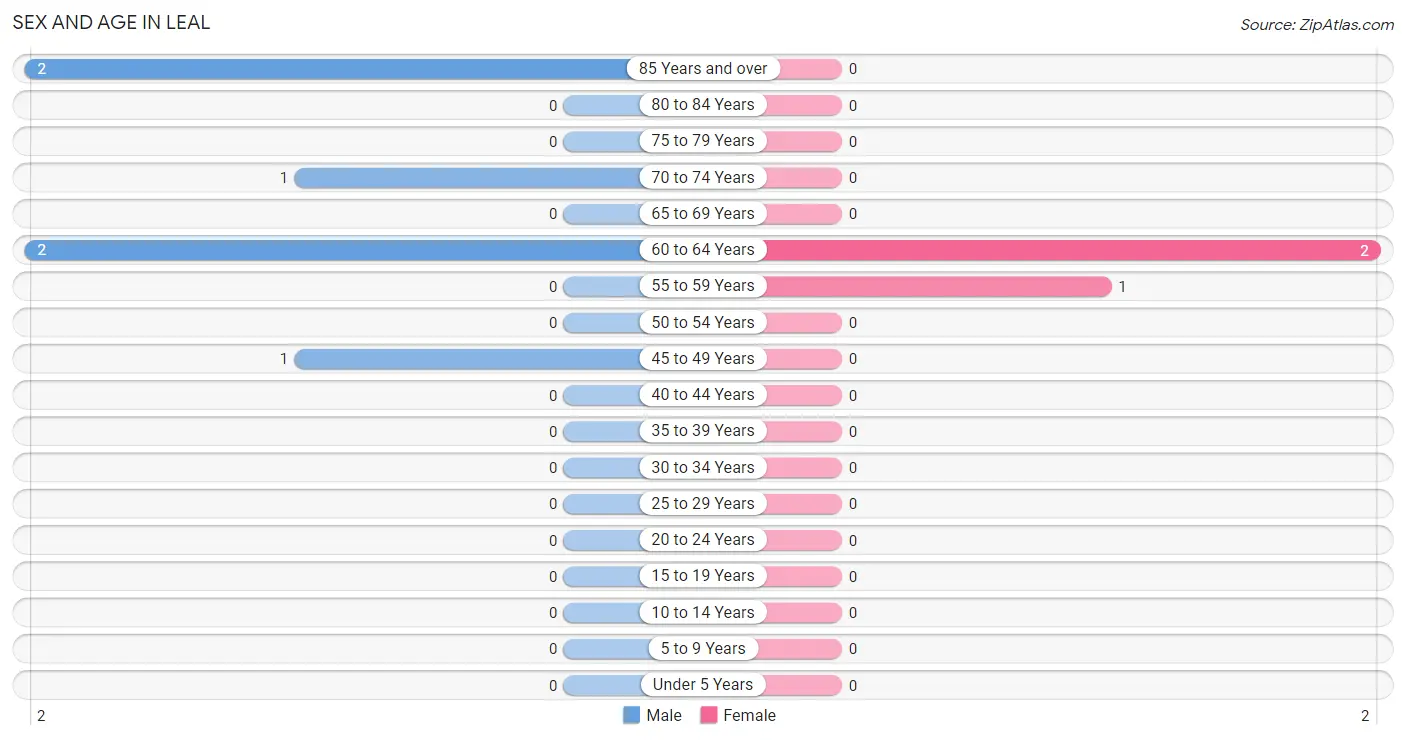
| Age Bracket | Male | Female |
| Under 5 Years | 0 (0.0%) | 0 (0.0%) |
| 5 to 9 Years | 0 (0.0%) | 0 (0.0%) |
| 10 to 14 Years | 0 (0.0%) | 0 (0.0%) |
| 15 to 19 Years | 0 (0.0%) | 0 (0.0%) |
| 20 to 24 Years | 0 (0.0%) | 0 (0.0%) |
| 25 to 29 Years | 0 (0.0%) | 0 (0.0%) |
| 30 to 34 Years | 0 (0.0%) | 0 (0.0%) |
| 35 to 39 Years | 0 (0.0%) | 0 (0.0%) |
| 40 to 44 Years | 0 (0.0%) | 0 (0.0%) |
| 45 to 49 Years | 1 (16.7%) | 0 (0.0%) |
| 50 to 54 Years | 0 (0.0%) | 0 (0.0%) |
| 55 to 59 Years | 0 (0.0%) | 1 (33.3%) |
| 60 to 64 Years | 2 (33.3%) | 2 (66.7%) |
| 65 to 69 Years | 0 (0.0%) | 0 (0.0%) |
| 70 to 74 Years | 1 (16.7%) | 0 (0.0%) |
| 75 to 79 Years | 0 (0.0%) | 0 (0.0%) |
| 80 to 84 Years | 0 (0.0%) | 0 (0.0%) |
| 85 Years and over | 2 (33.3%) | 0 (0.0%) |
| Total | 6 (100.0%) | 3 (100.0%) |
Families and Households in Leal
Median Family Size in Leal
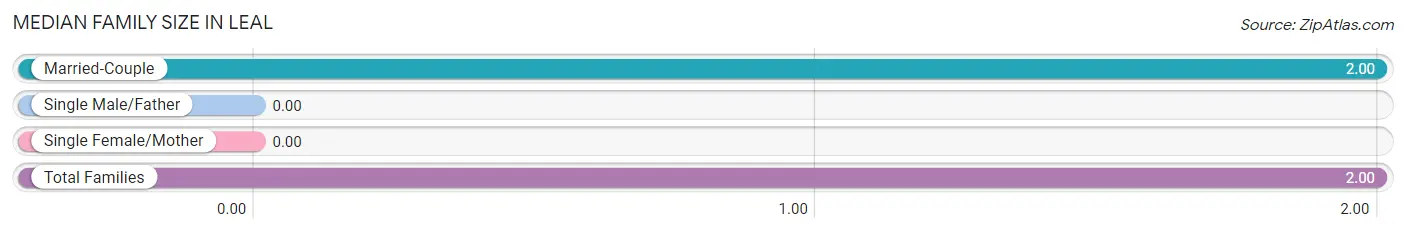
| Family Type | # Families | Family Size |
| Married-Couple | 3 (100.0%) | 2.00 |
| Single Male/Father | 0 (0.0%) | - |
| Single Female/Mother | 0 (0.0%) | - |
| Total Families | 3 (100.0%) | 2.00 |
Median Household Size in Leal
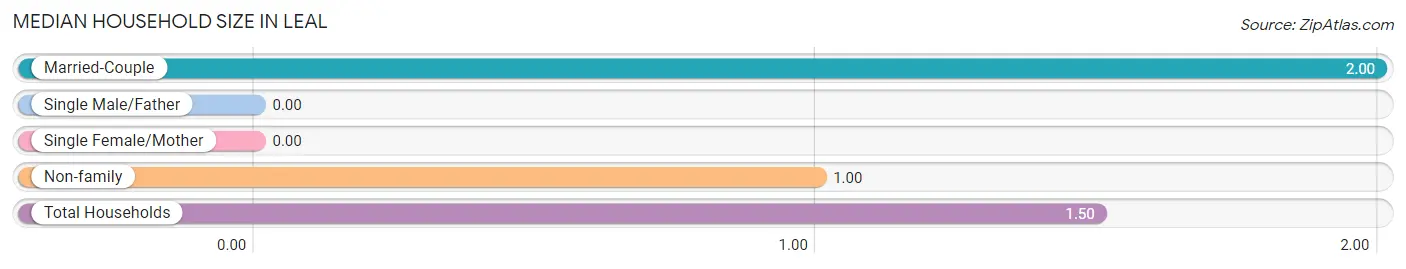
| Household Type | # Households | Household Size |
| Married-Couple | 3 (50.0%) | 2.00 |
| Single Male/Father | 0 (0.0%) | - |
| Single Female/Mother | 0 (0.0%) | - |
| Non-family | 3 (50.0%) | 1.00 |
| Total Households | 6 (100.0%) | 1.50 |
Household Size by Marriage Status in Leal
Out of a total of 6 households in Leal, 3 (50.0%) are family households, while 3 (50.0%) are nonfamily households. The most numerous type of family households are 2-person households, comprising 3, and the most common type of nonfamily households are 1-person households, comprising 3.
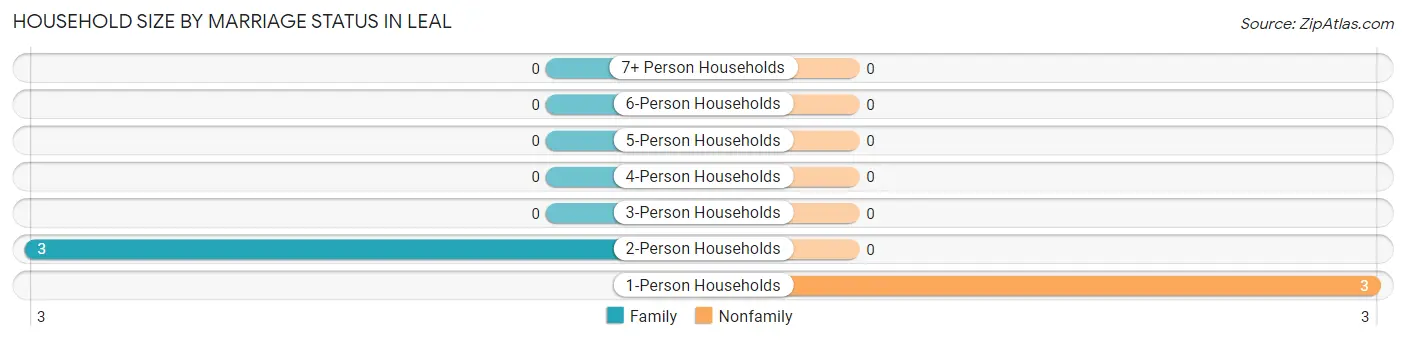
| Household Size | Family Households | Nonfamily Households |
| 1-Person Households | - | 3 (50.0%) |
| 2-Person Households | 3 (50.0%) | 0 (0.0%) |
| 3-Person Households | 0 (0.0%) | 0 (0.0%) |
| 4-Person Households | 0 (0.0%) | 0 (0.0%) |
| 5-Person Households | 0 (0.0%) | 0 (0.0%) |
| 6-Person Households | 0 (0.0%) | 0 (0.0%) |
| 7+ Person Households | 0 (0.0%) | 0 (0.0%) |
| Total | 3 (50.0%) | 3 (50.0%) |
Female Fertility in Leal
Fertility by Age in Leal
| Age Bracket | Women with Births | Births / 1,000 Women |
| 15 to 19 years | 0 (0.0%) | 0.0 |
| 20 to 34 years | 0 (0.0%) | 0.0 |
| 35 to 50 years | 0 (0.0%) | 0.0 |
| Total | 0 (0.0%) | 0.0 |
Fertility by Age by Marriage Status in Leal
| Age Bracket | Married | Unmarried |
| 15 to 19 years | 0 (0.0%) | 0 (0.0%) |
| 20 to 34 years | 0 (0.0%) | 0 (0.0%) |
| 35 to 50 years | 0 (0.0%) | 0 (0.0%) |
| Total | 0 (0.0%) | 0 (0.0%) |
Fertility by Education in Leal
| Educational Attainment | Women with Births | Births / 1,000 Women |
| Less than High School | 0 (0.0%) | 0.0 |
| High School Diploma | 0 (0.0%) | 0.0 |
| College or Associate's Degree | 0 (0.0%) | 0.0 |
| Bachelor's Degree | 0 (0.0%) | 0.0 |
| Graduate Degree | 0 (0.0%) | 0.0 |
| Total | 0 (0.0%) | 0.0 |
Fertility by Education by Marriage Status in Leal
| Educational Attainment | Married | Unmarried |
| Less than High School | 0 (0.0%) | 0 (0.0%) |
| High School Diploma | 0 (0.0%) | 0 (0.0%) |
| College or Associate's Degree | 0 (0.0%) | 0 (0.0%) |
| Bachelor's Degree | 0 (0.0%) | 0 (0.0%) |
| Graduate Degree | 0 (0.0%) | 0 (0.0%) |
| Total | 0 (0.0%) | 0 (0.0%) |
Employment Characteristics in Leal
Employment by Class of Employer in Leal
Among the 3 employed individuals in Leal, private company employees (2 | 66.7%), and local government employees (1 | 33.3%) make up the most common classes of employment.
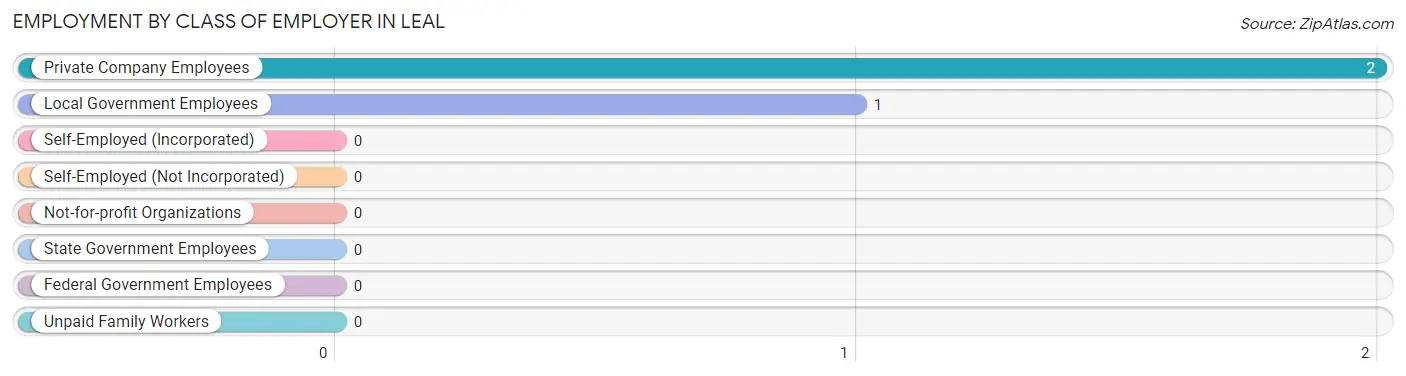
| Employer Class | # Employees | % Employees |
| Private Company Employees | 2 | 66.7% |
| Self-Employed (Incorporated) | 0 | 0.0% |
| Self-Employed (Not Incorporated) | 0 | 0.0% |
| Not-for-profit Organizations | 0 | 0.0% |
| Local Government Employees | 1 | 33.3% |
| State Government Employees | 0 | 0.0% |
| Federal Government Employees | 0 | 0.0% |
| Unpaid Family Workers | 0 | 0.0% |
| Total | 3 | 100.0% |
Employment Status by Age in Leal
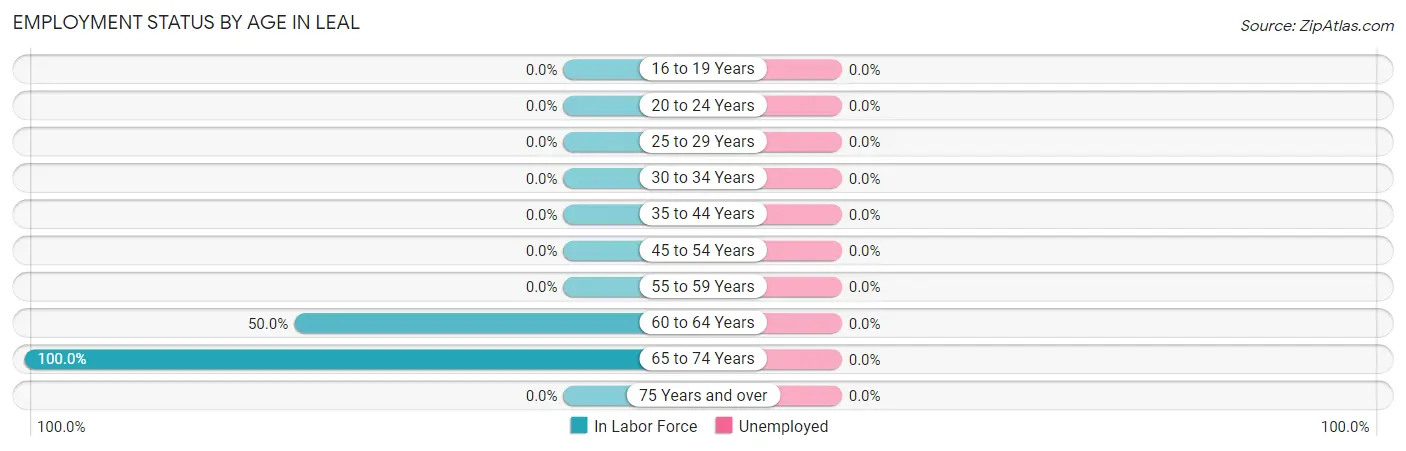
| Age Bracket | In Labor Force | Unemployed |
| 16 to 19 Years | 0 (0.0%) | 0 (0.0%) |
| 20 to 24 Years | 0 (0.0%) | 0 (0.0%) |
| 25 to 29 Years | 0 (0.0%) | 0 (0.0%) |
| 30 to 34 Years | 0 (0.0%) | 0 (0.0%) |
| 35 to 44 Years | 0 (0.0%) | 0 (0.0%) |
| 45 to 54 Years | 0 (0.0%) | 0 (0.0%) |
| 55 to 59 Years | 0 (0.0%) | 0 (0.0%) |
| 60 to 64 Years | 2 (50.0%) | 0 (0.0%) |
| 65 to 74 Years | 1 (100.0%) | 0 (0.0%) |
| 75 Years and over | 0 (0.0%) | 0 (0.0%) |
| Total | 3 (33.3%) | 0 (0.0%) |
Employment Status by Educational Attainment in Leal
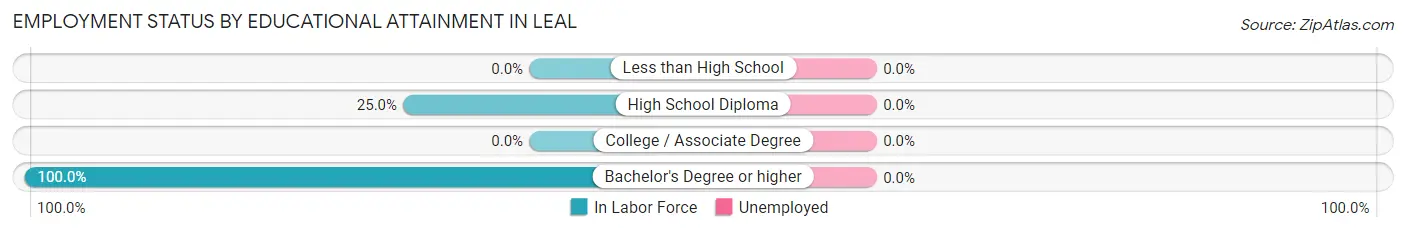
| Educational Attainment | In Labor Force | Unemployed |
| Less than High School | 0 (0.0%) | 0 (0.0%) |
| High School Diploma | 1 (25.0%) | 0 (0.0%) |
| College / Associate Degree | 0 (0.0%) | 0 (0.0%) |
| Bachelor's Degree or higher | 1 (100.0%) | 0 (0.0%) |
| Total | 2 (33.3%) | 0 (0.0%) |
Employment Occupations by Sex in Leal
Management, Business, Science and Arts Occupations
The most common Management, Business, Science and Arts occupations in Leal are Community & Social Service (1 | 33.3%), and Education Instruction & Library (1 | 33.3%).
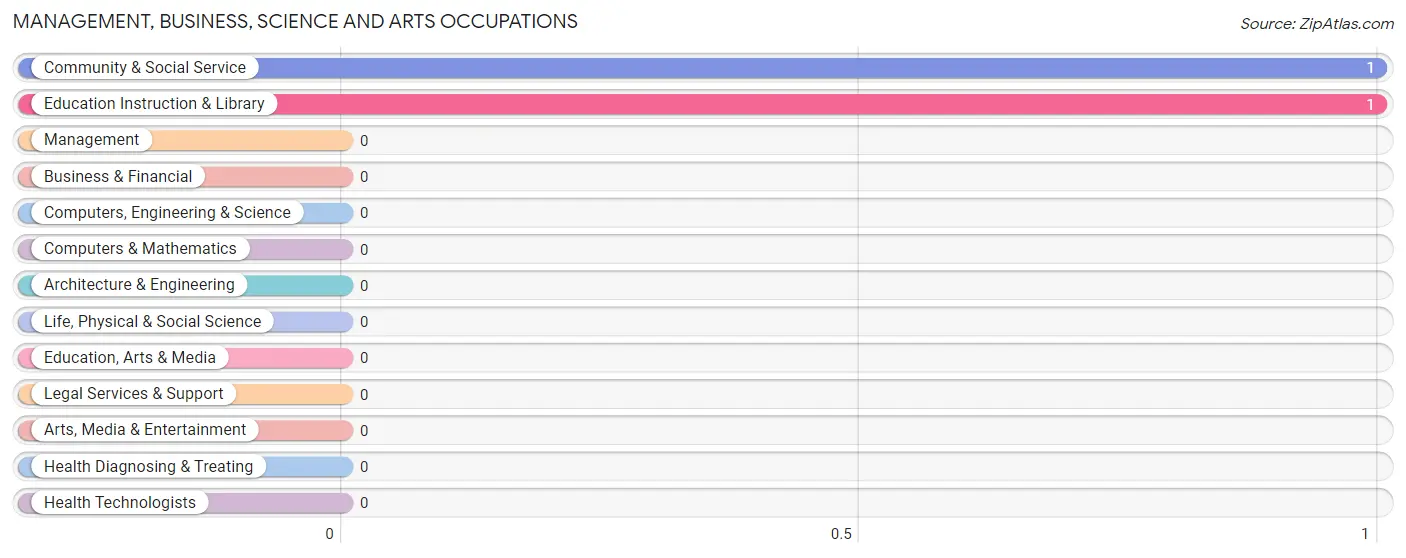
Management, Business, Science and Arts Occupations by Sex
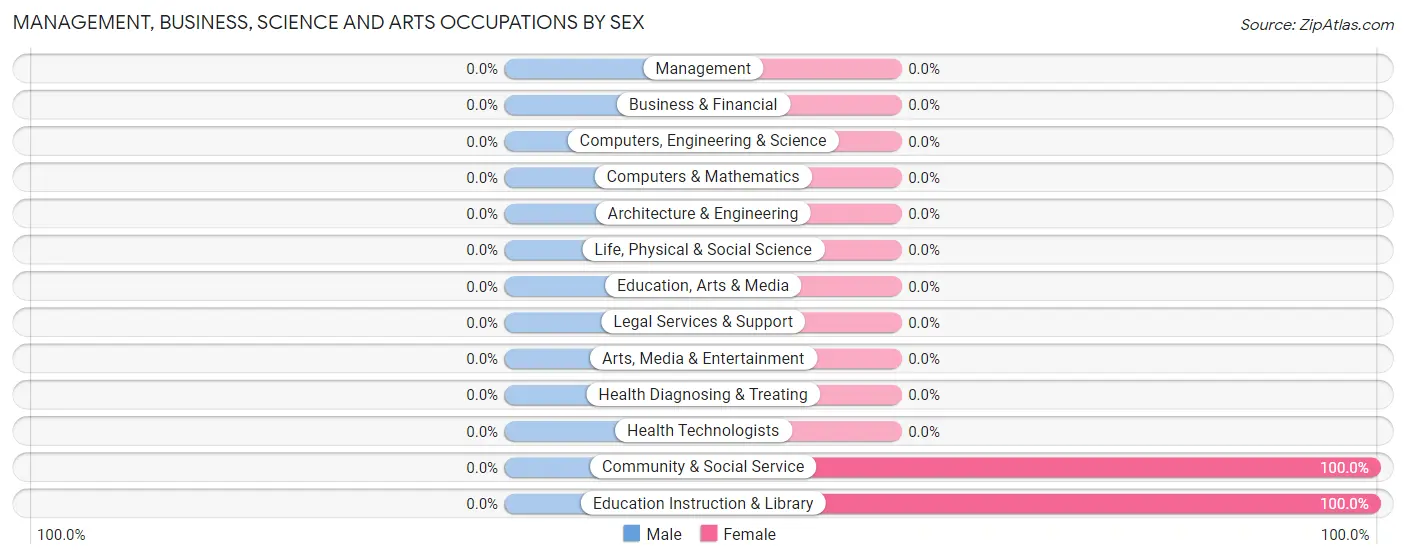
| Occupation | Male | Female |
| Management | 0 (0.0%) | 0 (0.0%) |
| Business & Financial | 0 (0.0%) | 0 (0.0%) |
| Computers, Engineering & Science | 0 (0.0%) | 0 (0.0%) |
| Computers & Mathematics | 0 (0.0%) | 0 (0.0%) |
| Architecture & Engineering | 0 (0.0%) | 0 (0.0%) |
| Life, Physical & Social Science | 0 (0.0%) | 0 (0.0%) |
| Community & Social Service | 0 (0.0%) | 1 (100.0%) |
| Education, Arts & Media | 0 (0.0%) | 0 (0.0%) |
| Legal Services & Support | 0 (0.0%) | 0 (0.0%) |
| Education Instruction & Library | 0 (0.0%) | 1 (100.0%) |
| Arts, Media & Entertainment | 0 (0.0%) | 0 (0.0%) |
| Health Diagnosing & Treating | 0 (0.0%) | 0 (0.0%) |
| Health Technologists | 0 (0.0%) | 0 (0.0%) |
| Total (Category) | 0 (0.0%) | 1 (100.0%) |
| Total (Overall) | 2 (66.7%) | 1 (33.3%) |
Services Occupations
Services Occupations by Sex
| Occupation | Male | Female |
| Healthcare Support | 0 (0.0%) | 0 (0.0%) |
| Security & Protection | 0 (0.0%) | 0 (0.0%) |
| Firefighting & Prevention | 0 (0.0%) | 0 (0.0%) |
| Law Enforcement | 0 (0.0%) | 0 (0.0%) |
| Food Preparation & Serving | 0 (0.0%) | 0 (0.0%) |
| Cleaning & Maintenance | 0 (0.0%) | 0 (0.0%) |
| Personal Care & Service | 0 (0.0%) | 0 (0.0%) |
| Total (Category) | 0 (0.0%) | 0 (0.0%) |
| Total (Overall) | 2 (66.7%) | 1 (33.3%) |
Sales and Office Occupations
The most common Sales and Office occupations in Leal are Sales & Related (1 | 33.3%), and Office & Administration (1 | 33.3%).

Sales and Office Occupations by Sex
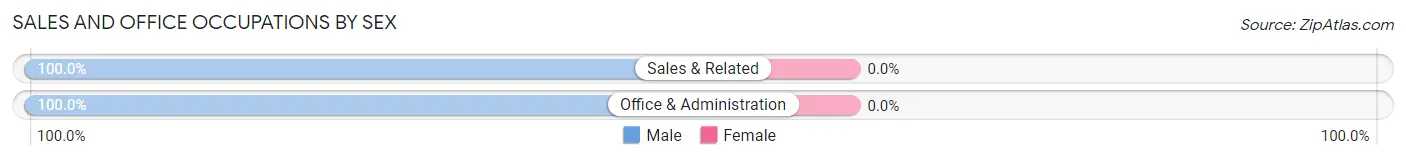
| Occupation | Male | Female |
| Sales & Related | 1 (100.0%) | 0 (0.0%) |
| Office & Administration | 1 (100.0%) | 0 (0.0%) |
| Total (Category) | 2 (100.0%) | 0 (0.0%) |
| Total (Overall) | 2 (66.7%) | 1 (33.3%) |
Natural Resources, Construction and Maintenance Occupations
Natural Resources, Construction and Maintenance Occupations by Sex
| Occupation | Male | Female |
| Farming, Fishing & Forestry | 0 (0.0%) | 0 (0.0%) |
| Construction & Extraction | 0 (0.0%) | 0 (0.0%) |
| Installation, Maintenance & Repair | 0 (0.0%) | 0 (0.0%) |
| Total (Category) | 0 (0.0%) | 0 (0.0%) |
| Total (Overall) | 2 (66.7%) | 1 (33.3%) |
Production, Transportation and Moving Occupations
Production, Transportation and Moving Occupations by Sex
| Occupation | Male | Female |
| Production | 0 (0.0%) | 0 (0.0%) |
| Transportation | 0 (0.0%) | 0 (0.0%) |
| Material Moving | 0 (0.0%) | 0 (0.0%) |
| Total (Category) | 0 (0.0%) | 0 (0.0%) |
| Total (Overall) | 2 (66.7%) | 1 (33.3%) |
Employment Industries by Sex in Leal
Employment Industries in Leal
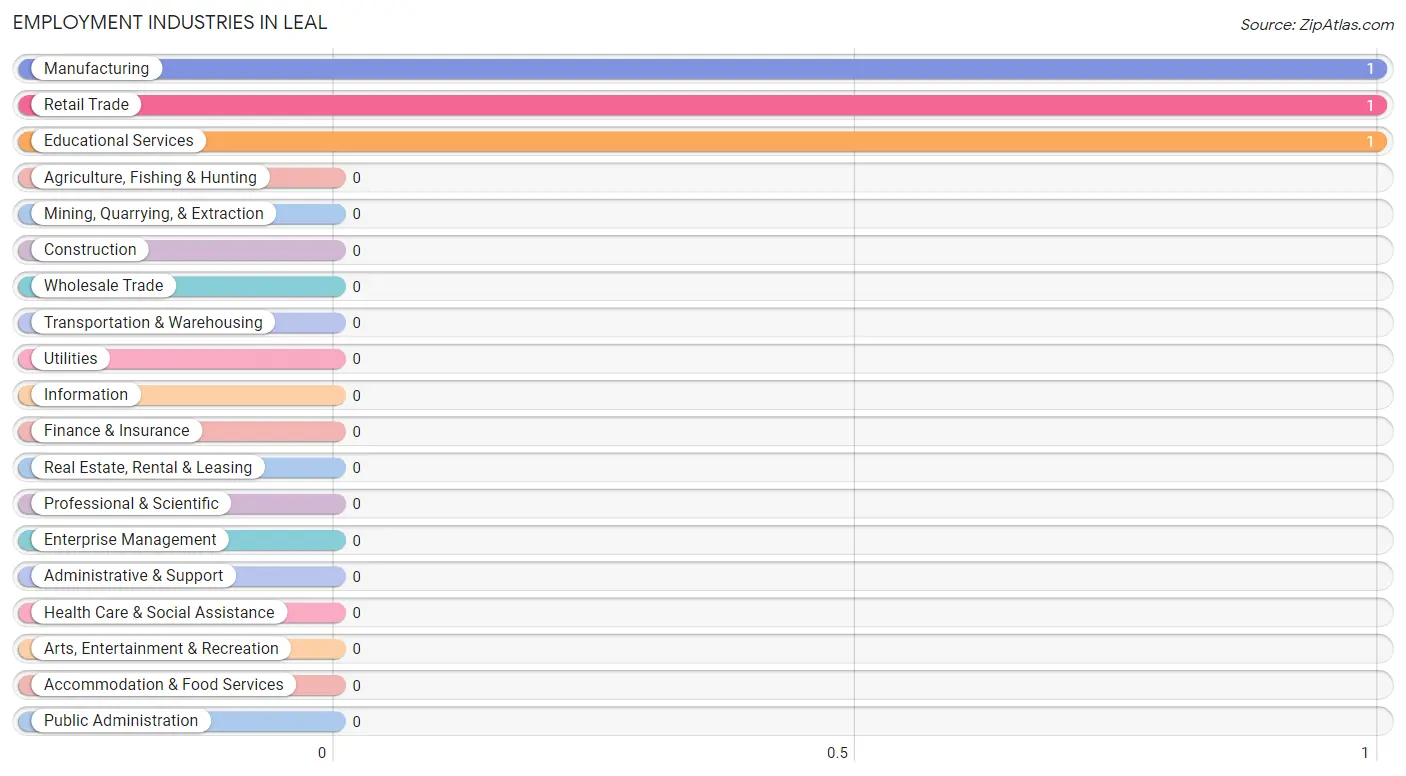
The major employment industries in Leal include Manufacturing (1 | 33.3%), Retail Trade (1 | 33.3%), and Educational Services (1 | 33.3%).
Employment Industries by Sex in Leal
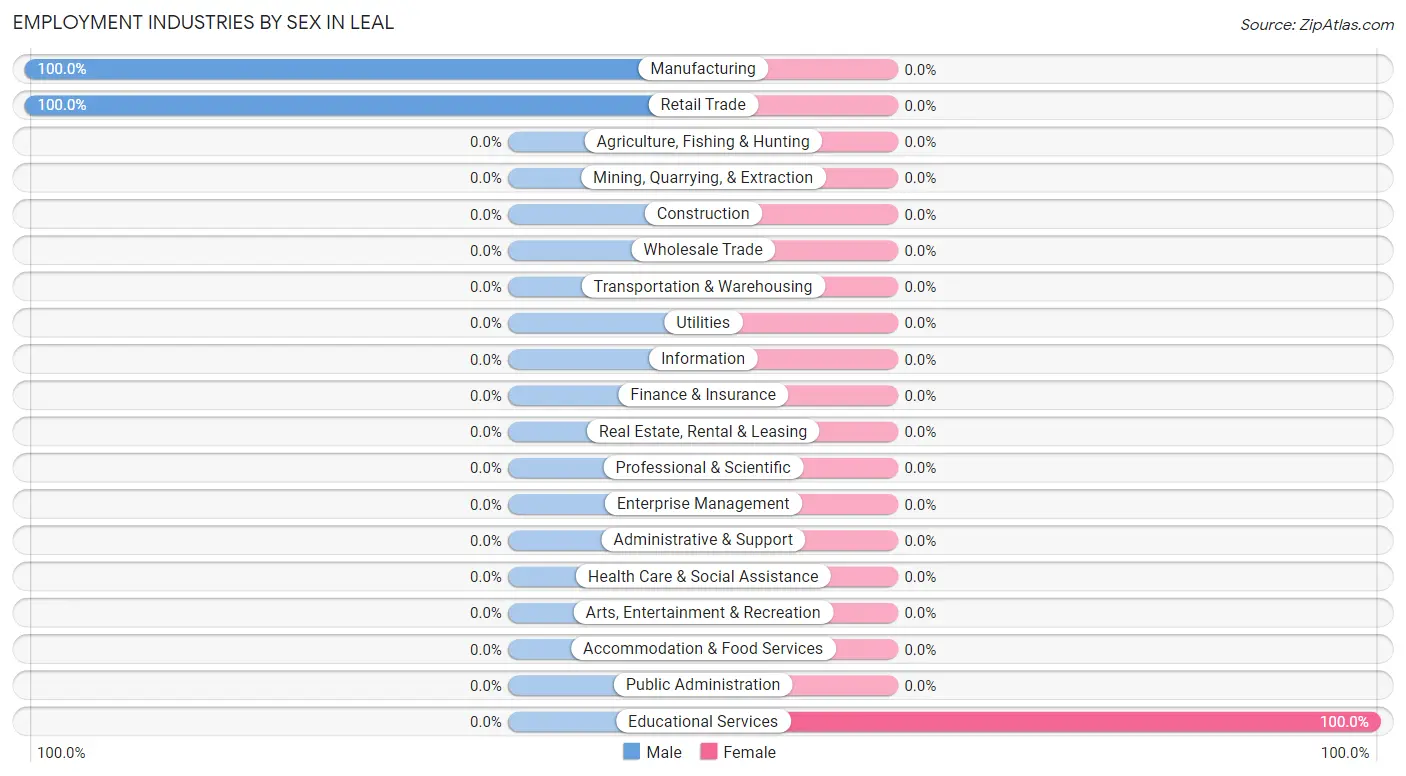
| Industry | Male | Female |
| Agriculture, Fishing & Hunting | 0 (0.0%) | 0 (0.0%) |
| Mining, Quarrying, & Extraction | 0 (0.0%) | 0 (0.0%) |
| Construction | 0 (0.0%) | 0 (0.0%) |
| Manufacturing | 1 (100.0%) | 0 (0.0%) |
| Wholesale Trade | 0 (0.0%) | 0 (0.0%) |
| Retail Trade | 1 (100.0%) | 0 (0.0%) |
| Transportation & Warehousing | 0 (0.0%) | 0 (0.0%) |
| Utilities | 0 (0.0%) | 0 (0.0%) |
| Information | 0 (0.0%) | 0 (0.0%) |
| Finance & Insurance | 0 (0.0%) | 0 (0.0%) |
| Real Estate, Rental & Leasing | 0 (0.0%) | 0 (0.0%) |
| Professional & Scientific | 0 (0.0%) | 0 (0.0%) |
| Enterprise Management | 0 (0.0%) | 0 (0.0%) |
| Administrative & Support | 0 (0.0%) | 0 (0.0%) |
| Educational Services | 0 (0.0%) | 1 (100.0%) |
| Health Care & Social Assistance | 0 (0.0%) | 0 (0.0%) |
| Arts, Entertainment & Recreation | 0 (0.0%) | 0 (0.0%) |
| Accommodation & Food Services | 0 (0.0%) | 0 (0.0%) |
| Public Administration | 0 (0.0%) | 0 (0.0%) |
| Total | 2 (66.7%) | 1 (33.3%) |
Education in Leal
School Enrollment in Leal
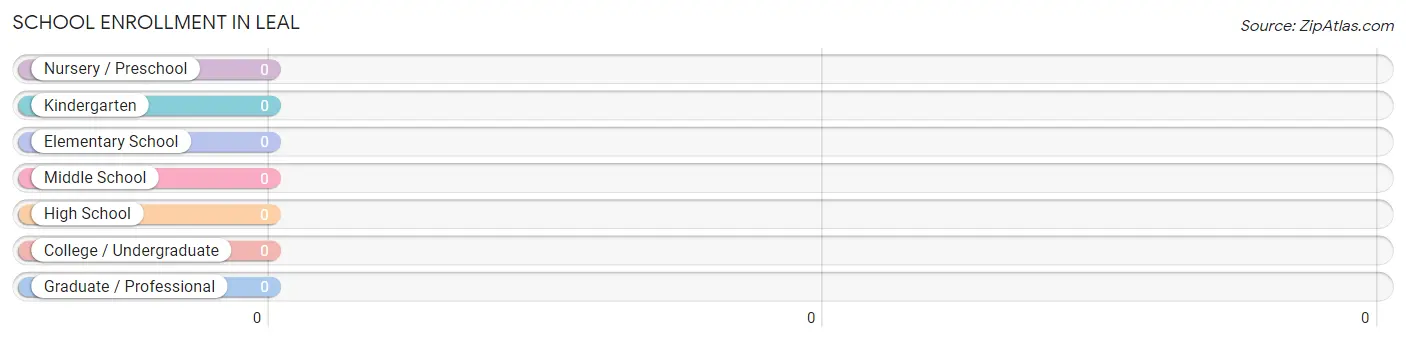
| School Level | # Students | % Students |
| Nursery / Preschool | 0 | 0.0% |
| Kindergarten | 0 | 0.0% |
| Elementary School | 0 | 0.0% |
| Middle School | 0 | 0.0% |
| High School | 0 | 0.0% |
| College / Undergraduate | 0 | 0.0% |
| Graduate / Professional | 0 | 0.0% |
| Total | 0 | 0.0% |
School Enrollment by Age by Funding Source in Leal
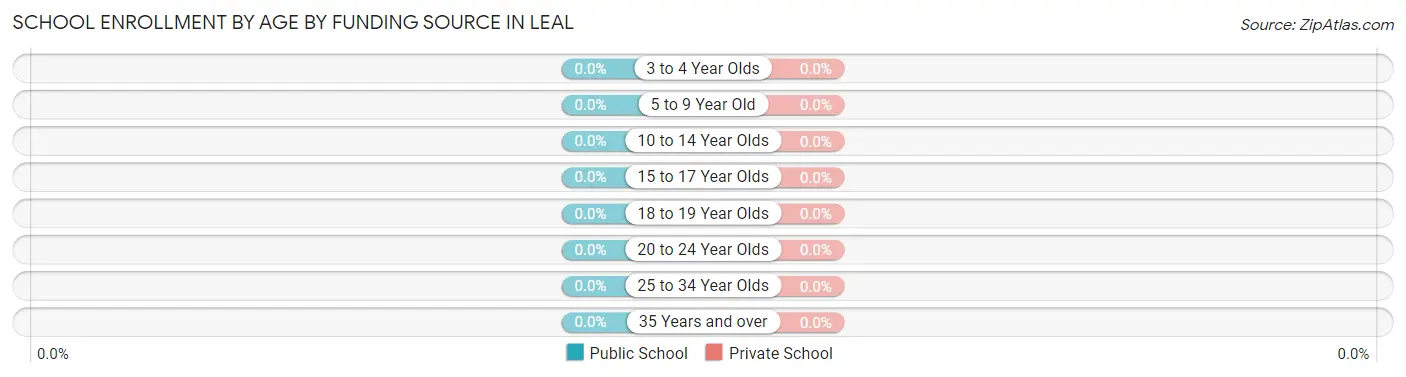
| Age Bracket | Public School | Private School |
| 3 to 4 Year Olds | 0 (0.0%) | 0 (0.0%) |
| 5 to 9 Year Old | 0 (0.0%) | 0 (0.0%) |
| 10 to 14 Year Olds | 0 (0.0%) | 0 (0.0%) |
| 15 to 17 Year Olds | 0 (0.0%) | 0 (0.0%) |
| 18 to 19 Year Olds | 0 (0.0%) | 0 (0.0%) |
| 20 to 24 Year Olds | 0 (0.0%) | 0 (0.0%) |
| 25 to 34 Year Olds | 0 (0.0%) | 0 (0.0%) |
| 35 Years and over | 0 (0.0%) | 0 (0.0%) |
| Total | 0 (0.0%) | 0 (0.0%) |
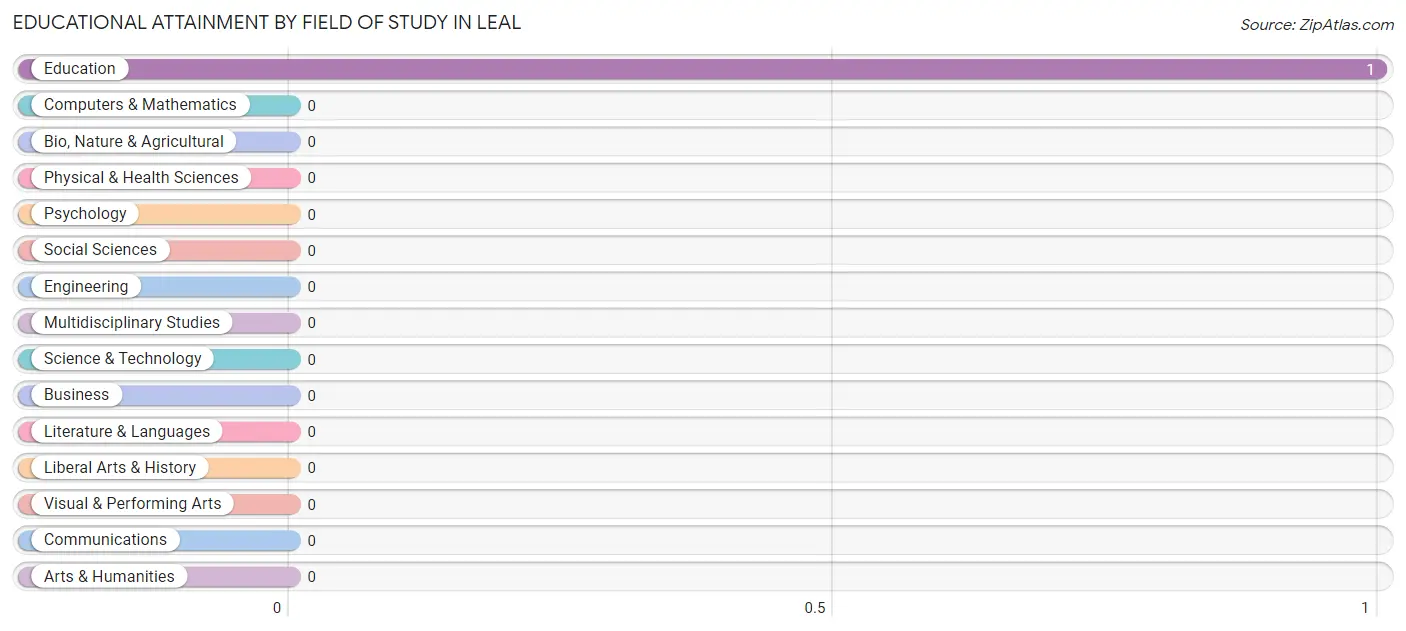
Educational Attainment by Field of Study in Leal
, and education (1 | 100.0%) are the most common fields of study among 1 individuals in Leal who have obtained a bachelor's degree or higher.
| Field of Study | # Graduates | % Graduates |
| Computers & Mathematics | 0 | 0.0% |
| Bio, Nature & Agricultural | 0 | 0.0% |
| Physical & Health Sciences | 0 | 0.0% |
| Psychology | 0 | 0.0% |
| Social Sciences | 0 | 0.0% |
| Engineering | 0 | 0.0% |
| Multidisciplinary Studies | 0 | 0.0% |
| Science & Technology | 0 | 0.0% |
| Business | 0 | 0.0% |
| Education | 1 | 100.0% |
| Literature & Languages | 0 | 0.0% |
| Liberal Arts & History | 0 | 0.0% |
| Visual & Performing Arts | 0 | 0.0% |
| Communications | 0 | 0.0% |
| Arts & Humanities | 0 | 0.0% |
| Total | 1 | 100.0% |
Transportation & Commute in Leal
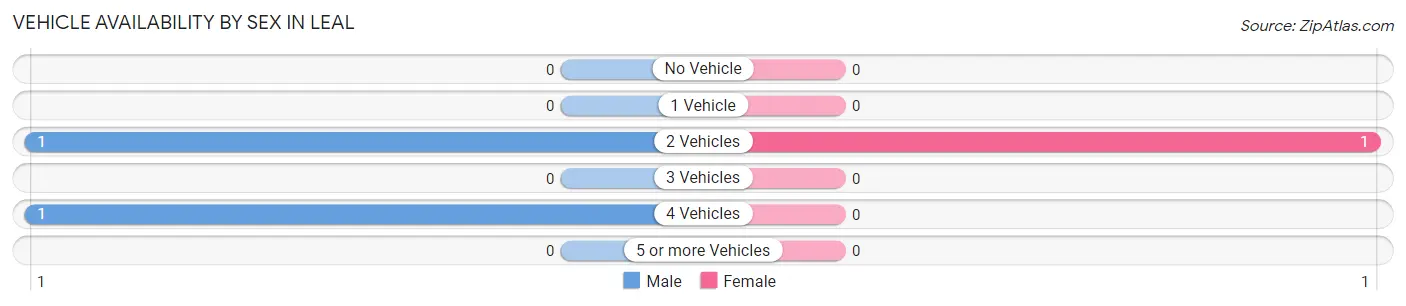
Vehicle Availability by Sex in Leal
The most prevalent vehicle ownership categories in Leal are males with 2 vehicles (1, accounting for 50.0%) and females with 2 vehicles (1, making up 100.0%).
| Vehicles Available | Male | Female |
| No Vehicle | 0 (0.0%) | 0 (0.0%) |
| 1 Vehicle | 0 (0.0%) | 0 (0.0%) |
| 2 Vehicles | 1 (50.0%) | 1 (100.0%) |
| 3 Vehicles | 0 (0.0%) | 0 (0.0%) |
| 4 Vehicles | 1 (50.0%) | 0 (0.0%) |
| 5 or more Vehicles | 0 (0.0%) | 0 (0.0%) |
| Total | 2 (100.0%) | 1 (100.0%) |
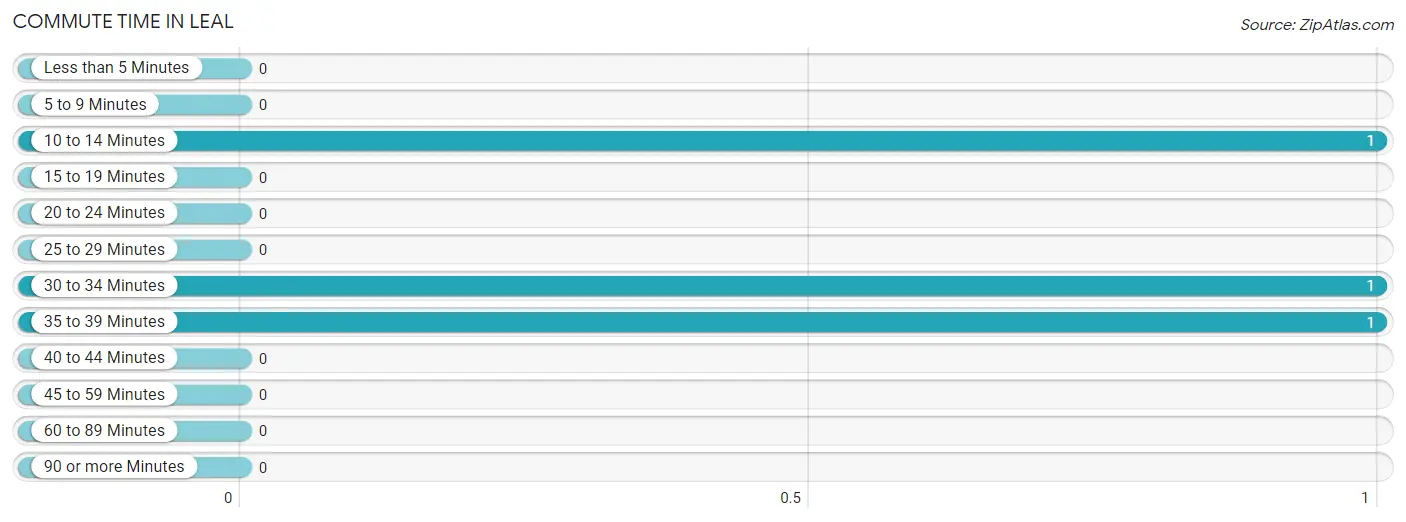
Commute Time in Leal
The most frequently occuring commute durations in Leal are 10 to 14 minutes (1 commuters, 33.3%), 30 to 34 minutes (1 commuters, 33.3%), and 35 to 39 minutes (1 commuters, 33.3%).
| Commute Time | # Commuters | % Commuters |
| Less than 5 Minutes | 0 | 0.0% |
| 5 to 9 Minutes | 0 | 0.0% |
| 10 to 14 Minutes | 1 | 33.3% |
| 15 to 19 Minutes | 0 | 0.0% |
| 20 to 24 Minutes | 0 | 0.0% |
| 25 to 29 Minutes | 0 | 0.0% |
| 30 to 34 Minutes | 1 | 33.3% |
| 35 to 39 Minutes | 1 | 33.3% |
| 40 to 44 Minutes | 0 | 0.0% |
| 45 to 59 Minutes | 0 | 0.0% |
| 60 to 89 Minutes | 0 | 0.0% |
| 90 or more Minutes | 0 | 0.0% |
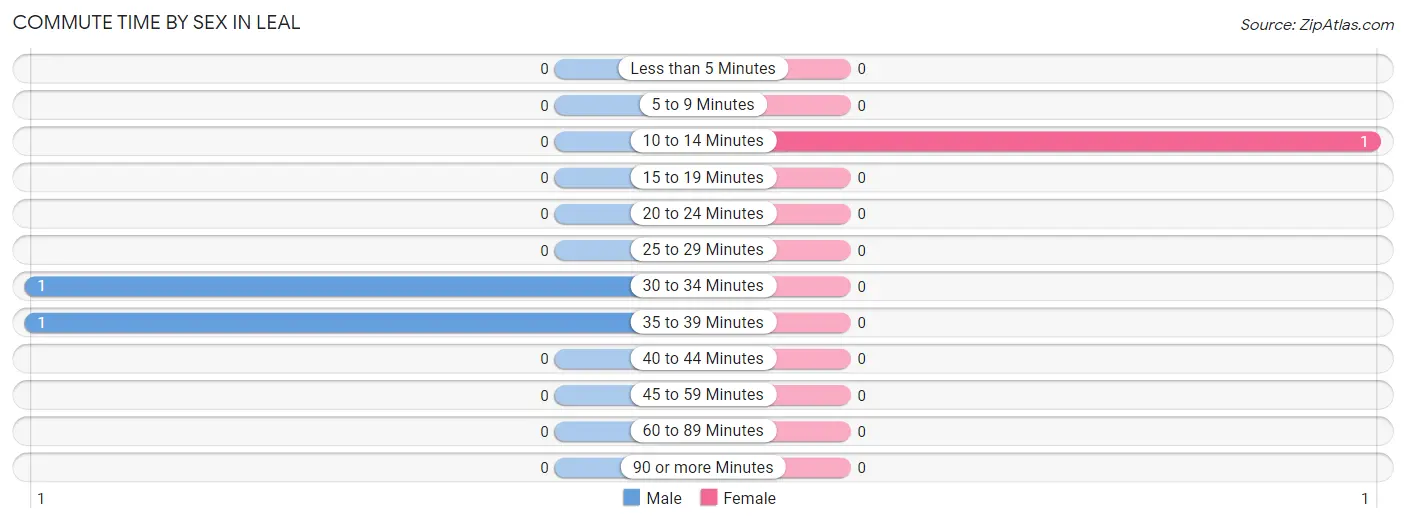
Commute Time by Sex in Leal
The most common commute times in Leal are 30 to 34 minutes (1 commuters, 50.0%) for males and 10 to 14 minutes (1 commuters, 100.0%) for females.
| Commute Time | Male | Female |
| Less than 5 Minutes | 0 (0.0%) | 0 (0.0%) |
| 5 to 9 Minutes | 0 (0.0%) | 0 (0.0%) |
| 10 to 14 Minutes | 0 (0.0%) | 1 (100.0%) |
| 15 to 19 Minutes | 0 (0.0%) | 0 (0.0%) |
| 20 to 24 Minutes | 0 (0.0%) | 0 (0.0%) |
| 25 to 29 Minutes | 0 (0.0%) | 0 (0.0%) |
| 30 to 34 Minutes | 1 (50.0%) | 0 (0.0%) |
| 35 to 39 Minutes | 1 (50.0%) | 0 (0.0%) |
| 40 to 44 Minutes | 0 (0.0%) | 0 (0.0%) |
| 45 to 59 Minutes | 0 (0.0%) | 0 (0.0%) |
| 60 to 89 Minutes | 0 (0.0%) | 0 (0.0%) |
| 90 or more Minutes | 0 (0.0%) | 0 (0.0%) |
Time of Departure to Work by Sex in Leal
The most frequent times of departure to work in Leal are 6:30 AM to 6:59 AM (1, 50.0%) for males and 7:00 AM to 7:29 AM (1, 100.0%) for females.
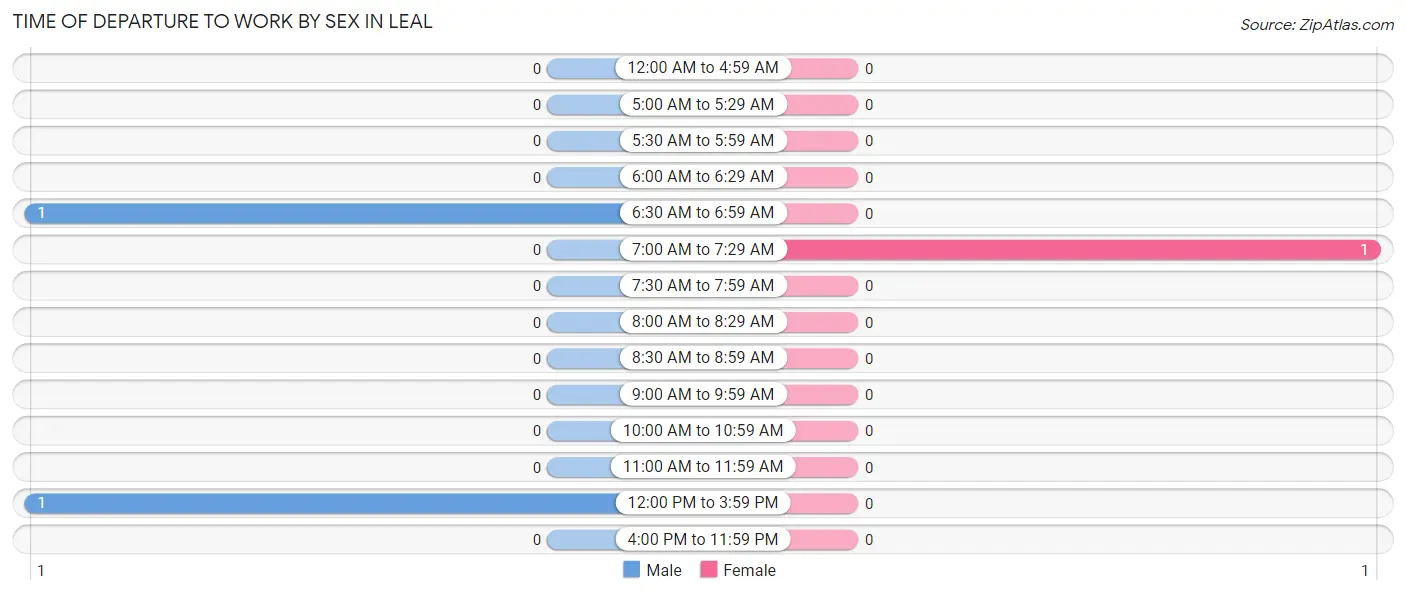
| Time of Departure | Male | Female |
| 12:00 AM to 4:59 AM | 0 (0.0%) | 0 (0.0%) |
| 5:00 AM to 5:29 AM | 0 (0.0%) | 0 (0.0%) |
| 5:30 AM to 5:59 AM | 0 (0.0%) | 0 (0.0%) |
| 6:00 AM to 6:29 AM | 0 (0.0%) | 0 (0.0%) |
| 6:30 AM to 6:59 AM | 1 (50.0%) | 0 (0.0%) |
| 7:00 AM to 7:29 AM | 0 (0.0%) | 1 (100.0%) |
| 7:30 AM to 7:59 AM | 0 (0.0%) | 0 (0.0%) |
| 8:00 AM to 8:29 AM | 0 (0.0%) | 0 (0.0%) |
| 8:30 AM to 8:59 AM | 0 (0.0%) | 0 (0.0%) |
| 9:00 AM to 9:59 AM | 0 (0.0%) | 0 (0.0%) |
| 10:00 AM to 10:59 AM | 0 (0.0%) | 0 (0.0%) |
| 11:00 AM to 11:59 AM | 0 (0.0%) | 0 (0.0%) |
| 12:00 PM to 3:59 PM | 1 (50.0%) | 0 (0.0%) |
| 4:00 PM to 11:59 PM | 0 (0.0%) | 0 (0.0%) |
| Total | 2 (100.0%) | 1 (100.0%) |
Housing Occupancy in Leal
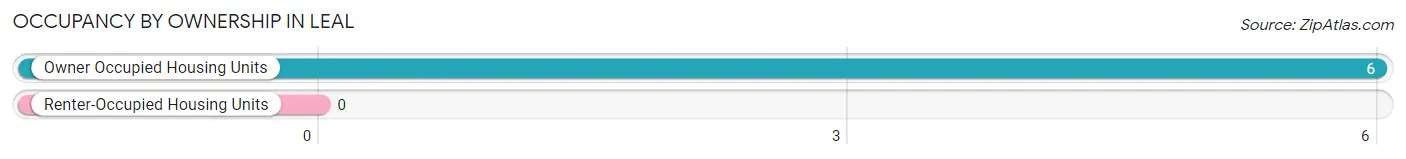
Occupancy by Ownership in Leal
Of the total 6 dwellings in Leal, owner-occupied units account for 6 (100.0%), while renter-occupied units make up 0 (0.0%).
| Occupancy | # Housing Units | % Housing Units |
| Owner Occupied Housing Units | 6 | 100.0% |
| Renter-Occupied Housing Units | 0 | 0.0% |
| Total Occupied Housing Units | 6 | 100.0% |
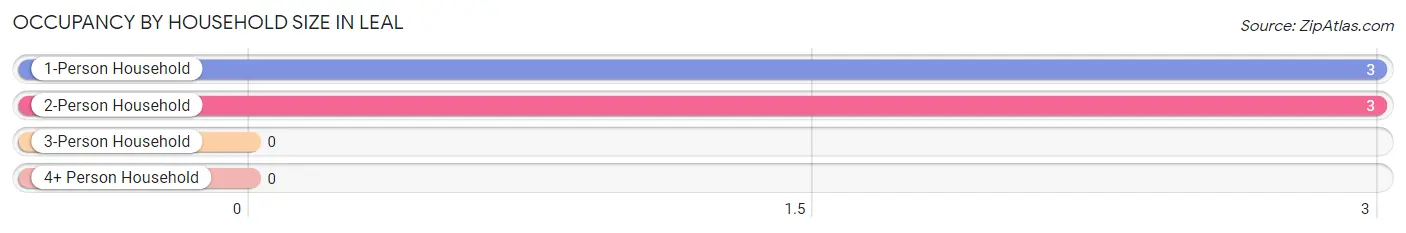
Occupancy by Household Size in Leal
| Household Size | # Housing Units | % Housing Units |
| 1-Person Household | 3 | 50.0% |
| 2-Person Household | 3 | 50.0% |
| 3-Person Household | 0 | 0.0% |
| 4+ Person Household | 0 | 0.0% |
| Total Housing Units | 6 | 100.0% |
Occupancy by Ownership by Household Size in Leal
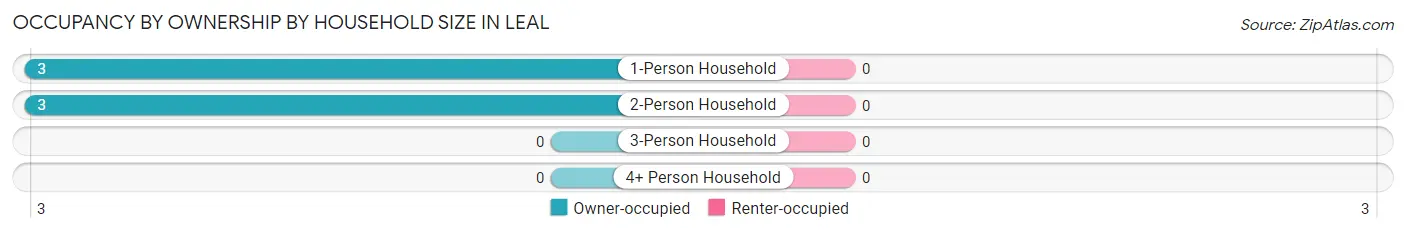
| Household Size | Owner-occupied | Renter-occupied |
| 1-Person Household | 3 (100.0%) | 0 (0.0%) |
| 2-Person Household | 3 (100.0%) | 0 (0.0%) |
| 3-Person Household | 0 (0.0%) | 0 (0.0%) |
| 4+ Person Household | 0 (0.0%) | 0 (0.0%) |
| Total Housing Units | 6 (100.0%) | 0 (0.0%) |
Occupancy by Educational Attainment in Leal
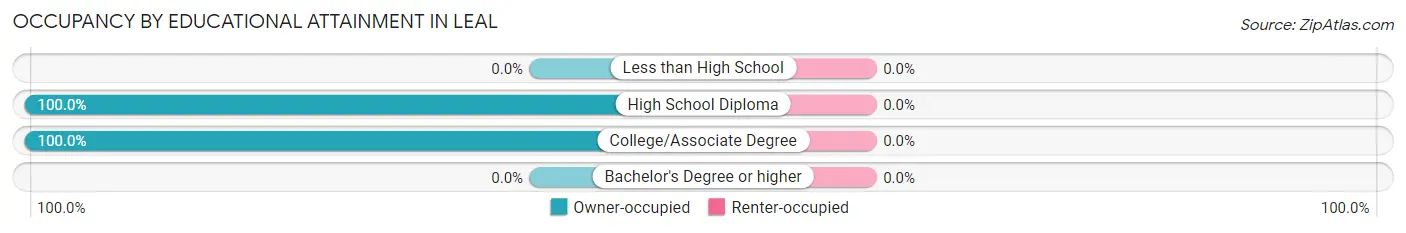
| Household Size | Owner-occupied | Renter-occupied |
| Less than High School | 0 (0.0%) | 0 (0.0%) |
| High School Diploma | 5 (100.0%) | 0 (0.0%) |
| College/Associate Degree | 1 (100.0%) | 0 (0.0%) |
| Bachelor's Degree or higher | 0 (0.0%) | 0 (0.0%) |
Occupancy by Age of Householder in Leal
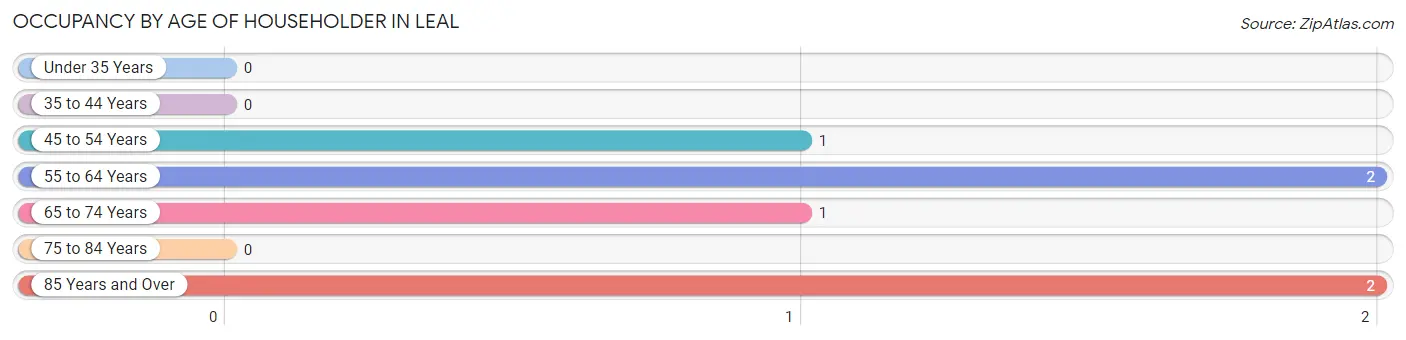
| Age Bracket | # Households | % Households |
| Under 35 Years | 0 | 0.0% |
| 35 to 44 Years | 0 | 0.0% |
| 45 to 54 Years | 1 | 16.7% |
| 55 to 64 Years | 2 | 33.3% |
| 65 to 74 Years | 1 | 16.7% |
| 75 to 84 Years | 0 | 0.0% |
| 85 Years and Over | 2 | 33.3% |
| Total | 6 | 100.0% |
Housing Finances in Leal
Median Income by Occupancy in Leal
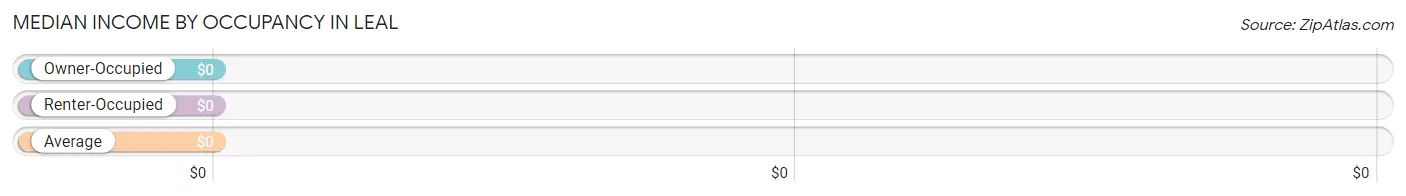
| Occupancy Type | # Households | Median Income |
| Owner-Occupied | 6 (100.0%) | $0 |
| Renter-Occupied | 0 (0.0%) | $0 |
| Average | 6 (100.0%) | $0 |
Occupancy by Householder Income Bracket in Leal
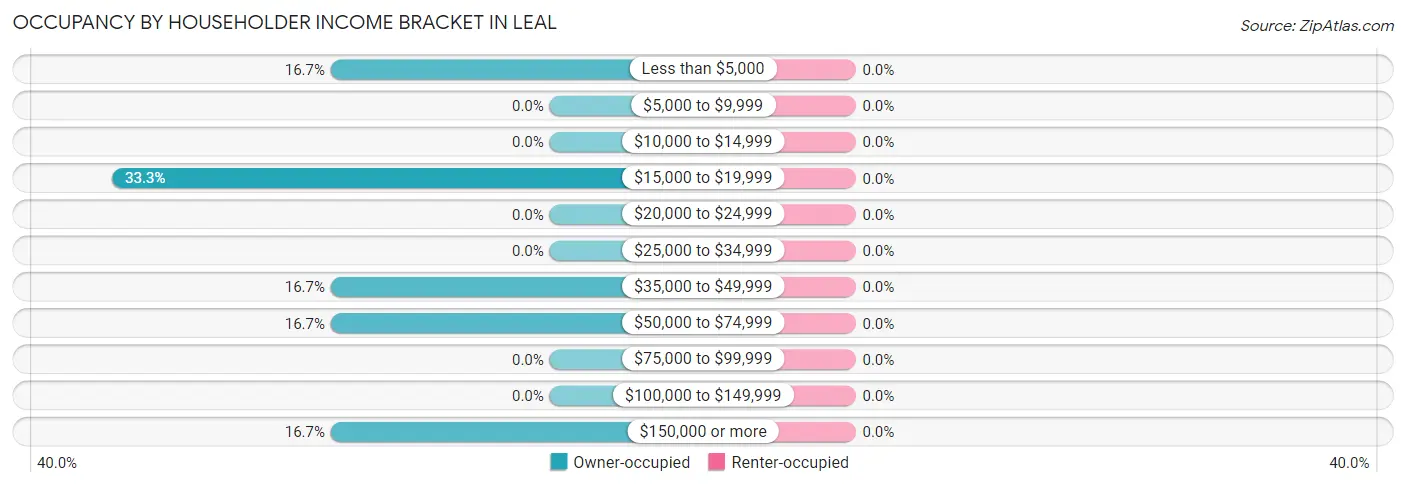
| Income Bracket | Owner-occupied | Renter-occupied |
| Less than $5,000 | 1 (16.7%) | 0 (0.0%) |
| $5,000 to $9,999 | 0 (0.0%) | 0 (0.0%) |
| $10,000 to $14,999 | 0 (0.0%) | 0 (0.0%) |
| $15,000 to $19,999 | 2 (33.3%) | 0 (0.0%) |
| $20,000 to $24,999 | 0 (0.0%) | 0 (0.0%) |
| $25,000 to $34,999 | 0 (0.0%) | 0 (0.0%) |
| $35,000 to $49,999 | 1 (16.7%) | 0 (0.0%) |
| $50,000 to $74,999 | 1 (16.7%) | 0 (0.0%) |
| $75,000 to $99,999 | 0 (0.0%) | 0 (0.0%) |
| $100,000 to $149,999 | 0 (0.0%) | 0 (0.0%) |
| $150,000 or more | 1 (16.7%) | 0 (0.0%) |
| Total | 6 (100.0%) | 0 (0.0%) |
Monthly Housing Cost Tiers in Leal
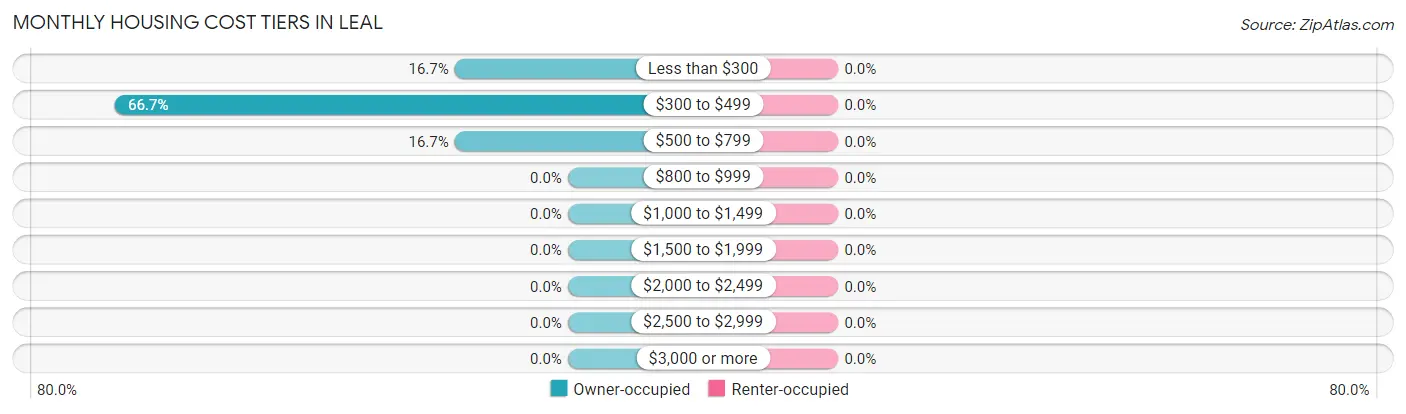
| Monthly Cost | Owner-occupied | Renter-occupied |
| Less than $300 | 1 (16.7%) | 0 (0.0%) |
| $300 to $499 | 4 (66.7%) | 0 (0.0%) |
| $500 to $799 | 1 (16.7%) | 0 (0.0%) |
| $800 to $999 | 0 (0.0%) | 0 (0.0%) |
| $1,000 to $1,499 | 0 (0.0%) | 0 (0.0%) |
| $1,500 to $1,999 | 0 (0.0%) | 0 (0.0%) |
| $2,000 to $2,499 | 0 (0.0%) | 0 (0.0%) |
| $2,500 to $2,999 | 0 (0.0%) | 0 (0.0%) |
| $3,000 or more | 0 (0.0%) | 0 (0.0%) |
| Total | 6 (100.0%) | 0 (0.0%) |
Physical Housing Characteristics in Leal
Housing Structures in Leal
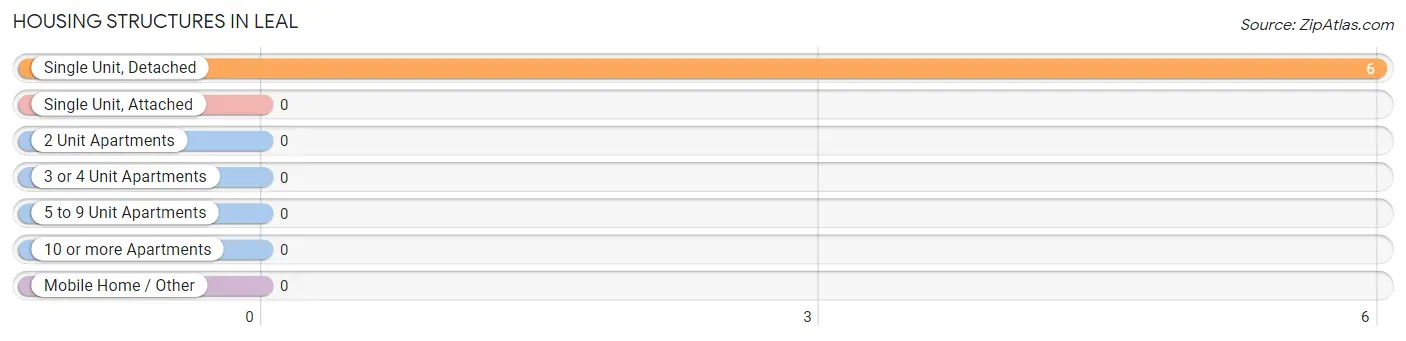
| Structure Type | # Housing Units | % Housing Units |
| Single Unit, Detached | 6 | 100.0% |
| Single Unit, Attached | 0 | 0.0% |
| 2 Unit Apartments | 0 | 0.0% |
| 3 or 4 Unit Apartments | 0 | 0.0% |
| 5 to 9 Unit Apartments | 0 | 0.0% |
| 10 or more Apartments | 0 | 0.0% |
| Mobile Home / Other | 0 | 0.0% |
| Total | 6 | 100.0% |
Housing Structures by Occupancy in Leal
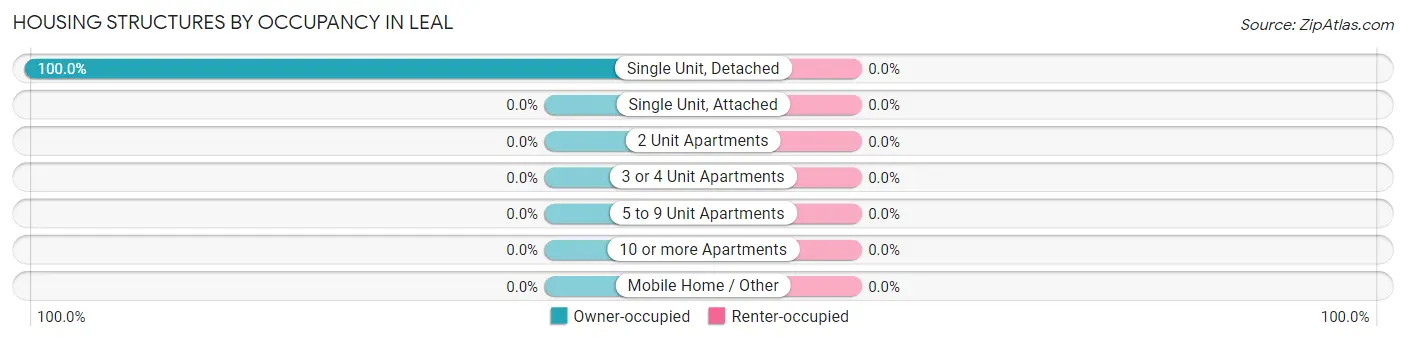
| Structure Type | Owner-occupied | Renter-occupied |
| Single Unit, Detached | 6 (100.0%) | 0 (0.0%) |
| Single Unit, Attached | 0 (0.0%) | 0 (0.0%) |
| 2 Unit Apartments | 0 (0.0%) | 0 (0.0%) |
| 3 or 4 Unit Apartments | 0 (0.0%) | 0 (0.0%) |
| 5 to 9 Unit Apartments | 0 (0.0%) | 0 (0.0%) |
| 10 or more Apartments | 0 (0.0%) | 0 (0.0%) |
| Mobile Home / Other | 0 (0.0%) | 0 (0.0%) |
| Total | 6 (100.0%) | 0 (0.0%) |
Housing Structures by Number of Rooms in Leal
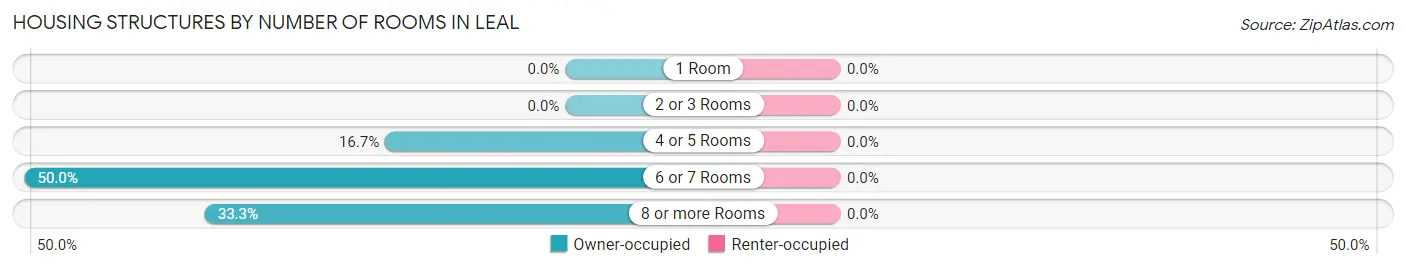
| Number of Rooms | Owner-occupied | Renter-occupied |
| 1 Room | 0 (0.0%) | 0 (0.0%) |
| 2 or 3 Rooms | 0 (0.0%) | 0 (0.0%) |
| 4 or 5 Rooms | 1 (16.7%) | 0 (0.0%) |
| 6 or 7 Rooms | 3 (50.0%) | 0 (0.0%) |
| 8 or more Rooms | 2 (33.3%) | 0 (0.0%) |
| Total | 6 (100.0%) | 0 (0.0%) |
Housing Structure by Heating Type in Leal
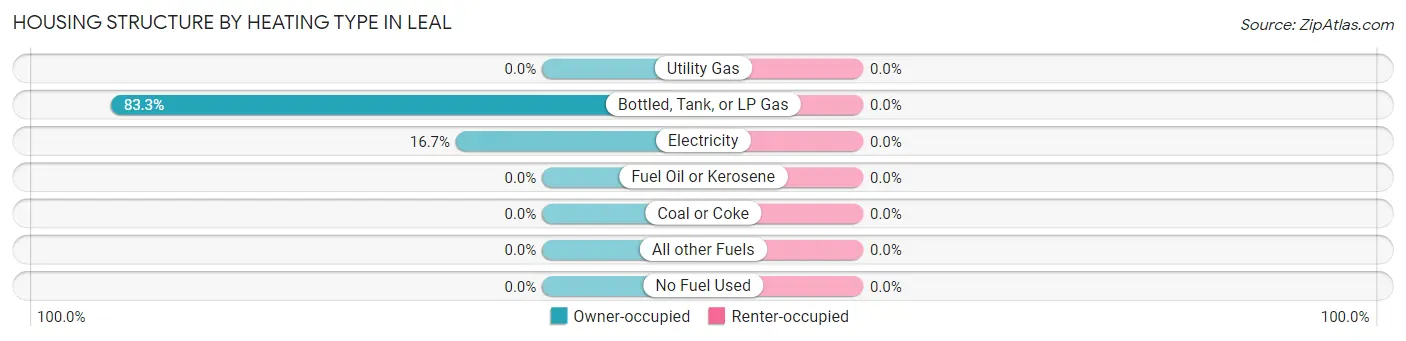
| Heating Type | Owner-occupied | Renter-occupied |
| Utility Gas | 0 (0.0%) | 0 (0.0%) |
| Bottled, Tank, or LP Gas | 5 (83.3%) | 0 (0.0%) |
| Electricity | 1 (16.7%) | 0 (0.0%) |
| Fuel Oil or Kerosene | 0 (0.0%) | 0 (0.0%) |
| Coal or Coke | 0 (0.0%) | 0 (0.0%) |
| All other Fuels | 0 (0.0%) | 0 (0.0%) |
| No Fuel Used | 0 (0.0%) | 0 (0.0%) |
| Total | 6 (100.0%) | 0 (0.0%) |
Household Vehicle Usage in Leal
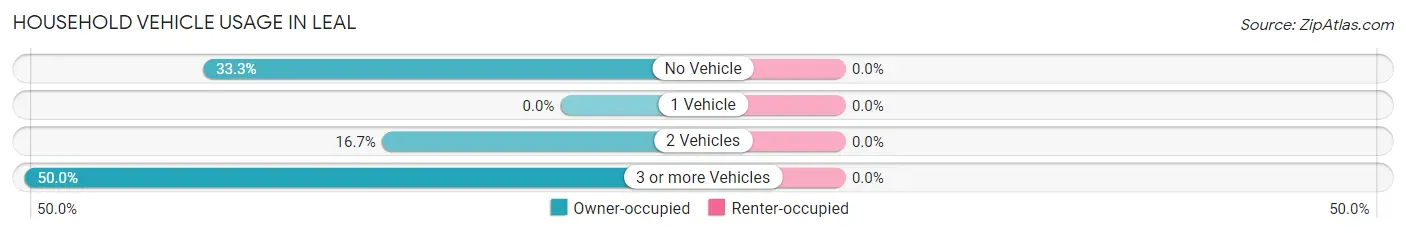
| Vehicles per Household | Owner-occupied | Renter-occupied |
| No Vehicle | 2 (33.3%) | 0 (0.0%) |
| 1 Vehicle | 0 (0.0%) | 0 (0.0%) |
| 2 Vehicles | 1 (16.7%) | 0 (0.0%) |
| 3 or more Vehicles | 3 (50.0%) | 0 (0.0%) |
| Total | 6 (100.0%) | 0 (0.0%) |
Real Estate & Mortgages in Leal
Real Estate and Mortgage Overview in Leal
| Characteristic | Without Mortgage | With Mortgage |
| Housing Units | 6 | 0 |
| Median Property Value | - | - |
| Median Household Income | - | - |
| Monthly Housing Costs | $383 | $0 |
| Real Estate Taxes | $325 | $0 |
Property Value by Mortgage Status in Leal
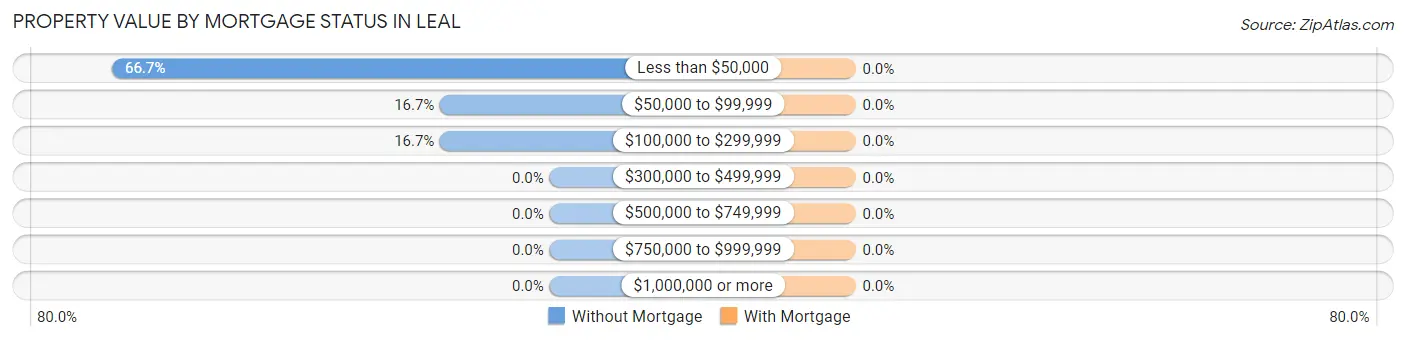
| Property Value | Without Mortgage | With Mortgage |
| Less than $50,000 | 4 (66.7%) | 0 (0.0%) |
| $50,000 to $99,999 | 1 (16.7%) | 0 (0.0%) |
| $100,000 to $299,999 | 1 (16.7%) | 0 (0.0%) |
| $300,000 to $499,999 | 0 (0.0%) | 0 (0.0%) |
| $500,000 to $749,999 | 0 (0.0%) | 0 (0.0%) |
| $750,000 to $999,999 | 0 (0.0%) | 0 (0.0%) |
| $1,000,000 or more | 0 (0.0%) | 0 (0.0%) |
| Total | 6 (100.0%) | 0 (0.0%) |
Household Income by Mortgage Status in Leal
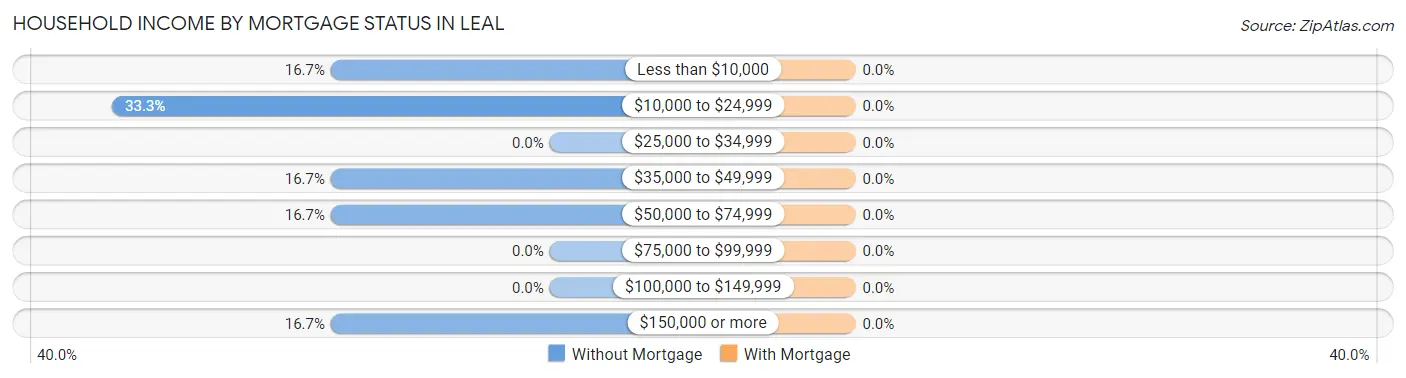
| Household Income | Without Mortgage | With Mortgage |
| Less than $10,000 | 1 (16.7%) | 0 (0.0%) |
| $10,000 to $24,999 | 2 (33.3%) | 0 (0.0%) |
| $25,000 to $34,999 | 0 (0.0%) | 0 (0.0%) |
| $35,000 to $49,999 | 1 (16.7%) | 0 (0.0%) |
| $50,000 to $74,999 | 1 (16.7%) | 0 (0.0%) |
| $75,000 to $99,999 | 0 (0.0%) | 0 (0.0%) |
| $100,000 to $149,999 | 0 (0.0%) | 0 (0.0%) |
| $150,000 or more | 1 (16.7%) | 0 (0.0%) |
| Total | 6 (100.0%) | 0 (0.0%) |
Property Value to Household Income Ratio in Leal
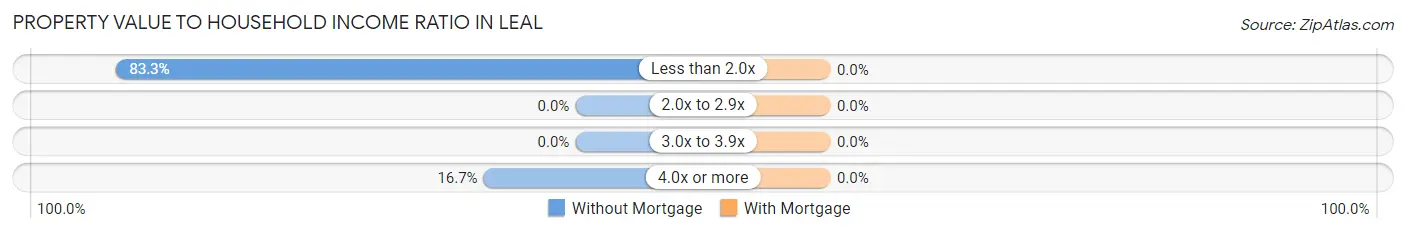
| Value-to-Income Ratio | Without Mortgage | With Mortgage |
| Less than 2.0x | 5 (83.3%) | 0 (0.0%) |
| 2.0x to 2.9x | 0 (0.0%) | 0 (0.0%) |
| 3.0x to 3.9x | 0 (0.0%) | 0 (0.0%) |
| 4.0x or more | 1 (16.7%) | 0 (0.0%) |
| Total | 6 (100.0%) | 0 (0.0%) |
Real Estate Taxes by Mortgage Status in Leal
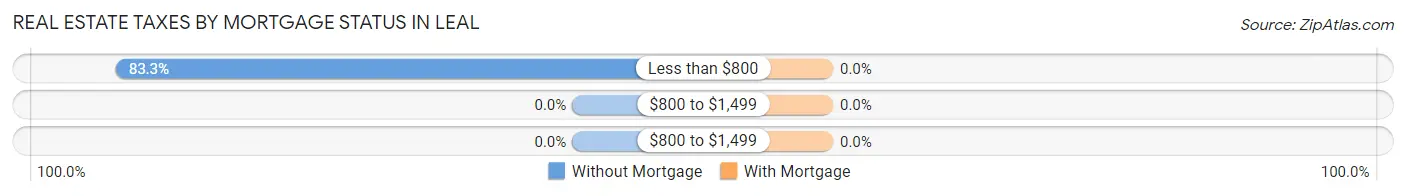
| Property Taxes | Without Mortgage | With Mortgage |
| Less than $800 | 5 (83.3%) | 0 (0.0%) |
| $800 to $1,499 | 0 (0.0%) | 0 (0.0%) |
| $800 to $1,499 | 0 (0.0%) | 0 (0.0%) |
| Total | 6 (100.0%) | 0 (0.0%) |
Health & Disability in Leal
Health Insurance Coverage by Age in Leal
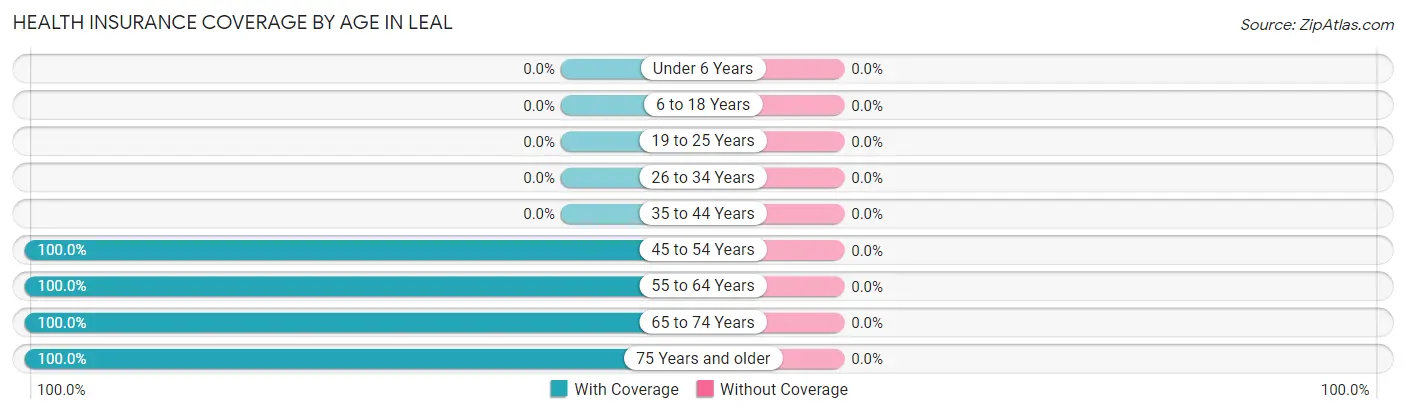
| Age Bracket | With Coverage | Without Coverage |
| Under 6 Years | 0 (0.0%) | 0 (0.0%) |
| 6 to 18 Years | 0 (0.0%) | 0 (0.0%) |
| 19 to 25 Years | 0 (0.0%) | 0 (0.0%) |
| 26 to 34 Years | 0 (0.0%) | 0 (0.0%) |
| 35 to 44 Years | 0 (0.0%) | 0 (0.0%) |
| 45 to 54 Years | 1 (100.0%) | 0 (0.0%) |
| 55 to 64 Years | 5 (100.0%) | 0 (0.0%) |
| 65 to 74 Years | 1 (100.0%) | 0 (0.0%) |
| 75 Years and older | 2 (100.0%) | 0 (0.0%) |
| Total | 9 (100.0%) | 0 (0.0%) |
Health Insurance Coverage by Citizenship Status in Leal
| Citizenship Status | With Coverage | Without Coverage |
| Native Born | 0 (0.0%) | 0 (0.0%) |
| Foreign Born, Citizen | 0 (0.0%) | 0 (0.0%) |
| Foreign Born, not a Citizen | 0 (0.0%) | 0 (0.0%) |
Health Insurance Coverage by Household Income in Leal
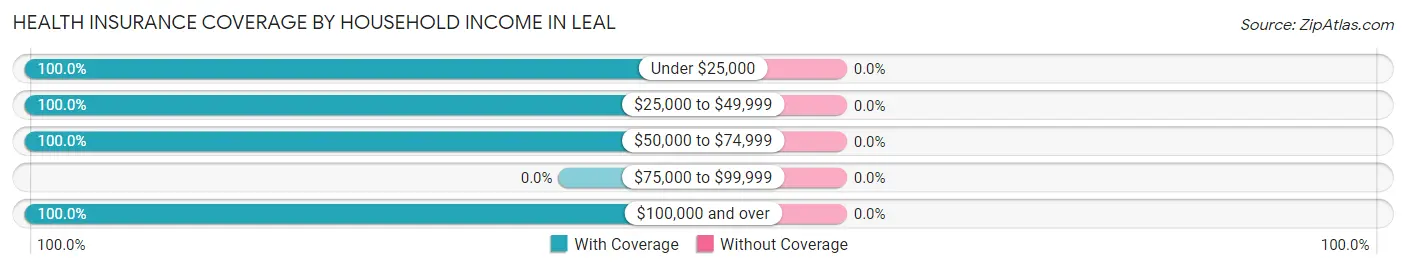
| Household Income | With Coverage | Without Coverage |
| Under $25,000 | 4 (100.0%) | 0 (0.0%) |
| $25,000 to $49,999 | 2 (100.0%) | 0 (0.0%) |
| $50,000 to $74,999 | 1 (100.0%) | 0 (0.0%) |
| $75,000 to $99,999 | 0 (0.0%) | 0 (0.0%) |
| $100,000 and over | 2 (100.0%) | 0 (0.0%) |
Public vs Private Health Insurance Coverage by Age in Leal
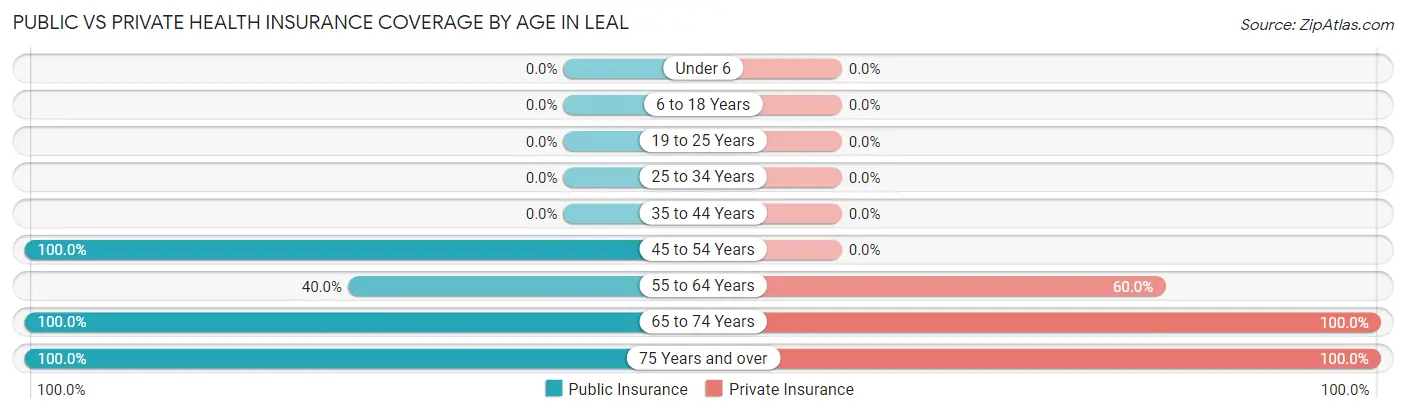
| Age Bracket | Public Insurance | Private Insurance |
| Under 6 | 0 (0.0%) | 0 (0.0%) |
| 6 to 18 Years | 0 (0.0%) | 0 (0.0%) |
| 19 to 25 Years | 0 (0.0%) | 0 (0.0%) |
| 25 to 34 Years | 0 (0.0%) | 0 (0.0%) |
| 35 to 44 Years | 0 (0.0%) | 0 (0.0%) |
| 45 to 54 Years | 1 (100.0%) | 0 (0.0%) |
| 55 to 64 Years | 2 (40.0%) | 3 (60.0%) |
| 65 to 74 Years | 1 (100.0%) | 1 (100.0%) |
| 75 Years and over | 2 (100.0%) | 2 (100.0%) |
| Total | 6 (66.7%) | 6 (66.7%) |
Disability Status by Sex by Age in Leal

| Age Bracket | Male | Female |
| Under 5 Years | 0 (0.0%) | 0 (0.0%) |
| 5 to 17 Years | 0 (0.0%) | 0 (0.0%) |
| 18 to 34 Years | 0 (0.0%) | 0 (0.0%) |
| 35 to 64 Years | 1 (33.3%) | 0 (0.0%) |
| 65 to 74 Years | 0 (0.0%) | 0 (0.0%) |
| 75 Years and over | 0 (0.0%) | 0 (0.0%) |
Disability Class by Sex by Age in Leal
Disability Class: Hearing Difficulty
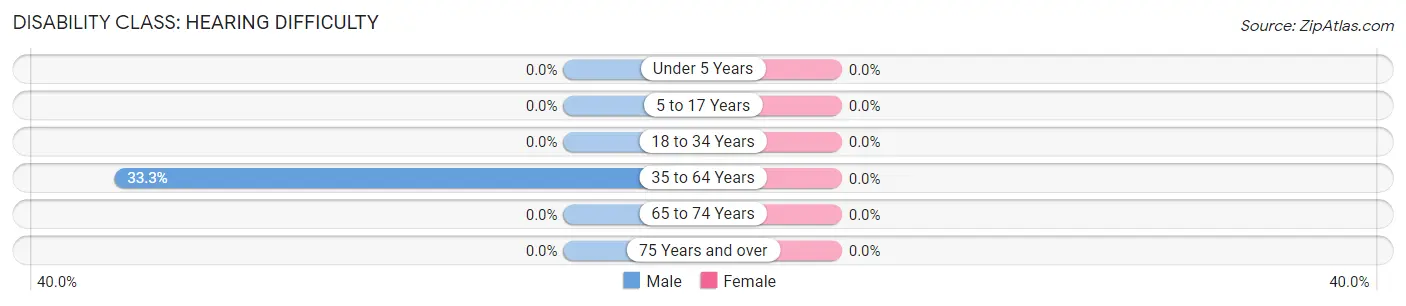
| Age Bracket | Male | Female |
| Under 5 Years | 0 (0.0%) | 0 (0.0%) |
| 5 to 17 Years | 0 (0.0%) | 0 (0.0%) |
| 18 to 34 Years | 0 (0.0%) | 0 (0.0%) |
| 35 to 64 Years | 1 (33.3%) | 0 (0.0%) |
| 65 to 74 Years | 0 (0.0%) | 0 (0.0%) |
| 75 Years and over | 0 (0.0%) | 0 (0.0%) |
Disability Class: Vision Difficulty
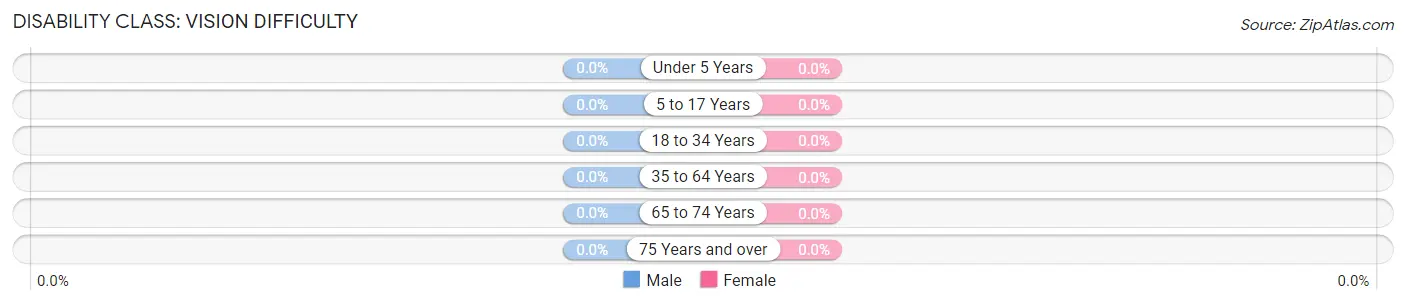
| Age Bracket | Male | Female |
| Under 5 Years | 0 (0.0%) | 0 (0.0%) |
| 5 to 17 Years | 0 (0.0%) | 0 (0.0%) |
| 18 to 34 Years | 0 (0.0%) | 0 (0.0%) |
| 35 to 64 Years | 0 (0.0%) | 0 (0.0%) |
| 65 to 74 Years | 0 (0.0%) | 0 (0.0%) |
| 75 Years and over | 0 (0.0%) | 0 (0.0%) |
Disability Class: Cognitive Difficulty
| Age Bracket | Male | Female |
| 5 to 17 Years | 0 (0.0%) | 0 (0.0%) |
| 18 to 34 Years | 0 (0.0%) | 0 (0.0%) |
| 35 to 64 Years | 0 (0.0%) | 0 (0.0%) |
| 65 to 74 Years | 0 (0.0%) | 0 (0.0%) |
| 75 Years and over | 0 (0.0%) | 0 (0.0%) |
Disability Class: Ambulatory Difficulty
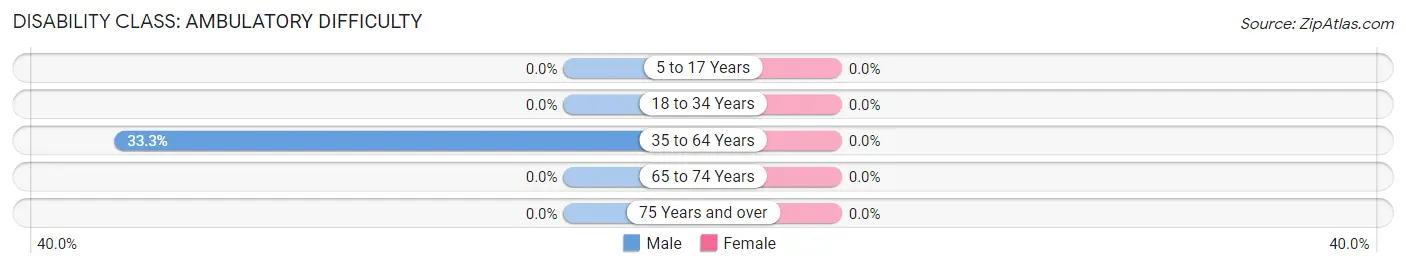
| Age Bracket | Male | Female |
| 5 to 17 Years | 0 (0.0%) | 0 (0.0%) |
| 18 to 34 Years | 0 (0.0%) | 0 (0.0%) |
| 35 to 64 Years | 1 (33.3%) | 0 (0.0%) |
| 65 to 74 Years | 0 (0.0%) | 0 (0.0%) |
| 75 Years and over | 0 (0.0%) | 0 (0.0%) |
Disability Class: Self-Care Difficulty
| Age Bracket | Male | Female |
| 5 to 17 Years | 0 (0.0%) | 0 (0.0%) |
| 18 to 34 Years | 0 (0.0%) | 0 (0.0%) |
| 35 to 64 Years | 0 (0.0%) | 0 (0.0%) |
| 65 to 74 Years | 0 (0.0%) | 0 (0.0%) |
| 75 Years and over | 0 (0.0%) | 0 (0.0%) |
Technology Access in Leal
Computing Device Access in Leal
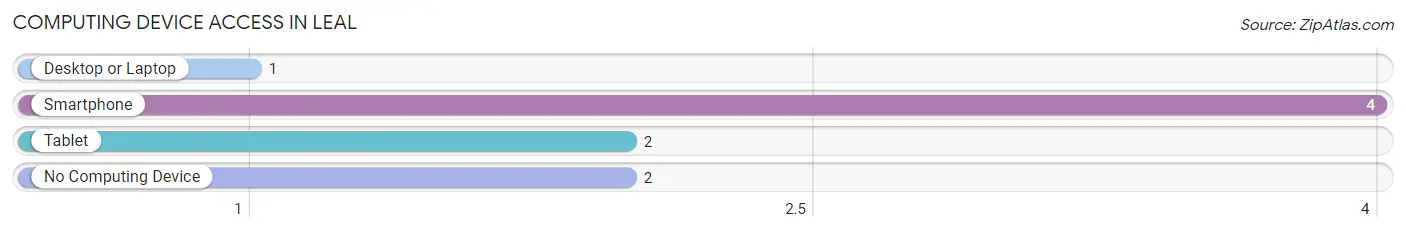
| Device Type | # Households | % Households |
| Desktop or Laptop | 1 | 16.7% |
| Smartphone | 4 | 66.7% |
| Tablet | 2 | 33.3% |
| No Computing Device | 2 | 33.3% |
| Total | 6 | 100.0% |
Internet Access in Leal
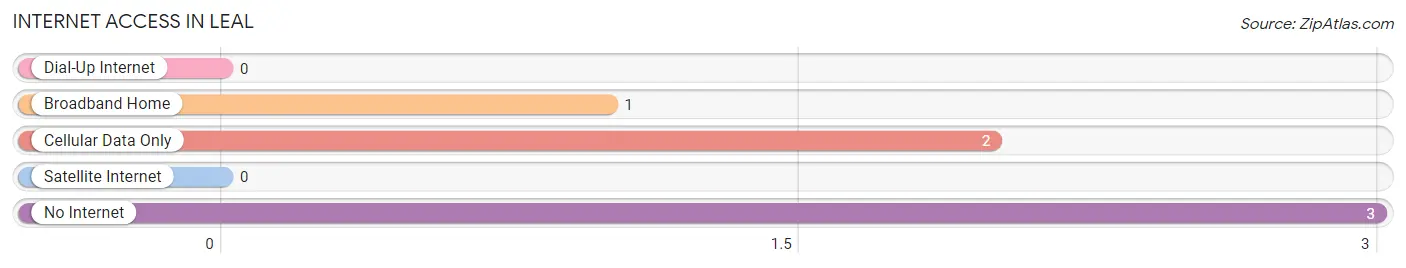
| Internet Type | # Households | % Households |
| Dial-Up Internet | 0 | 0.0% |
| Broadband Home | 1 | 16.7% |
| Cellular Data Only | 2 | 33.3% |
| Satellite Internet | 0 | 0.0% |
| No Internet | 3 | 50.0% |
| Total | 6 | 100.0% |
Leal Summary
The history of North Dakota is a long and varied one, stretching back to the days of the Native Americans who first inhabited the area. The first Europeans to explore the area were French fur traders, who arrived in the late 1700s. The area was then part of the Louisiana Purchase, and was part of the Dakota Territory until 1889, when it became the 39th state in the Union.
The geography of North Dakota is largely defined by its location in the Great Plains region of the United States. It is bordered by Minnesota to the east, South Dakota to the south, Montana to the west, and Canada to the north. The state is divided into two distinct regions: the eastern part of the state is largely flat and covered in prairie grasslands, while the western part is more rugged and mountainous. The highest point in the state is White Butte, which stands at 3,506 feet above sea level.
The economy of North Dakota is largely based on agriculture, with wheat, corn, and soybeans being the main crops. Other important industries include oil and gas, manufacturing, and tourism. The state is also home to several military bases, which provide a significant source of employment.
The demographics of North Dakota are largely rural, with the majority of the population living in small towns and rural areas. The largest city in the state is Fargo, with a population of around 120,000. The state has a population of just over 740,000, with the majority of the population being of European descent. The state also has a significant Native American population, with the largest tribes being the Sioux, Mandan, and Hidatsa.
North Dakota has a rich and varied history, and its geography, economy, and demographics all contribute to its unique character. From its Native American roots to its modern-day economy, North Dakota has something to offer everyone.
Common Questions
What is Per Capita Income in Leal?
Per Capita income in Leal is $34,500.
What is Inequality or Gini Index in Leal?
Inequality or Gini Index in Leal is 0.51.
What is the Total Population of Leal?
Total Population of Leal is 9.
What is the Total Male Population of Leal?
Total Male Population of Leal is 6.
What is the Total Female Population of Leal?
Total Female Population of Leal is 3.
What is the Ratio of Males per 100 Females in Leal?
There are 200.00 Males per 100 Females in Leal.
What is the Ratio of Females per 100 Males in Leal?
There are 50.00 Females per 100 Males in Leal.
What is the Median Population Age in Leal?
Median Population Age in Leal is 63.3 Years.
What is the Average Family Size in Leal
Average Family Size in Leal is 2.0 People.
What is the Average Household Size in Leal
Average Household Size in Leal is 1.5 People.
How Large is the Labor Force in Leal?
There are 3 People in the Labor Forcein in Leal.
What is the Percentage of People in the Labor Force in Leal?
33.3% of People are in the Labor Force in Leal.