Martin, ND Map & Demographics
Martin Map
Martin Overview
$36,525
PER CAPITA INCOME
$54,688
AVG FAMILY INCOME
$52,875
AVG HOUSEHOLD INCOME
0.31
INEQUALITY / GINI INDEX
57
TOTAL POPULATION
27
MALE POPULATION
30
FEMALE POPULATION
90.00
MALES / 100 FEMALES
111.11
FEMALES / 100 MALES
63.4
MEDIAN AGE
2.2
AVG FAMILY SIZE
1.6
AVG HOUSEHOLD SIZE
40
LABOR FORCE [ PEOPLE ]
76.9%
PERCENT IN LABOR FORCE
Martin Zip Codes
Martin Area Codes
Income in Martin
Income Overview in Martin
Per Capita Income in Martin is $36,525, while median incomes of families and households are $54,688 and $52,875 respectively.
| Characteristic | Number | Measure |
| Per Capita Income | 57 | $36,525 |
| Median Family Income | 16 | $54,688 |
| Mean Family Income | 16 | $75,131 |
| Median Household Income | 35 | $52,875 |
| Mean Household Income | 35 | $60,803 |
| Income Deficit | 16 | $0 |
| Wage / Income Gap (%) | 57 | 0.00% |
| Wage / Income Gap ($) | 57 | 100.00¢ per $1 |
| Gini / Inequality Index | 57 | 0.31 |
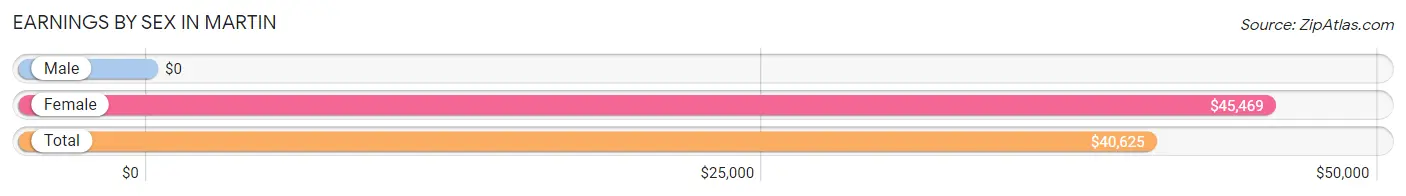
Earnings by Sex in Martin
| Sex | Number | Average Earnings |
| Male | 18 (43.9%) | $0 |
| Female | 23 (56.1%) | $45,469 |
| Total | 41 (100.0%) | $40,625 |
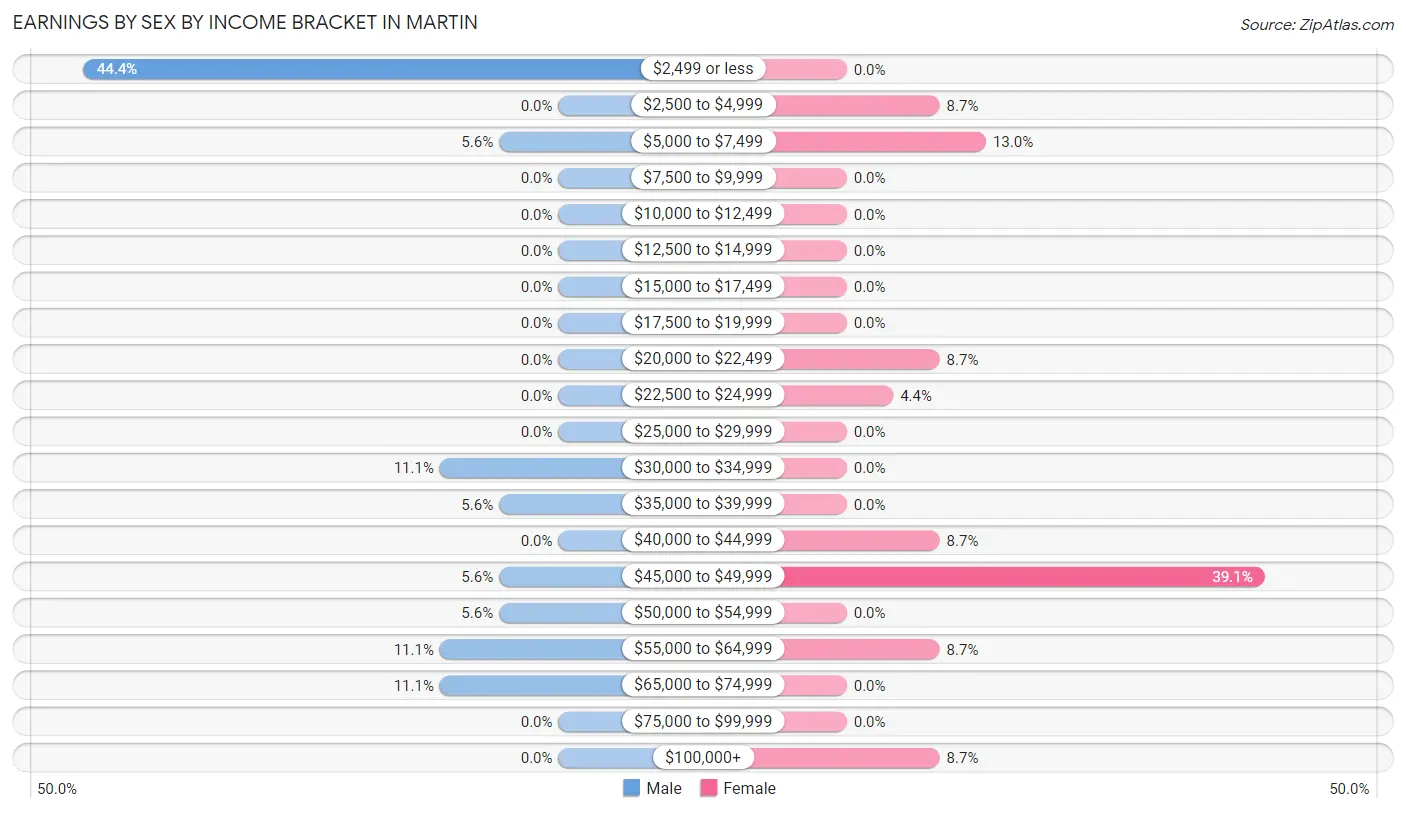
Earnings by Sex by Income Bracket in Martin
The most common earnings brackets in Martin are $2,499 or less for men (8 | 44.4%) and $45,000 to $49,999 for women (9 | 39.1%).
| Income | Male | Female |
| $2,499 or less | 8 (44.4%) | 0 (0.0%) |
| $2,500 to $4,999 | 0 (0.0%) | 2 (8.7%) |
| $5,000 to $7,499 | 1 (5.6%) | 3 (13.0%) |
| $7,500 to $9,999 | 0 (0.0%) | 0 (0.0%) |
| $10,000 to $12,499 | 0 (0.0%) | 0 (0.0%) |
| $12,500 to $14,999 | 0 (0.0%) | 0 (0.0%) |
| $15,000 to $17,499 | 0 (0.0%) | 0 (0.0%) |
| $17,500 to $19,999 | 0 (0.0%) | 0 (0.0%) |
| $20,000 to $22,499 | 0 (0.0%) | 2 (8.7%) |
| $22,500 to $24,999 | 0 (0.0%) | 1 (4.3%) |
| $25,000 to $29,999 | 0 (0.0%) | 0 (0.0%) |
| $30,000 to $34,999 | 2 (11.1%) | 0 (0.0%) |
| $35,000 to $39,999 | 1 (5.6%) | 0 (0.0%) |
| $40,000 to $44,999 | 0 (0.0%) | 2 (8.7%) |
| $45,000 to $49,999 | 1 (5.6%) | 9 (39.1%) |
| $50,000 to $54,999 | 1 (5.6%) | 0 (0.0%) |
| $55,000 to $64,999 | 2 (11.1%) | 2 (8.7%) |
| $65,000 to $74,999 | 2 (11.1%) | 0 (0.0%) |
| $75,000 to $99,999 | 0 (0.0%) | 0 (0.0%) |
| $100,000+ | 0 (0.0%) | 2 (8.7%) |
| Total | 18 (100.0%) | 23 (100.0%) |
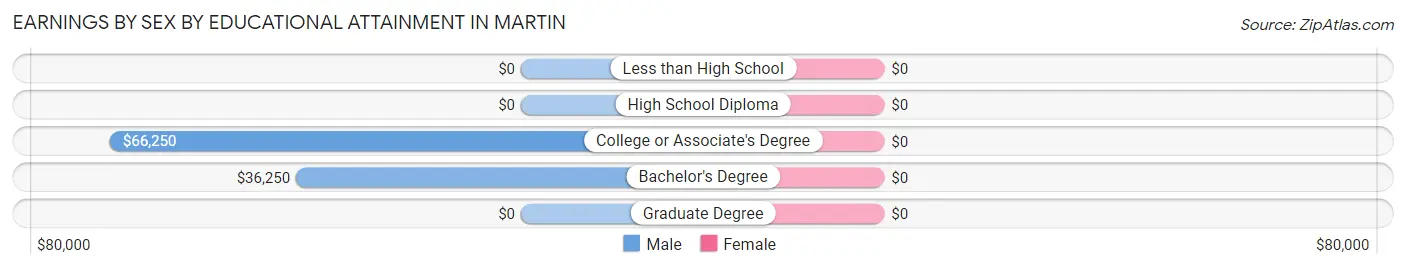
Earnings by Sex by Educational Attainment in Martin
| Educational Attainment | Male Income | Female Income |
| Less than High School | - | - |
| High School Diploma | - | - |
| College or Associate's Degree | $66,250 | $0 |
| Bachelor's Degree | $36,250 | $0 |
| Graduate Degree | - | - |
| Total | - | - |
Family Income in Martin
Family Income Brackets in Martin
According to the Martin family income data, there are 9 families falling into the $50,000 to $74,999 income range, which is the most common income bracket and makes up 56.2% of all families.
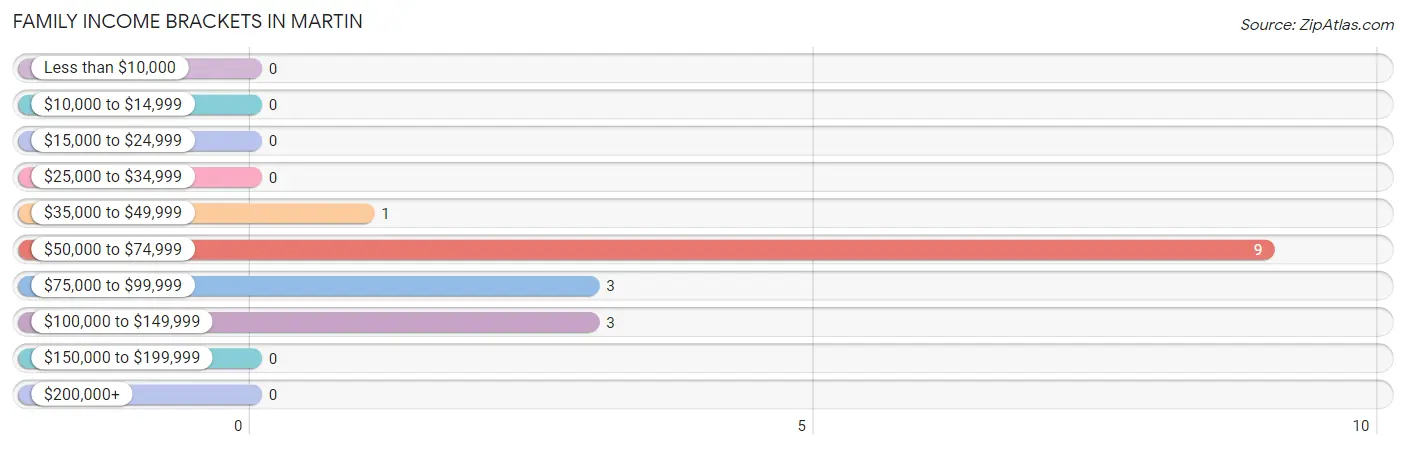
| Income Bracket | # Families | % Families |
| Less than $10,000 | 0 | 0.0% |
| $10,000 to $14,999 | 0 | 0.0% |
| $15,000 to $24,999 | 0 | 0.0% |
| $25,000 to $34,999 | 0 | 0.0% |
| $35,000 to $49,999 | 1 | 6.3% |
| $50,000 to $74,999 | 9 | 56.3% |
| $75,000 to $99,999 | 3 | 18.8% |
| $100,000 to $149,999 | 3 | 18.8% |
| $150,000 to $199,999 | 0 | 0.0% |
| $200,000+ | 0 | 0.0% |
Family Income by Famaliy Size in Martin
2-person families (13 | 81.2%) account for the highest median family income in Martin with $54,531 per family, while 2-person families (13 | 81.2%) have the highest median income of $27,266 per family member.
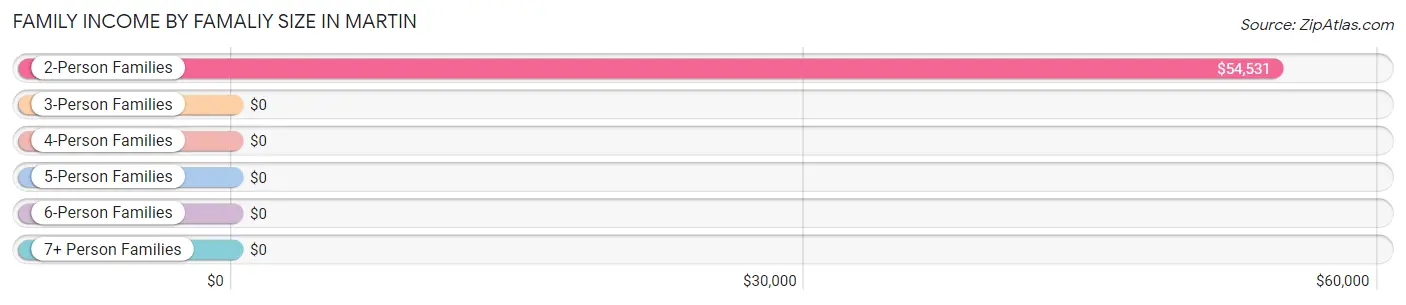
| Income Bracket | # Families | Median Income |
| 2-Person Families | 13 (81.2%) | $54,531 |
| 3-Person Families | 1 (6.2%) | $0 |
| 4-Person Families | 2 (12.5%) | $0 |
| 5-Person Families | 0 (0.0%) | $0 |
| 6-Person Families | 0 (0.0%) | $0 |
| 7+ Person Families | 0 (0.0%) | $0 |
| Total | 16 (100.0%) | $54,688 |
Family Income by Number of Earners in Martin
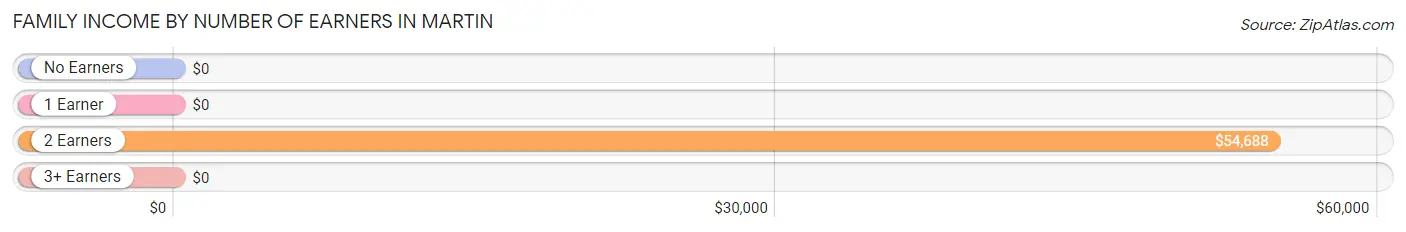
| Number of Earners | # Families | Median Income |
| No Earners | 1 (6.2%) | $0 |
| 1 Earner | 1 (6.2%) | $0 |
| 2 Earners | 14 (87.5%) | $54,688 |
| 3+ Earners | 0 (0.0%) | $0 |
| Total | 16 (100.0%) | $54,688 |
Household Income in Martin
Household Income Brackets in Martin
With 11 households falling in the category, the $35,000 to $49,999 income range is the most frequent in Martin, accounting for 31.4% of all households.
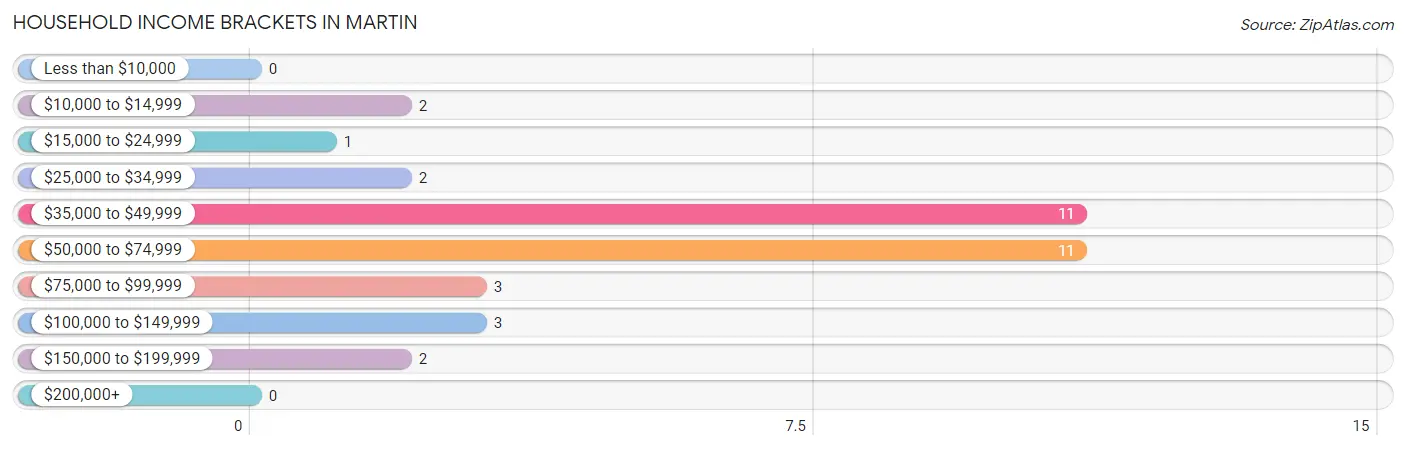
| Income Bracket | # Households | % Households |
| Less than $10,000 | 0 | 0.0% |
| $10,000 to $14,999 | 2 | 5.7% |
| $15,000 to $24,999 | 1 | 2.9% |
| $25,000 to $34,999 | 2 | 5.7% |
| $35,000 to $49,999 | 11 | 31.4% |
| $50,000 to $74,999 | 11 | 31.4% |
| $75,000 to $99,999 | 3 | 8.6% |
| $100,000 to $149,999 | 3 | 8.6% |
| $150,000 to $199,999 | 2 | 5.7% |
| $200,000+ | 0 | 0.0% |
Household Income by Householder Age in Martin
The median household income in Martin is $52,875, with the highest median household income of $68,750 found in the 25 to 44 years age bracket for the primary householder. A total of 4 households (11.4%) fall into this category. Meanwhile, the 15 to 24 years age bracket for the primary householder has the lowest median household income of $0, with 2 households (5.7%) in this group.
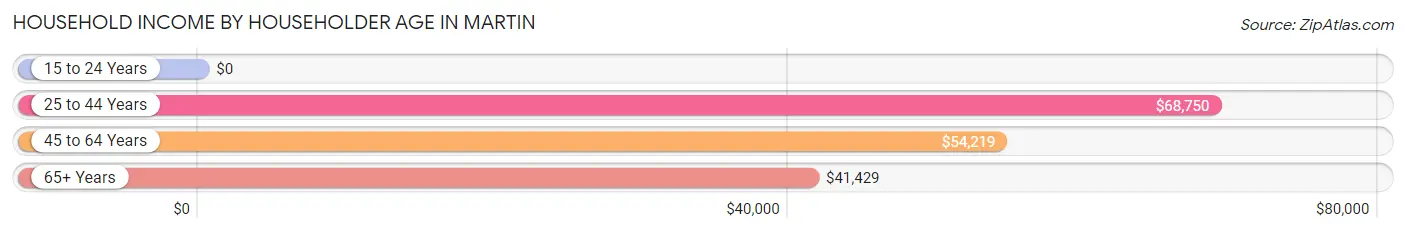
| Income Bracket | # Households | Median Income |
| 15 to 24 Years | 2 (5.7%) | $0 |
| 25 to 44 Years | 4 (11.4%) | $68,750 |
| 45 to 64 Years | 15 (42.9%) | $54,219 |
| 65+ Years | 14 (40.0%) | $41,429 |
| Total | 35 (100.0%) | $52,875 |
Poverty in Martin
Income Below Poverty by Sex and Age in Martin
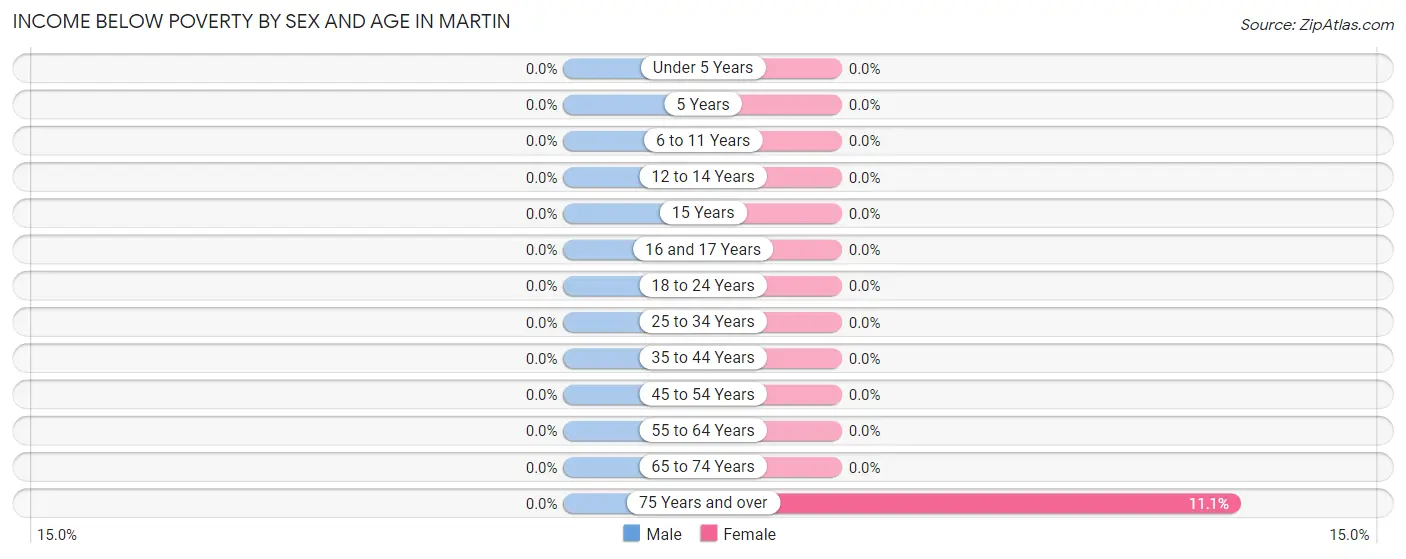
| Age Bracket | Male | Female |
| Under 5 Years | 0 (0.0%) | 0 (0.0%) |
| 5 Years | 0 (0.0%) | 0 (0.0%) |
| 6 to 11 Years | 0 (0.0%) | 0 (0.0%) |
| 12 to 14 Years | 0 (0.0%) | 0 (0.0%) |
| 15 Years | 0 (0.0%) | 0 (0.0%) |
| 16 and 17 Years | 0 (0.0%) | 0 (0.0%) |
| 18 to 24 Years | 0 (0.0%) | 0 (0.0%) |
| 25 to 34 Years | 0 (0.0%) | 0 (0.0%) |
| 35 to 44 Years | 0 (0.0%) | 0 (0.0%) |
| 45 to 54 Years | 0 (0.0%) | 0 (0.0%) |
| 55 to 64 Years | 0 (0.0%) | 0 (0.0%) |
| 65 to 74 Years | 0 (0.0%) | 0 (0.0%) |
| 75 Years and over | 0 (0.0%) | 1 (11.1%) |
| Total | 0 (0.0%) | 1 (3.3%) |
Income Above Poverty by Sex and Age in Martin
According to the poverty statistics in Martin, males aged under 5 years and females aged 18 to 24 years are the age groups that are most secure financially, with 100.0% of males and 100.0% of females in these age groups living above the poverty line.
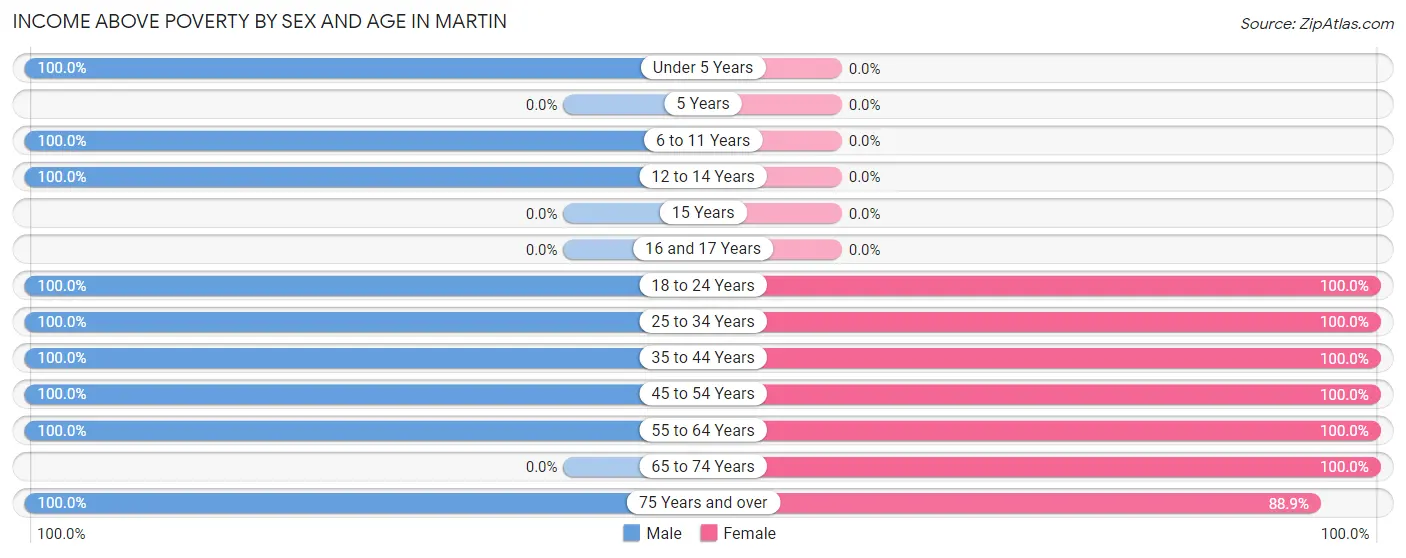
| Age Bracket | Male | Female |
| Under 5 Years | 2 (100.0%) | 0 (0.0%) |
| 5 Years | 0 (0.0%) | 0 (0.0%) |
| 6 to 11 Years | 2 (100.0%) | 0 (0.0%) |
| 12 to 14 Years | 1 (100.0%) | 0 (0.0%) |
| 15 Years | 0 (0.0%) | 0 (0.0%) |
| 16 and 17 Years | 0 (0.0%) | 0 (0.0%) |
| 18 to 24 Years | 2 (100.0%) | 2 (100.0%) |
| 25 to 34 Years | 1 (100.0%) | 2 (100.0%) |
| 35 to 44 Years | 2 (100.0%) | 1 (100.0%) |
| 45 to 54 Years | 2 (100.0%) | 3 (100.0%) |
| 55 to 64 Years | 13 (100.0%) | 10 (100.0%) |
| 65 to 74 Years | 0 (0.0%) | 3 (100.0%) |
| 75 Years and over | 2 (100.0%) | 8 (88.9%) |
| Total | 27 (100.0%) | 29 (96.7%) |
Income Below Poverty Among Married-Couple Families in Martin
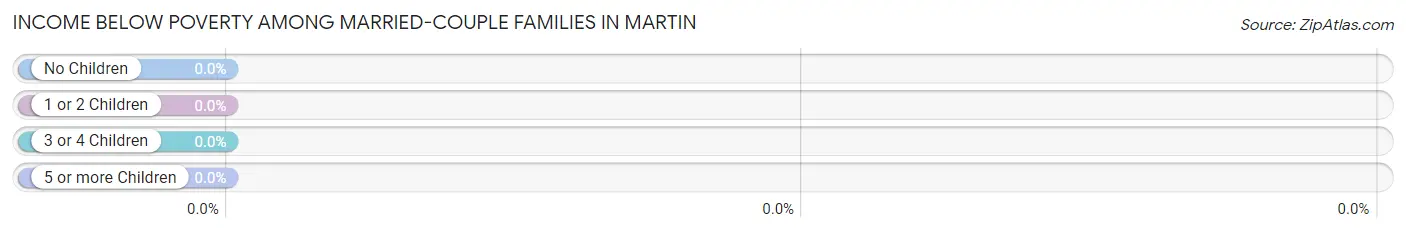
| Children | Above Poverty | Below Poverty |
| No Children | 13 (100.0%) | 0 (0.0%) |
| 1 or 2 Children | 3 (100.0%) | 0 (0.0%) |
| 3 or 4 Children | 0 (0.0%) | 0 (0.0%) |
| 5 or more Children | 0 (0.0%) | 0 (0.0%) |
| Total | 16 (100.0%) | 0 (0.0%) |
Income Below Poverty Among Single-Parent Households in Martin
| Children | Single Father | Single Mother |
| No Children | 0 (0.0%) | 0 (0.0%) |
| 1 or 2 Children | 0 (0.0%) | 0 (0.0%) |
| 3 or 4 Children | 0 (0.0%) | 0 (0.0%) |
| 5 or more Children | 0 (0.0%) | 0 (0.0%) |
| Total | 0 (0.0%) | 0 (0.0%) |
Income Below Poverty Among Married-Couple vs Single-Parent Households in Martin
| Children | Married-Couple Families | Single-Parent Households |
| No Children | 0 (0.0%) | 0 (0.0%) |
| 1 or 2 Children | 0 (0.0%) | 0 (0.0%) |
| 3 or 4 Children | 0 (0.0%) | 0 (0.0%) |
| 5 or more Children | 0 (0.0%) | 0 (0.0%) |
| Total | 0 (0.0%) | 0 (0.0%) |
Race in Martin
The most populous races in Martin are White / Caucasian (53 | 93.0%), Hispanic or Latino (4 | 7.0%), and Two or more Races (4 | 7.0%).
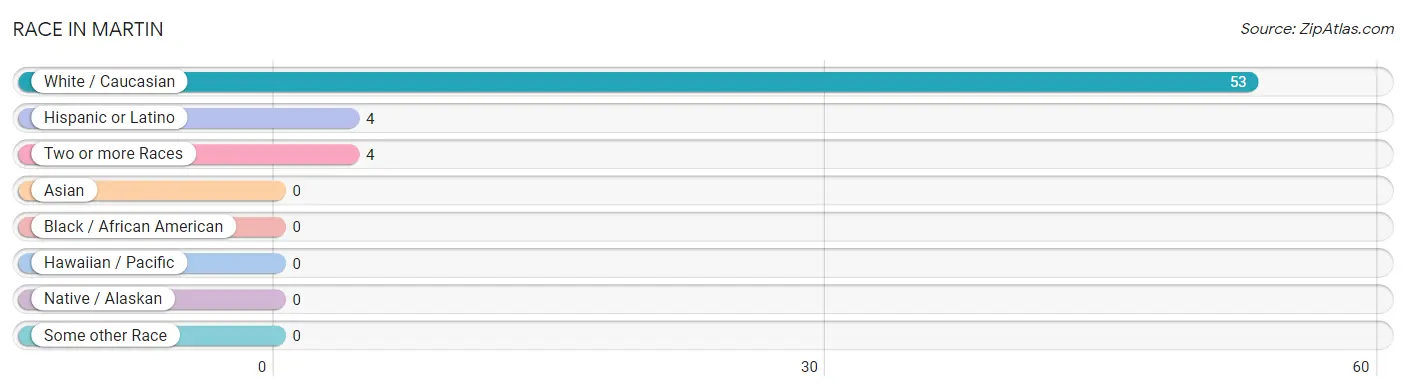
| Race | # Population | % Population |
| Asian | 0 | 0.0% |
| Black / African American | 0 | 0.0% |
| Hawaiian / Pacific | 0 | 0.0% |
| Hispanic or Latino | 4 | 7.0% |
| Native / Alaskan | 0 | 0.0% |
| White / Caucasian | 53 | 93.0% |
| Two or more Races | 4 | 7.0% |
| Some other Race | 0 | 0.0% |
| Total | 57 | 100.0% |
Ancestry in Martin
The most populous ancestries reported in Martin are German (22 | 38.6%), English (12 | 21.0%), Spanish (4 | 7.0%), American (2 | 3.5%), and Scottish (2 | 3.5%), together accounting for 73.7% of all Martin residents.
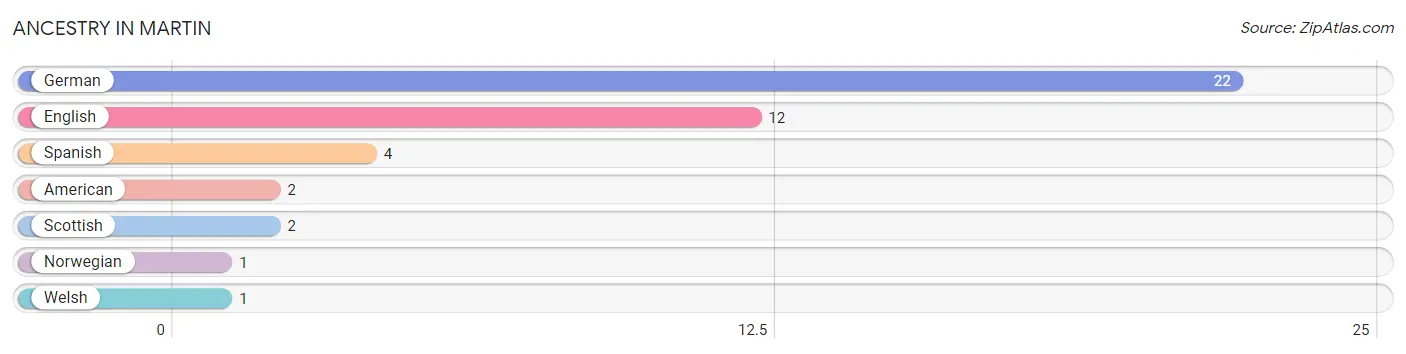
| Ancestry | # Population | % Population |
| American | 2 | 3.5% |
| English | 12 | 21.0% |
| German | 22 | 38.6% |
| Norwegian | 1 | 1.8% |
| Scottish | 2 | 3.5% |
| Spanish | 4 | 7.0% |
| Welsh | 1 | 1.8% | View All 7 Rows |
Immigrants in Martin
The most numerous immigrant groups reported in Martin came from , and Canada (2 | 3.5%), together accounting for 3.5% of all Martin residents.

| Immigration Origin | # Population | % Population |
| Canada | 2 | 3.5% | View All 1 Rows |
Sex and Age in Martin
Sex and Age in Martin
The most populous age groups in Martin are 60 to 64 Years (10 | 37.0%) for men and 60 to 64 Years (8 | 26.7%) for women.
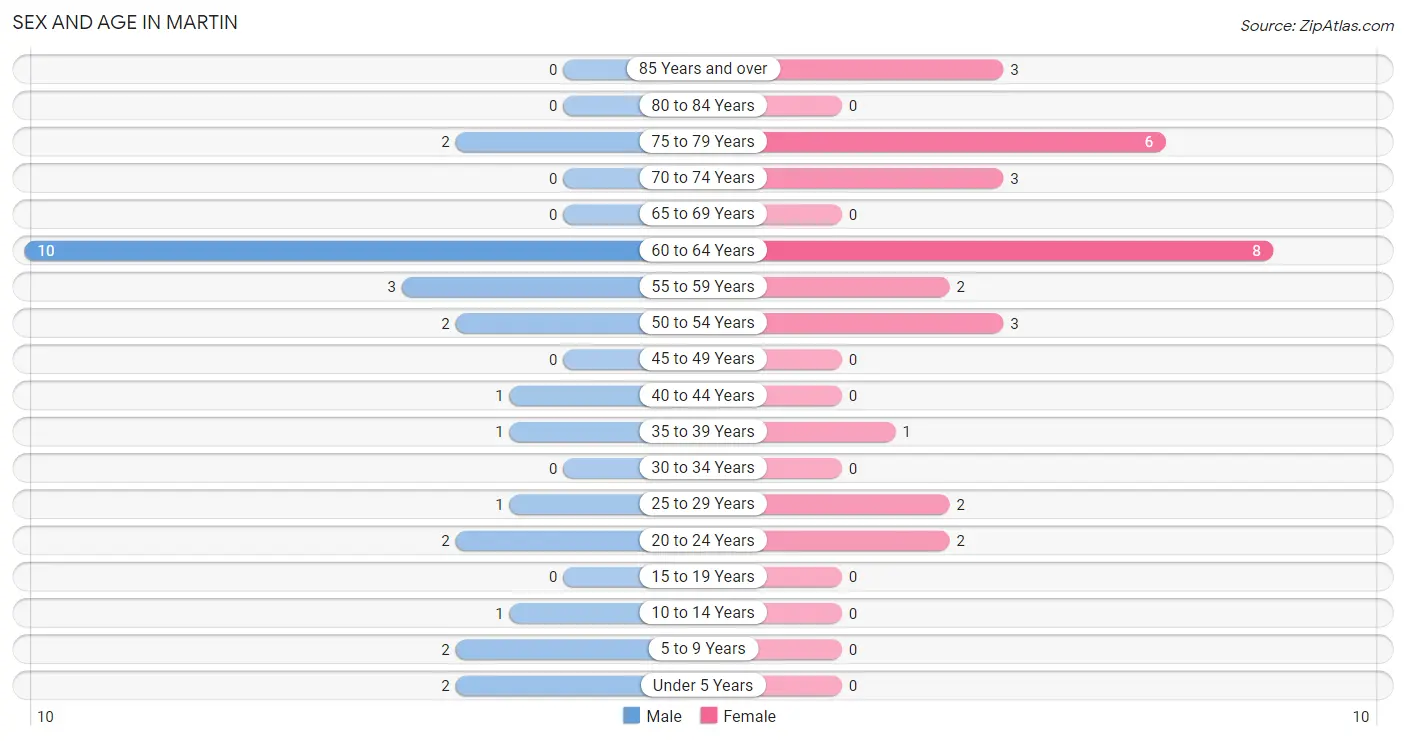
| Age Bracket | Male | Female |
| Under 5 Years | 2 (7.4%) | 0 (0.0%) |
| 5 to 9 Years | 2 (7.4%) | 0 (0.0%) |
| 10 to 14 Years | 1 (3.7%) | 0 (0.0%) |
| 15 to 19 Years | 0 (0.0%) | 0 (0.0%) |
| 20 to 24 Years | 2 (7.4%) | 2 (6.7%) |
| 25 to 29 Years | 1 (3.7%) | 2 (6.7%) |
| 30 to 34 Years | 0 (0.0%) | 0 (0.0%) |
| 35 to 39 Years | 1 (3.7%) | 1 (3.3%) |
| 40 to 44 Years | 1 (3.7%) | 0 (0.0%) |
| 45 to 49 Years | 0 (0.0%) | 0 (0.0%) |
| 50 to 54 Years | 2 (7.4%) | 3 (10.0%) |
| 55 to 59 Years | 3 (11.1%) | 2 (6.7%) |
| 60 to 64 Years | 10 (37.0%) | 8 (26.7%) |
| 65 to 69 Years | 0 (0.0%) | 0 (0.0%) |
| 70 to 74 Years | 0 (0.0%) | 3 (10.0%) |
| 75 to 79 Years | 2 (7.4%) | 6 (20.0%) |
| 80 to 84 Years | 0 (0.0%) | 0 (0.0%) |
| 85 Years and over | 0 (0.0%) | 3 (10.0%) |
| Total | 27 (100.0%) | 30 (100.0%) |
Families and Households in Martin
Median Family Size in Martin
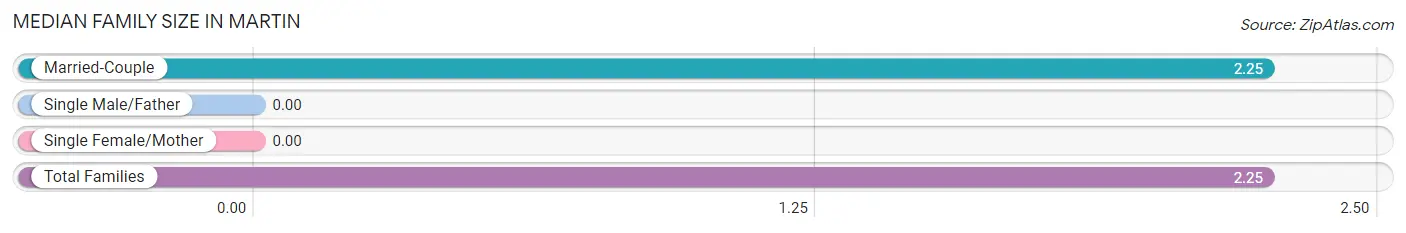
| Family Type | # Families | Family Size |
| Married-Couple | 16 (100.0%) | 2.25 |
| Single Male/Father | 0 (0.0%) | - |
| Single Female/Mother | 0 (0.0%) | - |
| Total Families | 16 (100.0%) | 2.25 |
Median Household Size in Martin
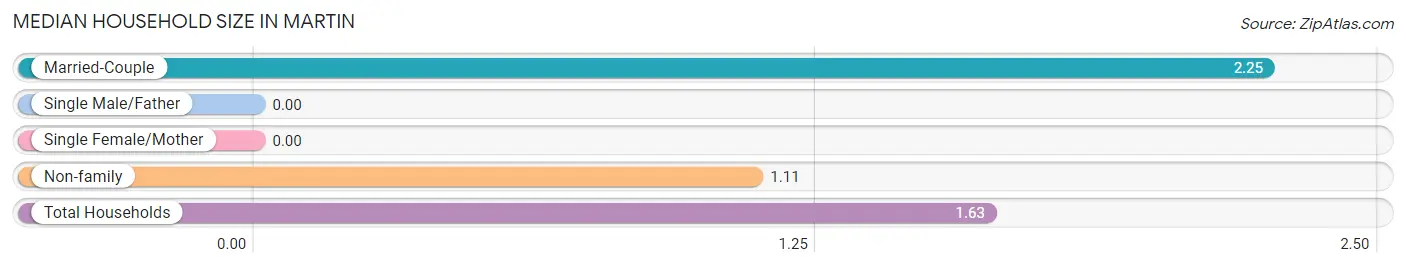
| Household Type | # Households | Household Size |
| Married-Couple | 16 (45.7%) | 2.25 |
| Single Male/Father | 0 (0.0%) | - |
| Single Female/Mother | 0 (0.0%) | - |
| Non-family | 19 (54.3%) | 1.11 |
| Total Households | 35 (100.0%) | 1.63 |
Household Size by Marriage Status in Martin
Out of a total of 35 households in Martin, 16 (45.7%) are family households, while 19 (54.3%) are nonfamily households. The most numerous type of family households are 2-person households, comprising 13, and the most common type of nonfamily households are 1-person households, comprising 17.
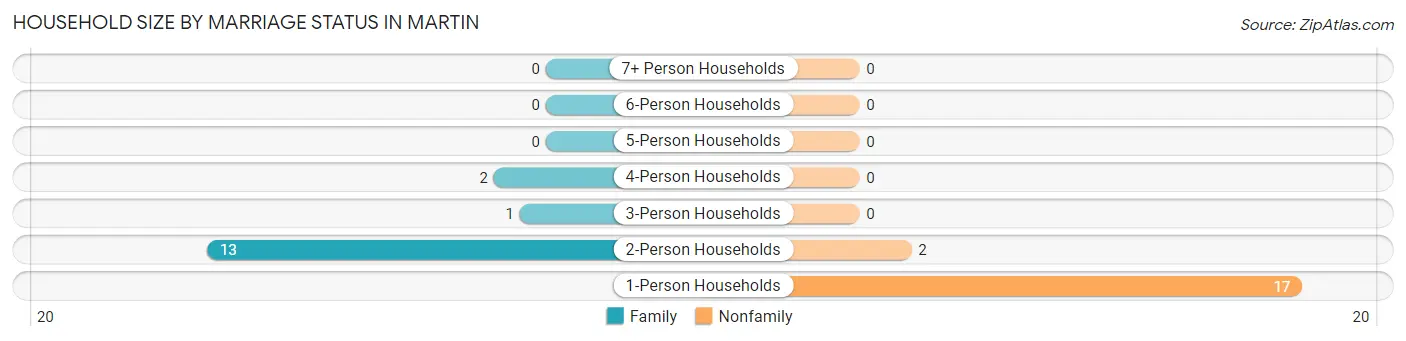
| Household Size | Family Households | Nonfamily Households |
| 1-Person Households | - | 17 (48.6%) |
| 2-Person Households | 13 (37.1%) | 2 (5.7%) |
| 3-Person Households | 1 (2.9%) | 0 (0.0%) |
| 4-Person Households | 2 (5.7%) | 0 (0.0%) |
| 5-Person Households | 0 (0.0%) | 0 (0.0%) |
| 6-Person Households | 0 (0.0%) | 0 (0.0%) |
| 7+ Person Households | 0 (0.0%) | 0 (0.0%) |
| Total | 16 (45.7%) | 19 (54.3%) |
Female Fertility in Martin
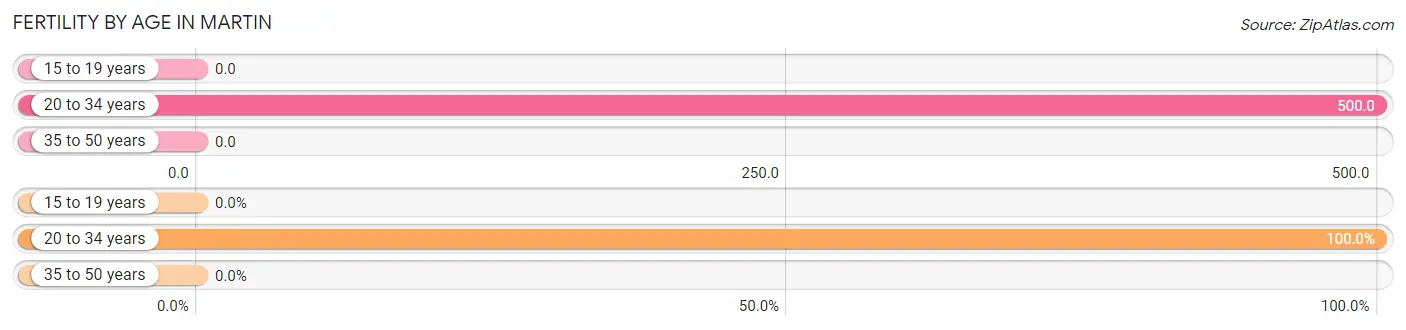
Fertility by Age in Martin
Average fertility rate in Martin is 400.0 births per 1,000 women. Women in the age bracket of 20 to 34 years have the highest fertility rate with 500.0 births per 1,000 women. Women in the age bracket of 20 to 34 years acount for 100.0% of all women with births.
| Age Bracket | Women with Births | Births / 1,000 Women |
| 15 to 19 years | 0 (0.0%) | 0.0 |
| 20 to 34 years | 2 (100.0%) | 500.0 |
| 35 to 50 years | 0 (0.0%) | 0.0 |
| Total | 2 (100.0%) | 400.0 |
Fertility by Age by Marriage Status in Martin
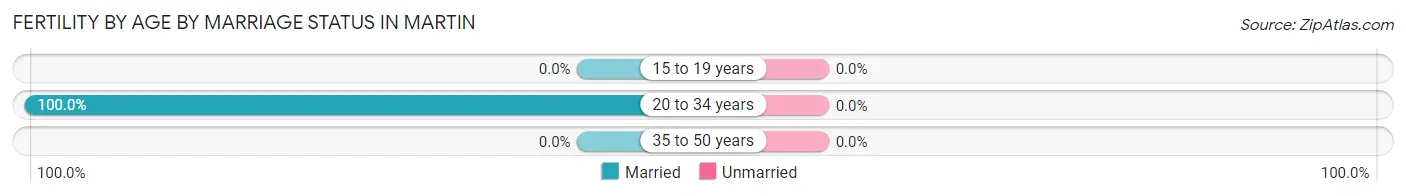
| Age Bracket | Married | Unmarried |
| 15 to 19 years | 0 (0.0%) | 0 (0.0%) |
| 20 to 34 years | 2 (100.0%) | 0 (0.0%) |
| 35 to 50 years | 0 (0.0%) | 0 (0.0%) |
| Total | 2 (100.0%) | 0 (0.0%) |
Fertility by Education in Martin
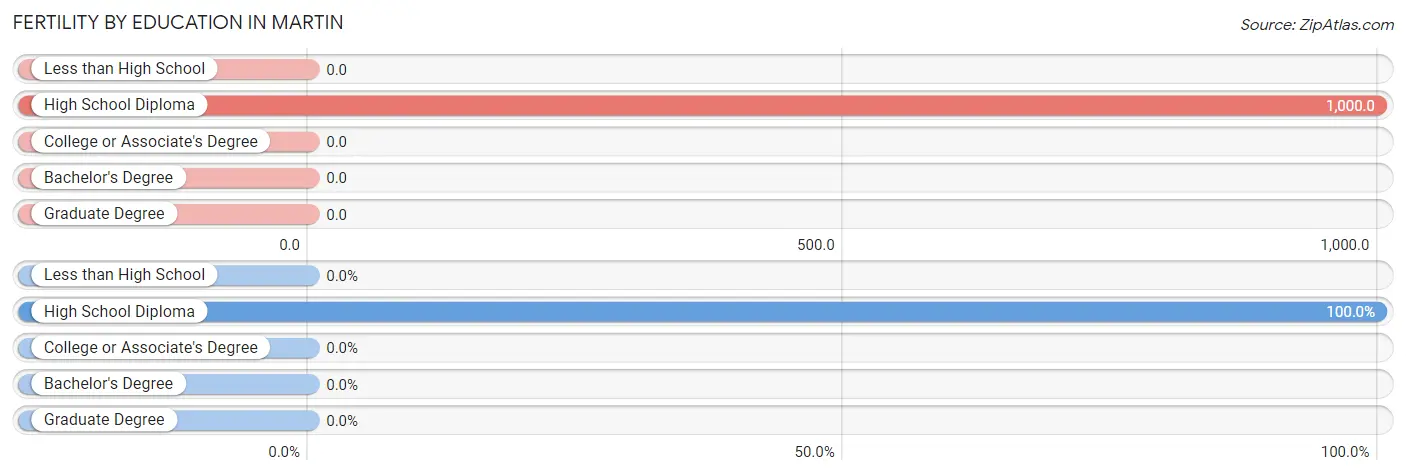
| Educational Attainment | Women with Births | Births / 1,000 Women |
| Less than High School | 0 (0.0%) | 0.0 |
| High School Diploma | 2 (100.0%) | 1,000.0 |
| College or Associate's Degree | 0 (0.0%) | 0.0 |
| Bachelor's Degree | 0 (0.0%) | 0.0 |
| Graduate Degree | 0 (0.0%) | 0.0 |
| Total | 2 (100.0%) | 400.0 |
Fertility by Education by Marriage Status in Martin
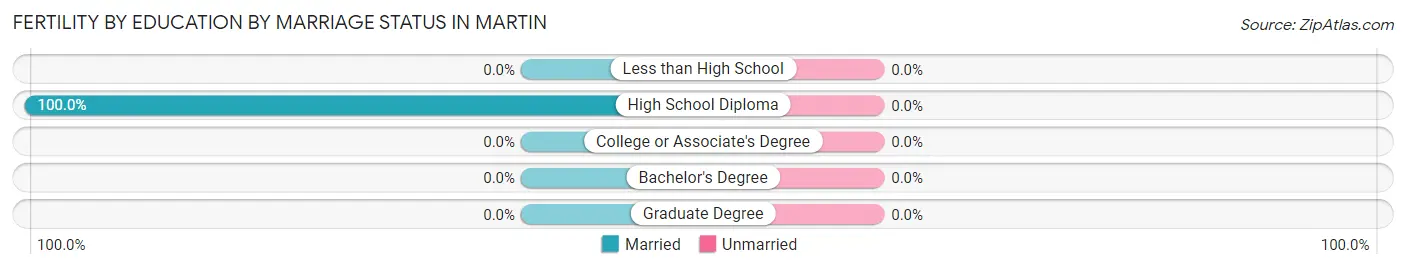
| Educational Attainment | Married | Unmarried |
| Less than High School | 0 (0.0%) | 0 (0.0%) |
| High School Diploma | 2 (100.0%) | 0 (0.0%) |
| College or Associate's Degree | 0 (0.0%) | 0 (0.0%) |
| Bachelor's Degree | 0 (0.0%) | 0 (0.0%) |
| Graduate Degree | 0 (0.0%) | 0 (0.0%) |
| Total | 2 (100.0%) | 0 (0.0%) |
Employment Characteristics in Martin
Employment by Class of Employer in Martin
Among the 40 employed individuals in Martin, private company employees (19 | 47.5%), self-employed (not incorporated) (12 | 30.0%), and federal government employees (4 | 10.0%) make up the most common classes of employment.
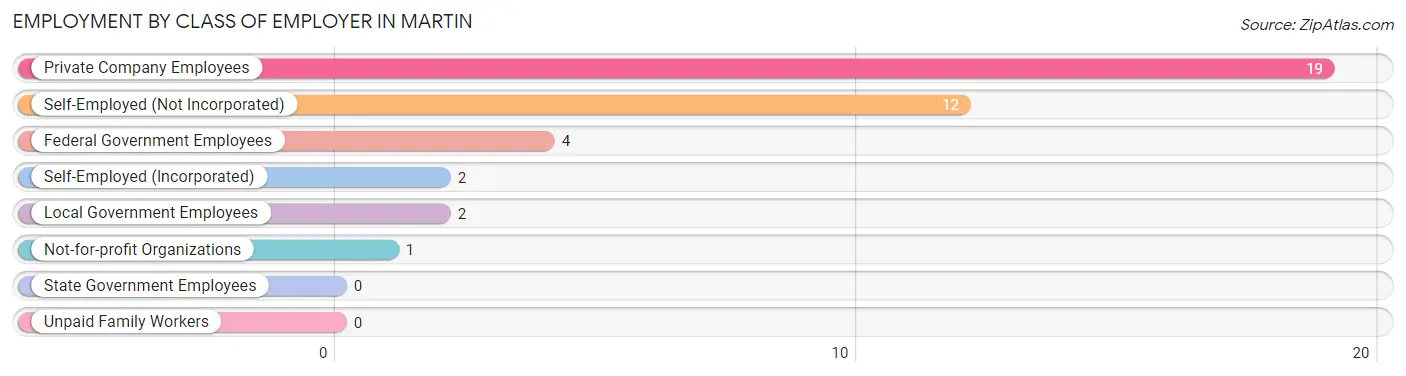
| Employer Class | # Employees | % Employees |
| Private Company Employees | 19 | 47.5% |
| Self-Employed (Incorporated) | 2 | 5.0% |
| Self-Employed (Not Incorporated) | 12 | 30.0% |
| Not-for-profit Organizations | 1 | 2.5% |
| Local Government Employees | 2 | 5.0% |
| State Government Employees | 0 | 0.0% |
| Federal Government Employees | 4 | 10.0% |
| Unpaid Family Workers | 0 | 0.0% |
| Total | 40 | 100.0% |
Employment Status by Age in Martin
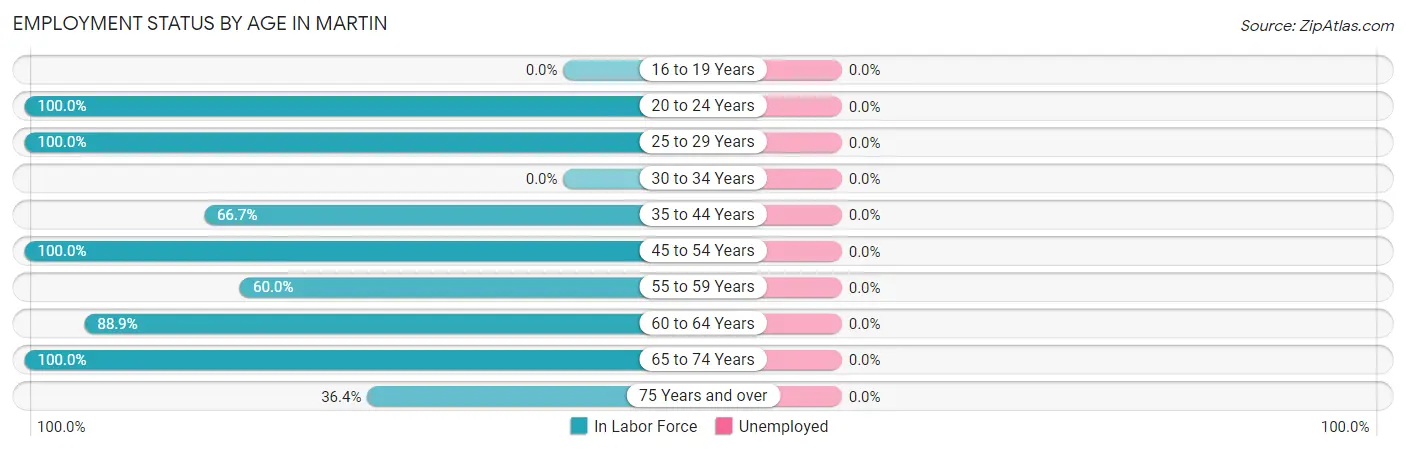
| Age Bracket | In Labor Force | Unemployed |
| 16 to 19 Years | 0 (0.0%) | 0 (0.0%) |
| 20 to 24 Years | 4 (100.0%) | 0 (0.0%) |
| 25 to 29 Years | 3 (100.0%) | 0 (0.0%) |
| 30 to 34 Years | 0 (0.0%) | 0 (0.0%) |
| 35 to 44 Years | 2 (66.7%) | 0 (0.0%) |
| 45 to 54 Years | 5 (100.0%) | 0 (0.0%) |
| 55 to 59 Years | 3 (60.0%) | 0 (0.0%) |
| 60 to 64 Years | 16 (88.9%) | 0 (0.0%) |
| 65 to 74 Years | 3 (100.0%) | 0 (0.0%) |
| 75 Years and over | 4 (36.4%) | 0 (0.0%) |
| Total | 40 (76.9%) | 0 (0.0%) |
Employment Status by Educational Attainment in Martin
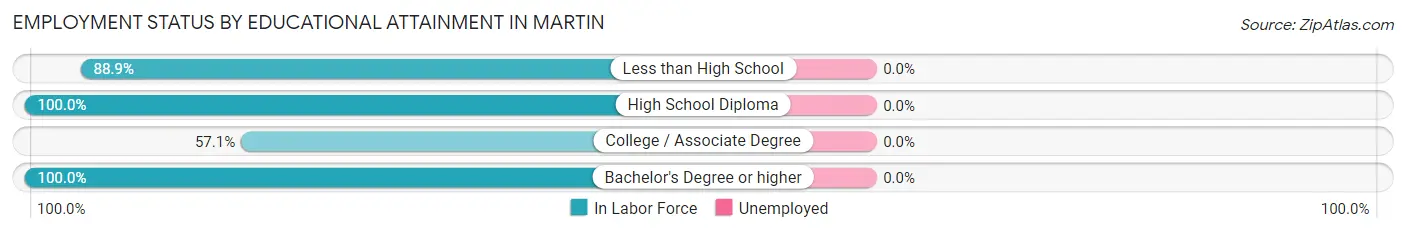
| Educational Attainment | In Labor Force | Unemployed |
| Less than High School | 16 (88.9%) | 0 (0.0%) |
| High School Diploma | 4 (100.0%) | 0 (0.0%) |
| College / Associate Degree | 4 (57.1%) | 0 (0.0%) |
| Bachelor's Degree or higher | 5 (100.0%) | 0 (0.0%) |
| Total | 29 (85.3%) | 0 (0.0%) |
Employment Occupations by Sex in Martin
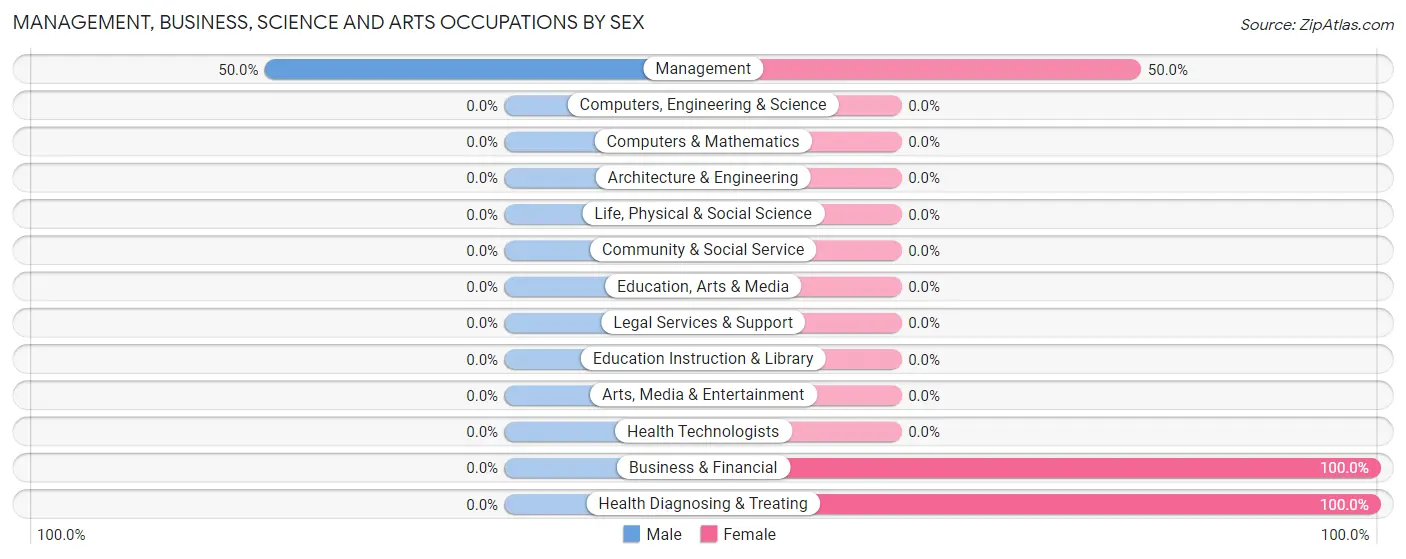
Management, Business, Science and Arts Occupations
The most common Management, Business, Science and Arts occupations in Martin are Management (2 | 5.0%), Business & Financial (2 | 5.0%), and Health Diagnosing & Treating (2 | 5.0%).
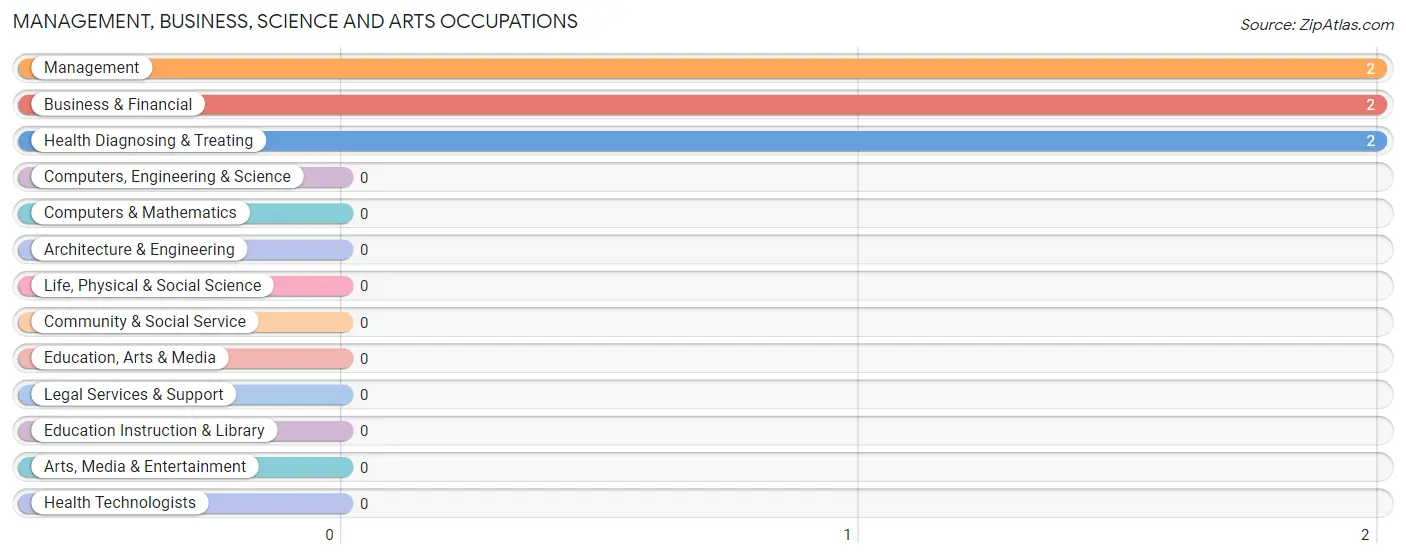
Management, Business, Science and Arts Occupations by Sex
| Occupation | Male | Female |
| Management | 1 (50.0%) | 1 (50.0%) |
| Business & Financial | 0 (0.0%) | 2 (100.0%) |
| Computers, Engineering & Science | 0 (0.0%) | 0 (0.0%) |
| Computers & Mathematics | 0 (0.0%) | 0 (0.0%) |
| Architecture & Engineering | 0 (0.0%) | 0 (0.0%) |
| Life, Physical & Social Science | 0 (0.0%) | 0 (0.0%) |
| Community & Social Service | 0 (0.0%) | 0 (0.0%) |
| Education, Arts & Media | 0 (0.0%) | 0 (0.0%) |
| Legal Services & Support | 0 (0.0%) | 0 (0.0%) |
| Education Instruction & Library | 0 (0.0%) | 0 (0.0%) |
| Arts, Media & Entertainment | 0 (0.0%) | 0 (0.0%) |
| Health Diagnosing & Treating | 0 (0.0%) | 2 (100.0%) |
| Health Technologists | 0 (0.0%) | 0 (0.0%) |
| Total (Category) | 1 (16.7%) | 5 (83.3%) |
| Total (Overall) | 17 (42.5%) | 23 (57.5%) |
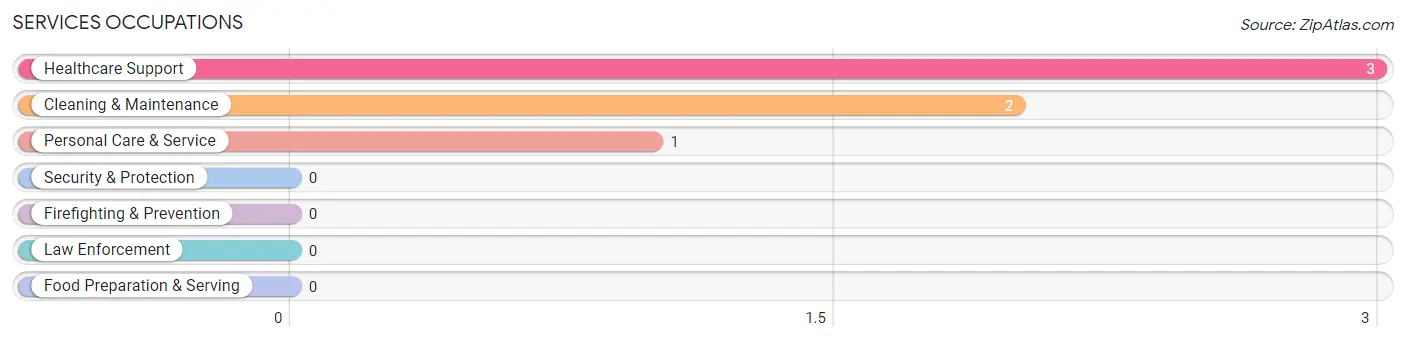
Services Occupations
The most common Services occupations in Martin are Healthcare Support (3 | 7.5%), Cleaning & Maintenance (2 | 5.0%), and Personal Care & Service (1 | 2.5%).
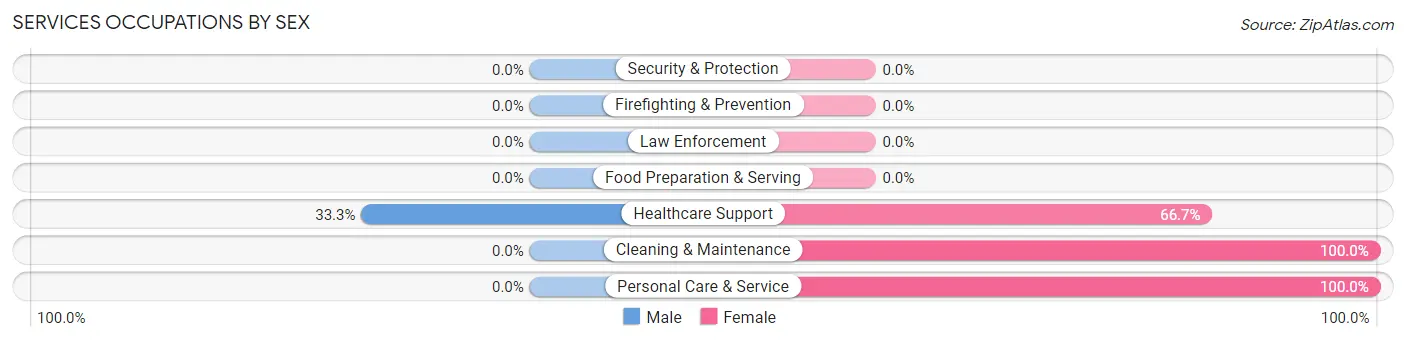
Services Occupations by Sex
| Occupation | Male | Female |
| Healthcare Support | 1 (33.3%) | 2 (66.7%) |
| Security & Protection | 0 (0.0%) | 0 (0.0%) |
| Firefighting & Prevention | 0 (0.0%) | 0 (0.0%) |
| Law Enforcement | 0 (0.0%) | 0 (0.0%) |
| Food Preparation & Serving | 0 (0.0%) | 0 (0.0%) |
| Cleaning & Maintenance | 0 (0.0%) | 2 (100.0%) |
| Personal Care & Service | 0 (0.0%) | 1 (100.0%) |
| Total (Category) | 1 (16.7%) | 5 (83.3%) |
| Total (Overall) | 17 (42.5%) | 23 (57.5%) |
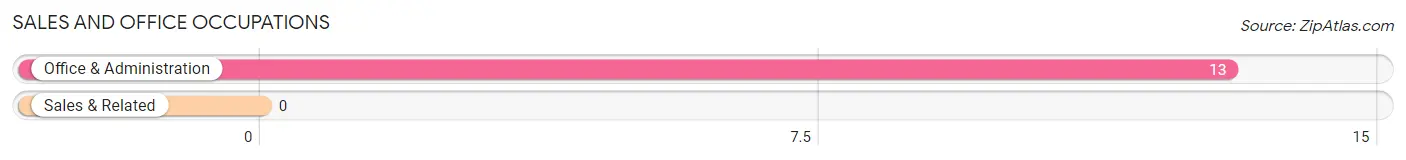
Sales and Office Occupations
The most common Sales and Office occupations in Martin are , and Office & Administration (13 | 32.5%).
Sales and Office Occupations by Sex
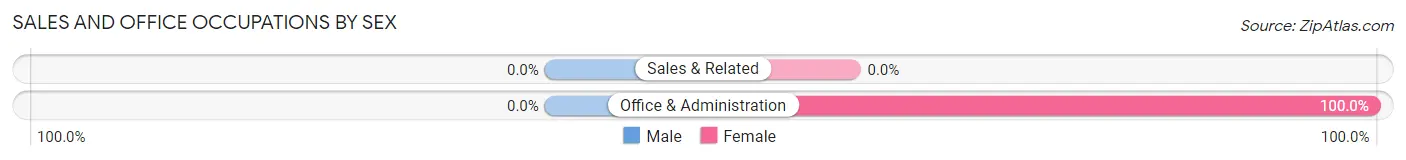
| Occupation | Male | Female |
| Sales & Related | 0 (0.0%) | 0 (0.0%) |
| Office & Administration | 0 (0.0%) | 13 (100.0%) |
| Total (Category) | 0 (0.0%) | 13 (100.0%) |
| Total (Overall) | 17 (42.5%) | 23 (57.5%) |
Natural Resources, Construction and Maintenance Occupations
The most common Natural Resources, Construction and Maintenance occupations in Martin are , and Construction & Extraction (14 | 35.0%).
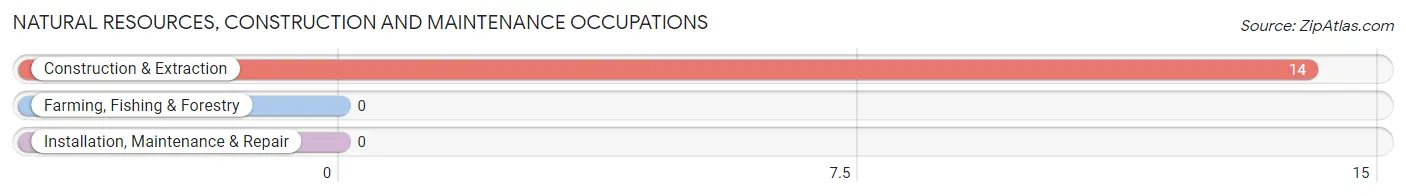
Natural Resources, Construction and Maintenance Occupations by Sex
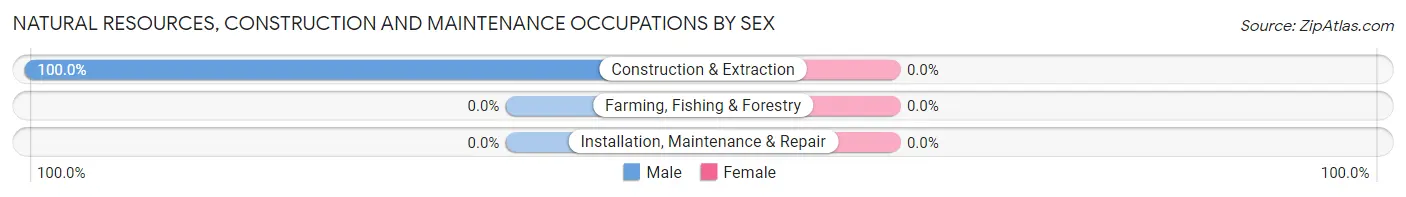
| Occupation | Male | Female |
| Farming, Fishing & Forestry | 0 (0.0%) | 0 (0.0%) |
| Construction & Extraction | 14 (100.0%) | 0 (0.0%) |
| Installation, Maintenance & Repair | 0 (0.0%) | 0 (0.0%) |
| Total (Category) | 14 (100.0%) | 0 (0.0%) |
| Total (Overall) | 17 (42.5%) | 23 (57.5%) |
Production, Transportation and Moving Occupations
The most common Production, Transportation and Moving occupations in Martin are , and Transportation (1 | 2.5%).
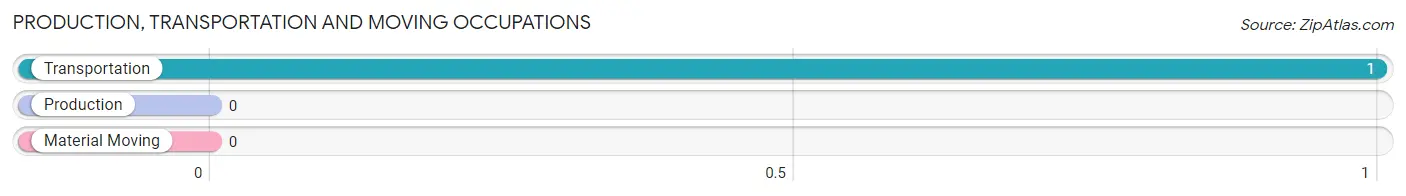
Production, Transportation and Moving Occupations by Sex
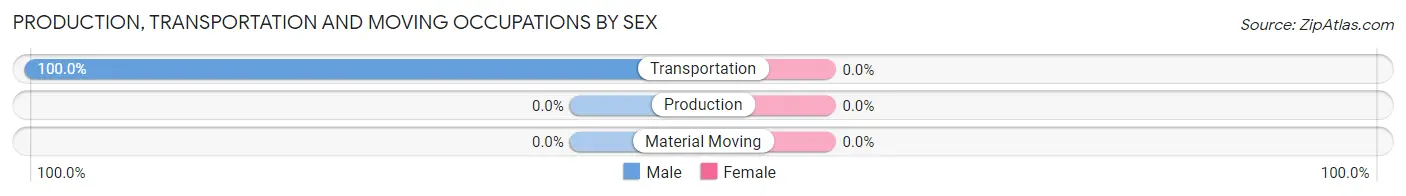
| Occupation | Male | Female |
| Production | 0 (0.0%) | 0 (0.0%) |
| Transportation | 1 (100.0%) | 0 (0.0%) |
| Material Moving | 0 (0.0%) | 0 (0.0%) |
| Total (Category) | 1 (100.0%) | 0 (0.0%) |
| Total (Overall) | 17 (42.5%) | 23 (57.5%) |
Employment Industries by Sex in Martin
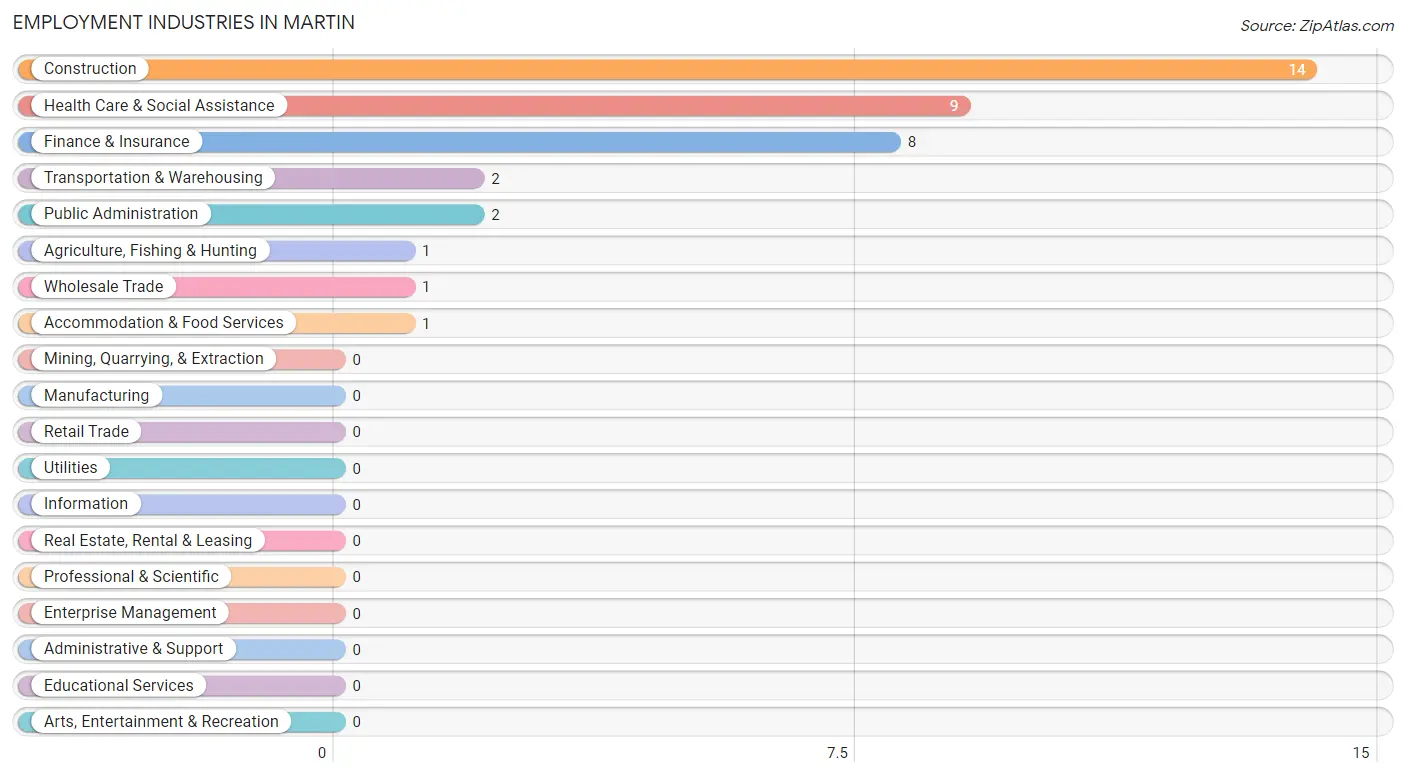
Employment Industries in Martin
The major employment industries in Martin include Construction (14 | 35.0%), Health Care & Social Assistance (9 | 22.5%), Finance & Insurance (8 | 20.0%), Transportation & Warehousing (2 | 5.0%), and Public Administration (2 | 5.0%).
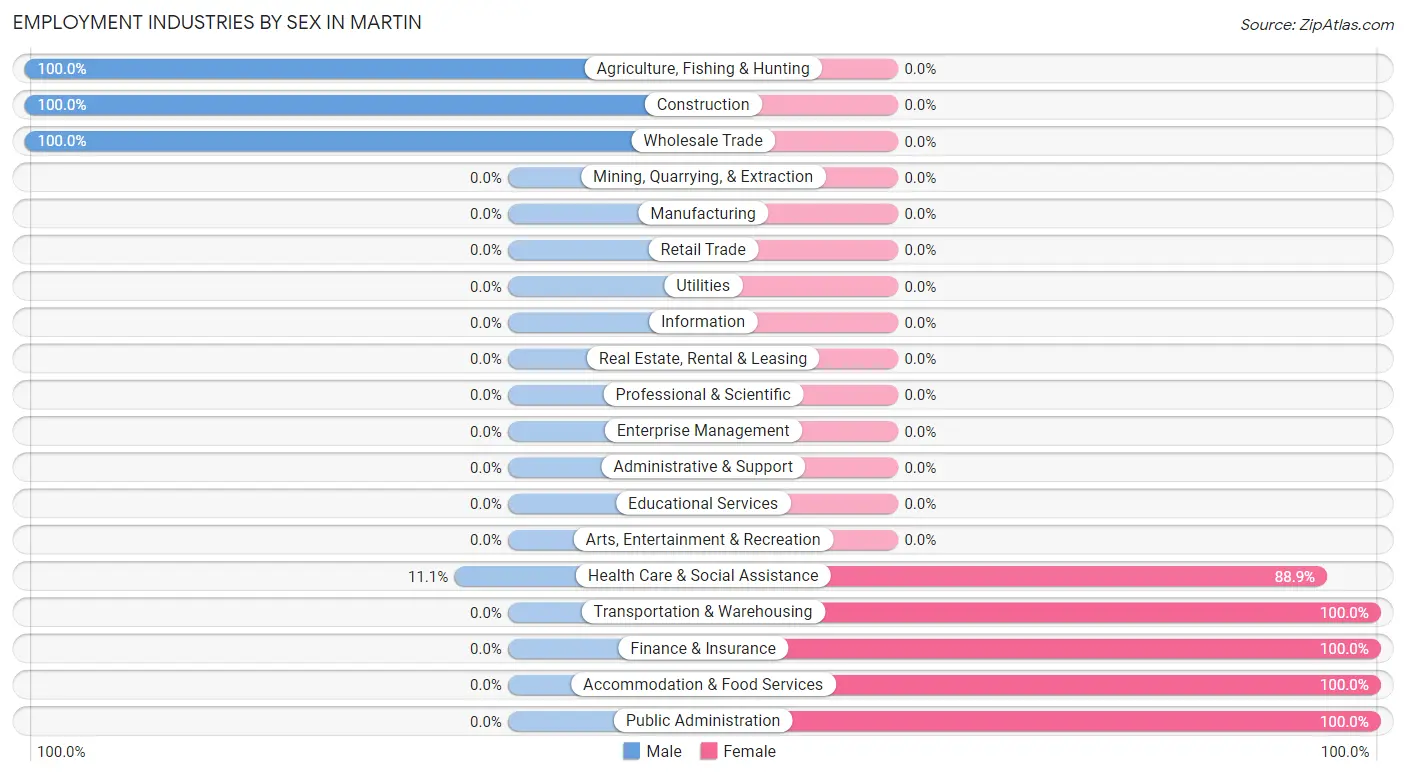
Employment Industries by Sex in Martin
The Martin industries that see more men than women are Agriculture, Fishing & Hunting (100.0%), Construction (100.0%), and Wholesale Trade (100.0%), whereas the industries that tend to have a higher number of women are Transportation & Warehousing (100.0%), Finance & Insurance (100.0%), and Accommodation & Food Services (100.0%).
| Industry | Male | Female |
| Agriculture, Fishing & Hunting | 1 (100.0%) | 0 (0.0%) |
| Mining, Quarrying, & Extraction | 0 (0.0%) | 0 (0.0%) |
| Construction | 14 (100.0%) | 0 (0.0%) |
| Manufacturing | 0 (0.0%) | 0 (0.0%) |
| Wholesale Trade | 1 (100.0%) | 0 (0.0%) |
| Retail Trade | 0 (0.0%) | 0 (0.0%) |
| Transportation & Warehousing | 0 (0.0%) | 2 (100.0%) |
| Utilities | 0 (0.0%) | 0 (0.0%) |
| Information | 0 (0.0%) | 0 (0.0%) |
| Finance & Insurance | 0 (0.0%) | 8 (100.0%) |
| Real Estate, Rental & Leasing | 0 (0.0%) | 0 (0.0%) |
| Professional & Scientific | 0 (0.0%) | 0 (0.0%) |
| Enterprise Management | 0 (0.0%) | 0 (0.0%) |
| Administrative & Support | 0 (0.0%) | 0 (0.0%) |
| Educational Services | 0 (0.0%) | 0 (0.0%) |
| Health Care & Social Assistance | 1 (11.1%) | 8 (88.9%) |
| Arts, Entertainment & Recreation | 0 (0.0%) | 0 (0.0%) |
| Accommodation & Food Services | 0 (0.0%) | 1 (100.0%) |
| Public Administration | 0 (0.0%) | 2 (100.0%) |
| Total | 17 (42.5%) | 23 (57.5%) |
Education in Martin
School Enrollment in Martin
The most common levels of schooling among the 3 students in Martin are college / undergraduate (2 | 66.7%), and high school (1 | 33.3%).
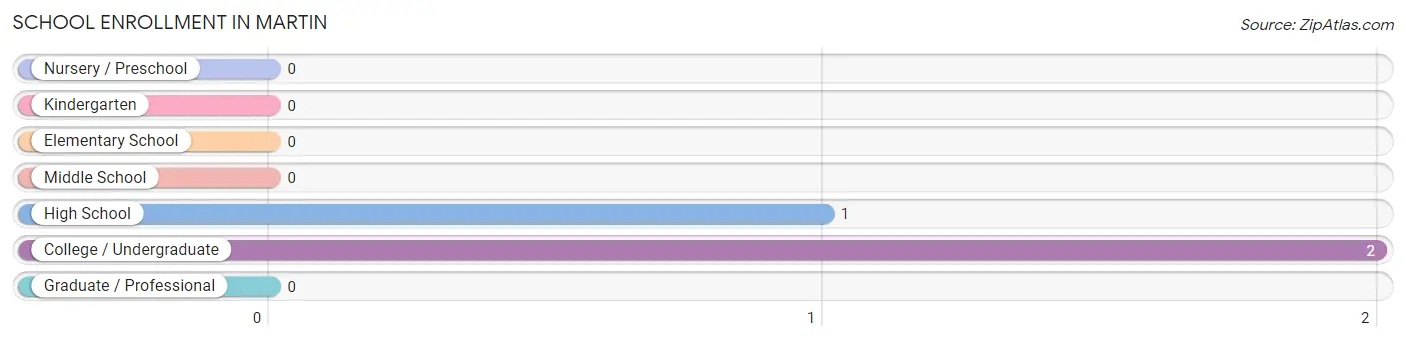
| School Level | # Students | % Students |
| Nursery / Preschool | 0 | 0.0% |
| Kindergarten | 0 | 0.0% |
| Elementary School | 0 | 0.0% |
| Middle School | 0 | 0.0% |
| High School | 1 | 33.3% |
| College / Undergraduate | 2 | 66.7% |
| Graduate / Professional | 0 | 0.0% |
| Total | 3 | 100.0% |
School Enrollment by Age by Funding Source in Martin
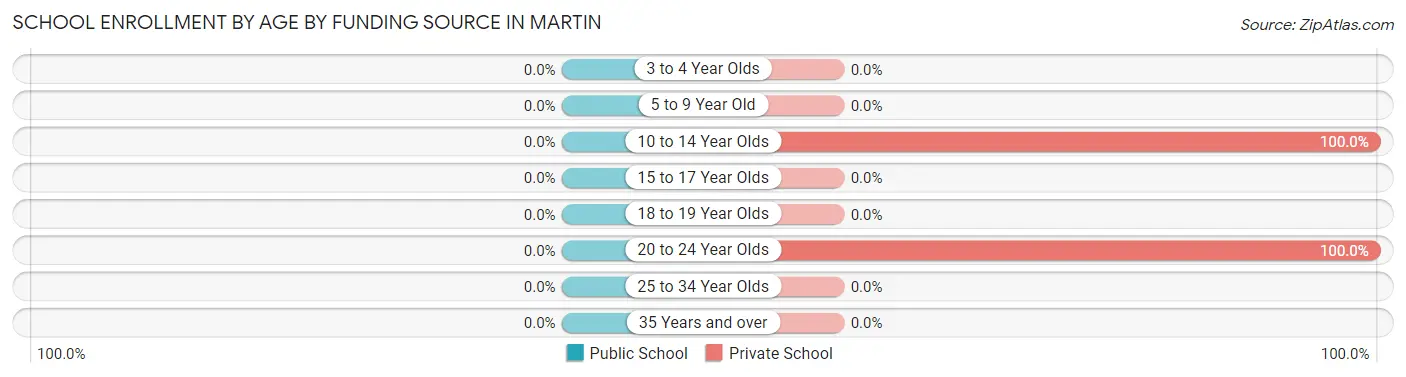
| Age Bracket | Public School | Private School |
| 3 to 4 Year Olds | 0 (0.0%) | 0 (0.0%) |
| 5 to 9 Year Old | 0 (0.0%) | 0 (0.0%) |
| 10 to 14 Year Olds | 0 (0.0%) | 1 (100.0%) |
| 15 to 17 Year Olds | 0 (0.0%) | 0 (0.0%) |
| 18 to 19 Year Olds | 0 (0.0%) | 0 (0.0%) |
| 20 to 24 Year Olds | 0 (0.0%) | 2 (100.0%) |
| 25 to 34 Year Olds | 0 (0.0%) | 0 (0.0%) |
| 35 Years and over | 0 (0.0%) | 0 (0.0%) |
| Total | 0 (0.0%) | 3 (100.0%) |
Educational Attainment by Field of Study in Martin
Business (2 | 33.3%), science & technology (1 | 16.7%), education (1 | 16.7%), literature & languages (1 | 16.7%), and arts & humanities (1 | 16.7%) are the most common fields of study among 6 individuals in Martin who have obtained a bachelor's degree or higher.
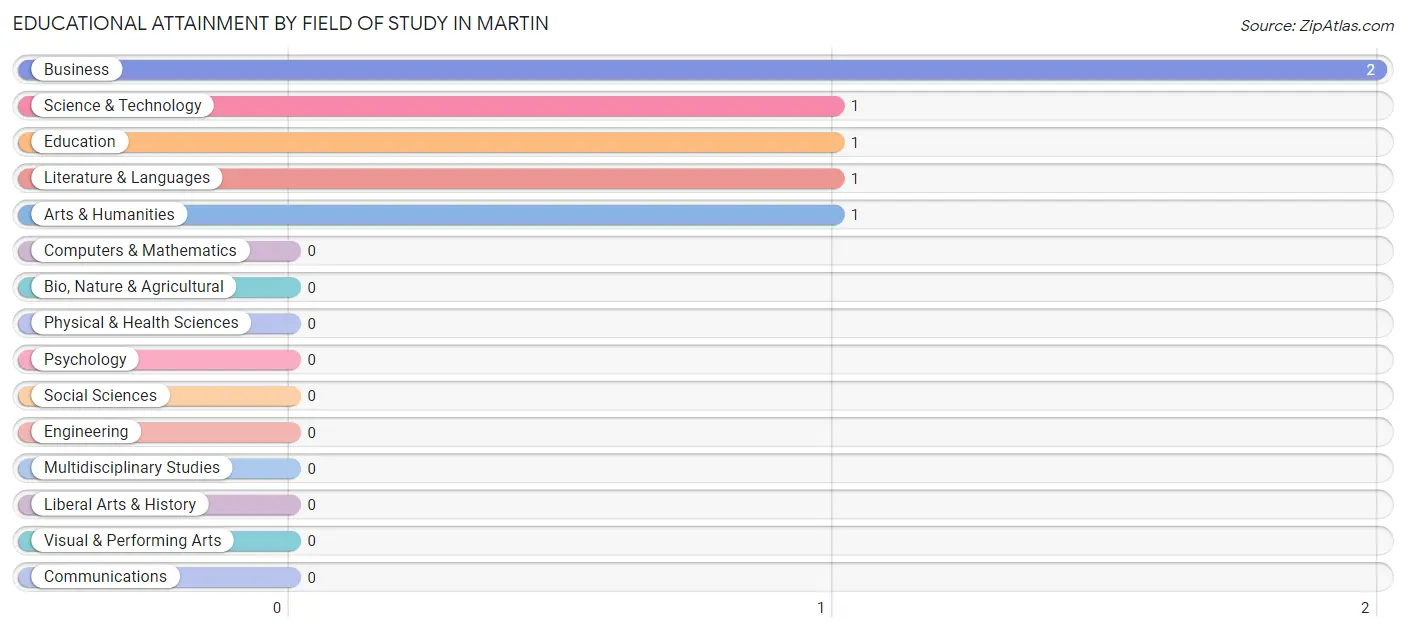
| Field of Study | # Graduates | % Graduates |
| Computers & Mathematics | 0 | 0.0% |
| Bio, Nature & Agricultural | 0 | 0.0% |
| Physical & Health Sciences | 0 | 0.0% |
| Psychology | 0 | 0.0% |
| Social Sciences | 0 | 0.0% |
| Engineering | 0 | 0.0% |
| Multidisciplinary Studies | 0 | 0.0% |
| Science & Technology | 1 | 16.7% |
| Business | 2 | 33.3% |
| Education | 1 | 16.7% |
| Literature & Languages | 1 | 16.7% |
| Liberal Arts & History | 0 | 0.0% |
| Visual & Performing Arts | 0 | 0.0% |
| Communications | 0 | 0.0% |
| Arts & Humanities | 1 | 16.7% |
| Total | 6 | 100.0% |
Transportation & Commute in Martin
Vehicle Availability by Sex in Martin
The most prevalent vehicle ownership categories in Martin are males with 4 vehicles (11, accounting for 64.7%) and females with 4 vehicles (9, making up 47.8%).
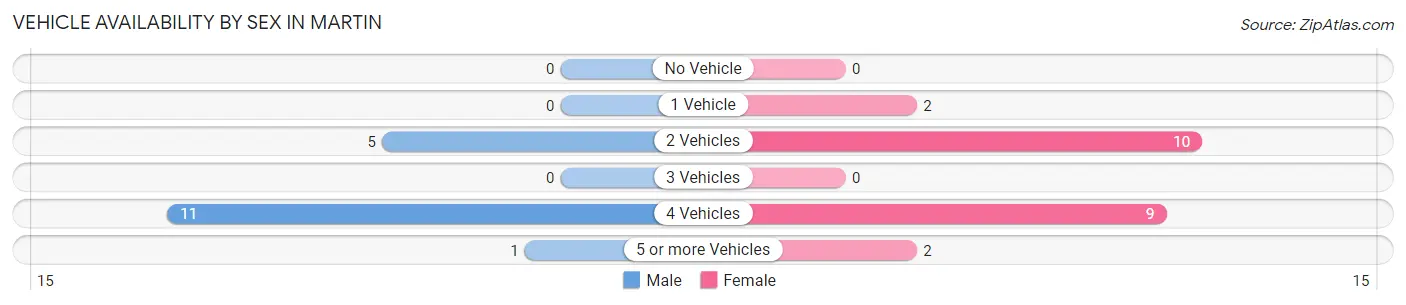
| Vehicles Available | Male | Female |
| No Vehicle | 0 (0.0%) | 0 (0.0%) |
| 1 Vehicle | 0 (0.0%) | 2 (8.7%) |
| 2 Vehicles | 5 (29.4%) | 10 (43.5%) |
| 3 Vehicles | 0 (0.0%) | 0 (0.0%) |
| 4 Vehicles | 11 (64.7%) | 9 (39.1%) |
| 5 or more Vehicles | 1 (5.9%) | 2 (8.7%) |
| Total | 17 (100.0%) | 23 (100.0%) |
Commute Time in Martin
The most frequently occuring commute durations in Martin are 15 to 19 minutes (14 commuters, 36.8%), 20 to 24 minutes (10 commuters, 26.3%), and 5 to 9 minutes (5 commuters, 13.2%).
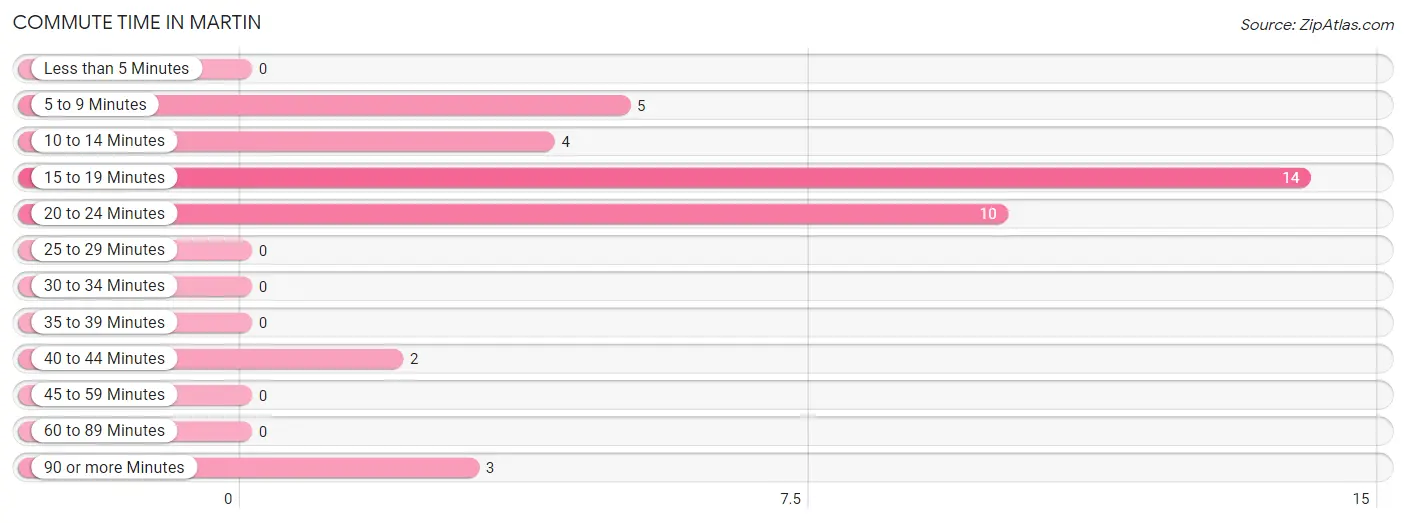
| Commute Time | # Commuters | % Commuters |
| Less than 5 Minutes | 0 | 0.0% |
| 5 to 9 Minutes | 5 | 13.2% |
| 10 to 14 Minutes | 4 | 10.5% |
| 15 to 19 Minutes | 14 | 36.8% |
| 20 to 24 Minutes | 10 | 26.3% |
| 25 to 29 Minutes | 0 | 0.0% |
| 30 to 34 Minutes | 0 | 0.0% |
| 35 to 39 Minutes | 0 | 0.0% |
| 40 to 44 Minutes | 2 | 5.3% |
| 45 to 59 Minutes | 0 | 0.0% |
| 60 to 89 Minutes | 0 | 0.0% |
| 90 or more Minutes | 3 | 7.9% |
Commute Time by Sex in Martin
The most common commute times in Martin are 15 to 19 minutes (10 commuters, 58.8%) for males and 20 to 24 minutes (10 commuters, 47.6%) for females.
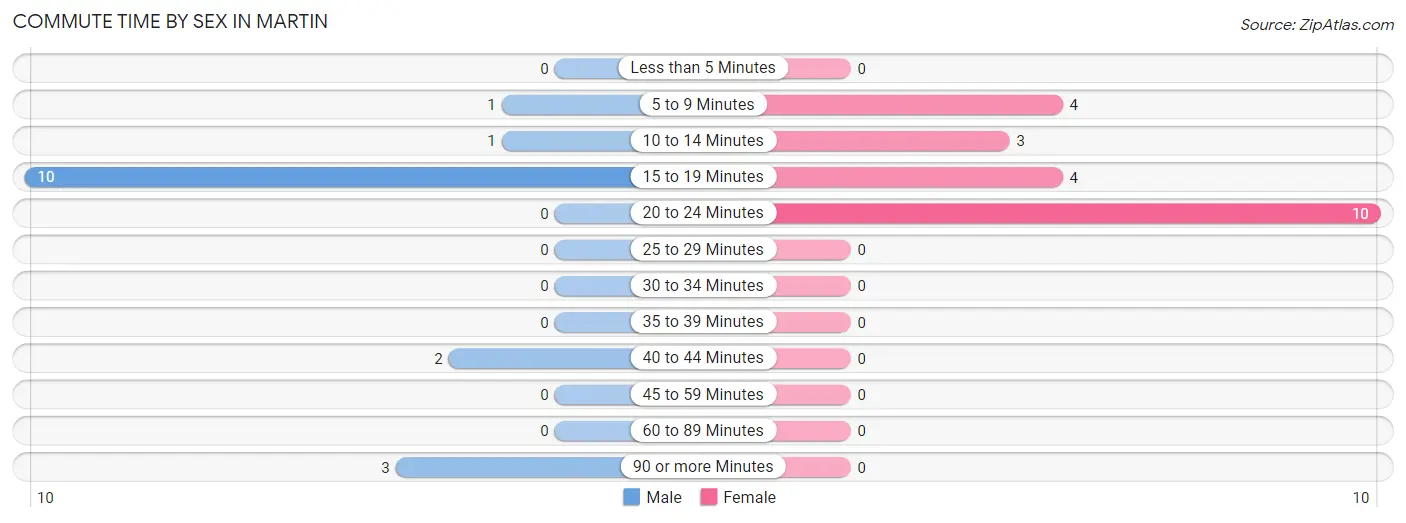
| Commute Time | Male | Female |
| Less than 5 Minutes | 0 (0.0%) | 0 (0.0%) |
| 5 to 9 Minutes | 1 (5.9%) | 4 (19.1%) |
| 10 to 14 Minutes | 1 (5.9%) | 3 (14.3%) |
| 15 to 19 Minutes | 10 (58.8%) | 4 (19.1%) |
| 20 to 24 Minutes | 0 (0.0%) | 10 (47.6%) |
| 25 to 29 Minutes | 0 (0.0%) | 0 (0.0%) |
| 30 to 34 Minutes | 0 (0.0%) | 0 (0.0%) |
| 35 to 39 Minutes | 0 (0.0%) | 0 (0.0%) |
| 40 to 44 Minutes | 2 (11.8%) | 0 (0.0%) |
| 45 to 59 Minutes | 0 (0.0%) | 0 (0.0%) |
| 60 to 89 Minutes | 0 (0.0%) | 0 (0.0%) |
| 90 or more Minutes | 3 (17.6%) | 0 (0.0%) |
Time of Departure to Work by Sex in Martin
The most frequent times of departure to work in Martin are 8:00 AM to 8:29 AM (9, 52.9%) for males and 9:00 AM to 9:59 AM (11, 52.4%) for females.
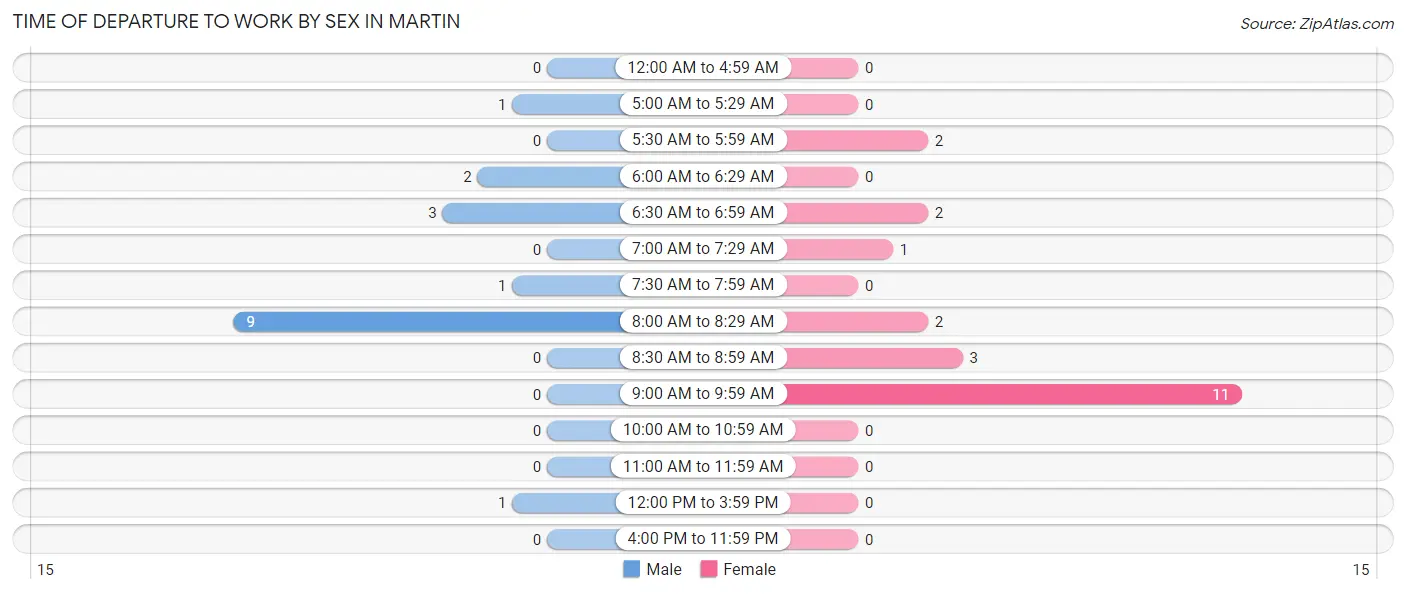
| Time of Departure | Male | Female |
| 12:00 AM to 4:59 AM | 0 (0.0%) | 0 (0.0%) |
| 5:00 AM to 5:29 AM | 1 (5.9%) | 0 (0.0%) |
| 5:30 AM to 5:59 AM | 0 (0.0%) | 2 (9.5%) |
| 6:00 AM to 6:29 AM | 2 (11.8%) | 0 (0.0%) |
| 6:30 AM to 6:59 AM | 3 (17.6%) | 2 (9.5%) |
| 7:00 AM to 7:29 AM | 0 (0.0%) | 1 (4.8%) |
| 7:30 AM to 7:59 AM | 1 (5.9%) | 0 (0.0%) |
| 8:00 AM to 8:29 AM | 9 (52.9%) | 2 (9.5%) |
| 8:30 AM to 8:59 AM | 0 (0.0%) | 3 (14.3%) |
| 9:00 AM to 9:59 AM | 0 (0.0%) | 11 (52.4%) |
| 10:00 AM to 10:59 AM | 0 (0.0%) | 0 (0.0%) |
| 11:00 AM to 11:59 AM | 0 (0.0%) | 0 (0.0%) |
| 12:00 PM to 3:59 PM | 1 (5.9%) | 0 (0.0%) |
| 4:00 PM to 11:59 PM | 0 (0.0%) | 0 (0.0%) |
| Total | 17 (100.0%) | 21 (100.0%) |
Housing Occupancy in Martin
Occupancy by Ownership in Martin
Of the total 35 dwellings in Martin, owner-occupied units account for 33 (94.3%), while renter-occupied units make up 2 (5.7%).
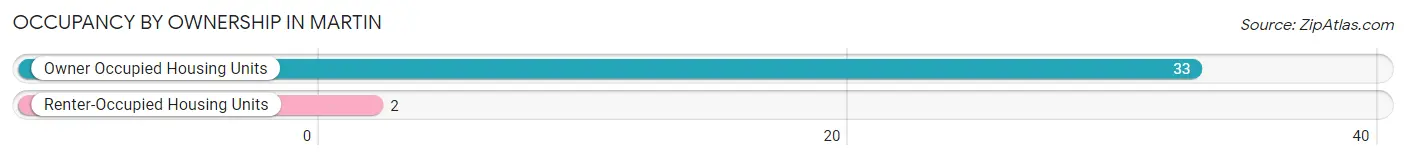
| Occupancy | # Housing Units | % Housing Units |
| Owner Occupied Housing Units | 33 | 94.3% |
| Renter-Occupied Housing Units | 2 | 5.7% |
| Total Occupied Housing Units | 35 | 100.0% |
Occupancy by Household Size in Martin
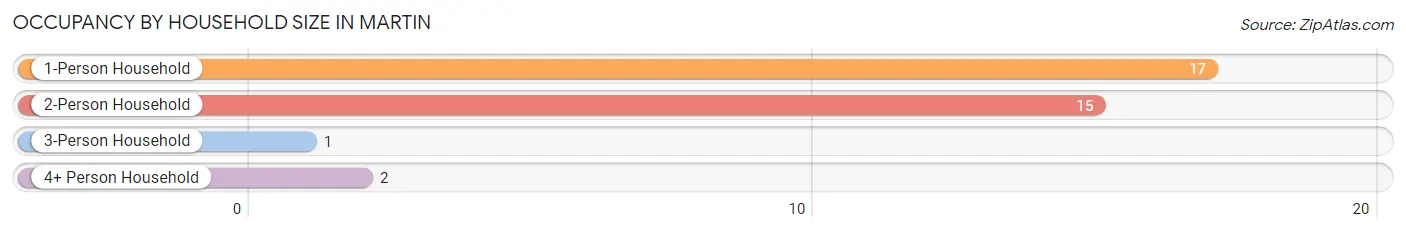
| Household Size | # Housing Units | % Housing Units |
| 1-Person Household | 17 | 48.6% |
| 2-Person Household | 15 | 42.9% |
| 3-Person Household | 1 | 2.9% |
| 4+ Person Household | 2 | 5.7% |
| Total Housing Units | 35 | 100.0% |
Occupancy by Ownership by Household Size in Martin
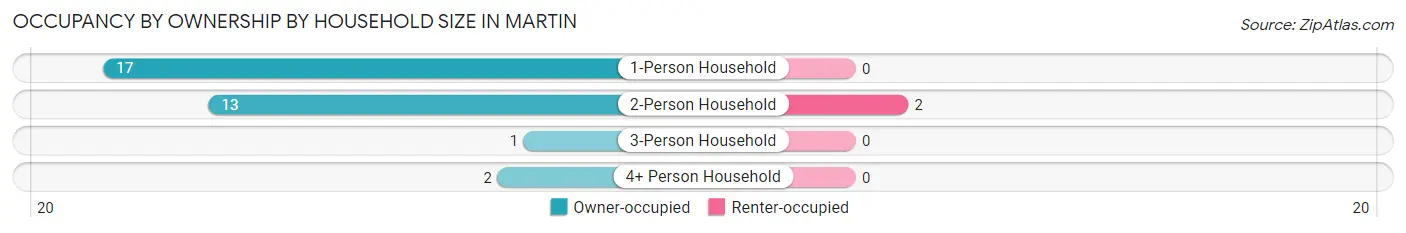
| Household Size | Owner-occupied | Renter-occupied |
| 1-Person Household | 17 (100.0%) | 0 (0.0%) |
| 2-Person Household | 13 (86.7%) | 2 (13.3%) |
| 3-Person Household | 1 (100.0%) | 0 (0.0%) |
| 4+ Person Household | 2 (100.0%) | 0 (0.0%) |
| Total Housing Units | 33 (94.3%) | 2 (5.7%) |
Occupancy by Educational Attainment in Martin
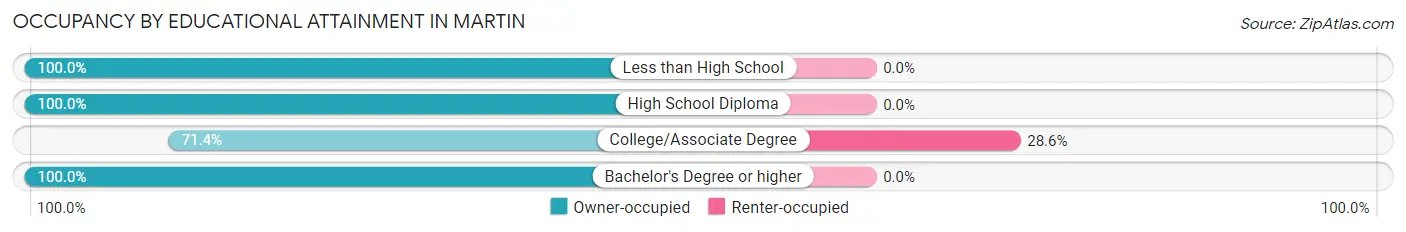
| Household Size | Owner-occupied | Renter-occupied |
| Less than High School | 10 (100.0%) | 0 (0.0%) |
| High School Diploma | 12 (100.0%) | 0 (0.0%) |
| College/Associate Degree | 5 (71.4%) | 2 (28.6%) |
| Bachelor's Degree or higher | 6 (100.0%) | 0 (0.0%) |
Occupancy by Age of Householder in Martin
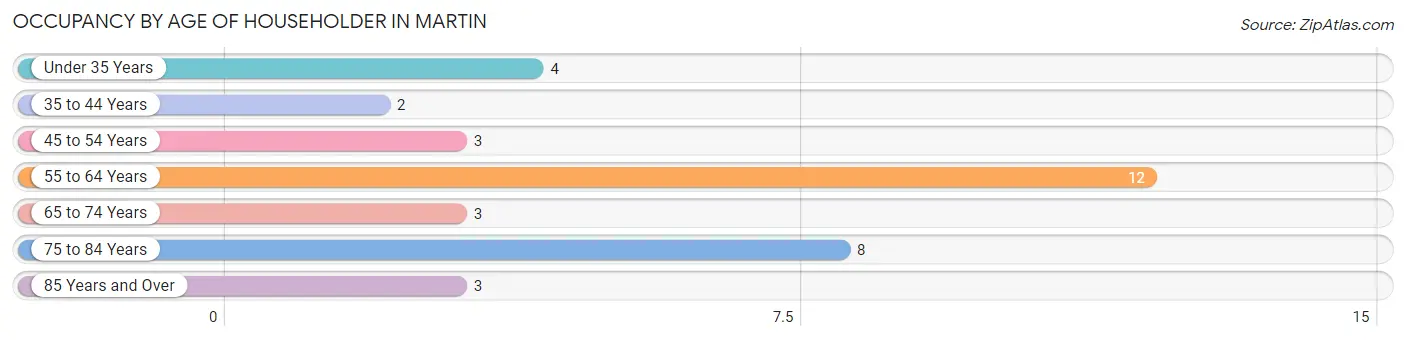
| Age Bracket | # Households | % Households |
| Under 35 Years | 4 | 11.4% |
| 35 to 44 Years | 2 | 5.7% |
| 45 to 54 Years | 3 | 8.6% |
| 55 to 64 Years | 12 | 34.3% |
| 65 to 74 Years | 3 | 8.6% |
| 75 to 84 Years | 8 | 22.9% |
| 85 Years and Over | 3 | 8.6% |
| Total | 35 | 100.0% |
Housing Finances in Martin
Median Income by Occupancy in Martin
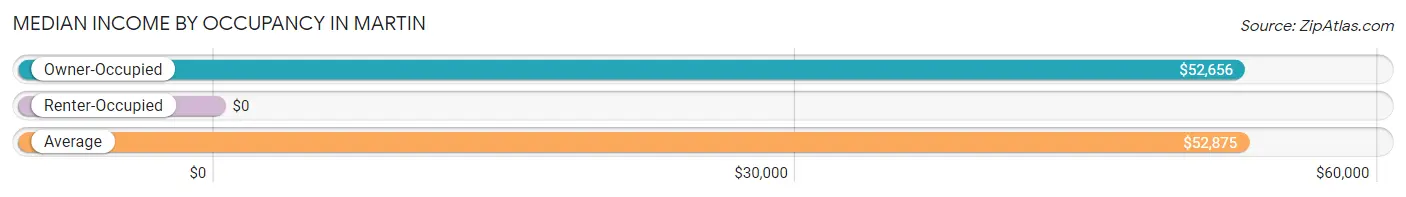
| Occupancy Type | # Households | Median Income |
| Owner-Occupied | 33 (94.3%) | $52,656 |
| Renter-Occupied | 2 (5.7%) | $0 |
| Average | 35 (100.0%) | $52,875 |
Occupancy by Householder Income Bracket in Martin
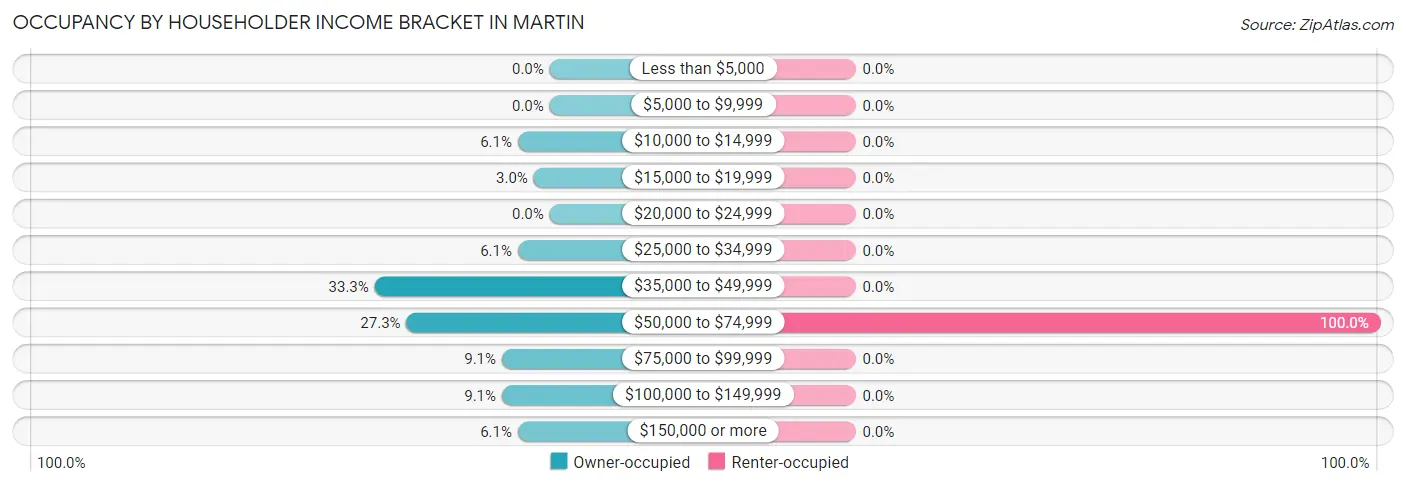
| Income Bracket | Owner-occupied | Renter-occupied |
| Less than $5,000 | 0 (0.0%) | 0 (0.0%) |
| $5,000 to $9,999 | 0 (0.0%) | 0 (0.0%) |
| $10,000 to $14,999 | 2 (6.1%) | 0 (0.0%) |
| $15,000 to $19,999 | 1 (3.0%) | 0 (0.0%) |
| $20,000 to $24,999 | 0 (0.0%) | 0 (0.0%) |
| $25,000 to $34,999 | 2 (6.1%) | 0 (0.0%) |
| $35,000 to $49,999 | 11 (33.3%) | 0 (0.0%) |
| $50,000 to $74,999 | 9 (27.3%) | 2 (100.0%) |
| $75,000 to $99,999 | 3 (9.1%) | 0 (0.0%) |
| $100,000 to $149,999 | 3 (9.1%) | 0 (0.0%) |
| $150,000 or more | 2 (6.1%) | 0 (0.0%) |
| Total | 33 (100.0%) | 2 (100.0%) |
Monthly Housing Cost Tiers in Martin
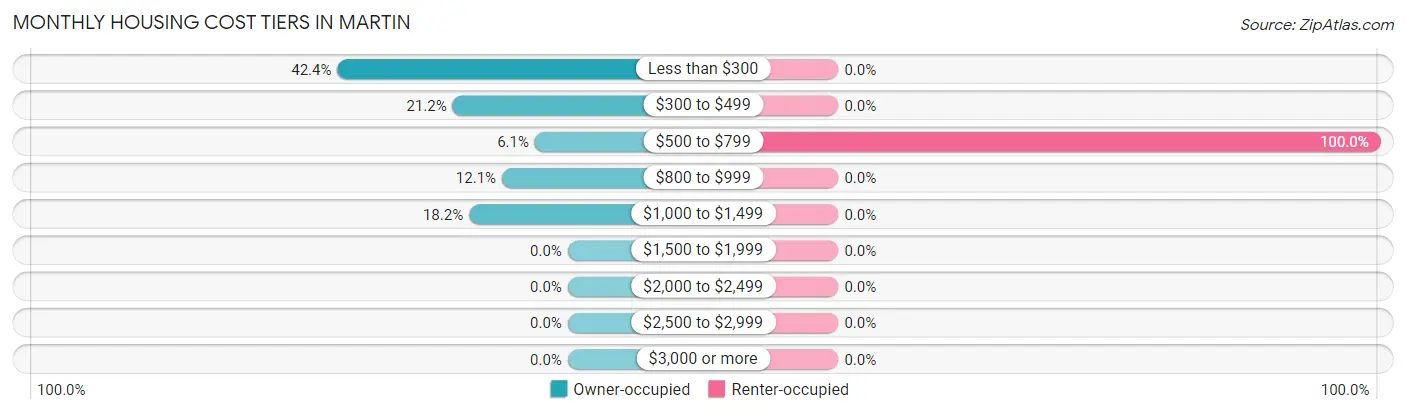
| Monthly Cost | Owner-occupied | Renter-occupied |
| Less than $300 | 14 (42.4%) | 0 (0.0%) |
| $300 to $499 | 7 (21.2%) | 0 (0.0%) |
| $500 to $799 | 2 (6.1%) | 2 (100.0%) |
| $800 to $999 | 4 (12.1%) | 0 (0.0%) |
| $1,000 to $1,499 | 6 (18.2%) | 0 (0.0%) |
| $1,500 to $1,999 | 0 (0.0%) | 0 (0.0%) |
| $2,000 to $2,499 | 0 (0.0%) | 0 (0.0%) |
| $2,500 to $2,999 | 0 (0.0%) | 0 (0.0%) |
| $3,000 or more | 0 (0.0%) | 0 (0.0%) |
| Total | 33 (100.0%) | 2 (100.0%) |
Physical Housing Characteristics in Martin
Housing Structures in Martin
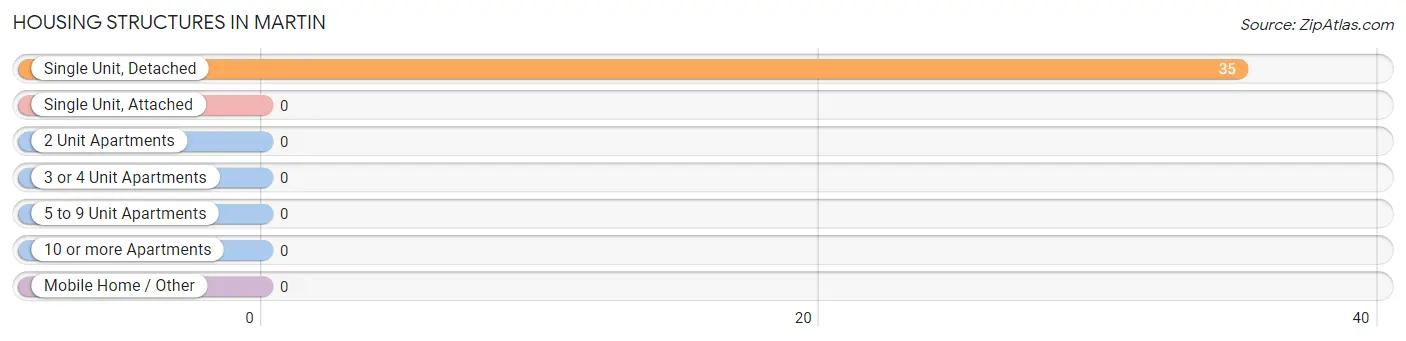
| Structure Type | # Housing Units | % Housing Units |
| Single Unit, Detached | 35 | 100.0% |
| Single Unit, Attached | 0 | 0.0% |
| 2 Unit Apartments | 0 | 0.0% |
| 3 or 4 Unit Apartments | 0 | 0.0% |
| 5 to 9 Unit Apartments | 0 | 0.0% |
| 10 or more Apartments | 0 | 0.0% |
| Mobile Home / Other | 0 | 0.0% |
| Total | 35 | 100.0% |
Housing Structures by Occupancy in Martin
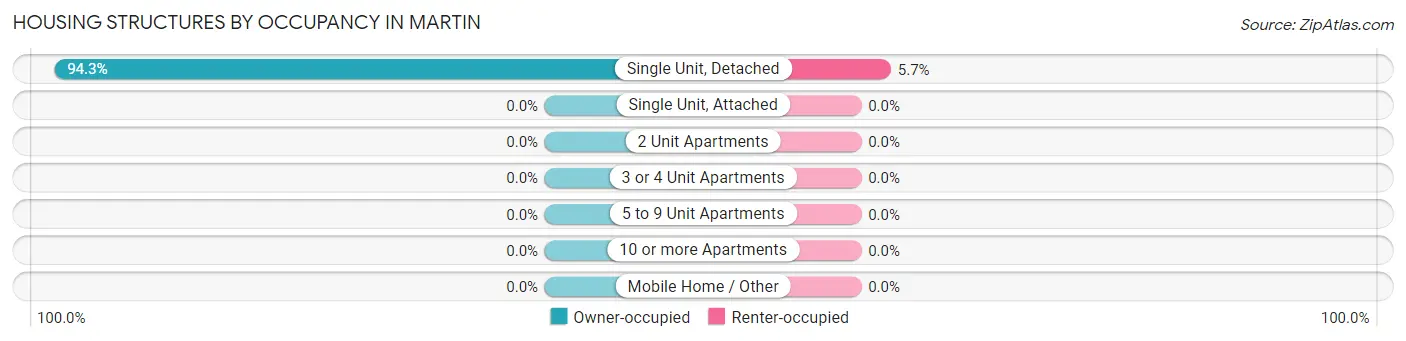
| Structure Type | Owner-occupied | Renter-occupied |
| Single Unit, Detached | 33 (94.3%) | 2 (5.7%) |
| Single Unit, Attached | 0 (0.0%) | 0 (0.0%) |
| 2 Unit Apartments | 0 (0.0%) | 0 (0.0%) |
| 3 or 4 Unit Apartments | 0 (0.0%) | 0 (0.0%) |
| 5 to 9 Unit Apartments | 0 (0.0%) | 0 (0.0%) |
| 10 or more Apartments | 0 (0.0%) | 0 (0.0%) |
| Mobile Home / Other | 0 (0.0%) | 0 (0.0%) |
| Total | 33 (94.3%) | 2 (5.7%) |
Housing Structures by Number of Rooms in Martin
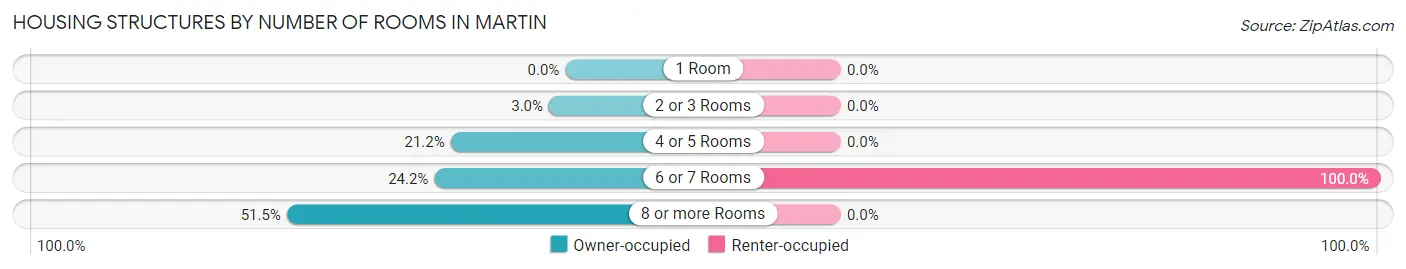
| Number of Rooms | Owner-occupied | Renter-occupied |
| 1 Room | 0 (0.0%) | 0 (0.0%) |
| 2 or 3 Rooms | 1 (3.0%) | 0 (0.0%) |
| 4 or 5 Rooms | 7 (21.2%) | 0 (0.0%) |
| 6 or 7 Rooms | 8 (24.2%) | 2 (100.0%) |
| 8 or more Rooms | 17 (51.5%) | 0 (0.0%) |
| Total | 33 (100.0%) | 2 (100.0%) |
Housing Structure by Heating Type in Martin
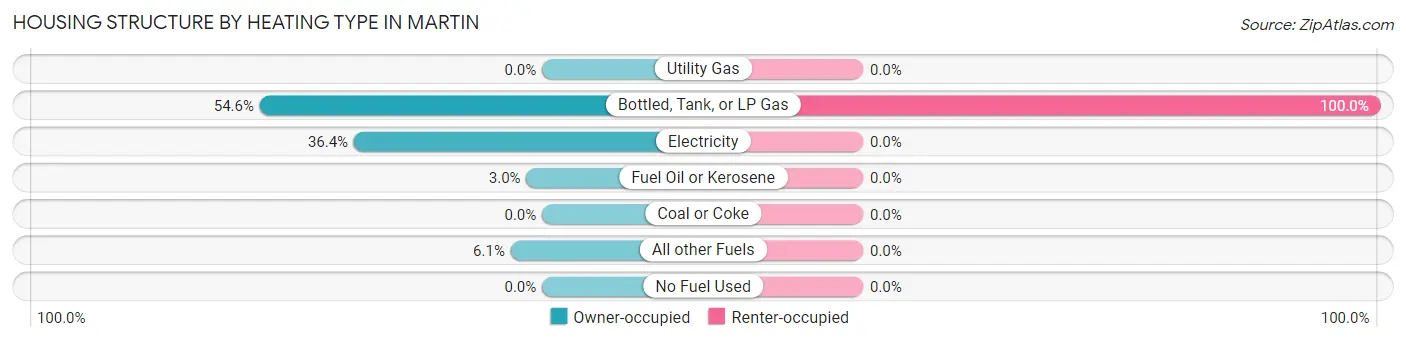
| Heating Type | Owner-occupied | Renter-occupied |
| Utility Gas | 0 (0.0%) | 0 (0.0%) |
| Bottled, Tank, or LP Gas | 18 (54.5%) | 2 (100.0%) |
| Electricity | 12 (36.4%) | 0 (0.0%) |
| Fuel Oil or Kerosene | 1 (3.0%) | 0 (0.0%) |
| Coal or Coke | 0 (0.0%) | 0 (0.0%) |
| All other Fuels | 2 (6.1%) | 0 (0.0%) |
| No Fuel Used | 0 (0.0%) | 0 (0.0%) |
| Total | 33 (100.0%) | 2 (100.0%) |
Household Vehicle Usage in Martin
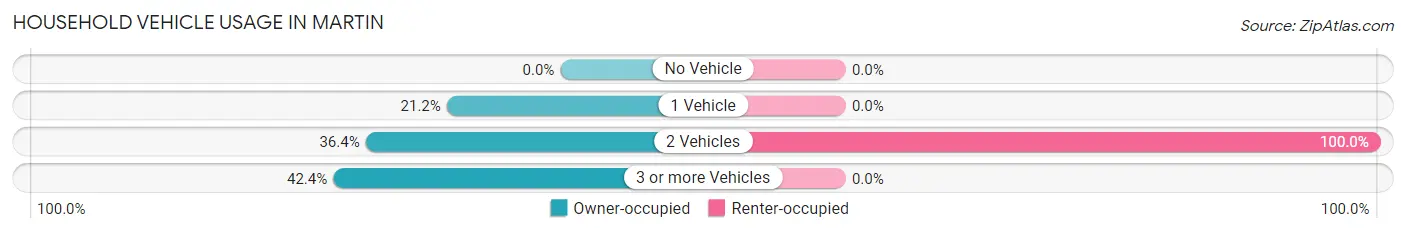
| Vehicles per Household | Owner-occupied | Renter-occupied |
| No Vehicle | 0 (0.0%) | 0 (0.0%) |
| 1 Vehicle | 7 (21.2%) | 0 (0.0%) |
| 2 Vehicles | 12 (36.4%) | 2 (100.0%) |
| 3 or more Vehicles | 14 (42.4%) | 0 (0.0%) |
| Total | 33 (100.0%) | 2 (100.0%) |
Real Estate & Mortgages in Martin
Real Estate and Mortgage Overview in Martin
| Characteristic | Without Mortgage | With Mortgage |
| Housing Units | 21 | 12 |
| Median Property Value | $77,500 | $85,000 |
| Median Household Income | $53,281 | $0 |
| Monthly Housing Costs | $287 | $0 |
| Real Estate Taxes | $450 | $2 |
Property Value by Mortgage Status in Martin
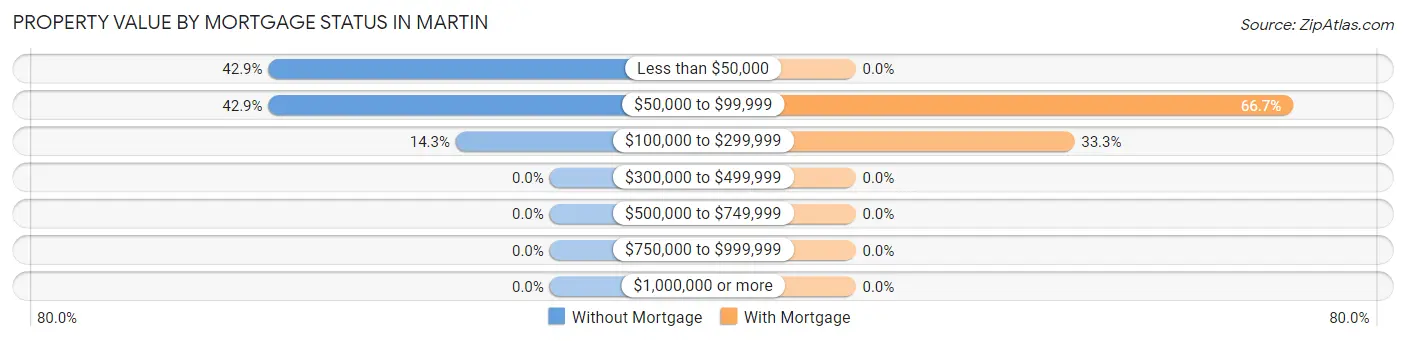
| Property Value | Without Mortgage | With Mortgage |
| Less than $50,000 | 9 (42.9%) | 0 (0.0%) |
| $50,000 to $99,999 | 9 (42.9%) | 8 (66.7%) |
| $100,000 to $299,999 | 3 (14.3%) | 4 (33.3%) |
| $300,000 to $499,999 | 0 (0.0%) | 0 (0.0%) |
| $500,000 to $749,999 | 0 (0.0%) | 0 (0.0%) |
| $750,000 to $999,999 | 0 (0.0%) | 0 (0.0%) |
| $1,000,000 or more | 0 (0.0%) | 0 (0.0%) |
| Total | 21 (100.0%) | 12 (100.0%) |
Household Income by Mortgage Status in Martin
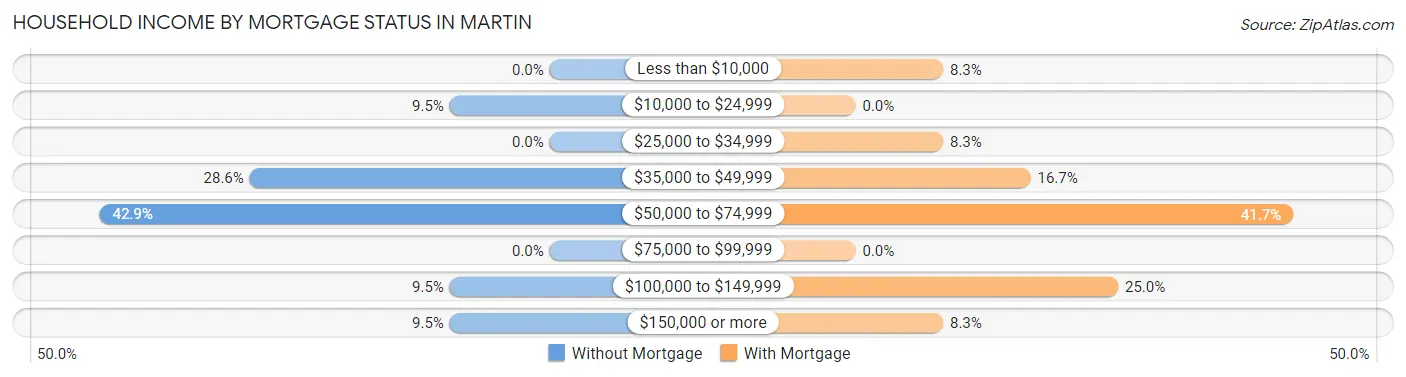
| Household Income | Without Mortgage | With Mortgage |
| Less than $10,000 | 0 (0.0%) | 1 (8.3%) |
| $10,000 to $24,999 | 2 (9.5%) | 0 (0.0%) |
| $25,000 to $34,999 | 0 (0.0%) | 1 (8.3%) |
| $35,000 to $49,999 | 6 (28.6%) | 2 (16.7%) |
| $50,000 to $74,999 | 9 (42.9%) | 5 (41.7%) |
| $75,000 to $99,999 | 0 (0.0%) | 0 (0.0%) |
| $100,000 to $149,999 | 2 (9.5%) | 3 (25.0%) |
| $150,000 or more | 2 (9.5%) | 1 (8.3%) |
| Total | 21 (100.0%) | 12 (100.0%) |
Property Value to Household Income Ratio in Martin
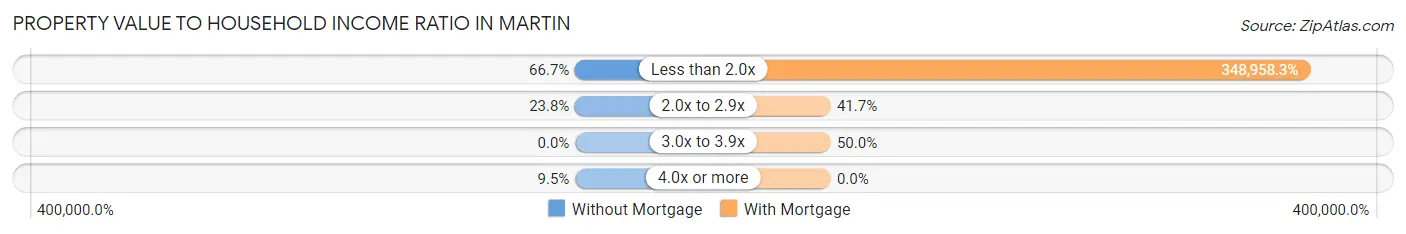
| Value-to-Income Ratio | Without Mortgage | With Mortgage |
| Less than 2.0x | 14 (66.7%) | 41,875 (348,958.3%) |
| 2.0x to 2.9x | 5 (23.8%) | 5 (41.7%) |
| 3.0x to 3.9x | 0 (0.0%) | 6 (50.0%) |
| 4.0x or more | 2 (9.5%) | 0 (0.0%) |
| Total | 21 (100.0%) | 12 (100.0%) |
Real Estate Taxes by Mortgage Status in Martin
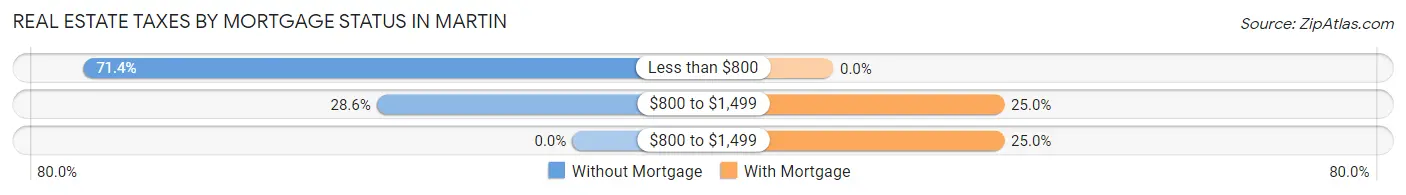
| Property Taxes | Without Mortgage | With Mortgage |
| Less than $800 | 15 (71.4%) | 0 (0.0%) |
| $800 to $1,499 | 6 (28.6%) | 3 (25.0%) |
| $800 to $1,499 | 0 (0.0%) | 3 (25.0%) |
| Total | 21 (100.0%) | 12 (100.0%) |
Health & Disability in Martin
Health Insurance Coverage by Age in Martin
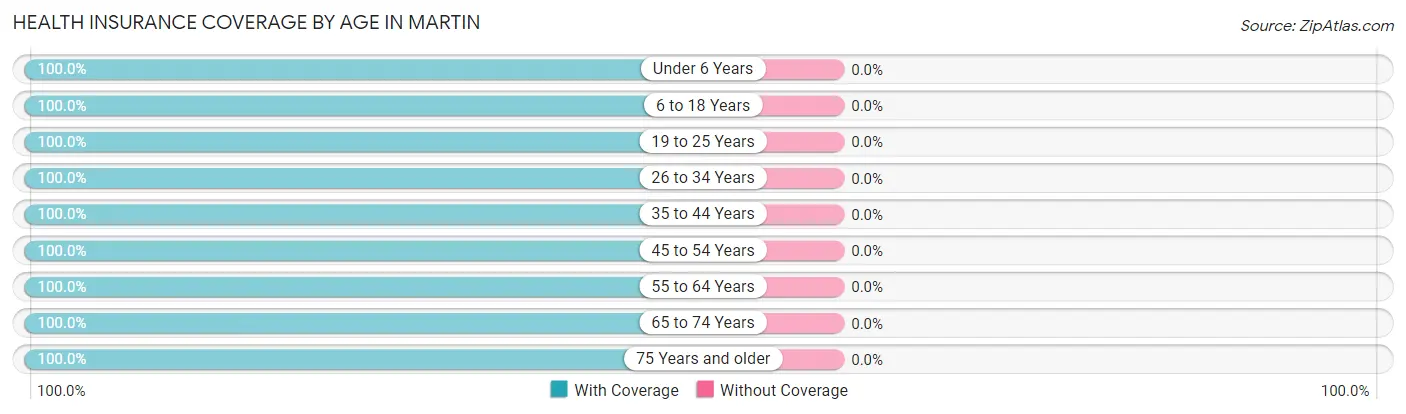
| Age Bracket | With Coverage | Without Coverage |
| Under 6 Years | 2 (100.0%) | 0 (0.0%) |
| 6 to 18 Years | 3 (100.0%) | 0 (0.0%) |
| 19 to 25 Years | 4 (100.0%) | 0 (0.0%) |
| 26 to 34 Years | 3 (100.0%) | 0 (0.0%) |
| 35 to 44 Years | 3 (100.0%) | 0 (0.0%) |
| 45 to 54 Years | 5 (100.0%) | 0 (0.0%) |
| 55 to 64 Years | 23 (100.0%) | 0 (0.0%) |
| 65 to 74 Years | 3 (100.0%) | 0 (0.0%) |
| 75 Years and older | 11 (100.0%) | 0 (0.0%) |
| Total | 57 (100.0%) | 0 (0.0%) |
Health Insurance Coverage by Citizenship Status in Martin
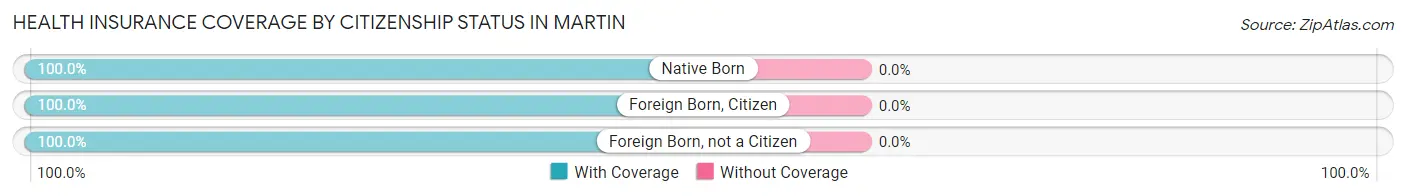
| Citizenship Status | With Coverage | Without Coverage |
| Native Born | 2 (100.0%) | 0 (0.0%) |
| Foreign Born, Citizen | 3 (100.0%) | 0 (0.0%) |
| Foreign Born, not a Citizen | 4 (100.0%) | 0 (0.0%) |
Health Insurance Coverage by Household Income in Martin
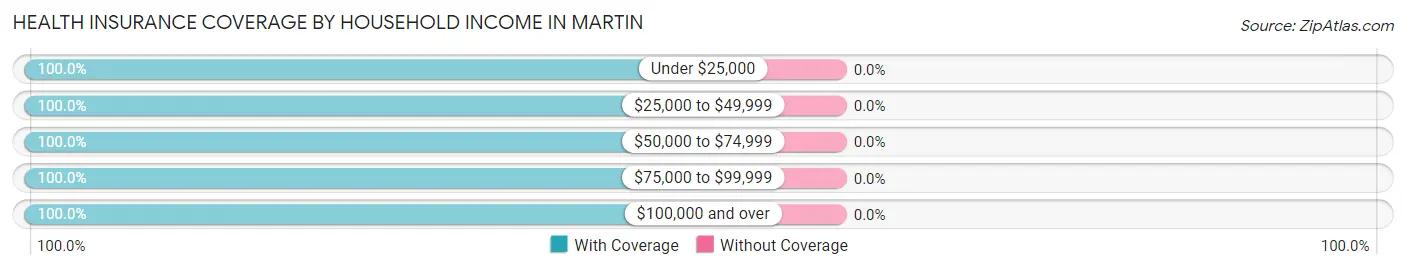
| Household Income | With Coverage | Without Coverage |
| Under $25,000 | 3 (100.0%) | 0 (0.0%) |
| $25,000 to $49,999 | 15 (100.0%) | 0 (0.0%) |
| $50,000 to $74,999 | 22 (100.0%) | 0 (0.0%) |
| $75,000 to $99,999 | 9 (100.0%) | 0 (0.0%) |
| $100,000 and over | 8 (100.0%) | 0 (0.0%) |
Public vs Private Health Insurance Coverage by Age in Martin
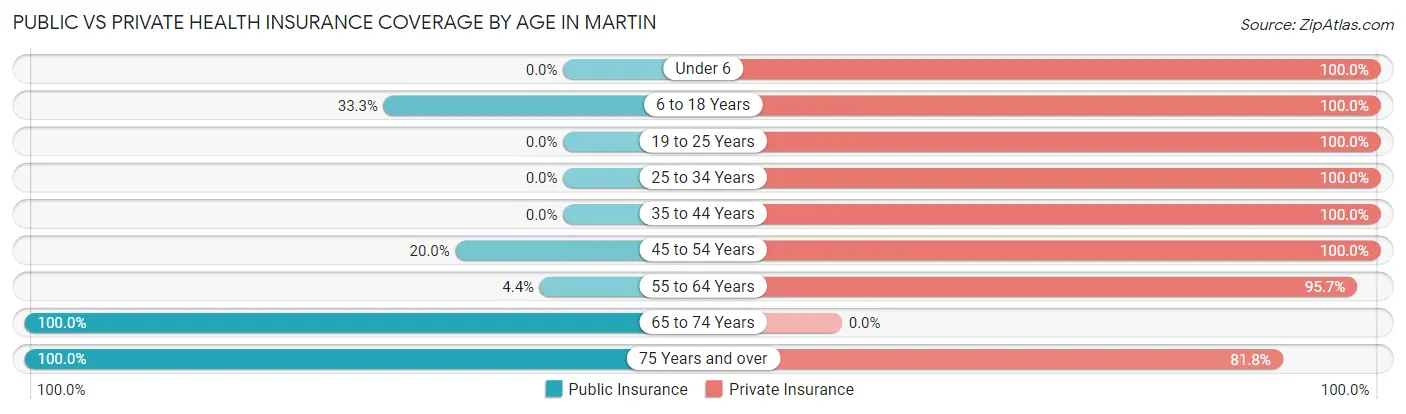
| Age Bracket | Public Insurance | Private Insurance |
| Under 6 | 0 (0.0%) | 2 (100.0%) |
| 6 to 18 Years | 1 (33.3%) | 3 (100.0%) |
| 19 to 25 Years | 0 (0.0%) | 4 (100.0%) |
| 25 to 34 Years | 0 (0.0%) | 3 (100.0%) |
| 35 to 44 Years | 0 (0.0%) | 3 (100.0%) |
| 45 to 54 Years | 1 (20.0%) | 5 (100.0%) |
| 55 to 64 Years | 1 (4.3%) | 22 (95.7%) |
| 65 to 74 Years | 3 (100.0%) | 0 (0.0%) |
| 75 Years and over | 11 (100.0%) | 9 (81.8%) |
| Total | 17 (29.8%) | 51 (89.5%) |
Disability Status by Sex by Age in Martin
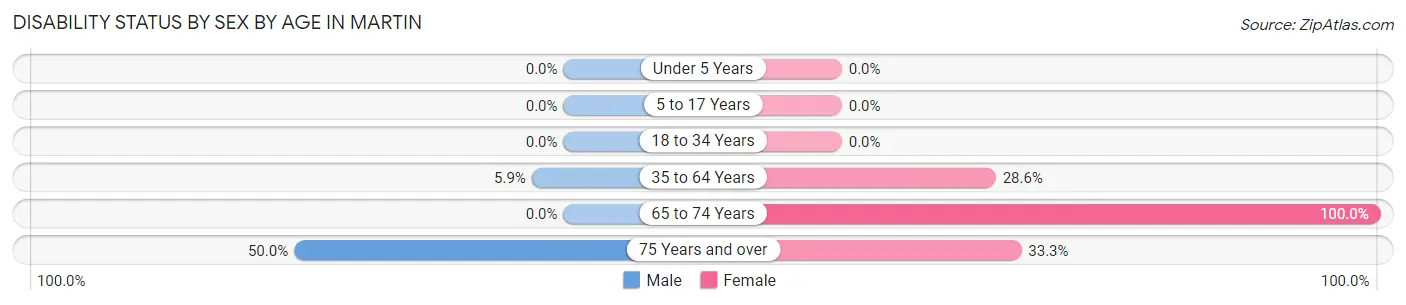
| Age Bracket | Male | Female |
| Under 5 Years | 0 (0.0%) | 0 (0.0%) |
| 5 to 17 Years | 0 (0.0%) | 0 (0.0%) |
| 18 to 34 Years | 0 (0.0%) | 0 (0.0%) |
| 35 to 64 Years | 1 (5.9%) | 4 (28.6%) |
| 65 to 74 Years | 0 (0.0%) | 3 (100.0%) |
| 75 Years and over | 1 (50.0%) | 3 (33.3%) |
Disability Class by Sex by Age in Martin
Disability Class: Hearing Difficulty
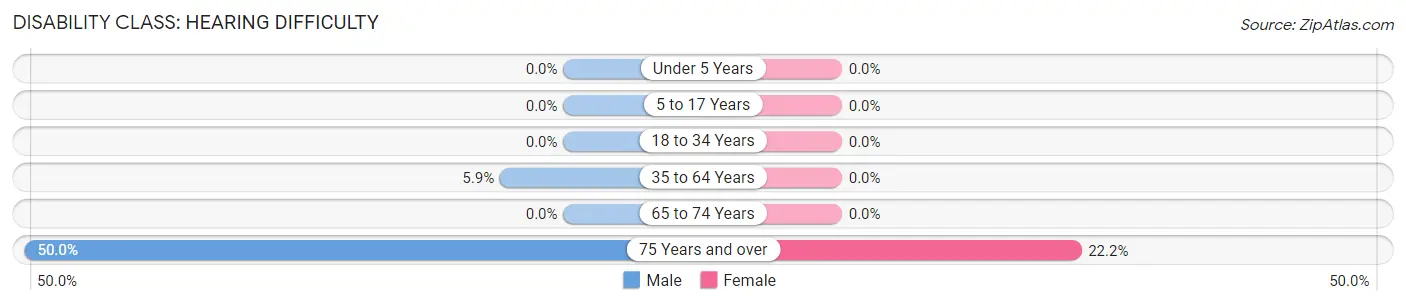
| Age Bracket | Male | Female |
| Under 5 Years | 0 (0.0%) | 0 (0.0%) |
| 5 to 17 Years | 0 (0.0%) | 0 (0.0%) |
| 18 to 34 Years | 0 (0.0%) | 0 (0.0%) |
| 35 to 64 Years | 1 (5.9%) | 0 (0.0%) |
| 65 to 74 Years | 0 (0.0%) | 0 (0.0%) |
| 75 Years and over | 1 (50.0%) | 2 (22.2%) |
Disability Class: Vision Difficulty
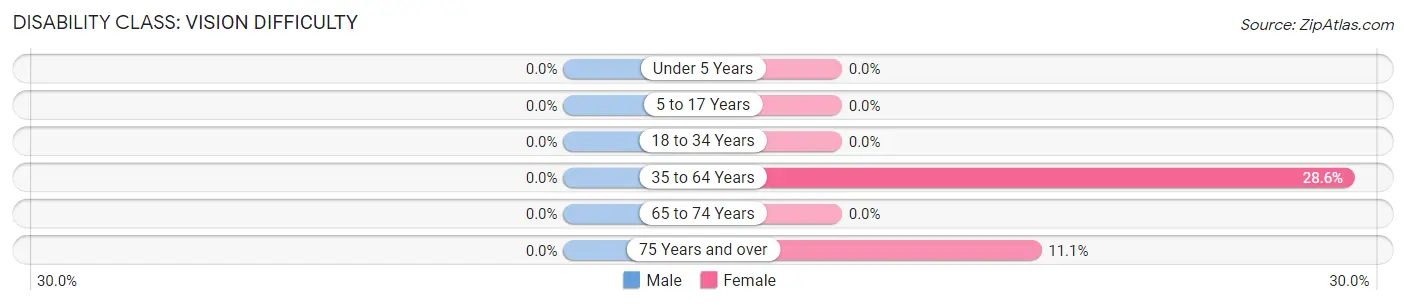
| Age Bracket | Male | Female |
| Under 5 Years | 0 (0.0%) | 0 (0.0%) |
| 5 to 17 Years | 0 (0.0%) | 0 (0.0%) |
| 18 to 34 Years | 0 (0.0%) | 0 (0.0%) |
| 35 to 64 Years | 0 (0.0%) | 4 (28.6%) |
| 65 to 74 Years | 0 (0.0%) | 0 (0.0%) |
| 75 Years and over | 0 (0.0%) | 1 (11.1%) |
Disability Class: Cognitive Difficulty
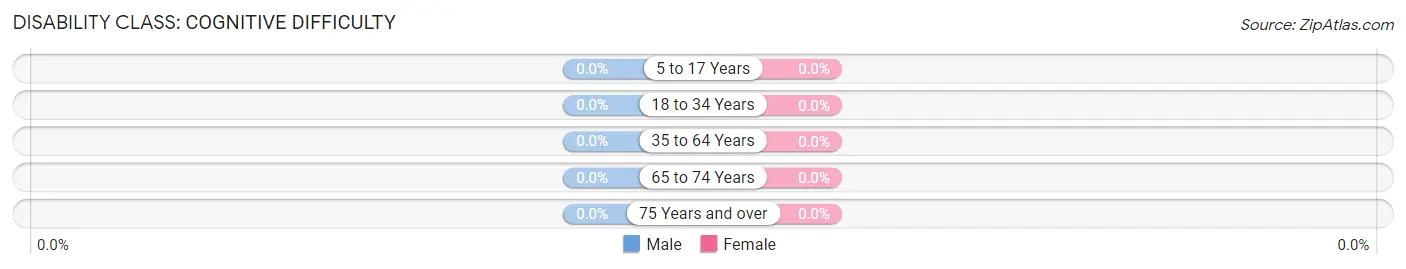
| Age Bracket | Male | Female |
| 5 to 17 Years | 0 (0.0%) | 0 (0.0%) |
| 18 to 34 Years | 0 (0.0%) | 0 (0.0%) |
| 35 to 64 Years | 0 (0.0%) | 0 (0.0%) |
| 65 to 74 Years | 0 (0.0%) | 0 (0.0%) |
| 75 Years and over | 0 (0.0%) | 0 (0.0%) |
Disability Class: Ambulatory Difficulty
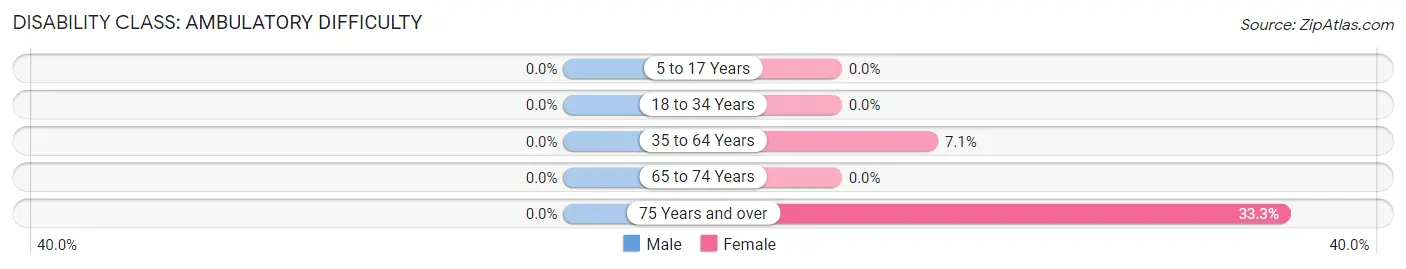
| Age Bracket | Male | Female |
| 5 to 17 Years | 0 (0.0%) | 0 (0.0%) |
| 18 to 34 Years | 0 (0.0%) | 0 (0.0%) |
| 35 to 64 Years | 0 (0.0%) | 1 (7.1%) |
| 65 to 74 Years | 0 (0.0%) | 0 (0.0%) |
| 75 Years and over | 0 (0.0%) | 3 (33.3%) |
Disability Class: Self-Care Difficulty
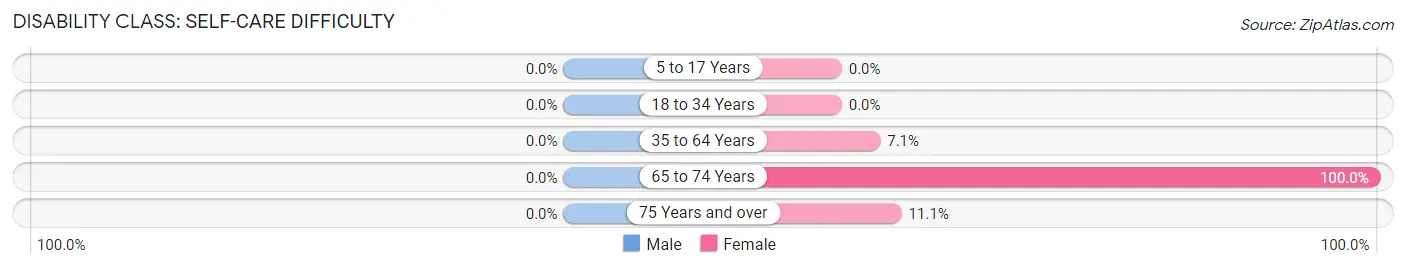
| Age Bracket | Male | Female |
| 5 to 17 Years | 0 (0.0%) | 0 (0.0%) |
| 18 to 34 Years | 0 (0.0%) | 0 (0.0%) |
| 35 to 64 Years | 0 (0.0%) | 1 (7.1%) |
| 65 to 74 Years | 0 (0.0%) | 3 (100.0%) |
| 75 Years and over | 0 (0.0%) | 1 (11.1%) |
Technology Access in Martin
Computing Device Access in Martin
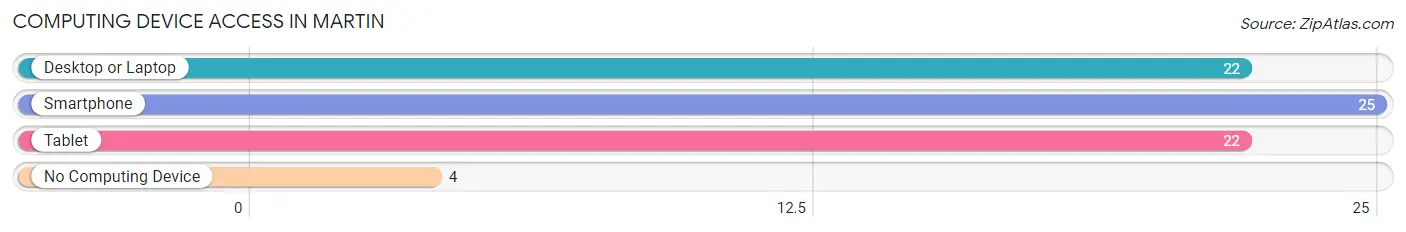
| Device Type | # Households | % Households |
| Desktop or Laptop | 22 | 62.9% |
| Smartphone | 25 | 71.4% |
| Tablet | 22 | 62.9% |
| No Computing Device | 4 | 11.4% |
| Total | 35 | 100.0% |
Internet Access in Martin
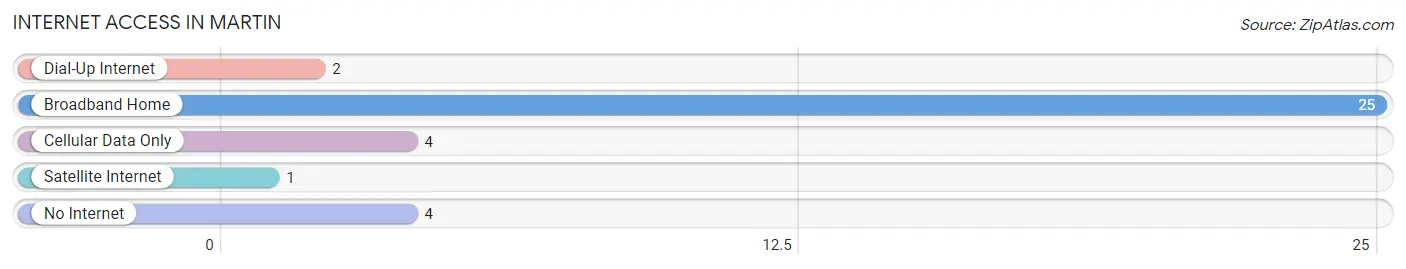
| Internet Type | # Households | % Households |
| Dial-Up Internet | 2 | 5.7% |
| Broadband Home | 25 | 71.4% |
| Cellular Data Only | 4 | 11.4% |
| Satellite Internet | 1 | 2.9% |
| No Internet | 4 | 11.4% |
| Total | 35 | 100.0% |
Martin Summary
The history of North Dakota is a long and varied one, stretching back to the days of the Native Americans who first inhabited the area. The first Europeans to explore the area were French fur traders, who arrived in the late 1700s. The area was then part of the Louisiana Purchase, and was part of the Dakota Territory until 1889, when it became the 39th state in the Union.
Geographically, North Dakota is located in the northern Great Plains region of the United States. It is bordered by Minnesota to the east, South Dakota to the south, Montana to the west, and the Canadian provinces of Saskatchewan and Manitoba to the north. The state is divided into 53 counties, and its capital is Bismarck. The state is home to the Badlands, the Missouri River, and the Red River Valley.
The economy of North Dakota is largely based on agriculture, with wheat, corn, and soybeans being the main crops. Other important industries include oil and gas, tourism, and manufacturing. The state is also home to several military bases, including Minot Air Force Base and Grand Forks Air Force Base.
North Dakota has a population of approximately 762,062 people, according to the 2020 U.S. Census. The population is largely white (90.2%), with Native Americans making up the largest minority group (5.2%). The median household income is $58,906, and the median age is 37.7 years. The state has a low unemployment rate of 2.9%, and the poverty rate is 11.2%.
North Dakota is a largely rural state, with most of its population living in small towns and rural areas. The largest cities are Fargo, Bismarck, Grand Forks, and Minot. The state is home to several universities, including the University of North Dakota, North Dakota State University, and the University of Mary.
North Dakota has a rich cultural heritage, with many Native American tribes having a long history in the area. The state is also home to a variety of festivals and events, including the North Dakota State Fair, the North Dakota Winter Show, and the North Dakota Cowboy Hall of Fame.
North Dakota is a beautiful state, with a variety of landscapes and activities to enjoy. From the Badlands to the Red River Valley, there is something for everyone in North Dakota. With its rich history, diverse population, and strong economy, North Dakota is a great place to live and visit.
Common Questions
What is Per Capita Income in Martin?
Per Capita income in Martin is $36,525.
What is the Median Family Income in Martin?
Median Family Income in Martin is $54,688.
What is the Median Household income in Martin?
Median Household Income in Martin is $52,875.
What is Inequality or Gini Index in Martin?
Inequality or Gini Index in Martin is 0.31.
What is the Total Population of Martin?
Total Population of Martin is 57.
What is the Total Male Population of Martin?
Total Male Population of Martin is 27.
What is the Total Female Population of Martin?
Total Female Population of Martin is 30.
What is the Ratio of Males per 100 Females in Martin?
There are 90.00 Males per 100 Females in Martin.
What is the Ratio of Females per 100 Males in Martin?
There are 111.11 Females per 100 Males in Martin.
What is the Median Population Age in Martin?
Median Population Age in Martin is 63.4 Years.
What is the Average Family Size in Martin
Average Family Size in Martin is 2.2 People.
What is the Average Household Size in Martin
Average Household Size in Martin is 1.6 People.
How Large is the Labor Force in Martin?
There are 40 People in the Labor Forcein in Martin.
What is the Percentage of People in the Labor Force in Martin?
76.9% of People are in the Labor Force in Martin.