Joplin, MT Map & Demographics
Joplin Map
Joplin Overview
$54,665
PER CAPITA INCOME
$53,750
AVG FAMILY INCOME
$62,833
AVG HOUSEHOLD INCOME
0.66
INEQUALITY / GINI INDEX
261
TOTAL POPULATION
150
MALE POPULATION
111
FEMALE POPULATION
135.14
MALES / 100 FEMALES
74.00
FEMALES / 100 MALES
36.2
MEDIAN AGE
4.3
AVG FAMILY SIZE
2.9
AVG HOUSEHOLD SIZE
76
LABOR FORCE [ PEOPLE ]
46.3%
PERCENT IN LABOR FORCE
Joplin Zip Codes
Joplin Area Codes
Income in Joplin
Income Overview in Joplin
Per Capita Income in Joplin is $54,665, while median incomes of families and households are $53,750 and $62,833 respectively.
| Characteristic | Number | Measure |
| Per Capita Income | 261 | $54,665 |
| Median Family Income | 48 | $53,750 |
| Mean Family Income | 48 | $78,433 |
| Median Household Income | 90 | $62,833 |
| Mean Household Income | 90 | $156,148 |
| Income Deficit | 48 | $0 |
| Wage / Income Gap (%) | 261 | 0.00% |
| Wage / Income Gap ($) | 261 | 100.00¢ per $1 |
| Gini / Inequality Index | 261 | 0.66 |
Earnings by Sex in Joplin
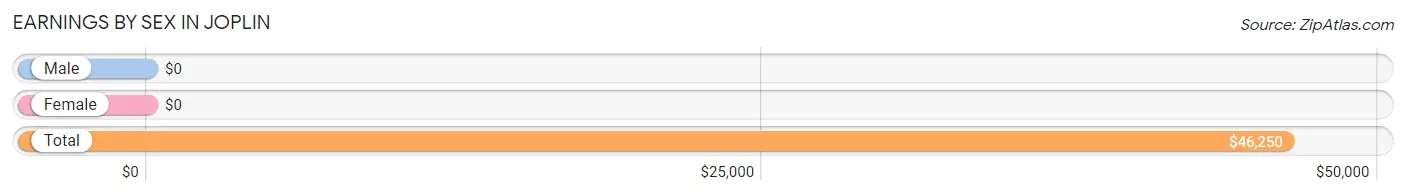
| Sex | Number | Average Earnings |
| Male | 53 (61.6%) | $0 |
| Female | 33 (38.4%) | $0 |
| Total | 86 (100.0%) | $46,250 |
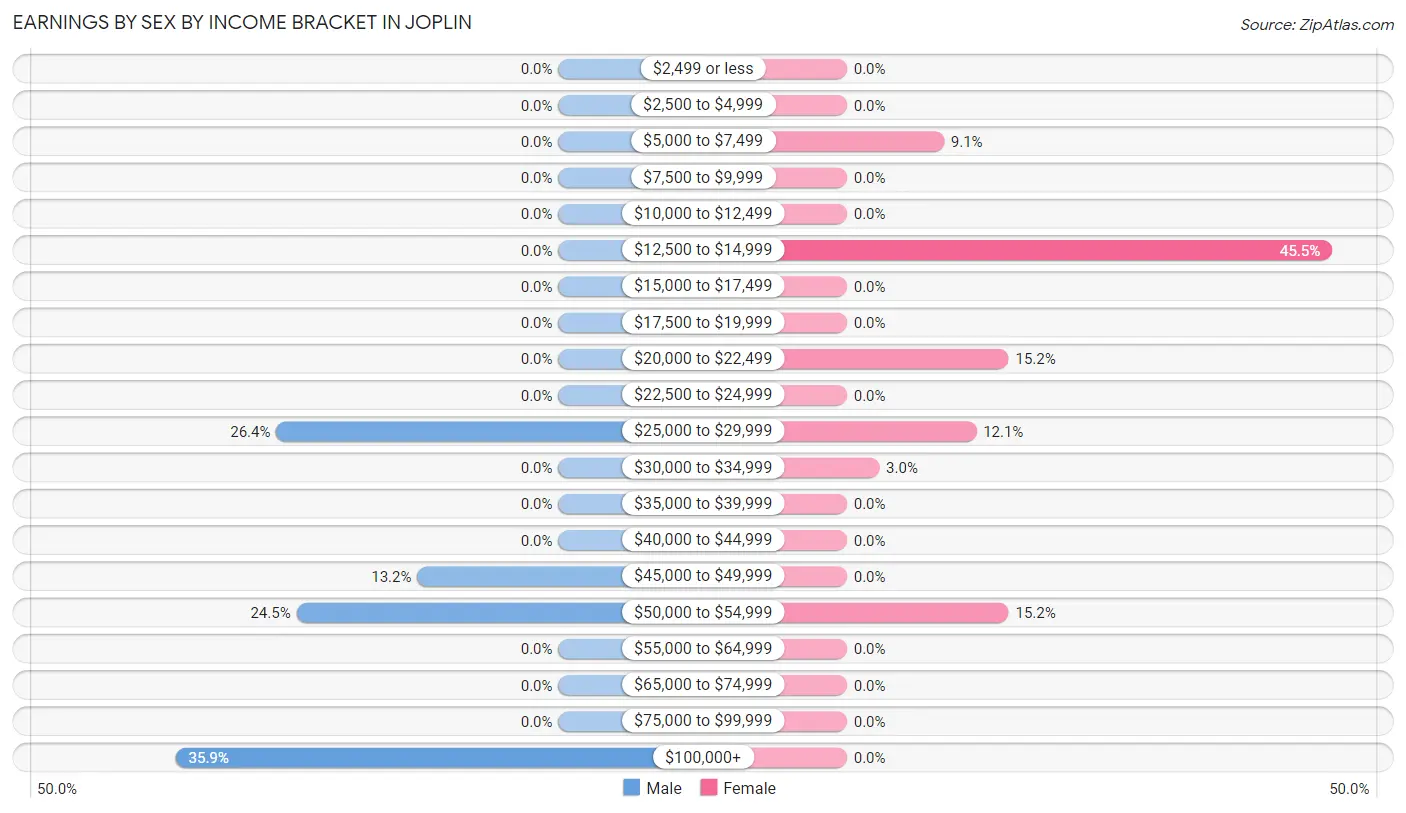
Earnings by Sex by Income Bracket in Joplin
The most common earnings brackets in Joplin are $100,000+ for men (19 | 35.8%) and $12,500 to $14,999 for women (15 | 45.5%).
| Income | Male | Female |
| $2,499 or less | 0 (0.0%) | 0 (0.0%) |
| $2,500 to $4,999 | 0 (0.0%) | 0 (0.0%) |
| $5,000 to $7,499 | 0 (0.0%) | 3 (9.1%) |
| $7,500 to $9,999 | 0 (0.0%) | 0 (0.0%) |
| $10,000 to $12,499 | 0 (0.0%) | 0 (0.0%) |
| $12,500 to $14,999 | 0 (0.0%) | 15 (45.5%) |
| $15,000 to $17,499 | 0 (0.0%) | 0 (0.0%) |
| $17,500 to $19,999 | 0 (0.0%) | 0 (0.0%) |
| $20,000 to $22,499 | 0 (0.0%) | 5 (15.1%) |
| $22,500 to $24,999 | 0 (0.0%) | 0 (0.0%) |
| $25,000 to $29,999 | 14 (26.4%) | 4 (12.1%) |
| $30,000 to $34,999 | 0 (0.0%) | 1 (3.0%) |
| $35,000 to $39,999 | 0 (0.0%) | 0 (0.0%) |
| $40,000 to $44,999 | 0 (0.0%) | 0 (0.0%) |
| $45,000 to $49,999 | 7 (13.2%) | 0 (0.0%) |
| $50,000 to $54,999 | 13 (24.5%) | 5 (15.1%) |
| $55,000 to $64,999 | 0 (0.0%) | 0 (0.0%) |
| $65,000 to $74,999 | 0 (0.0%) | 0 (0.0%) |
| $75,000 to $99,999 | 0 (0.0%) | 0 (0.0%) |
| $100,000+ | 19 (35.8%) | 0 (0.0%) |
| Total | 53 (100.0%) | 33 (100.0%) |
Earnings by Sex by Educational Attainment in Joplin
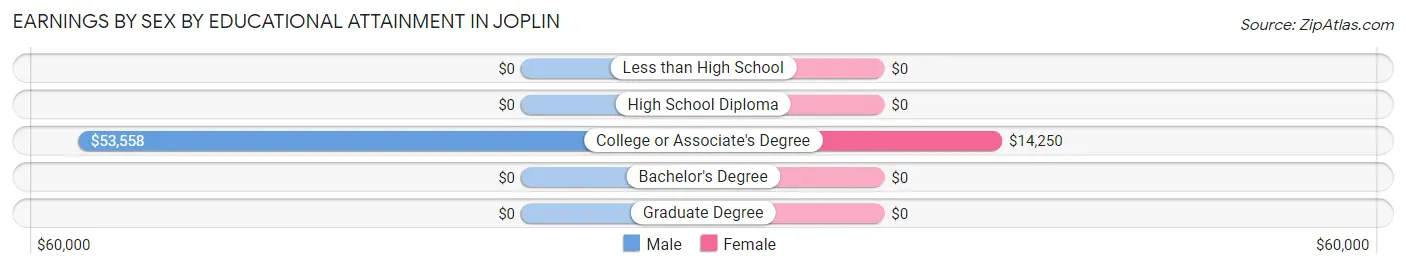
| Educational Attainment | Male Income | Female Income |
| Less than High School | - | - |
| High School Diploma | - | - |
| College or Associate's Degree | $53,558 | $14,250 |
| Bachelor's Degree | - | - |
| Graduate Degree | - | - |
| Total | - | - |
Family Income in Joplin
Family Income Brackets in Joplin
According to the Joplin family income data, there are 23 families falling into the $50,000 to $74,999 income range, which is the most common income bracket and makes up 47.9% of all families.
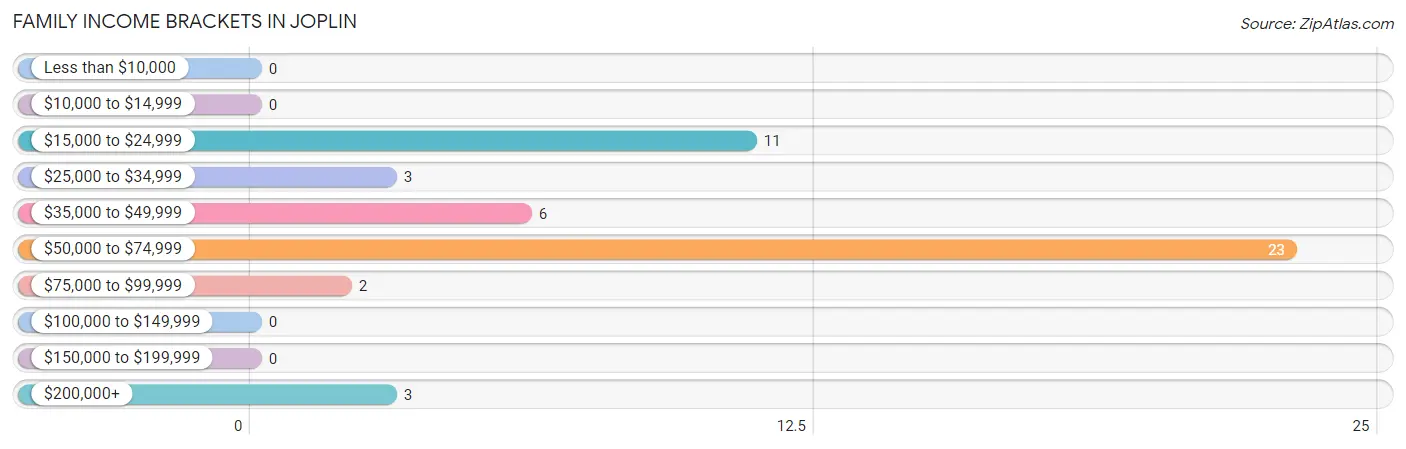
| Income Bracket | # Families | % Families |
| Less than $10,000 | 0 | 0.0% |
| $10,000 to $14,999 | 0 | 0.0% |
| $15,000 to $24,999 | 11 | 22.9% |
| $25,000 to $34,999 | 3 | 6.3% |
| $35,000 to $49,999 | 6 | 12.5% |
| $50,000 to $74,999 | 23 | 47.9% |
| $75,000 to $99,999 | 2 | 4.2% |
| $100,000 to $149,999 | 0 | 0.0% |
| $150,000 to $199,999 | 0 | 0.0% |
| $200,000+ | 3 | 6.3% |
Family Income by Famaliy Size in Joplin
2-person families (17 | 35.4%) account for the highest median family income in Joplin with $53,281 per family, while 2-person families (17 | 35.4%) have the highest median income of $26,640 per family member.
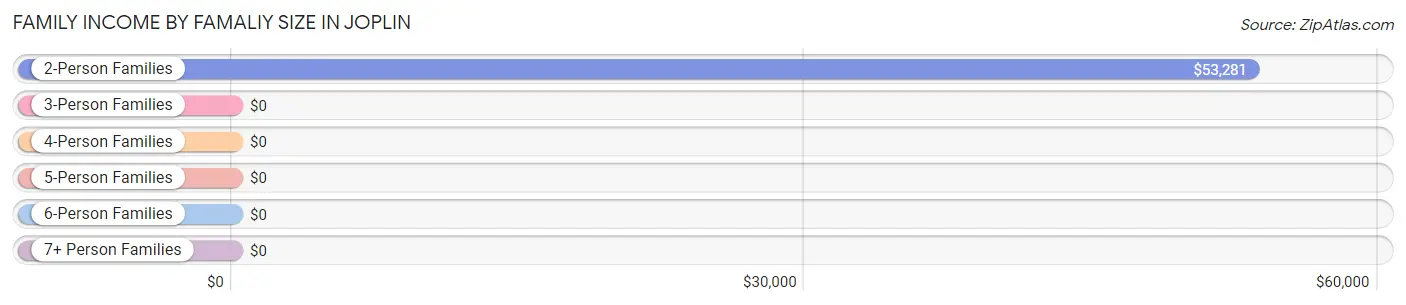
| Income Bracket | # Families | Median Income |
| 2-Person Families | 17 (35.4%) | $53,281 |
| 3-Person Families | 9 (18.8%) | $0 |
| 4-Person Families | 17 (35.4%) | $0 |
| 5-Person Families | 0 (0.0%) | $0 |
| 6-Person Families | 5 (10.4%) | $0 |
| 7+ Person Families | 0 (0.0%) | $0 |
| Total | 48 (100.0%) | $53,750 |
Family Income by Number of Earners in Joplin
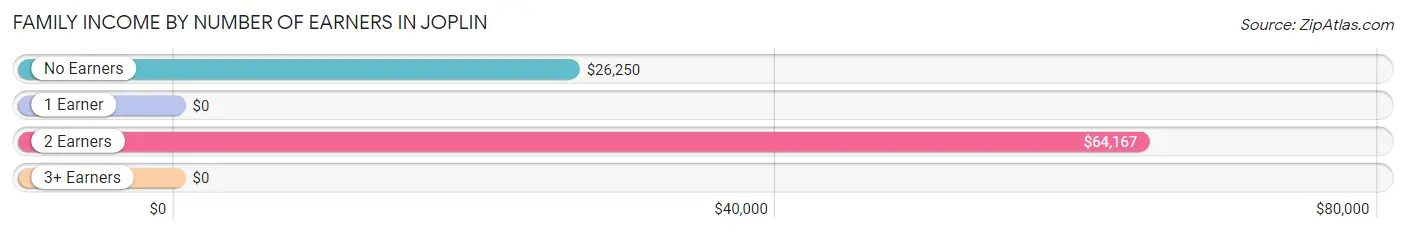
| Number of Earners | # Families | Median Income |
| No Earners | 15 (31.2%) | $26,250 |
| 1 Earner | 13 (27.1%) | $0 |
| 2 Earners | 20 (41.7%) | $64,167 |
| 3+ Earners | 0 (0.0%) | $0 |
| Total | 48 (100.0%) | $53,750 |
Household Income in Joplin
Household Income Brackets in Joplin
With 28 households falling in the category, the $50,000 to $74,999 income range is the most frequent in Joplin, accounting for 31.1% of all households.
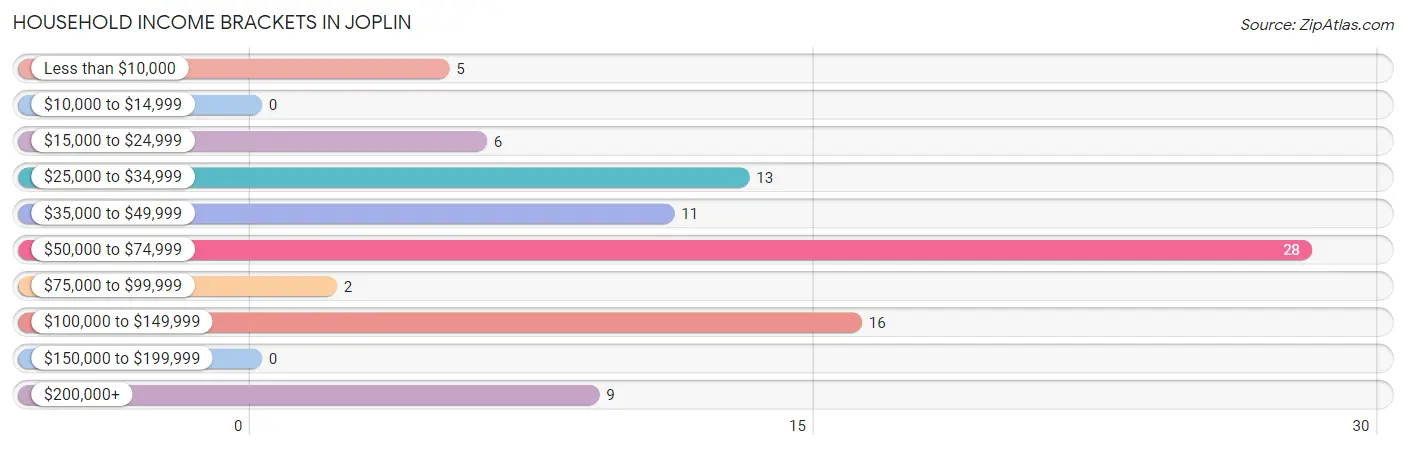
| Income Bracket | # Households | % Households |
| Less than $10,000 | 5 | 5.6% |
| $10,000 to $14,999 | 0 | 0.0% |
| $15,000 to $24,999 | 6 | 6.7% |
| $25,000 to $34,999 | 13 | 14.4% |
| $35,000 to $49,999 | 11 | 12.2% |
| $50,000 to $74,999 | 28 | 31.1% |
| $75,000 to $99,999 | 2 | 2.2% |
| $100,000 to $149,999 | 16 | 17.8% |
| $150,000 to $199,999 | 0 | 0.0% |
| $200,000+ | 9 | 10.0% |
Household Income by Householder Age in Joplin
The median household income in Joplin is $62,833, with the highest median household income of $52,656 found in the 65+ years age bracket for the primary householder. A total of 37 households (41.1%) fall into this category.
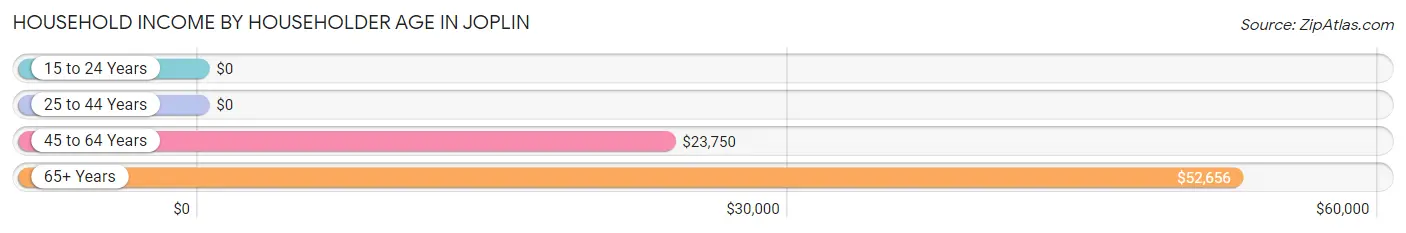
| Income Bracket | # Households | Median Income |
| 15 to 24 Years | 0 (0.0%) | $0 |
| 25 to 44 Years | 41 (45.6%) | $0 |
| 45 to 64 Years | 12 (13.3%) | $23,750 |
| 65+ Years | 37 (41.1%) | $52,656 |
| Total | 90 (100.0%) | $62,833 |
Poverty in Joplin
Income Below Poverty by Sex and Age in Joplin
With 30.7% poverty level for males and 27.9% for females among the residents of Joplin, 5 year old males and under 5 year old females are the most vulnerable to poverty, with 10 males (100.0%) and 23 females (100.0%) in their respective age groups living below the poverty level.
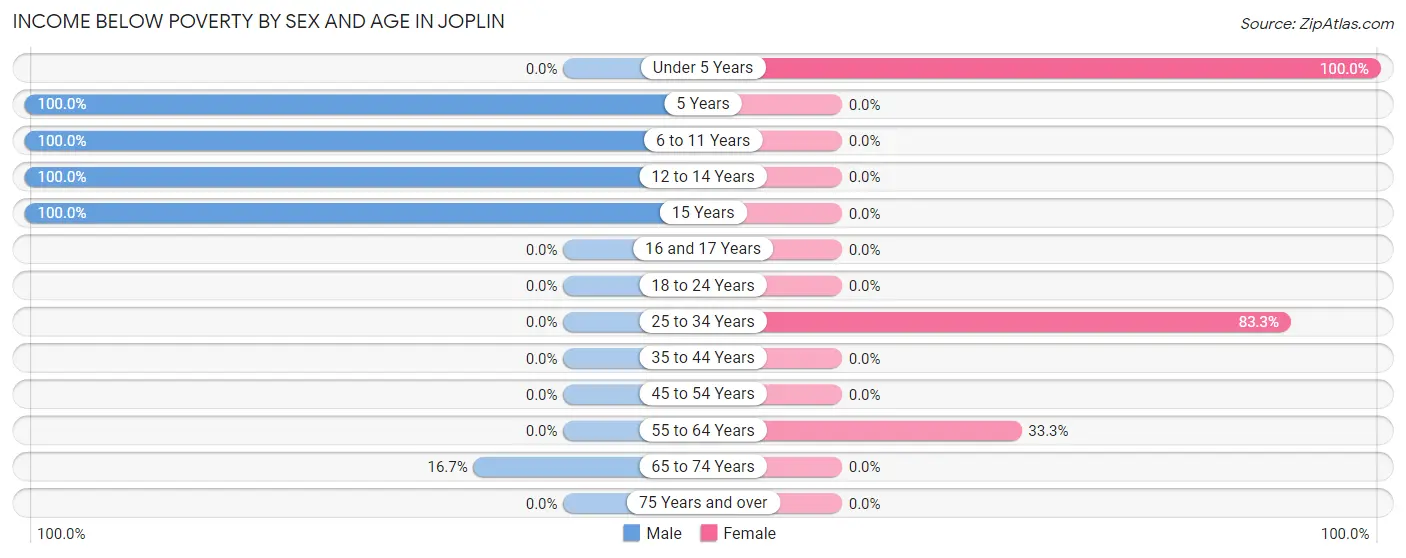
| Age Bracket | Male | Female |
| Under 5 Years | 0 (0.0%) | 23 (100.0%) |
| 5 Years | 10 (100.0%) | 0 (0.0%) |
| 6 to 11 Years | 11 (100.0%) | 0 (0.0%) |
| 12 to 14 Years | 10 (100.0%) | 0 (0.0%) |
| 15 Years | 13 (100.0%) | 0 (0.0%) |
| 16 and 17 Years | 0 (0.0%) | 0 (0.0%) |
| 18 to 24 Years | 0 (0.0%) | 0 (0.0%) |
| 25 to 34 Years | 0 (0.0%) | 5 (83.3%) |
| 35 to 44 Years | 0 (0.0%) | 0 (0.0%) |
| 45 to 54 Years | 0 (0.0%) | 0 (0.0%) |
| 55 to 64 Years | 0 (0.0%) | 3 (33.3%) |
| 65 to 74 Years | 2 (16.7%) | 0 (0.0%) |
| 75 Years and over | 0 (0.0%) | 0 (0.0%) |
| Total | 46 (30.7%) | 31 (27.9%) |
Income Above Poverty by Sex and Age in Joplin
According to the poverty statistics in Joplin, males aged under 5 years and females aged 5 years are the age groups that are most secure financially, with 100.0% of males and 100.0% of females in these age groups living above the poverty line.
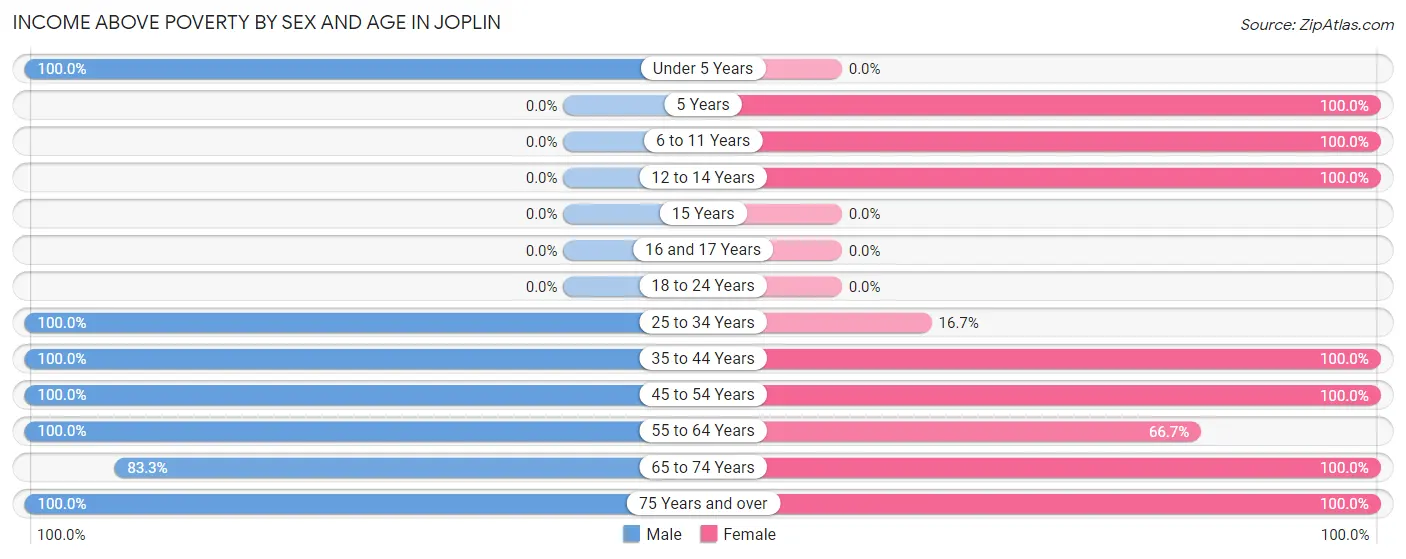
| Age Bracket | Male | Female |
| Under 5 Years | 4 (100.0%) | 0 (0.0%) |
| 5 Years | 0 (0.0%) | 4 (100.0%) |
| 6 to 11 Years | 0 (0.0%) | 14 (100.0%) |
| 12 to 14 Years | 0 (0.0%) | 8 (100.0%) |
| 15 Years | 0 (0.0%) | 0 (0.0%) |
| 16 and 17 Years | 0 (0.0%) | 0 (0.0%) |
| 18 to 24 Years | 0 (0.0%) | 0 (0.0%) |
| 25 to 34 Years | 18 (100.0%) | 1 (16.7%) |
| 35 to 44 Years | 45 (100.0%) | 19 (100.0%) |
| 45 to 54 Years | 3 (100.0%) | 3 (100.0%) |
| 55 to 64 Years | 18 (100.0%) | 6 (66.7%) |
| 65 to 74 Years | 10 (83.3%) | 8 (100.0%) |
| 75 Years and over | 6 (100.0%) | 17 (100.0%) |
| Total | 104 (69.3%) | 80 (72.1%) |
Income Below Poverty Among Married-Couple Families in Joplin
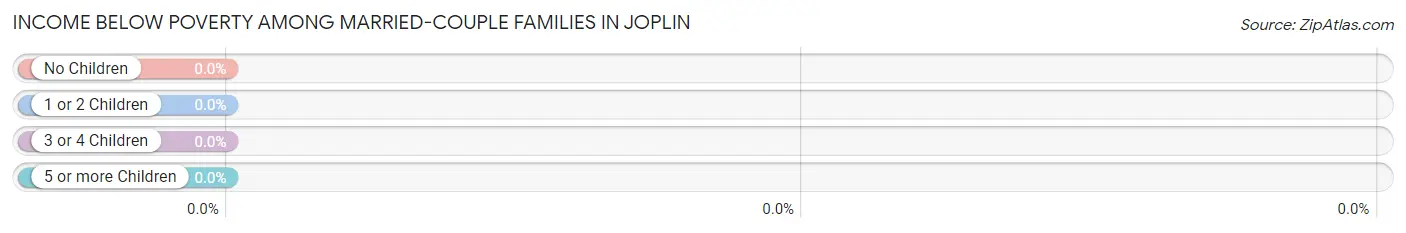
| Children | Above Poverty | Below Poverty |
| No Children | 23 (100.0%) | 0 (0.0%) |
| 1 or 2 Children | 20 (100.0%) | 0 (0.0%) |
| 3 or 4 Children | 0 (0.0%) | 0 (0.0%) |
| 5 or more Children | 0 (0.0%) | 0 (0.0%) |
| Total | 43 (100.0%) | 0 (0.0%) |
Income Below Poverty Among Single-Parent Households in Joplin
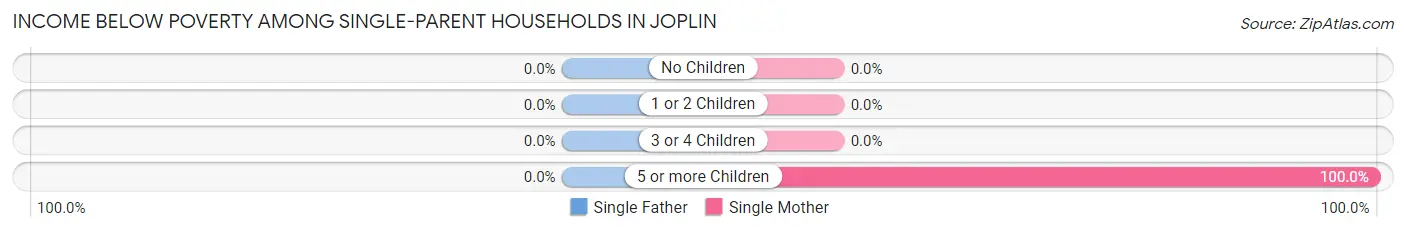
| Children | Single Father | Single Mother |
| No Children | 0 (0.0%) | 0 (0.0%) |
| 1 or 2 Children | 0 (0.0%) | 0 (0.0%) |
| 3 or 4 Children | 0 (0.0%) | 0 (0.0%) |
| 5 or more Children | 0 (0.0%) | 5 (100.0%) |
| Total | 0 (0.0%) | 5 (100.0%) |
Income Below Poverty Among Married-Couple vs Single-Parent Households in Joplin
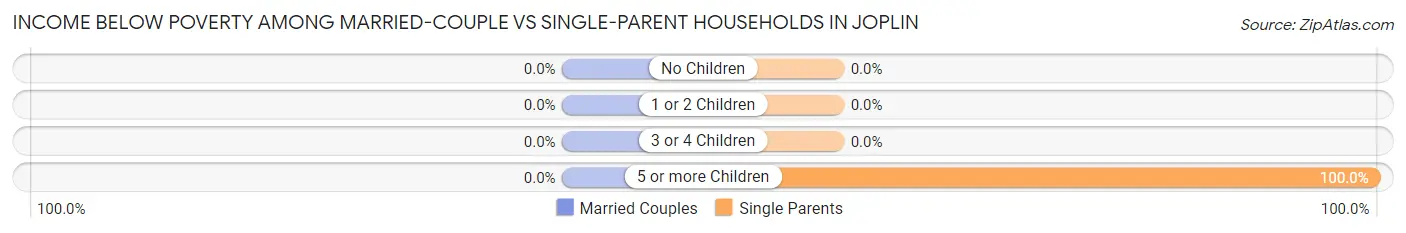
| Children | Married-Couple Families | Single-Parent Households |
| No Children | 0 (0.0%) | 0 (0.0%) |
| 1 or 2 Children | 0 (0.0%) | 0 (0.0%) |
| 3 or 4 Children | 0 (0.0%) | 0 (0.0%) |
| 5 or more Children | 0 (0.0%) | 5 (100.0%) |
| Total | 0 (0.0%) | 5 (100.0%) |
Race in Joplin
The most populous races in Joplin are , and White / Caucasian (261 | 100.0%).
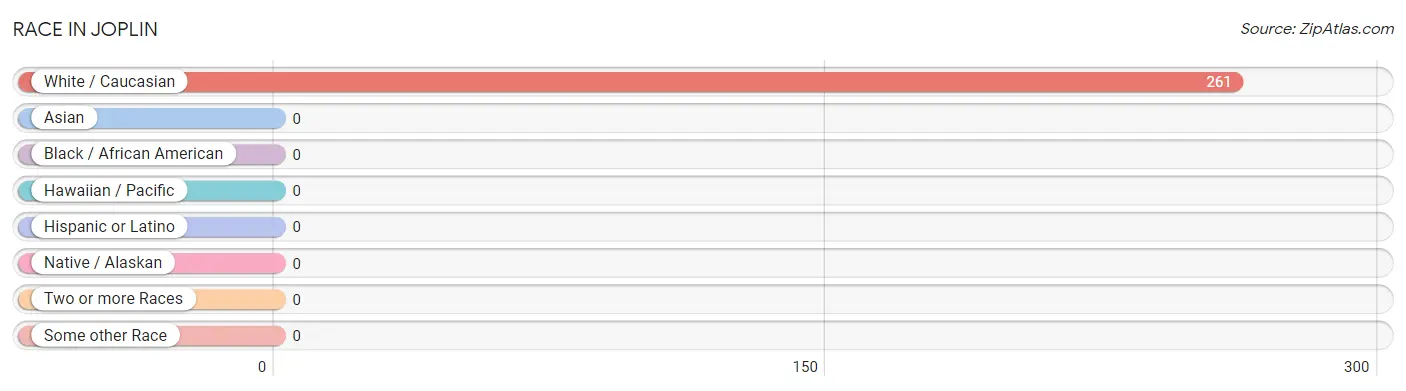
| Race | # Population | % Population |
| Asian | 0 | 0.0% |
| Black / African American | 0 | 0.0% |
| Hawaiian / Pacific | 0 | 0.0% |
| Hispanic or Latino | 0 | 0.0% |
| Native / Alaskan | 0 | 0.0% |
| White / Caucasian | 261 | 100.0% |
| Two or more Races | 0 | 0.0% |
| Some other Race | 0 | 0.0% |
| Total | 261 | 100.0% |
Ancestry in Joplin
The most populous ancestries reported in Joplin are German (69 | 26.4%), Norwegian (48 | 18.4%), Swedish (19 | 7.3%), Dutch (16 | 6.1%), and English (16 | 6.1%), together accounting for 64.4% of all Joplin residents.
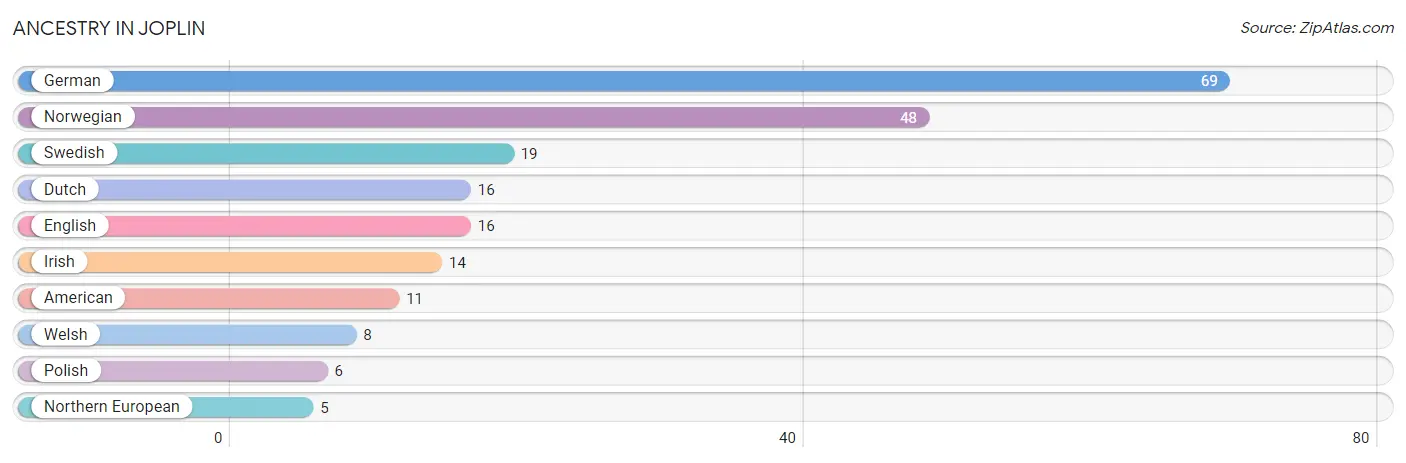
| Ancestry | # Population | % Population |
| American | 11 | 4.2% |
| Dutch | 16 | 6.1% |
| English | 16 | 6.1% |
| German | 69 | 26.4% |
| Irish | 14 | 5.4% |
| Northern European | 5 | 1.9% |
| Norwegian | 48 | 18.4% |
| Polish | 6 | 2.3% |
| Swedish | 19 | 7.3% |
| Welsh | 8 | 3.1% | View All 10 Rows |
Immigrants in Joplin

| Immigration Origin | # Population | % Population | View All 0 Rows |
Sex and Age in Joplin
Sex and Age in Joplin
The most populous age groups in Joplin are 35 to 39 Years (40 | 26.7%) for men and Under 5 Years (23 | 20.7%) for women.
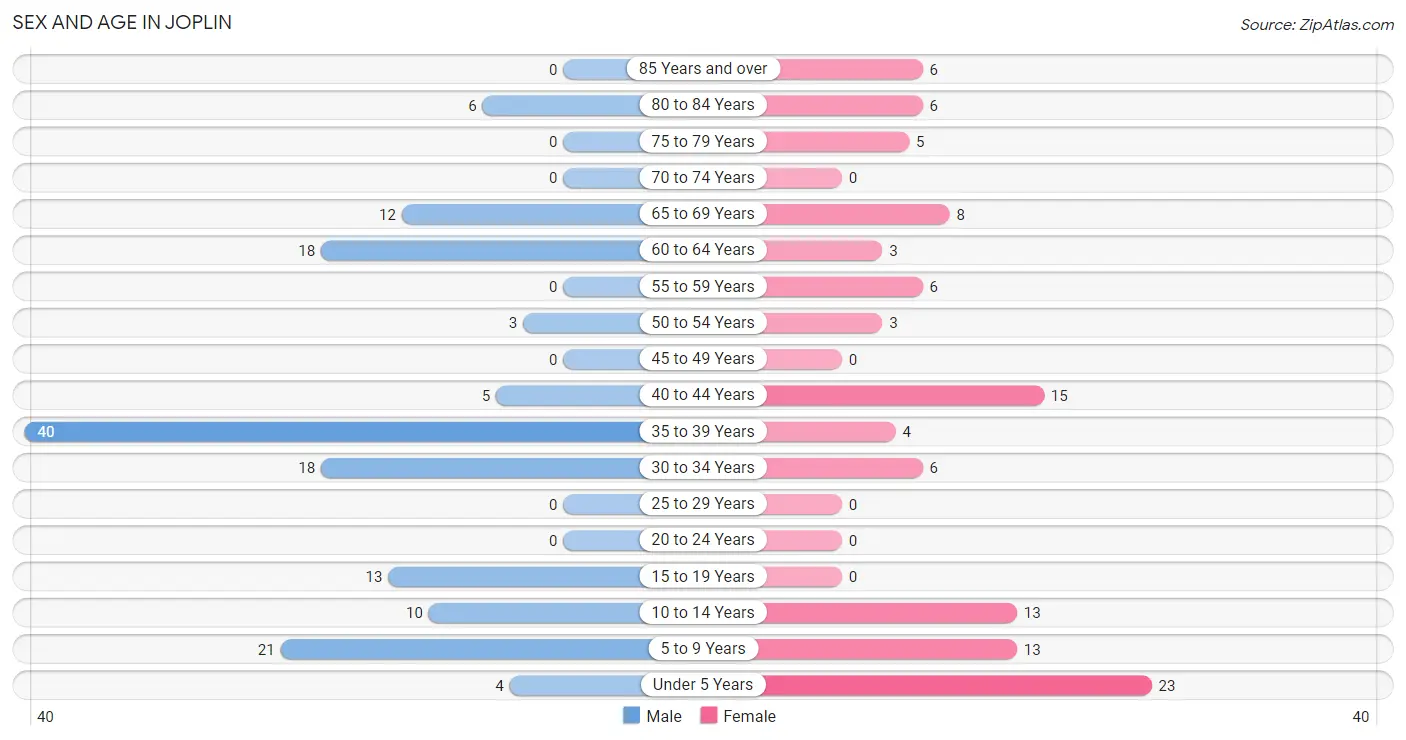
| Age Bracket | Male | Female |
| Under 5 Years | 4 (2.7%) | 23 (20.7%) |
| 5 to 9 Years | 21 (14.0%) | 13 (11.7%) |
| 10 to 14 Years | 10 (6.7%) | 13 (11.7%) |
| 15 to 19 Years | 13 (8.7%) | 0 (0.0%) |
| 20 to 24 Years | 0 (0.0%) | 0 (0.0%) |
| 25 to 29 Years | 0 (0.0%) | 0 (0.0%) |
| 30 to 34 Years | 18 (12.0%) | 6 (5.4%) |
| 35 to 39 Years | 40 (26.7%) | 4 (3.6%) |
| 40 to 44 Years | 5 (3.3%) | 15 (13.5%) |
| 45 to 49 Years | 0 (0.0%) | 0 (0.0%) |
| 50 to 54 Years | 3 (2.0%) | 3 (2.7%) |
| 55 to 59 Years | 0 (0.0%) | 6 (5.4%) |
| 60 to 64 Years | 18 (12.0%) | 3 (2.7%) |
| 65 to 69 Years | 12 (8.0%) | 8 (7.2%) |
| 70 to 74 Years | 0 (0.0%) | 0 (0.0%) |
| 75 to 79 Years | 0 (0.0%) | 5 (4.5%) |
| 80 to 84 Years | 6 (4.0%) | 6 (5.4%) |
| 85 Years and over | 0 (0.0%) | 6 (5.4%) |
| Total | 150 (100.0%) | 111 (100.0%) |
Families and Households in Joplin
Median Family Size in Joplin
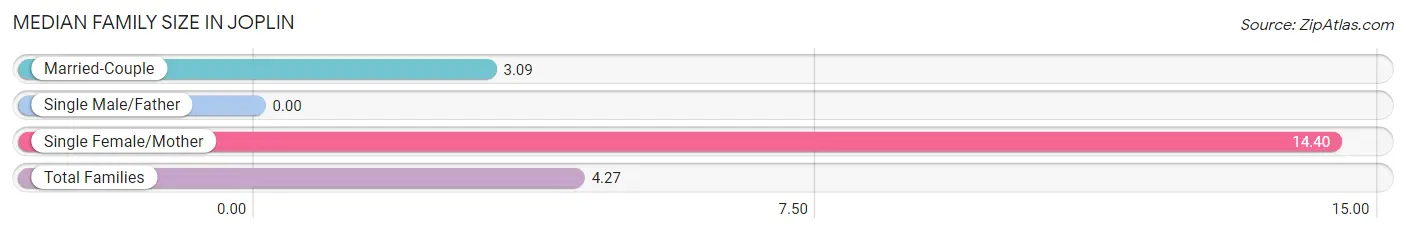
| Family Type | # Families | Family Size |
| Married-Couple | 43 (89.6%) | 3.09 |
| Single Male/Father | 0 (0.0%) | - |
| Single Female/Mother | 5 (10.4%) | 14.40 |
| Total Families | 48 (100.0%) | 4.27 |
Median Household Size in Joplin
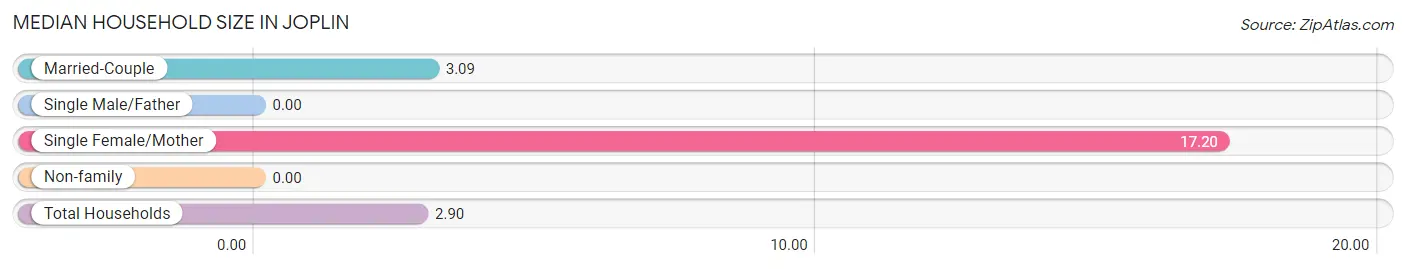
| Household Type | # Households | Household Size |
| Married-Couple | 43 (47.8%) | 3.09 |
| Single Male/Father | 0 (0.0%) | - |
| Single Female/Mother | 5 (5.6%) | 17.20 |
| Non-family | 42 (46.7%) | - |
| Total Households | 90 (100.0%) | 2.90 |
Household Size by Marriage Status in Joplin
Out of a total of 90 households in Joplin, 48 (53.3%) are family households, while 42 (46.7%) are nonfamily households. The most numerous type of family households are 2-person households, comprising 17, and the most common type of nonfamily households are 1-person households, comprising 42.
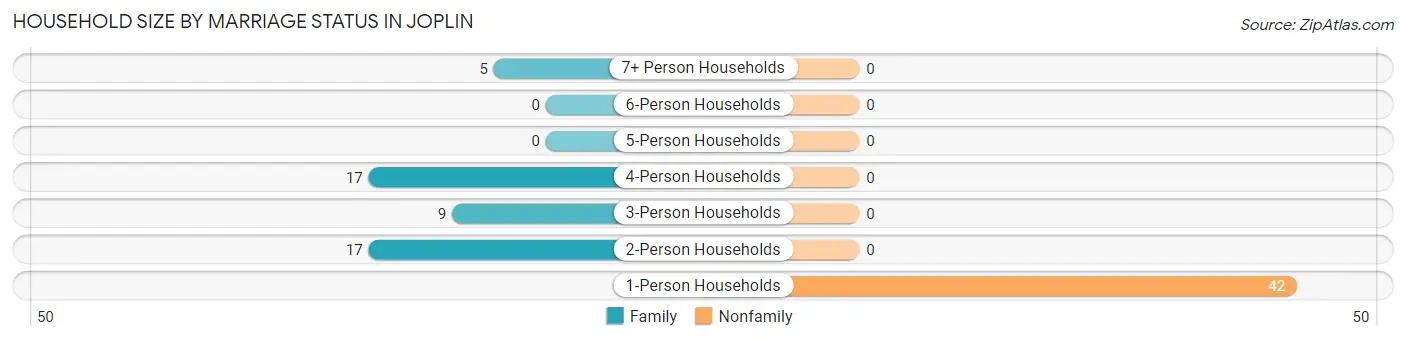
| Household Size | Family Households | Nonfamily Households |
| 1-Person Households | - | 42 (46.7%) |
| 2-Person Households | 17 (18.9%) | 0 (0.0%) |
| 3-Person Households | 9 (10.0%) | 0 (0.0%) |
| 4-Person Households | 17 (18.9%) | 0 (0.0%) |
| 5-Person Households | 0 (0.0%) | 0 (0.0%) |
| 6-Person Households | 0 (0.0%) | 0 (0.0%) |
| 7+ Person Households | 5 (5.6%) | 0 (0.0%) |
| Total | 48 (53.3%) | 42 (46.7%) |
Female Fertility in Joplin
Fertility by Age in Joplin
| Age Bracket | Women with Births | Births / 1,000 Women |
| 15 to 19 years | 0 (0.0%) | 0.0 |
| 20 to 34 years | 0 (0.0%) | 0.0 |
| 35 to 50 years | 0 (0.0%) | 0.0 |
| Total | 0 (0.0%) | 0.0 |
Fertility by Age by Marriage Status in Joplin
| Age Bracket | Married | Unmarried |
| 15 to 19 years | 0 (0.0%) | 0 (0.0%) |
| 20 to 34 years | 0 (0.0%) | 0 (0.0%) |
| 35 to 50 years | 0 (0.0%) | 0 (0.0%) |
| Total | 0 (0.0%) | 0 (0.0%) |
Fertility by Education in Joplin
| Educational Attainment | Women with Births | Births / 1,000 Women |
| Less than High School | 0 (0.0%) | 0.0 |
| High School Diploma | 0 (0.0%) | 0.0 |
| College or Associate's Degree | 0 (0.0%) | 0.0 |
| Bachelor's Degree | 0 (0.0%) | 0.0 |
| Graduate Degree | 0 (0.0%) | 0.0 |
| Total | 0 (0.0%) | 0.0 |
Fertility by Education by Marriage Status in Joplin
| Educational Attainment | Married | Unmarried |
| Less than High School | 0 (0.0%) | 0 (0.0%) |
| High School Diploma | 0 (0.0%) | 0 (0.0%) |
| College or Associate's Degree | 0 (0.0%) | 0 (0.0%) |
| Bachelor's Degree | 0 (0.0%) | 0 (0.0%) |
| Graduate Degree | 0 (0.0%) | 0 (0.0%) |
| Total | 0 (0.0%) | 0 (0.0%) |
Employment Characteristics in Joplin
Employment by Class of Employer in Joplin
Among the 76 employed individuals in Joplin, private company employees (37 | 48.7%), self-employed (incorporated) (22 | 28.9%), and self-employed (not incorporated) (14 | 18.4%) make up the most common classes of employment.
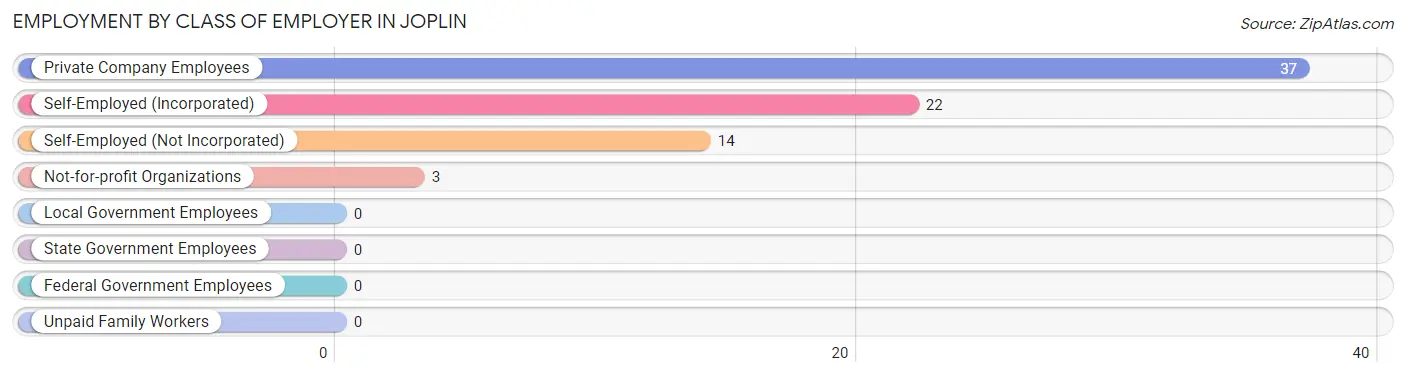
| Employer Class | # Employees | % Employees |
| Private Company Employees | 37 | 48.7% |
| Self-Employed (Incorporated) | 22 | 28.9% |
| Self-Employed (Not Incorporated) | 14 | 18.4% |
| Not-for-profit Organizations | 3 | 4.0% |
| Local Government Employees | 0 | 0.0% |
| State Government Employees | 0 | 0.0% |
| Federal Government Employees | 0 | 0.0% |
| Unpaid Family Workers | 0 | 0.0% |
| Total | 76 | 100.0% |
Employment Status by Age in Joplin
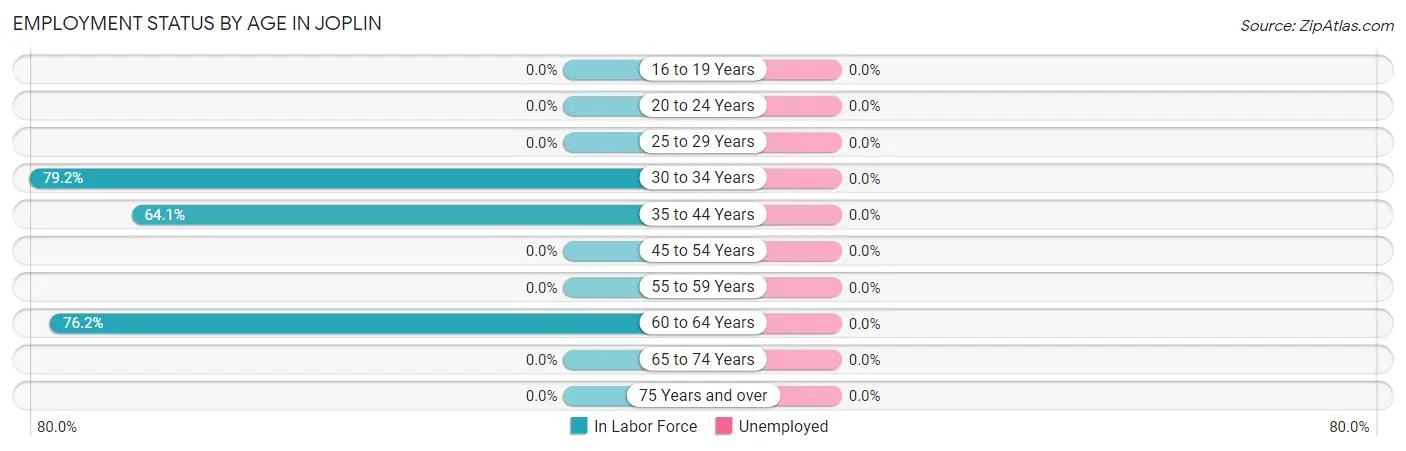
| Age Bracket | In Labor Force | Unemployed |
| 16 to 19 Years | 0 (0.0%) | 0 (0.0%) |
| 20 to 24 Years | 0 (0.0%) | 0 (0.0%) |
| 25 to 29 Years | 0 (0.0%) | 0 (0.0%) |
| 30 to 34 Years | 19 (79.2%) | 0 (0.0%) |
| 35 to 44 Years | 41 (64.1%) | 0 (0.0%) |
| 45 to 54 Years | 0 (0.0%) | 0 (0.0%) |
| 55 to 59 Years | 0 (0.0%) | 0 (0.0%) |
| 60 to 64 Years | 16 (76.2%) | 0 (0.0%) |
| 65 to 74 Years | 0 (0.0%) | 0 (0.0%) |
| 75 Years and over | 0 (0.0%) | 0 (0.0%) |
| Total | 76 (46.3%) | 0 (0.0%) |
Employment Status by Educational Attainment in Joplin
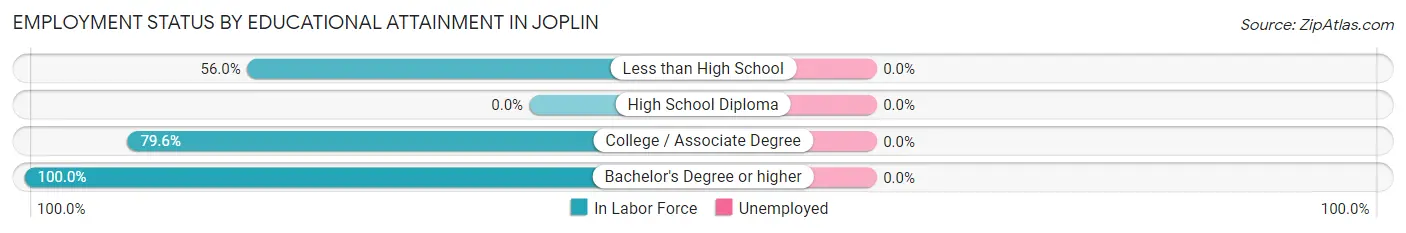
| Educational Attainment | In Labor Force | Unemployed |
| Less than High School | 14 (56.0%) | 0 (0.0%) |
| High School Diploma | 0 (0.0%) | 0 (0.0%) |
| College / Associate Degree | 43 (79.6%) | 0 (0.0%) |
| Bachelor's Degree or higher | 19 (100.0%) | 0 (0.0%) |
| Total | 76 (62.8%) | 0 (0.0%) |
Employment Occupations by Sex in Joplin
Management, Business, Science and Arts Occupations
The most common Management, Business, Science and Arts occupations in Joplin are Management (35 | 46.1%), Health Diagnosing & Treating (20 | 26.3%), Health Technologists (5 | 6.6%), Computers, Engineering & Science (3 | 4.0%), and Computers & Mathematics (3 | 4.0%).
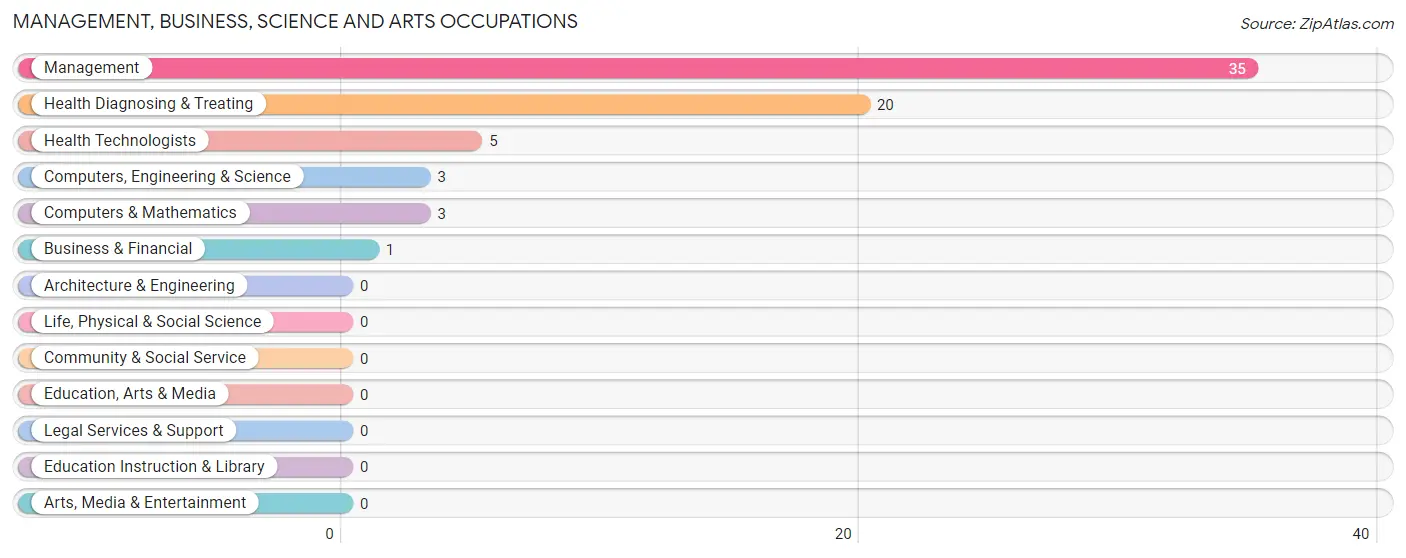
Management, Business, Science and Arts Occupations by Sex
Within the Management, Business, Science and Arts occupations in Joplin, the most male-oriented occupations are Management (100.0%), Health Technologists (100.0%), and Health Diagnosing & Treating (25.0%), while the most female-oriented occupations are Business & Financial (100.0%), Computers, Engineering & Science (100.0%), and Computers & Mathematics (100.0%).
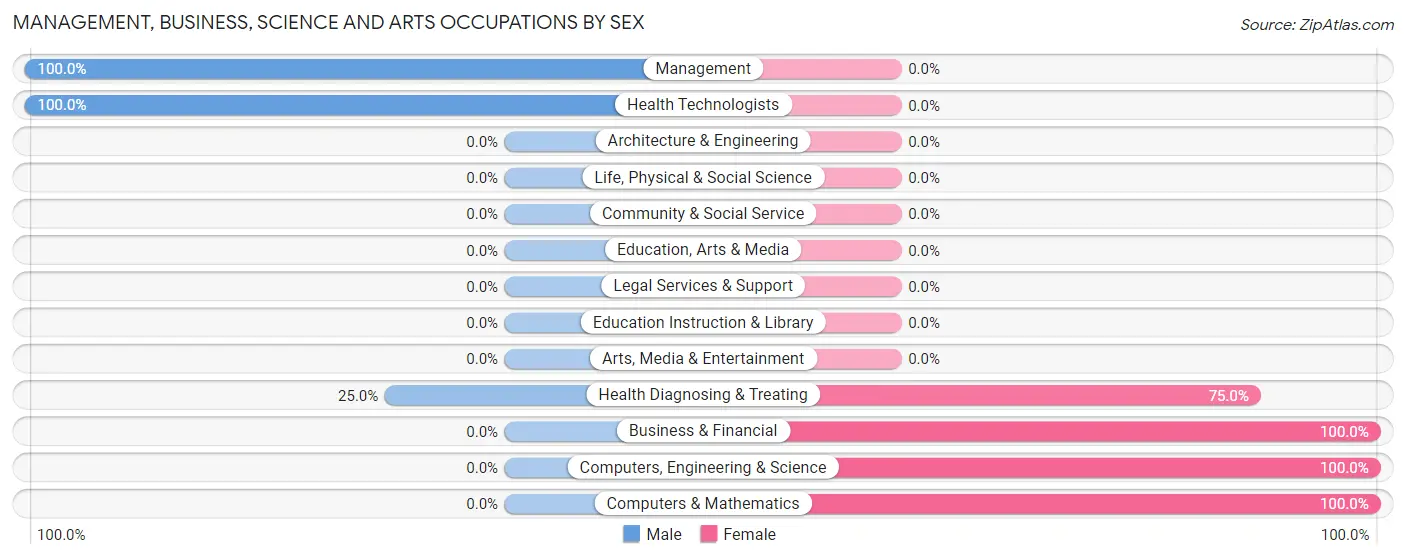
| Occupation | Male | Female |
| Management | 35 (100.0%) | 0 (0.0%) |
| Business & Financial | 0 (0.0%) | 1 (100.0%) |
| Computers, Engineering & Science | 0 (0.0%) | 3 (100.0%) |
| Computers & Mathematics | 0 (0.0%) | 3 (100.0%) |
| Architecture & Engineering | 0 (0.0%) | 0 (0.0%) |
| Life, Physical & Social Science | 0 (0.0%) | 0 (0.0%) |
| Community & Social Service | 0 (0.0%) | 0 (0.0%) |
| Education, Arts & Media | 0 (0.0%) | 0 (0.0%) |
| Legal Services & Support | 0 (0.0%) | 0 (0.0%) |
| Education Instruction & Library | 0 (0.0%) | 0 (0.0%) |
| Arts, Media & Entertainment | 0 (0.0%) | 0 (0.0%) |
| Health Diagnosing & Treating | 5 (25.0%) | 15 (75.0%) |
| Health Technologists | 5 (100.0%) | 0 (0.0%) |
| Total (Category) | 40 (67.8%) | 19 (32.2%) |
| Total (Overall) | 53 (69.7%) | 23 (30.3%) |
Services Occupations
Services Occupations by Sex
| Occupation | Male | Female |
| Healthcare Support | 0 (0.0%) | 0 (0.0%) |
| Security & Protection | 0 (0.0%) | 0 (0.0%) |
| Firefighting & Prevention | 0 (0.0%) | 0 (0.0%) |
| Law Enforcement | 0 (0.0%) | 0 (0.0%) |
| Food Preparation & Serving | 0 (0.0%) | 0 (0.0%) |
| Cleaning & Maintenance | 0 (0.0%) | 0 (0.0%) |
| Personal Care & Service | 0 (0.0%) | 0 (0.0%) |
| Total (Category) | 0 (0.0%) | 0 (0.0%) |
| Total (Overall) | 53 (69.7%) | 23 (30.3%) |
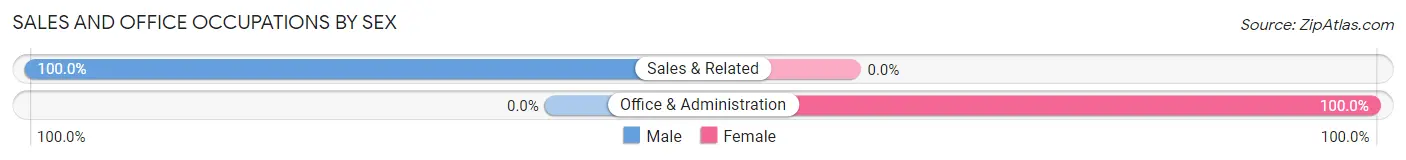
Sales and Office Occupations
The most common Sales and Office occupations in Joplin are Sales & Related (13 | 17.1%), and Office & Administration (4 | 5.3%).
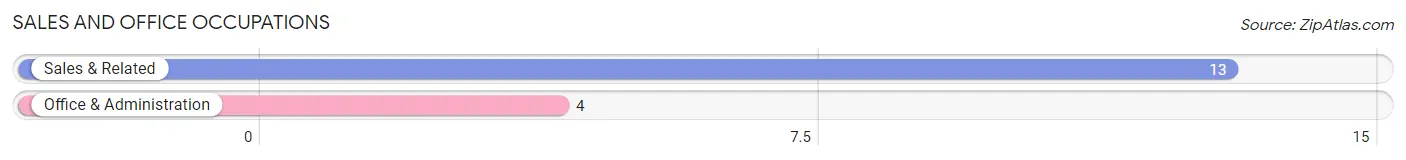
Sales and Office Occupations by Sex
| Occupation | Male | Female |
| Sales & Related | 13 (100.0%) | 0 (0.0%) |
| Office & Administration | 0 (0.0%) | 4 (100.0%) |
| Total (Category) | 13 (76.5%) | 4 (23.5%) |
| Total (Overall) | 53 (69.7%) | 23 (30.3%) |
Natural Resources, Construction and Maintenance Occupations
Natural Resources, Construction and Maintenance Occupations by Sex
| Occupation | Male | Female |
| Farming, Fishing & Forestry | 0 (0.0%) | 0 (0.0%) |
| Construction & Extraction | 0 (0.0%) | 0 (0.0%) |
| Installation, Maintenance & Repair | 0 (0.0%) | 0 (0.0%) |
| Total (Category) | 0 (0.0%) | 0 (0.0%) |
| Total (Overall) | 53 (69.7%) | 23 (30.3%) |
Production, Transportation and Moving Occupations
Production, Transportation and Moving Occupations by Sex
| Occupation | Male | Female |
| Production | 0 (0.0%) | 0 (0.0%) |
| Transportation | 0 (0.0%) | 0 (0.0%) |
| Material Moving | 0 (0.0%) | 0 (0.0%) |
| Total (Category) | 0 (0.0%) | 0 (0.0%) |
| Total (Overall) | 53 (69.7%) | 23 (30.3%) |
Employment Industries by Sex in Joplin
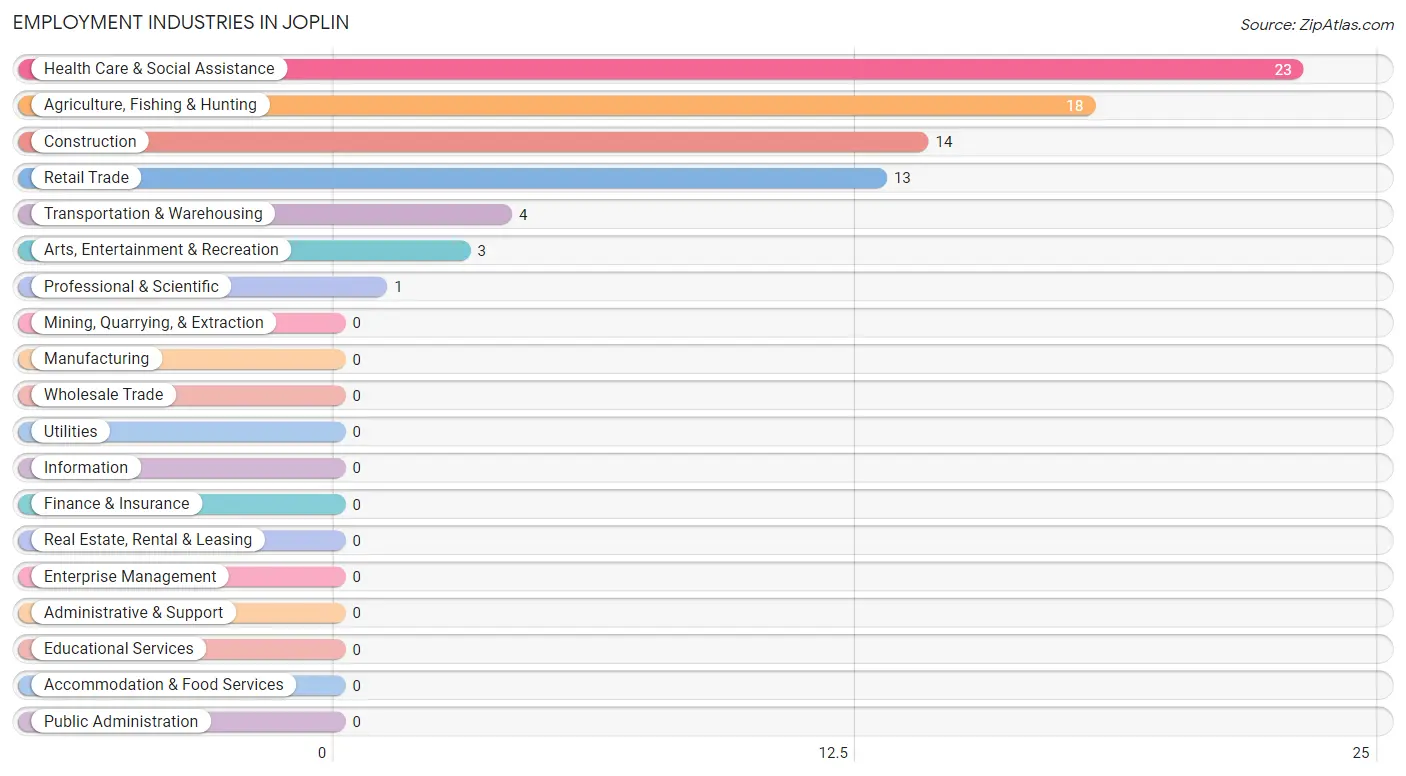
Employment Industries in Joplin
The major employment industries in Joplin include Health Care & Social Assistance (23 | 30.3%), Agriculture, Fishing & Hunting (18 | 23.7%), Construction (14 | 18.4%), Retail Trade (13 | 17.1%), and Transportation & Warehousing (4 | 5.3%).
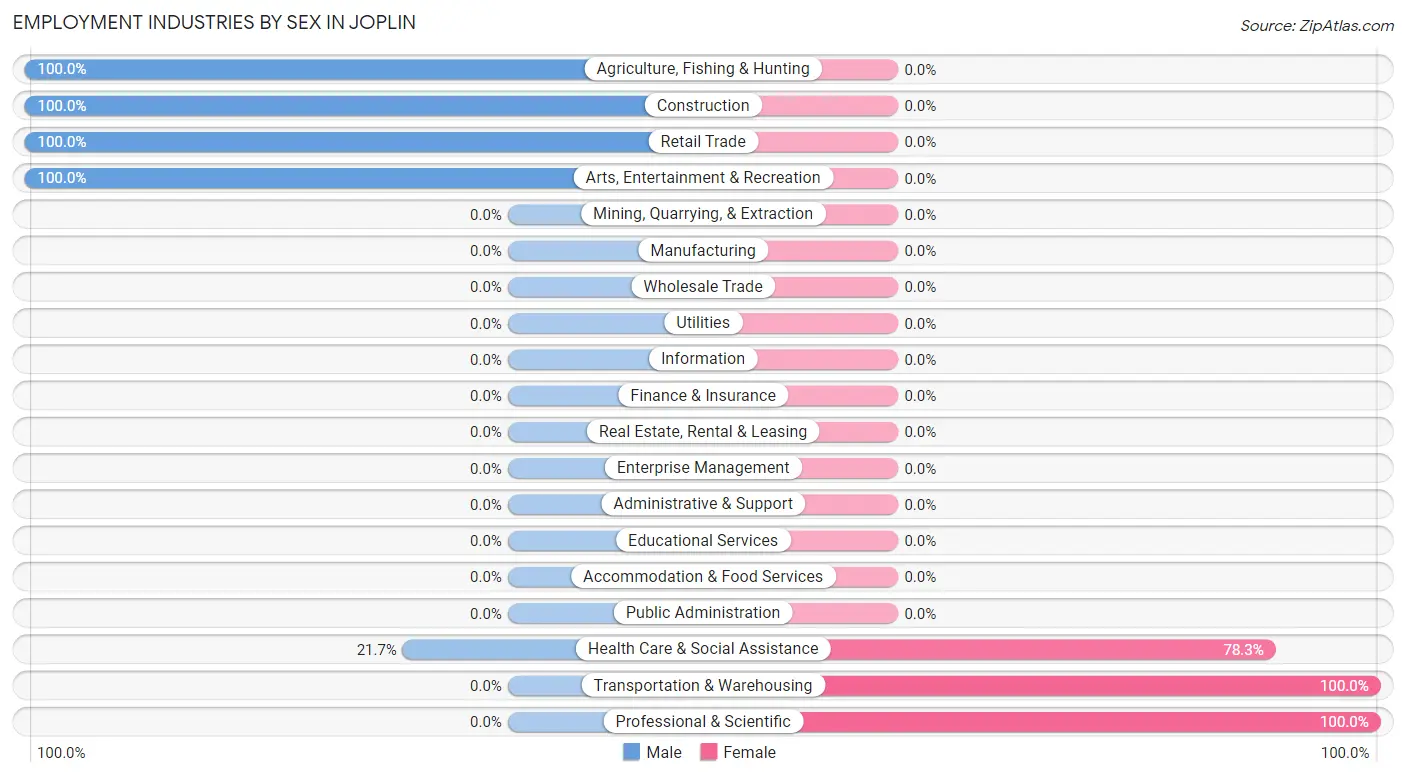
Employment Industries by Sex in Joplin
The Joplin industries that see more men than women are Agriculture, Fishing & Hunting (100.0%), Construction (100.0%), and Retail Trade (100.0%), whereas the industries that tend to have a higher number of women are Transportation & Warehousing (100.0%), Professional & Scientific (100.0%), and Health Care & Social Assistance (78.3%).
| Industry | Male | Female |
| Agriculture, Fishing & Hunting | 18 (100.0%) | 0 (0.0%) |
| Mining, Quarrying, & Extraction | 0 (0.0%) | 0 (0.0%) |
| Construction | 14 (100.0%) | 0 (0.0%) |
| Manufacturing | 0 (0.0%) | 0 (0.0%) |
| Wholesale Trade | 0 (0.0%) | 0 (0.0%) |
| Retail Trade | 13 (100.0%) | 0 (0.0%) |
| Transportation & Warehousing | 0 (0.0%) | 4 (100.0%) |
| Utilities | 0 (0.0%) | 0 (0.0%) |
| Information | 0 (0.0%) | 0 (0.0%) |
| Finance & Insurance | 0 (0.0%) | 0 (0.0%) |
| Real Estate, Rental & Leasing | 0 (0.0%) | 0 (0.0%) |
| Professional & Scientific | 0 (0.0%) | 1 (100.0%) |
| Enterprise Management | 0 (0.0%) | 0 (0.0%) |
| Administrative & Support | 0 (0.0%) | 0 (0.0%) |
| Educational Services | 0 (0.0%) | 0 (0.0%) |
| Health Care & Social Assistance | 5 (21.7%) | 18 (78.3%) |
| Arts, Entertainment & Recreation | 3 (100.0%) | 0 (0.0%) |
| Accommodation & Food Services | 0 (0.0%) | 0 (0.0%) |
| Public Administration | 0 (0.0%) | 0 (0.0%) |
| Total | 53 (69.7%) | 23 (30.3%) |
Education in Joplin
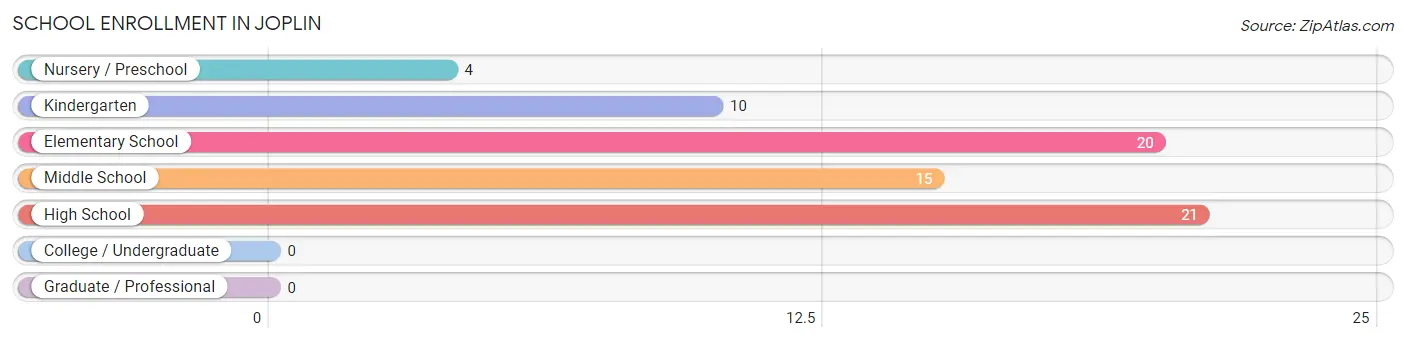
School Enrollment in Joplin
The most common levels of schooling among the 70 students in Joplin are high school (21 | 30.0%), elementary school (20 | 28.6%), and middle school (15 | 21.4%).
| School Level | # Students | % Students |
| Nursery / Preschool | 4 | 5.7% |
| Kindergarten | 10 | 14.3% |
| Elementary School | 20 | 28.6% |
| Middle School | 15 | 21.4% |
| High School | 21 | 30.0% |
| College / Undergraduate | 0 | 0.0% |
| Graduate / Professional | 0 | 0.0% |
| Total | 70 | 100.0% |
School Enrollment by Age by Funding Source in Joplin
Out of a total of 70 students who are enrolled in schools in Joplin, 53 (75.7%) attend a private institution, while the remaining 17 (24.3%) are enrolled in public schools. The age group of 15 to 17 year olds has the highest likelihood of being enrolled in private schools, with 13 (100.0% in the age bracket) enrolled. Conversely, the age group of 10 to 14 year olds has the lowest likelihood of being enrolled in a private school, with 8 (34.8% in the age bracket) attending a public institution.
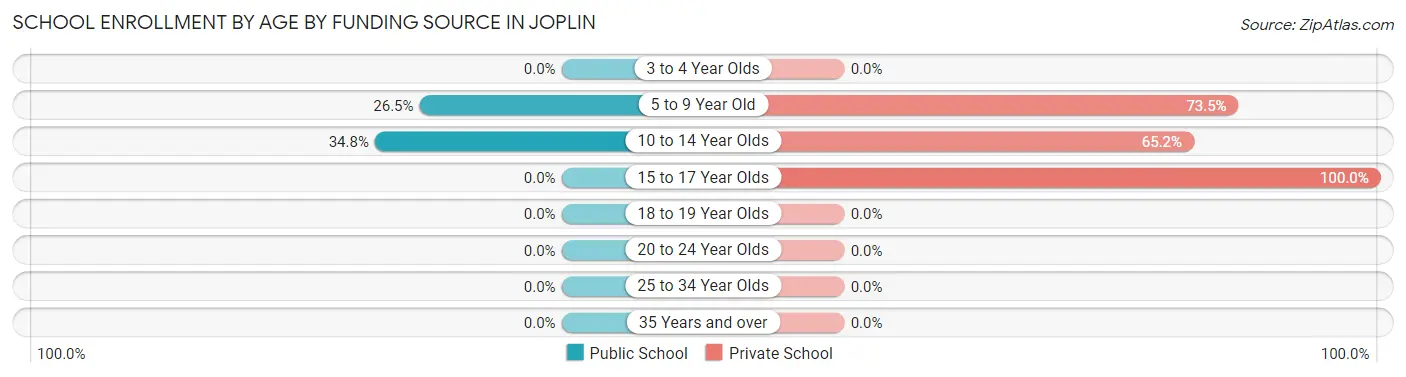
| Age Bracket | Public School | Private School |
| 3 to 4 Year Olds | 0 (0.0%) | 0 (0.0%) |
| 5 to 9 Year Old | 9 (26.5%) | 25 (73.5%) |
| 10 to 14 Year Olds | 8 (34.8%) | 15 (65.2%) |
| 15 to 17 Year Olds | 0 (0.0%) | 13 (100.0%) |
| 18 to 19 Year Olds | 0 (0.0%) | 0 (0.0%) |
| 20 to 24 Year Olds | 0 (0.0%) | 0 (0.0%) |
| 25 to 34 Year Olds | 0 (0.0%) | 0 (0.0%) |
| 35 Years and over | 0 (0.0%) | 0 (0.0%) |
| Total | 17 (24.3%) | 53 (75.7%) |
Educational Attainment by Field of Study in Joplin
Business (19 | 57.6%), science & technology (6 | 18.2%), education (6 | 18.2%), and engineering (2 | 6.1%) are the most common fields of study among 33 individuals in Joplin who have obtained a bachelor's degree or higher.
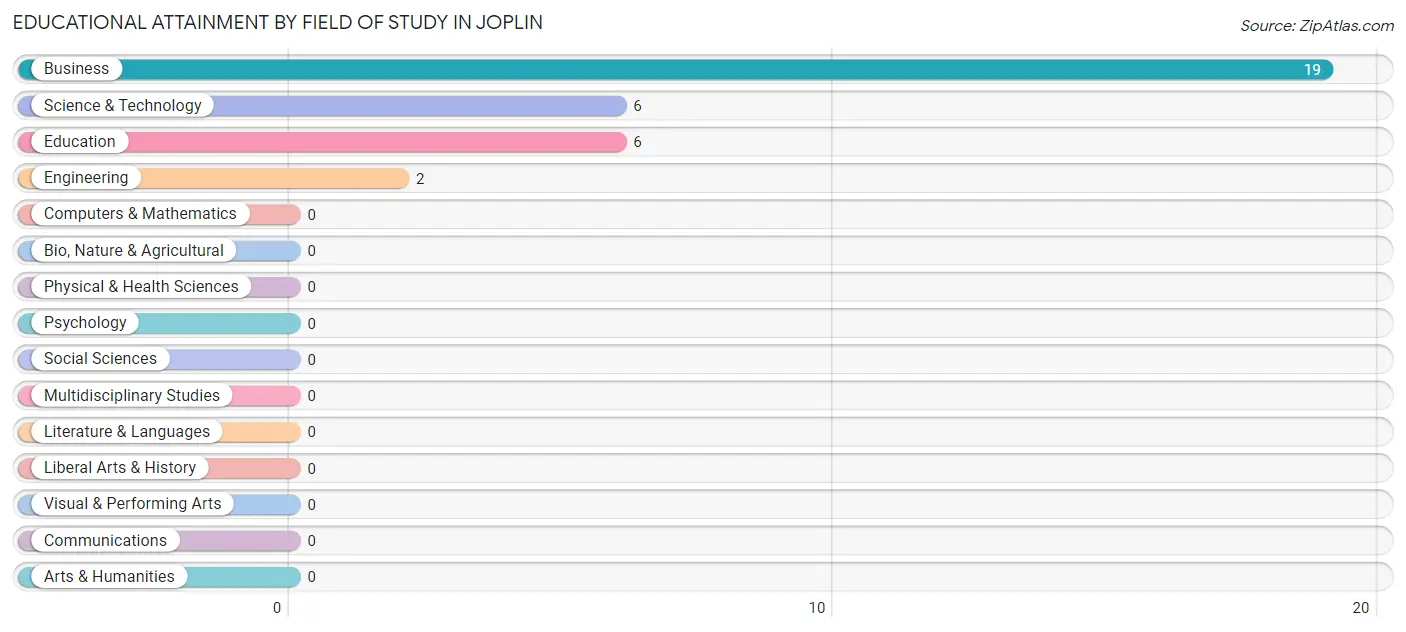
| Field of Study | # Graduates | % Graduates |
| Computers & Mathematics | 0 | 0.0% |
| Bio, Nature & Agricultural | 0 | 0.0% |
| Physical & Health Sciences | 0 | 0.0% |
| Psychology | 0 | 0.0% |
| Social Sciences | 0 | 0.0% |
| Engineering | 2 | 6.1% |
| Multidisciplinary Studies | 0 | 0.0% |
| Science & Technology | 6 | 18.2% |
| Business | 19 | 57.6% |
| Education | 6 | 18.2% |
| Literature & Languages | 0 | 0.0% |
| Liberal Arts & History | 0 | 0.0% |
| Visual & Performing Arts | 0 | 0.0% |
| Communications | 0 | 0.0% |
| Arts & Humanities | 0 | 0.0% |
| Total | 33 | 100.0% |
Transportation & Commute in Joplin
Vehicle Availability by Sex in Joplin
The most prevalent vehicle ownership categories in Joplin are males with 1 vehicle (16, accounting for 30.2%) and females with 1 vehicle (3, making up 69.6%).
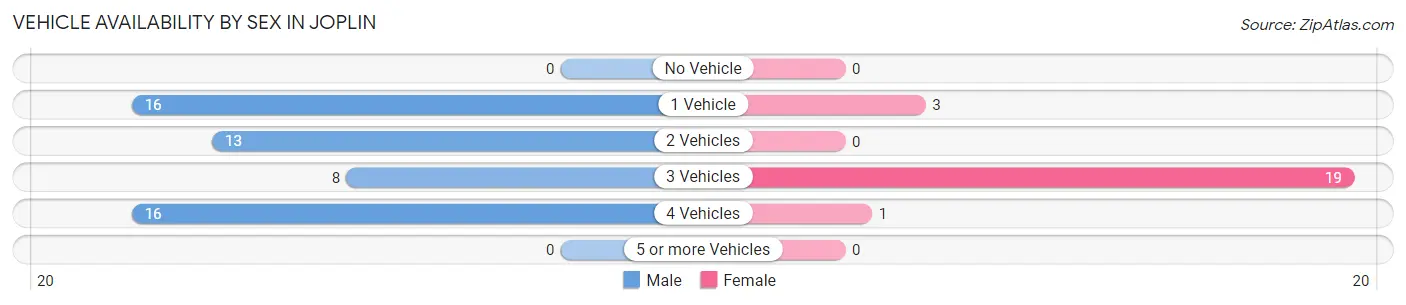
| Vehicles Available | Male | Female |
| No Vehicle | 0 (0.0%) | 0 (0.0%) |
| 1 Vehicle | 16 (30.2%) | 3 (13.0%) |
| 2 Vehicles | 13 (24.5%) | 0 (0.0%) |
| 3 Vehicles | 8 (15.1%) | 19 (82.6%) |
| 4 Vehicles | 16 (30.2%) | 1 (4.3%) |
| 5 or more Vehicles | 0 (0.0%) | 0 (0.0%) |
| Total | 53 (100.0%) | 23 (100.0%) |
Commute Time in Joplin
The most frequently occuring commute durations in Joplin are 20 to 24 minutes (37 commuters, 61.7%), 15 to 19 minutes (20 commuters, 33.3%), and 45 to 59 minutes (3 commuters, 5.0%).
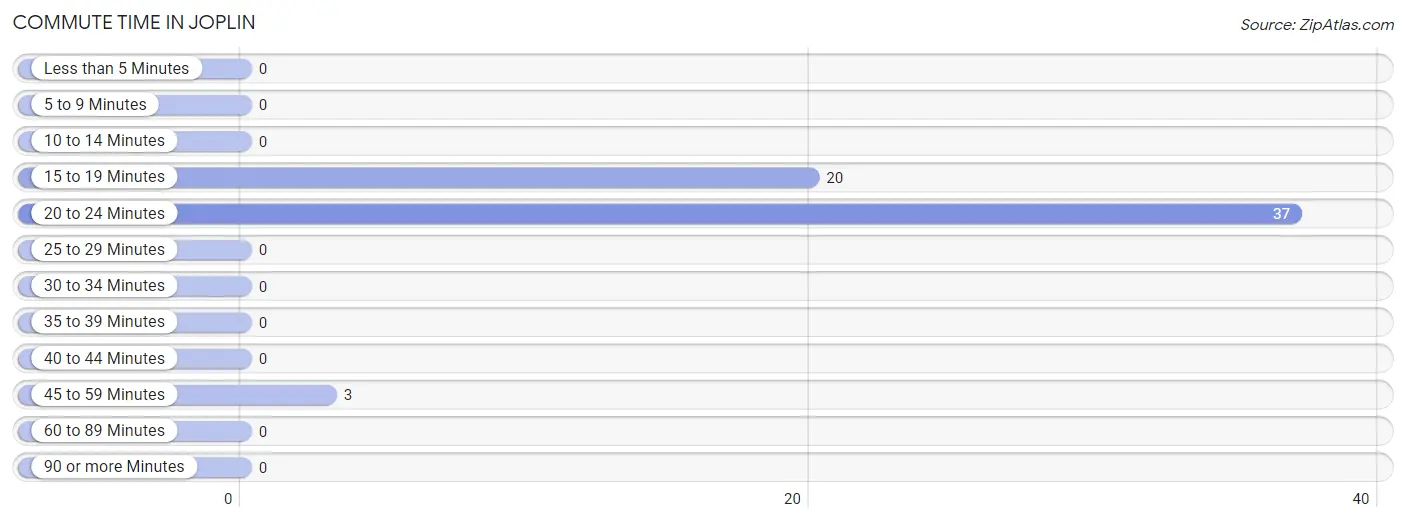
| Commute Time | # Commuters | % Commuters |
| Less than 5 Minutes | 0 | 0.0% |
| 5 to 9 Minutes | 0 | 0.0% |
| 10 to 14 Minutes | 0 | 0.0% |
| 15 to 19 Minutes | 20 | 33.3% |
| 20 to 24 Minutes | 37 | 61.7% |
| 25 to 29 Minutes | 0 | 0.0% |
| 30 to 34 Minutes | 0 | 0.0% |
| 35 to 39 Minutes | 0 | 0.0% |
| 40 to 44 Minutes | 0 | 0.0% |
| 45 to 59 Minutes | 3 | 5.0% |
| 60 to 89 Minutes | 0 | 0.0% |
| 90 or more Minutes | 0 | 0.0% |
Commute Time by Sex in Joplin
The most common commute times in Joplin are 20 to 24 minutes (19 commuters, 51.3%) for males and 20 to 24 minutes (18 commuters, 78.3%) for females.
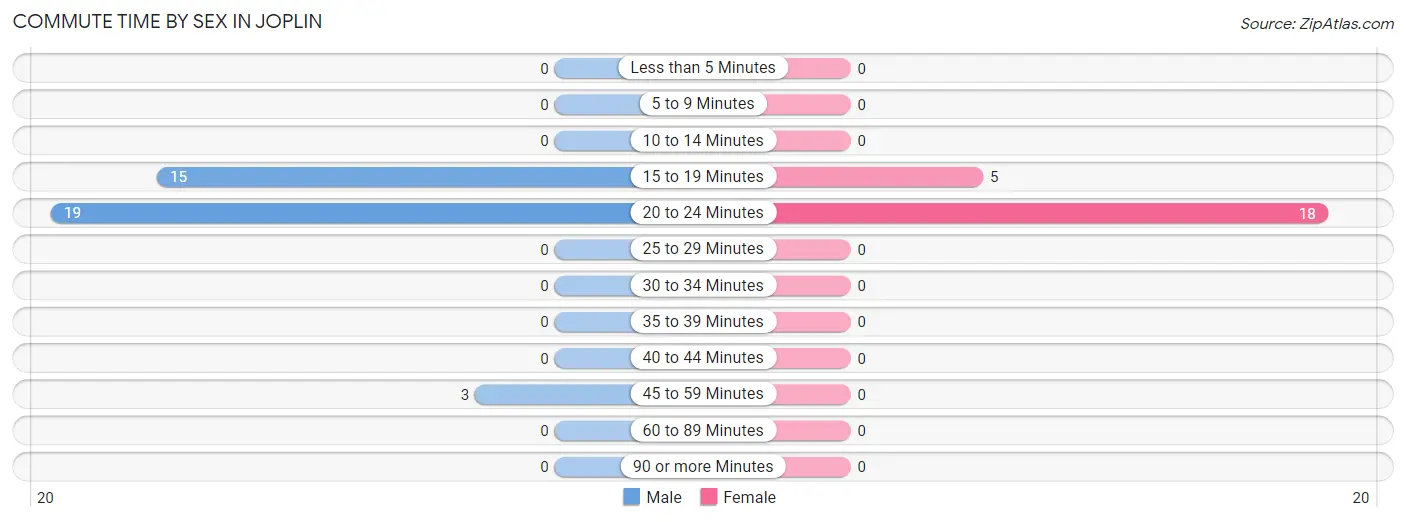
| Commute Time | Male | Female |
| Less than 5 Minutes | 0 (0.0%) | 0 (0.0%) |
| 5 to 9 Minutes | 0 (0.0%) | 0 (0.0%) |
| 10 to 14 Minutes | 0 (0.0%) | 0 (0.0%) |
| 15 to 19 Minutes | 15 (40.5%) | 5 (21.7%) |
| 20 to 24 Minutes | 19 (51.3%) | 18 (78.3%) |
| 25 to 29 Minutes | 0 (0.0%) | 0 (0.0%) |
| 30 to 34 Minutes | 0 (0.0%) | 0 (0.0%) |
| 35 to 39 Minutes | 0 (0.0%) | 0 (0.0%) |
| 40 to 44 Minutes | 0 (0.0%) | 0 (0.0%) |
| 45 to 59 Minutes | 3 (8.1%) | 0 (0.0%) |
| 60 to 89 Minutes | 0 (0.0%) | 0 (0.0%) |
| 90 or more Minutes | 0 (0.0%) | 0 (0.0%) |
Time of Departure to Work by Sex in Joplin
The most frequent times of departure to work in Joplin are 7:00 AM to 7:29 AM (18, 48.6%) for males and 8:30 AM to 8:59 AM (22, 95.7%) for females.
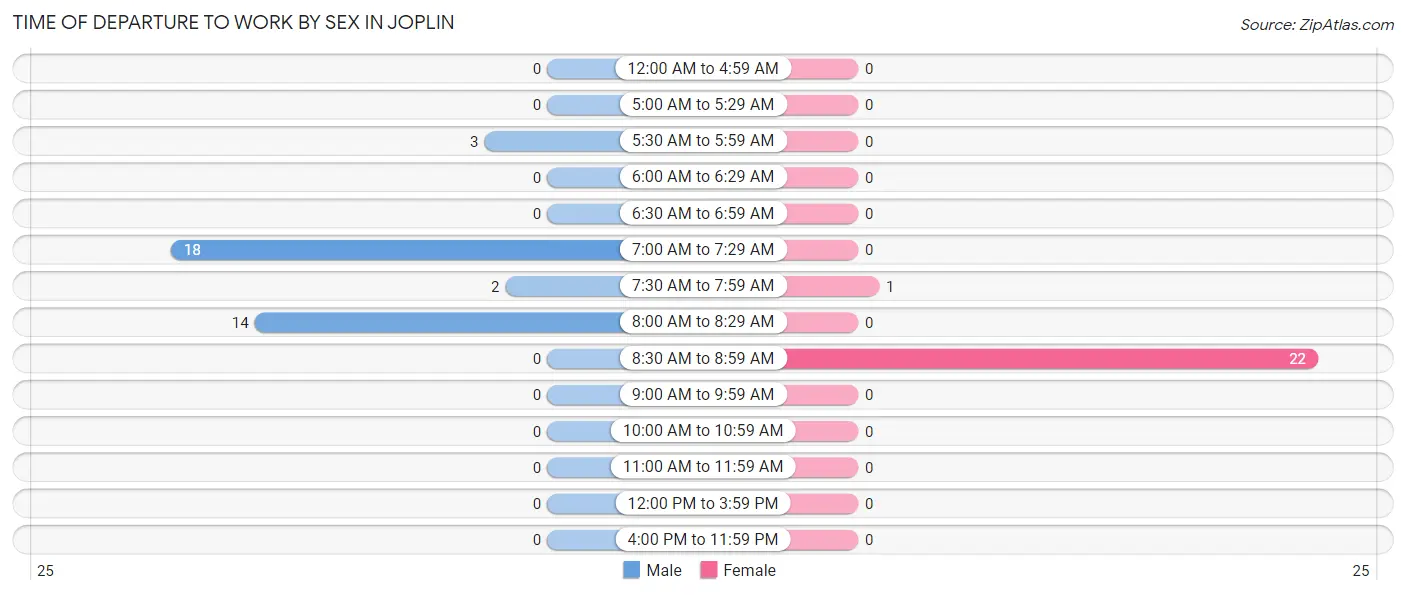
| Time of Departure | Male | Female |
| 12:00 AM to 4:59 AM | 0 (0.0%) | 0 (0.0%) |
| 5:00 AM to 5:29 AM | 0 (0.0%) | 0 (0.0%) |
| 5:30 AM to 5:59 AM | 3 (8.1%) | 0 (0.0%) |
| 6:00 AM to 6:29 AM | 0 (0.0%) | 0 (0.0%) |
| 6:30 AM to 6:59 AM | 0 (0.0%) | 0 (0.0%) |
| 7:00 AM to 7:29 AM | 18 (48.6%) | 0 (0.0%) |
| 7:30 AM to 7:59 AM | 2 (5.4%) | 1 (4.3%) |
| 8:00 AM to 8:29 AM | 14 (37.8%) | 0 (0.0%) |
| 8:30 AM to 8:59 AM | 0 (0.0%) | 22 (95.7%) |
| 9:00 AM to 9:59 AM | 0 (0.0%) | 0 (0.0%) |
| 10:00 AM to 10:59 AM | 0 (0.0%) | 0 (0.0%) |
| 11:00 AM to 11:59 AM | 0 (0.0%) | 0 (0.0%) |
| 12:00 PM to 3:59 PM | 0 (0.0%) | 0 (0.0%) |
| 4:00 PM to 11:59 PM | 0 (0.0%) | 0 (0.0%) |
| Total | 37 (100.0%) | 23 (100.0%) |
Housing Occupancy in Joplin
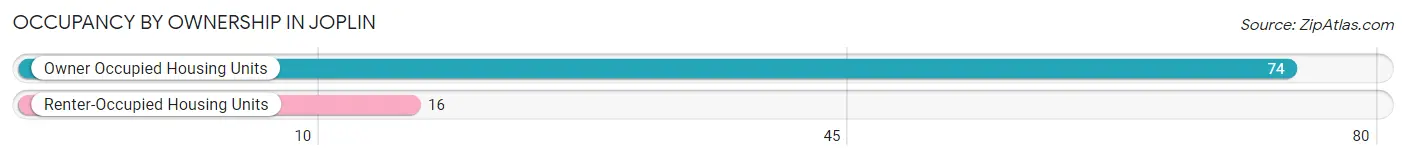
Occupancy by Ownership in Joplin
Of the total 90 dwellings in Joplin, owner-occupied units account for 74 (82.2%), while renter-occupied units make up 16 (17.8%).
| Occupancy | # Housing Units | % Housing Units |
| Owner Occupied Housing Units | 74 | 82.2% |
| Renter-Occupied Housing Units | 16 | 17.8% |
| Total Occupied Housing Units | 90 | 100.0% |
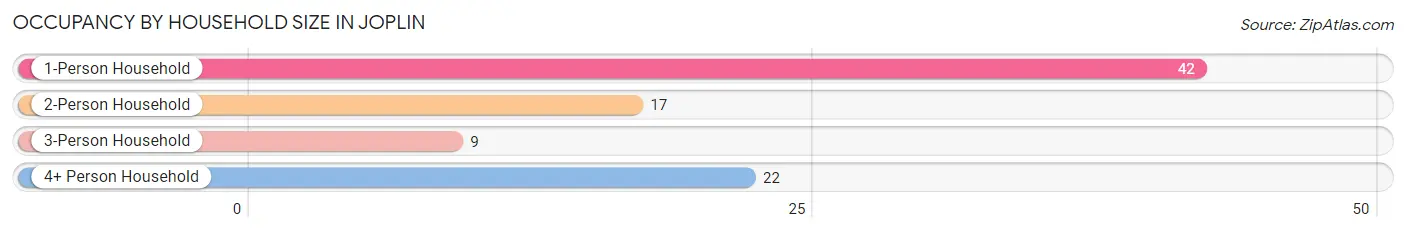
Occupancy by Household Size in Joplin
| Household Size | # Housing Units | % Housing Units |
| 1-Person Household | 42 | 46.7% |
| 2-Person Household | 17 | 18.9% |
| 3-Person Household | 9 | 10.0% |
| 4+ Person Household | 22 | 24.4% |
| Total Housing Units | 90 | 100.0% |
Occupancy by Ownership by Household Size in Joplin
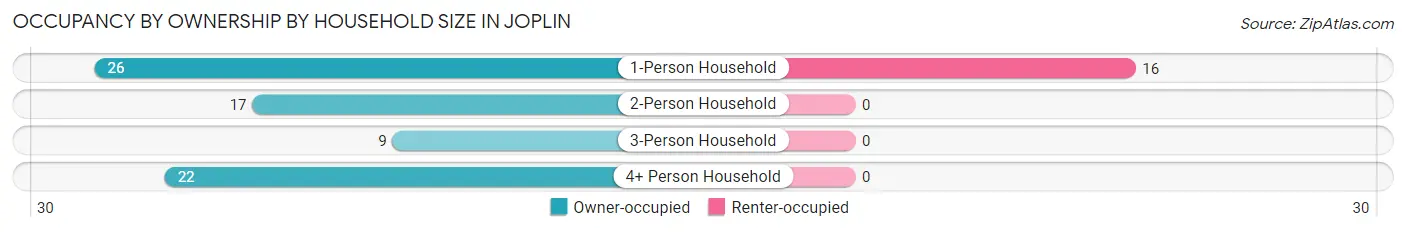
| Household Size | Owner-occupied | Renter-occupied |
| 1-Person Household | 26 (61.9%) | 16 (38.1%) |
| 2-Person Household | 17 (100.0%) | 0 (0.0%) |
| 3-Person Household | 9 (100.0%) | 0 (0.0%) |
| 4+ Person Household | 22 (100.0%) | 0 (0.0%) |
| Total Housing Units | 74 (82.2%) | 16 (17.8%) |
Occupancy by Educational Attainment in Joplin
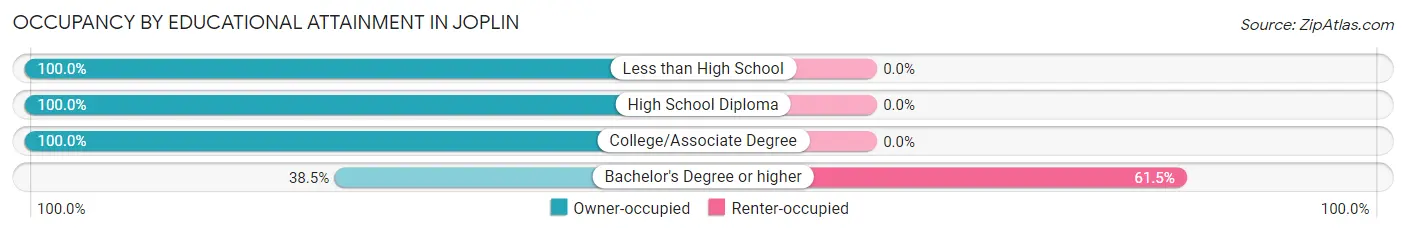
| Household Size | Owner-occupied | Renter-occupied |
| Less than High School | 8 (100.0%) | 0 (0.0%) |
| High School Diploma | 16 (100.0%) | 0 (0.0%) |
| College/Associate Degree | 40 (100.0%) | 0 (0.0%) |
| Bachelor's Degree or higher | 10 (38.5%) | 16 (61.5%) |
Occupancy by Age of Householder in Joplin
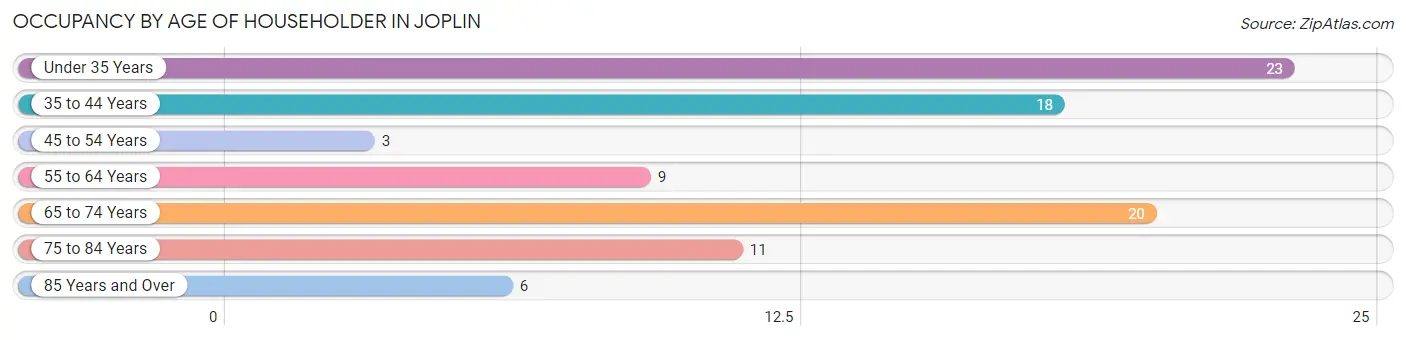
| Age Bracket | # Households | % Households |
| Under 35 Years | 23 | 25.6% |
| 35 to 44 Years | 18 | 20.0% |
| 45 to 54 Years | 3 | 3.3% |
| 55 to 64 Years | 9 | 10.0% |
| 65 to 74 Years | 20 | 22.2% |
| 75 to 84 Years | 11 | 12.2% |
| 85 Years and Over | 6 | 6.7% |
| Total | 90 | 100.0% |
Housing Finances in Joplin
Median Income by Occupancy in Joplin
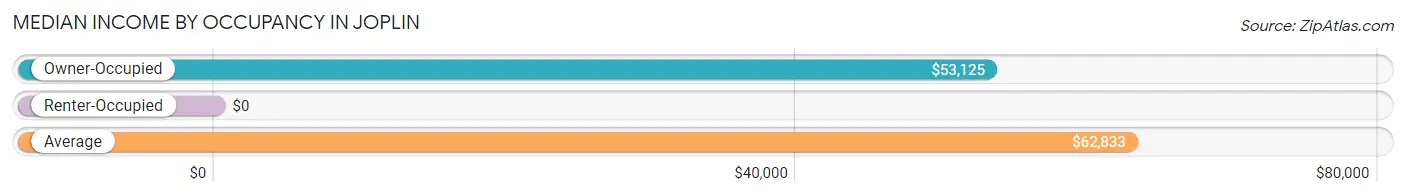
| Occupancy Type | # Households | Median Income |
| Owner-Occupied | 74 (82.2%) | $53,125 |
| Renter-Occupied | 16 (17.8%) | $0 |
| Average | 90 (100.0%) | $62,833 |
Occupancy by Householder Income Bracket in Joplin
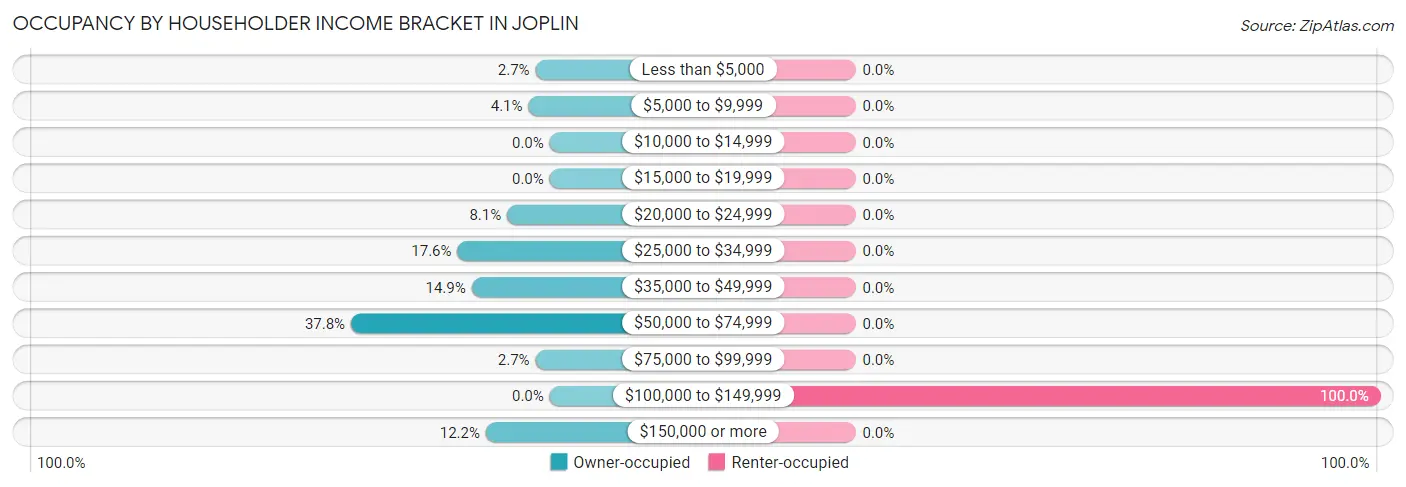
| Income Bracket | Owner-occupied | Renter-occupied |
| Less than $5,000 | 2 (2.7%) | 0 (0.0%) |
| $5,000 to $9,999 | 3 (4.1%) | 0 (0.0%) |
| $10,000 to $14,999 | 0 (0.0%) | 0 (0.0%) |
| $15,000 to $19,999 | 0 (0.0%) | 0 (0.0%) |
| $20,000 to $24,999 | 6 (8.1%) | 0 (0.0%) |
| $25,000 to $34,999 | 13 (17.6%) | 0 (0.0%) |
| $35,000 to $49,999 | 11 (14.9%) | 0 (0.0%) |
| $50,000 to $74,999 | 28 (37.8%) | 0 (0.0%) |
| $75,000 to $99,999 | 2 (2.7%) | 0 (0.0%) |
| $100,000 to $149,999 | 0 (0.0%) | 16 (100.0%) |
| $150,000 or more | 9 (12.2%) | 0 (0.0%) |
| Total | 74 (100.0%) | 16 (100.0%) |
Monthly Housing Cost Tiers in Joplin
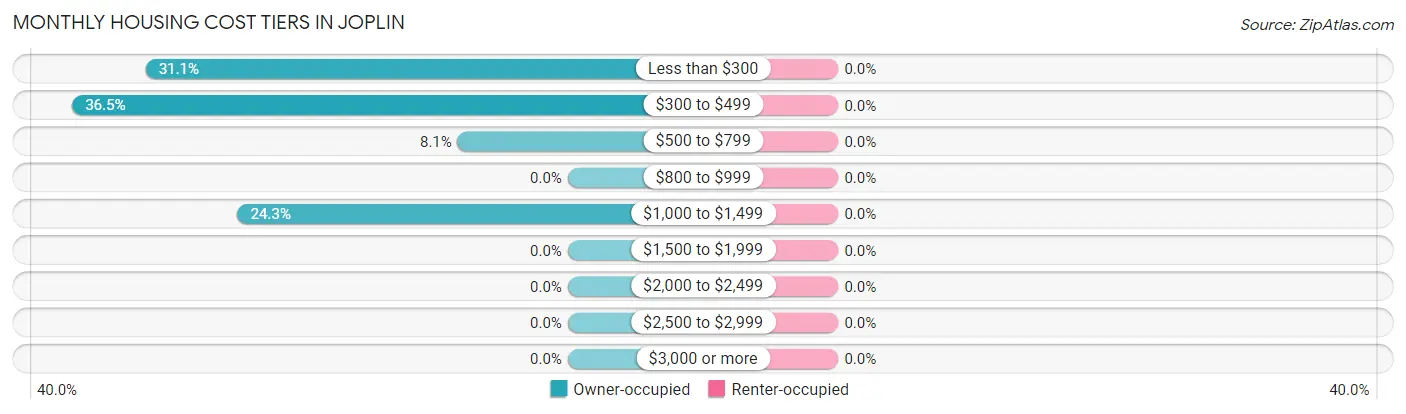
| Monthly Cost | Owner-occupied | Renter-occupied |
| Less than $300 | 23 (31.1%) | 0 (0.0%) |
| $300 to $499 | 27 (36.5%) | 0 (0.0%) |
| $500 to $799 | 6 (8.1%) | 0 (0.0%) |
| $800 to $999 | 0 (0.0%) | 0 (0.0%) |
| $1,000 to $1,499 | 18 (24.3%) | 0 (0.0%) |
| $1,500 to $1,999 | 0 (0.0%) | 0 (0.0%) |
| $2,000 to $2,499 | 0 (0.0%) | 0 (0.0%) |
| $2,500 to $2,999 | 0 (0.0%) | 0 (0.0%) |
| $3,000 or more | 0 (0.0%) | 0 (0.0%) |
| Total | 74 (100.0%) | 16 (100.0%) |
Physical Housing Characteristics in Joplin
Housing Structures in Joplin
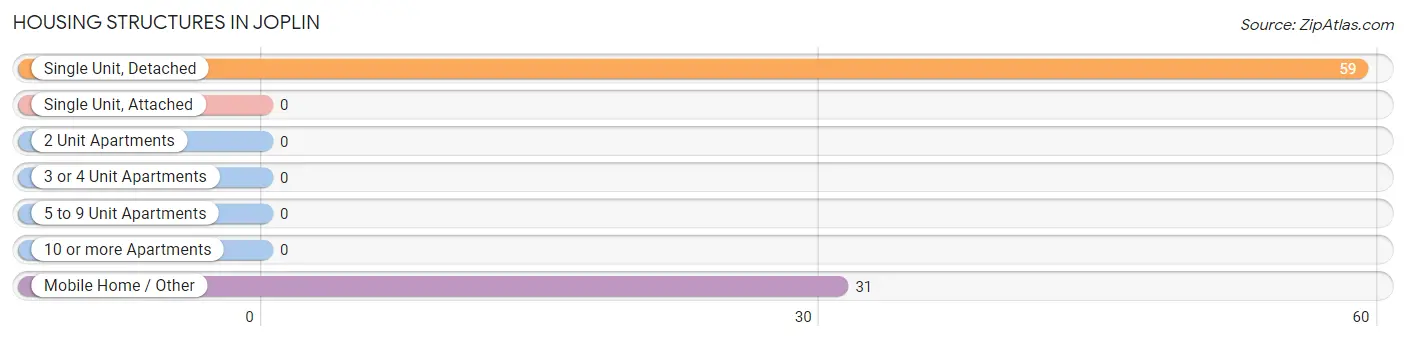
| Structure Type | # Housing Units | % Housing Units |
| Single Unit, Detached | 59 | 65.6% |
| Single Unit, Attached | 0 | 0.0% |
| 2 Unit Apartments | 0 | 0.0% |
| 3 or 4 Unit Apartments | 0 | 0.0% |
| 5 to 9 Unit Apartments | 0 | 0.0% |
| 10 or more Apartments | 0 | 0.0% |
| Mobile Home / Other | 31 | 34.4% |
| Total | 90 | 100.0% |
Housing Structures by Occupancy in Joplin
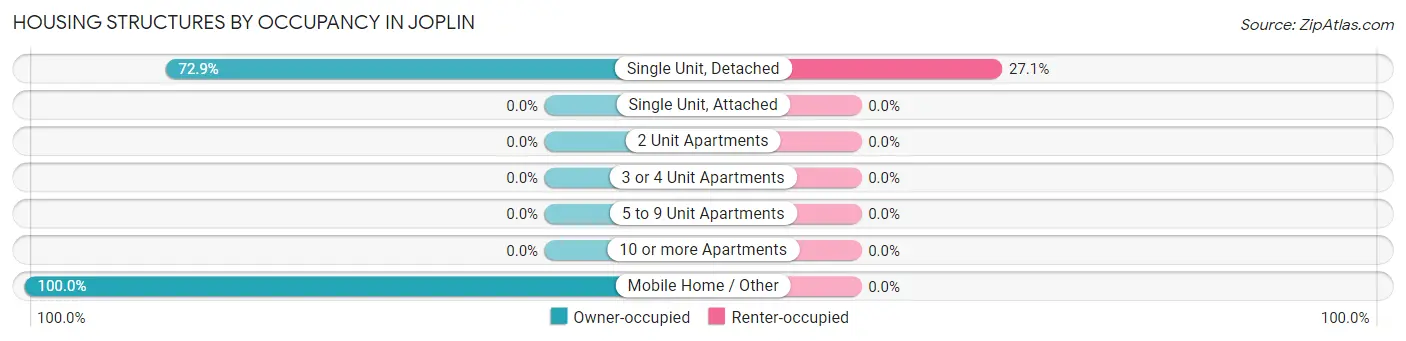
| Structure Type | Owner-occupied | Renter-occupied |
| Single Unit, Detached | 43 (72.9%) | 16 (27.1%) |
| Single Unit, Attached | 0 (0.0%) | 0 (0.0%) |
| 2 Unit Apartments | 0 (0.0%) | 0 (0.0%) |
| 3 or 4 Unit Apartments | 0 (0.0%) | 0 (0.0%) |
| 5 to 9 Unit Apartments | 0 (0.0%) | 0 (0.0%) |
| 10 or more Apartments | 0 (0.0%) | 0 (0.0%) |
| Mobile Home / Other | 31 (100.0%) | 0 (0.0%) |
| Total | 74 (82.2%) | 16 (17.8%) |
Housing Structures by Number of Rooms in Joplin
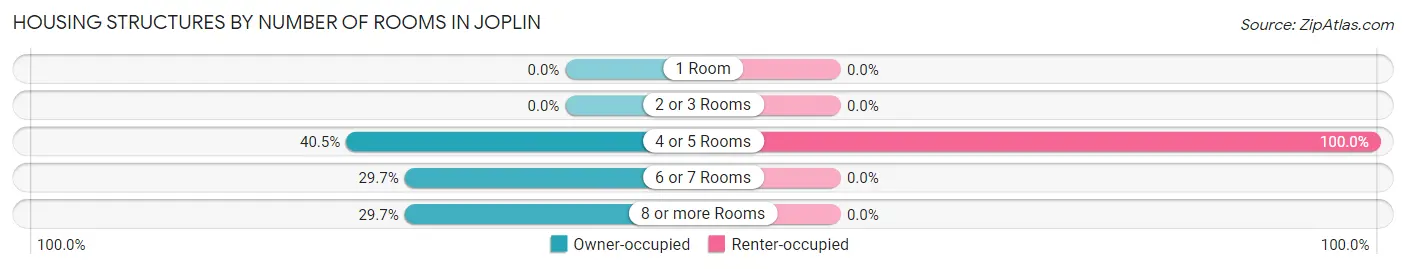
| Number of Rooms | Owner-occupied | Renter-occupied |
| 1 Room | 0 (0.0%) | 0 (0.0%) |
| 2 or 3 Rooms | 0 (0.0%) | 0 (0.0%) |
| 4 or 5 Rooms | 30 (40.5%) | 16 (100.0%) |
| 6 or 7 Rooms | 22 (29.7%) | 0 (0.0%) |
| 8 or more Rooms | 22 (29.7%) | 0 (0.0%) |
| Total | 74 (100.0%) | 16 (100.0%) |
Housing Structure by Heating Type in Joplin
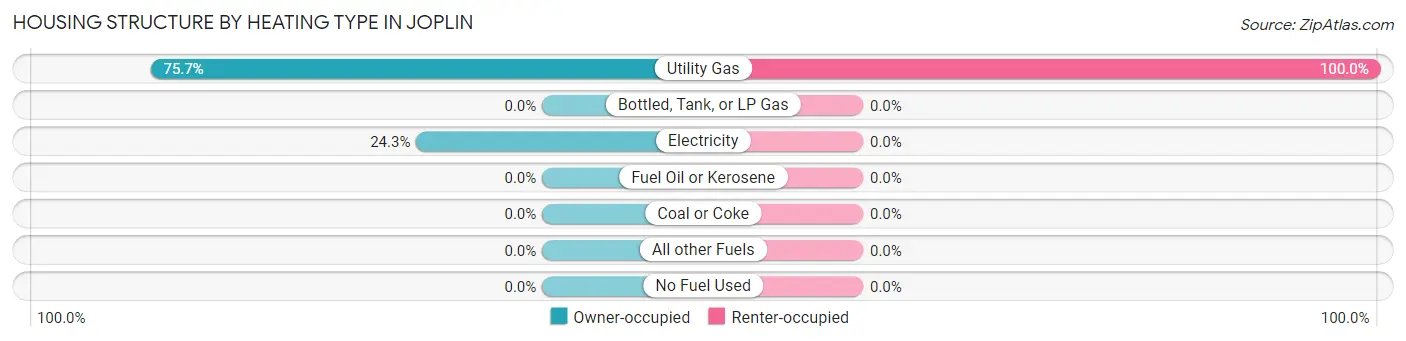
| Heating Type | Owner-occupied | Renter-occupied |
| Utility Gas | 56 (75.7%) | 16 (100.0%) |
| Bottled, Tank, or LP Gas | 0 (0.0%) | 0 (0.0%) |
| Electricity | 18 (24.3%) | 0 (0.0%) |
| Fuel Oil or Kerosene | 0 (0.0%) | 0 (0.0%) |
| Coal or Coke | 0 (0.0%) | 0 (0.0%) |
| All other Fuels | 0 (0.0%) | 0 (0.0%) |
| No Fuel Used | 0 (0.0%) | 0 (0.0%) |
| Total | 74 (100.0%) | 16 (100.0%) |
Household Vehicle Usage in Joplin
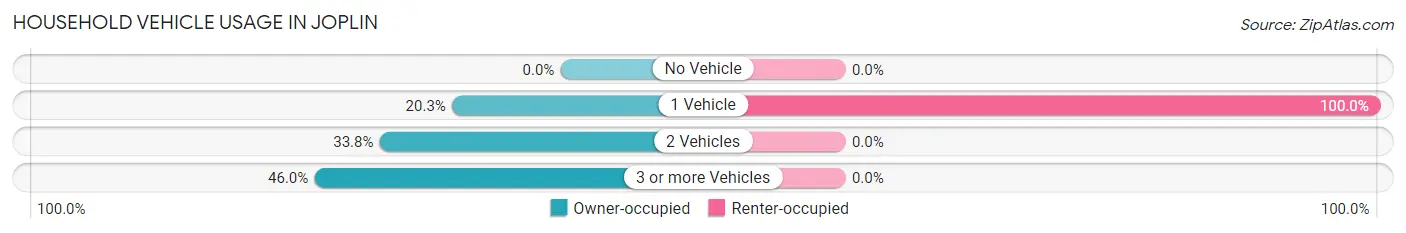
| Vehicles per Household | Owner-occupied | Renter-occupied |
| No Vehicle | 0 (0.0%) | 0 (0.0%) |
| 1 Vehicle | 15 (20.3%) | 16 (100.0%) |
| 2 Vehicles | 25 (33.8%) | 0 (0.0%) |
| 3 or more Vehicles | 34 (46.0%) | 0 (0.0%) |
| Total | 74 (100.0%) | 16 (100.0%) |
Real Estate & Mortgages in Joplin
Real Estate and Mortgage Overview in Joplin
| Characteristic | Without Mortgage | With Mortgage |
| Housing Units | 53 | 21 |
| Median Property Value | - | - |
| Median Household Income | $39,792 | $3 |
| Monthly Housing Costs | $322 | $0 |
| Real Estate Taxes | $1,038 | $0 |
Property Value by Mortgage Status in Joplin
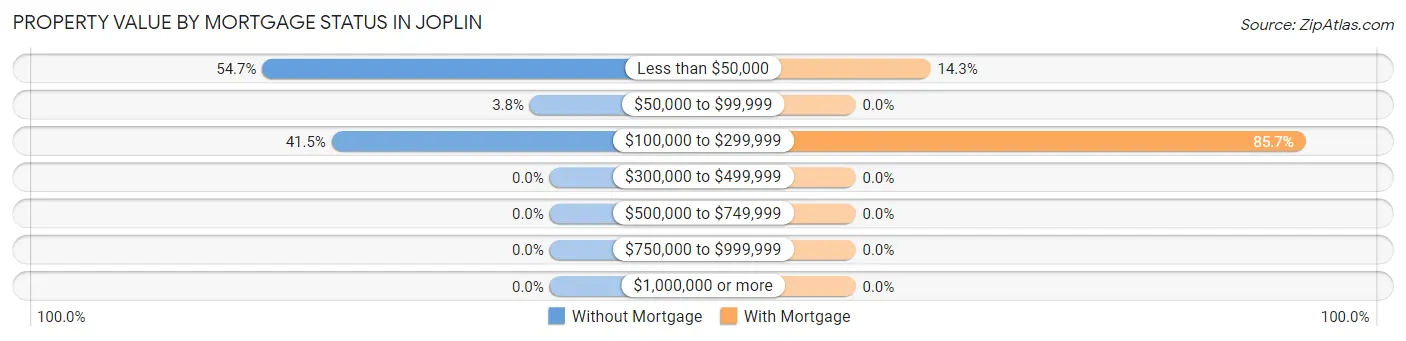
| Property Value | Without Mortgage | With Mortgage |
| Less than $50,000 | 29 (54.7%) | 3 (14.3%) |
| $50,000 to $99,999 | 2 (3.8%) | 0 (0.0%) |
| $100,000 to $299,999 | 22 (41.5%) | 18 (85.7%) |
| $300,000 to $499,999 | 0 (0.0%) | 0 (0.0%) |
| $500,000 to $749,999 | 0 (0.0%) | 0 (0.0%) |
| $750,000 to $999,999 | 0 (0.0%) | 0 (0.0%) |
| $1,000,000 or more | 0 (0.0%) | 0 (0.0%) |
| Total | 53 (100.0%) | 21 (100.0%) |
Household Income by Mortgage Status in Joplin
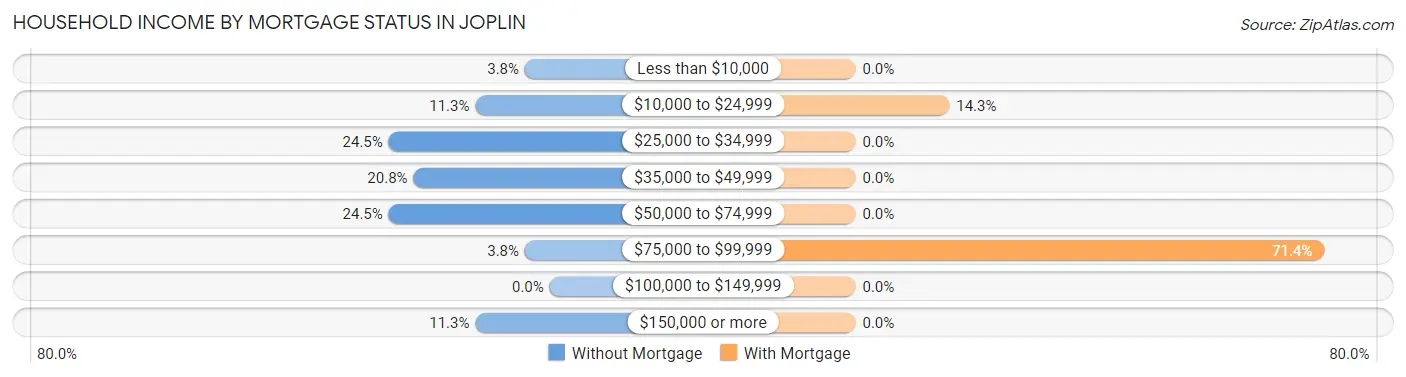
| Household Income | Without Mortgage | With Mortgage |
| Less than $10,000 | 2 (3.8%) | 0 (0.0%) |
| $10,000 to $24,999 | 6 (11.3%) | 3 (14.3%) |
| $25,000 to $34,999 | 13 (24.5%) | 0 (0.0%) |
| $35,000 to $49,999 | 11 (20.7%) | 0 (0.0%) |
| $50,000 to $74,999 | 13 (24.5%) | 0 (0.0%) |
| $75,000 to $99,999 | 2 (3.8%) | 15 (71.4%) |
| $100,000 to $149,999 | 0 (0.0%) | 0 (0.0%) |
| $150,000 or more | 6 (11.3%) | 0 (0.0%) |
| Total | 53 (100.0%) | 21 (100.0%) |
Property Value to Household Income Ratio in Joplin
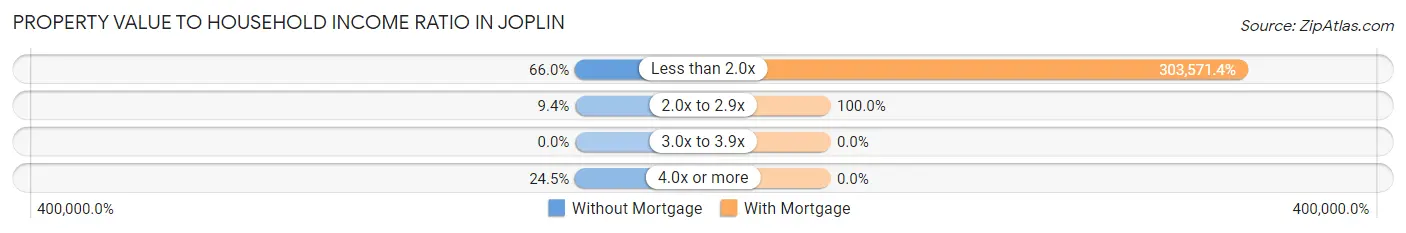
| Value-to-Income Ratio | Without Mortgage | With Mortgage |
| Less than 2.0x | 35 (66.0%) | 63,750 (303,571.4%) |
| 2.0x to 2.9x | 5 (9.4%) | 21 (100.0%) |
| 3.0x to 3.9x | 0 (0.0%) | 0 (0.0%) |
| 4.0x or more | 13 (24.5%) | 0 (0.0%) |
| Total | 53 (100.0%) | 21 (100.0%) |
Real Estate Taxes by Mortgage Status in Joplin
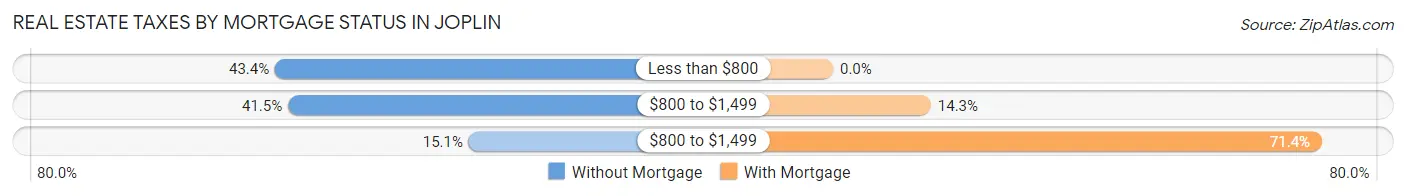
| Property Taxes | Without Mortgage | With Mortgage |
| Less than $800 | 23 (43.4%) | 0 (0.0%) |
| $800 to $1,499 | 22 (41.5%) | 3 (14.3%) |
| $800 to $1,499 | 8 (15.1%) | 15 (71.4%) |
| Total | 53 (100.0%) | 21 (100.0%) |
Health & Disability in Joplin
Health Insurance Coverage by Age in Joplin
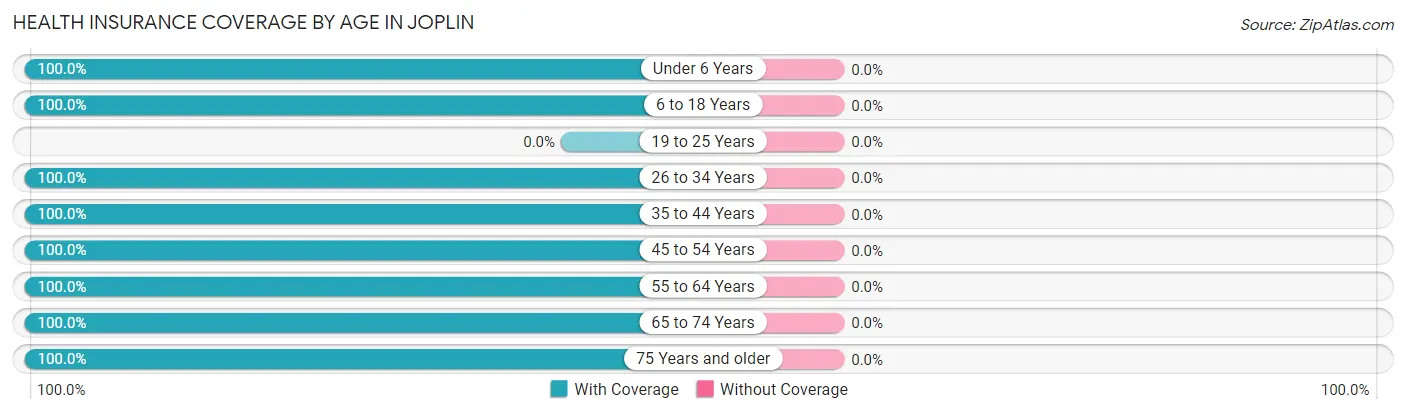
| Age Bracket | With Coverage | Without Coverage |
| Under 6 Years | 41 (100.0%) | 0 (0.0%) |
| 6 to 18 Years | 56 (100.0%) | 0 (0.0%) |
| 19 to 25 Years | 0 (0.0%) | 0 (0.0%) |
| 26 to 34 Years | 24 (100.0%) | 0 (0.0%) |
| 35 to 44 Years | 64 (100.0%) | 0 (0.0%) |
| 45 to 54 Years | 6 (100.0%) | 0 (0.0%) |
| 55 to 64 Years | 27 (100.0%) | 0 (0.0%) |
| 65 to 74 Years | 20 (100.0%) | 0 (0.0%) |
| 75 Years and older | 23 (100.0%) | 0 (0.0%) |
| Total | 261 (100.0%) | 0 (0.0%) |
Health Insurance Coverage by Citizenship Status in Joplin
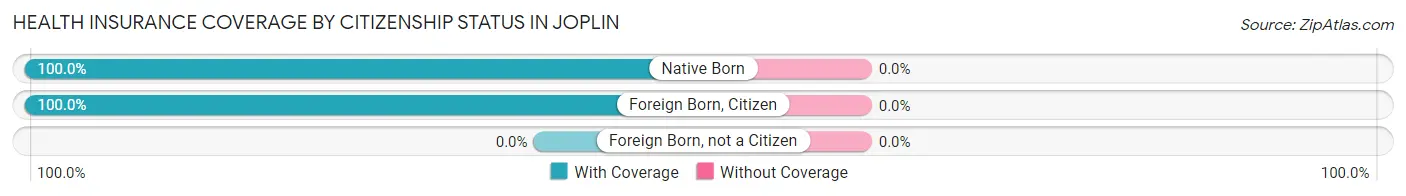
| Citizenship Status | With Coverage | Without Coverage |
| Native Born | 41 (100.0%) | 0 (0.0%) |
| Foreign Born, Citizen | 56 (100.0%) | 0 (0.0%) |
| Foreign Born, not a Citizen | 0 (0.0%) | 0 (0.0%) |
Health Insurance Coverage by Household Income in Joplin
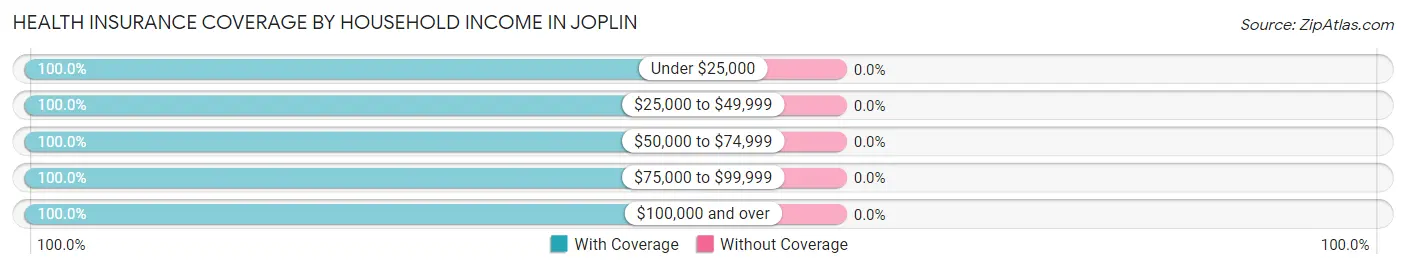
| Household Income | With Coverage | Without Coverage |
| Under $25,000 | 39 (100.0%) | 0 (0.0%) |
| $25,000 to $49,999 | 119 (100.0%) | 0 (0.0%) |
| $50,000 to $74,999 | 63 (100.0%) | 0 (0.0%) |
| $75,000 to $99,999 | 11 (100.0%) | 0 (0.0%) |
| $100,000 and over | 29 (100.0%) | 0 (0.0%) |
Public vs Private Health Insurance Coverage by Age in Joplin
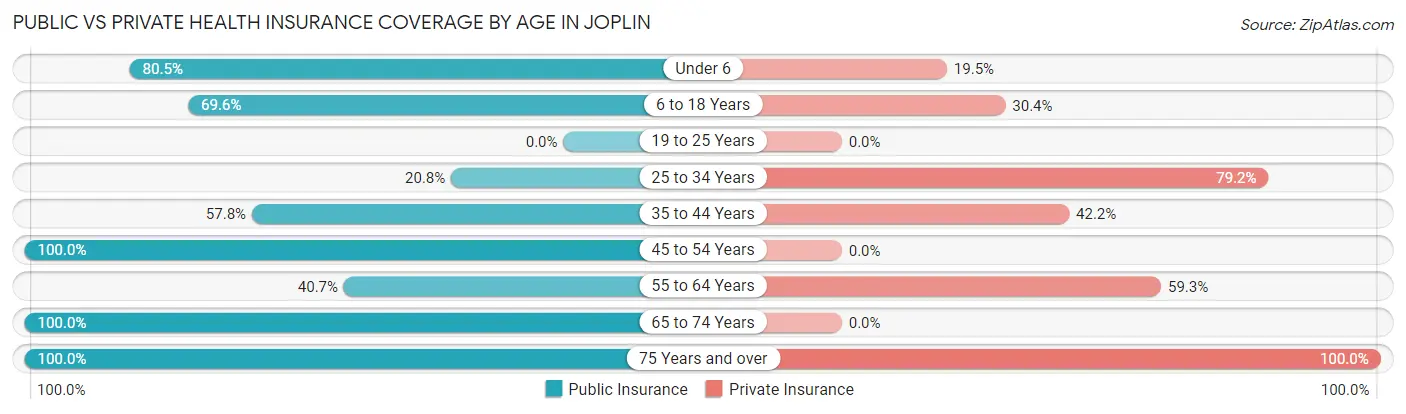
| Age Bracket | Public Insurance | Private Insurance |
| Under 6 | 33 (80.5%) | 8 (19.5%) |
| 6 to 18 Years | 39 (69.6%) | 17 (30.4%) |
| 19 to 25 Years | 0 (0.0%) | 0 (0.0%) |
| 25 to 34 Years | 5 (20.8%) | 19 (79.2%) |
| 35 to 44 Years | 37 (57.8%) | 27 (42.2%) |
| 45 to 54 Years | 6 (100.0%) | 0 (0.0%) |
| 55 to 64 Years | 11 (40.7%) | 16 (59.3%) |
| 65 to 74 Years | 20 (100.0%) | 0 (0.0%) |
| 75 Years and over | 23 (100.0%) | 23 (100.0%) |
| Total | 174 (66.7%) | 110 (42.1%) |
Disability Status by Sex by Age in Joplin
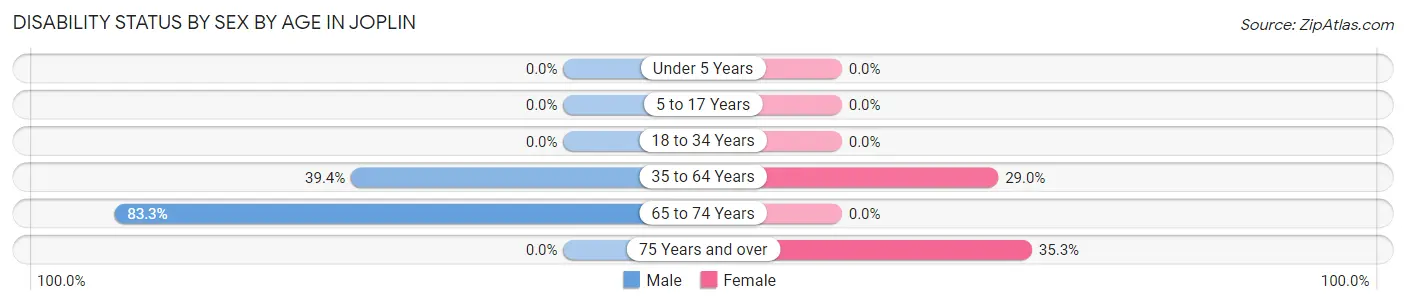
| Age Bracket | Male | Female |
| Under 5 Years | 0 (0.0%) | 0 (0.0%) |
| 5 to 17 Years | 0 (0.0%) | 0 (0.0%) |
| 18 to 34 Years | 0 (0.0%) | 0 (0.0%) |
| 35 to 64 Years | 26 (39.4%) | 9 (29.0%) |
| 65 to 74 Years | 10 (83.3%) | 0 (0.0%) |
| 75 Years and over | 0 (0.0%) | 6 (35.3%) |
Disability Class by Sex by Age in Joplin
Disability Class: Hearing Difficulty
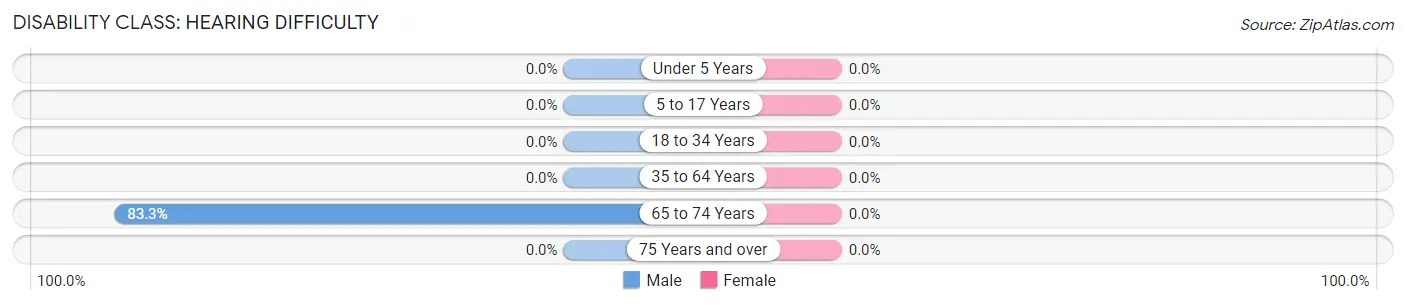
| Age Bracket | Male | Female |
| Under 5 Years | 0 (0.0%) | 0 (0.0%) |
| 5 to 17 Years | 0 (0.0%) | 0 (0.0%) |
| 18 to 34 Years | 0 (0.0%) | 0 (0.0%) |
| 35 to 64 Years | 0 (0.0%) | 0 (0.0%) |
| 65 to 74 Years | 10 (83.3%) | 0 (0.0%) |
| 75 Years and over | 0 (0.0%) | 0 (0.0%) |
Disability Class: Vision Difficulty
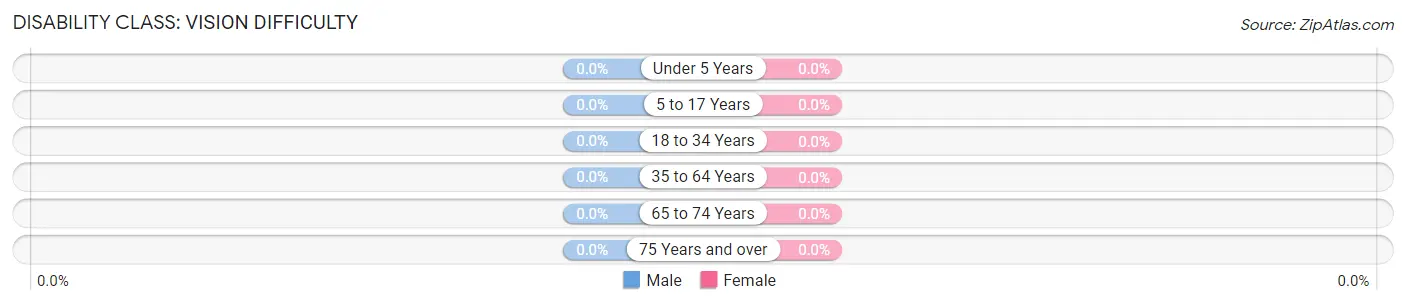
| Age Bracket | Male | Female |
| Under 5 Years | 0 (0.0%) | 0 (0.0%) |
| 5 to 17 Years | 0 (0.0%) | 0 (0.0%) |
| 18 to 34 Years | 0 (0.0%) | 0 (0.0%) |
| 35 to 64 Years | 0 (0.0%) | 0 (0.0%) |
| 65 to 74 Years | 0 (0.0%) | 0 (0.0%) |
| 75 Years and over | 0 (0.0%) | 0 (0.0%) |
Disability Class: Cognitive Difficulty
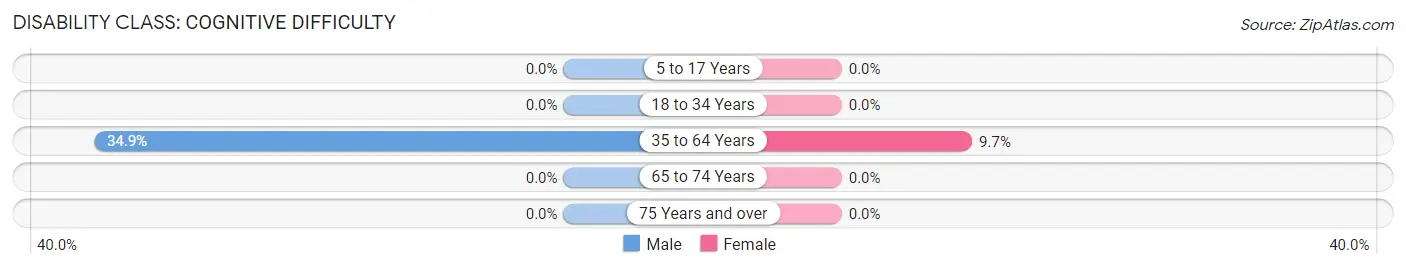
| Age Bracket | Male | Female |
| 5 to 17 Years | 0 (0.0%) | 0 (0.0%) |
| 18 to 34 Years | 0 (0.0%) | 0 (0.0%) |
| 35 to 64 Years | 23 (34.8%) | 3 (9.7%) |
| 65 to 74 Years | 0 (0.0%) | 0 (0.0%) |
| 75 Years and over | 0 (0.0%) | 0 (0.0%) |
Disability Class: Ambulatory Difficulty
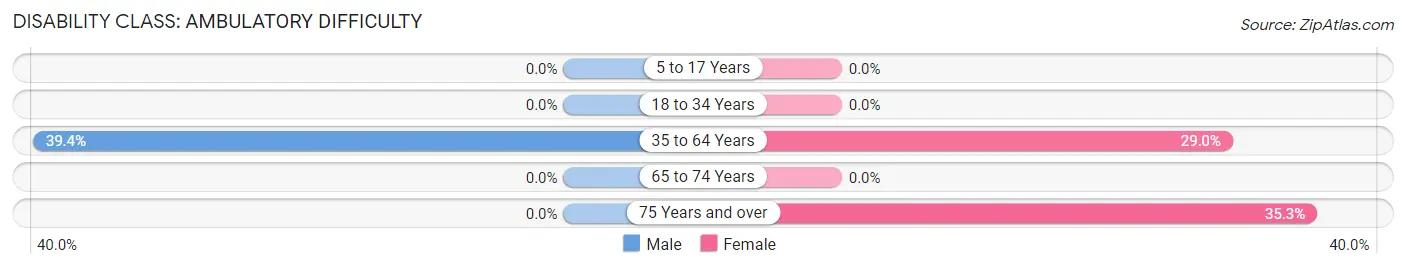
| Age Bracket | Male | Female |
| 5 to 17 Years | 0 (0.0%) | 0 (0.0%) |
| 18 to 34 Years | 0 (0.0%) | 0 (0.0%) |
| 35 to 64 Years | 26 (39.4%) | 9 (29.0%) |
| 65 to 74 Years | 0 (0.0%) | 0 (0.0%) |
| 75 Years and over | 0 (0.0%) | 6 (35.3%) |
Disability Class: Self-Care Difficulty
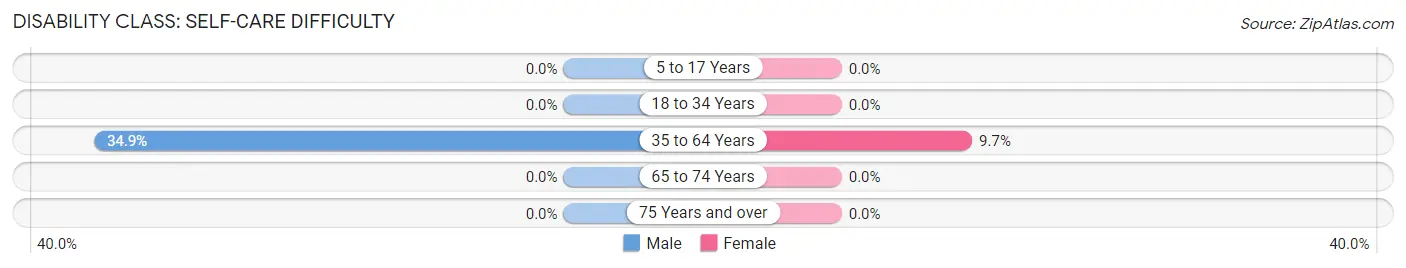
| Age Bracket | Male | Female |
| 5 to 17 Years | 0 (0.0%) | 0 (0.0%) |
| 18 to 34 Years | 0 (0.0%) | 0 (0.0%) |
| 35 to 64 Years | 23 (34.8%) | 3 (9.7%) |
| 65 to 74 Years | 0 (0.0%) | 0 (0.0%) |
| 75 Years and over | 0 (0.0%) | 0 (0.0%) |
Technology Access in Joplin
Computing Device Access in Joplin
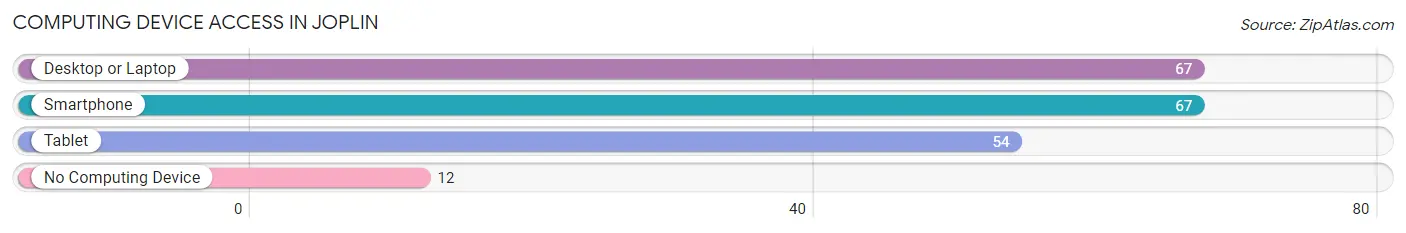
| Device Type | # Households | % Households |
| Desktop or Laptop | 67 | 74.4% |
| Smartphone | 67 | 74.4% |
| Tablet | 54 | 60.0% |
| No Computing Device | 12 | 13.3% |
| Total | 90 | 100.0% |
Internet Access in Joplin
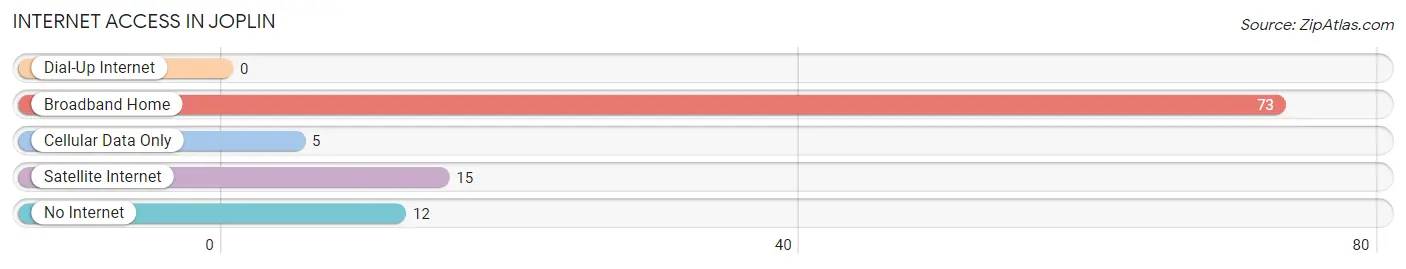
| Internet Type | # Households | % Households |
| Dial-Up Internet | 0 | 0.0% |
| Broadband Home | 73 | 81.1% |
| Cellular Data Only | 5 | 5.6% |
| Satellite Internet | 15 | 16.7% |
| No Internet | 12 | 13.3% |
| Total | 90 | 100.0% |
Joplin Summary
Joplin is a small town located in the state of Montana, in the United States. It is situated in the south-central part of the state, in the foothills of the Rocky Mountains. The town is located in the county of Carbon, and is part of the Billings Metropolitan Statistical Area. The population of Joplin was estimated to be 1,072 in 2019.
Geography
Joplin is located at an elevation of 4,890 feet (1,490 m) above sea level. It is situated in the foothills of the Rocky Mountains, and is surrounded by rolling hills and grasslands. The town is located in the Yellowstone River Valley, and is bordered by the Pryor Mountains to the south and the Beartooth Mountains to the north. The town is located approximately 25 miles (40 km) south of Billings, the largest city in Montana.
Climate
Joplin has a semi-arid climate, with hot summers and cold winters. The average high temperature in July is 85°F (29°C), and the average low temperature in January is 11°F (-12°C). The town receives an average of 16 inches (41 cm) of precipitation per year, with most of it falling in the form of snow.
History
Joplin was founded in 1882 by a group of settlers from the Midwest. The town was named after the Joplin family, who were among the first settlers in the area. The town quickly grew, and by the early 1900s, it had become a thriving agricultural and ranching community.
In the early 1900s, Joplin was a major stop on the Northern Pacific Railroad. The railroad brought in new settlers and businesses, and the town continued to grow. In the 1950s, the town was incorporated, and it has remained a small, rural community ever since.
Economy
The economy of Joplin is largely based on agriculture and ranching. The town is home to several large farms and ranches, and the surrounding area is known for its cattle and sheep production. The town also has a small manufacturing sector, with several small businesses producing a variety of products.
The town is also home to several small businesses, including restaurants, shops, and other services. The town is also home to a small airport, which serves the surrounding area.
Demographics
As of 2019, the population of Joplin was estimated to be 1,072. The town has a median age of 44.7 years, and the median household income is $45,938. The town is predominantly white, with 92.3% of the population identifying as white. The town also has a small Hispanic population, with 4.3% of the population identifying as Hispanic or Latino.
Conclusion
Joplin is a small town located in the state of Montana, in the United States. It is situated in the south-central part of the state, in the foothills of the Rocky Mountains. The town is known for its agricultural and ranching economy, and it has a population of 1,072 as of 2019. The town has a semi-arid climate, with hot summers and cold winters. The town is predominantly white, with 92.3% of the population identifying as white. The town is also home to several small businesses, including restaurants, shops, and other services.
Common Questions
What is Per Capita Income in Joplin?
Per Capita income in Joplin is $54,665.
What is the Median Family Income in Joplin?
Median Family Income in Joplin is $53,750.
What is the Median Household income in Joplin?
Median Household Income in Joplin is $62,833.
What is Inequality or Gini Index in Joplin?
Inequality or Gini Index in Joplin is 0.66.
What is the Total Population of Joplin?
Total Population of Joplin is 261.
What is the Total Male Population of Joplin?
Total Male Population of Joplin is 150.
What is the Total Female Population of Joplin?
Total Female Population of Joplin is 111.
What is the Ratio of Males per 100 Females in Joplin?
There are 135.14 Males per 100 Females in Joplin.
What is the Ratio of Females per 100 Males in Joplin?
There are 74.00 Females per 100 Males in Joplin.
What is the Median Population Age in Joplin?
Median Population Age in Joplin is 36.2 Years.
What is the Average Family Size in Joplin
Average Family Size in Joplin is 4.3 People.
What is the Average Household Size in Joplin
Average Household Size in Joplin is 2.9 People.
How Large is the Labor Force in Joplin?
There are 76 People in the Labor Forcein in Joplin.
What is the Percentage of People in the Labor Force in Joplin?
46.3% of People are in the Labor Force in Joplin.