Zip Codes with the Highest Percentage of Population with a Degree in Science and Engineering in Billings, MT
RELATED REPORTS & OPTIONS
Science and Engineering
Billings
Compare Zip Codes
Map of Zip Codes with the Highest Percentage of Population with a Degree in Science and Engineering in Billings
11.6%
17.2%
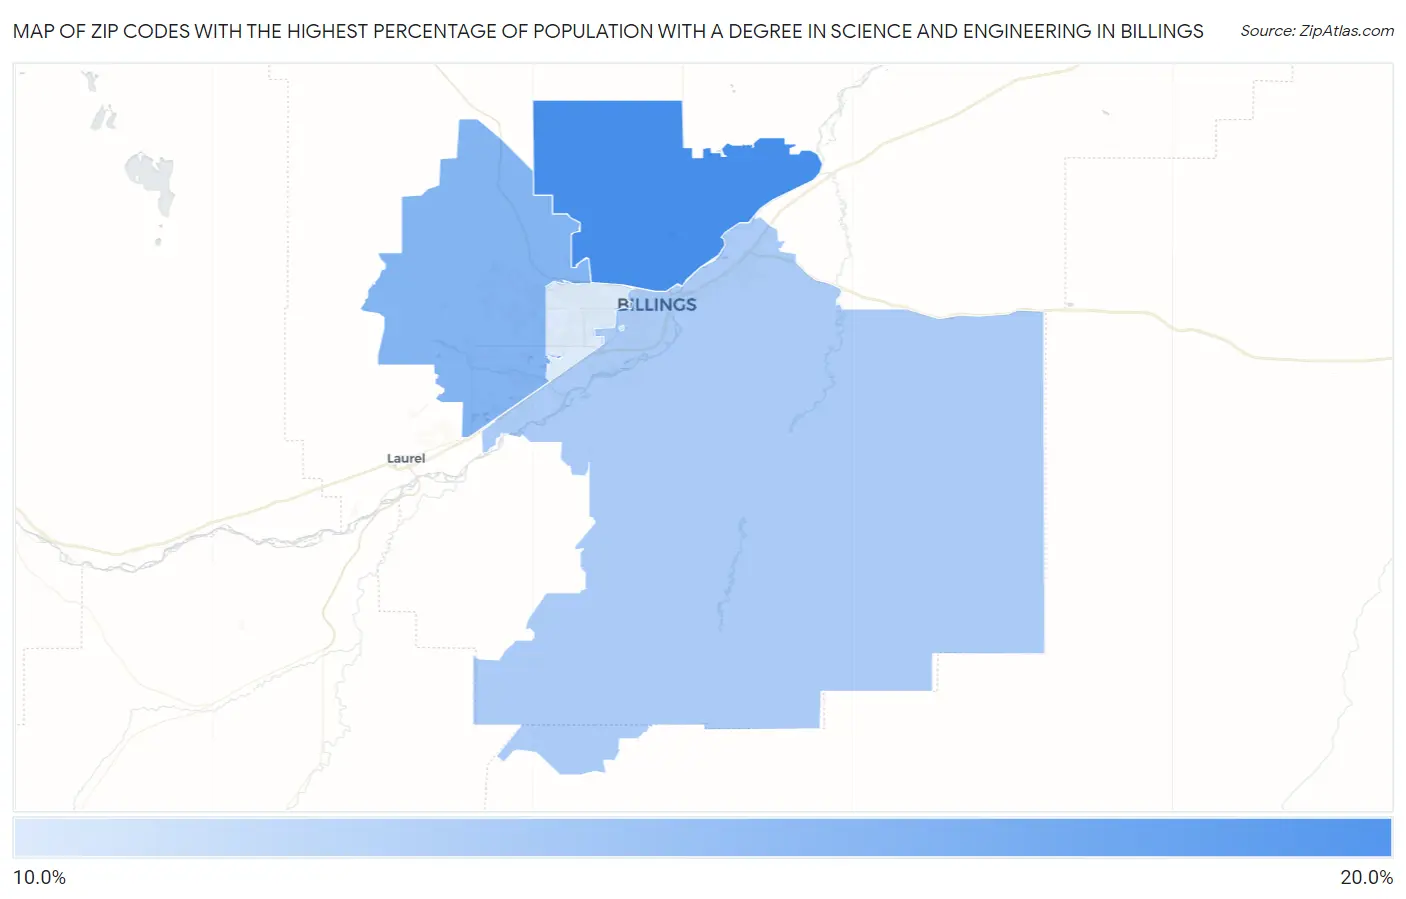
Zip Codes with the Highest Percentage of Population with a Degree in Science and Engineering in Billings, MT
| Zip Code | % Graduates | vs State | vs National | |
| 1. | 59105 | 17.2% | 11.0%(+6.16)#59 | 9.8%(+7.40)#4,796 |
| 2. | 59106 | 14.9% | 11.0%(+3.90)#77 | 9.8%(+5.14)#6,795 |
| 3. | 59101 | 13.5% | 11.0%(+2.45)#96 | 9.8%(+3.69)#8,539 |
| 4. | 59102 | 11.6% | 11.0%(+0.543)#123 | 9.8%(+1.78)#11,719 |
1
Common Questions
What are the Top 3 Zip Codes with the Highest Percentage of Population with a Degree in Science and Engineering in Billings, MT?
Top 3 Zip Codes with the Highest Percentage of Population with a Degree in Science and Engineering in Billings, MT are:
What zip code has the Highest Percentage of Population with a Degree in Science and Engineering in Billings, MT?
59105 has the Highest Percentage of Population with a Degree in Science and Engineering in Billings, MT with 17.2%.
What is the Percentage of Population with a Degree in Science and Engineering in Billings, MT?
Percentage of Population with a Degree in Science and Engineering in Billings is 13.9%.
What is the Percentage of Population with a Degree in Science and Engineering in Montana?
Percentage of Population with a Degree in Science and Engineering in Montana is 11.0%.
What is the Percentage of Population with a Degree in Science and Engineering in the United States?
Percentage of Population with a Degree in Science and Engineering in the United States is 9.8%.