Lewistown Heights, MT Map & Demographics
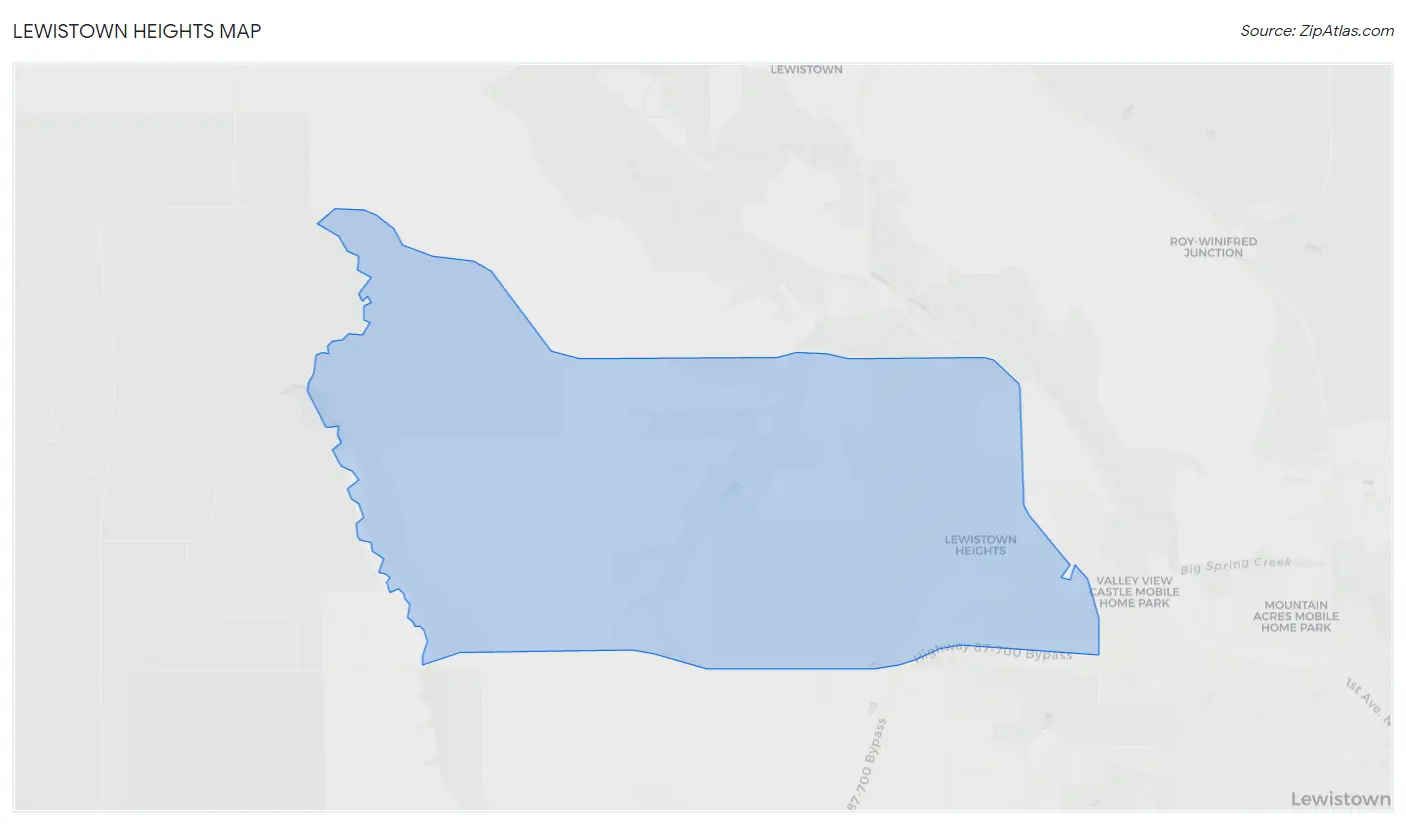
Lewistown Heights Map
Lewistown Heights Overview
$41,890
PER CAPITA INCOME
$84,313
AVG FAMILY INCOME
$84,155
AVG HOUSEHOLD INCOME
41.5%
WAGE / INCOME GAP [ % ]
58.5¢/ $1
WAGE / INCOME GAP [ $ ]
0.26
INEQUALITY / GINI INDEX
486
TOTAL POPULATION
253
MALE POPULATION
233
FEMALE POPULATION
108.58
MALES / 100 FEMALES
92.09
FEMALES / 100 MALES
27.6
MEDIAN AGE
2.7
AVG FAMILY SIZE
2.6
AVG HOUSEHOLD SIZE
323
LABOR FORCE [ PEOPLE ]
73.7%
PERCENT IN LABOR FORCE
Income in Lewistown Heights
Income Overview in Lewistown Heights
Per Capita Income in Lewistown Heights is $41,890, while median incomes of families and households are $84,313 and $84,155 respectively.
| Characteristic | Number | Measure |
| Per Capita Income | 486 | $41,890 |
| Median Family Income | 175 | $84,313 |
| Mean Family Income | 175 | $120,665 |
| Median Household Income | 184 | $84,155 |
| Mean Household Income | 184 | $117,381 |
| Income Deficit | 175 | $0 |
| Wage / Income Gap (%) | 486 | 41.54% |
| Wage / Income Gap ($) | 486 | 58.46¢ per $1 |
| Gini / Inequality Index | 486 | 0.26 |
Earnings by Sex in Lewistown Heights
Average Earnings in Lewistown Heights are $39,519, $31,750 for men and $54,306 for women, a difference of 41.5%.
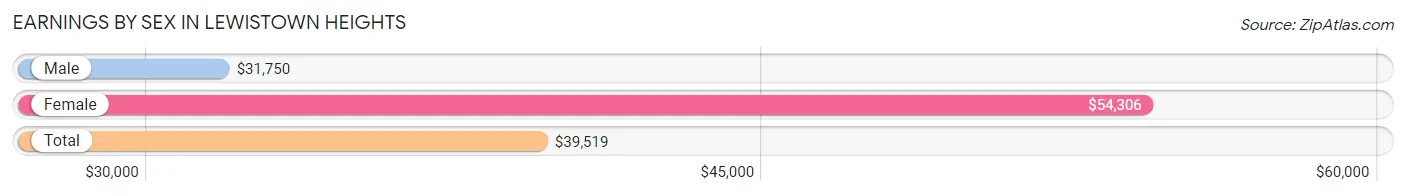
| Sex | Number | Average Earnings |
| Male | 192 (56.6%) | $31,750 |
| Female | 147 (43.4%) | $54,306 |
| Total | 339 (100.0%) | $39,519 |
Earnings by Sex by Income Bracket in Lewistown Heights
The most common earnings brackets in Lewistown Heights are $17,500 to $19,999 for men (62 | 32.3%) and $55,000 to $64,999 for women (60 | 40.8%).
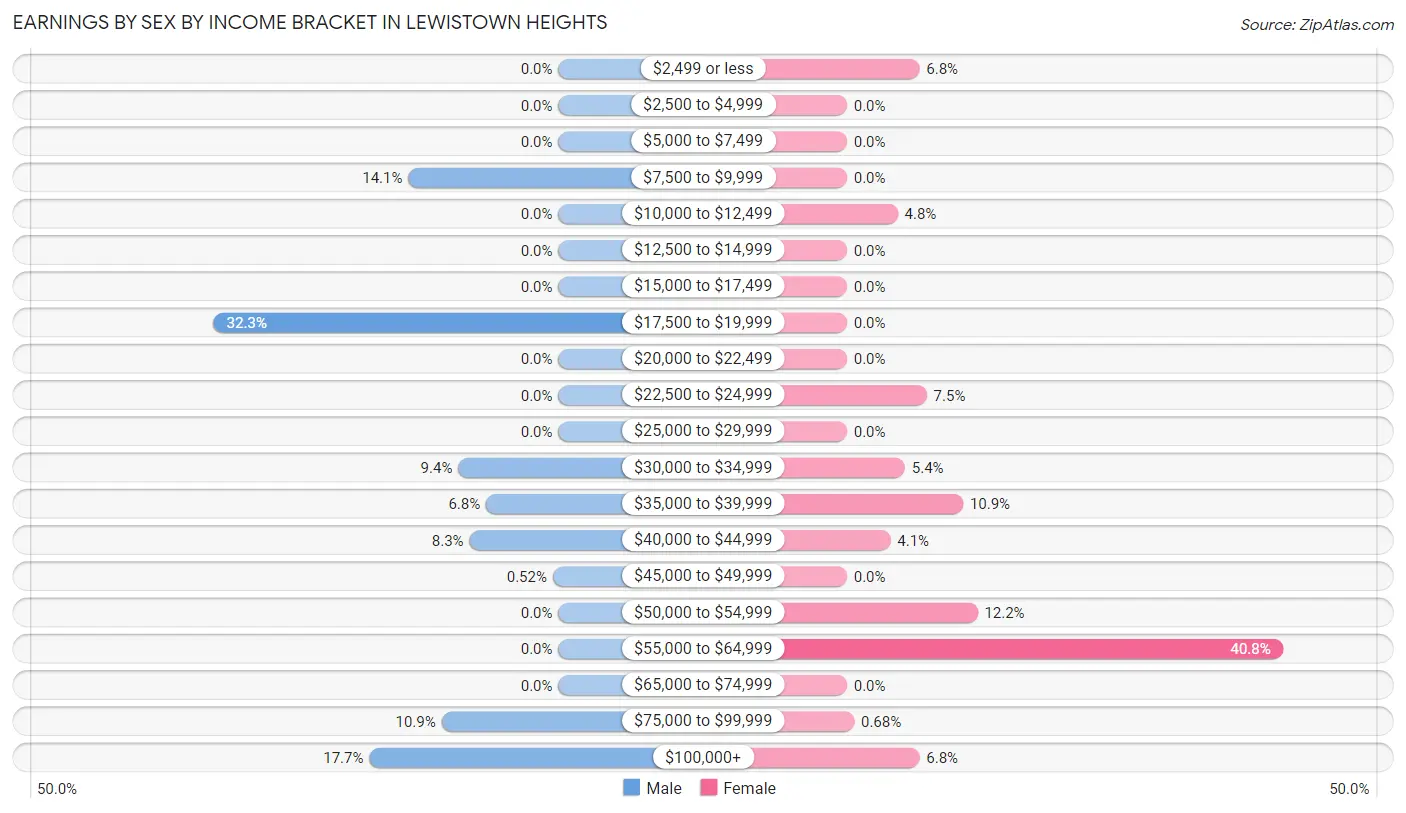
| Income | Male | Female |
| $2,499 or less | 0 (0.0%) | 10 (6.8%) |
| $2,500 to $4,999 | 0 (0.0%) | 0 (0.0%) |
| $5,000 to $7,499 | 0 (0.0%) | 0 (0.0%) |
| $7,500 to $9,999 | 27 (14.1%) | 0 (0.0%) |
| $10,000 to $12,499 | 0 (0.0%) | 7 (4.8%) |
| $12,500 to $14,999 | 0 (0.0%) | 0 (0.0%) |
| $15,000 to $17,499 | 0 (0.0%) | 0 (0.0%) |
| $17,500 to $19,999 | 62 (32.3%) | 0 (0.0%) |
| $20,000 to $22,499 | 0 (0.0%) | 0 (0.0%) |
| $22,500 to $24,999 | 0 (0.0%) | 11 (7.5%) |
| $25,000 to $29,999 | 0 (0.0%) | 0 (0.0%) |
| $30,000 to $34,999 | 18 (9.4%) | 8 (5.4%) |
| $35,000 to $39,999 | 13 (6.8%) | 16 (10.9%) |
| $40,000 to $44,999 | 16 (8.3%) | 6 (4.1%) |
| $45,000 to $49,999 | 1 (0.5%) | 0 (0.0%) |
| $50,000 to $54,999 | 0 (0.0%) | 18 (12.2%) |
| $55,000 to $64,999 | 0 (0.0%) | 60 (40.8%) |
| $65,000 to $74,999 | 0 (0.0%) | 0 (0.0%) |
| $75,000 to $99,999 | 21 (10.9%) | 1 (0.7%) |
| $100,000+ | 34 (17.7%) | 10 (6.8%) |
| Total | 192 (100.0%) | 147 (100.0%) |
Earnings by Sex by Educational Attainment in Lewistown Heights
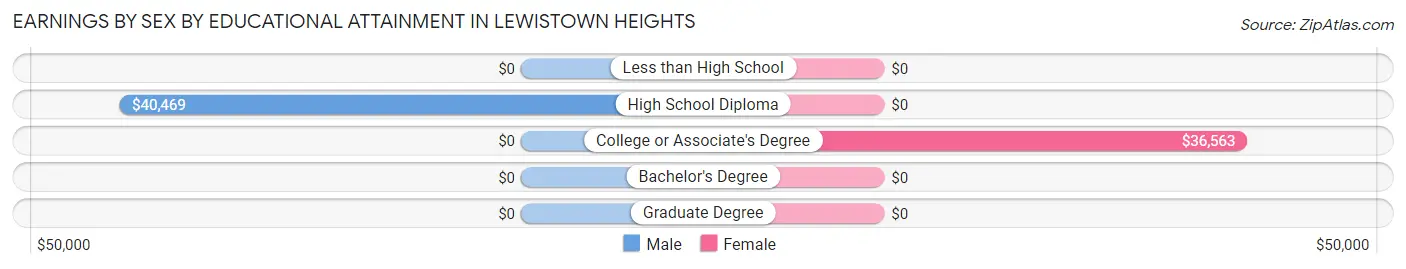
| Educational Attainment | Male Income | Female Income |
| Less than High School | - | - |
| High School Diploma | $40,469 | $0 |
| College or Associate's Degree | - | - |
| Bachelor's Degree | - | - |
| Graduate Degree | - | - |
| Total | - | - |
Family Income in Lewistown Heights
Family Income Brackets in Lewistown Heights
According to the Lewistown Heights family income data, there are 104 families falling into the $75,000 to $99,999 income range, which is the most common income bracket and makes up 59.4% of all families.
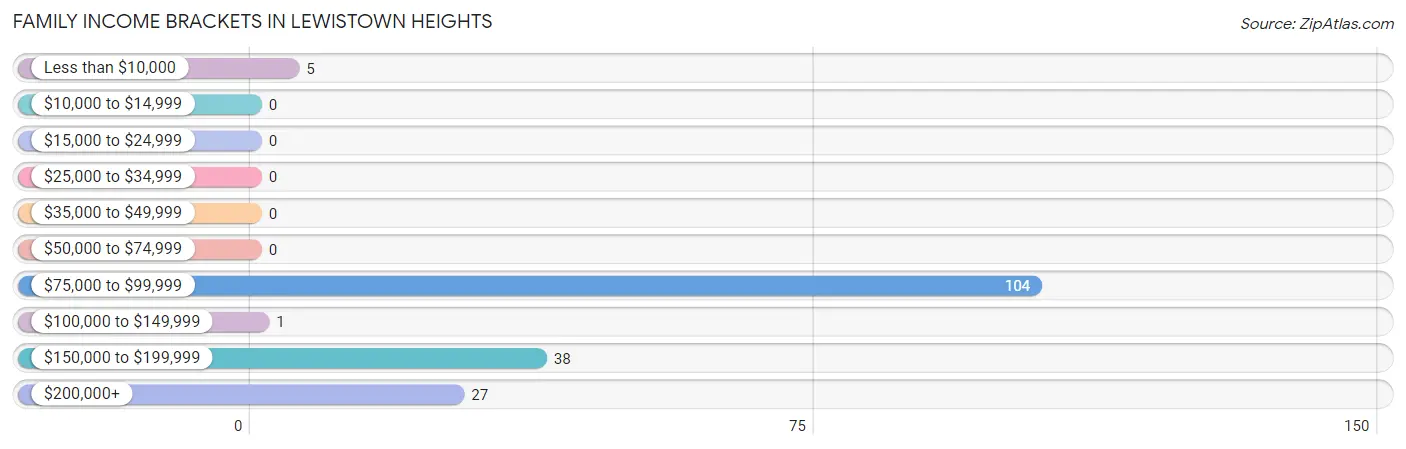
| Income Bracket | # Families | % Families |
| Less than $10,000 | 5 | 2.9% |
| $10,000 to $14,999 | 0 | 0.0% |
| $15,000 to $24,999 | 0 | 0.0% |
| $25,000 to $34,999 | 0 | 0.0% |
| $35,000 to $49,999 | 0 | 0.0% |
| $50,000 to $74,999 | 0 | 0.0% |
| $75,000 to $99,999 | 104 | 59.4% |
| $100,000 to $149,999 | 1 | 0.6% |
| $150,000 to $199,999 | 38 | 21.7% |
| $200,000+ | 27 | 15.4% |
Family Income by Famaliy Size in Lewistown Heights
2-person families (71 | 40.6%) account for the highest median family income in Lewistown Heights with $171,488 per family, while 2-person families (71 | 40.6%) have the highest median income of $85,744 per family member.
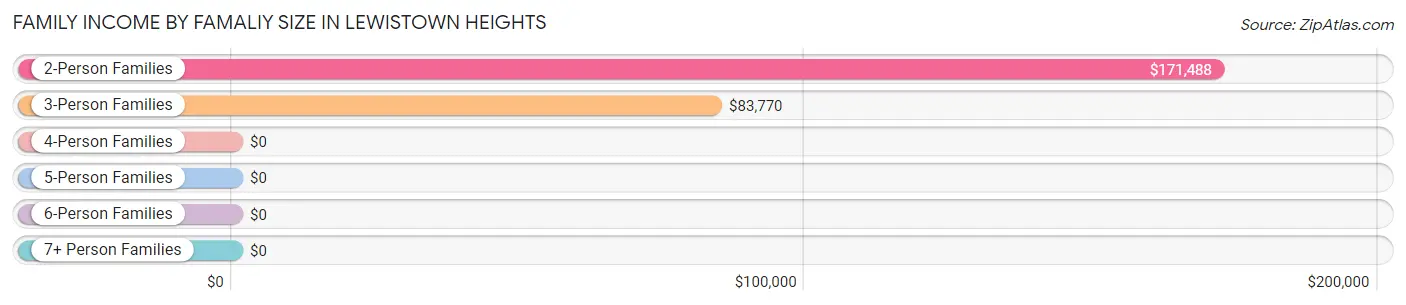
| Income Bracket | # Families | Median Income |
| 2-Person Families | 71 (40.6%) | $171,488 |
| 3-Person Families | 95 (54.3%) | $83,770 |
| 4-Person Families | 9 (5.1%) | $0 |
| 5-Person Families | 0 (0.0%) | $0 |
| 6-Person Families | 0 (0.0%) | $0 |
| 7+ Person Families | 0 (0.0%) | $0 |
| Total | 175 (100.0%) | $84,313 |
Family Income by Number of Earners in Lewistown Heights
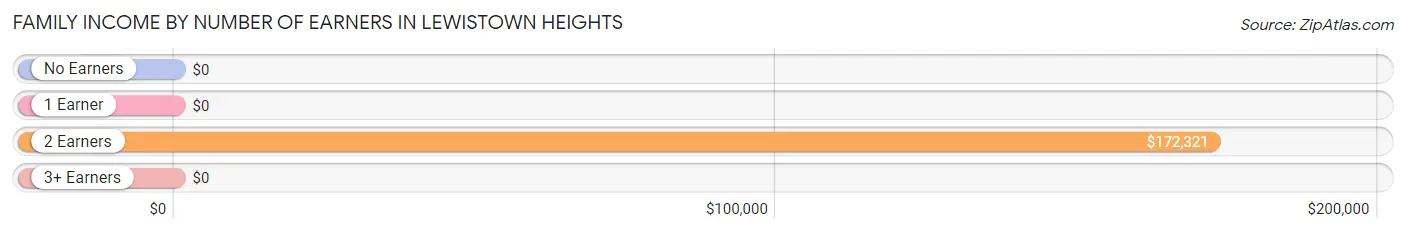
| Number of Earners | # Families | Median Income |
| No Earners | 5 (2.9%) | $0 |
| 1 Earner | 15 (8.6%) | $0 |
| 2 Earners | 77 (44.0%) | $172,321 |
| 3+ Earners | 78 (44.6%) | $0 |
| Total | 175 (100.0%) | $84,313 |
Household Income in Lewistown Heights
Household Income Brackets in Lewistown Heights
With 104 households falling in the category, the $75,000 to $99,999 income range is the most frequent in Lewistown Heights, accounting for 56.5% of all households.
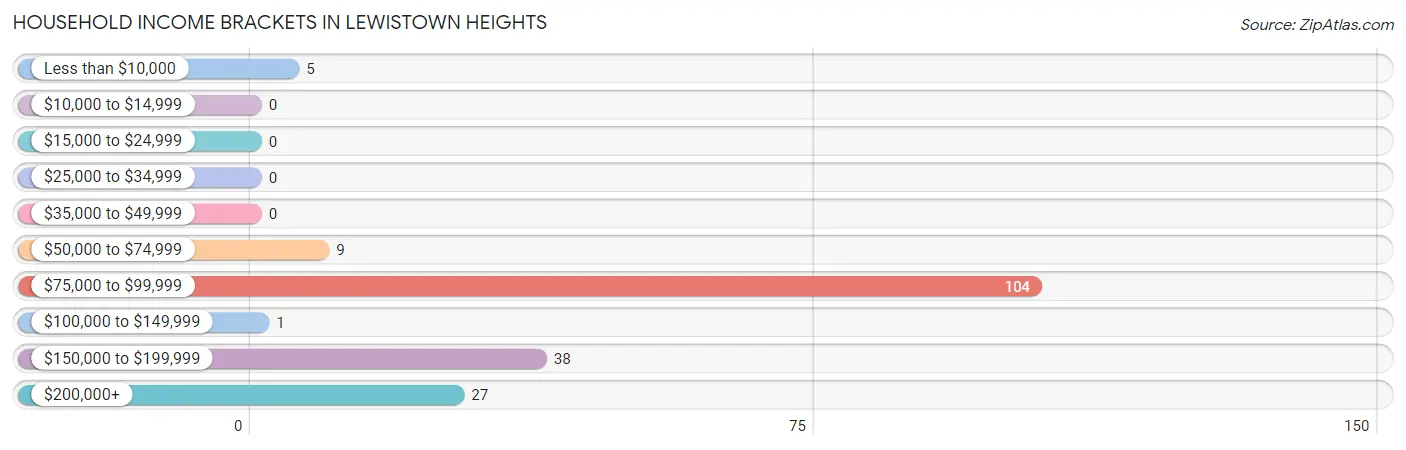
| Income Bracket | # Households | % Households |
| Less than $10,000 | 5 | 2.7% |
| $10,000 to $14,999 | 0 | 0.0% |
| $15,000 to $24,999 | 0 | 0.0% |
| $25,000 to $34,999 | 0 | 0.0% |
| $35,000 to $49,999 | 0 | 0.0% |
| $50,000 to $74,999 | 9 | 4.9% |
| $75,000 to $99,999 | 104 | 56.5% |
| $100,000 to $149,999 | 1 | 0.5% |
| $150,000 to $199,999 | 38 | 20.7% |
| $200,000+ | 27 | 14.7% |
Household Income by Householder Age in Lewistown Heights
The median household income in Lewistown Heights is $84,155, with the highest median household income of $78,710 found in the 45 to 64 years age bracket for the primary householder. A total of 58 households (31.5%) fall into this category. Meanwhile, the 15 to 24 years age bracket for the primary householder has the lowest median household income of $0, with 62 households (33.7%) in this group.
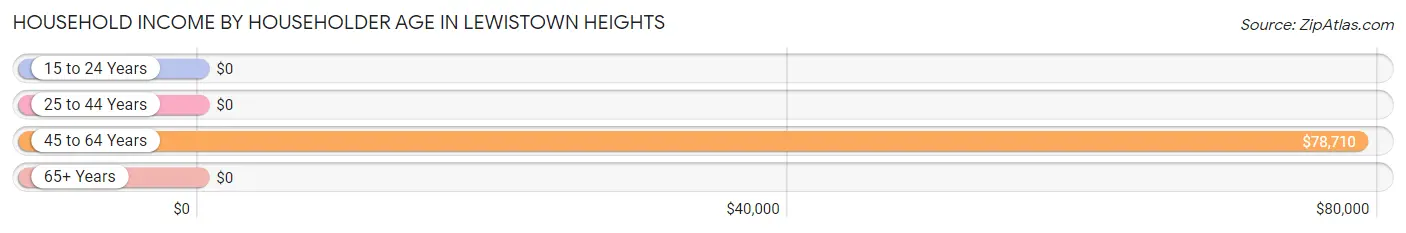
| Income Bracket | # Households | Median Income |
| 15 to 24 Years | 62 (33.7%) | $0 |
| 25 to 44 Years | 36 (19.6%) | $0 |
| 45 to 64 Years | 58 (31.5%) | $78,710 |
| 65+ Years | 28 (15.2%) | $0 |
| Total | 184 (100.0%) | $84,155 |
Poverty in Lewistown Heights
Income Below Poverty by Sex and Age in Lewistown Heights
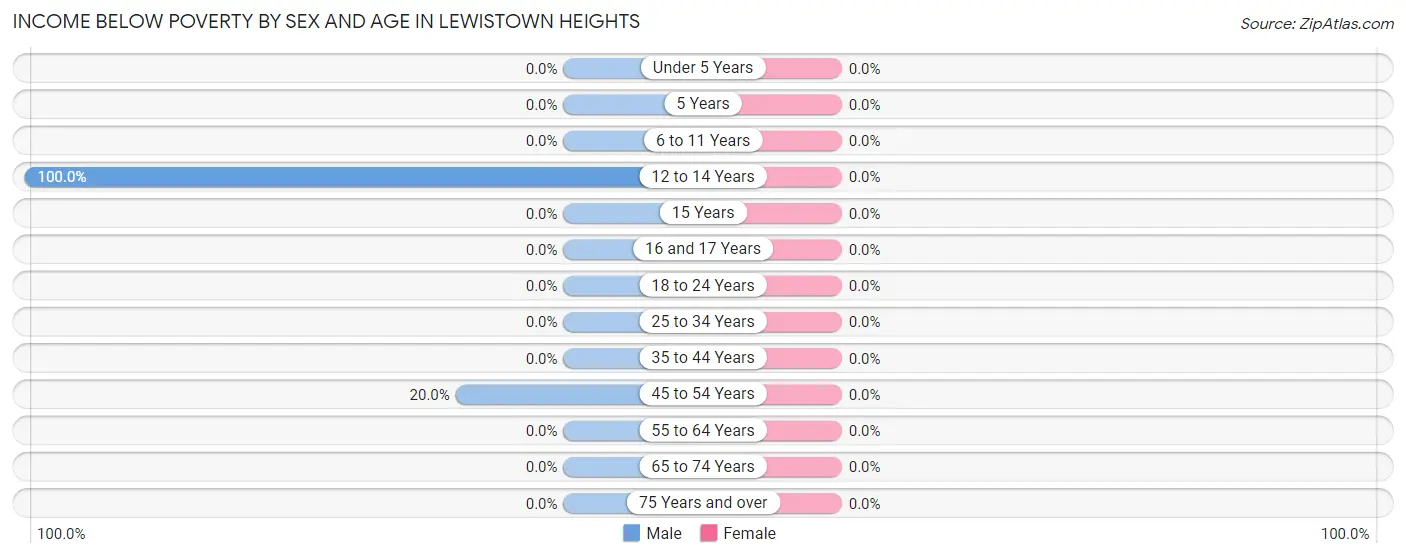
| Age Bracket | Male | Female |
| Under 5 Years | 0 (0.0%) | 0 (0.0%) |
| 5 Years | 0 (0.0%) | 0 (0.0%) |
| 6 to 11 Years | 0 (0.0%) | 0 (0.0%) |
| 12 to 14 Years | 26 (100.0%) | 0 (0.0%) |
| 15 Years | 0 (0.0%) | 0 (0.0%) |
| 16 and 17 Years | 0 (0.0%) | 0 (0.0%) |
| 18 to 24 Years | 0 (0.0%) | 0 (0.0%) |
| 25 to 34 Years | 0 (0.0%) | 0 (0.0%) |
| 35 to 44 Years | 0 (0.0%) | 0 (0.0%) |
| 45 to 54 Years | 5 (20.0%) | 0 (0.0%) |
| 55 to 64 Years | 0 (0.0%) | 0 (0.0%) |
| 65 to 74 Years | 0 (0.0%) | 0 (0.0%) |
| 75 Years and over | 0 (0.0%) | 0 (0.0%) |
| Total | 31 (12.2%) | 0 (0.0%) |
Income Above Poverty by Sex and Age in Lewistown Heights
According to the poverty statistics in Lewistown Heights, males aged 6 to 11 years and females aged 6 to 11 years are the age groups that are most secure financially, with 100.0% of males and 100.0% of females in these age groups living above the poverty line.
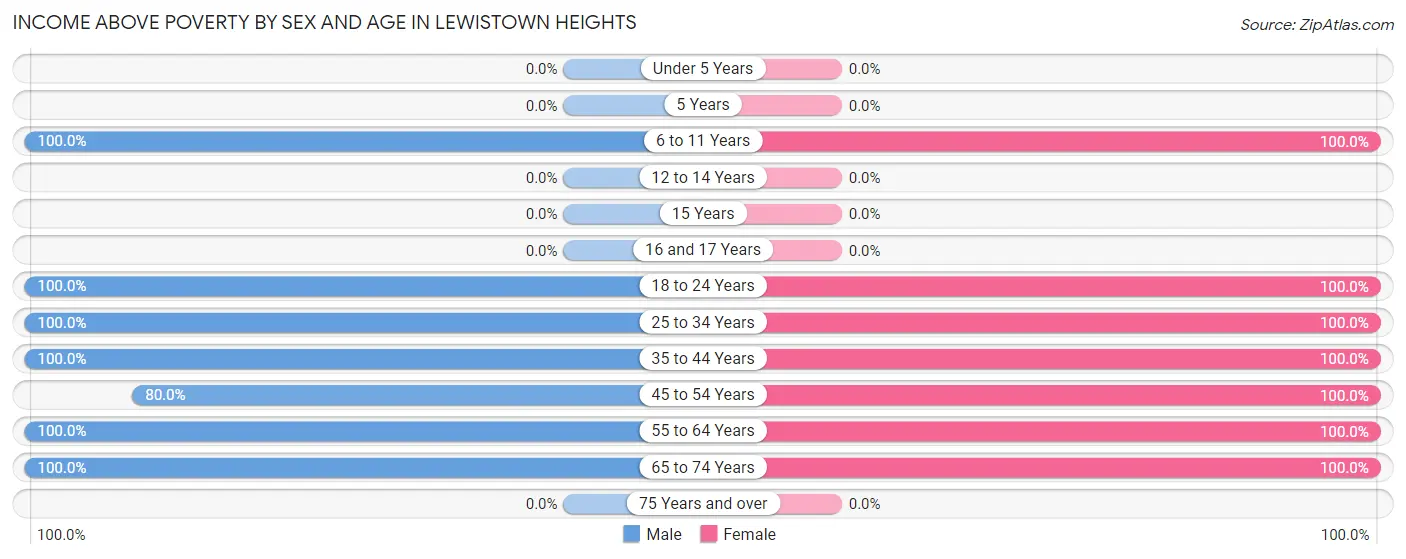
| Age Bracket | Male | Female |
| Under 5 Years | 0 (0.0%) | 0 (0.0%) |
| 5 Years | 0 (0.0%) | 0 (0.0%) |
| 6 to 11 Years | 15 (100.0%) | 7 (100.0%) |
| 12 to 14 Years | 0 (0.0%) | 0 (0.0%) |
| 15 Years | 0 (0.0%) | 0 (0.0%) |
| 16 and 17 Years | 0 (0.0%) | 0 (0.0%) |
| 18 to 24 Years | 89 (100.0%) | 60 (100.0%) |
| 25 to 34 Years | 27 (100.0%) | 79 (100.0%) |
| 35 to 44 Years | 11 (100.0%) | 29 (100.0%) |
| 45 to 54 Years | 20 (80.0%) | 6 (100.0%) |
| 55 to 64 Years | 32 (100.0%) | 36 (100.0%) |
| 65 to 74 Years | 28 (100.0%) | 16 (100.0%) |
| 75 Years and over | 0 (0.0%) | 0 (0.0%) |
| Total | 222 (87.7%) | 233 (100.0%) |
Income Below Poverty Among Married-Couple Families in Lewistown Heights
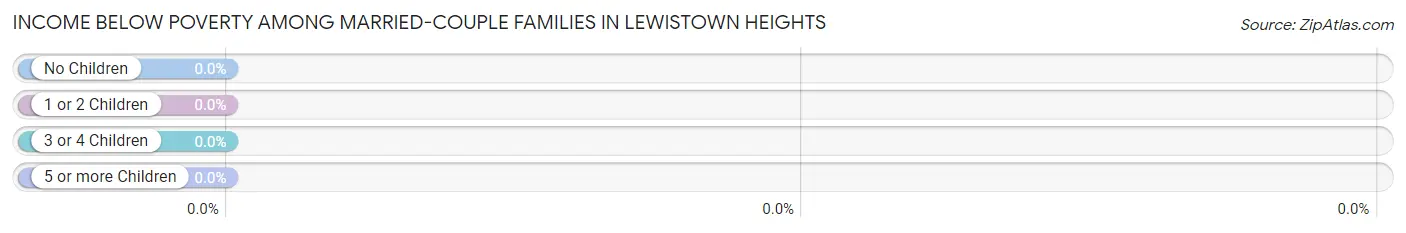
| Children | Above Poverty | Below Poverty |
| No Children | 73 (100.0%) | 0 (0.0%) |
| 1 or 2 Children | 19 (100.0%) | 0 (0.0%) |
| 3 or 4 Children | 0 (0.0%) | 0 (0.0%) |
| 5 or more Children | 0 (0.0%) | 0 (0.0%) |
| Total | 92 (100.0%) | 0 (0.0%) |
Income Below Poverty Among Single-Parent Households in Lewistown Heights
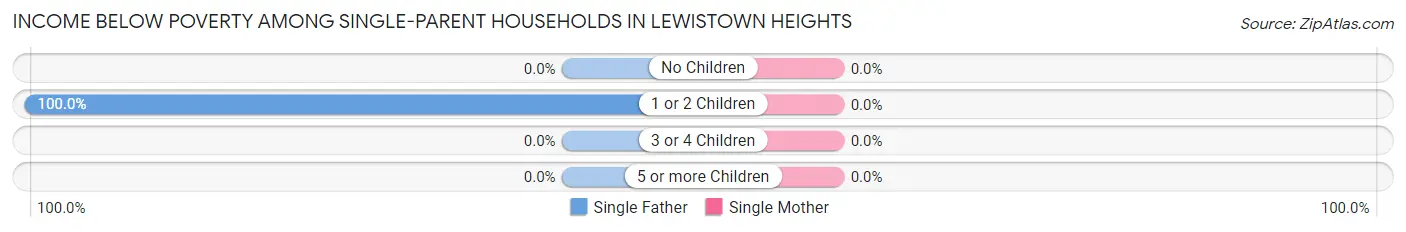
| Children | Single Father | Single Mother |
| No Children | 0 (0.0%) | 0 (0.0%) |
| 1 or 2 Children | 5 (100.0%) | 0 (0.0%) |
| 3 or 4 Children | 0 (0.0%) | 0 (0.0%) |
| 5 or more Children | 0 (0.0%) | 0 (0.0%) |
| Total | 5 (6.0%) | 0 (0.0%) |
Income Below Poverty Among Married-Couple vs Single-Parent Households in Lewistown Heights
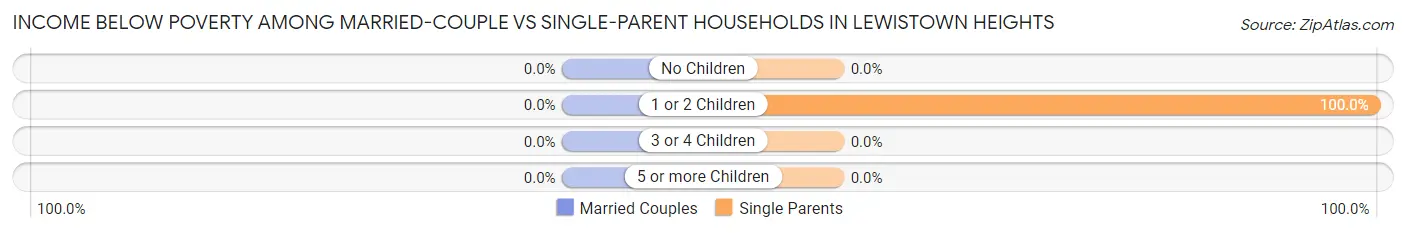
| Children | Married-Couple Families | Single-Parent Households |
| No Children | 0 (0.0%) | 0 (0.0%) |
| 1 or 2 Children | 0 (0.0%) | 5 (100.0%) |
| 3 or 4 Children | 0 (0.0%) | 0 (0.0%) |
| 5 or more Children | 0 (0.0%) | 0 (0.0%) |
| Total | 0 (0.0%) | 5 (6.0%) |
Race in Lewistown Heights
The most populous races in Lewistown Heights are White / Caucasian (407 | 83.7%), and Asian (79 | 16.3%).
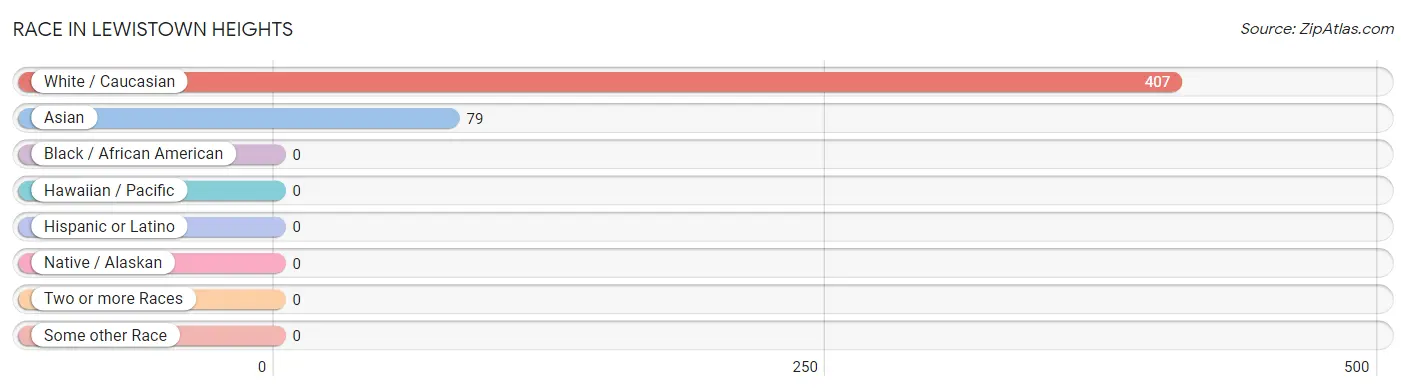
| Race | # Population | % Population |
| Asian | 79 | 16.3% |
| Black / African American | 0 | 0.0% |
| Hawaiian / Pacific | 0 | 0.0% |
| Hispanic or Latino | 0 | 0.0% |
| Native / Alaskan | 0 | 0.0% |
| White / Caucasian | 407 | 83.7% |
| Two or more Races | 0 | 0.0% |
| Some other Race | 0 | 0.0% |
| Total | 486 | 100.0% |
Ancestry in Lewistown Heights
The most populous ancestries reported in Lewistown Heights are Norwegian (131 | 27.0%), German (115 | 23.7%), Burmese (79 | 16.3%), English (50 | 10.3%), and French (22 | 4.5%), together accounting for 81.7% of all Lewistown Heights residents.
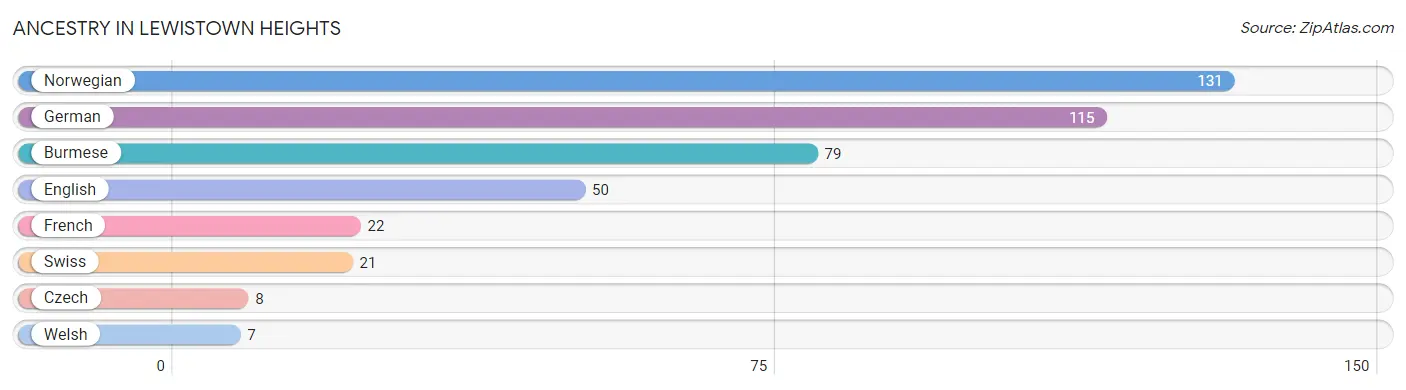
| Ancestry | # Population | % Population |
| Burmese | 79 | 16.3% |
| Czech | 8 | 1.7% |
| English | 50 | 10.3% |
| French | 22 | 4.5% |
| German | 115 | 23.7% |
| Norwegian | 131 | 27.0% |
| Swiss | 21 | 4.3% |
| Welsh | 7 | 1.4% | View All 8 Rows |
Immigrants in Lewistown Heights
The most numerous immigrant groups reported in Lewistown Heights came from Asia (79 | 16.3%), Eastern Asia (79 | 16.3%), and Korea (79 | 16.3%), together accounting for 48.8% of all Lewistown Heights residents.
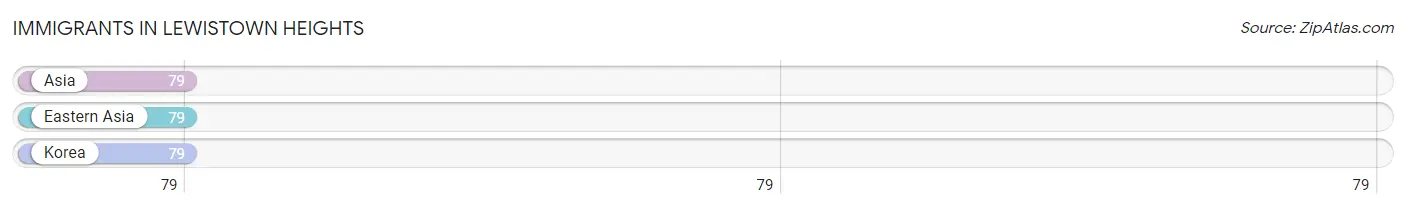
| Immigration Origin | # Population | % Population |
| Asia | 79 | 16.3% |
| Eastern Asia | 79 | 16.3% |
| Korea | 79 | 16.3% | View All 3 Rows |
Sex and Age in Lewistown Heights
Sex and Age in Lewistown Heights
The most populous age groups in Lewistown Heights are 15 to 19 Years (62 | 24.5%) for men and 25 to 29 Years (79 | 33.9%) for women.
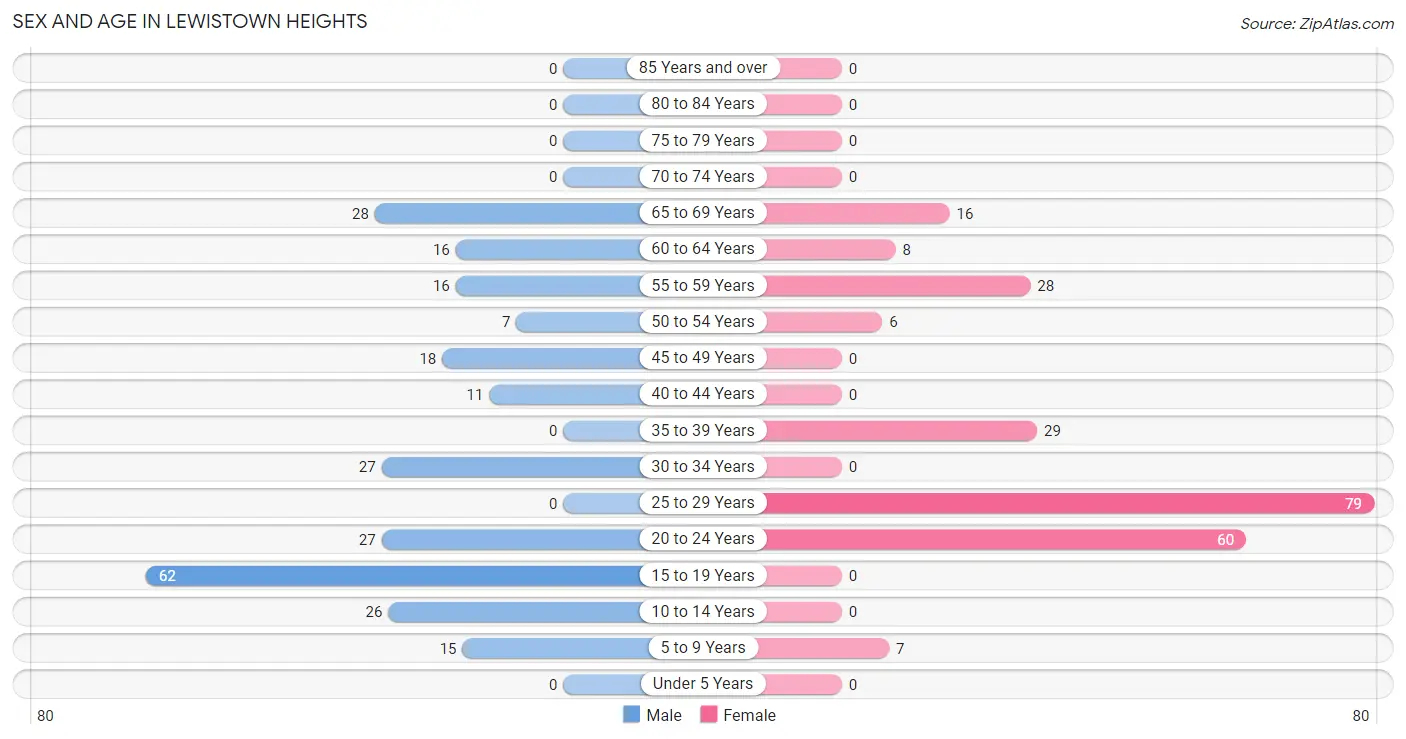
| Age Bracket | Male | Female |
| Under 5 Years | 0 (0.0%) | 0 (0.0%) |
| 5 to 9 Years | 15 (5.9%) | 7 (3.0%) |
| 10 to 14 Years | 26 (10.3%) | 0 (0.0%) |
| 15 to 19 Years | 62 (24.5%) | 0 (0.0%) |
| 20 to 24 Years | 27 (10.7%) | 60 (25.8%) |
| 25 to 29 Years | 0 (0.0%) | 79 (33.9%) |
| 30 to 34 Years | 27 (10.7%) | 0 (0.0%) |
| 35 to 39 Years | 0 (0.0%) | 29 (12.4%) |
| 40 to 44 Years | 11 (4.3%) | 0 (0.0%) |
| 45 to 49 Years | 18 (7.1%) | 0 (0.0%) |
| 50 to 54 Years | 7 (2.8%) | 6 (2.6%) |
| 55 to 59 Years | 16 (6.3%) | 28 (12.0%) |
| 60 to 64 Years | 16 (6.3%) | 8 (3.4%) |
| 65 to 69 Years | 28 (11.1%) | 16 (6.9%) |
| 70 to 74 Years | 0 (0.0%) | 0 (0.0%) |
| 75 to 79 Years | 0 (0.0%) | 0 (0.0%) |
| 80 to 84 Years | 0 (0.0%) | 0 (0.0%) |
| 85 Years and over | 0 (0.0%) | 0 (0.0%) |
| Total | 253 (100.0%) | 233 (100.0%) |
Families and Households in Lewistown Heights
Median Family Size in Lewistown Heights
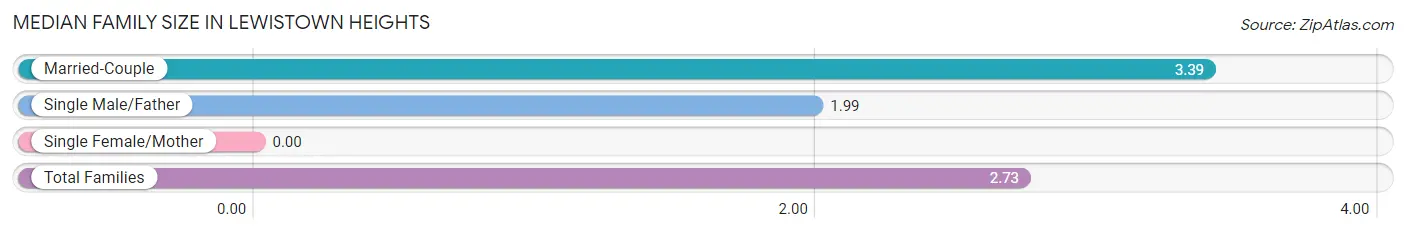
| Family Type | # Families | Family Size |
| Married-Couple | 92 (52.6%) | 3.39 |
| Single Male/Father | 83 (47.4%) | 1.99 |
| Single Female/Mother | 0 (0.0%) | - |
| Total Families | 175 (100.0%) | 2.73 |
Median Household Size in Lewistown Heights
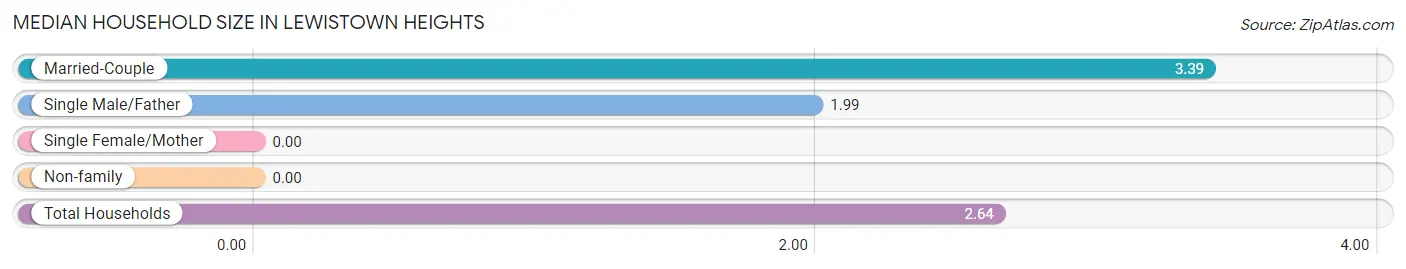
| Household Type | # Households | Household Size |
| Married-Couple | 92 (50.0%) | 3.39 |
| Single Male/Father | 83 (45.1%) | 1.99 |
| Single Female/Mother | 0 (0.0%) | - |
| Non-family | 9 (4.9%) | - |
| Total Households | 184 (100.0%) | 2.64 |
Household Size by Marriage Status in Lewistown Heights
Out of a total of 184 households in Lewistown Heights, 175 (95.1%) are family households, while 9 (4.9%) are nonfamily households. The most numerous type of family households are 3-person households, comprising 95, and the most common type of nonfamily households are 1-person households, comprising 9.
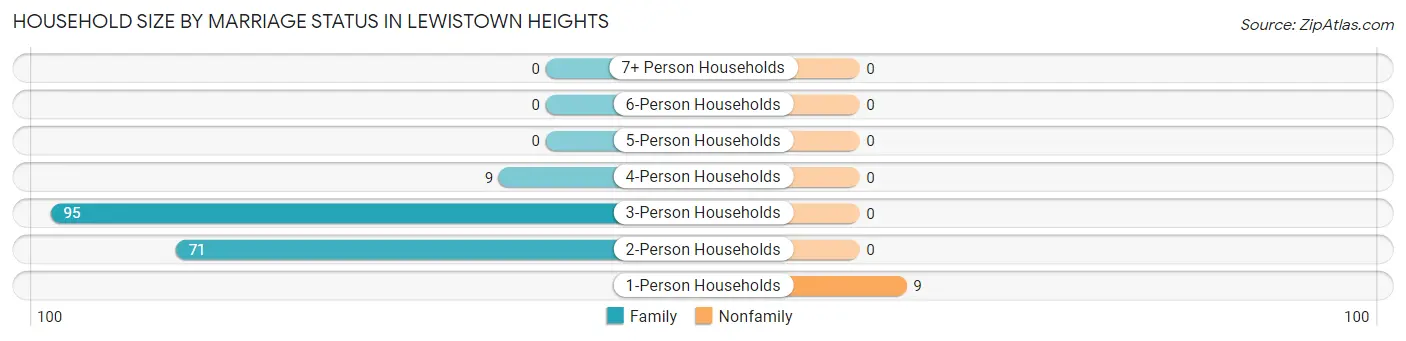
| Household Size | Family Households | Nonfamily Households |
| 1-Person Households | - | 9 (4.9%) |
| 2-Person Households | 71 (38.6%) | 0 (0.0%) |
| 3-Person Households | 95 (51.6%) | 0 (0.0%) |
| 4-Person Households | 9 (4.9%) | 0 (0.0%) |
| 5-Person Households | 0 (0.0%) | 0 (0.0%) |
| 6-Person Households | 0 (0.0%) | 0 (0.0%) |
| 7+ Person Households | 0 (0.0%) | 0 (0.0%) |
| Total | 175 (95.1%) | 9 (4.9%) |
Female Fertility in Lewistown Heights
Fertility by Age in Lewistown Heights
| Age Bracket | Women with Births | Births / 1,000 Women |
| 15 to 19 years | 0 (0.0%) | 0.0 |
| 20 to 34 years | 0 (0.0%) | 0.0 |
| 35 to 50 years | 0 (0.0%) | 0.0 |
| Total | 0 (0.0%) | 0.0 |
Fertility by Age by Marriage Status in Lewistown Heights
| Age Bracket | Married | Unmarried |
| 15 to 19 years | 0 (0.0%) | 0 (0.0%) |
| 20 to 34 years | 0 (0.0%) | 0 (0.0%) |
| 35 to 50 years | 0 (0.0%) | 0 (0.0%) |
| Total | 0 (0.0%) | 0 (0.0%) |
Fertility by Education in Lewistown Heights
| Educational Attainment | Women with Births | Births / 1,000 Women |
| Less than High School | 0 (0.0%) | 0.0 |
| High School Diploma | 0 (0.0%) | 0.0 |
| College or Associate's Degree | 0 (0.0%) | 0.0 |
| Bachelor's Degree | 0 (0.0%) | 0.0 |
| Graduate Degree | 0 (0.0%) | 0.0 |
| Total | 0 (0.0%) | 0.0 |
Fertility by Education by Marriage Status in Lewistown Heights
| Educational Attainment | Married | Unmarried |
| Less than High School | 0 (0.0%) | 0 (0.0%) |
| High School Diploma | 0 (0.0%) | 0 (0.0%) |
| College or Associate's Degree | 0 (0.0%) | 0 (0.0%) |
| Bachelor's Degree | 0 (0.0%) | 0 (0.0%) |
| Graduate Degree | 0 (0.0%) | 0 (0.0%) |
| Total | 0 (0.0%) | 0 (0.0%) |
Employment Characteristics in Lewistown Heights
Employment by Class of Employer in Lewistown Heights
Among the 323 employed individuals in Lewistown Heights, private company employees (247 | 76.5%), self-employed (incorporated) (38 | 11.8%), and self-employed (not incorporated) (28 | 8.7%) make up the most common classes of employment.
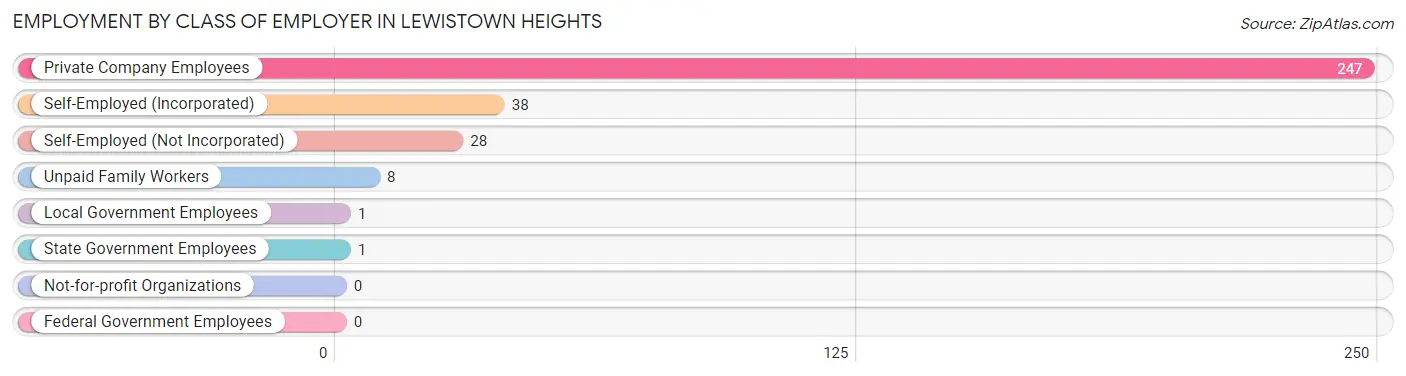
| Employer Class | # Employees | % Employees |
| Private Company Employees | 247 | 76.5% |
| Self-Employed (Incorporated) | 38 | 11.8% |
| Self-Employed (Not Incorporated) | 28 | 8.7% |
| Not-for-profit Organizations | 0 | 0.0% |
| Local Government Employees | 1 | 0.3% |
| State Government Employees | 1 | 0.3% |
| Federal Government Employees | 0 | 0.0% |
| Unpaid Family Workers | 8 | 2.5% |
| Total | 323 | 100.0% |
Employment Status by Age in Lewistown Heights
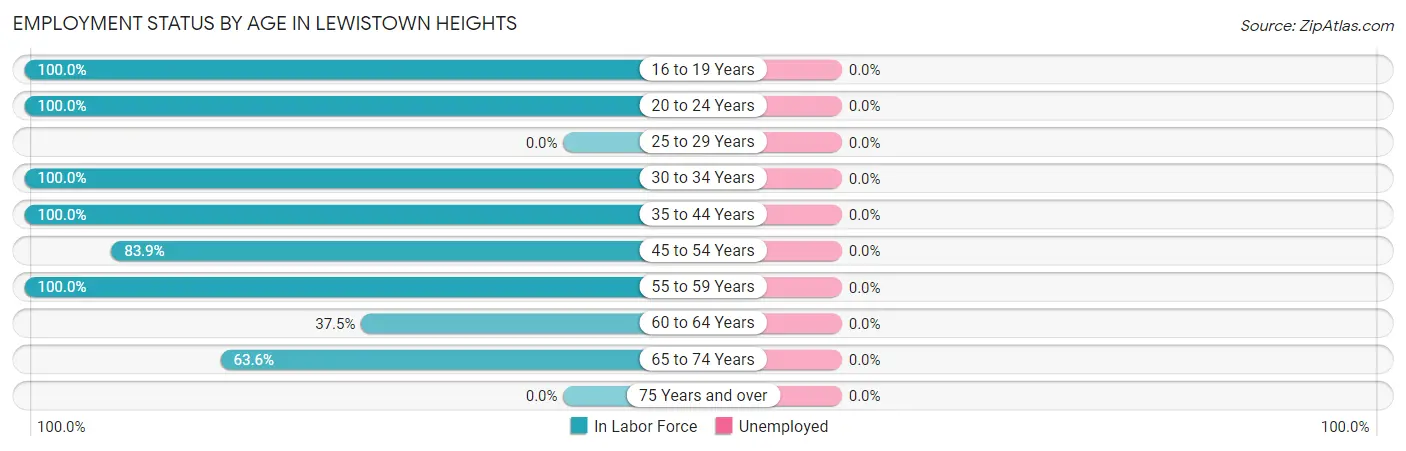
| Age Bracket | In Labor Force | Unemployed |
| 16 to 19 Years | 62 (100.0%) | 0 (0.0%) |
| 20 to 24 Years | 87 (100.0%) | 0 (0.0%) |
| 25 to 29 Years | 0 (0.0%) | 0 (0.0%) |
| 30 to 34 Years | 27 (100.0%) | 0 (0.0%) |
| 35 to 44 Years | 40 (100.0%) | 0 (0.0%) |
| 45 to 54 Years | 26 (83.9%) | 0 (0.0%) |
| 55 to 59 Years | 44 (100.0%) | 0 (0.0%) |
| 60 to 64 Years | 9 (37.5%) | 0 (0.0%) |
| 65 to 74 Years | 28 (63.6%) | 0 (0.0%) |
| 75 Years and over | 0 (0.0%) | 0 (0.0%) |
| Total | 323 (73.7%) | 0 (0.0%) |
Employment Status by Educational Attainment in Lewistown Heights
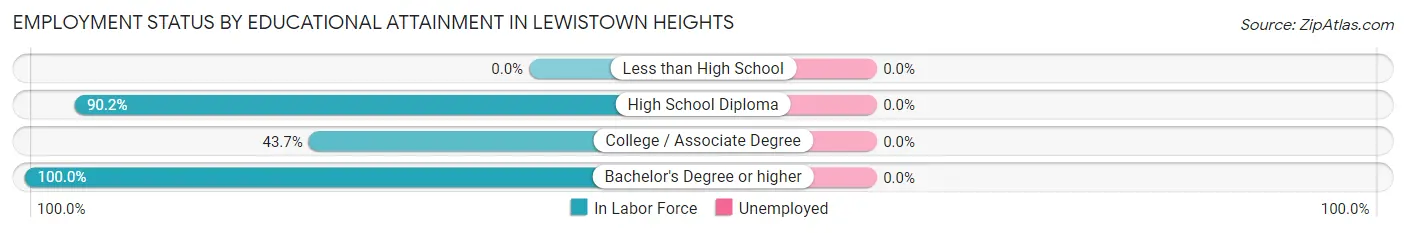
| Educational Attainment | In Labor Force | Unemployed |
| Less than High School | 0 (0.0%) | 0 (0.0%) |
| High School Diploma | 46 (90.2%) | 0 (0.0%) |
| College / Associate Degree | 73 (43.7%) | 0 (0.0%) |
| Bachelor's Degree or higher | 27 (100.0%) | 0 (0.0%) |
| Total | 146 (59.6%) | 0 (0.0%) |
Employment Occupations by Sex in Lewistown Heights
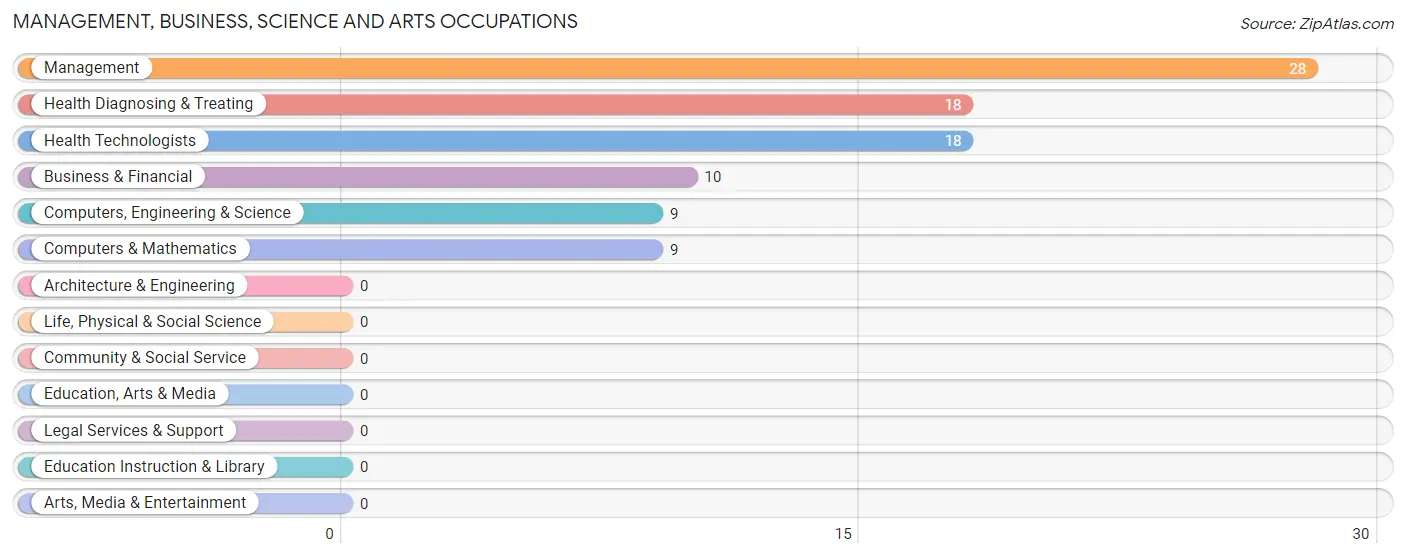
Management, Business, Science and Arts Occupations
The most common Management, Business, Science and Arts occupations in Lewistown Heights are Management (28 | 8.7%), Health Diagnosing & Treating (18 | 5.6%), Health Technologists (18 | 5.6%), Business & Financial (10 | 3.1%), and Computers, Engineering & Science (9 | 2.8%).
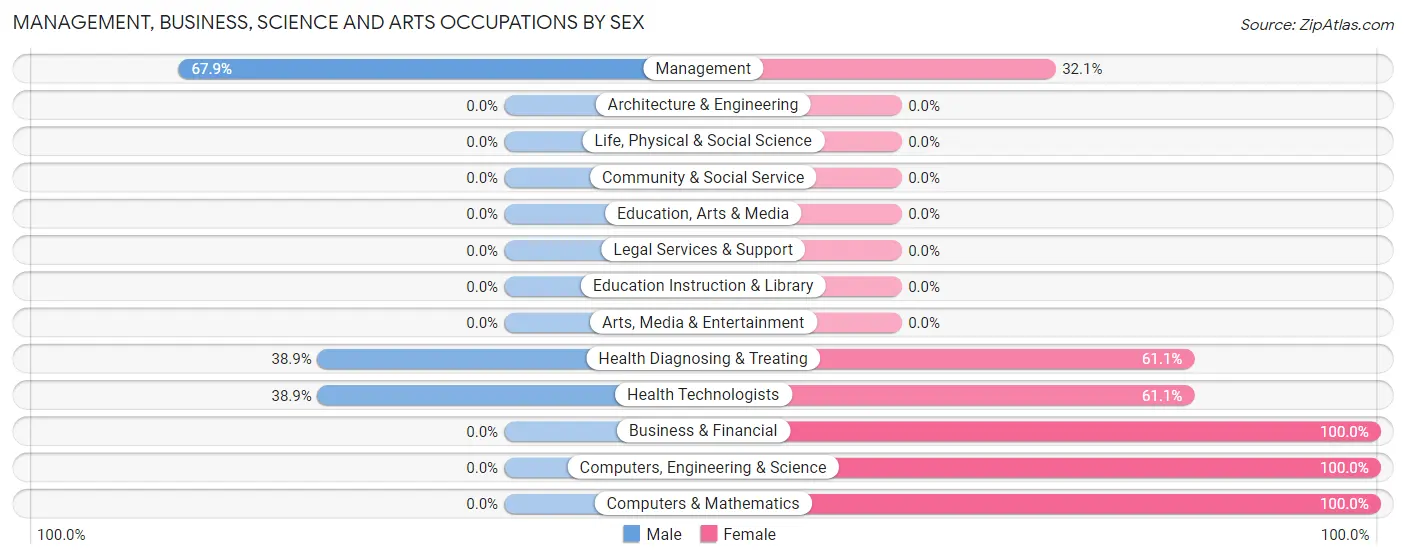
Management, Business, Science and Arts Occupations by Sex
Within the Management, Business, Science and Arts occupations in Lewistown Heights, the most male-oriented occupations are Management (67.9%), Health Diagnosing & Treating (38.9%), and Health Technologists (38.9%), while the most female-oriented occupations are Business & Financial (100.0%), Computers, Engineering & Science (100.0%), and Computers & Mathematics (100.0%).
| Occupation | Male | Female |
| Management | 19 (67.9%) | 9 (32.1%) |
| Business & Financial | 0 (0.0%) | 10 (100.0%) |
| Computers, Engineering & Science | 0 (0.0%) | 9 (100.0%) |
| Computers & Mathematics | 0 (0.0%) | 9 (100.0%) |
| Architecture & Engineering | 0 (0.0%) | 0 (0.0%) |
| Life, Physical & Social Science | 0 (0.0%) | 0 (0.0%) |
| Community & Social Service | 0 (0.0%) | 0 (0.0%) |
| Education, Arts & Media | 0 (0.0%) | 0 (0.0%) |
| Legal Services & Support | 0 (0.0%) | 0 (0.0%) |
| Education Instruction & Library | 0 (0.0%) | 0 (0.0%) |
| Arts, Media & Entertainment | 0 (0.0%) | 0 (0.0%) |
| Health Diagnosing & Treating | 7 (38.9%) | 11 (61.1%) |
| Health Technologists | 7 (38.9%) | 11 (61.1%) |
| Total (Category) | 26 (40.0%) | 39 (60.0%) |
| Total (Overall) | 192 (59.4%) | 131 (40.6%) |
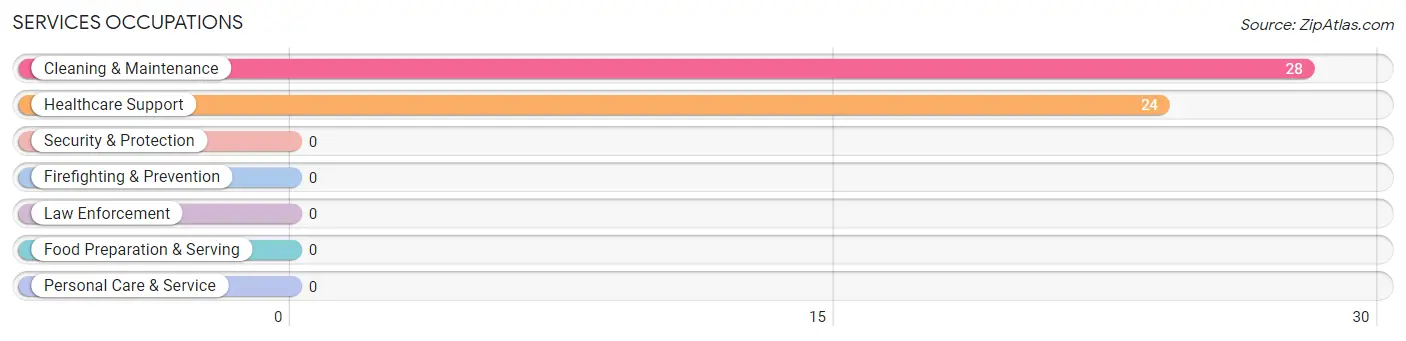
Services Occupations
The most common Services occupations in Lewistown Heights are Cleaning & Maintenance (28 | 8.7%), and Healthcare Support (24 | 7.4%).
Services Occupations by Sex
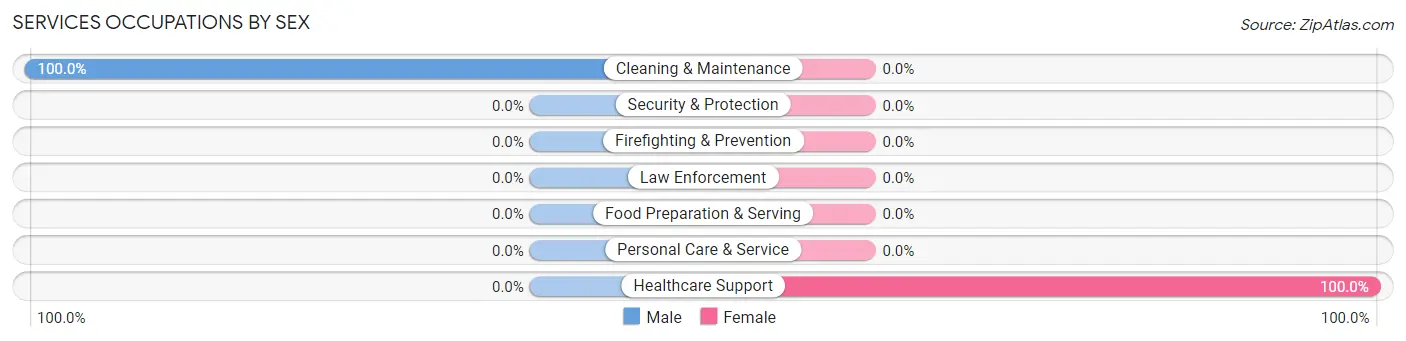
| Occupation | Male | Female |
| Healthcare Support | 0 (0.0%) | 24 (100.0%) |
| Security & Protection | 0 (0.0%) | 0 (0.0%) |
| Firefighting & Prevention | 0 (0.0%) | 0 (0.0%) |
| Law Enforcement | 0 (0.0%) | 0 (0.0%) |
| Food Preparation & Serving | 0 (0.0%) | 0 (0.0%) |
| Cleaning & Maintenance | 28 (100.0%) | 0 (0.0%) |
| Personal Care & Service | 0 (0.0%) | 0 (0.0%) |
| Total (Category) | 28 (53.8%) | 24 (46.2%) |
| Total (Overall) | 192 (59.4%) | 131 (40.6%) |
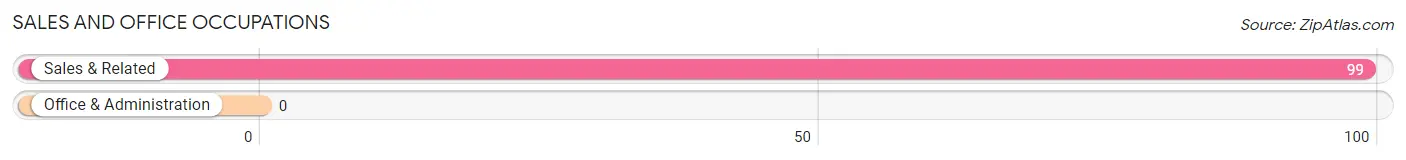
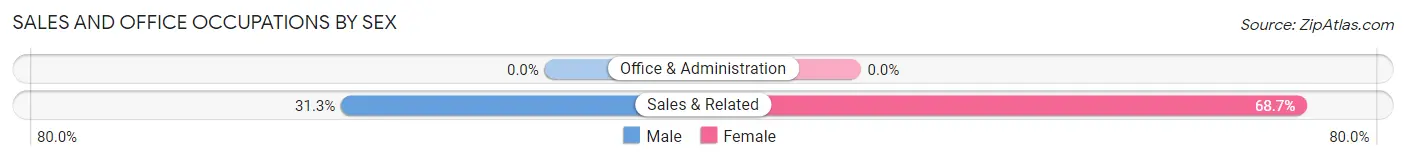
Sales and Office Occupations
The most common Sales and Office occupations in Lewistown Heights are , and Sales & Related (99 | 30.6%).
Sales and Office Occupations by Sex
| Occupation | Male | Female |
| Sales & Related | 31 (31.3%) | 68 (68.7%) |
| Office & Administration | 0 (0.0%) | 0 (0.0%) |
| Total (Category) | 31 (31.3%) | 68 (68.7%) |
| Total (Overall) | 192 (59.4%) | 131 (40.6%) |
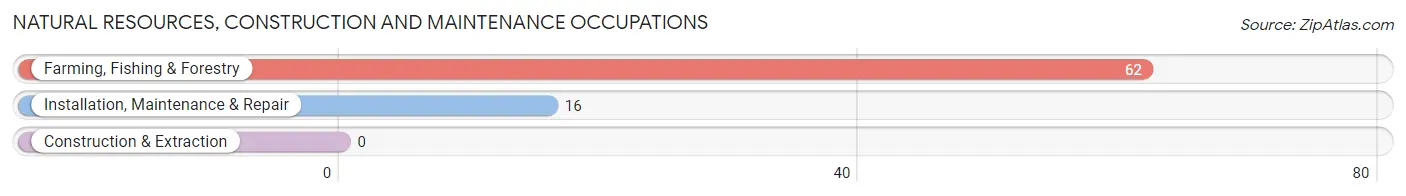
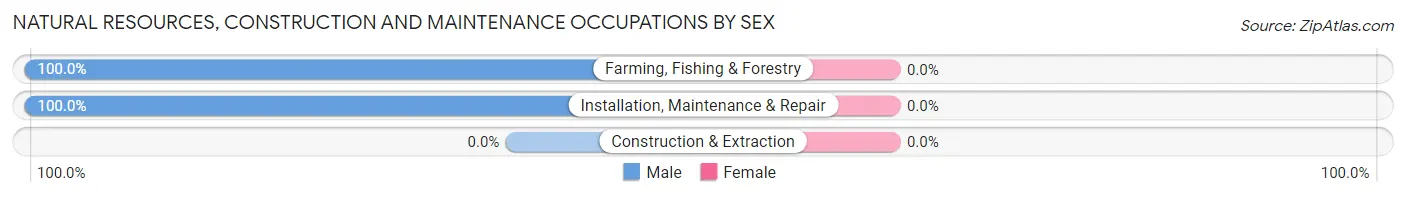
Natural Resources, Construction and Maintenance Occupations
The most common Natural Resources, Construction and Maintenance occupations in Lewistown Heights are Farming, Fishing & Forestry (62 | 19.2%), and Installation, Maintenance & Repair (16 | 5.0%).
Natural Resources, Construction and Maintenance Occupations by Sex
| Occupation | Male | Female |
| Farming, Fishing & Forestry | 62 (100.0%) | 0 (0.0%) |
| Construction & Extraction | 0 (0.0%) | 0 (0.0%) |
| Installation, Maintenance & Repair | 16 (100.0%) | 0 (0.0%) |
| Total (Category) | 78 (100.0%) | 0 (0.0%) |
| Total (Overall) | 192 (59.4%) | 131 (40.6%) |
Production, Transportation and Moving Occupations
The most common Production, Transportation and Moving occupations in Lewistown Heights are , and Production (29 | 9.0%).
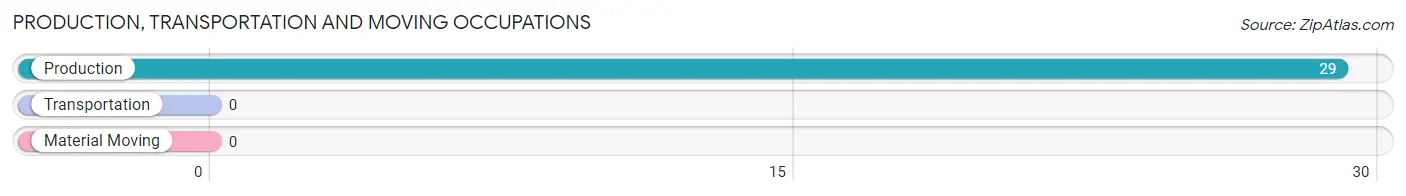
Production, Transportation and Moving Occupations by Sex
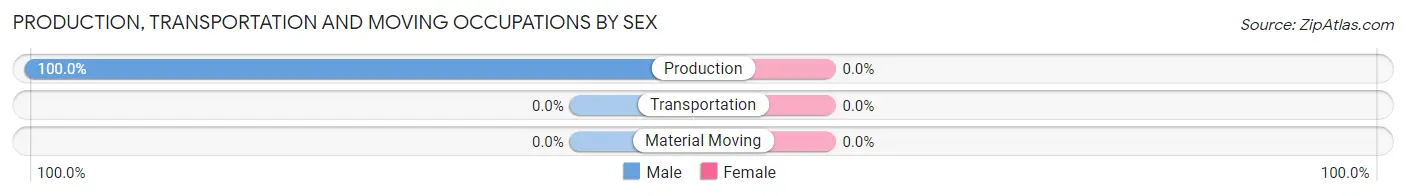
| Occupation | Male | Female |
| Production | 29 (100.0%) | 0 (0.0%) |
| Transportation | 0 (0.0%) | 0 (0.0%) |
| Material Moving | 0 (0.0%) | 0 (0.0%) |
| Total (Category) | 29 (100.0%) | 0 (0.0%) |
| Total (Overall) | 192 (59.4%) | 131 (40.6%) |
Employment Industries by Sex in Lewistown Heights
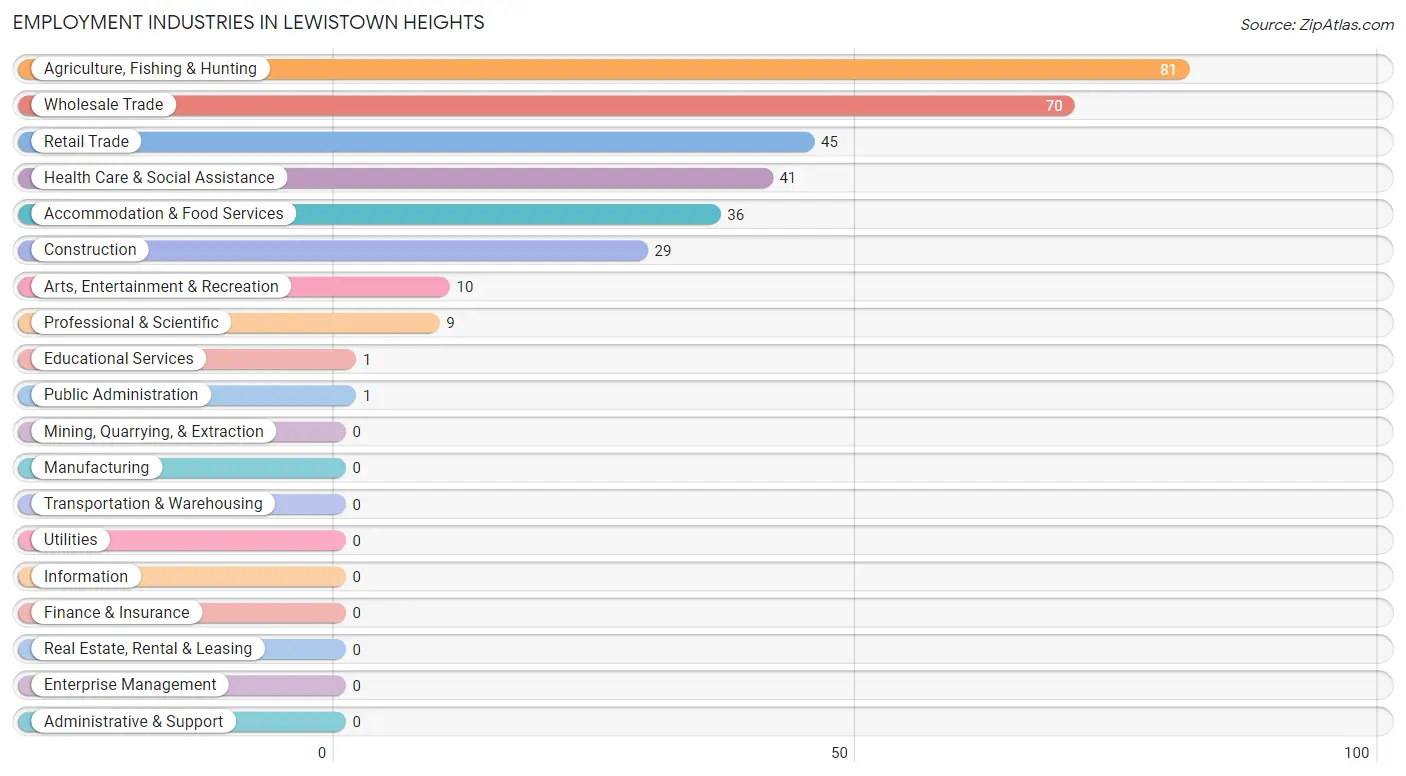
Employment Industries in Lewistown Heights
The major employment industries in Lewistown Heights include Agriculture, Fishing & Hunting (81 | 25.1%), Wholesale Trade (70 | 21.7%), Retail Trade (45 | 13.9%), Health Care & Social Assistance (41 | 12.7%), and Accommodation & Food Services (36 | 11.2%).
Employment Industries by Sex in Lewistown Heights
The Lewistown Heights industries that see more men than women are Agriculture, Fishing & Hunting (100.0%), Construction (100.0%), and Educational Services (100.0%), whereas the industries that tend to have a higher number of women are Professional & Scientific (100.0%), Arts, Entertainment & Recreation (100.0%), and Public Administration (100.0%).
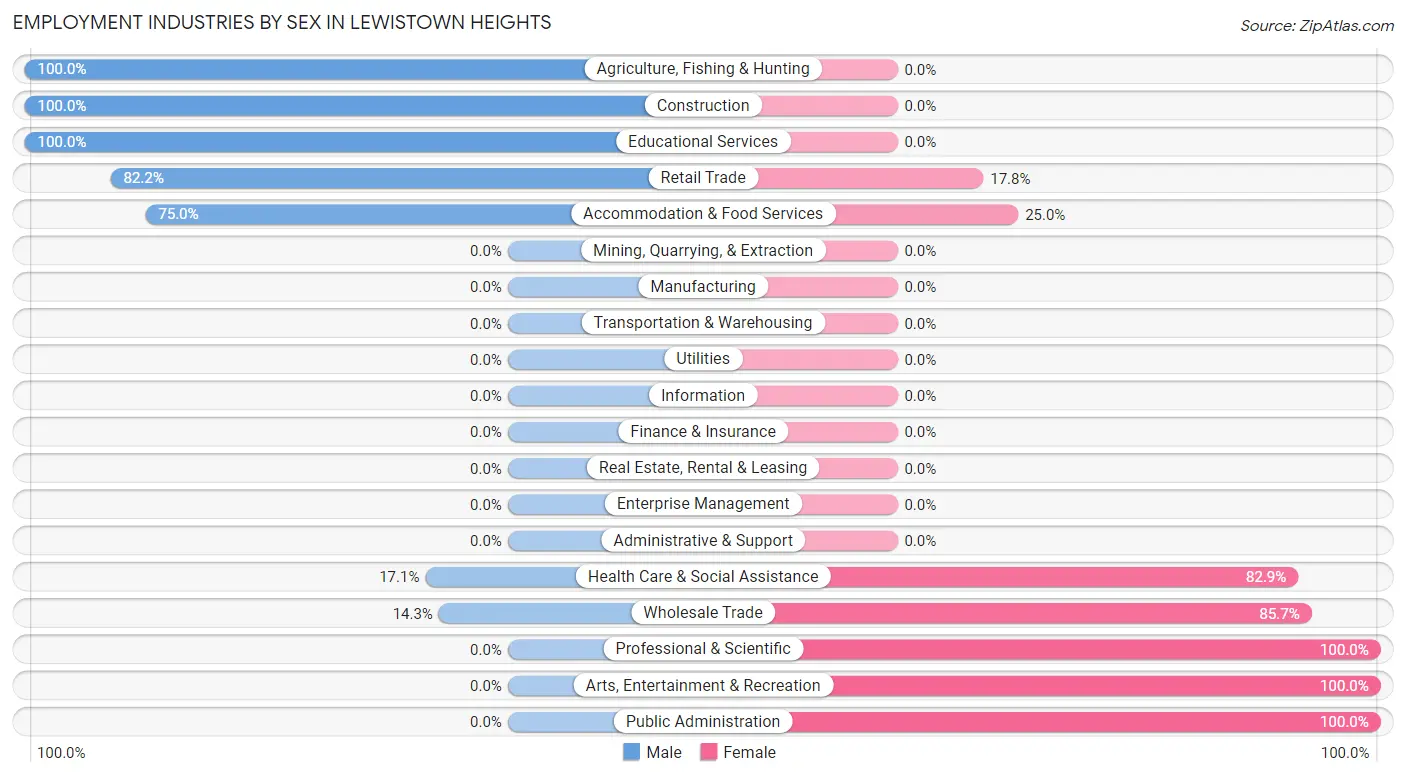
| Industry | Male | Female |
| Agriculture, Fishing & Hunting | 81 (100.0%) | 0 (0.0%) |
| Mining, Quarrying, & Extraction | 0 (0.0%) | 0 (0.0%) |
| Construction | 29 (100.0%) | 0 (0.0%) |
| Manufacturing | 0 (0.0%) | 0 (0.0%) |
| Wholesale Trade | 10 (14.3%) | 60 (85.7%) |
| Retail Trade | 37 (82.2%) | 8 (17.8%) |
| Transportation & Warehousing | 0 (0.0%) | 0 (0.0%) |
| Utilities | 0 (0.0%) | 0 (0.0%) |
| Information | 0 (0.0%) | 0 (0.0%) |
| Finance & Insurance | 0 (0.0%) | 0 (0.0%) |
| Real Estate, Rental & Leasing | 0 (0.0%) | 0 (0.0%) |
| Professional & Scientific | 0 (0.0%) | 9 (100.0%) |
| Enterprise Management | 0 (0.0%) | 0 (0.0%) |
| Administrative & Support | 0 (0.0%) | 0 (0.0%) |
| Educational Services | 1 (100.0%) | 0 (0.0%) |
| Health Care & Social Assistance | 7 (17.1%) | 34 (82.9%) |
| Arts, Entertainment & Recreation | 0 (0.0%) | 10 (100.0%) |
| Accommodation & Food Services | 27 (75.0%) | 9 (25.0%) |
| Public Administration | 0 (0.0%) | 1 (100.0%) |
| Total | 192 (59.4%) | 131 (40.6%) |
Education in Lewistown Heights
School Enrollment in Lewistown Heights
The most common levels of schooling among the 127 students in Lewistown Heights are college / undergraduate (79 | 62.2%), middle school (26 | 20.5%), and elementary school (22 | 17.3%).
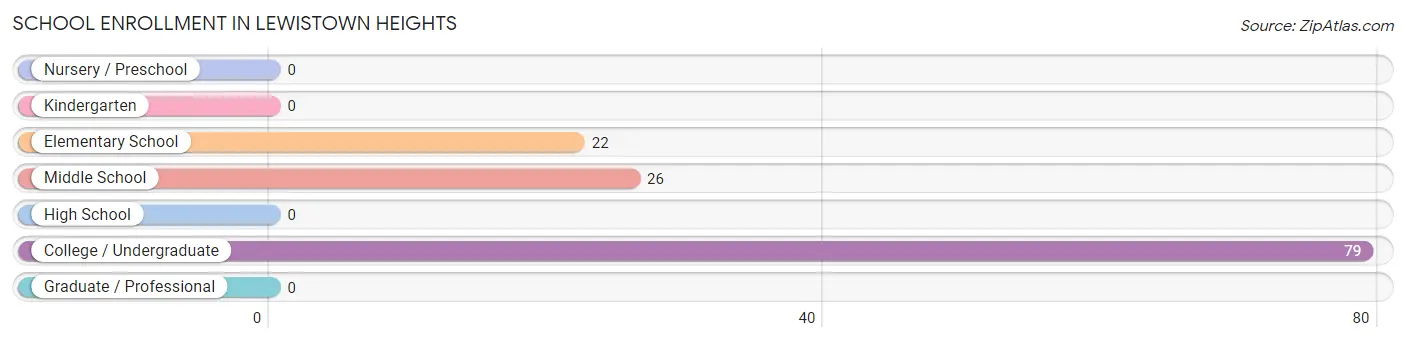
| School Level | # Students | % Students |
| Nursery / Preschool | 0 | 0.0% |
| Kindergarten | 0 | 0.0% |
| Elementary School | 22 | 17.3% |
| Middle School | 26 | 20.5% |
| High School | 0 | 0.0% |
| College / Undergraduate | 79 | 62.2% |
| Graduate / Professional | 0 | 0.0% |
| Total | 127 | 100.0% |
School Enrollment by Age by Funding Source in Lewistown Heights
Out of a total of 127 students who are enrolled in schools in Lewistown Heights, 93 (73.2%) attend a private institution, while the remaining 34 (26.8%) are enrolled in public schools. The age group of 25 to 34 year olds has the highest likelihood of being enrolled in private schools, with 79 (100.0% in the age bracket) enrolled. Conversely, the age group of 10 to 14 year olds has the lowest likelihood of being enrolled in a private school, with 26 (100.0% in the age bracket) attending a public institution.
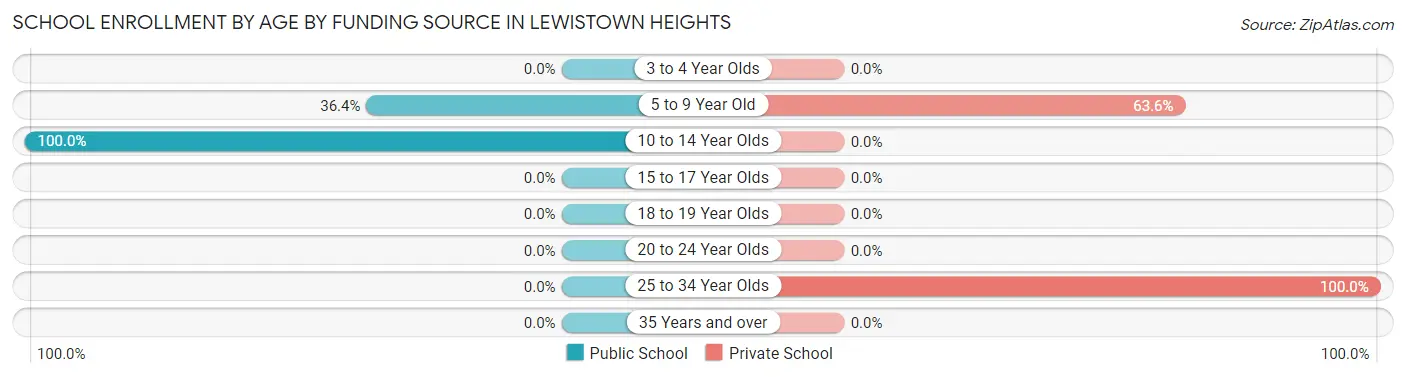
| Age Bracket | Public School | Private School |
| 3 to 4 Year Olds | 0 (0.0%) | 0 (0.0%) |
| 5 to 9 Year Old | 8 (36.4%) | 14 (63.6%) |
| 10 to 14 Year Olds | 26 (100.0%) | 0 (0.0%) |
| 15 to 17 Year Olds | 0 (0.0%) | 0 (0.0%) |
| 18 to 19 Year Olds | 0 (0.0%) | 0 (0.0%) |
| 20 to 24 Year Olds | 0 (0.0%) | 0 (0.0%) |
| 25 to 34 Year Olds | 0 (0.0%) | 79 (100.0%) |
| 35 Years and over | 0 (0.0%) | 0 (0.0%) |
| Total | 34 (26.8%) | 93 (73.2%) |
Educational Attainment by Field of Study in Lewistown Heights
Business (21 | 38.2%), bio, nature & agricultural (17 | 30.9%), education (16 | 29.1%), and science & technology (1 | 1.8%) are the most common fields of study among 55 individuals in Lewistown Heights who have obtained a bachelor's degree or higher.
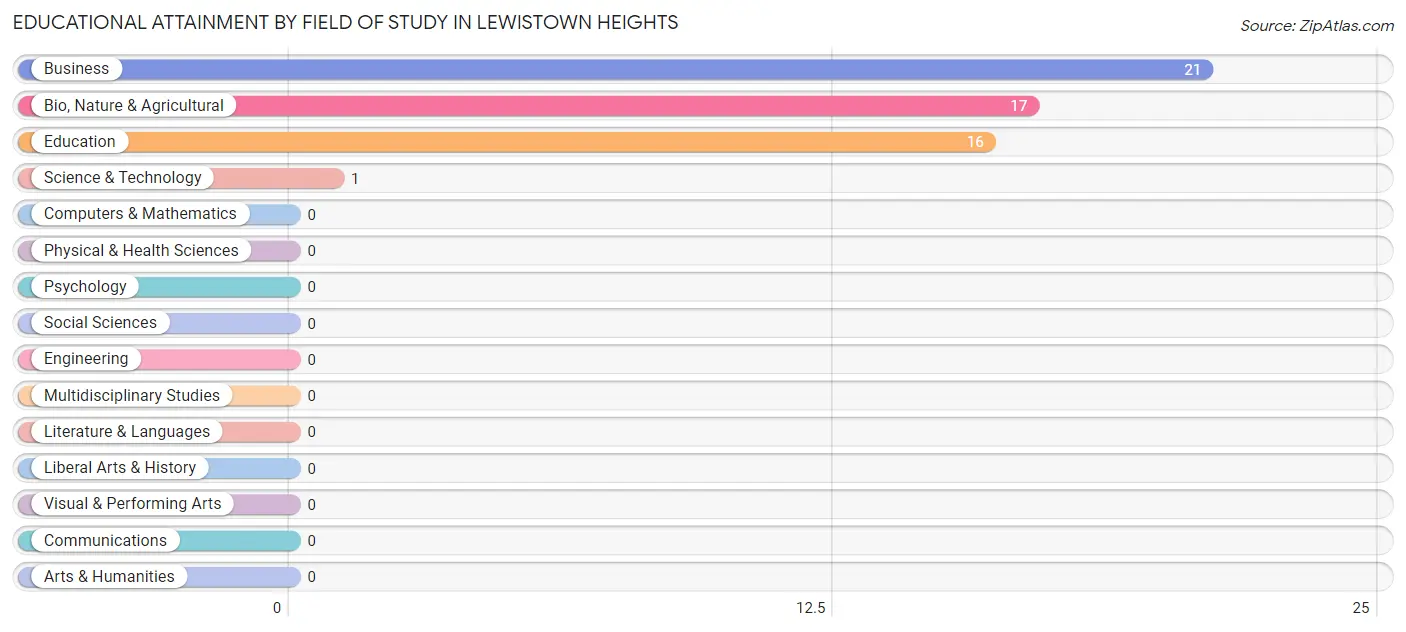
| Field of Study | # Graduates | % Graduates |
| Computers & Mathematics | 0 | 0.0% |
| Bio, Nature & Agricultural | 17 | 30.9% |
| Physical & Health Sciences | 0 | 0.0% |
| Psychology | 0 | 0.0% |
| Social Sciences | 0 | 0.0% |
| Engineering | 0 | 0.0% |
| Multidisciplinary Studies | 0 | 0.0% |
| Science & Technology | 1 | 1.8% |
| Business | 21 | 38.2% |
| Education | 16 | 29.1% |
| Literature & Languages | 0 | 0.0% |
| Liberal Arts & History | 0 | 0.0% |
| Visual & Performing Arts | 0 | 0.0% |
| Communications | 0 | 0.0% |
| Arts & Humanities | 0 | 0.0% |
| Total | 55 | 100.0% |
Transportation & Commute in Lewistown Heights
Vehicle Availability by Sex in Lewistown Heights
The most prevalent vehicle ownership categories in Lewistown Heights are males with 2 vehicles (95, accounting for 49.5%) and females with 2 vehicles (20, making up 72.5%).
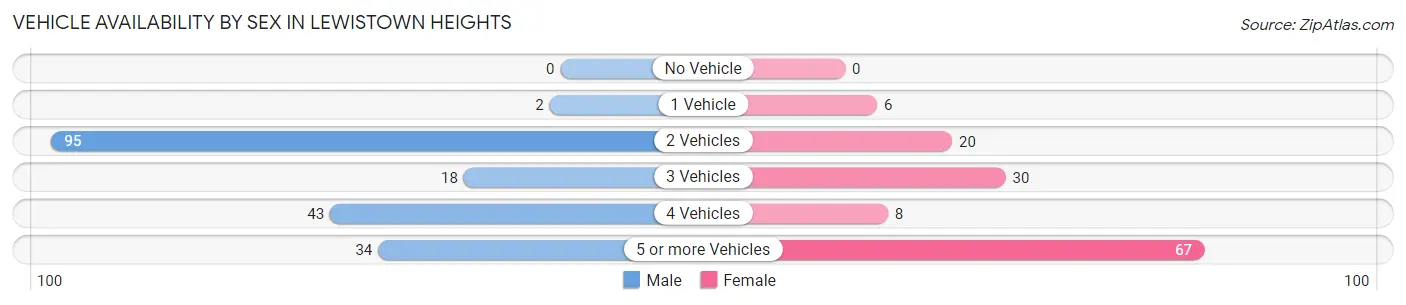
| Vehicles Available | Male | Female |
| No Vehicle | 0 (0.0%) | 0 (0.0%) |
| 1 Vehicle | 2 (1.0%) | 6 (4.6%) |
| 2 Vehicles | 95 (49.5%) | 20 (15.3%) |
| 3 Vehicles | 18 (9.4%) | 30 (22.9%) |
| 4 Vehicles | 43 (22.4%) | 8 (6.1%) |
| 5 or more Vehicles | 34 (17.7%) | 67 (51.1%) |
| Total | 192 (100.0%) | 131 (100.0%) |
Commute Time in Lewistown Heights
The most frequently occuring commute durations in Lewistown Heights are 30 to 34 minutes (71 commuters, 23.1%), 60 to 89 minutes (62 commuters, 20.1%), and 15 to 19 minutes (53 commuters, 17.2%).
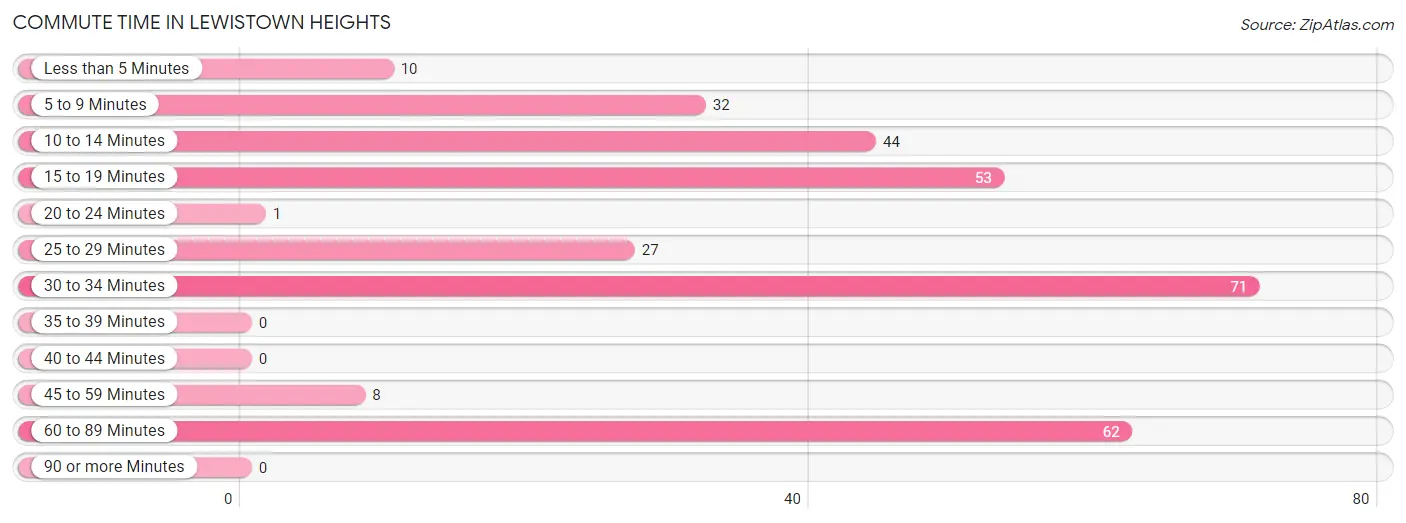
| Commute Time | # Commuters | % Commuters |
| Less than 5 Minutes | 10 | 3.3% |
| 5 to 9 Minutes | 32 | 10.4% |
| 10 to 14 Minutes | 44 | 14.3% |
| 15 to 19 Minutes | 53 | 17.2% |
| 20 to 24 Minutes | 1 | 0.3% |
| 25 to 29 Minutes | 27 | 8.8% |
| 30 to 34 Minutes | 71 | 23.1% |
| 35 to 39 Minutes | 0 | 0.0% |
| 40 to 44 Minutes | 0 | 0.0% |
| 45 to 59 Minutes | 8 | 2.6% |
| 60 to 89 Minutes | 62 | 20.1% |
| 90 or more Minutes | 0 | 0.0% |
Commute Time by Sex in Lewistown Heights
The most common commute times in Lewistown Heights are 60 to 89 minutes (62 commuters, 33.7%) for males and 30 to 34 minutes (60 commuters, 48.4%) for females.
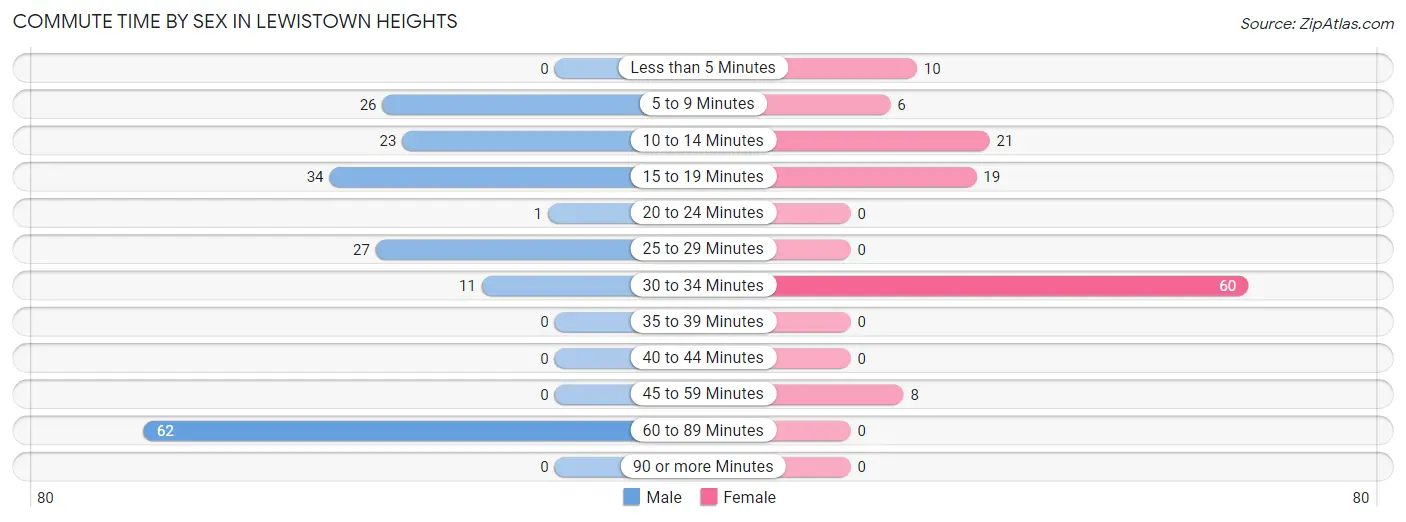
| Commute Time | Male | Female |
| Less than 5 Minutes | 0 (0.0%) | 10 (8.1%) |
| 5 to 9 Minutes | 26 (14.1%) | 6 (4.8%) |
| 10 to 14 Minutes | 23 (12.5%) | 21 (16.9%) |
| 15 to 19 Minutes | 34 (18.5%) | 19 (15.3%) |
| 20 to 24 Minutes | 1 (0.5%) | 0 (0.0%) |
| 25 to 29 Minutes | 27 (14.7%) | 0 (0.0%) |
| 30 to 34 Minutes | 11 (6.0%) | 60 (48.4%) |
| 35 to 39 Minutes | 0 (0.0%) | 0 (0.0%) |
| 40 to 44 Minutes | 0 (0.0%) | 0 (0.0%) |
| 45 to 59 Minutes | 0 (0.0%) | 8 (6.5%) |
| 60 to 89 Minutes | 62 (33.7%) | 0 (0.0%) |
| 90 or more Minutes | 0 (0.0%) | 0 (0.0%) |
Time of Departure to Work by Sex in Lewistown Heights
The most frequent times of departure to work in Lewistown Heights are 12:00 PM to 3:59 PM (62, 33.7%) for males and 7:00 AM to 7:29 AM (90, 72.6%) for females.
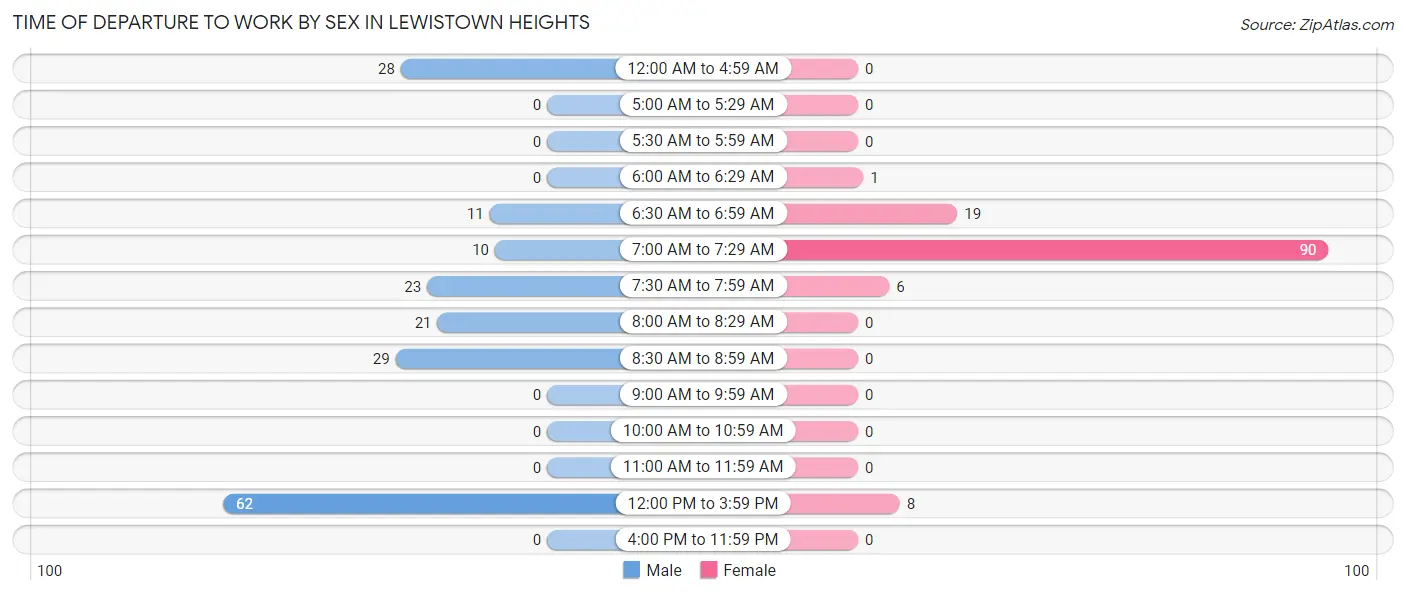
| Time of Departure | Male | Female |
| 12:00 AM to 4:59 AM | 28 (15.2%) | 0 (0.0%) |
| 5:00 AM to 5:29 AM | 0 (0.0%) | 0 (0.0%) |
| 5:30 AM to 5:59 AM | 0 (0.0%) | 0 (0.0%) |
| 6:00 AM to 6:29 AM | 0 (0.0%) | 1 (0.8%) |
| 6:30 AM to 6:59 AM | 11 (6.0%) | 19 (15.3%) |
| 7:00 AM to 7:29 AM | 10 (5.4%) | 90 (72.6%) |
| 7:30 AM to 7:59 AM | 23 (12.5%) | 6 (4.8%) |
| 8:00 AM to 8:29 AM | 21 (11.4%) | 0 (0.0%) |
| 8:30 AM to 8:59 AM | 29 (15.8%) | 0 (0.0%) |
| 9:00 AM to 9:59 AM | 0 (0.0%) | 0 (0.0%) |
| 10:00 AM to 10:59 AM | 0 (0.0%) | 0 (0.0%) |
| 11:00 AM to 11:59 AM | 0 (0.0%) | 0 (0.0%) |
| 12:00 PM to 3:59 PM | 62 (33.7%) | 8 (6.5%) |
| 4:00 PM to 11:59 PM | 0 (0.0%) | 0 (0.0%) |
| Total | 184 (100.0%) | 124 (100.0%) |
Housing Occupancy in Lewistown Heights
Occupancy by Ownership in Lewistown Heights
Of the total 184 dwellings in Lewistown Heights, owner-occupied units account for 95 (51.6%), while renter-occupied units make up 89 (48.4%).
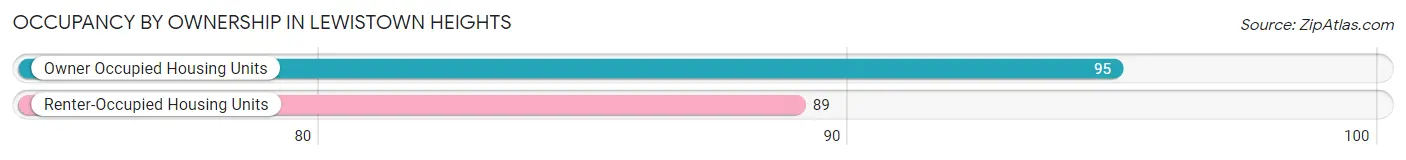
| Occupancy | # Housing Units | % Housing Units |
| Owner Occupied Housing Units | 95 | 51.6% |
| Renter-Occupied Housing Units | 89 | 48.4% |
| Total Occupied Housing Units | 184 | 100.0% |
Occupancy by Household Size in Lewistown Heights
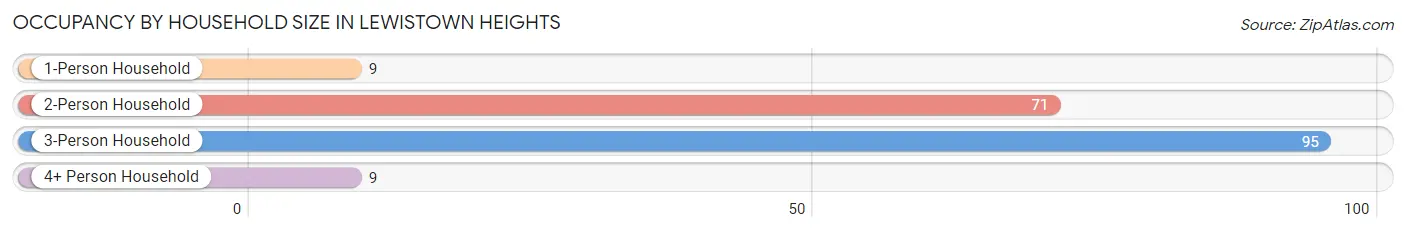
| Household Size | # Housing Units | % Housing Units |
| 1-Person Household | 9 | 4.9% |
| 2-Person Household | 71 | 38.6% |
| 3-Person Household | 95 | 51.6% |
| 4+ Person Household | 9 | 4.9% |
| Total Housing Units | 184 | 100.0% |
Occupancy by Ownership by Household Size in Lewistown Heights
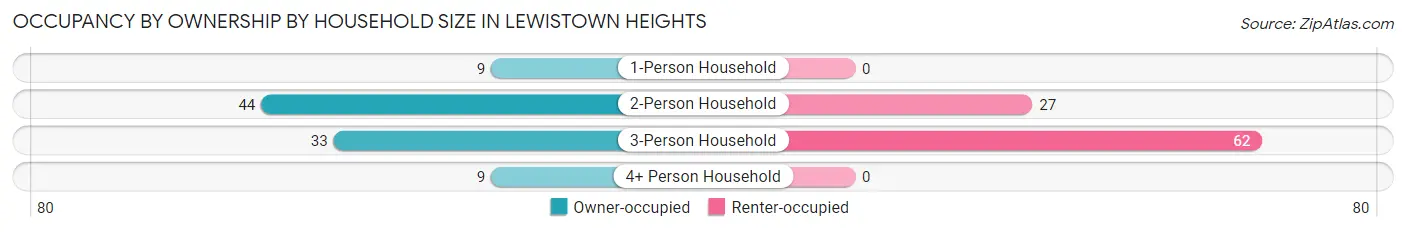
| Household Size | Owner-occupied | Renter-occupied |
| 1-Person Household | 9 (100.0%) | 0 (0.0%) |
| 2-Person Household | 44 (62.0%) | 27 (38.0%) |
| 3-Person Household | 33 (34.7%) | 62 (65.3%) |
| 4+ Person Household | 9 (100.0%) | 0 (0.0%) |
| Total Housing Units | 95 (51.6%) | 89 (48.4%) |
Occupancy by Educational Attainment in Lewistown Heights
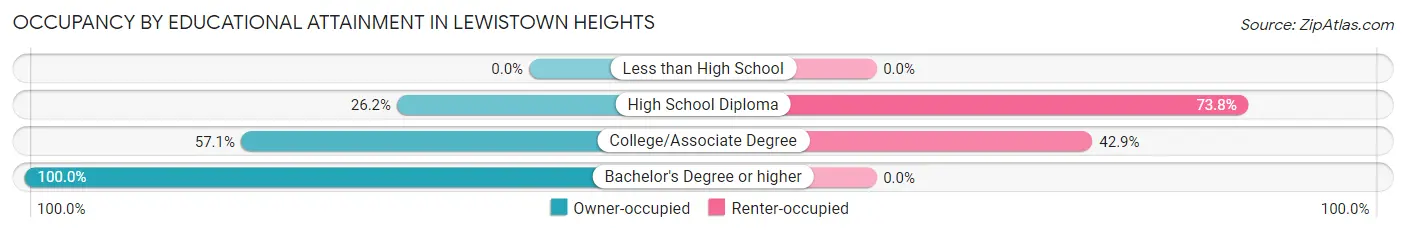
| Household Size | Owner-occupied | Renter-occupied |
| Less than High School | 0 (0.0%) | 0 (0.0%) |
| High School Diploma | 22 (26.2%) | 62 (73.8%) |
| College/Associate Degree | 36 (57.1%) | 27 (42.9%) |
| Bachelor's Degree or higher | 37 (100.0%) | 0 (0.0%) |
Occupancy by Age of Householder in Lewistown Heights
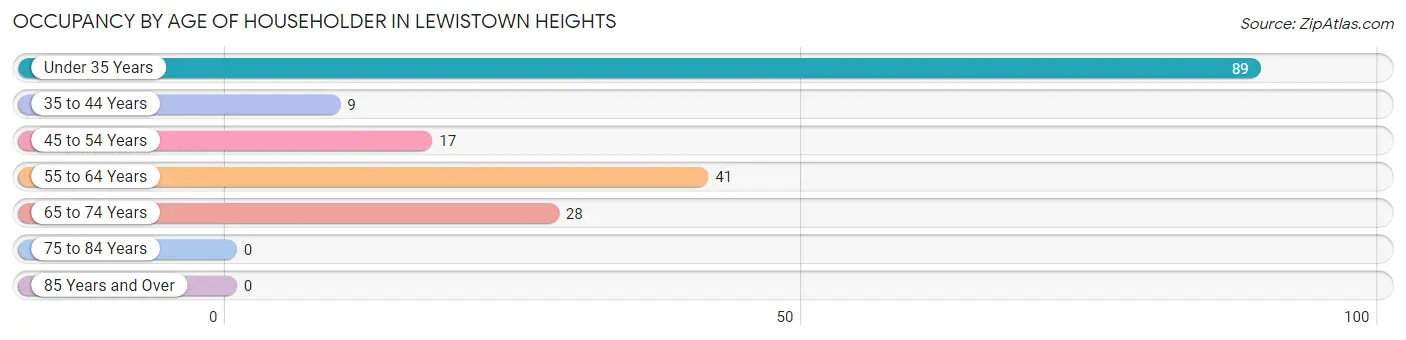
| Age Bracket | # Households | % Households |
| Under 35 Years | 89 | 48.4% |
| 35 to 44 Years | 9 | 4.9% |
| 45 to 54 Years | 17 | 9.2% |
| 55 to 64 Years | 41 | 22.3% |
| 65 to 74 Years | 28 | 15.2% |
| 75 to 84 Years | 0 | 0.0% |
| 85 Years and Over | 0 | 0.0% |
| Total | 184 | 100.0% |
Housing Finances in Lewistown Heights
Median Income by Occupancy in Lewistown Heights
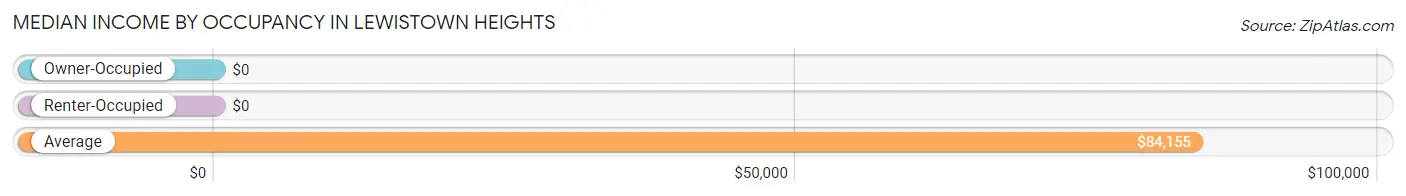
| Occupancy Type | # Households | Median Income |
| Owner-Occupied | 95 (51.6%) | $0 |
| Renter-Occupied | 89 (48.4%) | $0 |
| Average | 184 (100.0%) | $84,155 |
Occupancy by Householder Income Bracket in Lewistown Heights
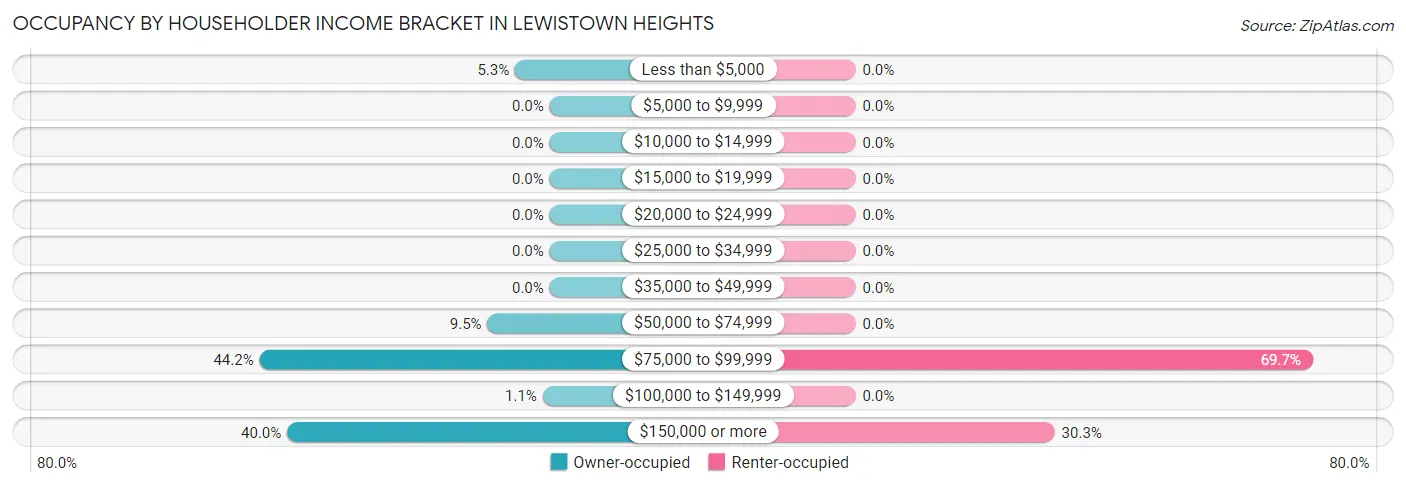
| Income Bracket | Owner-occupied | Renter-occupied |
| Less than $5,000 | 5 (5.3%) | 0 (0.0%) |
| $5,000 to $9,999 | 0 (0.0%) | 0 (0.0%) |
| $10,000 to $14,999 | 0 (0.0%) | 0 (0.0%) |
| $15,000 to $19,999 | 0 (0.0%) | 0 (0.0%) |
| $20,000 to $24,999 | 0 (0.0%) | 0 (0.0%) |
| $25,000 to $34,999 | 0 (0.0%) | 0 (0.0%) |
| $35,000 to $49,999 | 0 (0.0%) | 0 (0.0%) |
| $50,000 to $74,999 | 9 (9.5%) | 0 (0.0%) |
| $75,000 to $99,999 | 42 (44.2%) | 62 (69.7%) |
| $100,000 to $149,999 | 1 (1.1%) | 0 (0.0%) |
| $150,000 or more | 38 (40.0%) | 27 (30.3%) |
| Total | 95 (100.0%) | 89 (100.0%) |
Monthly Housing Cost Tiers in Lewistown Heights
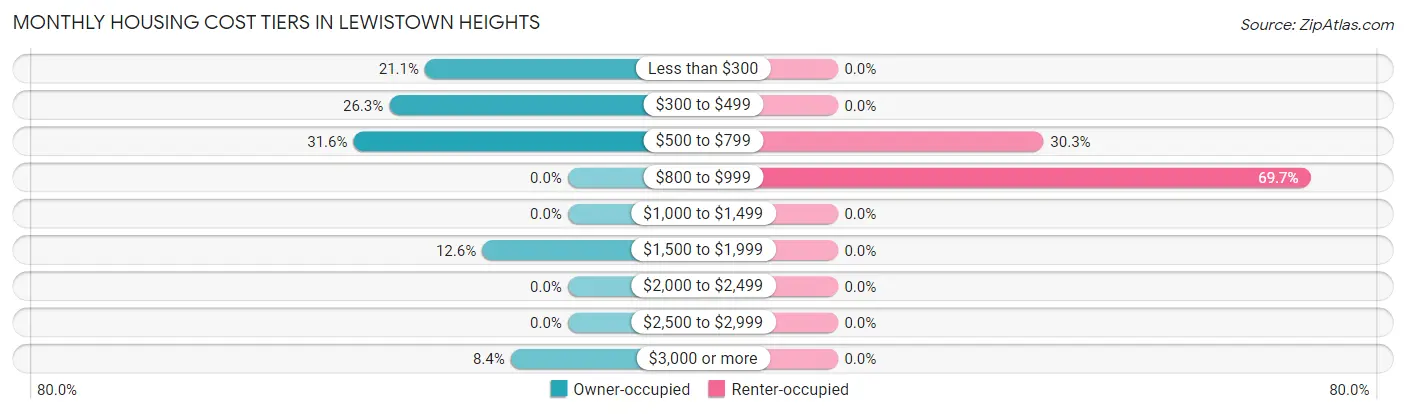
| Monthly Cost | Owner-occupied | Renter-occupied |
| Less than $300 | 20 (21.0%) | 0 (0.0%) |
| $300 to $499 | 25 (26.3%) | 0 (0.0%) |
| $500 to $799 | 30 (31.6%) | 27 (30.3%) |
| $800 to $999 | 0 (0.0%) | 62 (69.7%) |
| $1,000 to $1,499 | 0 (0.0%) | 0 (0.0%) |
| $1,500 to $1,999 | 12 (12.6%) | 0 (0.0%) |
| $2,000 to $2,499 | 0 (0.0%) | 0 (0.0%) |
| $2,500 to $2,999 | 0 (0.0%) | 0 (0.0%) |
| $3,000 or more | 8 (8.4%) | 0 (0.0%) |
| Total | 95 (100.0%) | 89 (100.0%) |
Physical Housing Characteristics in Lewistown Heights
Housing Structures in Lewistown Heights
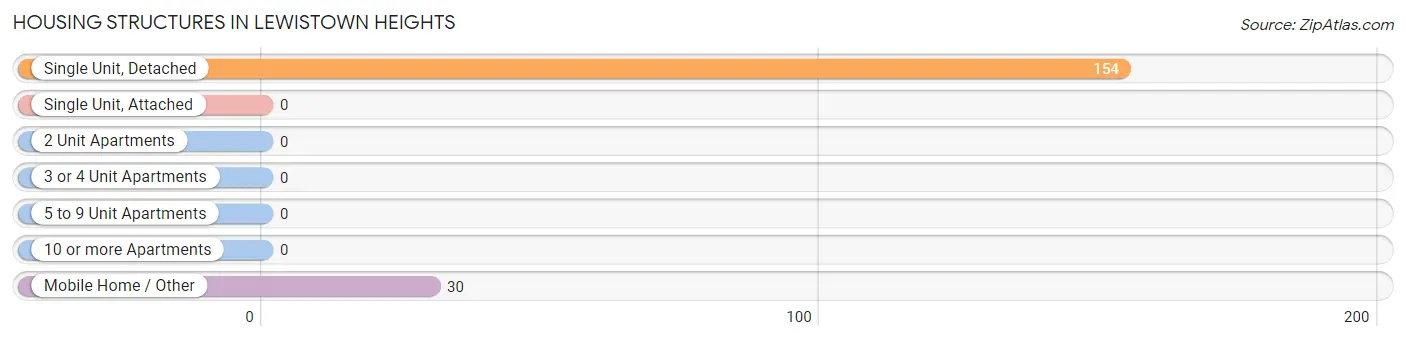
| Structure Type | # Housing Units | % Housing Units |
| Single Unit, Detached | 154 | 83.7% |
| Single Unit, Attached | 0 | 0.0% |
| 2 Unit Apartments | 0 | 0.0% |
| 3 or 4 Unit Apartments | 0 | 0.0% |
| 5 to 9 Unit Apartments | 0 | 0.0% |
| 10 or more Apartments | 0 | 0.0% |
| Mobile Home / Other | 30 | 16.3% |
| Total | 184 | 100.0% |
Housing Structures by Occupancy in Lewistown Heights
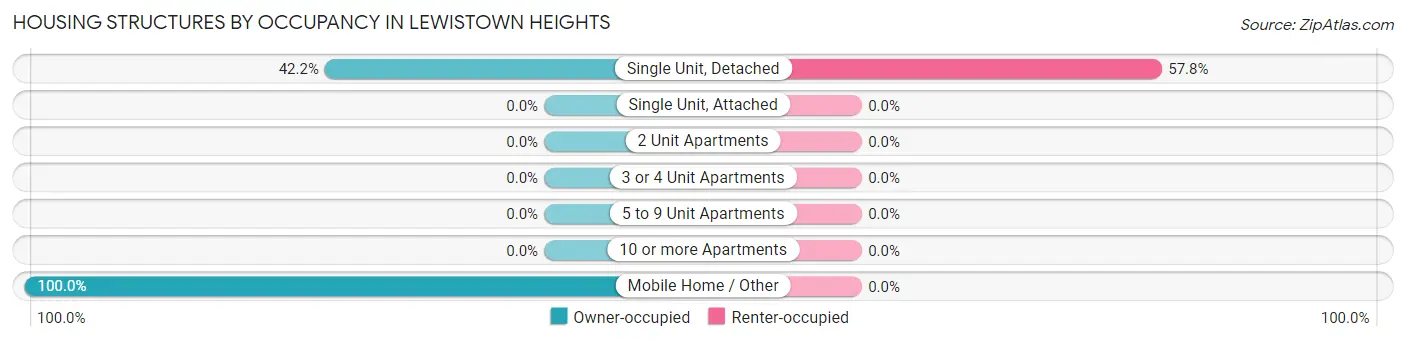
| Structure Type | Owner-occupied | Renter-occupied |
| Single Unit, Detached | 65 (42.2%) | 89 (57.8%) |
| Single Unit, Attached | 0 (0.0%) | 0 (0.0%) |
| 2 Unit Apartments | 0 (0.0%) | 0 (0.0%) |
| 3 or 4 Unit Apartments | 0 (0.0%) | 0 (0.0%) |
| 5 to 9 Unit Apartments | 0 (0.0%) | 0 (0.0%) |
| 10 or more Apartments | 0 (0.0%) | 0 (0.0%) |
| Mobile Home / Other | 30 (100.0%) | 0 (0.0%) |
| Total | 95 (51.6%) | 89 (48.4%) |
Housing Structures by Number of Rooms in Lewistown Heights
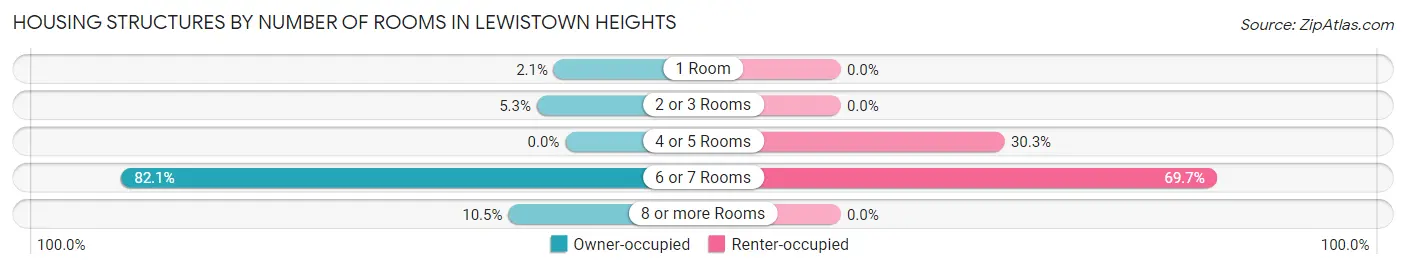
| Number of Rooms | Owner-occupied | Renter-occupied |
| 1 Room | 2 (2.1%) | 0 (0.0%) |
| 2 or 3 Rooms | 5 (5.3%) | 0 (0.0%) |
| 4 or 5 Rooms | 0 (0.0%) | 27 (30.3%) |
| 6 or 7 Rooms | 78 (82.1%) | 62 (69.7%) |
| 8 or more Rooms | 10 (10.5%) | 0 (0.0%) |
| Total | 95 (100.0%) | 89 (100.0%) |
Housing Structure by Heating Type in Lewistown Heights
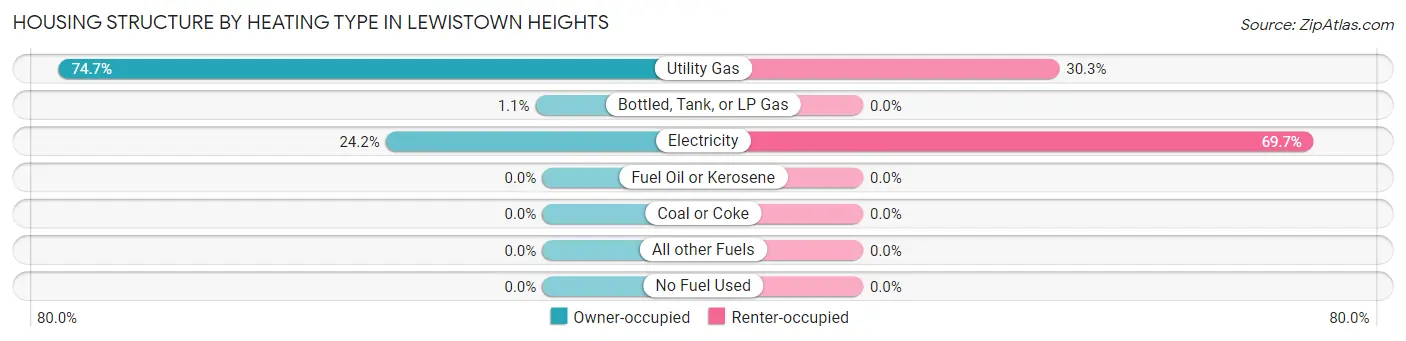
| Heating Type | Owner-occupied | Renter-occupied |
| Utility Gas | 71 (74.7%) | 27 (30.3%) |
| Bottled, Tank, or LP Gas | 1 (1.1%) | 0 (0.0%) |
| Electricity | 23 (24.2%) | 62 (69.7%) |
| Fuel Oil or Kerosene | 0 (0.0%) | 0 (0.0%) |
| Coal or Coke | 0 (0.0%) | 0 (0.0%) |
| All other Fuels | 0 (0.0%) | 0 (0.0%) |
| No Fuel Used | 0 (0.0%) | 0 (0.0%) |
| Total | 95 (100.0%) | 89 (100.0%) |
Household Vehicle Usage in Lewistown Heights
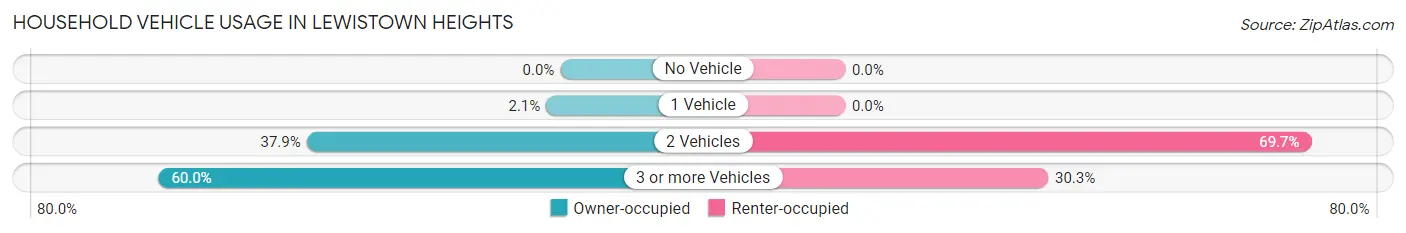
| Vehicles per Household | Owner-occupied | Renter-occupied |
| No Vehicle | 0 (0.0%) | 0 (0.0%) |
| 1 Vehicle | 2 (2.1%) | 0 (0.0%) |
| 2 Vehicles | 36 (37.9%) | 62 (69.7%) |
| 3 or more Vehicles | 57 (60.0%) | 27 (30.3%) |
| Total | 95 (100.0%) | 89 (100.0%) |
Real Estate & Mortgages in Lewistown Heights
Real Estate and Mortgage Overview in Lewistown Heights
| Characteristic | Without Mortgage | With Mortgage |
| Housing Units | 75 | 20 |
| Median Property Value | $273,400 | $725,000 |
| Median Household Income | $79,395 | $17 |
| Monthly Housing Costs | $453 | $8 |
| Real Estate Taxes | $979 | $0 |
Property Value by Mortgage Status in Lewistown Heights
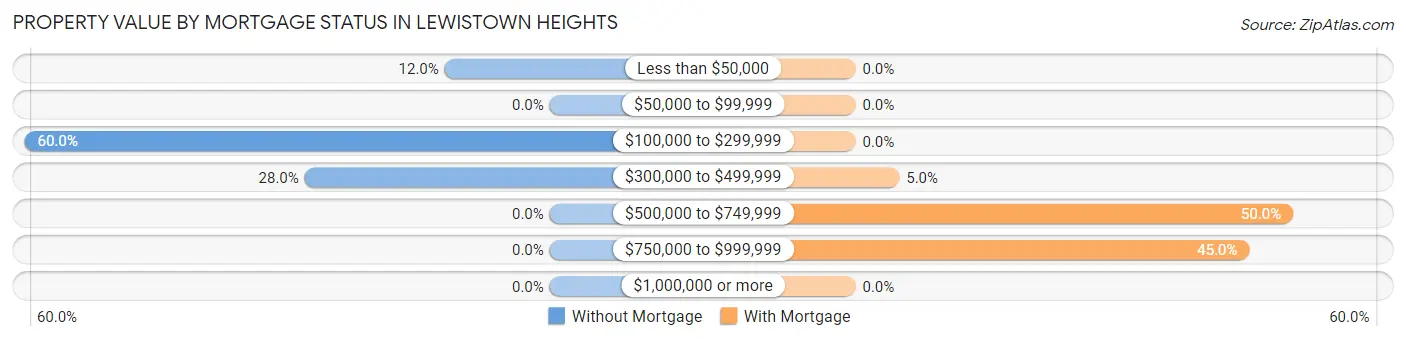
| Property Value | Without Mortgage | With Mortgage |
| Less than $50,000 | 9 (12.0%) | 0 (0.0%) |
| $50,000 to $99,999 | 0 (0.0%) | 0 (0.0%) |
| $100,000 to $299,999 | 45 (60.0%) | 0 (0.0%) |
| $300,000 to $499,999 | 21 (28.0%) | 1 (5.0%) |
| $500,000 to $749,999 | 0 (0.0%) | 10 (50.0%) |
| $750,000 to $999,999 | 0 (0.0%) | 9 (45.0%) |
| $1,000,000 or more | 0 (0.0%) | 0 (0.0%) |
| Total | 75 (100.0%) | 20 (100.0%) |
Household Income by Mortgage Status in Lewistown Heights
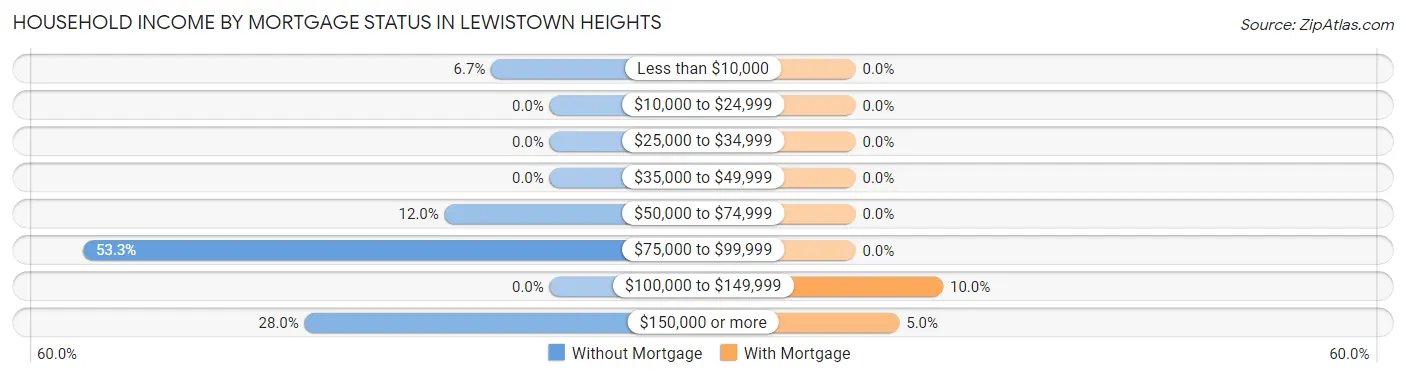
| Household Income | Without Mortgage | With Mortgage |
| Less than $10,000 | 5 (6.7%) | 0 (0.0%) |
| $10,000 to $24,999 | 0 (0.0%) | 0 (0.0%) |
| $25,000 to $34,999 | 0 (0.0%) | 0 (0.0%) |
| $35,000 to $49,999 | 0 (0.0%) | 0 (0.0%) |
| $50,000 to $74,999 | 9 (12.0%) | 0 (0.0%) |
| $75,000 to $99,999 | 40 (53.3%) | 0 (0.0%) |
| $100,000 to $149,999 | 0 (0.0%) | 2 (10.0%) |
| $150,000 or more | 21 (28.0%) | 1 (5.0%) |
| Total | 75 (100.0%) | 20 (100.0%) |
Property Value to Household Income Ratio in Lewistown Heights
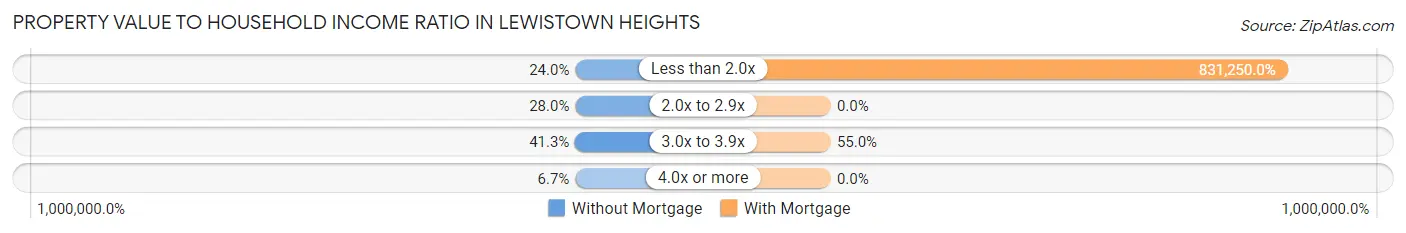
| Value-to-Income Ratio | Without Mortgage | With Mortgage |
| Less than 2.0x | 18 (24.0%) | 166,250 (831,250.0%) |
| 2.0x to 2.9x | 21 (28.0%) | 0 (0.0%) |
| 3.0x to 3.9x | 31 (41.3%) | 11 (55.0%) |
| 4.0x or more | 5 (6.7%) | 0 (0.0%) |
| Total | 75 (100.0%) | 20 (100.0%) |
Real Estate Taxes by Mortgage Status in Lewistown Heights
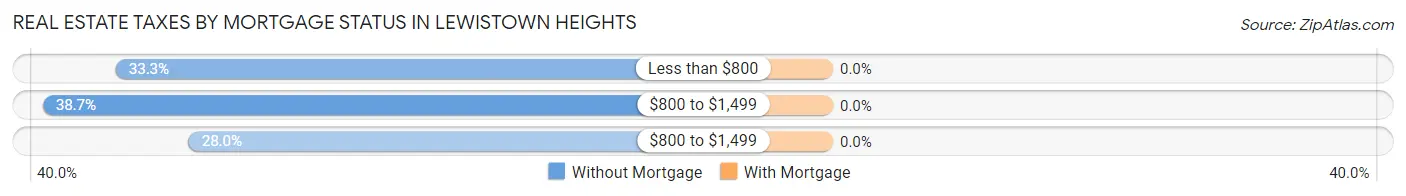
| Property Taxes | Without Mortgage | With Mortgage |
| Less than $800 | 25 (33.3%) | 0 (0.0%) |
| $800 to $1,499 | 29 (38.7%) | 0 (0.0%) |
| $800 to $1,499 | 21 (28.0%) | 0 (0.0%) |
| Total | 75 (100.0%) | 20 (100.0%) |
Health & Disability in Lewistown Heights
Health Insurance Coverage by Age in Lewistown Heights
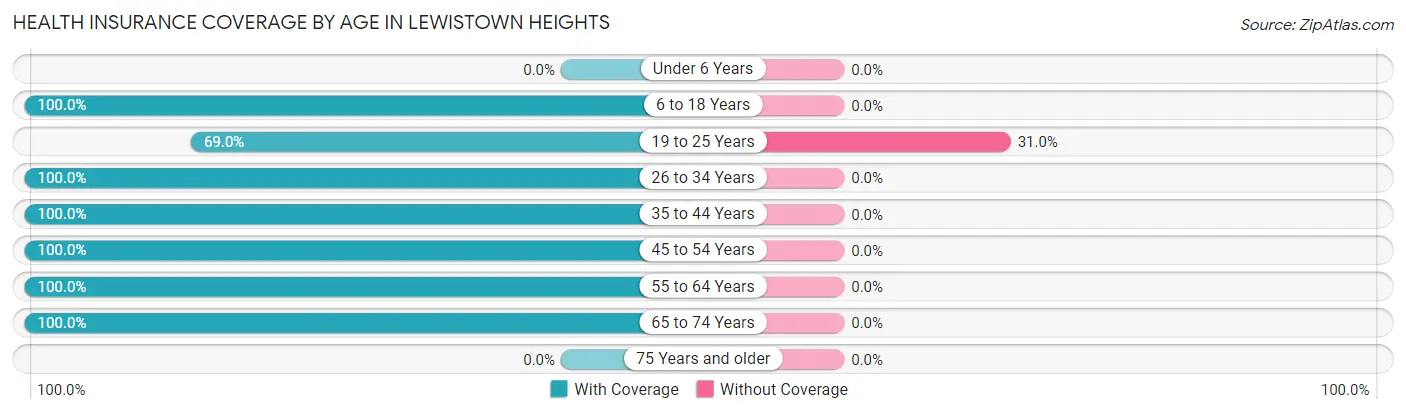
| Age Bracket | With Coverage | Without Coverage |
| Under 6 Years | 0 (0.0%) | 0 (0.0%) |
| 6 to 18 Years | 110 (100.0%) | 0 (0.0%) |
| 19 to 25 Years | 60 (69.0%) | 27 (31.0%) |
| 26 to 34 Years | 106 (100.0%) | 0 (0.0%) |
| 35 to 44 Years | 40 (100.0%) | 0 (0.0%) |
| 45 to 54 Years | 31 (100.0%) | 0 (0.0%) |
| 55 to 64 Years | 68 (100.0%) | 0 (0.0%) |
| 65 to 74 Years | 44 (100.0%) | 0 (0.0%) |
| 75 Years and older | 0 (0.0%) | 0 (0.0%) |
| Total | 459 (94.4%) | 27 (5.6%) |
Health Insurance Coverage by Citizenship Status in Lewistown Heights
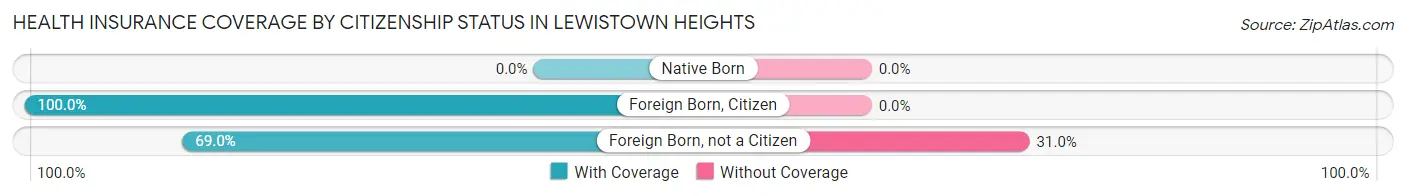
| Citizenship Status | With Coverage | Without Coverage |
| Native Born | 0 (0.0%) | 0 (0.0%) |
| Foreign Born, Citizen | 110 (100.0%) | 0 (0.0%) |
| Foreign Born, not a Citizen | 60 (69.0%) | 27 (31.0%) |
Health Insurance Coverage by Household Income in Lewistown Heights
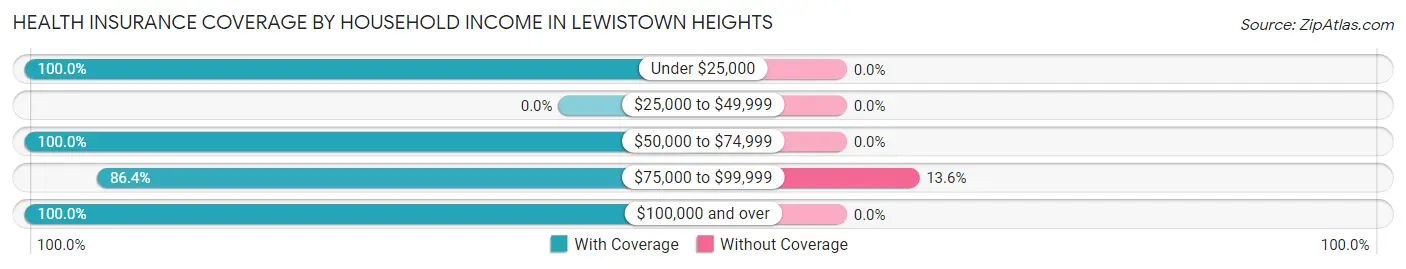
| Household Income | With Coverage | Without Coverage |
| Under $25,000 | 31 (100.0%) | 0 (0.0%) |
| $25,000 to $49,999 | 0 (0.0%) | 0 (0.0%) |
| $50,000 to $74,999 | 9 (100.0%) | 0 (0.0%) |
| $75,000 to $99,999 | 172 (86.4%) | 27 (13.6%) |
| $100,000 and over | 247 (100.0%) | 0 (0.0%) |
Public vs Private Health Insurance Coverage by Age in Lewistown Heights
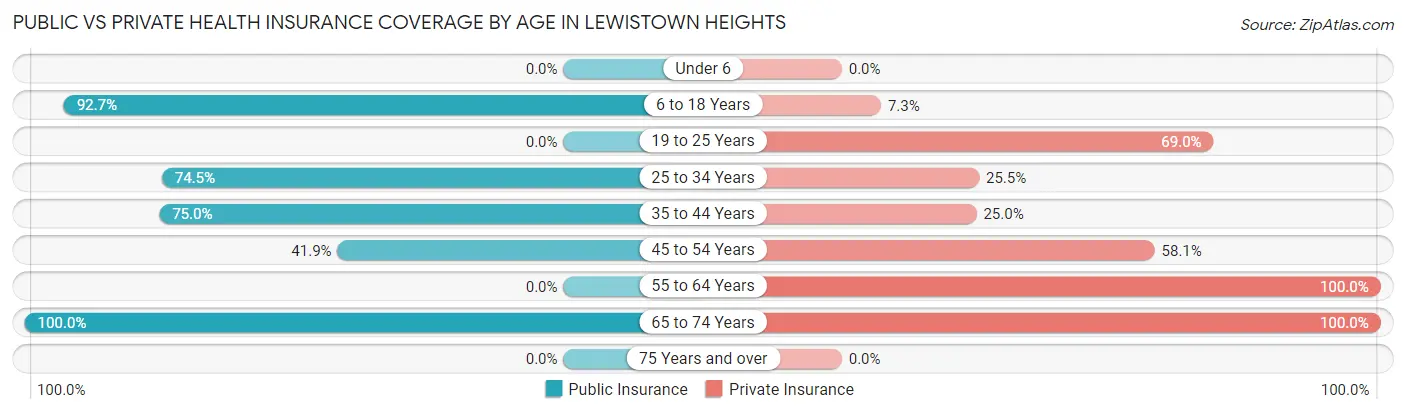
| Age Bracket | Public Insurance | Private Insurance |
| Under 6 | 0 (0.0%) | 0 (0.0%) |
| 6 to 18 Years | 102 (92.7%) | 8 (7.3%) |
| 19 to 25 Years | 0 (0.0%) | 60 (69.0%) |
| 25 to 34 Years | 79 (74.5%) | 27 (25.5%) |
| 35 to 44 Years | 30 (75.0%) | 10 (25.0%) |
| 45 to 54 Years | 13 (41.9%) | 18 (58.1%) |
| 55 to 64 Years | 0 (0.0%) | 68 (100.0%) |
| 65 to 74 Years | 44 (100.0%) | 44 (100.0%) |
| 75 Years and over | 0 (0.0%) | 0 (0.0%) |
| Total | 268 (55.1%) | 235 (48.3%) |
Disability Status by Sex by Age in Lewistown Heights
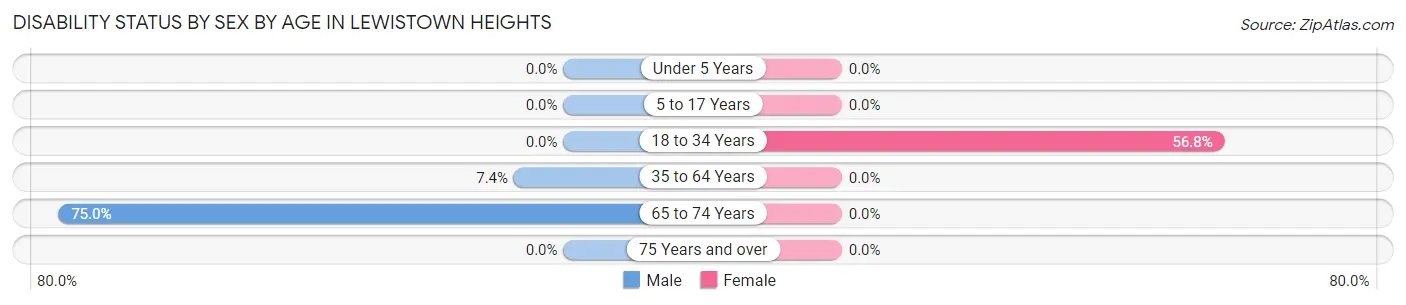
| Age Bracket | Male | Female |
| Under 5 Years | 0 (0.0%) | 0 (0.0%) |
| 5 to 17 Years | 0 (0.0%) | 0 (0.0%) |
| 18 to 34 Years | 0 (0.0%) | 79 (56.8%) |
| 35 to 64 Years | 5 (7.3%) | 0 (0.0%) |
| 65 to 74 Years | 21 (75.0%) | 0 (0.0%) |
| 75 Years and over | 0 (0.0%) | 0 (0.0%) |
Disability Class by Sex by Age in Lewistown Heights
Disability Class: Hearing Difficulty
| Age Bracket | Male | Female |
| Under 5 Years | 0 (0.0%) | 0 (0.0%) |
| 5 to 17 Years | 0 (0.0%) | 0 (0.0%) |
| 18 to 34 Years | 0 (0.0%) | 0 (0.0%) |
| 35 to 64 Years | 0 (0.0%) | 0 (0.0%) |
| 65 to 74 Years | 0 (0.0%) | 0 (0.0%) |
| 75 Years and over | 0 (0.0%) | 0 (0.0%) |
Disability Class: Vision Difficulty
| Age Bracket | Male | Female |
| Under 5 Years | 0 (0.0%) | 0 (0.0%) |
| 5 to 17 Years | 0 (0.0%) | 0 (0.0%) |
| 18 to 34 Years | 0 (0.0%) | 0 (0.0%) |
| 35 to 64 Years | 0 (0.0%) | 0 (0.0%) |
| 65 to 74 Years | 0 (0.0%) | 0 (0.0%) |
| 75 Years and over | 0 (0.0%) | 0 (0.0%) |
Disability Class: Cognitive Difficulty
| Age Bracket | Male | Female |
| 5 to 17 Years | 0 (0.0%) | 0 (0.0%) |
| 18 to 34 Years | 0 (0.0%) | 0 (0.0%) |
| 35 to 64 Years | 0 (0.0%) | 0 (0.0%) |
| 65 to 74 Years | 0 (0.0%) | 0 (0.0%) |
| 75 Years and over | 0 (0.0%) | 0 (0.0%) |
Disability Class: Ambulatory Difficulty
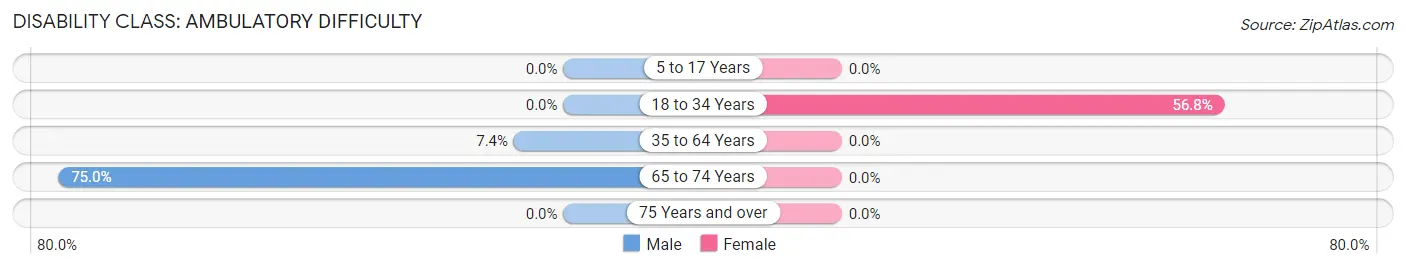
| Age Bracket | Male | Female |
| 5 to 17 Years | 0 (0.0%) | 0 (0.0%) |
| 18 to 34 Years | 0 (0.0%) | 79 (56.8%) |
| 35 to 64 Years | 5 (7.3%) | 0 (0.0%) |
| 65 to 74 Years | 21 (75.0%) | 0 (0.0%) |
| 75 Years and over | 0 (0.0%) | 0 (0.0%) |
Disability Class: Self-Care Difficulty
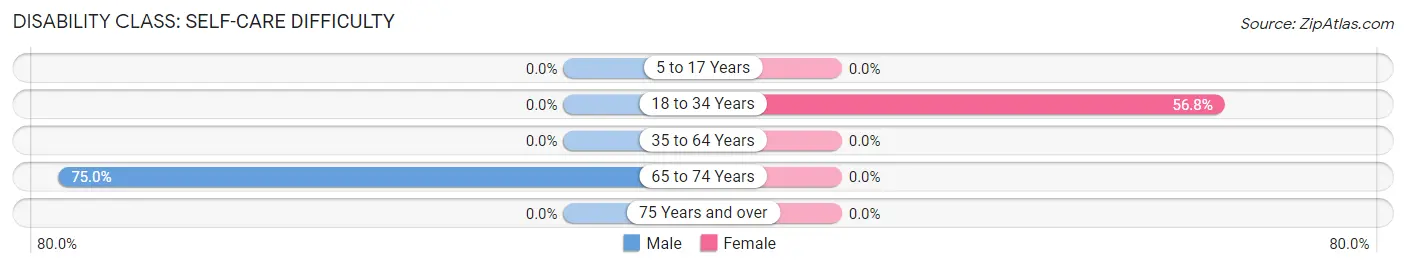
| Age Bracket | Male | Female |
| 5 to 17 Years | 0 (0.0%) | 0 (0.0%) |
| 18 to 34 Years | 0 (0.0%) | 79 (56.8%) |
| 35 to 64 Years | 0 (0.0%) | 0 (0.0%) |
| 65 to 74 Years | 21 (75.0%) | 0 (0.0%) |
| 75 Years and over | 0 (0.0%) | 0 (0.0%) |
Technology Access in Lewistown Heights
Computing Device Access in Lewistown Heights
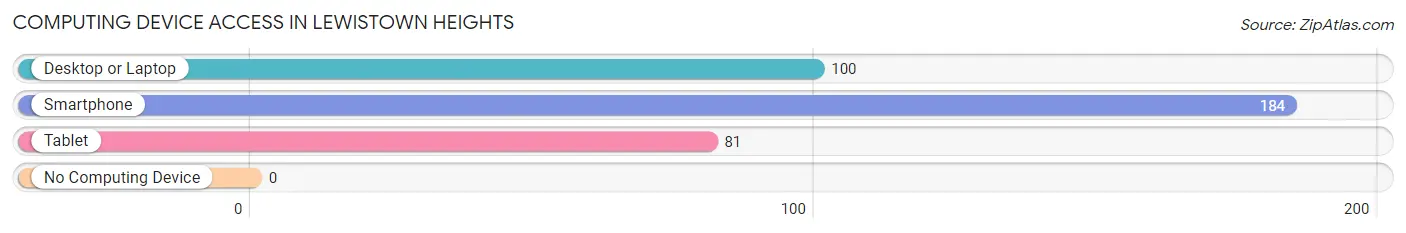
| Device Type | # Households | % Households |
| Desktop or Laptop | 100 | 54.3% |
| Smartphone | 184 | 100.0% |
| Tablet | 81 | 44.0% |
| No Computing Device | 0 | 0.0% |
| Total | 184 | 100.0% |
Internet Access in Lewistown Heights
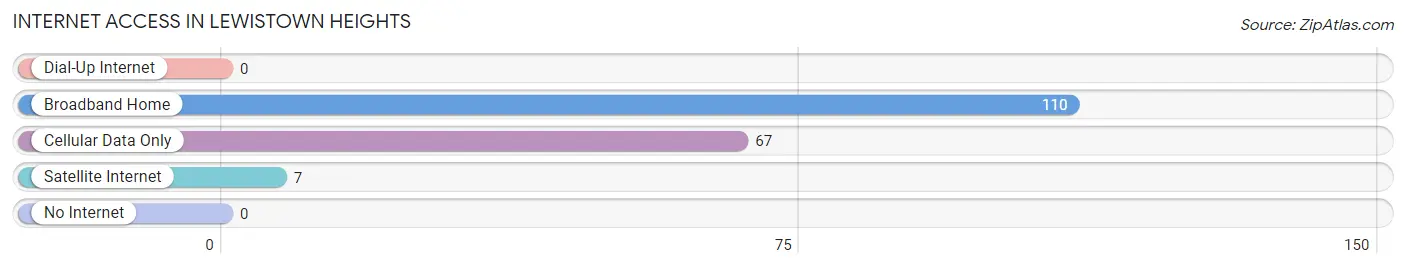
| Internet Type | # Households | % Households |
| Dial-Up Internet | 0 | 0.0% |
| Broadband Home | 110 | 59.8% |
| Cellular Data Only | 67 | 36.4% |
| Satellite Internet | 7 | 3.8% |
| No Internet | 0 | 0.0% |
| Total | 184 | 100.0% |
Lewistown Heights Summary
Lewistown Heights is a small town located in the state of Montana, in the United States of America. It is situated in Fergus County, and is part of the Lewistown Micropolitan Statistical Area. The town has a population of approximately 1,500 people, and is located at an elevation of 3,845 feet.
History
The area that is now Lewistown Heights was first settled in the late 1800s by ranchers and farmers. The town was officially founded in 1883, and was named after the nearby Lewistown Valley. The town was originally a small farming community, but grew rapidly in the early 1900s due to the discovery of gold in the area. The gold rush brought many people to the area, and the town quickly grew to become a bustling mining town.
The town was incorporated in 1909, and the population continued to grow throughout the early 20th century. The town was home to many businesses, including a bank, a hotel, a newspaper, and a variety of stores. The town also had a school, a library, and a post office.
Geography
Lewistown Heights is located in the central part of Montana, in Fergus County. The town is situated in the foothills of the Rocky Mountains, and is surrounded by rolling hills and grasslands. The town is located at an elevation of 3,845 feet, and is approximately 25 miles from the nearest major city, Great Falls.
The town is located in a semi-arid climate, with hot summers and cold winters. The average annual temperature is around 50 degrees Fahrenheit, and the average annual precipitation is around 12 inches.
Economy
The economy of Lewistown Heights is largely based on agriculture and tourism. The town is home to several farms, which produce a variety of crops, including wheat, barley, and hay. The town is also home to several tourist attractions, including the nearby Lewis and Clark National Historic Trail, the Charles M. Russell National Wildlife Refuge, and the Missouri River.
The town is also home to several businesses, including restaurants, hotels, and retail stores. The town is also home to a variety of manufacturing companies, including a furniture factory, a metal fabrication plant, and a printing company.
Demographics
As of the 2010 census, the population of Lewistown Heights was 1,500 people. The town is predominantly white, with approximately 95% of the population being white. The town also has a small Hispanic population, with approximately 4% of the population being Hispanic. The median household income in the town is approximately $35,000, and the median home value is approximately $150,000.
Conclusion
Lewistown Heights is a small town located in the state of Montana, in the United States of America. The town has a population of approximately 1,500 people, and is located at an elevation of 3,845 feet. The town was founded in 1883, and was originally a small farming community. The town grew rapidly in the early 1900s due to the discovery of gold in the area, and the population continued to grow throughout the early 20th century. The economy of Lewistown Heights is largely based on agriculture and tourism, and the town is home to several businesses, including restaurants, hotels, and retail stores. As of the 2010 census, the population of Lewistown Heights was 1,500 people, and the town is predominantly white, with approximately 95% of the population being white.
Common Questions
What is Per Capita Income in Lewistown Heights?
Per Capita income in Lewistown Heights is $41,890.
What is the Median Family Income in Lewistown Heights?
Median Family Income in Lewistown Heights is $84,313.
What is the Median Household income in Lewistown Heights?
Median Household Income in Lewistown Heights is $84,155.
What is Income or Wage Gap in Lewistown Heights?
Income or Wage Gap in Lewistown Heights is 41.5%.
Women in Lewistown Heights earn 58.5 cents for every dollar earned by a man.
What is Inequality or Gini Index in Lewistown Heights?
Inequality or Gini Index in Lewistown Heights is 0.26.
What is the Total Population of Lewistown Heights?
Total Population of Lewistown Heights is 486.
What is the Total Male Population of Lewistown Heights?
Total Male Population of Lewistown Heights is 253.
What is the Total Female Population of Lewistown Heights?
Total Female Population of Lewistown Heights is 233.
What is the Ratio of Males per 100 Females in Lewistown Heights?
There are 108.58 Males per 100 Females in Lewistown Heights.
What is the Ratio of Females per 100 Males in Lewistown Heights?
There are 92.09 Females per 100 Males in Lewistown Heights.
What is the Median Population Age in Lewistown Heights?
Median Population Age in Lewistown Heights is 27.6 Years.
What is the Average Family Size in Lewistown Heights
Average Family Size in Lewistown Heights is 2.7 People.
What is the Average Household Size in Lewistown Heights
Average Household Size in Lewistown Heights is 2.6 People.
How Large is the Labor Force in Lewistown Heights?
There are 323 People in the Labor Forcein in Lewistown Heights.
What is the Percentage of People in the Labor Force in Lewistown Heights?
73.7% of People are in the Labor Force in Lewistown Heights.