Rollins, MT Map & Demographics
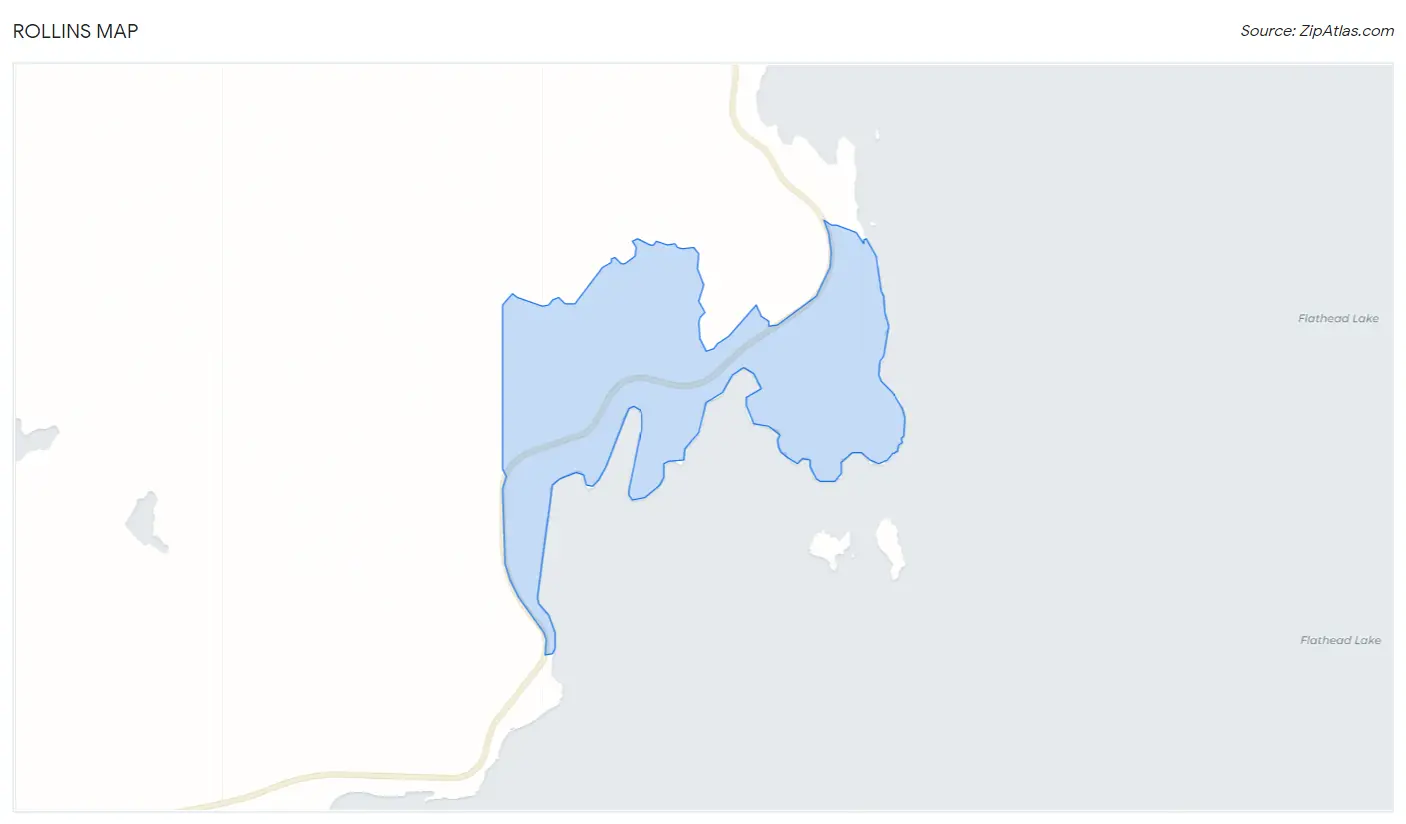
Rollins Map
Rollins Overview
$78,521
PER CAPITA INCOME
$175,486
AVG FAMILY INCOME
0.53
INEQUALITY / GINI INDEX
126
TOTAL POPULATION
65
MALE POPULATION
61
FEMALE POPULATION
106.56
MALES / 100 FEMALES
93.85
FEMALES / 100 MALES
62.8
MEDIAN AGE
2.2
AVG FAMILY SIZE
1.9
AVG HOUSEHOLD SIZE
80
LABOR FORCE [ PEOPLE ]
63.5%
PERCENT IN LABOR FORCE
5.0%
UNEMPLOYMENT RATE
Rollins Zip Codes
Rollins Area Codes
Income in Rollins
Income Overview in Rollins
| Characteristic | Number | Measure |
| Per Capita Income | 126 | $78,521 |
| Median Family Income | 35 | $175,486 |
| Mean Family Income | 35 | $193,011 |
| Median Household Income | 54 | $0 |
| Mean Household Income | 54 | $167,520 |
| Income Deficit | 35 | $0 |
| Wage / Income Gap (%) | 126 | 0.00% |
| Wage / Income Gap ($) | 126 | 100.00¢ per $1 |
| Gini / Inequality Index | 126 | 0.53 |
Earnings by Sex in Rollins
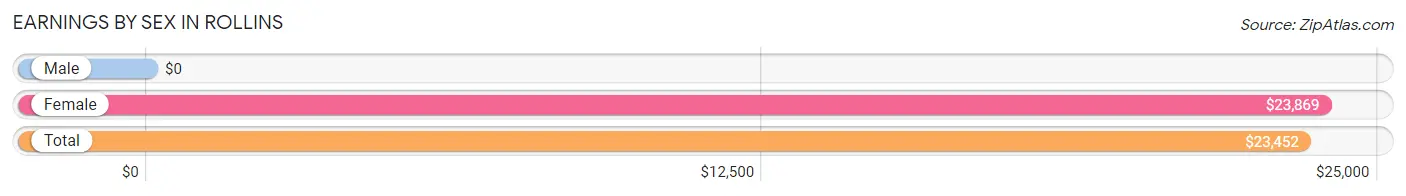
| Sex | Number | Average Earnings |
| Male | 47 (61.8%) | $0 |
| Female | 29 (38.2%) | $23,869 |
| Total | 76 (100.0%) | $23,452 |
Earnings by Sex by Income Bracket in Rollins
The most common earnings brackets in Rollins are $7,500 to $9,999 for men (18 | 38.3%) and $22,500 to $24,999 for women (21 | 72.4%).
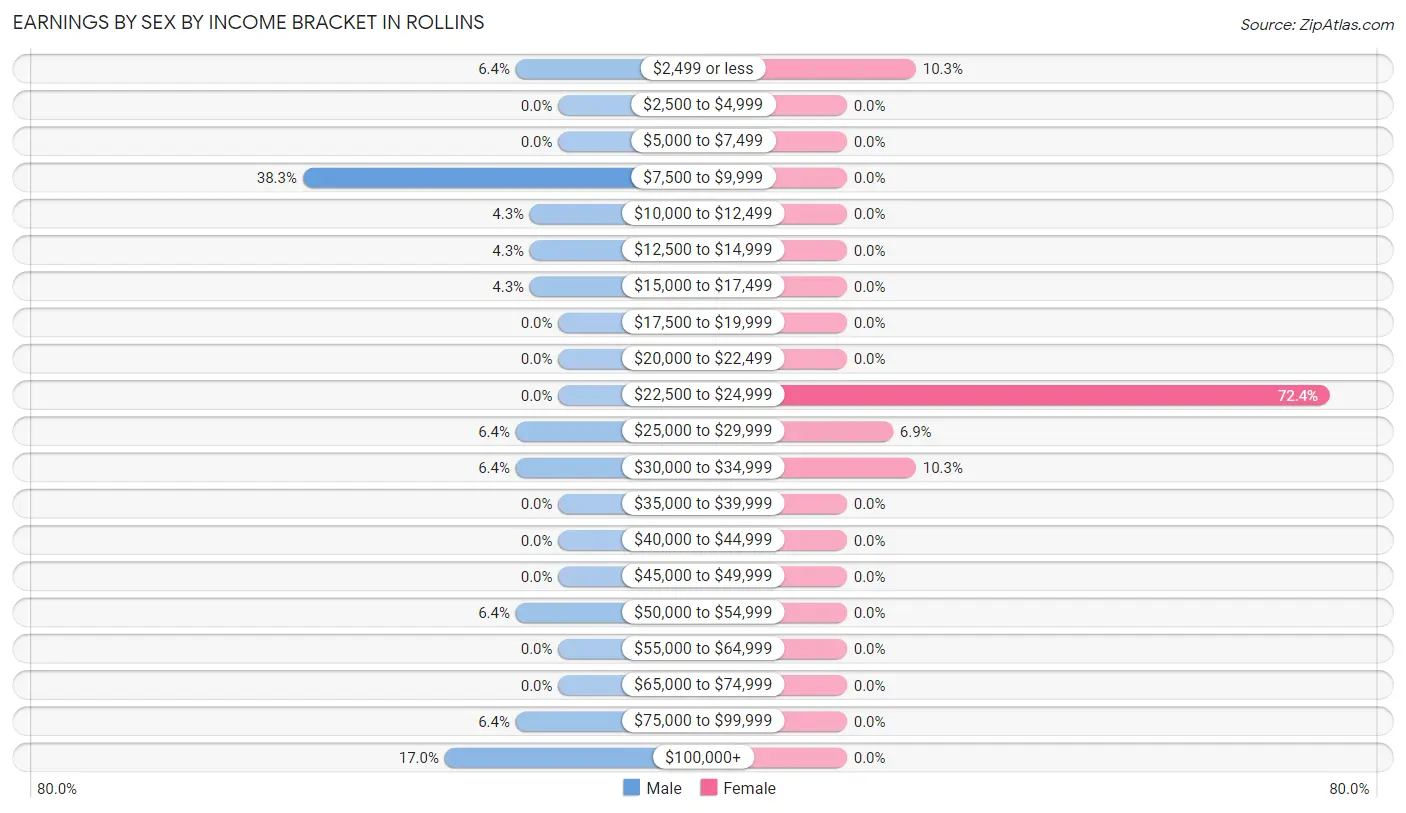
| Income | Male | Female |
| $2,499 or less | 3 (6.4%) | 3 (10.3%) |
| $2,500 to $4,999 | 0 (0.0%) | 0 (0.0%) |
| $5,000 to $7,499 | 0 (0.0%) | 0 (0.0%) |
| $7,500 to $9,999 | 18 (38.3%) | 0 (0.0%) |
| $10,000 to $12,499 | 2 (4.3%) | 0 (0.0%) |
| $12,500 to $14,999 | 2 (4.3%) | 0 (0.0%) |
| $15,000 to $17,499 | 2 (4.3%) | 0 (0.0%) |
| $17,500 to $19,999 | 0 (0.0%) | 0 (0.0%) |
| $20,000 to $22,499 | 0 (0.0%) | 0 (0.0%) |
| $22,500 to $24,999 | 0 (0.0%) | 21 (72.4%) |
| $25,000 to $29,999 | 3 (6.4%) | 2 (6.9%) |
| $30,000 to $34,999 | 3 (6.4%) | 3 (10.3%) |
| $35,000 to $39,999 | 0 (0.0%) | 0 (0.0%) |
| $40,000 to $44,999 | 0 (0.0%) | 0 (0.0%) |
| $45,000 to $49,999 | 0 (0.0%) | 0 (0.0%) |
| $50,000 to $54,999 | 3 (6.4%) | 0 (0.0%) |
| $55,000 to $64,999 | 0 (0.0%) | 0 (0.0%) |
| $65,000 to $74,999 | 0 (0.0%) | 0 (0.0%) |
| $75,000 to $99,999 | 3 (6.4%) | 0 (0.0%) |
| $100,000+ | 8 (17.0%) | 0 (0.0%) |
| Total | 47 (100.0%) | 29 (100.0%) |
Earnings by Sex by Educational Attainment in Rollins
| Educational Attainment | Male Income | Female Income |
| Less than High School | - | - |
| High School Diploma | - | - |
| College or Associate's Degree | - | - |
| Bachelor's Degree | - | - |
| Graduate Degree | - | - |
| Total | - | - |
Family Income in Rollins
Family Income Brackets in Rollins
According to the Rollins family income data, there are 18 families falling into the $150,000 to $199,999 income range, which is the most common income bracket and makes up 51.4% of all families.
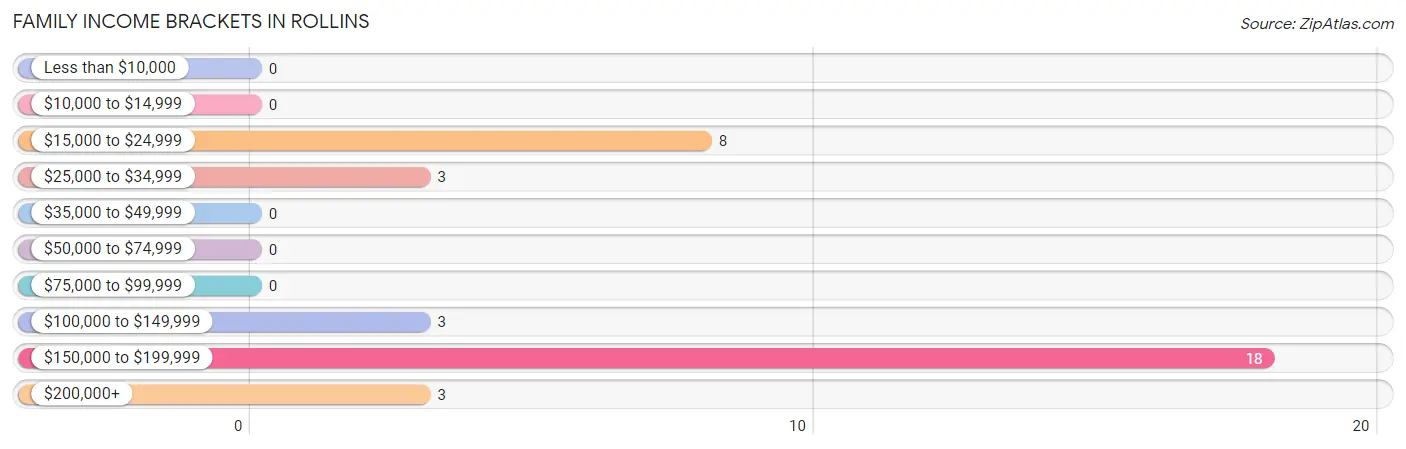
| Income Bracket | # Families | % Families |
| Less than $10,000 | 0 | 0.0% |
| $10,000 to $14,999 | 0 | 0.0% |
| $15,000 to $24,999 | 8 | 22.9% |
| $25,000 to $34,999 | 3 | 8.6% |
| $35,000 to $49,999 | 0 | 0.0% |
| $50,000 to $74,999 | 0 | 0.0% |
| $75,000 to $99,999 | 0 | 0.0% |
| $100,000 to $149,999 | 3 | 8.6% |
| $150,000 to $199,999 | 18 | 51.4% |
| $200,000+ | 3 | 8.6% |
Family Income by Famaliy Size in Rollins
| Income Bracket | # Families | Median Income |
| 2-Person Families | 32 (91.4%) | $0 |
| 3-Person Families | 3 (8.6%) | $0 |
| 4-Person Families | 0 (0.0%) | $0 |
| 5-Person Families | 0 (0.0%) | $0 |
| 6-Person Families | 0 (0.0%) | $0 |
| 7+ Person Families | 0 (0.0%) | $0 |
| Total | 35 (100.0%) | $175,486 |
Family Income by Number of Earners in Rollins
| Number of Earners | # Families | Median Income |
| No Earners | 14 (40.0%) | $0 |
| 1 Earner | 0 (0.0%) | $0 |
| 2 Earners | 21 (60.0%) | $0 |
| 3+ Earners | 0 (0.0%) | $0 |
| Total | 35 (100.0%) | $175,486 |
Household Income in Rollins
Household Income Brackets in Rollins
With 23 households falling in the category, the $150,000 to $199,999 income range is the most frequent in Rollins, accounting for 42.6% of all households.
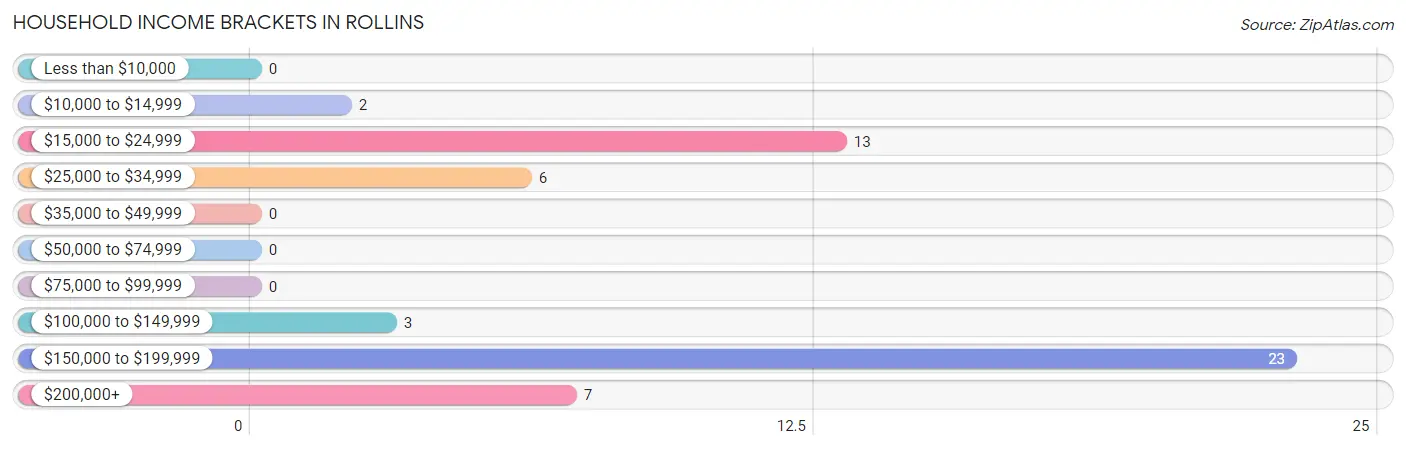
| Income Bracket | # Households | % Households |
| Less than $10,000 | 0 | 0.0% |
| $10,000 to $14,999 | 2 | 3.7% |
| $15,000 to $24,999 | 13 | 24.1% |
| $25,000 to $34,999 | 6 | 11.1% |
| $35,000 to $49,999 | 0 | 0.0% |
| $50,000 to $74,999 | 0 | 0.0% |
| $75,000 to $99,999 | 0 | 0.0% |
| $100,000 to $149,999 | 3 | 5.6% |
| $150,000 to $199,999 | 23 | 42.6% |
| $200,000+ | 7 | 13.0% |
Household Income by Householder Age in Rollins
The median household income in Rollins is $0, with the highest median household income of $137,500 found in the 45 to 64 years age bracket for the primary householder. A total of 16 households (29.6%) fall into this category.
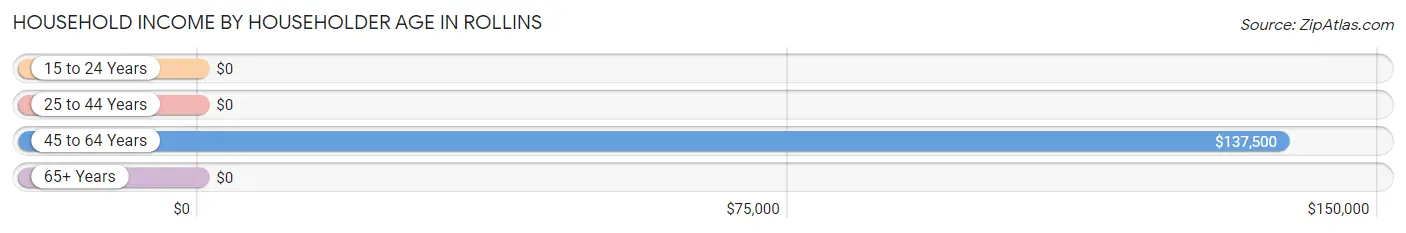
| Income Bracket | # Households | Median Income |
| 15 to 24 Years | 0 (0.0%) | $0 |
| 25 to 44 Years | 0 (0.0%) | $0 |
| 45 to 64 Years | 16 (29.6%) | $137,500 |
| 65+ Years | 38 (70.4%) | $0 |
| Total | 54 (100.0%) | $0 |
Poverty in Rollins
Income Below Poverty by Sex and Age in Rollins
With 13.9% poverty level for males and 9.8% for females among the residents of Rollins, 18 to 24 year old males and 25 to 34 year old females are the most vulnerable to poverty, with 4 males (100.0%) and 4 females (100.0%) in their respective age groups living below the poverty level.
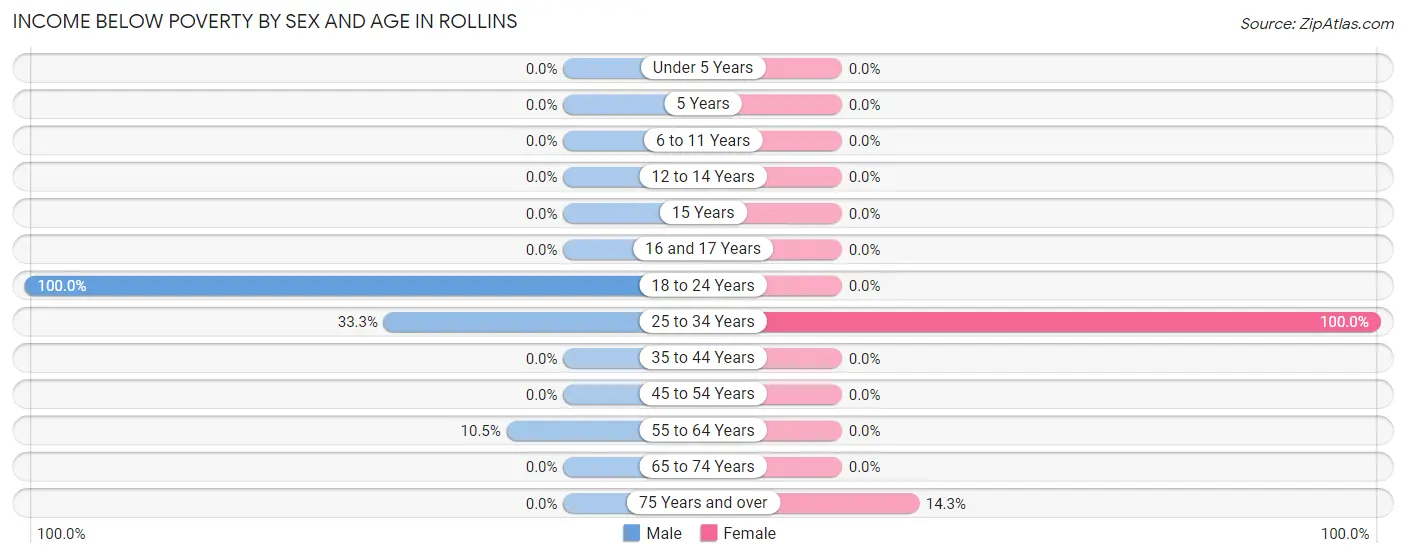
| Age Bracket | Male | Female |
| Under 5 Years | 0 (0.0%) | 0 (0.0%) |
| 5 Years | 0 (0.0%) | 0 (0.0%) |
| 6 to 11 Years | 0 (0.0%) | 0 (0.0%) |
| 12 to 14 Years | 0 (0.0%) | 0 (0.0%) |
| 15 Years | 0 (0.0%) | 0 (0.0%) |
| 16 and 17 Years | 0 (0.0%) | 0 (0.0%) |
| 18 to 24 Years | 4 (100.0%) | 0 (0.0%) |
| 25 to 34 Years | 3 (33.3%) | 4 (100.0%) |
| 35 to 44 Years | 0 (0.0%) | 0 (0.0%) |
| 45 to 54 Years | 0 (0.0%) | 0 (0.0%) |
| 55 to 64 Years | 2 (10.5%) | 0 (0.0%) |
| 65 to 74 Years | 0 (0.0%) | 0 (0.0%) |
| 75 Years and over | 0 (0.0%) | 2 (14.3%) |
| Total | 9 (13.9%) | 6 (9.8%) |
Income Above Poverty by Sex and Age in Rollins
According to the poverty statistics in Rollins, males aged 65 to 74 years and females aged 16 and 17 years are the age groups that are most secure financially, with 100.0% of males and 100.0% of females in these age groups living above the poverty line.
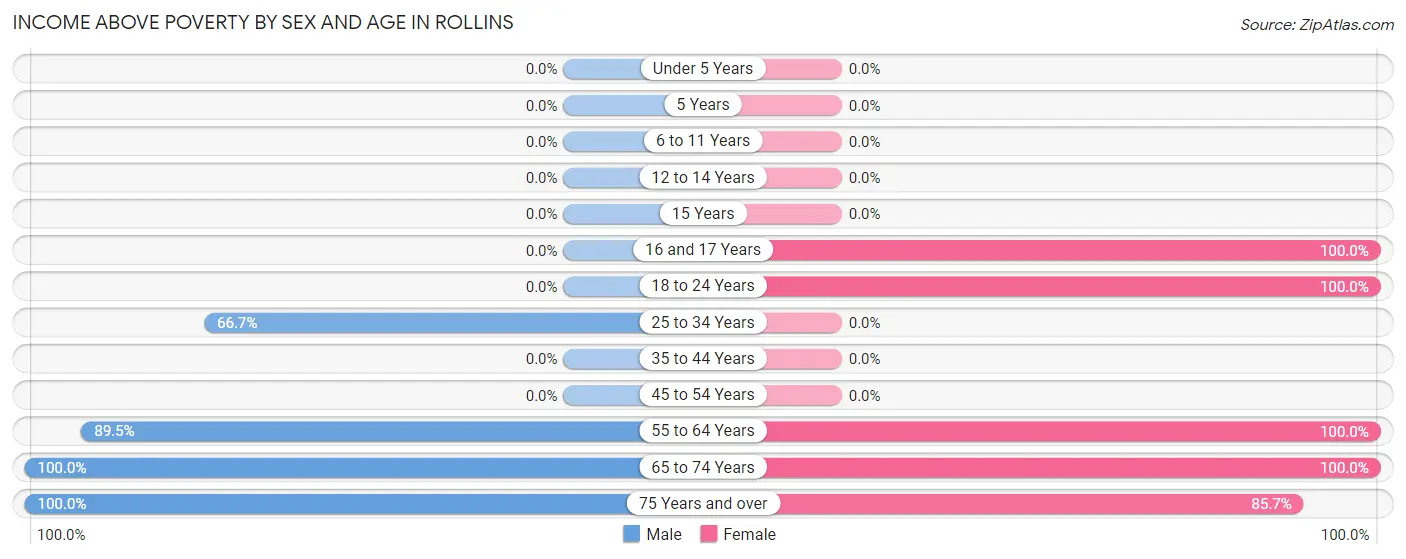
| Age Bracket | Male | Female |
| Under 5 Years | 0 (0.0%) | 0 (0.0%) |
| 5 Years | 0 (0.0%) | 0 (0.0%) |
| 6 to 11 Years | 0 (0.0%) | 0 (0.0%) |
| 12 to 14 Years | 0 (0.0%) | 0 (0.0%) |
| 15 Years | 0 (0.0%) | 0 (0.0%) |
| 16 and 17 Years | 0 (0.0%) | 3 (100.0%) |
| 18 to 24 Years | 0 (0.0%) | 2 (100.0%) |
| 25 to 34 Years | 6 (66.7%) | 0 (0.0%) |
| 35 to 44 Years | 0 (0.0%) | 0 (0.0%) |
| 45 to 54 Years | 0 (0.0%) | 0 (0.0%) |
| 55 to 64 Years | 17 (89.5%) | 34 (100.0%) |
| 65 to 74 Years | 28 (100.0%) | 4 (100.0%) |
| 75 Years and over | 5 (100.0%) | 12 (85.7%) |
| Total | 56 (86.2%) | 55 (90.2%) |
Income Below Poverty Among Married-Couple Families in Rollins
| Children | Above Poverty | Below Poverty |
| No Children | 32 (100.0%) | 0 (0.0%) |
| 1 or 2 Children | 3 (100.0%) | 0 (0.0%) |
| 3 or 4 Children | 0 (0.0%) | 0 (0.0%) |
| 5 or more Children | 0 (0.0%) | 0 (0.0%) |
| Total | 35 (100.0%) | 0 (0.0%) |
Income Below Poverty Among Single-Parent Households in Rollins
| Children | Single Father | Single Mother |
| No Children | 0 (0.0%) | 0 (0.0%) |
| 1 or 2 Children | 0 (0.0%) | 0 (0.0%) |
| 3 or 4 Children | 0 (0.0%) | 0 (0.0%) |
| 5 or more Children | 0 (0.0%) | 0 (0.0%) |
| Total | 0 (0.0%) | 0 (0.0%) |
Income Below Poverty Among Married-Couple vs Single-Parent Households in Rollins
| Children | Married-Couple Families | Single-Parent Households |
| No Children | 0 (0.0%) | 0 (0.0%) |
| 1 or 2 Children | 0 (0.0%) | 0 (0.0%) |
| 3 or 4 Children | 0 (0.0%) | 0 (0.0%) |
| 5 or more Children | 0 (0.0%) | 0 (0.0%) |
| Total | 0 (0.0%) | 0 (0.0%) |
Race in Rollins
The most populous races in Rollins are White / Caucasian (117 | 92.9%), Hawaiian / Pacific (4 | 3.2%), and Asian (3 | 2.4%).
| Race | # Population | % Population |
| Asian | 3 | 2.4% |
| Black / African American | 0 | 0.0% |
| Hawaiian / Pacific | 4 | 3.2% |
| Hispanic or Latino | 0 | 0.0% |
| Native / Alaskan | 0 | 0.0% |
| White / Caucasian | 117 | 92.9% |
| Two or more Races | 2 | 1.6% |
| Some other Race | 0 | 0.0% |
| Total | 126 | 100.0% |
Ancestry in Rollins
The most populous ancestries reported in Rollins are German (30 | 23.8%), Italian (24 | 19.1%), Polish (24 | 19.1%), Russian (18 | 14.3%), and English (16 | 12.7%), together accounting for 88.9% of all Rollins residents.
| Ancestry | # Population | % Population |
| American | 6 | 4.8% |
| Austrian | 5 | 4.0% |
| English | 16 | 12.7% |
| European | 3 | 2.4% |
| German | 30 | 23.8% |
| Inupiat | 2 | 1.6% |
| Irish | 13 | 10.3% |
| Italian | 24 | 19.1% |
| Korean | 3 | 2.4% |
| Native Hawaiian | 4 | 3.2% |
| Norwegian | 3 | 2.4% |
| Polish | 24 | 19.1% |
| Russian | 18 | 14.3% |
| Scottish | 7 | 5.6% |
| Swiss | 2 | 1.6% | View All 15 Rows |
Immigrants in Rollins
The most numerous immigrant groups reported in Rollins came from Canada (4 | 3.2%), Asia (3 | 2.4%), Philippines (3 | 2.4%), and South Eastern Asia (3 | 2.4%), together accounting for 10.3% of all Rollins residents.
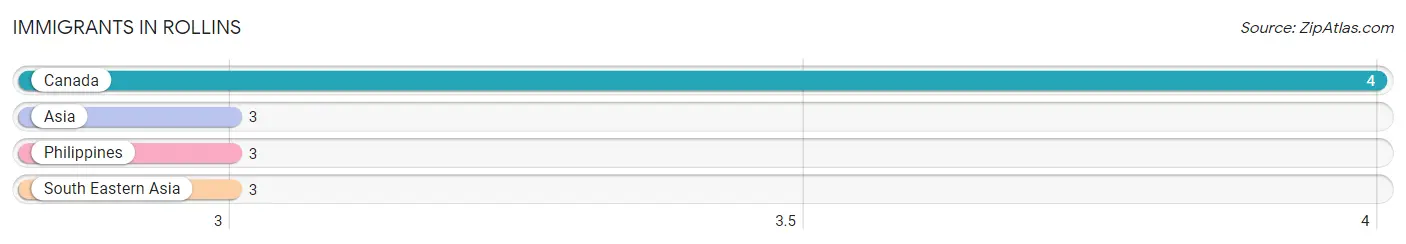
| Immigration Origin | # Population | % Population |
| Asia | 3 | 2.4% |
| Canada | 4 | 3.2% |
| Philippines | 3 | 2.4% |
| South Eastern Asia | 3 | 2.4% | View All 4 Rows |
Sex and Age in Rollins
Sex and Age in Rollins
The most populous age groups in Rollins are 65 to 69 Years (21 | 32.3%) for men and 60 to 64 Years (28 | 45.9%) for women.
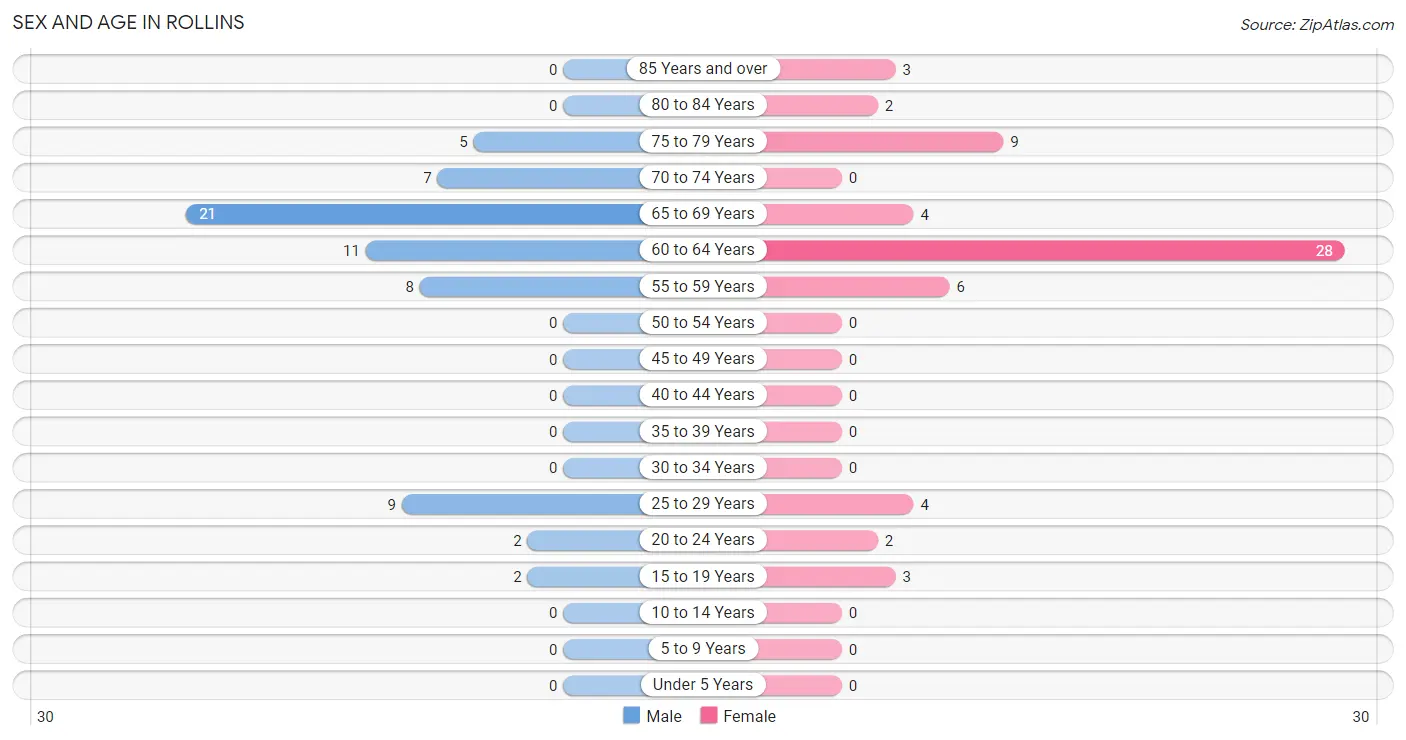
| Age Bracket | Male | Female |
| Under 5 Years | 0 (0.0%) | 0 (0.0%) |
| 5 to 9 Years | 0 (0.0%) | 0 (0.0%) |
| 10 to 14 Years | 0 (0.0%) | 0 (0.0%) |
| 15 to 19 Years | 2 (3.1%) | 3 (4.9%) |
| 20 to 24 Years | 2 (3.1%) | 2 (3.3%) |
| 25 to 29 Years | 9 (13.9%) | 4 (6.6%) |
| 30 to 34 Years | 0 (0.0%) | 0 (0.0%) |
| 35 to 39 Years | 0 (0.0%) | 0 (0.0%) |
| 40 to 44 Years | 0 (0.0%) | 0 (0.0%) |
| 45 to 49 Years | 0 (0.0%) | 0 (0.0%) |
| 50 to 54 Years | 0 (0.0%) | 0 (0.0%) |
| 55 to 59 Years | 8 (12.3%) | 6 (9.8%) |
| 60 to 64 Years | 11 (16.9%) | 28 (45.9%) |
| 65 to 69 Years | 21 (32.3%) | 4 (6.6%) |
| 70 to 74 Years | 7 (10.8%) | 0 (0.0%) |
| 75 to 79 Years | 5 (7.7%) | 9 (14.7%) |
| 80 to 84 Years | 0 (0.0%) | 2 (3.3%) |
| 85 Years and over | 0 (0.0%) | 3 (4.9%) |
| Total | 65 (100.0%) | 61 (100.0%) |
Families and Households in Rollins
Median Family Size in Rollins
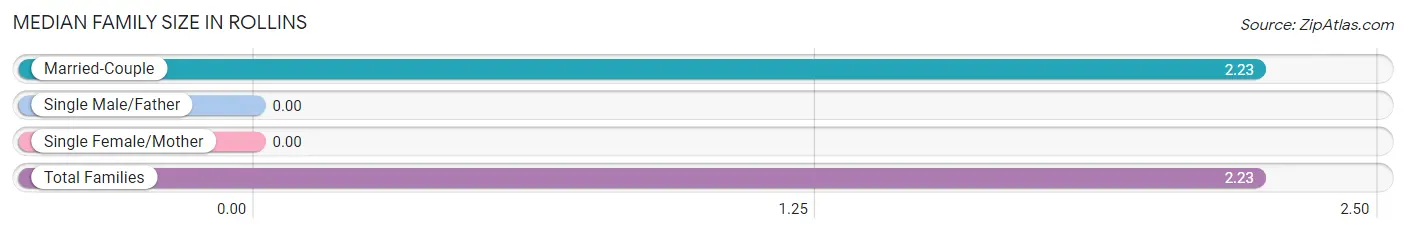
| Family Type | # Families | Family Size |
| Married-Couple | 35 (100.0%) | 2.23 |
| Single Male/Father | 0 (0.0%) | - |
| Single Female/Mother | 0 (0.0%) | - |
| Total Families | 35 (100.0%) | 2.23 |
Median Household Size in Rollins
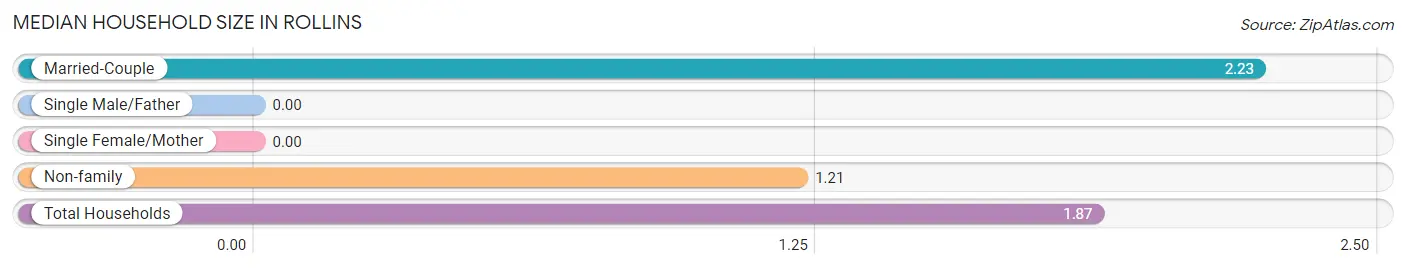
| Household Type | # Households | Household Size |
| Married-Couple | 35 (64.8%) | 2.23 |
| Single Male/Father | 0 (0.0%) | - |
| Single Female/Mother | 0 (0.0%) | - |
| Non-family | 19 (35.2%) | 1.21 |
| Total Households | 54 (100.0%) | 1.87 |
Household Size by Marriage Status in Rollins
Out of a total of 54 households in Rollins, 35 (64.8%) are family households, while 19 (35.2%) are nonfamily households. The most numerous type of family households are 2-person households, comprising 32, and the most common type of nonfamily households are 1-person households, comprising 17.
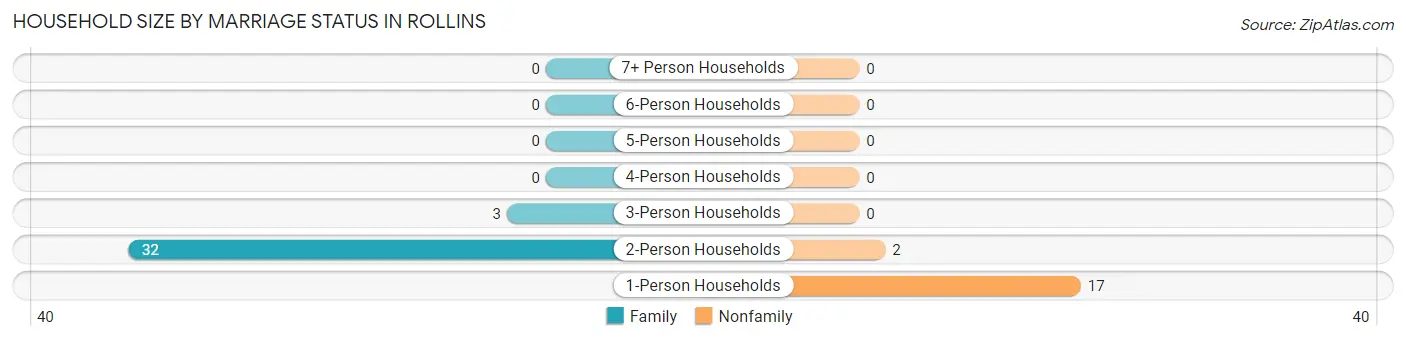
| Household Size | Family Households | Nonfamily Households |
| 1-Person Households | - | 17 (31.5%) |
| 2-Person Households | 32 (59.3%) | 2 (3.7%) |
| 3-Person Households | 3 (5.6%) | 0 (0.0%) |
| 4-Person Households | 0 (0.0%) | 0 (0.0%) |
| 5-Person Households | 0 (0.0%) | 0 (0.0%) |
| 6-Person Households | 0 (0.0%) | 0 (0.0%) |
| 7+ Person Households | 0 (0.0%) | 0 (0.0%) |
| Total | 35 (64.8%) | 19 (35.2%) |
Female Fertility in Rollins
Fertility by Age in Rollins
Average fertility rate in Rollins is 444.0 births per 1,000 women. Women in the age bracket of 20 to 34 years have the highest fertility rate with 667.0 births per 1,000 women. Women in the age bracket of 20 to 34 years acount for 100.0% of all women with births.
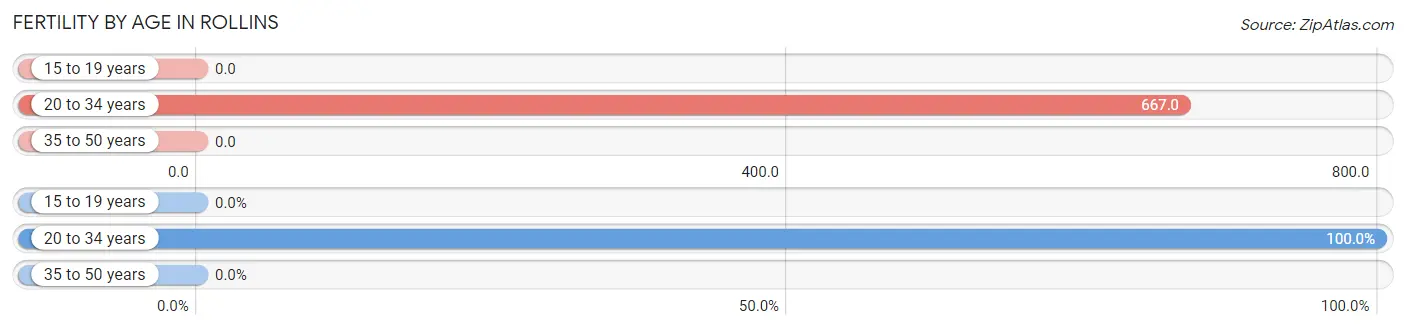
| Age Bracket | Women with Births | Births / 1,000 Women |
| 15 to 19 years | 0 (0.0%) | 0.0 |
| 20 to 34 years | 4 (100.0%) | 667.0 |
| 35 to 50 years | 0 (0.0%) | 0.0 |
| Total | 4 (100.0%) | 444.0 |
Fertility by Age by Marriage Status in Rollins
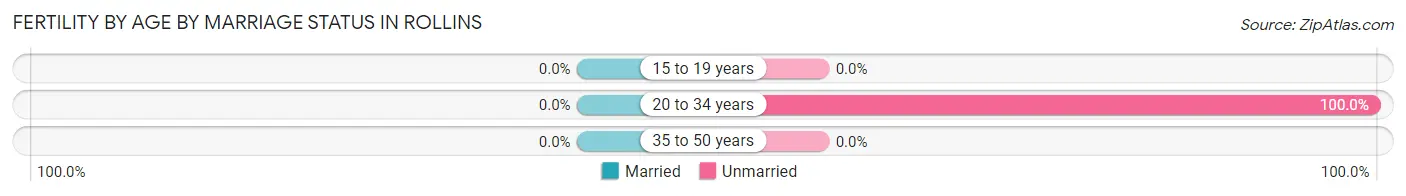
| Age Bracket | Married | Unmarried |
| 15 to 19 years | 0 (0.0%) | 0 (0.0%) |
| 20 to 34 years | 0 (0.0%) | 4 (100.0%) |
| 35 to 50 years | 0 (0.0%) | 0 (0.0%) |
| Total | 0 (0.0%) | 4 (100.0%) |
Fertility by Education in Rollins
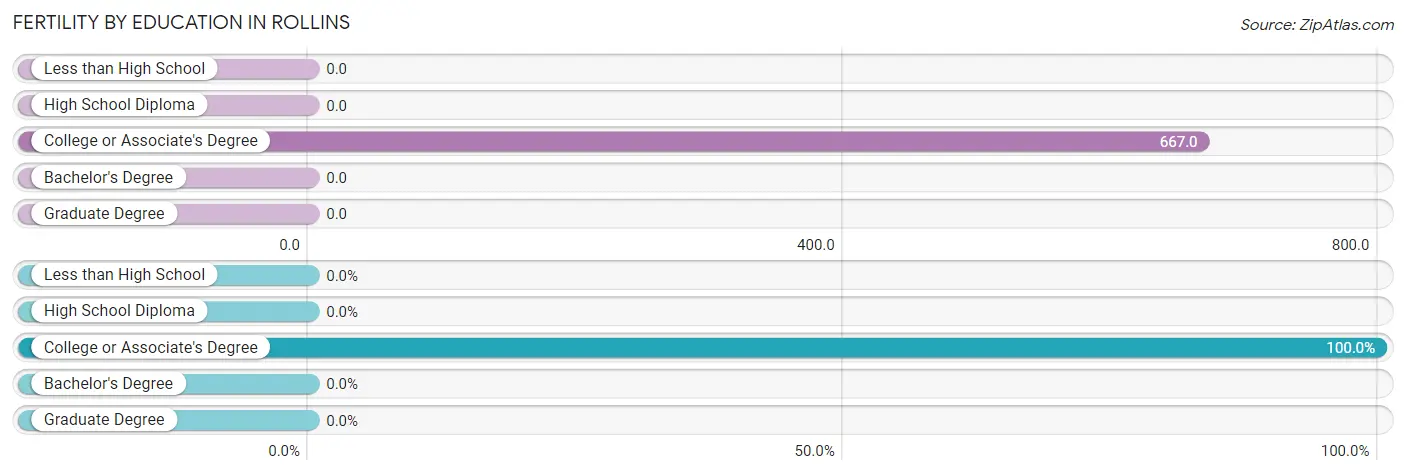
| Educational Attainment | Women with Births | Births / 1,000 Women |
| Less than High School | 0 (0.0%) | 0.0 |
| High School Diploma | 0 (0.0%) | 0.0 |
| College or Associate's Degree | 4 (100.0%) | 667.0 |
| Bachelor's Degree | 0 (0.0%) | 0.0 |
| Graduate Degree | 0 (0.0%) | 0.0 |
| Total | 4 (100.0%) | 444.0 |
Fertility by Education by Marriage Status in Rollins
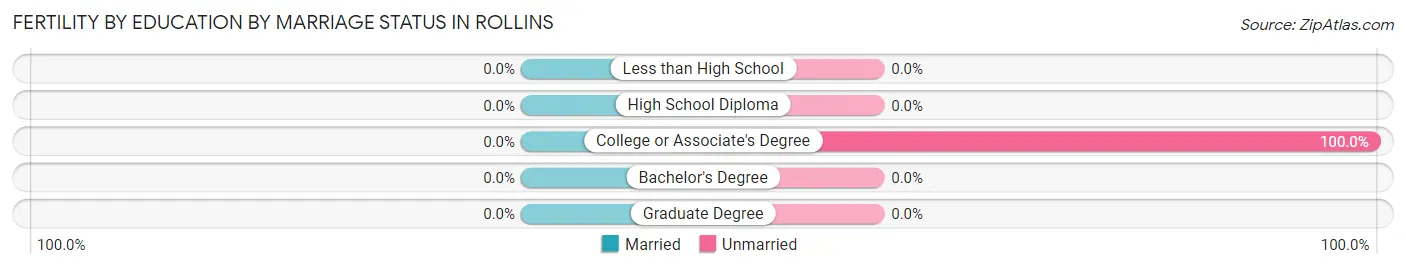
| Educational Attainment | Married | Unmarried |
| Less than High School | 0 (0.0%) | 0 (0.0%) |
| High School Diploma | 0 (0.0%) | 0 (0.0%) |
| College or Associate's Degree | 0 (0.0%) | 4 (100.0%) |
| Bachelor's Degree | 0 (0.0%) | 0 (0.0%) |
| Graduate Degree | 0 (0.0%) | 0 (0.0%) |
| Total | 0 (0.0%) | 4 (100.0%) |
Employment Characteristics in Rollins
Employment by Class of Employer in Rollins
Among the 73 employed individuals in Rollins, private company employees (44 | 60.3%), not-for-profit organizations (20 | 27.4%), and state government employees (4 | 5.5%) make up the most common classes of employment.
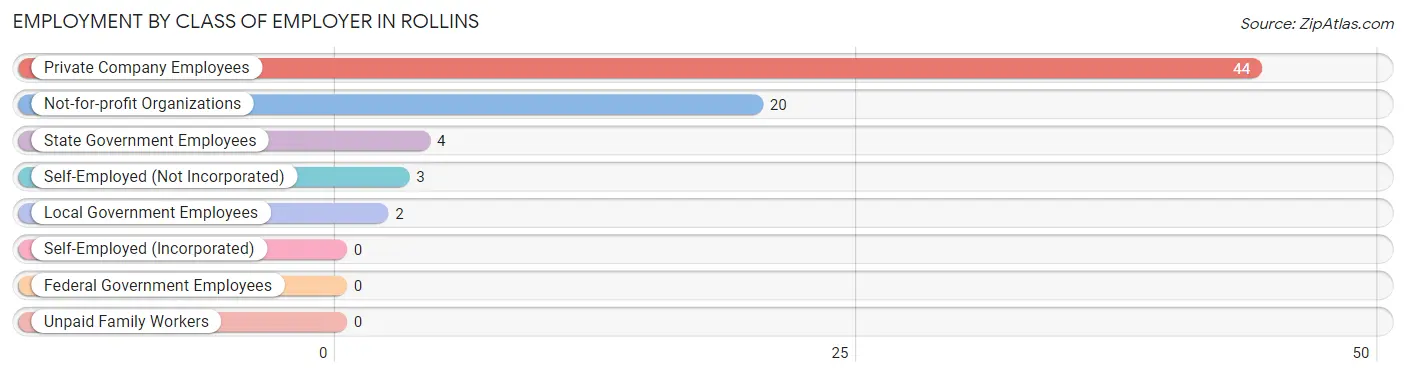
| Employer Class | # Employees | % Employees |
| Private Company Employees | 44 | 60.3% |
| Self-Employed (Incorporated) | 0 | 0.0% |
| Self-Employed (Not Incorporated) | 3 | 4.1% |
| Not-for-profit Organizations | 20 | 27.4% |
| Local Government Employees | 2 | 2.7% |
| State Government Employees | 4 | 5.5% |
| Federal Government Employees | 0 | 0.0% |
| Unpaid Family Workers | 0 | 0.0% |
| Total | 73 | 100.0% |
Employment Status by Age in Rollins
According to the labor force statistics for Rollins, out of the total population over 16 years of age (126), 63.5% or 80 individuals are in the labor force, with 5.0% or 4 of them unemployed. The age group with the highest labor force participation rate is 16 to 19 years, with 100.0% or 5 individuals in the labor force. Within the labor force, the 25 to 29 years age range has the highest percentage of unemployed individuals, with 30.8% or 4 of them being unemployed.
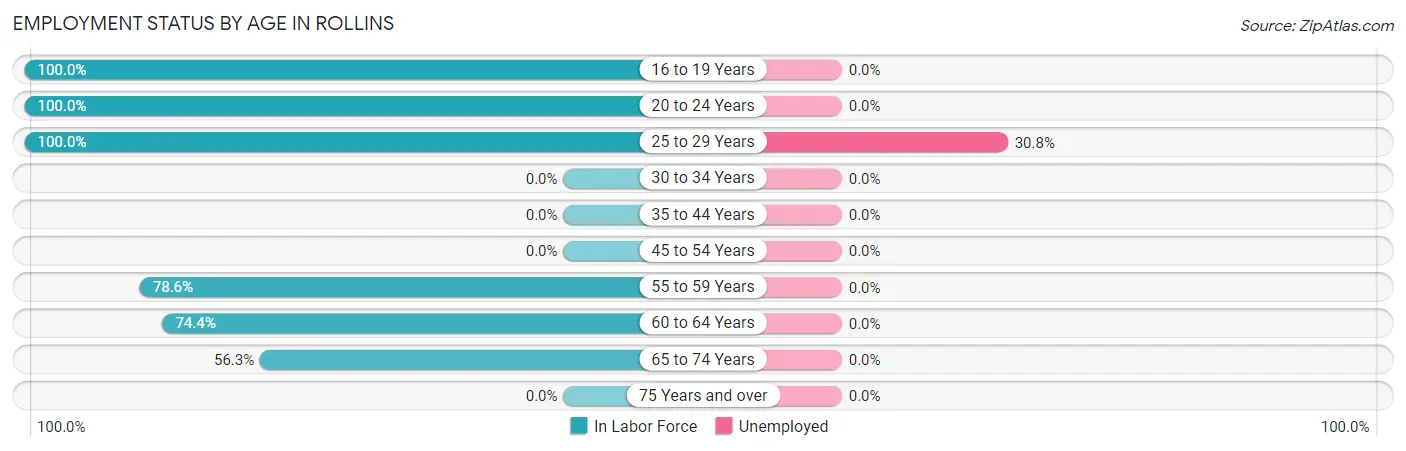
| Age Bracket | In Labor Force | Unemployed |
| 16 to 19 Years | 5 (100.0%) | 0 (0.0%) |
| 20 to 24 Years | 4 (100.0%) | 0 (0.0%) |
| 25 to 29 Years | 13 (100.0%) | 4 (30.8%) |
| 30 to 34 Years | 0 (0.0%) | 0 (0.0%) |
| 35 to 44 Years | 0 (0.0%) | 0 (0.0%) |
| 45 to 54 Years | 0 (0.0%) | 0 (0.0%) |
| 55 to 59 Years | 11 (78.6%) | 0 (0.0%) |
| 60 to 64 Years | 29 (74.4%) | 0 (0.0%) |
| 65 to 74 Years | 18 (56.3%) | 0 (0.0%) |
| 75 Years and over | 0 (0.0%) | 0 (0.0%) |
| Total | 80 (63.5%) | 4 (5.0%) |
Employment Status by Educational Attainment in Rollins
According to labor force statistics for Rollins, 80.3% of individuals (53) out of the total population between 25 and 64 years of age (66) are in the labor force, with 7.5% or 4 of them being unemployed. The group with the highest labor force participation rate are those with the educational attainment of less than high school, with 100.0% or 11 individuals in the labor force. Within the labor force, individuals with college / associate degree education have the highest percentage of unemployment, with 30.8% or 4 of them being unemployed.
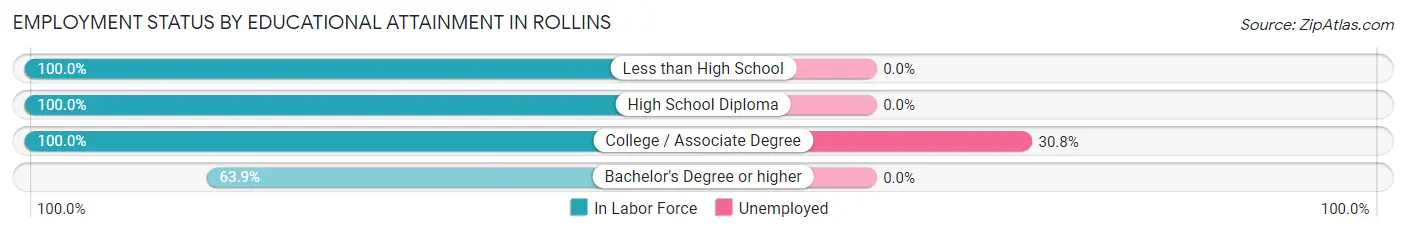
| Educational Attainment | In Labor Force | Unemployed |
| Less than High School | 11 (100.0%) | 0 (0.0%) |
| High School Diploma | 6 (100.0%) | 0 (0.0%) |
| College / Associate Degree | 13 (100.0%) | 4 (30.8%) |
| Bachelor's Degree or higher | 23 (63.9%) | 0 (0.0%) |
| Total | 53 (80.3%) | 5 (7.5%) |
Employment Occupations by Sex in Rollins
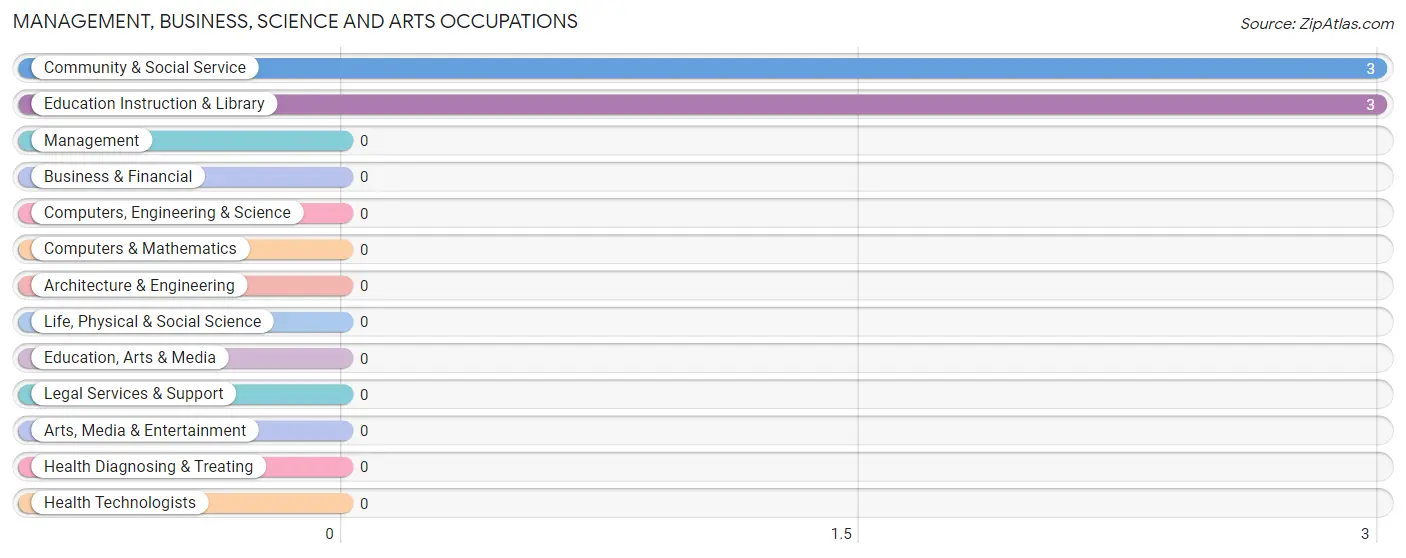
Management, Business, Science and Arts Occupations
The most common Management, Business, Science and Arts occupations in Rollins are Community & Social Service (3 | 4.0%), and Education Instruction & Library (3 | 4.0%).
Management, Business, Science and Arts Occupations by Sex
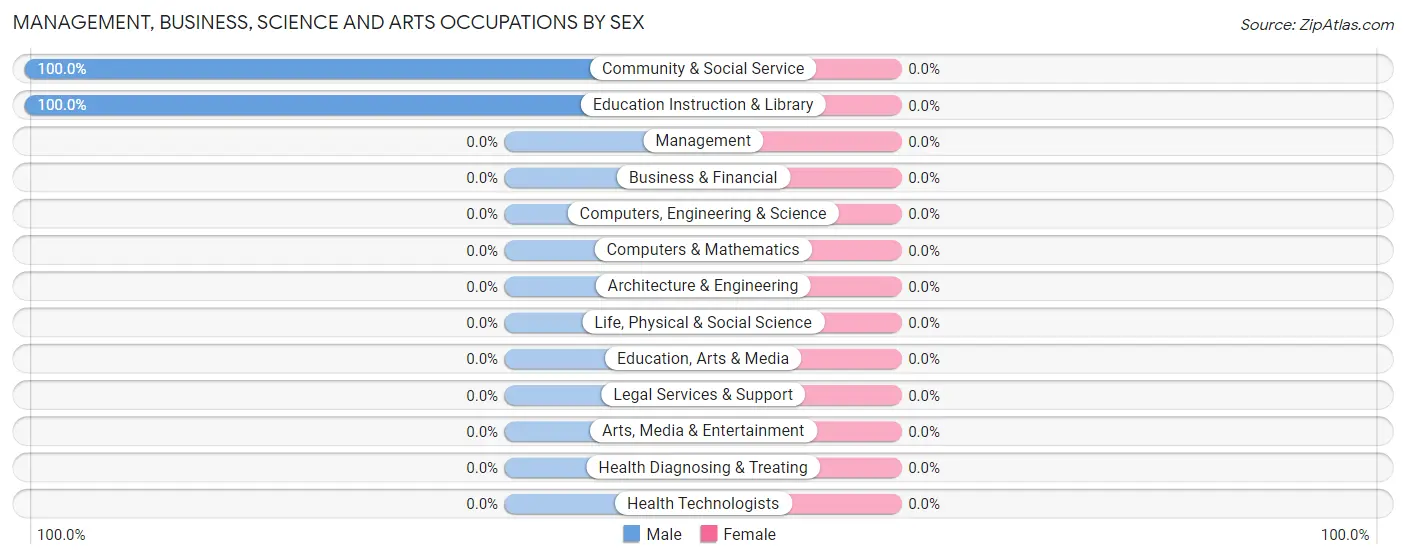
| Occupation | Male | Female |
| Management | 0 (0.0%) | 0 (0.0%) |
| Business & Financial | 0 (0.0%) | 0 (0.0%) |
| Computers, Engineering & Science | 0 (0.0%) | 0 (0.0%) |
| Computers & Mathematics | 0 (0.0%) | 0 (0.0%) |
| Architecture & Engineering | 0 (0.0%) | 0 (0.0%) |
| Life, Physical & Social Science | 0 (0.0%) | 0 (0.0%) |
| Community & Social Service | 3 (100.0%) | 0 (0.0%) |
| Education, Arts & Media | 0 (0.0%) | 0 (0.0%) |
| Legal Services & Support | 0 (0.0%) | 0 (0.0%) |
| Education Instruction & Library | 3 (100.0%) | 0 (0.0%) |
| Arts, Media & Entertainment | 0 (0.0%) | 0 (0.0%) |
| Health Diagnosing & Treating | 0 (0.0%) | 0 (0.0%) |
| Health Technologists | 0 (0.0%) | 0 (0.0%) |
| Total (Category) | 3 (100.0%) | 0 (0.0%) |
| Total (Overall) | 47 (61.8%) | 29 (38.2%) |
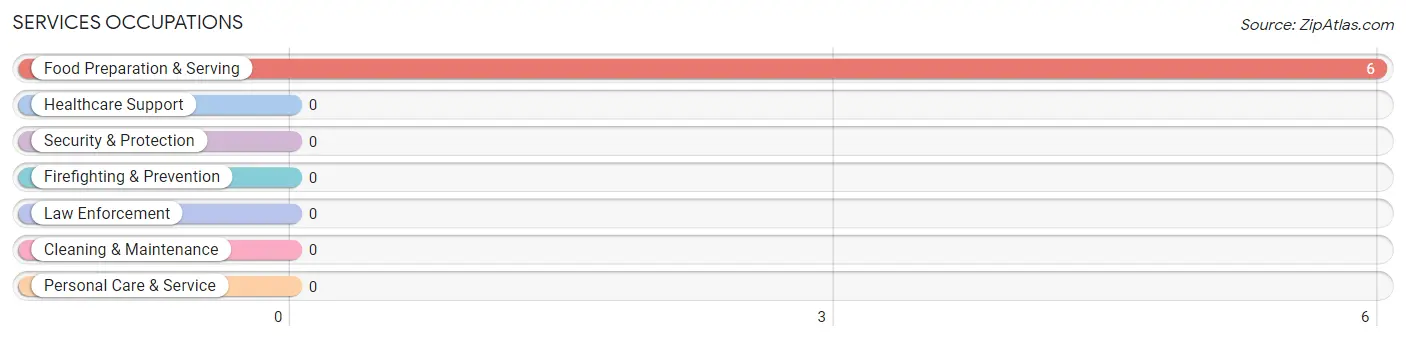
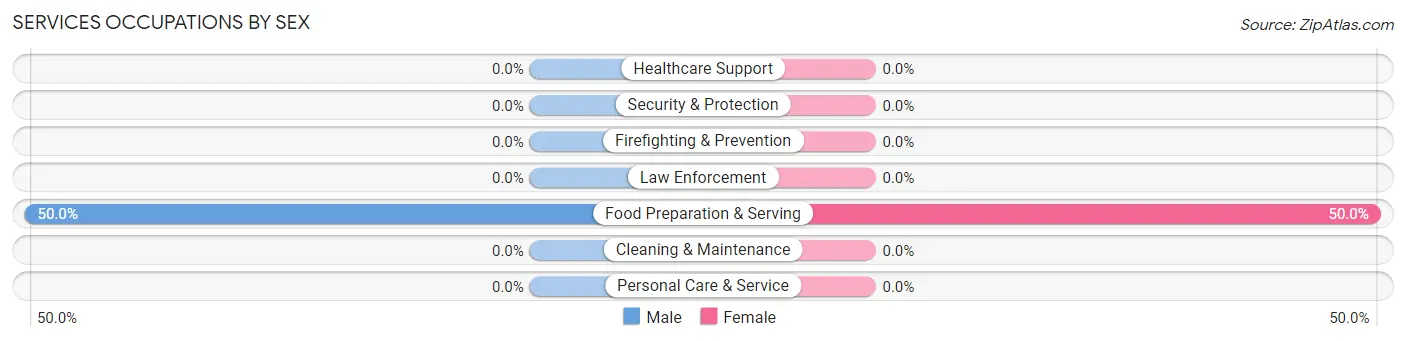
Services Occupations
The most common Services occupations in Rollins are , and Food Preparation & Serving (6 | 7.9%).
Services Occupations by Sex
| Occupation | Male | Female |
| Healthcare Support | 0 (0.0%) | 0 (0.0%) |
| Security & Protection | 0 (0.0%) | 0 (0.0%) |
| Firefighting & Prevention | 0 (0.0%) | 0 (0.0%) |
| Law Enforcement | 0 (0.0%) | 0 (0.0%) |
| Food Preparation & Serving | 3 (50.0%) | 3 (50.0%) |
| Cleaning & Maintenance | 0 (0.0%) | 0 (0.0%) |
| Personal Care & Service | 0 (0.0%) | 0 (0.0%) |
| Total (Category) | 3 (50.0%) | 3 (50.0%) |
| Total (Overall) | 47 (61.8%) | 29 (38.2%) |
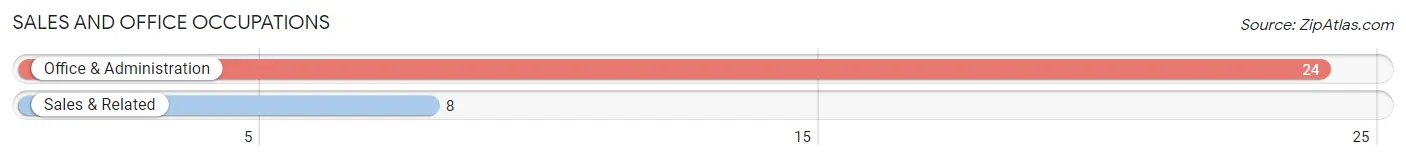
Sales and Office Occupations
The most common Sales and Office occupations in Rollins are Office & Administration (24 | 31.6%), and Sales & Related (8 | 10.5%).
Sales and Office Occupations by Sex
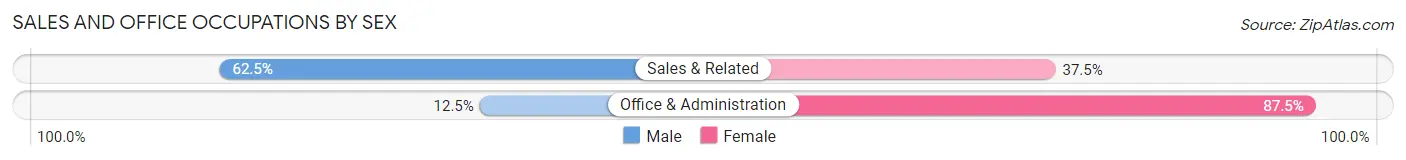
| Occupation | Male | Female |
| Sales & Related | 5 (62.5%) | 3 (37.5%) |
| Office & Administration | 3 (12.5%) | 21 (87.5%) |
| Total (Category) | 8 (25.0%) | 24 (75.0%) |
| Total (Overall) | 47 (61.8%) | 29 (38.2%) |
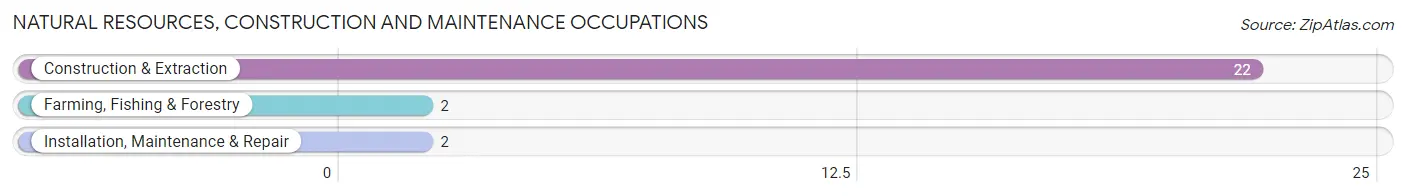
Natural Resources, Construction and Maintenance Occupations
The most common Natural Resources, Construction and Maintenance occupations in Rollins are Construction & Extraction (22 | 28.9%), Farming, Fishing & Forestry (2 | 2.6%), and Installation, Maintenance & Repair (2 | 2.6%).
Natural Resources, Construction and Maintenance Occupations by Sex
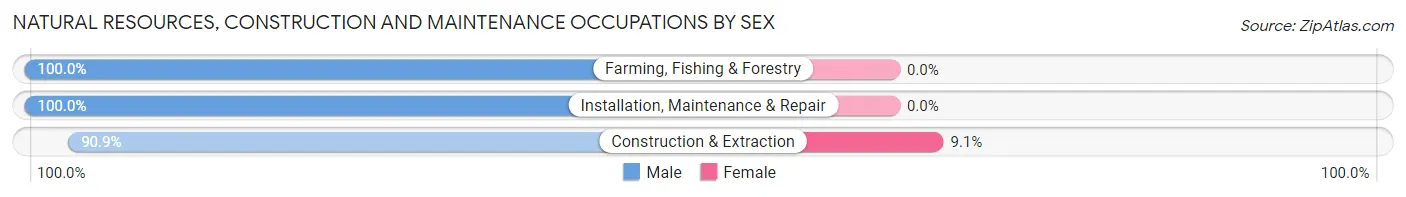
| Occupation | Male | Female |
| Farming, Fishing & Forestry | 2 (100.0%) | 0 (0.0%) |
| Construction & Extraction | 20 (90.9%) | 2 (9.1%) |
| Installation, Maintenance & Repair | 2 (100.0%) | 0 (0.0%) |
| Total (Category) | 24 (92.3%) | 2 (7.7%) |
| Total (Overall) | 47 (61.8%) | 29 (38.2%) |
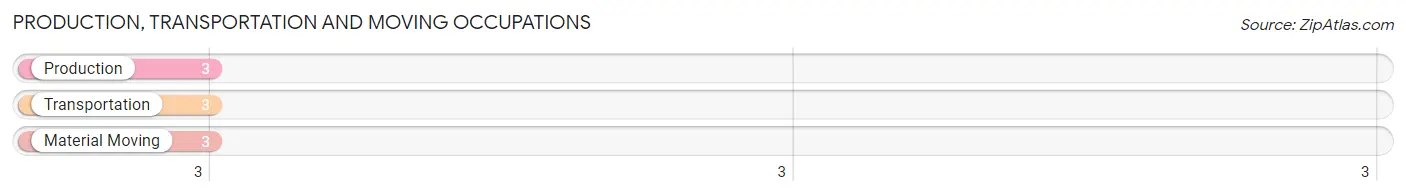
Production, Transportation and Moving Occupations
The most common Production, Transportation and Moving occupations in Rollins are Production (3 | 4.0%), Transportation (3 | 4.0%), and Material Moving (3 | 4.0%).
Production, Transportation and Moving Occupations by Sex
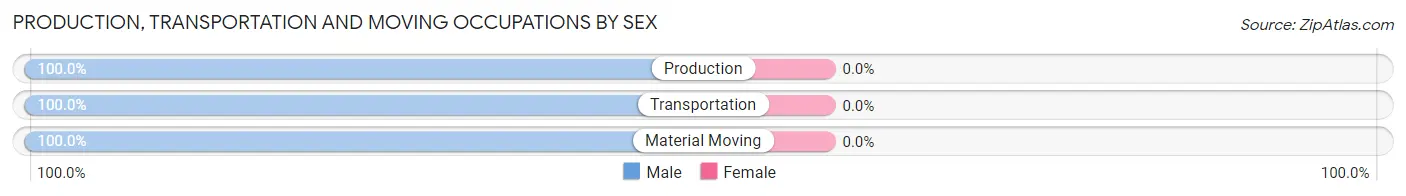
| Occupation | Male | Female |
| Production | 3 (100.0%) | 0 (0.0%) |
| Transportation | 3 (100.0%) | 0 (0.0%) |
| Material Moving | 3 (100.0%) | 0 (0.0%) |
| Total (Category) | 9 (100.0%) | 0 (0.0%) |
| Total (Overall) | 47 (61.8%) | 29 (38.2%) |
Employment Industries by Sex in Rollins
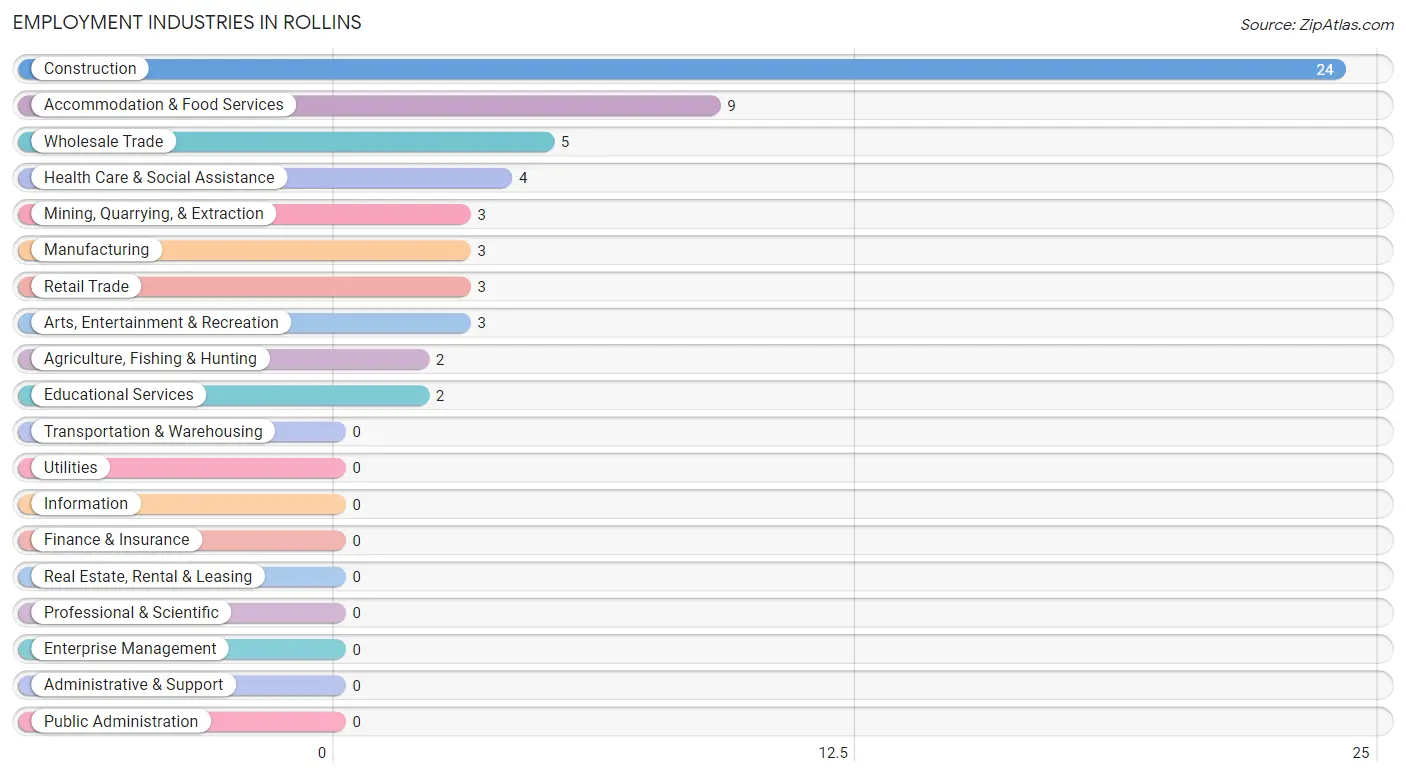
Employment Industries in Rollins
The major employment industries in Rollins include Construction (24 | 31.6%), Accommodation & Food Services (9 | 11.8%), Wholesale Trade (5 | 6.6%), Health Care & Social Assistance (4 | 5.3%), and Mining, Quarrying, & Extraction (3 | 4.0%).
Employment Industries by Sex in Rollins
The Rollins industries that see more men than women are Agriculture, Fishing & Hunting (100.0%), Mining, Quarrying, & Extraction (100.0%), and Manufacturing (100.0%), whereas the industries that tend to have a higher number of women are Retail Trade (100.0%), Construction (87.5%), and Health Care & Social Assistance (50.0%).
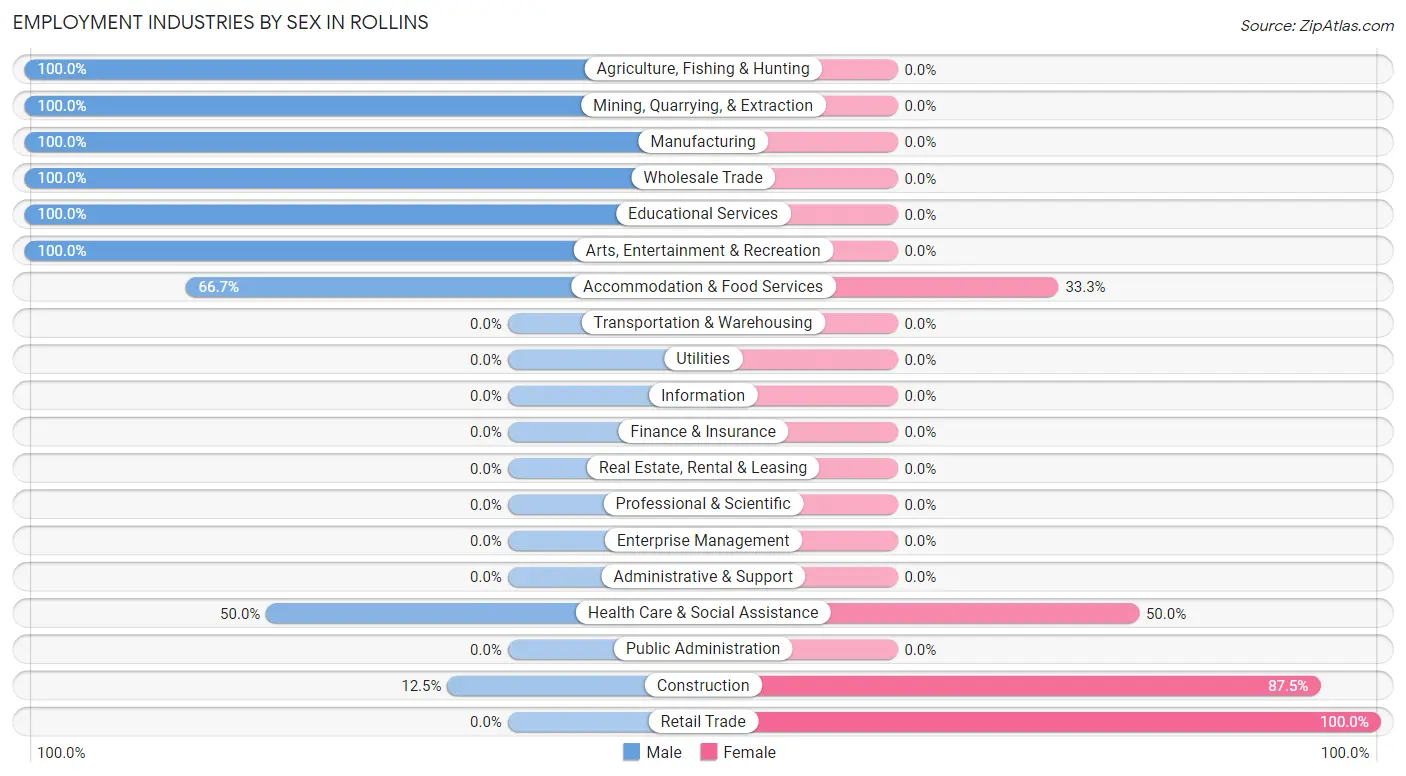
| Industry | Male | Female |
| Agriculture, Fishing & Hunting | 2 (100.0%) | 0 (0.0%) |
| Mining, Quarrying, & Extraction | 3 (100.0%) | 0 (0.0%) |
| Construction | 3 (12.5%) | 21 (87.5%) |
| Manufacturing | 3 (100.0%) | 0 (0.0%) |
| Wholesale Trade | 5 (100.0%) | 0 (0.0%) |
| Retail Trade | 0 (0.0%) | 3 (100.0%) |
| Transportation & Warehousing | 0 (0.0%) | 0 (0.0%) |
| Utilities | 0 (0.0%) | 0 (0.0%) |
| Information | 0 (0.0%) | 0 (0.0%) |
| Finance & Insurance | 0 (0.0%) | 0 (0.0%) |
| Real Estate, Rental & Leasing | 0 (0.0%) | 0 (0.0%) |
| Professional & Scientific | 0 (0.0%) | 0 (0.0%) |
| Enterprise Management | 0 (0.0%) | 0 (0.0%) |
| Administrative & Support | 0 (0.0%) | 0 (0.0%) |
| Educational Services | 2 (100.0%) | 0 (0.0%) |
| Health Care & Social Assistance | 2 (50.0%) | 2 (50.0%) |
| Arts, Entertainment & Recreation | 3 (100.0%) | 0 (0.0%) |
| Accommodation & Food Services | 6 (66.7%) | 3 (33.3%) |
| Public Administration | 0 (0.0%) | 0 (0.0%) |
| Total | 47 (61.8%) | 29 (38.2%) |
Education in Rollins
School Enrollment in Rollins
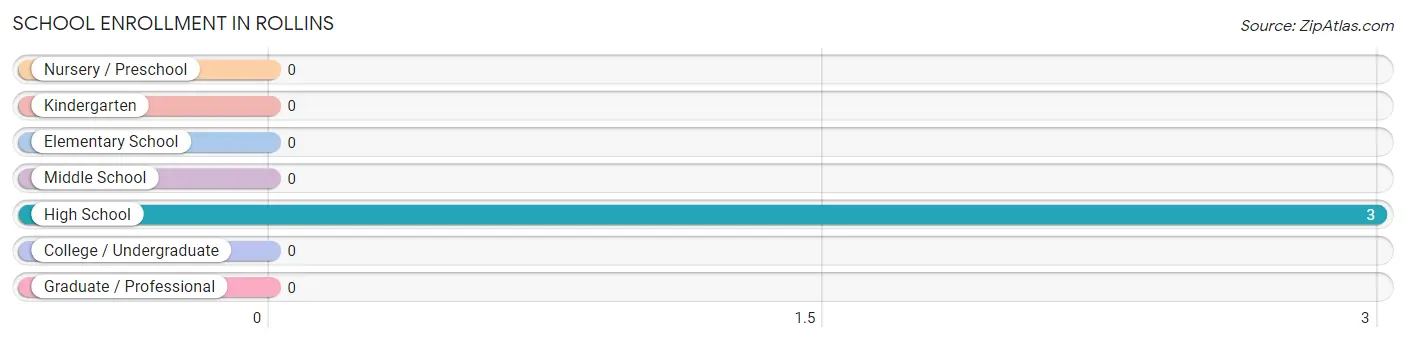
| School Level | # Students | % Students |
| Nursery / Preschool | 0 | 0.0% |
| Kindergarten | 0 | 0.0% |
| Elementary School | 0 | 0.0% |
| Middle School | 0 | 0.0% |
| High School | 3 | 100.0% |
| College / Undergraduate | 0 | 0.0% |
| Graduate / Professional | 0 | 0.0% |
| Total | 3 | 100.0% |
School Enrollment by Age by Funding Source in Rollins
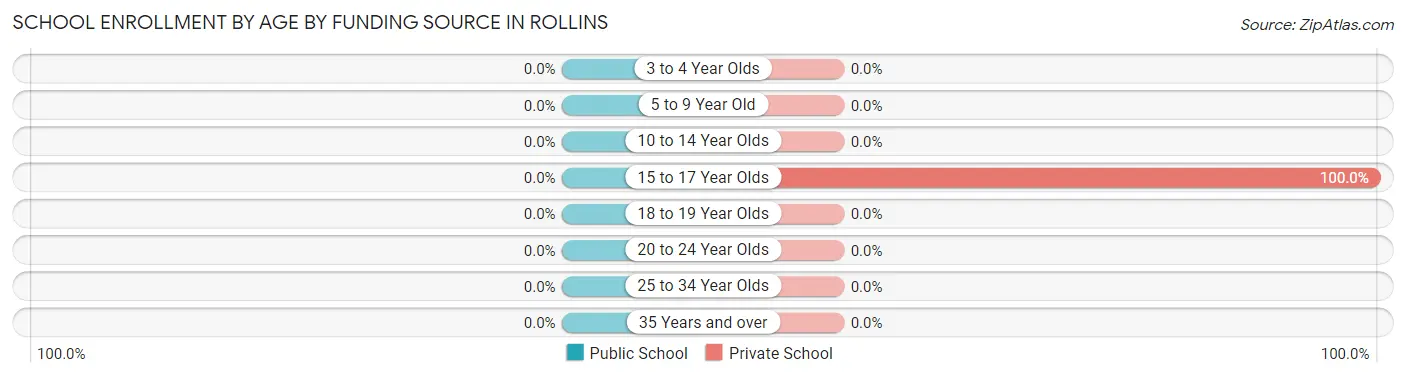
| Age Bracket | Public School | Private School |
| 3 to 4 Year Olds | 0 (0.0%) | 0 (0.0%) |
| 5 to 9 Year Old | 0 (0.0%) | 0 (0.0%) |
| 10 to 14 Year Olds | 0 (0.0%) | 0 (0.0%) |
| 15 to 17 Year Olds | 0 (0.0%) | 3 (100.0%) |
| 18 to 19 Year Olds | 0 (0.0%) | 0 (0.0%) |
| 20 to 24 Year Olds | 0 (0.0%) | 0 (0.0%) |
| 25 to 34 Year Olds | 0 (0.0%) | 0 (0.0%) |
| 35 Years and over | 0 (0.0%) | 0 (0.0%) |
| Total | 0 (0.0%) | 3 (100.0%) |
Educational Attainment by Field of Study in Rollins
Bio, nature & agricultural (27 | 31.0%), engineering (21 | 24.1%), business (21 | 24.1%), education (7 | 8.1%), and physical & health sciences (4 | 4.6%) are the most common fields of study among 87 individuals in Rollins who have obtained a bachelor's degree or higher.
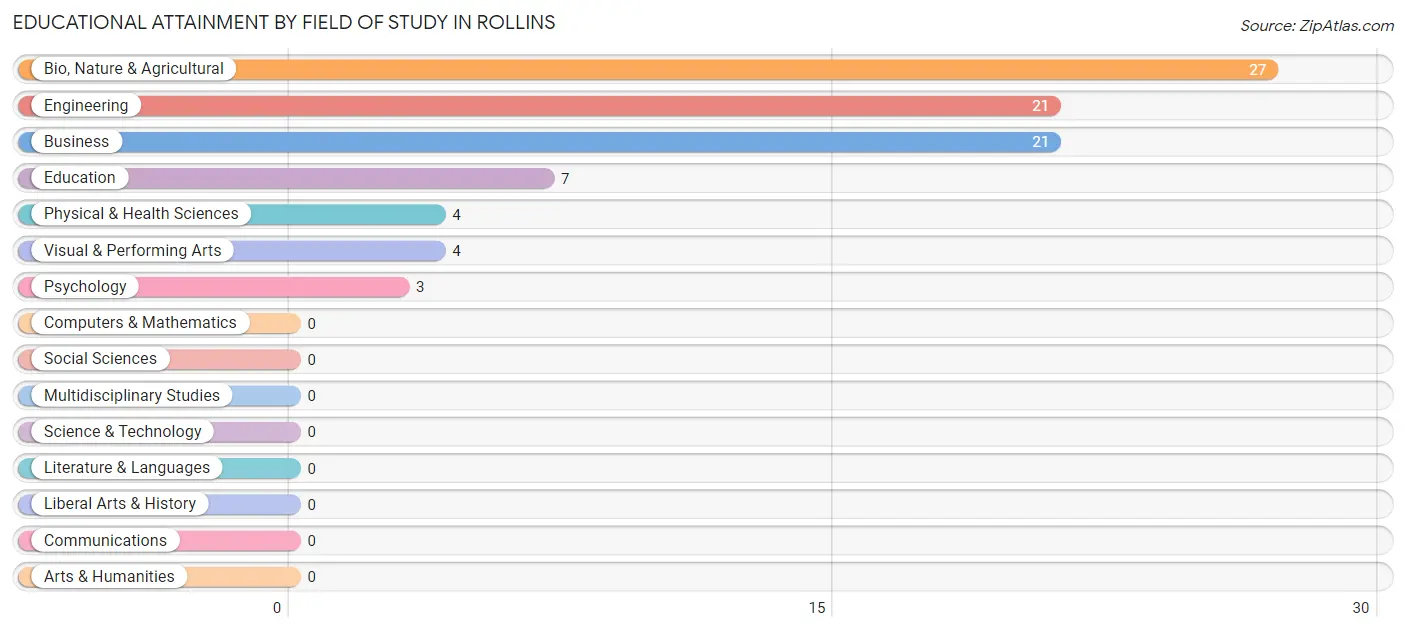
| Field of Study | # Graduates | % Graduates |
| Computers & Mathematics | 0 | 0.0% |
| Bio, Nature & Agricultural | 27 | 31.0% |
| Physical & Health Sciences | 4 | 4.6% |
| Psychology | 3 | 3.5% |
| Social Sciences | 0 | 0.0% |
| Engineering | 21 | 24.1% |
| Multidisciplinary Studies | 0 | 0.0% |
| Science & Technology | 0 | 0.0% |
| Business | 21 | 24.1% |
| Education | 7 | 8.1% |
| Literature & Languages | 0 | 0.0% |
| Liberal Arts & History | 0 | 0.0% |
| Visual & Performing Arts | 4 | 4.6% |
| Communications | 0 | 0.0% |
| Arts & Humanities | 0 | 0.0% |
| Total | 87 | 100.0% |
Transportation & Commute in Rollins
Vehicle Availability by Sex in Rollins
The most prevalent vehicle ownership categories in Rollins are males with 3 vehicles (18, accounting for 64.3%) and females with 3 vehicles (21, making up 66.7%).
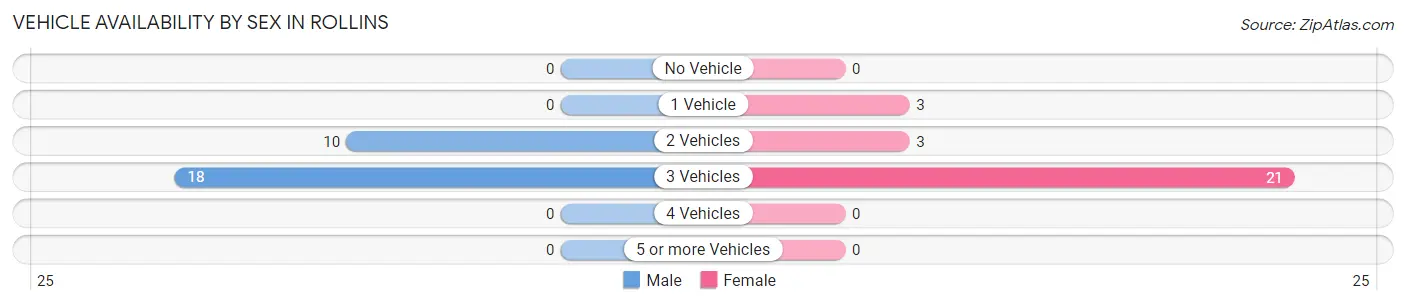
| Vehicles Available | Male | Female |
| No Vehicle | 0 (0.0%) | 0 (0.0%) |
| 1 Vehicle | 0 (0.0%) | 3 (11.1%) |
| 2 Vehicles | 10 (35.7%) | 3 (11.1%) |
| 3 Vehicles | 18 (64.3%) | 21 (77.8%) |
| 4 Vehicles | 0 (0.0%) | 0 (0.0%) |
| 5 or more Vehicles | 0 (0.0%) | 0 (0.0%) |
| Total | 28 (100.0%) | 27 (100.0%) |
Commute Time in Rollins
The most frequently occuring commute durations in Rollins are less than 5 minutes (27 commuters, 39.7%), 45 to 59 minutes (24 commuters, 35.3%), and 40 to 44 minutes (8 commuters, 11.8%).
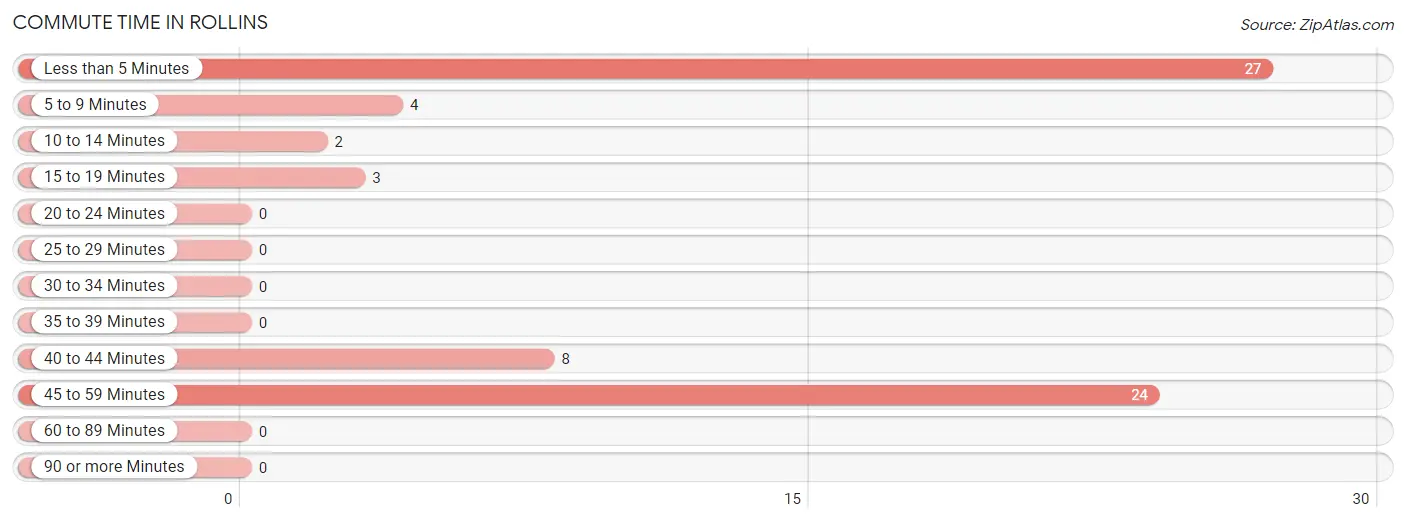
| Commute Time | # Commuters | % Commuters |
| Less than 5 Minutes | 27 | 39.7% |
| 5 to 9 Minutes | 4 | 5.9% |
| 10 to 14 Minutes | 2 | 2.9% |
| 15 to 19 Minutes | 3 | 4.4% |
| 20 to 24 Minutes | 0 | 0.0% |
| 25 to 29 Minutes | 0 | 0.0% |
| 30 to 34 Minutes | 0 | 0.0% |
| 35 to 39 Minutes | 0 | 0.0% |
| 40 to 44 Minutes | 8 | 11.8% |
| 45 to 59 Minutes | 24 | 35.3% |
| 60 to 89 Minutes | 0 | 0.0% |
| 90 or more Minutes | 0 | 0.0% |
Commute Time by Sex in Rollins
The most common commute times in Rollins are less than 5 minutes (24 commuters, 61.5%) for males and 45 to 59 minutes (21 commuters, 72.4%) for females.
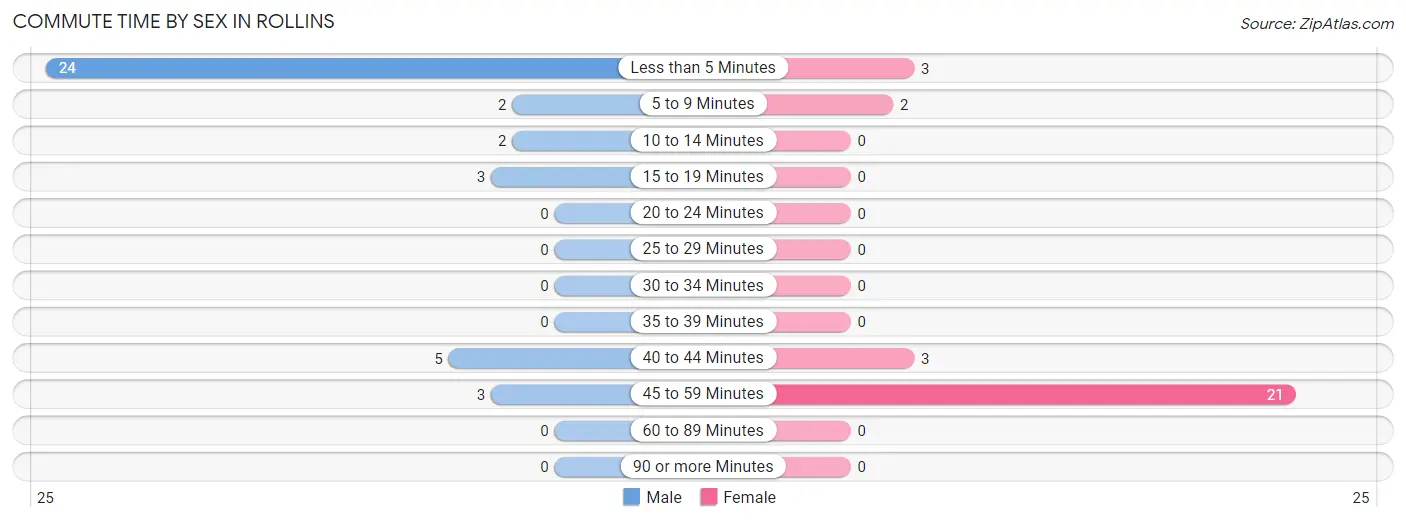
| Commute Time | Male | Female |
| Less than 5 Minutes | 24 (61.5%) | 3 (10.3%) |
| 5 to 9 Minutes | 2 (5.1%) | 2 (6.9%) |
| 10 to 14 Minutes | 2 (5.1%) | 0 (0.0%) |
| 15 to 19 Minutes | 3 (7.7%) | 0 (0.0%) |
| 20 to 24 Minutes | 0 (0.0%) | 0 (0.0%) |
| 25 to 29 Minutes | 0 (0.0%) | 0 (0.0%) |
| 30 to 34 Minutes | 0 (0.0%) | 0 (0.0%) |
| 35 to 39 Minutes | 0 (0.0%) | 0 (0.0%) |
| 40 to 44 Minutes | 5 (12.8%) | 3 (10.3%) |
| 45 to 59 Minutes | 3 (7.7%) | 21 (72.4%) |
| 60 to 89 Minutes | 0 (0.0%) | 0 (0.0%) |
| 90 or more Minutes | 0 (0.0%) | 0 (0.0%) |
Time of Departure to Work by Sex in Rollins
The most frequent times of departure to work in Rollins are 9:00 AM to 9:59 AM (18, 46.2%) for males and 8:00 AM to 8:29 AM (21, 72.4%) for females.
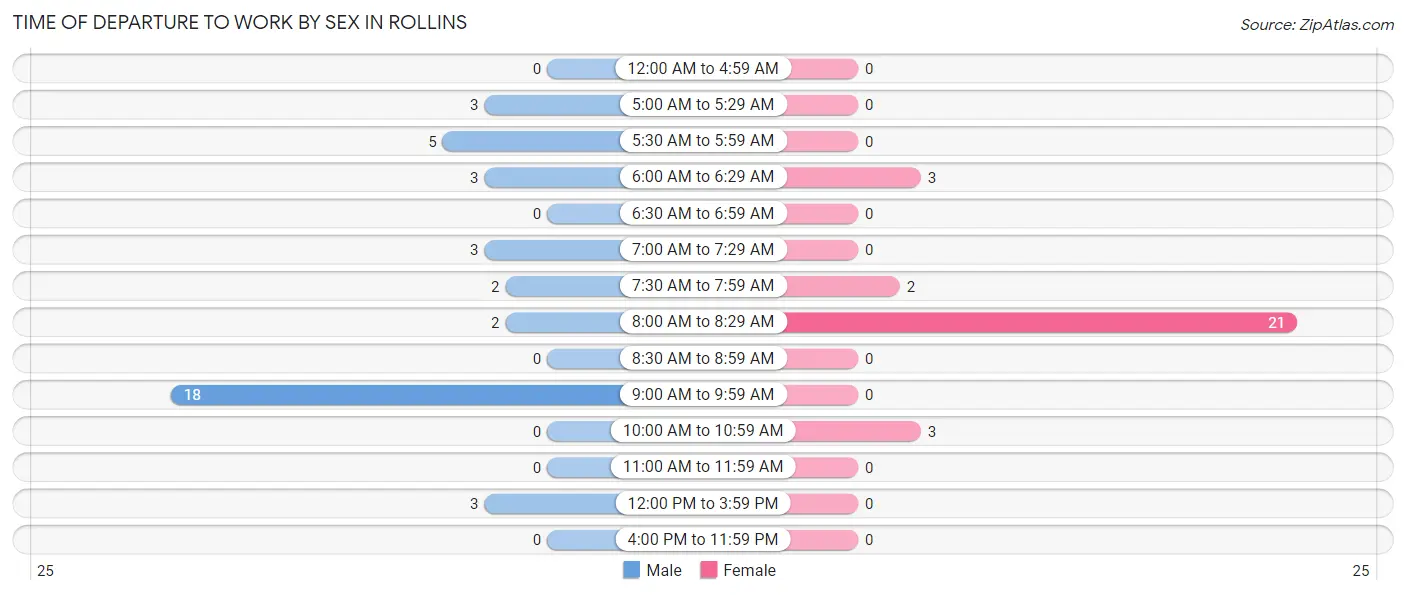
| Time of Departure | Male | Female |
| 12:00 AM to 4:59 AM | 0 (0.0%) | 0 (0.0%) |
| 5:00 AM to 5:29 AM | 3 (7.7%) | 0 (0.0%) |
| 5:30 AM to 5:59 AM | 5 (12.8%) | 0 (0.0%) |
| 6:00 AM to 6:29 AM | 3 (7.7%) | 3 (10.3%) |
| 6:30 AM to 6:59 AM | 0 (0.0%) | 0 (0.0%) |
| 7:00 AM to 7:29 AM | 3 (7.7%) | 0 (0.0%) |
| 7:30 AM to 7:59 AM | 2 (5.1%) | 2 (6.9%) |
| 8:00 AM to 8:29 AM | 2 (5.1%) | 21 (72.4%) |
| 8:30 AM to 8:59 AM | 0 (0.0%) | 0 (0.0%) |
| 9:00 AM to 9:59 AM | 18 (46.2%) | 0 (0.0%) |
| 10:00 AM to 10:59 AM | 0 (0.0%) | 3 (10.3%) |
| 11:00 AM to 11:59 AM | 0 (0.0%) | 0 (0.0%) |
| 12:00 PM to 3:59 PM | 3 (7.7%) | 0 (0.0%) |
| 4:00 PM to 11:59 PM | 0 (0.0%) | 0 (0.0%) |
| Total | 39 (100.0%) | 29 (100.0%) |
Housing Occupancy in Rollins
Occupancy by Ownership in Rollins
Of the total 54 dwellings in Rollins, owner-occupied units account for 52 (96.3%), while renter-occupied units make up 2 (3.7%).
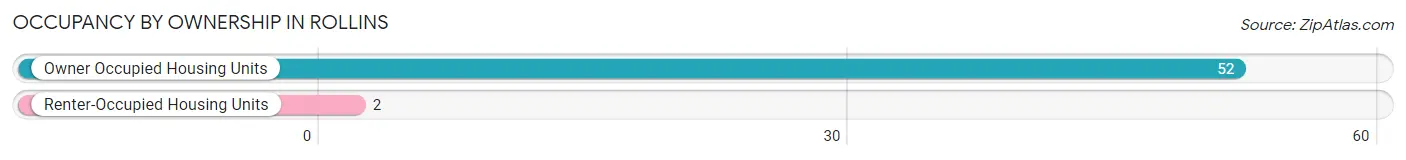
| Occupancy | # Housing Units | % Housing Units |
| Owner Occupied Housing Units | 52 | 96.3% |
| Renter-Occupied Housing Units | 2 | 3.7% |
| Total Occupied Housing Units | 54 | 100.0% |
Occupancy by Household Size in Rollins
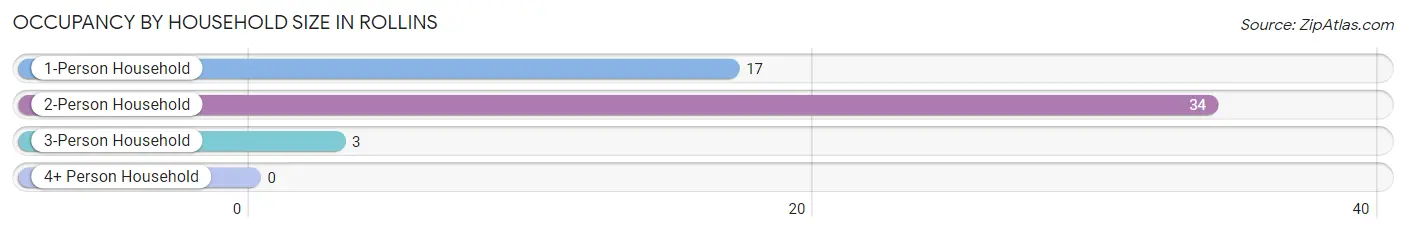
| Household Size | # Housing Units | % Housing Units |
| 1-Person Household | 17 | 31.5% |
| 2-Person Household | 34 | 63.0% |
| 3-Person Household | 3 | 5.6% |
| 4+ Person Household | 0 | 0.0% |
| Total Housing Units | 54 | 100.0% |
Occupancy by Ownership by Household Size in Rollins
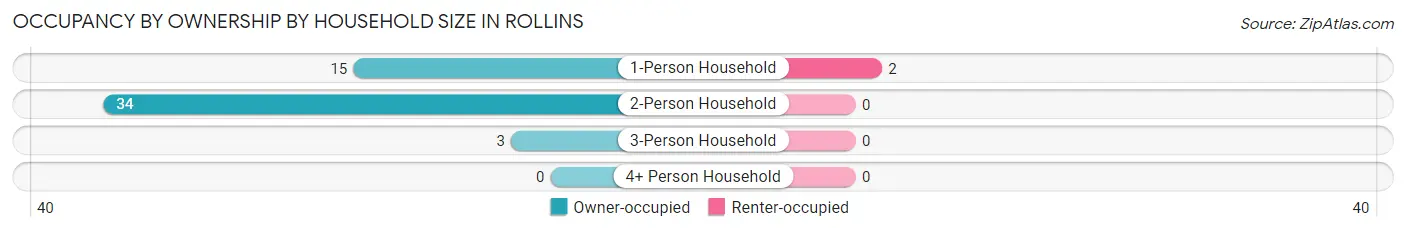
| Household Size | Owner-occupied | Renter-occupied |
| 1-Person Household | 15 (88.2%) | 2 (11.8%) |
| 2-Person Household | 34 (100.0%) | 0 (0.0%) |
| 3-Person Household | 3 (100.0%) | 0 (0.0%) |
| 4+ Person Household | 0 (0.0%) | 0 (0.0%) |
| Total Housing Units | 52 (96.3%) | 2 (3.7%) |
Occupancy by Educational Attainment in Rollins
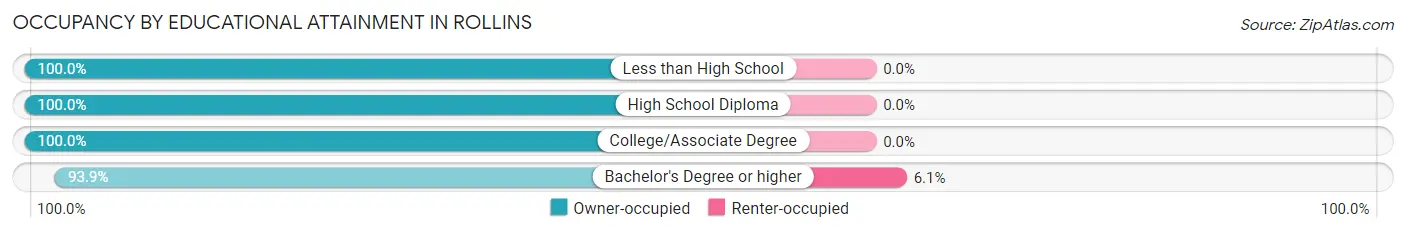
| Household Size | Owner-occupied | Renter-occupied |
| Less than High School | 8 (100.0%) | 0 (0.0%) |
| High School Diploma | 3 (100.0%) | 0 (0.0%) |
| College/Associate Degree | 10 (100.0%) | 0 (0.0%) |
| Bachelor's Degree or higher | 31 (93.9%) | 2 (6.1%) |
Occupancy by Age of Householder in Rollins
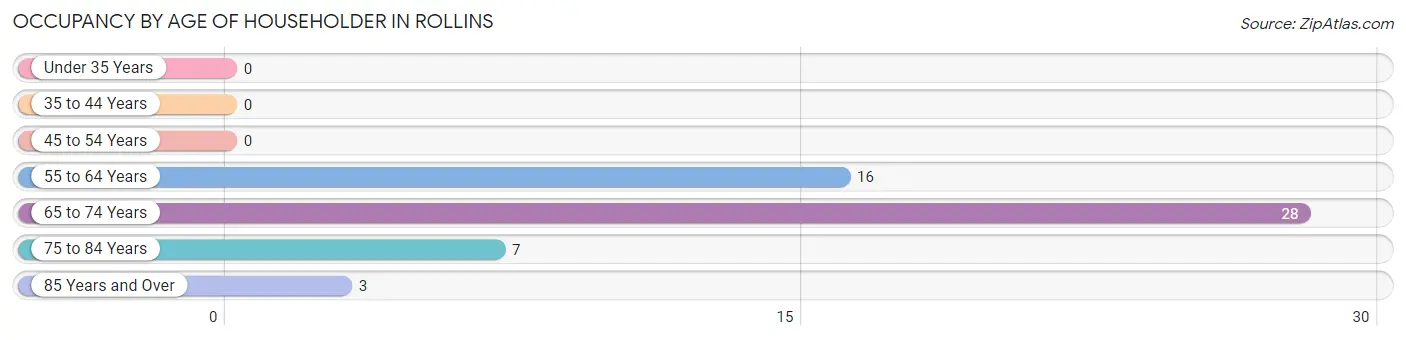
| Age Bracket | # Households | % Households |
| Under 35 Years | 0 | 0.0% |
| 35 to 44 Years | 0 | 0.0% |
| 45 to 54 Years | 0 | 0.0% |
| 55 to 64 Years | 16 | 29.6% |
| 65 to 74 Years | 28 | 51.8% |
| 75 to 84 Years | 7 | 13.0% |
| 85 Years and Over | 3 | 5.6% |
| Total | 54 | 100.0% |
Housing Finances in Rollins
Median Income by Occupancy in Rollins
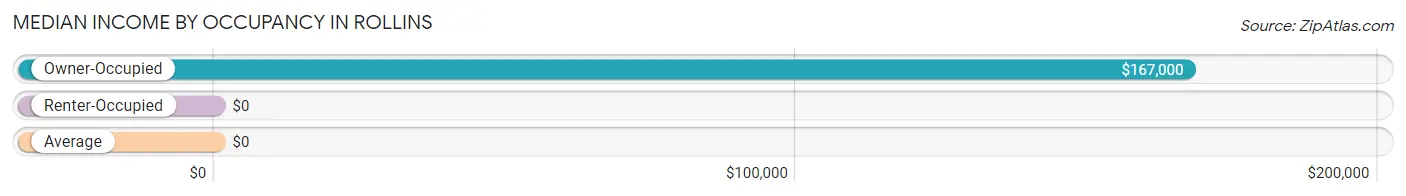
| Occupancy Type | # Households | Median Income |
| Owner-Occupied | 52 (96.3%) | $167,000 |
| Renter-Occupied | 2 (3.7%) | $0 |
| Average | 54 (100.0%) | $0 |
Occupancy by Householder Income Bracket in Rollins
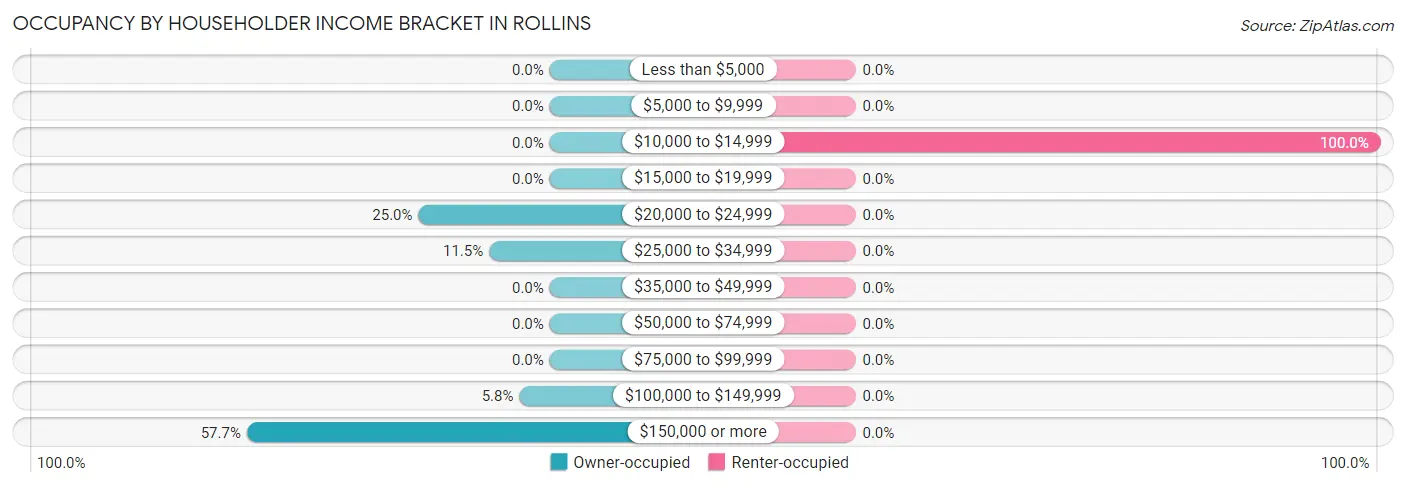
| Income Bracket | Owner-occupied | Renter-occupied |
| Less than $5,000 | 0 (0.0%) | 0 (0.0%) |
| $5,000 to $9,999 | 0 (0.0%) | 0 (0.0%) |
| $10,000 to $14,999 | 0 (0.0%) | 2 (100.0%) |
| $15,000 to $19,999 | 0 (0.0%) | 0 (0.0%) |
| $20,000 to $24,999 | 13 (25.0%) | 0 (0.0%) |
| $25,000 to $34,999 | 6 (11.5%) | 0 (0.0%) |
| $35,000 to $49,999 | 0 (0.0%) | 0 (0.0%) |
| $50,000 to $74,999 | 0 (0.0%) | 0 (0.0%) |
| $75,000 to $99,999 | 0 (0.0%) | 0 (0.0%) |
| $100,000 to $149,999 | 3 (5.8%) | 0 (0.0%) |
| $150,000 or more | 30 (57.7%) | 0 (0.0%) |
| Total | 52 (100.0%) | 2 (100.0%) |
Monthly Housing Cost Tiers in Rollins
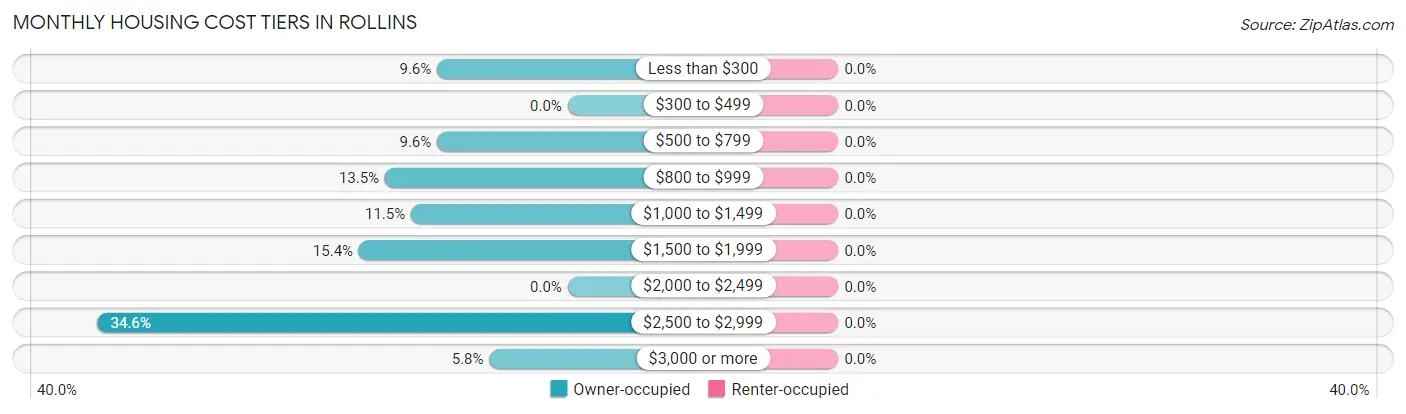
| Monthly Cost | Owner-occupied | Renter-occupied |
| Less than $300 | 5 (9.6%) | 0 (0.0%) |
| $300 to $499 | 0 (0.0%) | 0 (0.0%) |
| $500 to $799 | 5 (9.6%) | 0 (0.0%) |
| $800 to $999 | 7 (13.5%) | 0 (0.0%) |
| $1,000 to $1,499 | 6 (11.5%) | 0 (0.0%) |
| $1,500 to $1,999 | 8 (15.4%) | 0 (0.0%) |
| $2,000 to $2,499 | 0 (0.0%) | 0 (0.0%) |
| $2,500 to $2,999 | 18 (34.6%) | 0 (0.0%) |
| $3,000 or more | 3 (5.8%) | 0 (0.0%) |
| Total | 52 (100.0%) | 2 (100.0%) |
Physical Housing Characteristics in Rollins
Housing Structures in Rollins
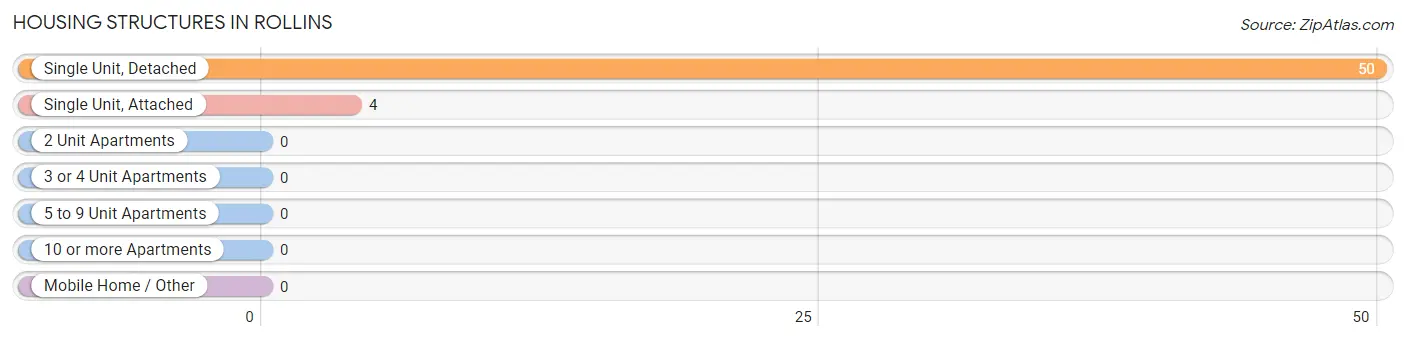
| Structure Type | # Housing Units | % Housing Units |
| Single Unit, Detached | 50 | 92.6% |
| Single Unit, Attached | 4 | 7.4% |
| 2 Unit Apartments | 0 | 0.0% |
| 3 or 4 Unit Apartments | 0 | 0.0% |
| 5 to 9 Unit Apartments | 0 | 0.0% |
| 10 or more Apartments | 0 | 0.0% |
| Mobile Home / Other | 0 | 0.0% |
| Total | 54 | 100.0% |
Housing Structures by Occupancy in Rollins
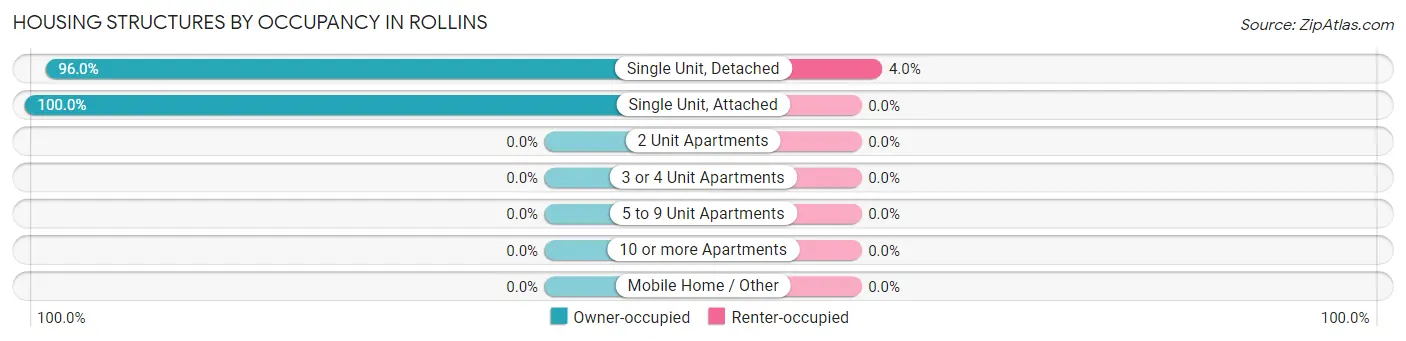
| Structure Type | Owner-occupied | Renter-occupied |
| Single Unit, Detached | 48 (96.0%) | 2 (4.0%) |
| Single Unit, Attached | 4 (100.0%) | 0 (0.0%) |
| 2 Unit Apartments | 0 (0.0%) | 0 (0.0%) |
| 3 or 4 Unit Apartments | 0 (0.0%) | 0 (0.0%) |
| 5 to 9 Unit Apartments | 0 (0.0%) | 0 (0.0%) |
| 10 or more Apartments | 0 (0.0%) | 0 (0.0%) |
| Mobile Home / Other | 0 (0.0%) | 0 (0.0%) |
| Total | 52 (96.3%) | 2 (3.7%) |
Housing Structures by Number of Rooms in Rollins
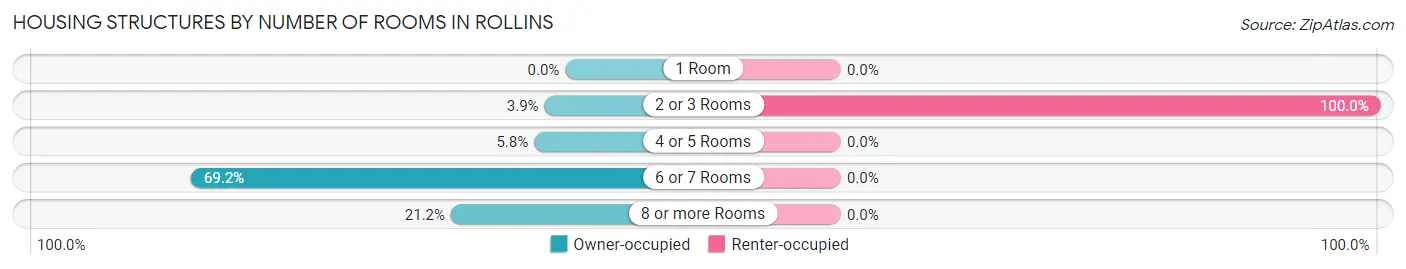
| Number of Rooms | Owner-occupied | Renter-occupied |
| 1 Room | 0 (0.0%) | 0 (0.0%) |
| 2 or 3 Rooms | 2 (3.8%) | 2 (100.0%) |
| 4 or 5 Rooms | 3 (5.8%) | 0 (0.0%) |
| 6 or 7 Rooms | 36 (69.2%) | 0 (0.0%) |
| 8 or more Rooms | 11 (21.1%) | 0 (0.0%) |
| Total | 52 (100.0%) | 2 (100.0%) |
Housing Structure by Heating Type in Rollins
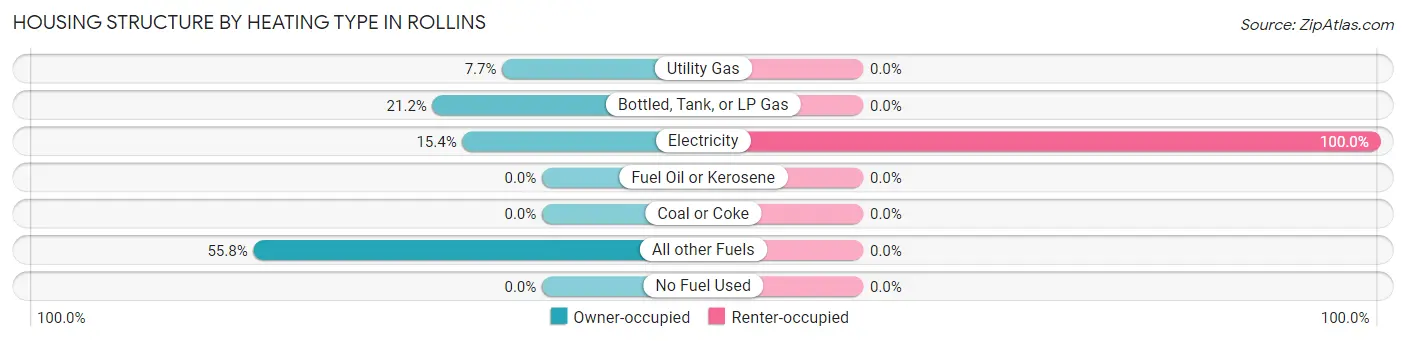
| Heating Type | Owner-occupied | Renter-occupied |
| Utility Gas | 4 (7.7%) | 0 (0.0%) |
| Bottled, Tank, or LP Gas | 11 (21.1%) | 0 (0.0%) |
| Electricity | 8 (15.4%) | 2 (100.0%) |
| Fuel Oil or Kerosene | 0 (0.0%) | 0 (0.0%) |
| Coal or Coke | 0 (0.0%) | 0 (0.0%) |
| All other Fuels | 29 (55.8%) | 0 (0.0%) |
| No Fuel Used | 0 (0.0%) | 0 (0.0%) |
| Total | 52 (100.0%) | 2 (100.0%) |
Household Vehicle Usage in Rollins
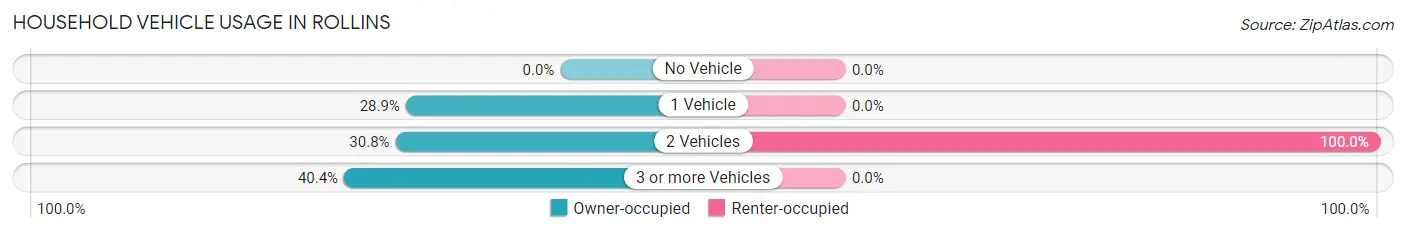
| Vehicles per Household | Owner-occupied | Renter-occupied |
| No Vehicle | 0 (0.0%) | 0 (0.0%) |
| 1 Vehicle | 15 (28.8%) | 0 (0.0%) |
| 2 Vehicles | 16 (30.8%) | 2 (100.0%) |
| 3 or more Vehicles | 21 (40.4%) | 0 (0.0%) |
| Total | 52 (100.0%) | 2 (100.0%) |
Real Estate & Mortgages in Rollins
Real Estate and Mortgage Overview in Rollins
| Characteristic | Without Mortgage | With Mortgage |
| Housing Units | 20 | 32 |
| Median Property Value | $1,022,700 | $1,319,400 |
| Median Household Income | - | - |
| Monthly Housing Costs | $700 | $3 |
| Real Estate Taxes | $4,750 | $0 |
Property Value by Mortgage Status in Rollins
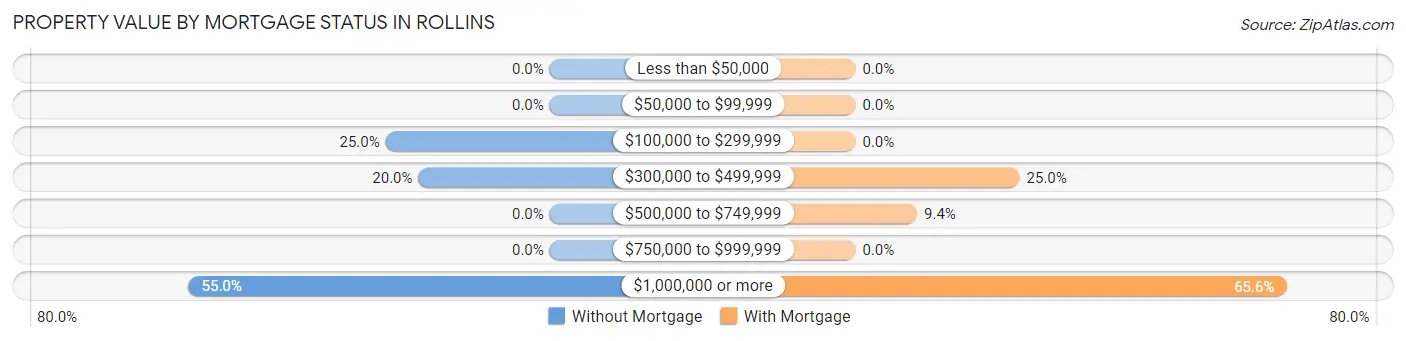
| Property Value | Without Mortgage | With Mortgage |
| Less than $50,000 | 0 (0.0%) | 0 (0.0%) |
| $50,000 to $99,999 | 0 (0.0%) | 0 (0.0%) |
| $100,000 to $299,999 | 5 (25.0%) | 0 (0.0%) |
| $300,000 to $499,999 | 4 (20.0%) | 8 (25.0%) |
| $500,000 to $749,999 | 0 (0.0%) | 3 (9.4%) |
| $750,000 to $999,999 | 0 (0.0%) | 0 (0.0%) |
| $1,000,000 or more | 11 (55.0%) | 21 (65.6%) |
| Total | 20 (100.0%) | 32 (100.0%) |
Household Income by Mortgage Status in Rollins
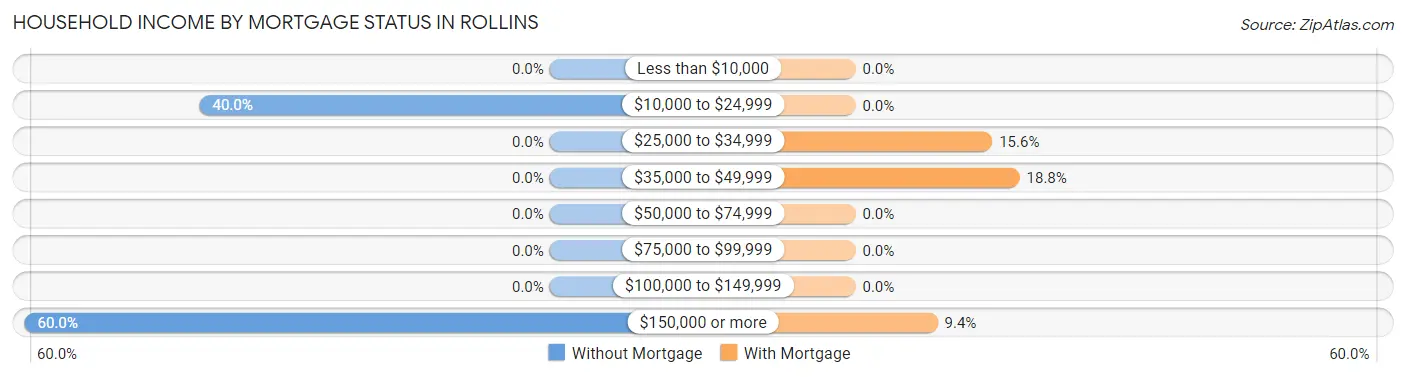
| Household Income | Without Mortgage | With Mortgage |
| Less than $10,000 | 0 (0.0%) | 0 (0.0%) |
| $10,000 to $24,999 | 8 (40.0%) | 0 (0.0%) |
| $25,000 to $34,999 | 0 (0.0%) | 5 (15.6%) |
| $35,000 to $49,999 | 0 (0.0%) | 6 (18.8%) |
| $50,000 to $74,999 | 0 (0.0%) | 0 (0.0%) |
| $75,000 to $99,999 | 0 (0.0%) | 0 (0.0%) |
| $100,000 to $149,999 | 0 (0.0%) | 0 (0.0%) |
| $150,000 or more | 12 (60.0%) | 3 (9.4%) |
| Total | 20 (100.0%) | 32 (100.0%) |
Property Value to Household Income Ratio in Rollins
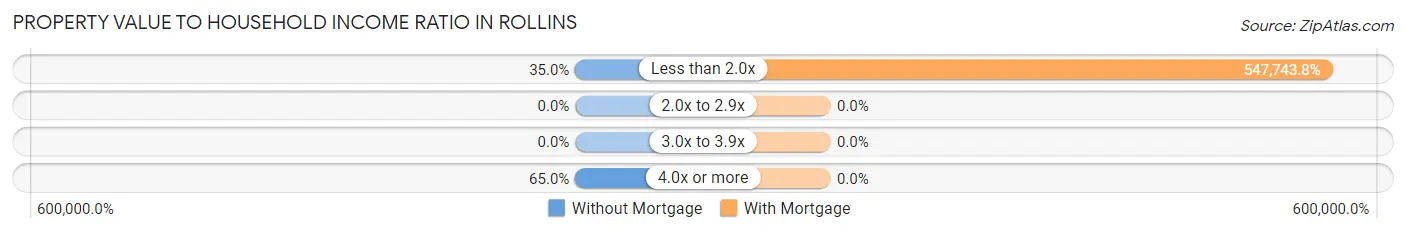
| Value-to-Income Ratio | Without Mortgage | With Mortgage |
| Less than 2.0x | 7 (35.0%) | 175,278 (547,743.8%) |
| 2.0x to 2.9x | 0 (0.0%) | 0 (0.0%) |
| 3.0x to 3.9x | 0 (0.0%) | 0 (0.0%) |
| 4.0x or more | 13 (65.0%) | 0 (0.0%) |
| Total | 20 (100.0%) | 32 (100.0%) |
Real Estate Taxes by Mortgage Status in Rollins
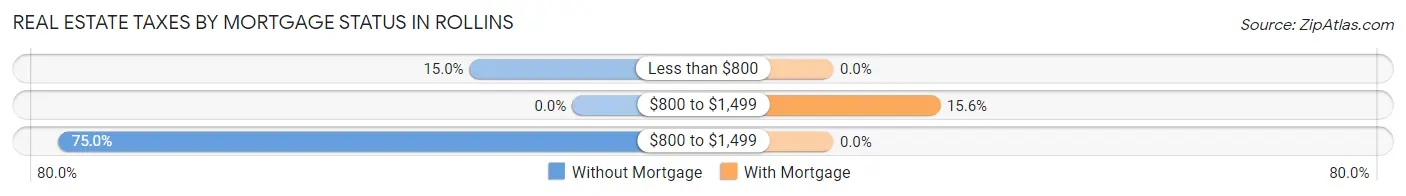
| Property Taxes | Without Mortgage | With Mortgage |
| Less than $800 | 3 (15.0%) | 0 (0.0%) |
| $800 to $1,499 | 0 (0.0%) | 5 (15.6%) |
| $800 to $1,499 | 15 (75.0%) | 0 (0.0%) |
| Total | 20 (100.0%) | 32 (100.0%) |
Health & Disability in Rollins
Health Insurance Coverage by Age in Rollins
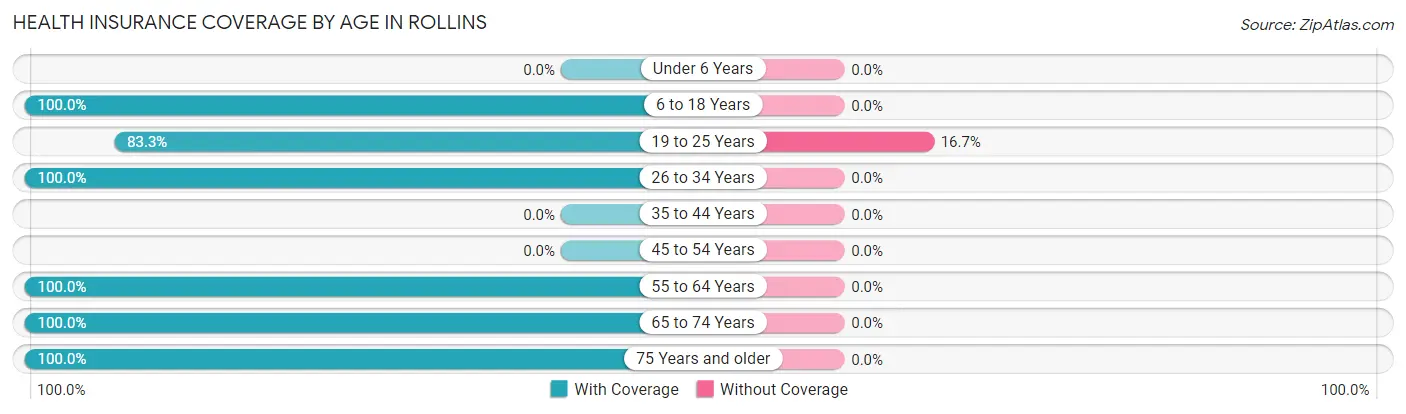
| Age Bracket | With Coverage | Without Coverage |
| Under 6 Years | 0 (0.0%) | 0 (0.0%) |
| 6 to 18 Years | 3 (100.0%) | 0 (0.0%) |
| 19 to 25 Years | 10 (83.3%) | 2 (16.7%) |
| 26 to 34 Years | 7 (100.0%) | 0 (0.0%) |
| 35 to 44 Years | 0 (0.0%) | 0 (0.0%) |
| 45 to 54 Years | 0 (0.0%) | 0 (0.0%) |
| 55 to 64 Years | 53 (100.0%) | 0 (0.0%) |
| 65 to 74 Years | 32 (100.0%) | 0 (0.0%) |
| 75 Years and older | 19 (100.0%) | 0 (0.0%) |
| Total | 124 (98.4%) | 2 (1.6%) |
Health Insurance Coverage by Citizenship Status in Rollins
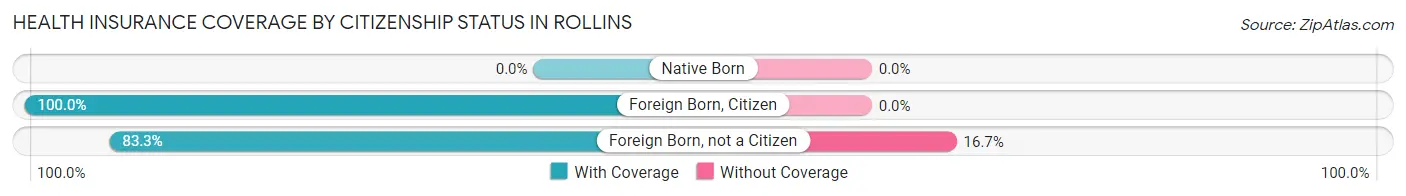
| Citizenship Status | With Coverage | Without Coverage |
| Native Born | 0 (0.0%) | 0 (0.0%) |
| Foreign Born, Citizen | 3 (100.0%) | 0 (0.0%) |
| Foreign Born, not a Citizen | 10 (83.3%) | 2 (16.7%) |
Health Insurance Coverage by Household Income in Rollins
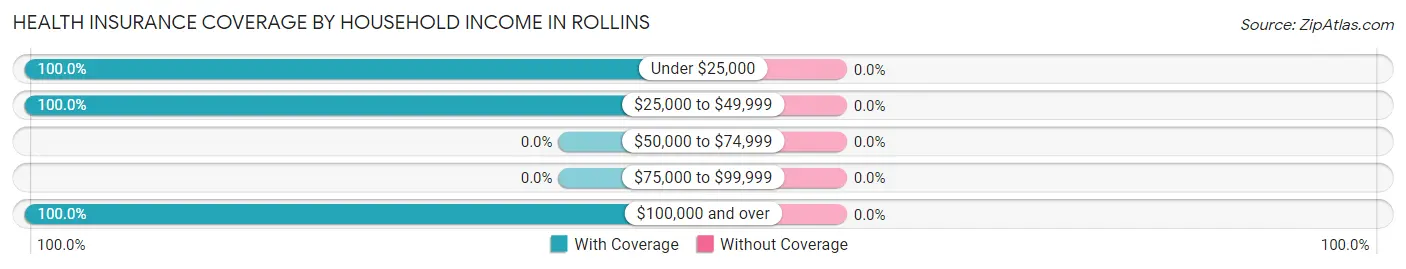
| Household Income | With Coverage | Without Coverage |
| Under $25,000 | 29 (100.0%) | 0 (0.0%) |
| $25,000 to $49,999 | 9 (100.0%) | 0 (0.0%) |
| $50,000 to $74,999 | 0 (0.0%) | 0 (0.0%) |
| $75,000 to $99,999 | 0 (0.0%) | 0 (0.0%) |
| $100,000 and over | 63 (100.0%) | 0 (0.0%) |
Public vs Private Health Insurance Coverage by Age in Rollins
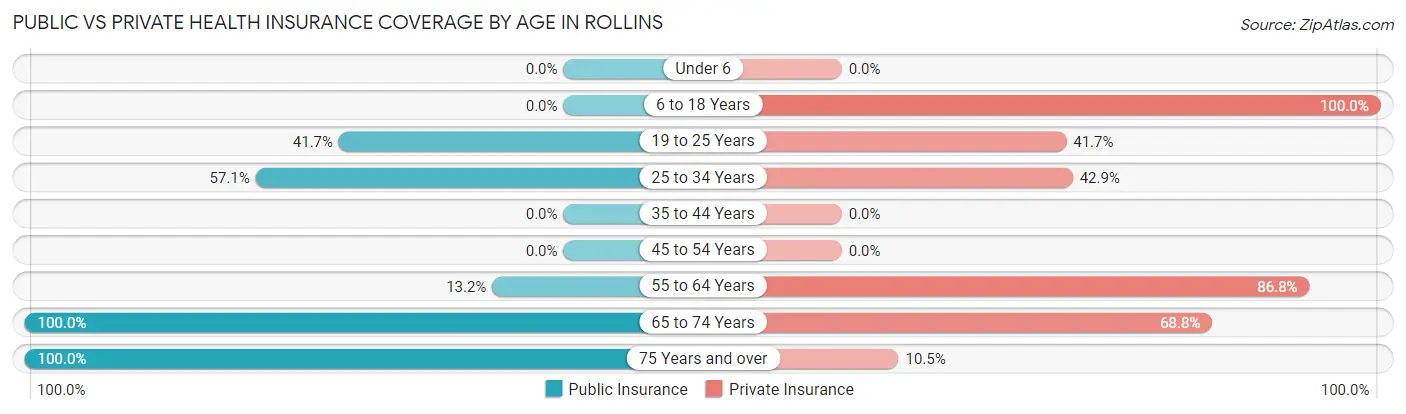
| Age Bracket | Public Insurance | Private Insurance |
| Under 6 | 0 (0.0%) | 0 (0.0%) |
| 6 to 18 Years | 0 (0.0%) | 3 (100.0%) |
| 19 to 25 Years | 5 (41.7%) | 5 (41.7%) |
| 25 to 34 Years | 4 (57.1%) | 3 (42.9%) |
| 35 to 44 Years | 0 (0.0%) | 0 (0.0%) |
| 45 to 54 Years | 0 (0.0%) | 0 (0.0%) |
| 55 to 64 Years | 7 (13.2%) | 46 (86.8%) |
| 65 to 74 Years | 32 (100.0%) | 22 (68.8%) |
| 75 Years and over | 19 (100.0%) | 2 (10.5%) |
| Total | 67 (53.2%) | 81 (64.3%) |
Disability Status by Sex by Age in Rollins
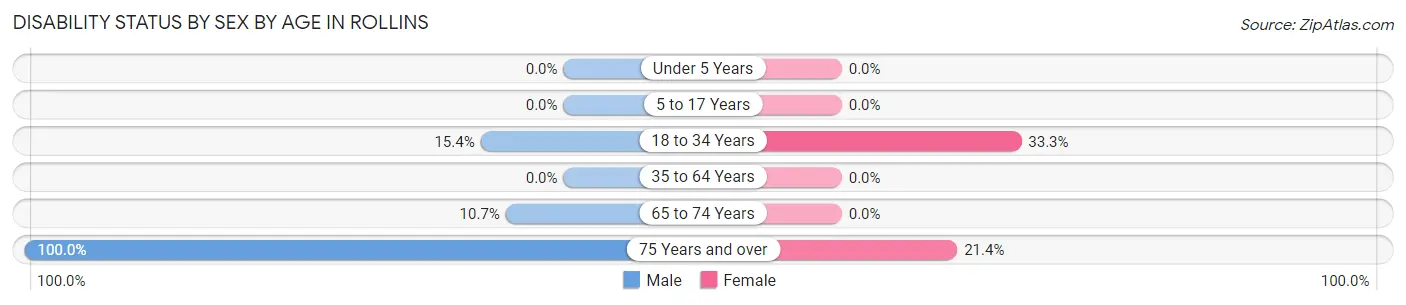
| Age Bracket | Male | Female |
| Under 5 Years | 0 (0.0%) | 0 (0.0%) |
| 5 to 17 Years | 0 (0.0%) | 0 (0.0%) |
| 18 to 34 Years | 2 (15.4%) | 2 (33.3%) |
| 35 to 64 Years | 0 (0.0%) | 0 (0.0%) |
| 65 to 74 Years | 3 (10.7%) | 0 (0.0%) |
| 75 Years and over | 5 (100.0%) | 3 (21.4%) |
Disability Class by Sex by Age in Rollins
Disability Class: Hearing Difficulty
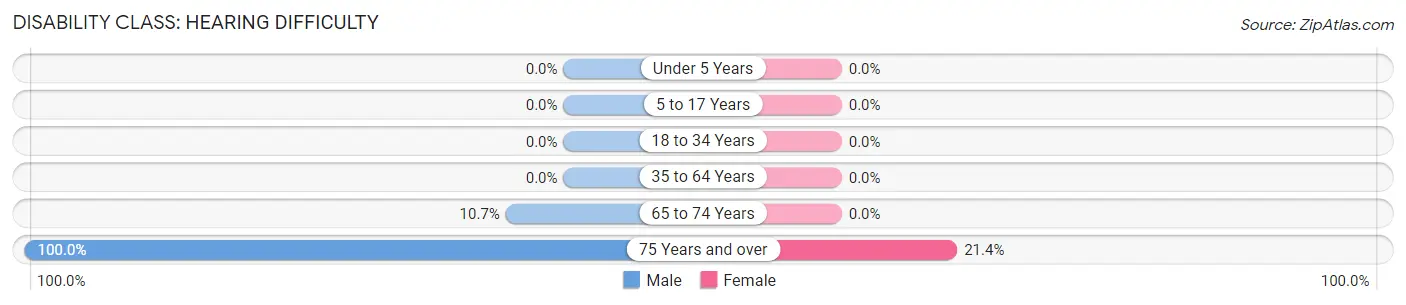
| Age Bracket | Male | Female |
| Under 5 Years | 0 (0.0%) | 0 (0.0%) |
| 5 to 17 Years | 0 (0.0%) | 0 (0.0%) |
| 18 to 34 Years | 0 (0.0%) | 0 (0.0%) |
| 35 to 64 Years | 0 (0.0%) | 0 (0.0%) |
| 65 to 74 Years | 3 (10.7%) | 0 (0.0%) |
| 75 Years and over | 5 (100.0%) | 3 (21.4%) |
Disability Class: Vision Difficulty
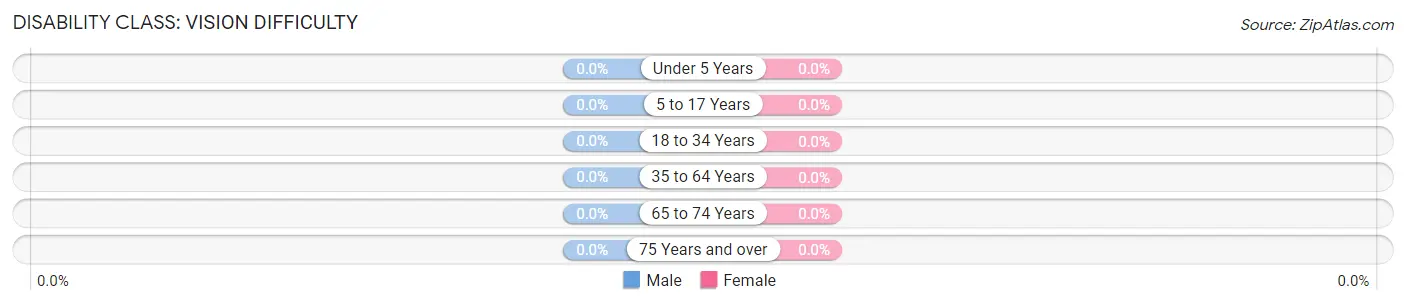
| Age Bracket | Male | Female |
| Under 5 Years | 0 (0.0%) | 0 (0.0%) |
| 5 to 17 Years | 0 (0.0%) | 0 (0.0%) |
| 18 to 34 Years | 0 (0.0%) | 0 (0.0%) |
| 35 to 64 Years | 0 (0.0%) | 0 (0.0%) |
| 65 to 74 Years | 0 (0.0%) | 0 (0.0%) |
| 75 Years and over | 0 (0.0%) | 0 (0.0%) |
Disability Class: Cognitive Difficulty
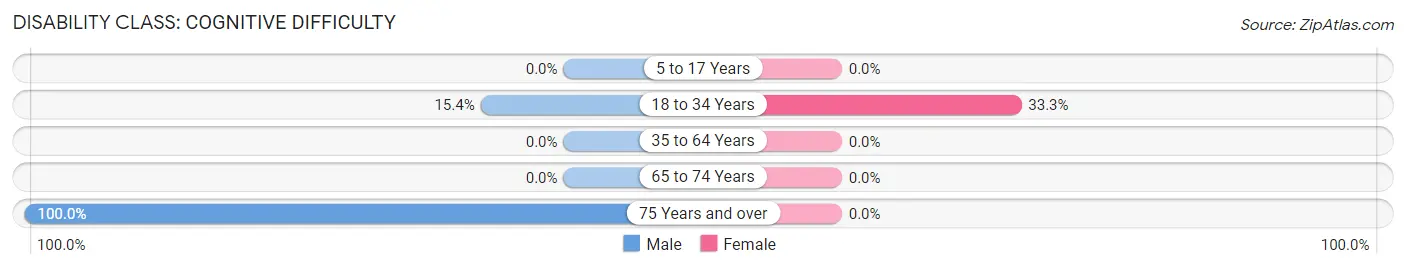
| Age Bracket | Male | Female |
| 5 to 17 Years | 0 (0.0%) | 0 (0.0%) |
| 18 to 34 Years | 2 (15.4%) | 2 (33.3%) |
| 35 to 64 Years | 0 (0.0%) | 0 (0.0%) |
| 65 to 74 Years | 0 (0.0%) | 0 (0.0%) |
| 75 Years and over | 5 (100.0%) | 0 (0.0%) |
Disability Class: Ambulatory Difficulty
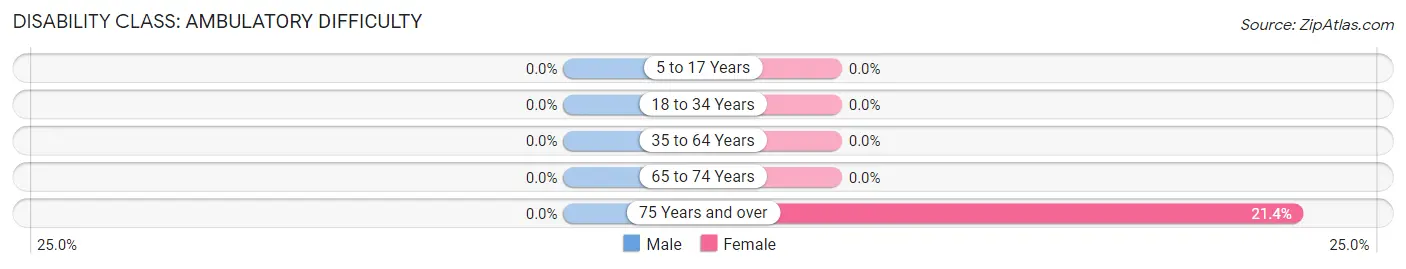
| Age Bracket | Male | Female |
| 5 to 17 Years | 0 (0.0%) | 0 (0.0%) |
| 18 to 34 Years | 0 (0.0%) | 0 (0.0%) |
| 35 to 64 Years | 0 (0.0%) | 0 (0.0%) |
| 65 to 74 Years | 0 (0.0%) | 0 (0.0%) |
| 75 Years and over | 0 (0.0%) | 3 (21.4%) |
Disability Class: Self-Care Difficulty
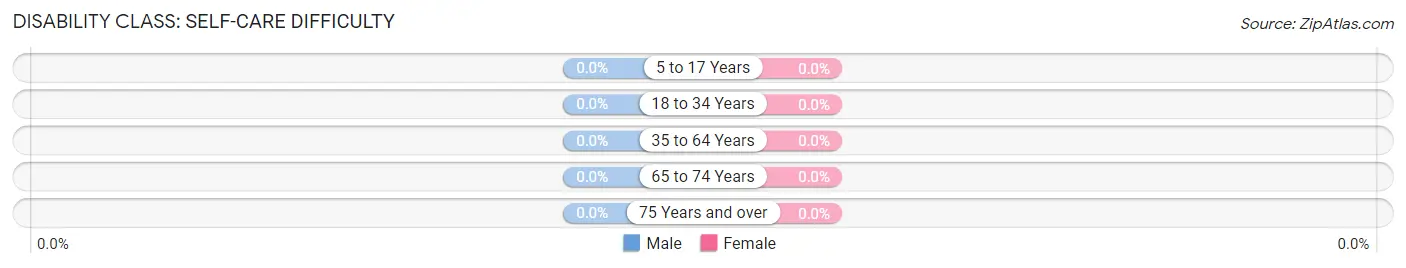
| Age Bracket | Male | Female |
| 5 to 17 Years | 0 (0.0%) | 0 (0.0%) |
| 18 to 34 Years | 0 (0.0%) | 0 (0.0%) |
| 35 to 64 Years | 0 (0.0%) | 0 (0.0%) |
| 65 to 74 Years | 0 (0.0%) | 0 (0.0%) |
| 75 Years and over | 0 (0.0%) | 0 (0.0%) |
Technology Access in Rollins
Computing Device Access in Rollins
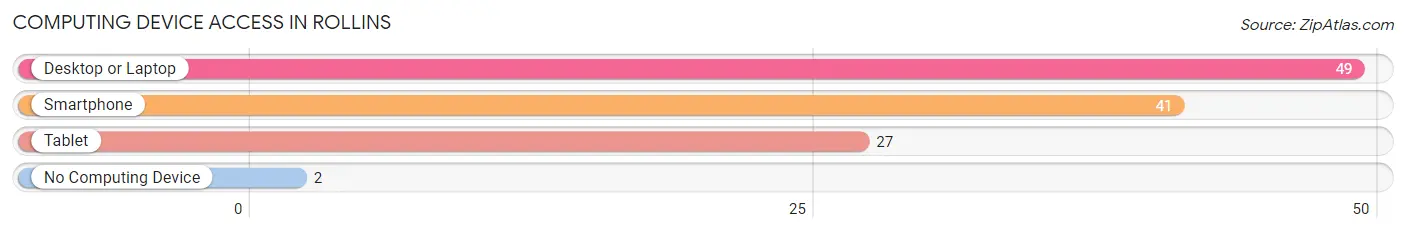
| Device Type | # Households | % Households |
| Desktop or Laptop | 49 | 90.7% |
| Smartphone | 41 | 75.9% |
| Tablet | 27 | 50.0% |
| No Computing Device | 2 | 3.7% |
| Total | 54 | 100.0% |
Internet Access in Rollins
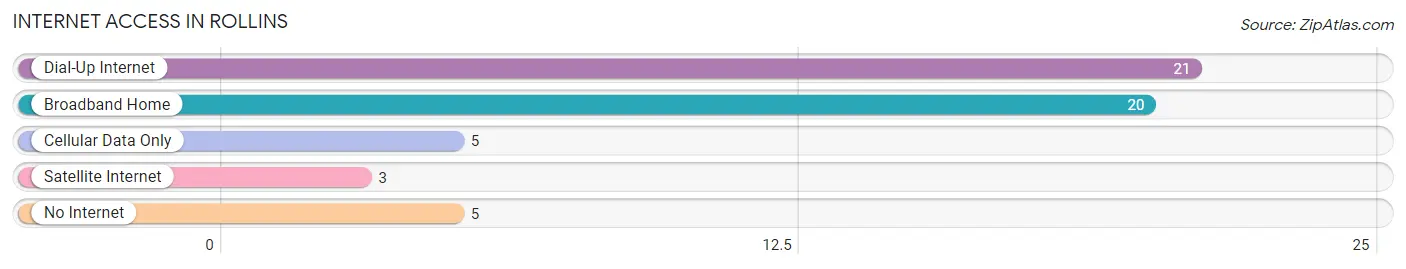
| Internet Type | # Households | % Households |
| Dial-Up Internet | 21 | 38.9% |
| Broadband Home | 20 | 37.0% |
| Cellular Data Only | 5 | 9.3% |
| Satellite Internet | 3 | 5.6% |
| No Internet | 5 | 9.3% |
| Total | 54 | 100.0% |
Rollins Summary
Rollins, Montana is a small town located in the western part of the state, near the Idaho border. It is situated in the Flathead Valley, which is part of the Rocky Mountain Front. The town is surrounded by mountains and forests, and is home to a population of just over 500 people.
History
Rollins was founded in 1883 by a group of settlers from the Midwest. The town was named after a local rancher, John Rollins, who had a large ranch in the area. The town was originally a small farming and ranching community, but it soon grew to include a variety of businesses, including a hotel, a general store, a blacksmith shop, and a saloon.
In the early 1900s, Rollins became a popular destination for tourists, who came to enjoy the area’s natural beauty and outdoor activities. The town was also home to a number of logging camps, which provided employment for many of the town’s residents.
Geography
Rollins is located in the Flathead Valley, which is part of the Rocky Mountain Front. The town is surrounded by mountains and forests, and is home to a variety of wildlife, including deer, elk, and moose. The Flathead River runs through the town, providing a source of recreation for locals and visitors alike.
The town is located at an elevation of 4,000 feet, and has a mild climate with warm summers and cold winters. The average annual temperature is around 45 degrees Fahrenheit.
Economy
The economy of Rollins is largely based on tourism and agriculture. The town is home to a number of small businesses, including restaurants, shops, and lodging. The town also has a number of farms and ranches, which produce a variety of crops and livestock.
The town is also home to a number of logging camps, which provide employment for many of the town’s residents. The logging industry is an important part of the local economy, and provides a significant source of income for the town.
Demographics
As of the 2010 census, the population of Rollins was 514. The town is predominantly white, with a small percentage of Native American and Hispanic residents. The median household income is around $35,000, and the median age is 44.
Conclusion
Rollins, Montana is a small town located in the western part of the state, near the Idaho border. It is situated in the Flathead Valley, which is part of the Rocky Mountain Front. The town is surrounded by mountains and forests, and is home to a population of just over 500 people. The economy of Rollins is largely based on tourism and agriculture, and the town is home to a number of small businesses, farms, and ranches. The town is predominantly white, with a small percentage of Native American and Hispanic residents. Rollins is a popular destination for tourists, who come to enjoy the area’s natural beauty and outdoor activities.
Common Questions
What is Per Capita Income in Rollins?
Per Capita income in Rollins is $78,521.
What is the Median Family Income in Rollins?
Median Family Income in Rollins is $175,486.
What is Inequality or Gini Index in Rollins?
Inequality or Gini Index in Rollins is 0.53.
What is the Total Population of Rollins?
Total Population of Rollins is 126.
What is the Total Male Population of Rollins?
Total Male Population of Rollins is 65.
What is the Total Female Population of Rollins?
Total Female Population of Rollins is 61.
What is the Ratio of Males per 100 Females in Rollins?
There are 106.56 Males per 100 Females in Rollins.
What is the Ratio of Females per 100 Males in Rollins?
There are 93.85 Females per 100 Males in Rollins.
What is the Median Population Age in Rollins?
Median Population Age in Rollins is 62.8 Years.
What is the Average Family Size in Rollins
Average Family Size in Rollins is 2.2 People.
What is the Average Household Size in Rollins
Average Household Size in Rollins is 1.9 People.
How Large is the Labor Force in Rollins?
There are 80 People in the Labor Forcein in Rollins.
What is the Percentage of People in the Labor Force in Rollins?
63.5% of People are in the Labor Force in Rollins.
What is the Unemployment Rate in Rollins?
Unemployment Rate in Rollins is 5.0%.