Junction City, LA Map & Demographics
Junction City Map
Junction City Overview
$15,469
PER CAPITA INCOME
$30,714
AVG FAMILY INCOME
73.1%
WAGE / INCOME GAP [ % ]
26.9¢/ $1
WAGE / INCOME GAP [ $ ]
0.49
INEQUALITY / GINI INDEX
556
TOTAL POPULATION
239
MALE POPULATION
317
FEMALE POPULATION
75.39
MALES / 100 FEMALES
132.64
FEMALES / 100 MALES
36.6
MEDIAN AGE
4.2
AVG FAMILY SIZE
2.3
AVG HOUSEHOLD SIZE
140
LABOR FORCE [ PEOPLE ]
37.0%
PERCENT IN LABOR FORCE
Junction City Area Codes
Income in Junction City
Income Overview in Junction City
| Characteristic | Number | Measure |
| Per Capita Income | 556 | $15,469 |
| Median Family Income | 94 | $30,714 |
| Mean Family Income | 94 | $41,919 |
| Median Household Income | 244 | $0 |
| Mean Household Income | 244 | $34,479 |
| Income Deficit | 94 | $0 |
| Wage / Income Gap (%) | 556 | 73.06% |
| Wage / Income Gap ($) | 556 | 26.94¢ per $1 |
| Gini / Inequality Index | 556 | 0.49 |
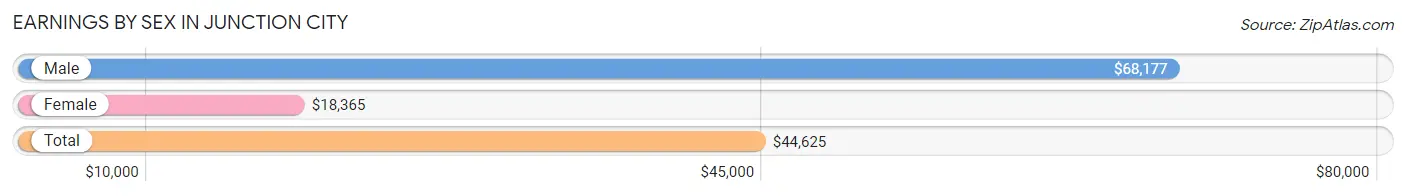
Earnings by Sex in Junction City
Average Earnings in Junction City are $44,625, $68,177 for men and $18,365 for women, a difference of 73.1%.
| Sex | Number | Average Earnings |
| Male | 80 (55.9%) | $68,177 |
| Female | 63 (44.1%) | $18,365 |
| Total | 143 (100.0%) | $44,625 |
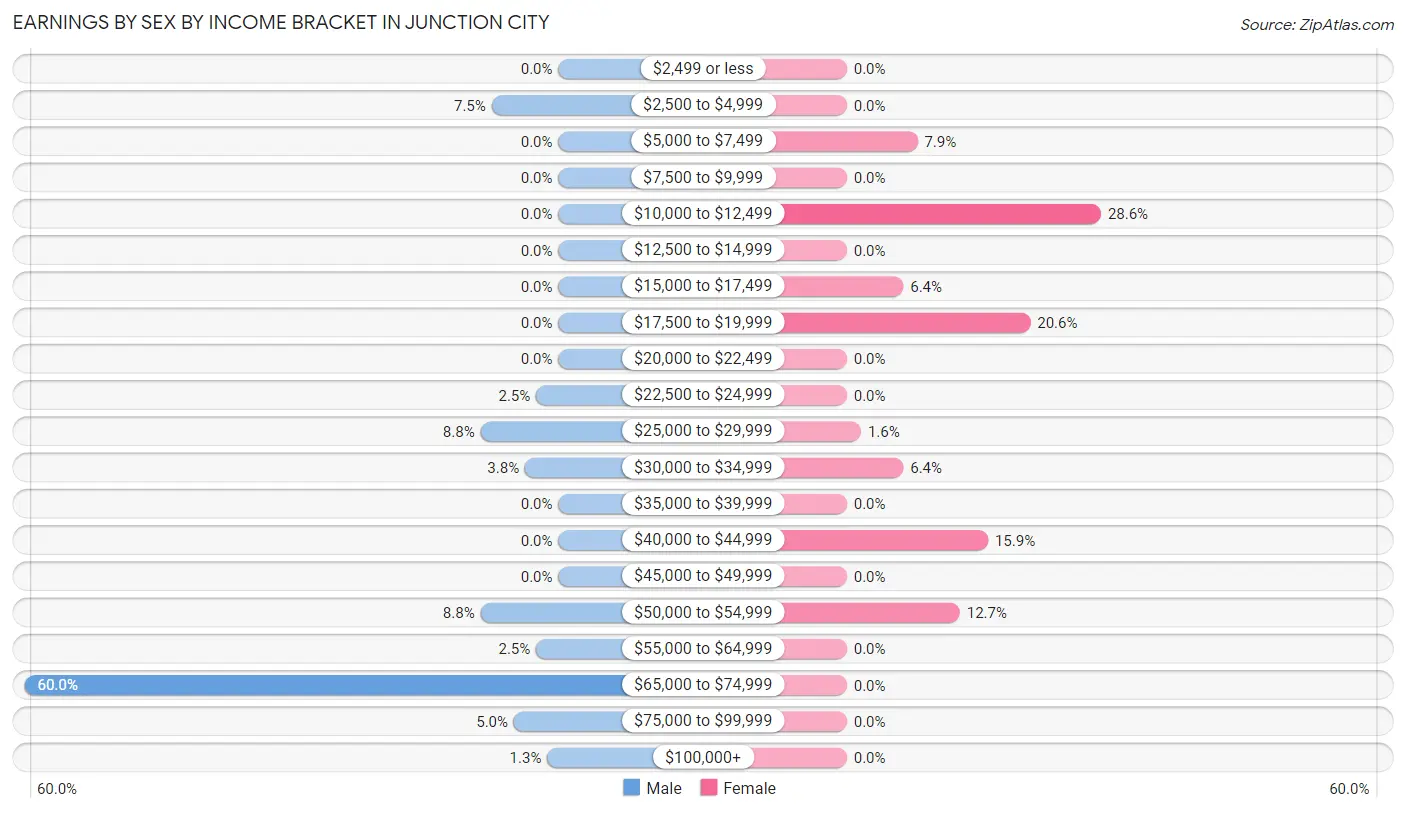
Earnings by Sex by Income Bracket in Junction City
The most common earnings brackets in Junction City are $65,000 to $74,999 for men (48 | 60.0%) and $10,000 to $12,499 for women (18 | 28.6%).
| Income | Male | Female |
| $2,499 or less | 0 (0.0%) | 0 (0.0%) |
| $2,500 to $4,999 | 6 (7.5%) | 0 (0.0%) |
| $5,000 to $7,499 | 0 (0.0%) | 5 (7.9%) |
| $7,500 to $9,999 | 0 (0.0%) | 0 (0.0%) |
| $10,000 to $12,499 | 0 (0.0%) | 18 (28.6%) |
| $12,500 to $14,999 | 0 (0.0%) | 0 (0.0%) |
| $15,000 to $17,499 | 0 (0.0%) | 4 (6.4%) |
| $17,500 to $19,999 | 0 (0.0%) | 13 (20.6%) |
| $20,000 to $22,499 | 0 (0.0%) | 0 (0.0%) |
| $22,500 to $24,999 | 2 (2.5%) | 0 (0.0%) |
| $25,000 to $29,999 | 7 (8.7%) | 1 (1.6%) |
| $30,000 to $34,999 | 3 (3.7%) | 4 (6.4%) |
| $35,000 to $39,999 | 0 (0.0%) | 0 (0.0%) |
| $40,000 to $44,999 | 0 (0.0%) | 10 (15.9%) |
| $45,000 to $49,999 | 0 (0.0%) | 0 (0.0%) |
| $50,000 to $54,999 | 7 (8.7%) | 8 (12.7%) |
| $55,000 to $64,999 | 2 (2.5%) | 0 (0.0%) |
| $65,000 to $74,999 | 48 (60.0%) | 0 (0.0%) |
| $75,000 to $99,999 | 4 (5.0%) | 0 (0.0%) |
| $100,000+ | 1 (1.3%) | 0 (0.0%) |
| Total | 80 (100.0%) | 63 (100.0%) |
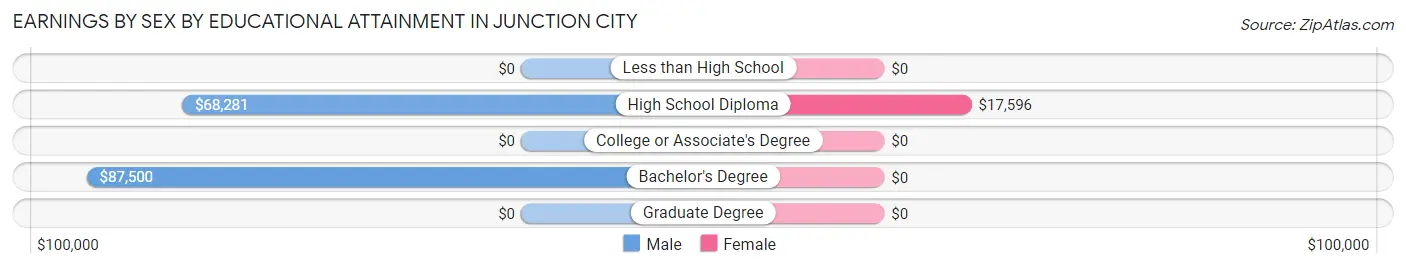
Earnings by Sex by Educational Attainment in Junction City
Average earnings in Junction City are $68,281 for men and $18,269 for women, a difference of 73.2%. Men with an educational attainment of bachelor's degree enjoy the highest average annual earnings of $87,500, while those with high school diploma education earn the least with $68,281. Women with an educational attainment of high school diploma earn the most with the average annual earnings of $17,596, while those with high school diploma education have the smallest earnings of $17,596.
| Educational Attainment | Male Income | Female Income |
| Less than High School | - | - |
| High School Diploma | $68,281 | $17,596 |
| College or Associate's Degree | - | - |
| Bachelor's Degree | $87,500 | $0 |
| Graduate Degree | - | - |
| Total | $68,281 | $18,269 |
Family Income in Junction City
Family Income Brackets in Junction City
According to the Junction City family income data, there are 20 families falling into the $25,000 to $34,999 income range, which is the most common income bracket and makes up 21.3% of all families.
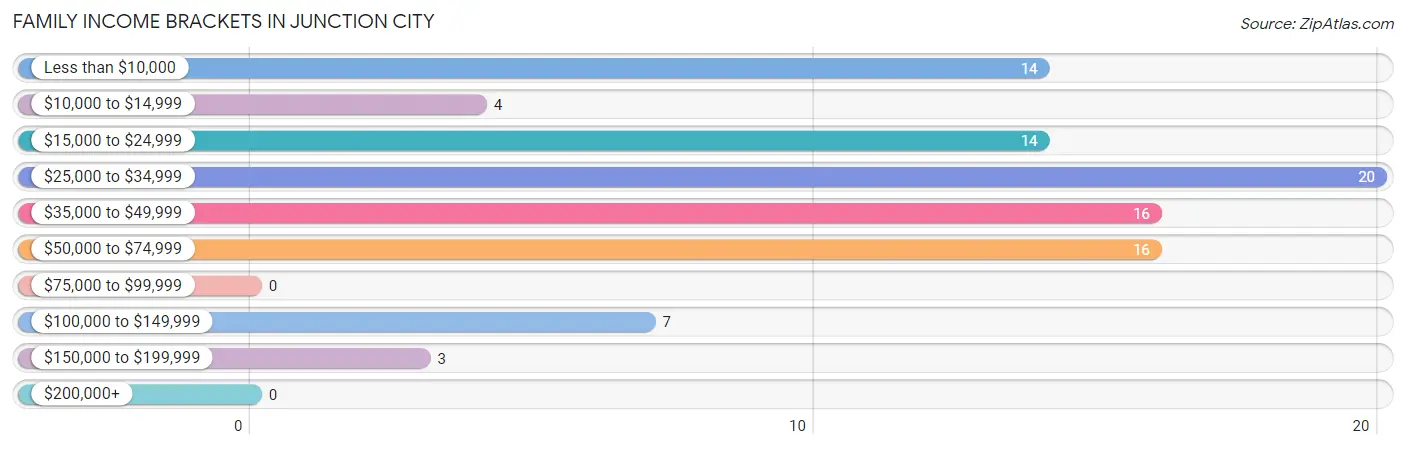
| Income Bracket | # Families | % Families |
| Less than $10,000 | 14 | 14.9% |
| $10,000 to $14,999 | 4 | 4.3% |
| $15,000 to $24,999 | 14 | 14.9% |
| $25,000 to $34,999 | 20 | 21.3% |
| $35,000 to $49,999 | 16 | 17.0% |
| $50,000 to $74,999 | 16 | 17.0% |
| $75,000 to $99,999 | 0 | 0.0% |
| $100,000 to $149,999 | 7 | 7.4% |
| $150,000 to $199,999 | 3 | 3.2% |
| $200,000+ | 0 | 0.0% |
Family Income by Famaliy Size in Junction City
3-person families (22 | 23.4%) account for the highest median family income in Junction City with $40,625 per family, while 2-person families (38 | 40.4%) have the highest median income of $20,250 per family member.
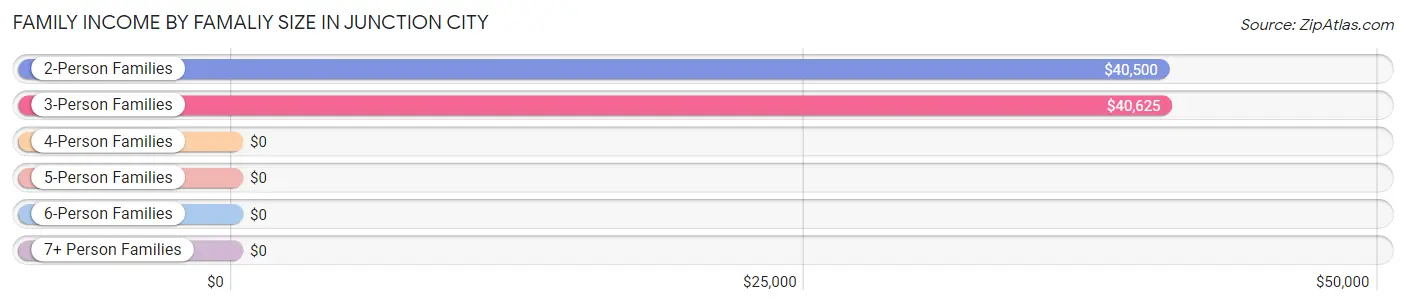
| Income Bracket | # Families | Median Income |
| 2-Person Families | 38 (40.4%) | $40,500 |
| 3-Person Families | 22 (23.4%) | $40,625 |
| 4-Person Families | 23 (24.5%) | $0 |
| 5-Person Families | 11 (11.7%) | $0 |
| 6-Person Families | 0 (0.0%) | $0 |
| 7+ Person Families | 0 (0.0%) | $0 |
| Total | 94 (100.0%) | $30,714 |
Family Income by Number of Earners in Junction City
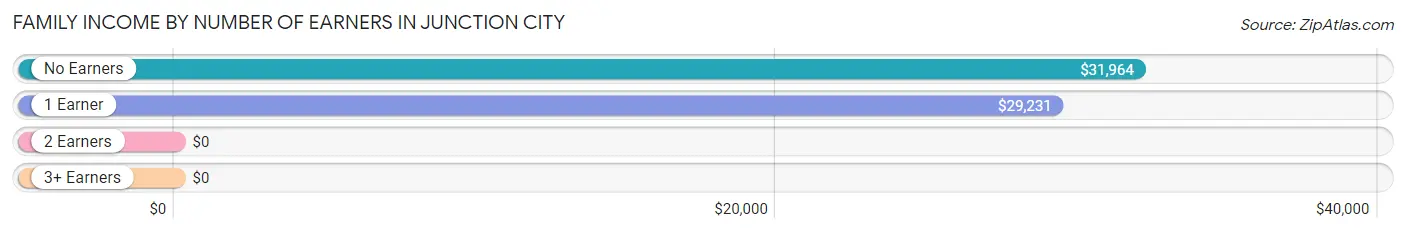
| Number of Earners | # Families | Median Income |
| No Earners | 33 (35.1%) | $31,964 |
| 1 Earner | 48 (51.1%) | $29,231 |
| 2 Earners | 11 (11.7%) | $0 |
| 3+ Earners | 2 (2.1%) | $0 |
| Total | 94 (100.0%) | $30,714 |
Household Income in Junction City
Household Income Brackets in Junction City
With 92 households falling in the category, the less than $10,000 income range is the most frequent in Junction City, accounting for 37.7% of all households.
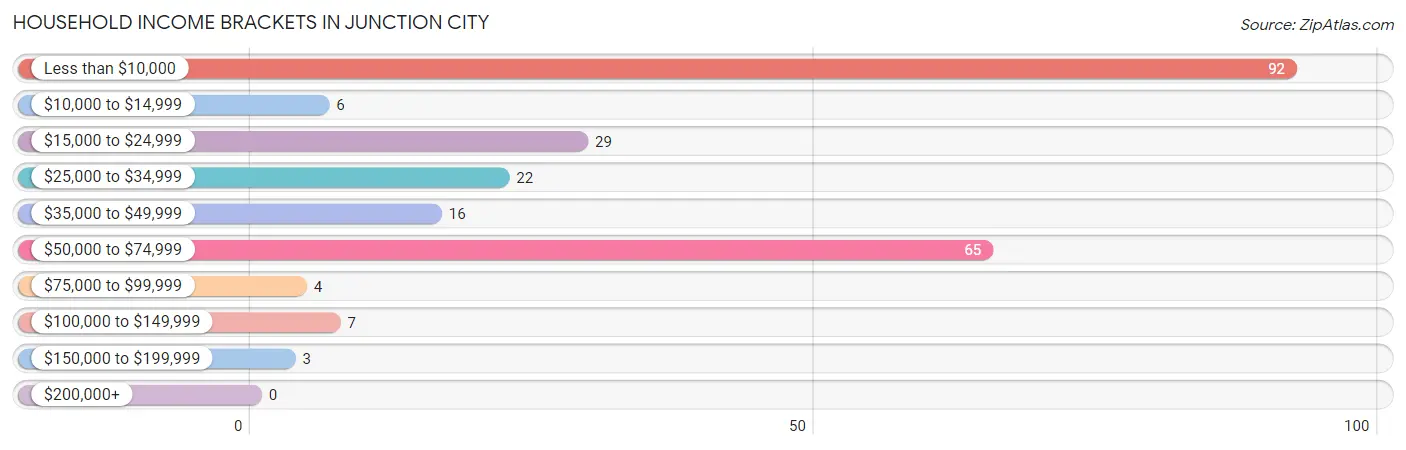
| Income Bracket | # Households | % Households |
| Less than $10,000 | 92 | 37.7% |
| $10,000 to $14,999 | 6 | 2.5% |
| $15,000 to $24,999 | 29 | 11.9% |
| $25,000 to $34,999 | 22 | 9.0% |
| $35,000 to $49,999 | 16 | 6.6% |
| $50,000 to $74,999 | 65 | 26.6% |
| $75,000 to $99,999 | 4 | 1.6% |
| $100,000 to $149,999 | 7 | 2.9% |
| $150,000 to $199,999 | 3 | 1.2% |
| $200,000+ | 0 | 0.0% |
Household Income by Householder Age in Junction City
The median household income in Junction City is $0, with the highest median household income of $54,766 found in the 25 to 44 years age bracket for the primary householder. A total of 105 households (43.0%) fall into this category. Meanwhile, the 15 to 24 years age bracket for the primary householder has the lowest median household income of $0, with 1 households (0.4%) in this group.
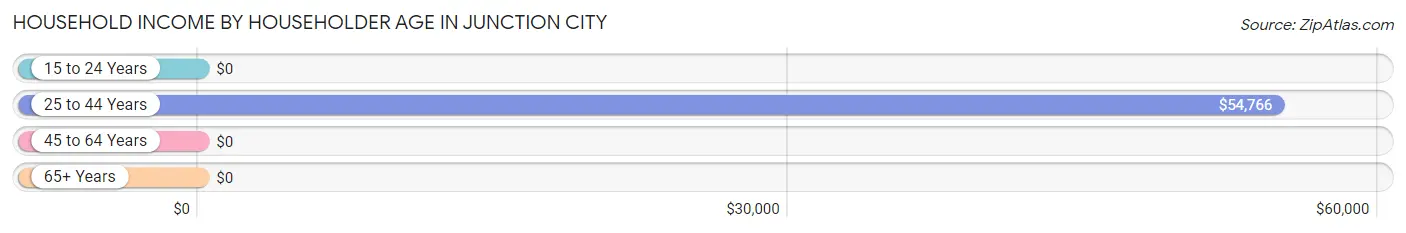
| Income Bracket | # Households | Median Income |
| 15 to 24 Years | 1 (0.4%) | $0 |
| 25 to 44 Years | 105 (43.0%) | $54,766 |
| 45 to 64 Years | 45 (18.4%) | $0 |
| 65+ Years | 93 (38.1%) | $0 |
| Total | 244 (100.0%) | $0 |
Poverty in Junction City
Income Below Poverty by Sex and Age in Junction City
With 39.8% poverty level for males and 62.8% for females among the residents of Junction City, 6 to 11 year old males and 12 to 14 year old females are the most vulnerable to poverty, with 47 males (100.0%) and 28 females (100.0%) in their respective age groups living below the poverty level.
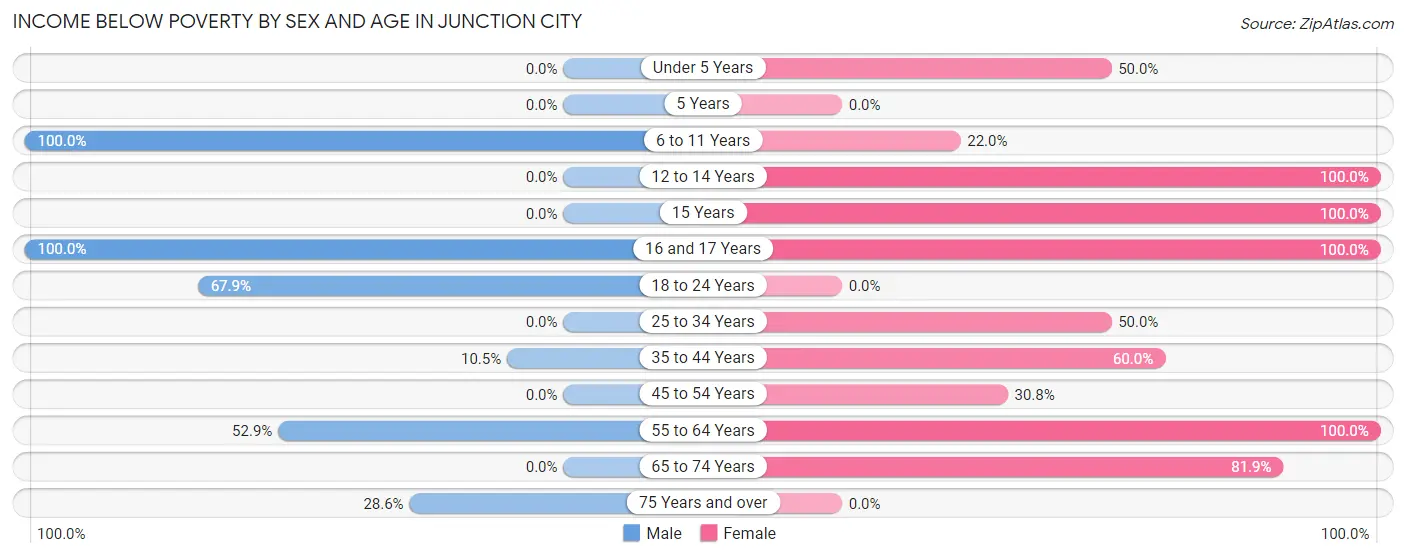
| Age Bracket | Male | Female |
| Under 5 Years | 0 (0.0%) | 4 (50.0%) |
| 5 Years | 0 (0.0%) | 0 (0.0%) |
| 6 to 11 Years | 47 (100.0%) | 11 (22.0%) |
| 12 to 14 Years | 0 (0.0%) | 28 (100.0%) |
| 15 Years | 0 (0.0%) | 12 (100.0%) |
| 16 and 17 Years | 7 (100.0%) | 12 (100.0%) |
| 18 to 24 Years | 19 (67.9%) | 0 (0.0%) |
| 25 to 34 Years | 0 (0.0%) | 11 (50.0%) |
| 35 to 44 Years | 7 (10.4%) | 24 (60.0%) |
| 45 to 54 Years | 0 (0.0%) | 4 (30.8%) |
| 55 to 64 Years | 9 (52.9%) | 34 (100.0%) |
| 65 to 74 Years | 0 (0.0%) | 59 (81.9%) |
| 75 Years and over | 6 (28.6%) | 0 (0.0%) |
| Total | 95 (39.8%) | 199 (62.8%) |
Income Above Poverty by Sex and Age in Junction City
According to the poverty statistics in Junction City, males aged under 5 years and females aged 18 to 24 years are the age groups that are most secure financially, with 100.0% of males and 100.0% of females in these age groups living above the poverty line.
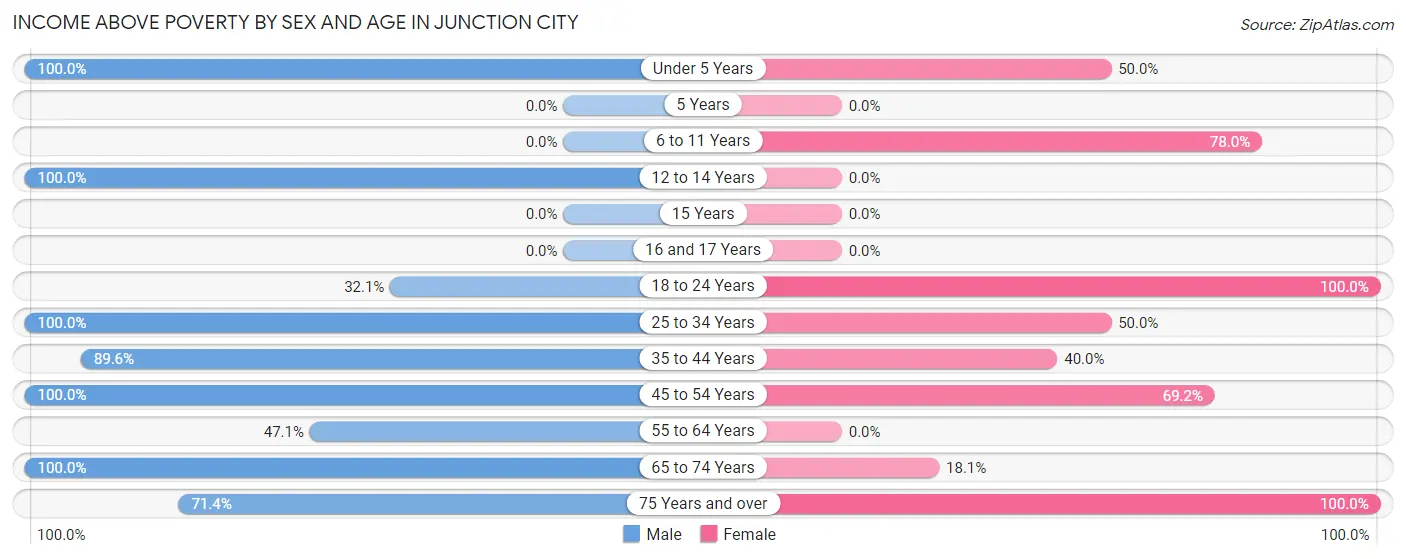
| Age Bracket | Male | Female |
| Under 5 Years | 9 (100.0%) | 4 (50.0%) |
| 5 Years | 0 (0.0%) | 0 (0.0%) |
| 6 to 11 Years | 0 (0.0%) | 39 (78.0%) |
| 12 to 14 Years | 24 (100.0%) | 0 (0.0%) |
| 15 Years | 0 (0.0%) | 0 (0.0%) |
| 16 and 17 Years | 0 (0.0%) | 0 (0.0%) |
| 18 to 24 Years | 9 (32.1%) | 11 (100.0%) |
| 25 to 34 Years | 2 (100.0%) | 11 (50.0%) |
| 35 to 44 Years | 60 (89.5%) | 16 (40.0%) |
| 45 to 54 Years | 4 (100.0%) | 9 (69.2%) |
| 55 to 64 Years | 8 (47.1%) | 0 (0.0%) |
| 65 to 74 Years | 13 (100.0%) | 13 (18.1%) |
| 75 Years and over | 15 (71.4%) | 15 (100.0%) |
| Total | 144 (60.3%) | 118 (37.2%) |
Income Below Poverty Among Married-Couple Families in Junction City
The poverty statistics for married-couple families in Junction City show that 39.3% or 24 of the total 61 families live below the poverty line. Families with 1 or 2 children have the highest poverty rate of 57.9%, comprising of 11 families. On the other hand, families with no children have the lowest poverty rate of 30.9%, which includes 13 families.
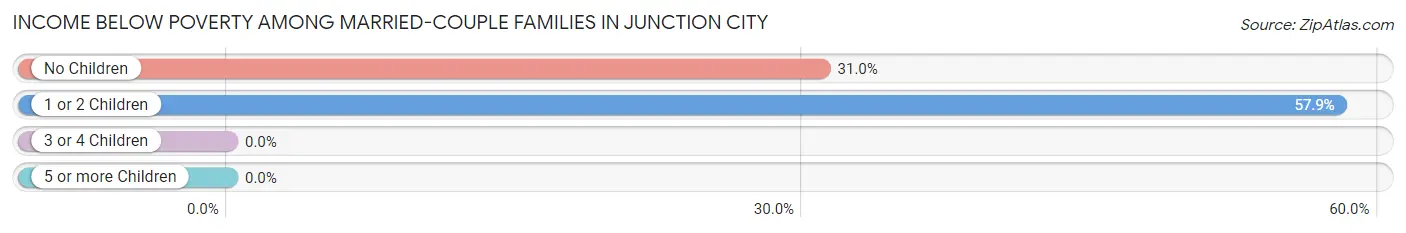
| Children | Above Poverty | Below Poverty |
| No Children | 29 (69.1%) | 13 (30.9%) |
| 1 or 2 Children | 8 (42.1%) | 11 (57.9%) |
| 3 or 4 Children | 0 (0.0%) | 0 (0.0%) |
| 5 or more Children | 0 (0.0%) | 0 (0.0%) |
| Total | 37 (60.7%) | 24 (39.3%) |
Income Below Poverty Among Single-Parent Households in Junction City
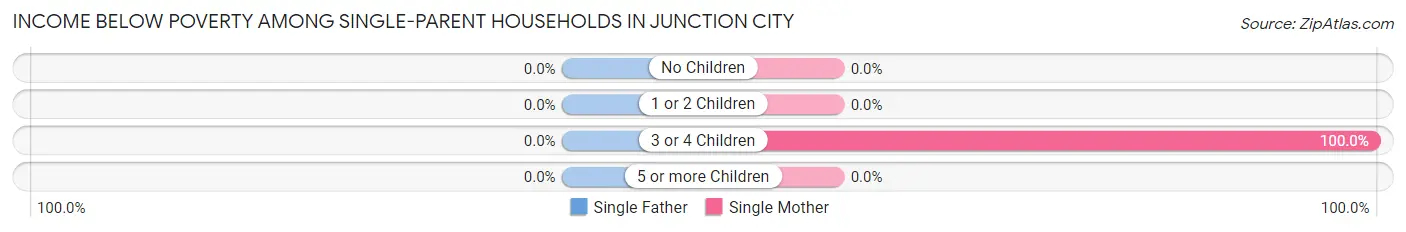
| Children | Single Father | Single Mother |
| No Children | 0 (0.0%) | 0 (0.0%) |
| 1 or 2 Children | 0 (0.0%) | 0 (0.0%) |
| 3 or 4 Children | 0 (0.0%) | 13 (100.0%) |
| 5 or more Children | 0 (0.0%) | 0 (0.0%) |
| Total | 0 (0.0%) | 13 (44.8%) |
Income Below Poverty Among Married-Couple vs Single-Parent Households in Junction City
The poverty data for Junction City shows that 24 of the married-couple family households (39.3%) and 13 of the single-parent households (39.4%) are living below the poverty level. Within the married-couple family households, those with 1 or 2 children have the highest poverty rate, with 11 households (57.9%) falling below the poverty line. Among the single-parent households, those with 3 or 4 children have the highest poverty rate, with 13 household (100.0%) living below poverty.
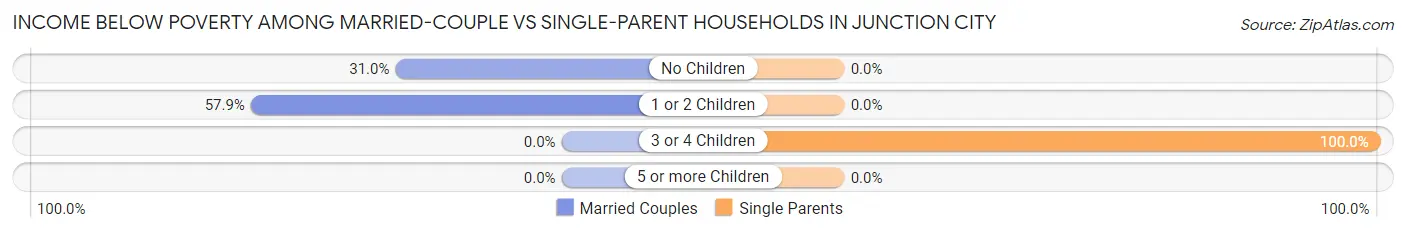
| Children | Married-Couple Families | Single-Parent Households |
| No Children | 13 (30.9%) | 0 (0.0%) |
| 1 or 2 Children | 11 (57.9%) | 0 (0.0%) |
| 3 or 4 Children | 0 (0.0%) | 13 (100.0%) |
| 5 or more Children | 0 (0.0%) | 0 (0.0%) |
| Total | 24 (39.3%) | 13 (39.4%) |
Race in Junction City
The most populous races in Junction City are Black / African American (379 | 68.2%), White / Caucasian (171 | 30.8%), and Hispanic or Latino (36 | 6.5%).
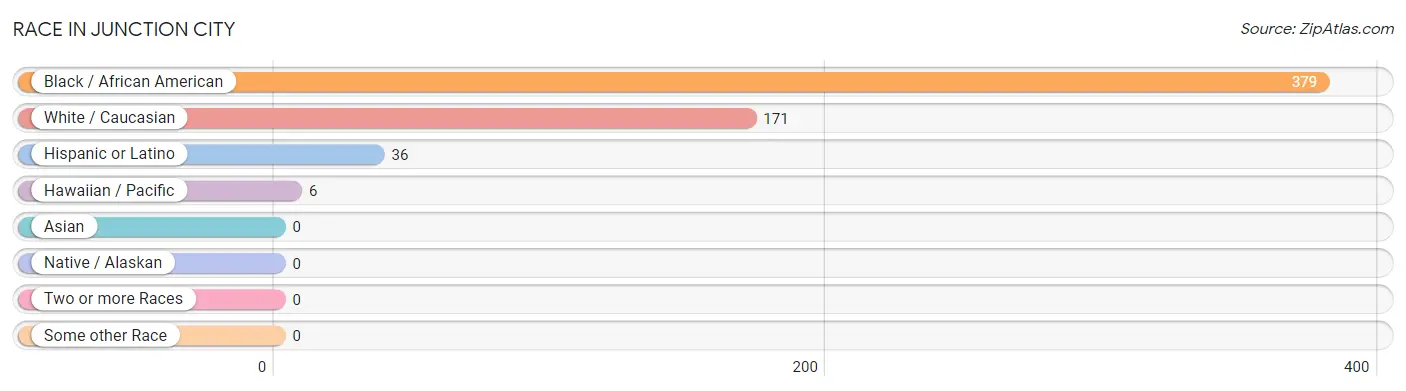
| Race | # Population | % Population |
| Asian | 0 | 0.0% |
| Black / African American | 379 | 68.2% |
| Hawaiian / Pacific | 6 | 1.1% |
| Hispanic or Latino | 36 | 6.5% |
| Native / Alaskan | 0 | 0.0% |
| White / Caucasian | 171 | 30.8% |
| Two or more Races | 0 | 0.0% |
| Some other Race | 0 | 0.0% |
| Total | 556 | 100.0% |
Ancestry in Junction City
The most populous ancestries reported in Junction City are American (114 | 20.5%), Mexican (36 | 6.5%), English (21 | 3.8%), African (7 | 1.3%), and European (7 | 1.3%), together accounting for 33.3% of all Junction City residents.
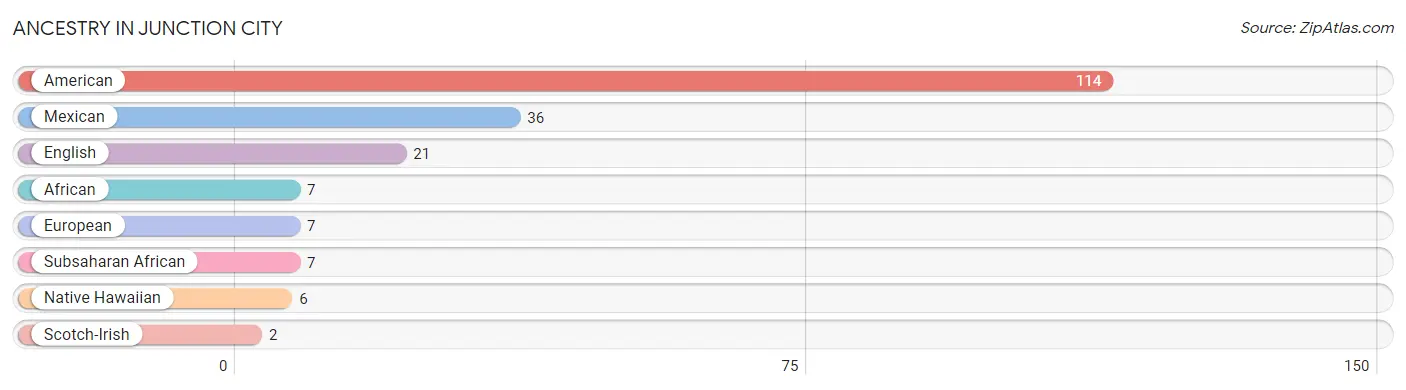
| Ancestry | # Population | % Population |
| African | 7 | 1.3% |
| American | 114 | 20.5% |
| English | 21 | 3.8% |
| European | 7 | 1.3% |
| Mexican | 36 | 6.5% |
| Native Hawaiian | 6 | 1.1% |
| Scotch-Irish | 2 | 0.4% |
| Subsaharan African | 7 | 1.3% | View All 8 Rows |
Immigrants in Junction City
The most numerous immigrant groups reported in Junction City came from Central America (12 | 2.2%), Latin America (12 | 2.2%), and Mexico (12 | 2.2%), together accounting for 6.5% of all Junction City residents.
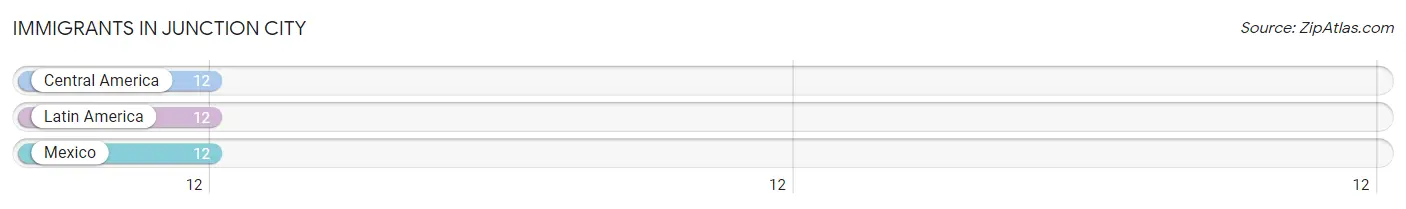
| Immigration Origin | # Population | % Population |
| Central America | 12 | 2.2% |
| Latin America | 12 | 2.2% |
| Mexico | 12 | 2.2% | View All 3 Rows |
Sex and Age in Junction City
Sex and Age in Junction City
The most populous age groups in Junction City are 35 to 39 Years (60 | 25.1%) for men and 70 to 74 Years (63 | 19.9%) for women.
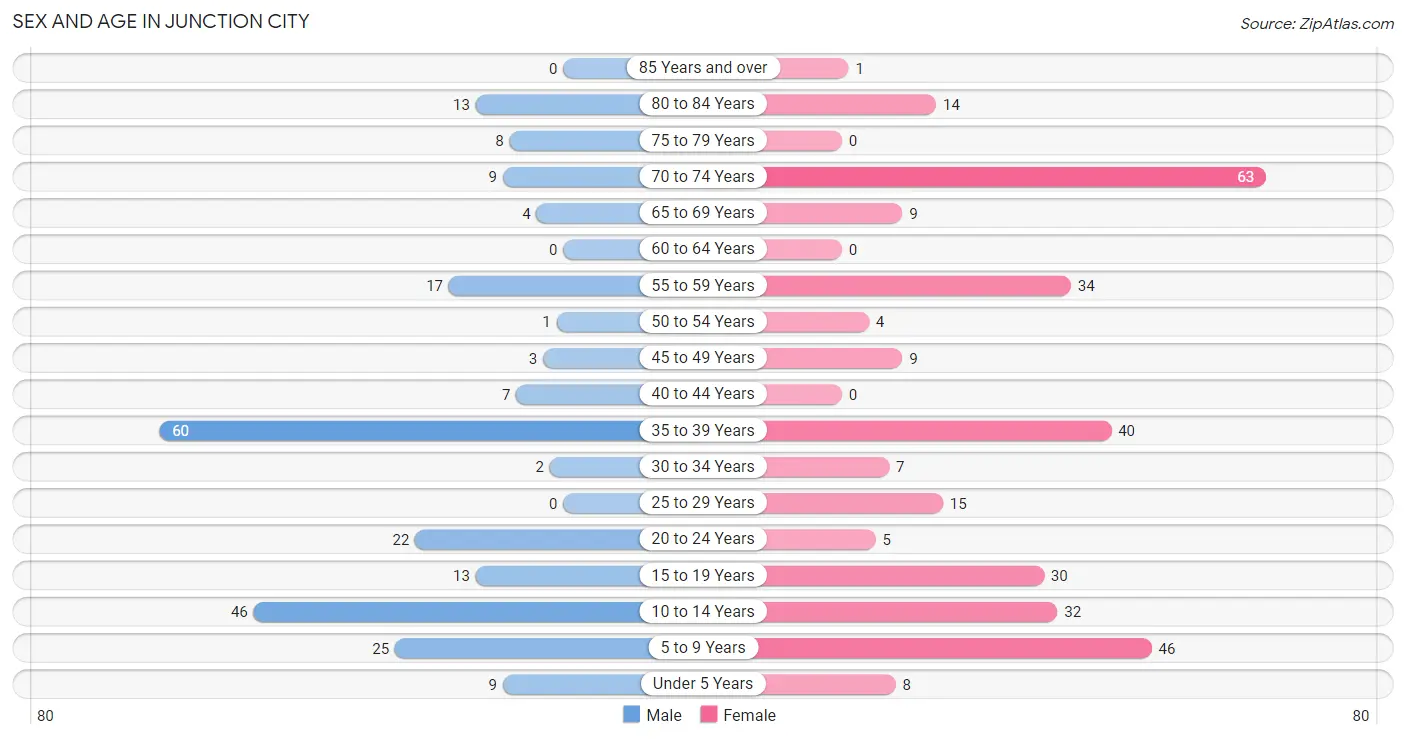
| Age Bracket | Male | Female |
| Under 5 Years | 9 (3.8%) | 8 (2.5%) |
| 5 to 9 Years | 25 (10.5%) | 46 (14.5%) |
| 10 to 14 Years | 46 (19.3%) | 32 (10.1%) |
| 15 to 19 Years | 13 (5.4%) | 30 (9.5%) |
| 20 to 24 Years | 22 (9.2%) | 5 (1.6%) |
| 25 to 29 Years | 0 (0.0%) | 15 (4.7%) |
| 30 to 34 Years | 2 (0.8%) | 7 (2.2%) |
| 35 to 39 Years | 60 (25.1%) | 40 (12.6%) |
| 40 to 44 Years | 7 (2.9%) | 0 (0.0%) |
| 45 to 49 Years | 3 (1.3%) | 9 (2.8%) |
| 50 to 54 Years | 1 (0.4%) | 4 (1.3%) |
| 55 to 59 Years | 17 (7.1%) | 34 (10.7%) |
| 60 to 64 Years | 0 (0.0%) | 0 (0.0%) |
| 65 to 69 Years | 4 (1.7%) | 9 (2.8%) |
| 70 to 74 Years | 9 (3.8%) | 63 (19.9%) |
| 75 to 79 Years | 8 (3.4%) | 0 (0.0%) |
| 80 to 84 Years | 13 (5.4%) | 14 (4.4%) |
| 85 Years and over | 0 (0.0%) | 1 (0.3%) |
| Total | 239 (100.0%) | 317 (100.0%) |
Families and Households in Junction City
Median Family Size in Junction City
The median family size in Junction City is 4.23 persons per family, with single female/mother families (29 | 30.8%) accounting for the largest median family size of 5.93 persons per family. On the other hand, married-couple families (61 | 64.9%) represent the smallest median family size with 3.48 persons per family.
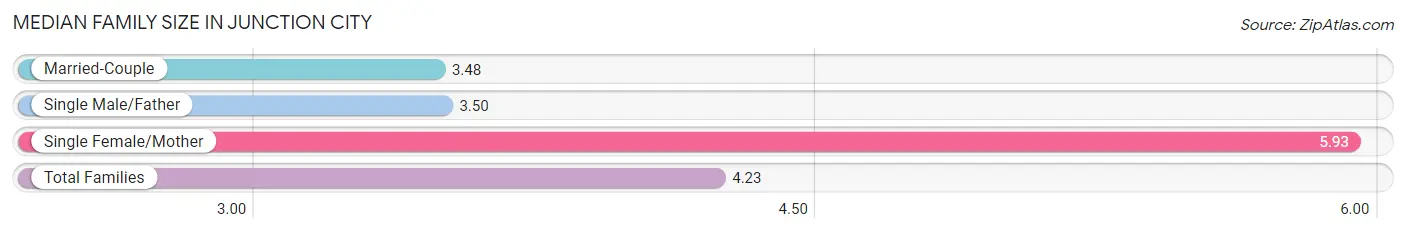
| Family Type | # Families | Family Size |
| Married-Couple | 61 (64.9%) | 3.48 |
| Single Male/Father | 4 (4.3%) | 3.50 |
| Single Female/Mother | 29 (30.8%) | 5.93 |
| Total Families | 94 (100.0%) | 4.23 |
Median Household Size in Junction City
The median household size in Junction City is 2.28 persons per household, with single female/mother households (29 | 11.9%) accounting for the largest median household size of 5.93 persons per household. non-family households (150 | 61.5%) represent the smallest median household size with 1.01 persons per household.
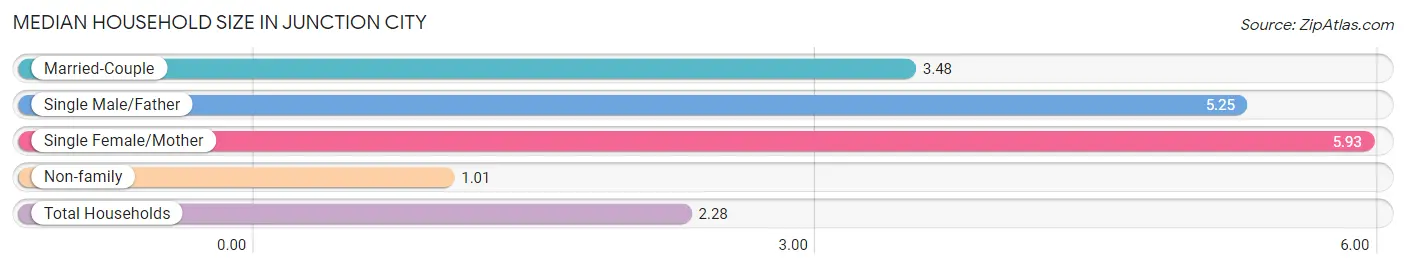
| Household Type | # Households | Household Size |
| Married-Couple | 61 (25.0%) | 3.48 |
| Single Male/Father | 4 (1.6%) | 5.25 |
| Single Female/Mother | 29 (11.9%) | 5.93 |
| Non-family | 150 (61.5%) | 1.01 |
| Total Households | 244 (100.0%) | 2.28 |
Household Size by Marriage Status in Junction City
Out of a total of 244 households in Junction City, 94 (38.5%) are family households, while 150 (61.5%) are nonfamily households. The most numerous type of family households are 2-person households, comprising 38, and the most common type of nonfamily households are 1-person households, comprising 149.
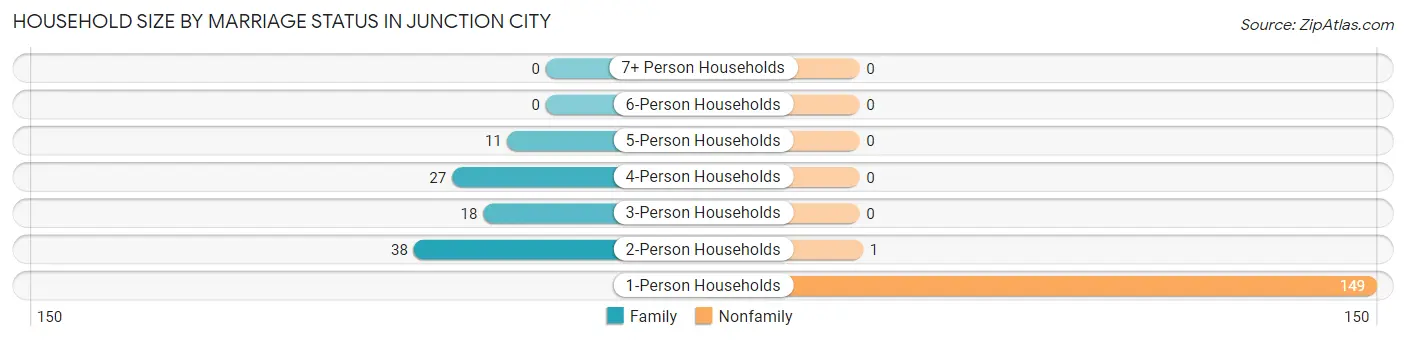
| Household Size | Family Households | Nonfamily Households |
| 1-Person Households | - | 149 (61.1%) |
| 2-Person Households | 38 (15.6%) | 1 (0.4%) |
| 3-Person Households | 18 (7.4%) | 0 (0.0%) |
| 4-Person Households | 27 (11.1%) | 0 (0.0%) |
| 5-Person Households | 11 (4.5%) | 0 (0.0%) |
| 6-Person Households | 0 (0.0%) | 0 (0.0%) |
| 7+ Person Households | 0 (0.0%) | 0 (0.0%) |
| Total | 94 (38.5%) | 150 (61.5%) |
Female Fertility in Junction City
Fertility by Age in Junction City
| Age Bracket | Women with Births | Births / 1,000 Women |
| 15 to 19 years | 0 (0.0%) | 0.0 |
| 20 to 34 years | 0 (0.0%) | 0.0 |
| 35 to 50 years | 0 (0.0%) | 0.0 |
| Total | 0 (0.0%) | 0.0 |
Fertility by Age by Marriage Status in Junction City
| Age Bracket | Married | Unmarried |
| 15 to 19 years | 0 (0.0%) | 0 (0.0%) |
| 20 to 34 years | 0 (0.0%) | 0 (0.0%) |
| 35 to 50 years | 0 (0.0%) | 0 (0.0%) |
| Total | 0 (0.0%) | 0 (0.0%) |
Fertility by Education in Junction City
| Educational Attainment | Women with Births | Births / 1,000 Women |
| Less than High School | 0 (0.0%) | 0.0 |
| High School Diploma | 0 (0.0%) | 0.0 |
| College or Associate's Degree | 0 (0.0%) | 0.0 |
| Bachelor's Degree | 0 (0.0%) | 0.0 |
| Graduate Degree | 0 (0.0%) | 0.0 |
| Total | 0 (0.0%) | 0.0 |
Fertility by Education by Marriage Status in Junction City
| Educational Attainment | Married | Unmarried |
| Less than High School | 0 (0.0%) | 0 (0.0%) |
| High School Diploma | 0 (0.0%) | 0 (0.0%) |
| College or Associate's Degree | 0 (0.0%) | 0 (0.0%) |
| Bachelor's Degree | 0 (0.0%) | 0 (0.0%) |
| Graduate Degree | 0 (0.0%) | 0 (0.0%) |
| Total | 0 (0.0%) | 0 (0.0%) |
Employment Characteristics in Junction City
Employment by Class of Employer in Junction City
Among the 140 employed individuals in Junction City, private company employees (117 | 83.6%), local government employees (11 | 7.9%), and state government employees (10 | 7.1%) make up the most common classes of employment.
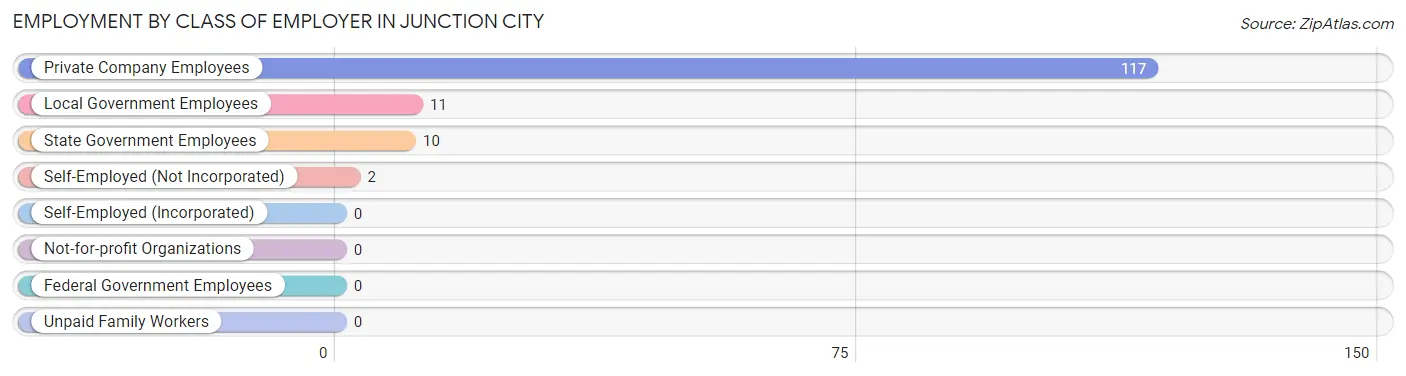
| Employer Class | # Employees | % Employees |
| Private Company Employees | 117 | 83.6% |
| Self-Employed (Incorporated) | 0 | 0.0% |
| Self-Employed (Not Incorporated) | 2 | 1.4% |
| Not-for-profit Organizations | 0 | 0.0% |
| Local Government Employees | 11 | 7.9% |
| State Government Employees | 10 | 7.1% |
| Federal Government Employees | 0 | 0.0% |
| Unpaid Family Workers | 0 | 0.0% |
| Total | 140 | 100.0% |
Employment Status by Age in Junction City
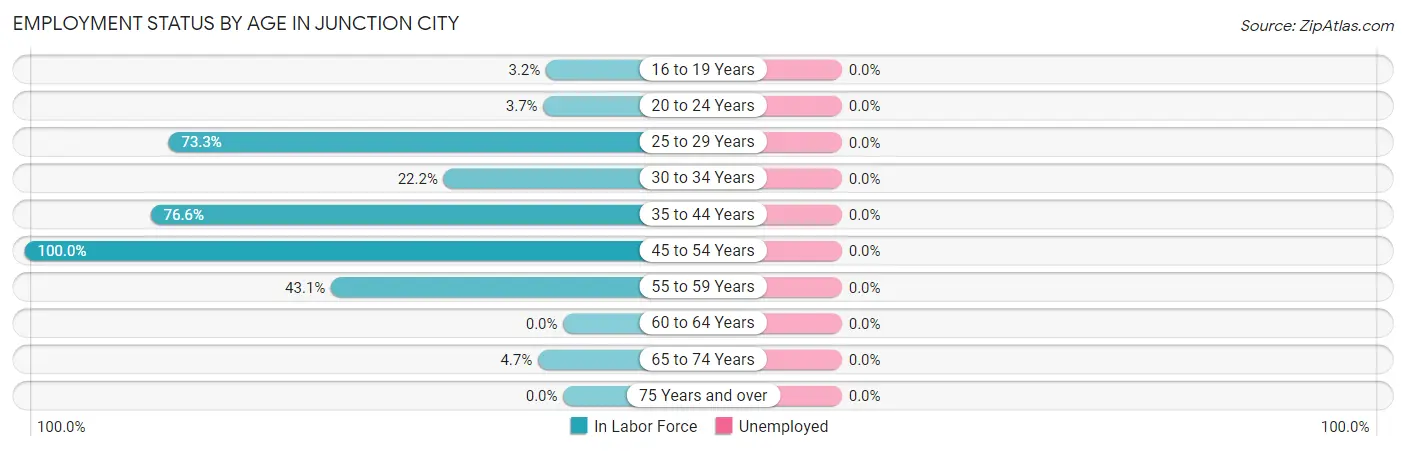
| Age Bracket | In Labor Force | Unemployed |
| 16 to 19 Years | 1 (3.2%) | 0 (0.0%) |
| 20 to 24 Years | 1 (3.7%) | 0 (0.0%) |
| 25 to 29 Years | 11 (73.3%) | 0 (0.0%) |
| 30 to 34 Years | 2 (22.2%) | 0 (0.0%) |
| 35 to 44 Years | 82 (76.6%) | 0 (0.0%) |
| 45 to 54 Years | 17 (100.0%) | 0 (0.0%) |
| 55 to 59 Years | 22 (43.1%) | 0 (0.0%) |
| 60 to 64 Years | 0 (0.0%) | 0 (0.0%) |
| 65 to 74 Years | 4 (4.7%) | 0 (0.0%) |
| 75 Years and over | 0 (0.0%) | 0 (0.0%) |
| Total | 140 (37.0%) | 0 (0.0%) |
Employment Status by Educational Attainment in Junction City
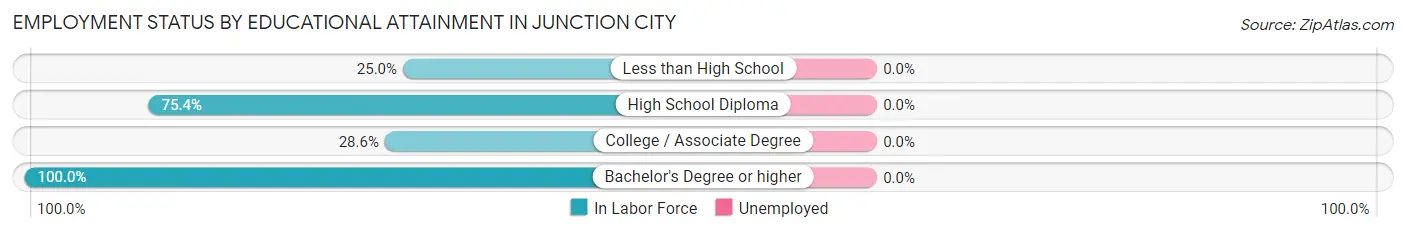
| Educational Attainment | In Labor Force | Unemployed |
| Less than High School | 5 (25.0%) | 0 (0.0%) |
| High School Diploma | 107 (75.4%) | 0 (0.0%) |
| College / Associate Degree | 6 (28.6%) | 0 (0.0%) |
| Bachelor's Degree or higher | 16 (100.0%) | 0 (0.0%) |
| Total | 134 (67.3%) | 0 (0.0%) |
Employment Occupations by Sex in Junction City
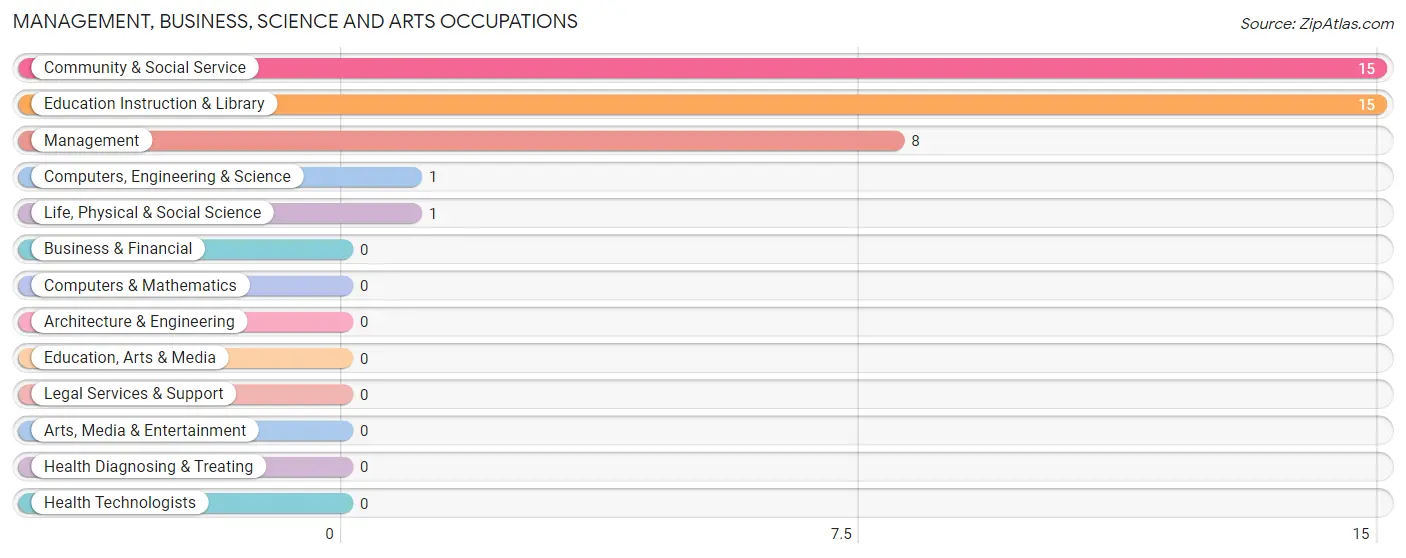
Management, Business, Science and Arts Occupations
The most common Management, Business, Science and Arts occupations in Junction City are Community & Social Service (15 | 10.7%), Education Instruction & Library (15 | 10.7%), Management (8 | 5.7%), Computers, Engineering & Science (1 | 0.7%), and Life, Physical & Social Science (1 | 0.7%).
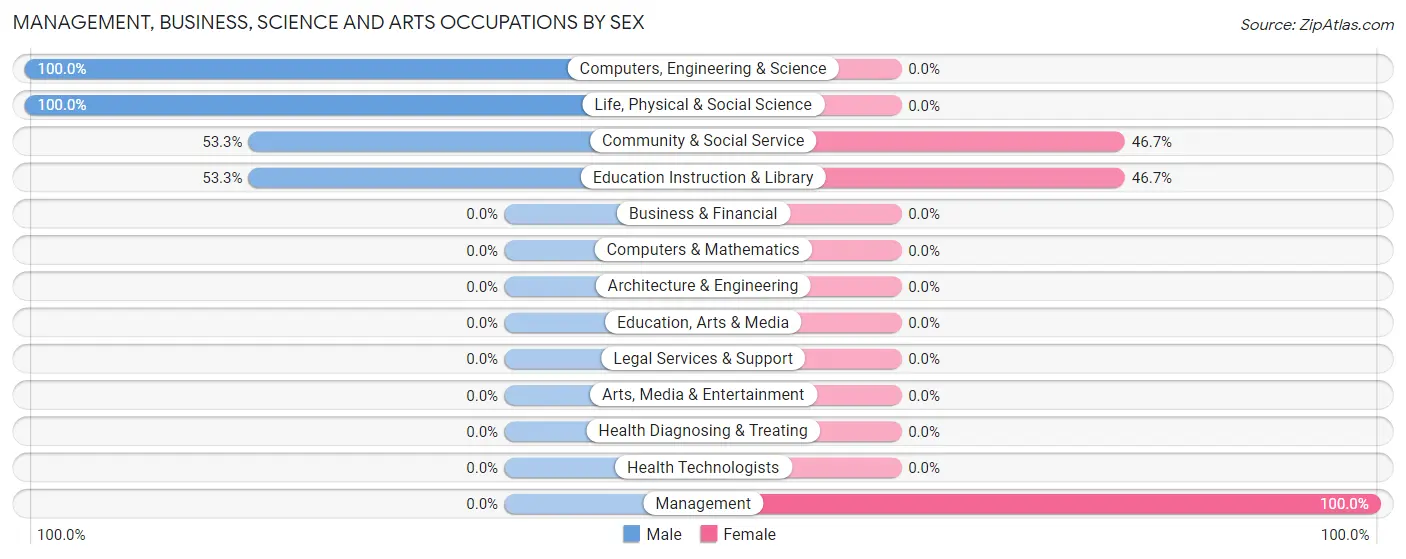
Management, Business, Science and Arts Occupations by Sex
Within the Management, Business, Science and Arts occupations in Junction City, the most male-oriented occupations are Computers, Engineering & Science (100.0%), Life, Physical & Social Science (100.0%), and Community & Social Service (53.3%), while the most female-oriented occupations are Management (100.0%), Community & Social Service (46.7%), and Education Instruction & Library (46.7%).
| Occupation | Male | Female |
| Management | 0 (0.0%) | 8 (100.0%) |
| Business & Financial | 0 (0.0%) | 0 (0.0%) |
| Computers, Engineering & Science | 1 (100.0%) | 0 (0.0%) |
| Computers & Mathematics | 0 (0.0%) | 0 (0.0%) |
| Architecture & Engineering | 0 (0.0%) | 0 (0.0%) |
| Life, Physical & Social Science | 1 (100.0%) | 0 (0.0%) |
| Community & Social Service | 8 (53.3%) | 7 (46.7%) |
| Education, Arts & Media | 0 (0.0%) | 0 (0.0%) |
| Legal Services & Support | 0 (0.0%) | 0 (0.0%) |
| Education Instruction & Library | 8 (53.3%) | 7 (46.7%) |
| Arts, Media & Entertainment | 0 (0.0%) | 0 (0.0%) |
| Health Diagnosing & Treating | 0 (0.0%) | 0 (0.0%) |
| Health Technologists | 0 (0.0%) | 0 (0.0%) |
| Total (Category) | 9 (37.5%) | 15 (62.5%) |
| Total (Overall) | 77 (55.0%) | 63 (45.0%) |
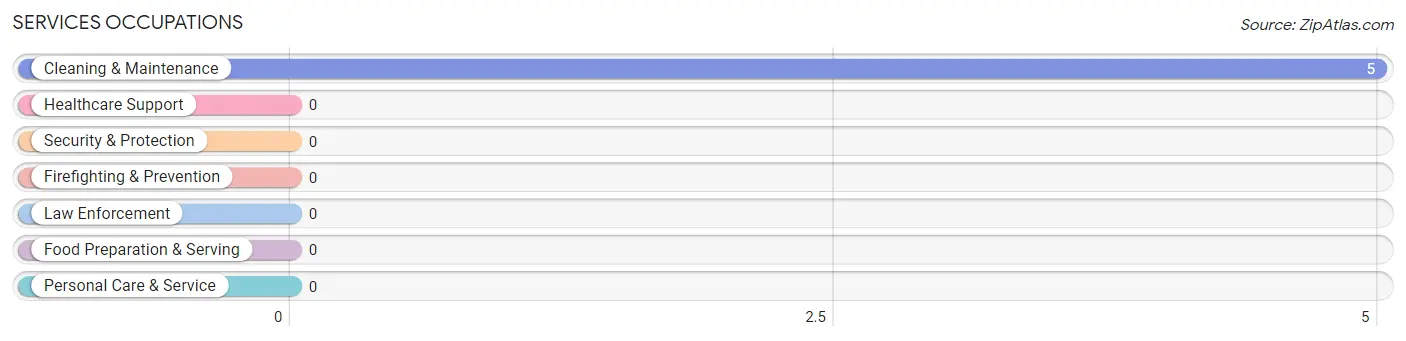
Services Occupations
The most common Services occupations in Junction City are , and Cleaning & Maintenance (5 | 3.6%).
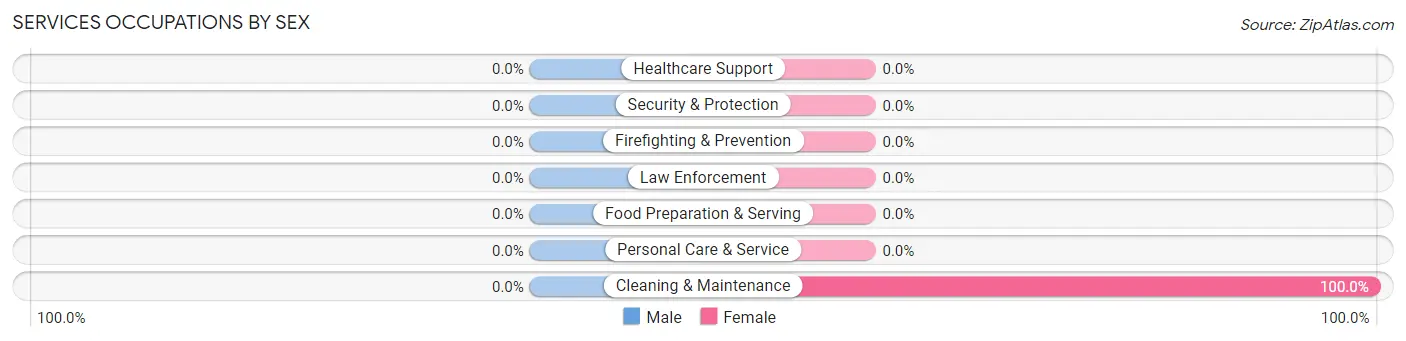
Services Occupations by Sex
| Occupation | Male | Female |
| Healthcare Support | 0 (0.0%) | 0 (0.0%) |
| Security & Protection | 0 (0.0%) | 0 (0.0%) |
| Firefighting & Prevention | 0 (0.0%) | 0 (0.0%) |
| Law Enforcement | 0 (0.0%) | 0 (0.0%) |
| Food Preparation & Serving | 0 (0.0%) | 0 (0.0%) |
| Cleaning & Maintenance | 0 (0.0%) | 5 (100.0%) |
| Personal Care & Service | 0 (0.0%) | 0 (0.0%) |
| Total (Category) | 0 (0.0%) | 5 (100.0%) |
| Total (Overall) | 77 (55.0%) | 63 (45.0%) |
Sales and Office Occupations
The most common Sales and Office occupations in Junction City are Sales & Related (11 | 7.9%), and Office & Administration (3 | 2.1%).
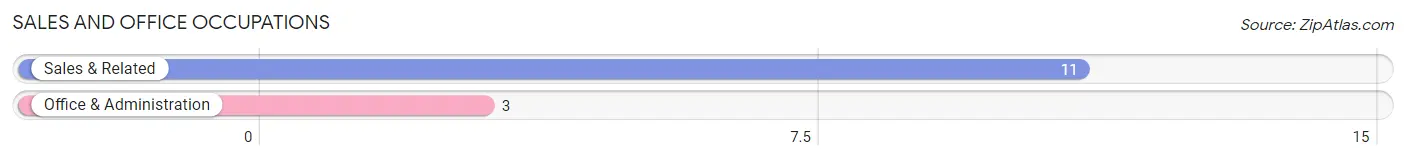
Sales and Office Occupations by Sex
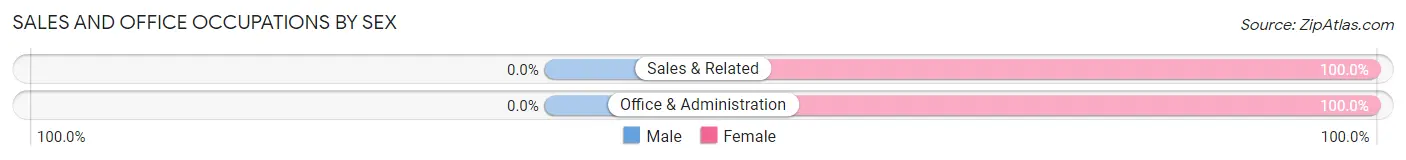
| Occupation | Male | Female |
| Sales & Related | 0 (0.0%) | 11 (100.0%) |
| Office & Administration | 0 (0.0%) | 3 (100.0%) |
| Total (Category) | 0 (0.0%) | 14 (100.0%) |
| Total (Overall) | 77 (55.0%) | 63 (45.0%) |
Natural Resources, Construction and Maintenance Occupations
The most common Natural Resources, Construction and Maintenance occupations in Junction City are Installation, Maintenance & Repair (24 | 17.1%), and Construction & Extraction (1 | 0.7%).
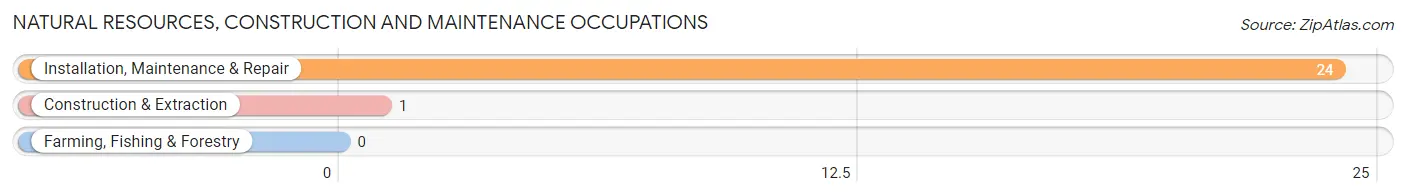
Natural Resources, Construction and Maintenance Occupations by Sex
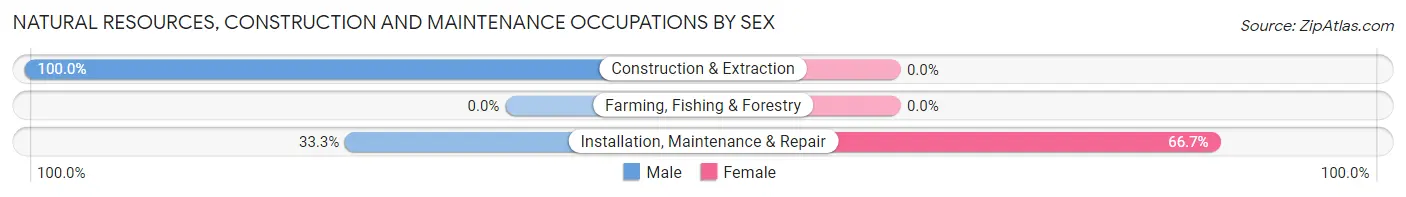
| Occupation | Male | Female |
| Farming, Fishing & Forestry | 0 (0.0%) | 0 (0.0%) |
| Construction & Extraction | 1 (100.0%) | 0 (0.0%) |
| Installation, Maintenance & Repair | 8 (33.3%) | 16 (66.7%) |
| Total (Category) | 9 (36.0%) | 16 (64.0%) |
| Total (Overall) | 77 (55.0%) | 63 (45.0%) |
Production, Transportation and Moving Occupations
The most common Production, Transportation and Moving occupations in Junction City are Transportation (50 | 35.7%), and Production (22 | 15.7%).
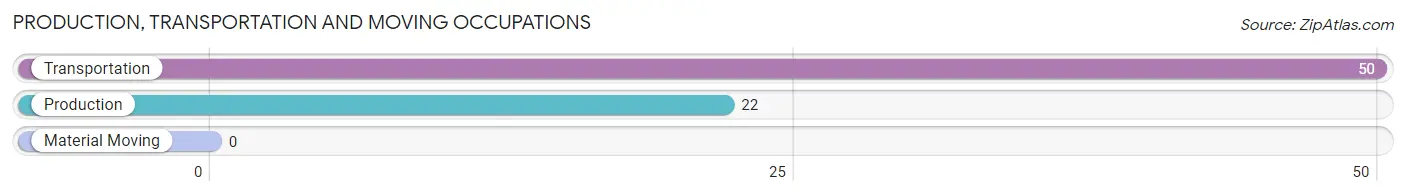
Production, Transportation and Moving Occupations by Sex
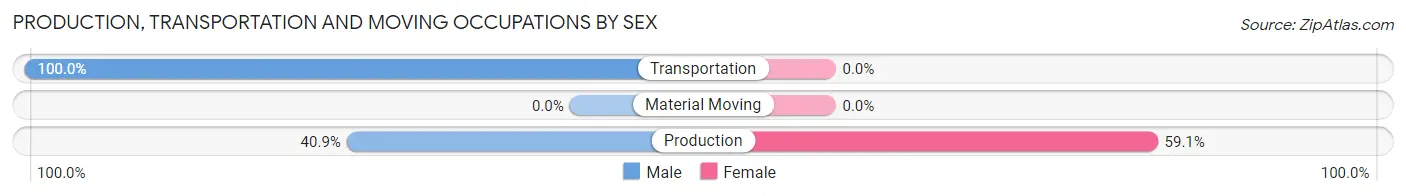
| Occupation | Male | Female |
| Production | 9 (40.9%) | 13 (59.1%) |
| Transportation | 50 (100.0%) | 0 (0.0%) |
| Material Moving | 0 (0.0%) | 0 (0.0%) |
| Total (Category) | 59 (81.9%) | 13 (18.1%) |
| Total (Overall) | 77 (55.0%) | 63 (45.0%) |
Employment Industries by Sex in Junction City
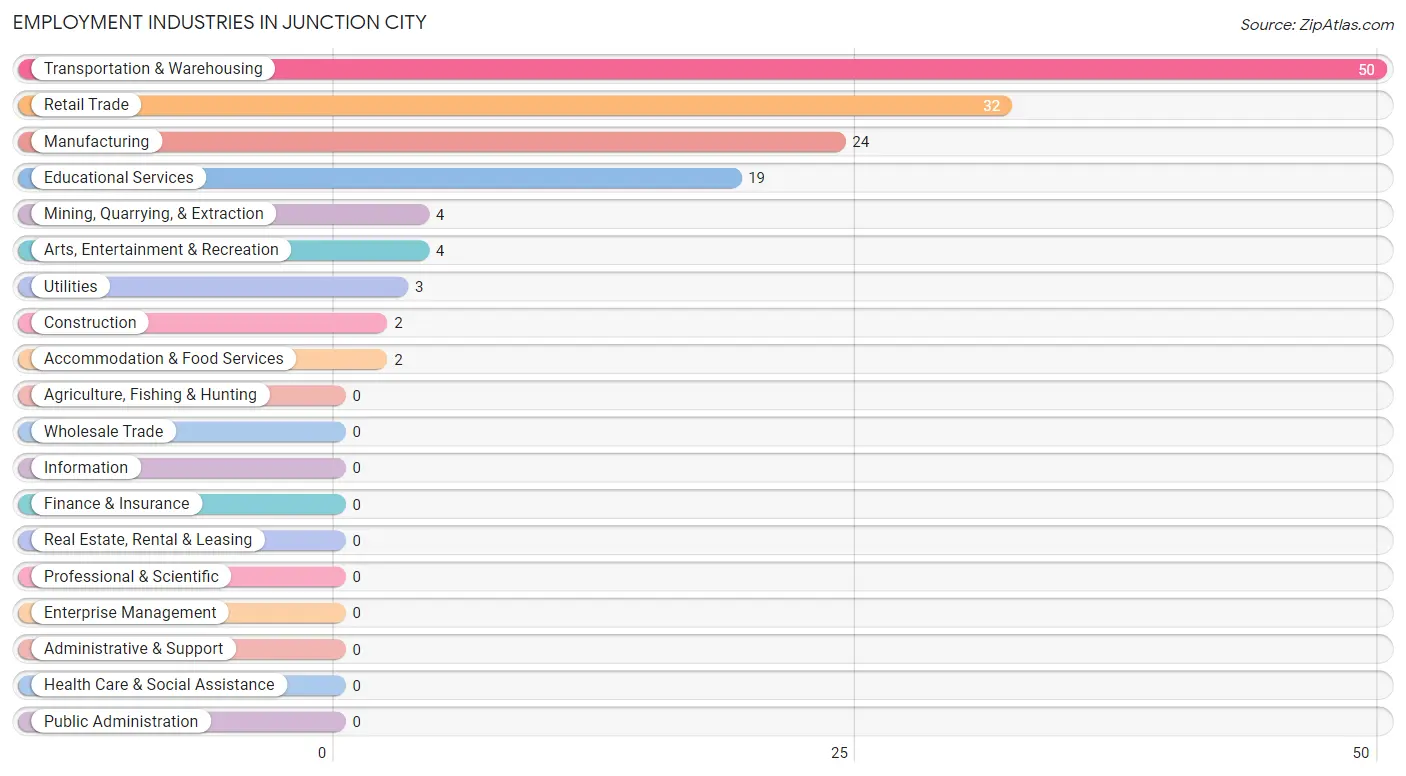
Employment Industries in Junction City
The major employment industries in Junction City include Transportation & Warehousing (50 | 35.7%), Retail Trade (32 | 22.9%), Manufacturing (24 | 17.1%), Educational Services (19 | 13.6%), and Mining, Quarrying, & Extraction (4 | 2.9%).
Employment Industries by Sex in Junction City
The Junction City industries that see more men than women are Mining, Quarrying, & Extraction (100.0%), Transportation & Warehousing (100.0%), and Utilities (100.0%), whereas the industries that tend to have a higher number of women are Retail Trade (100.0%), Arts, Entertainment & Recreation (100.0%), and Accommodation & Food Services (100.0%).
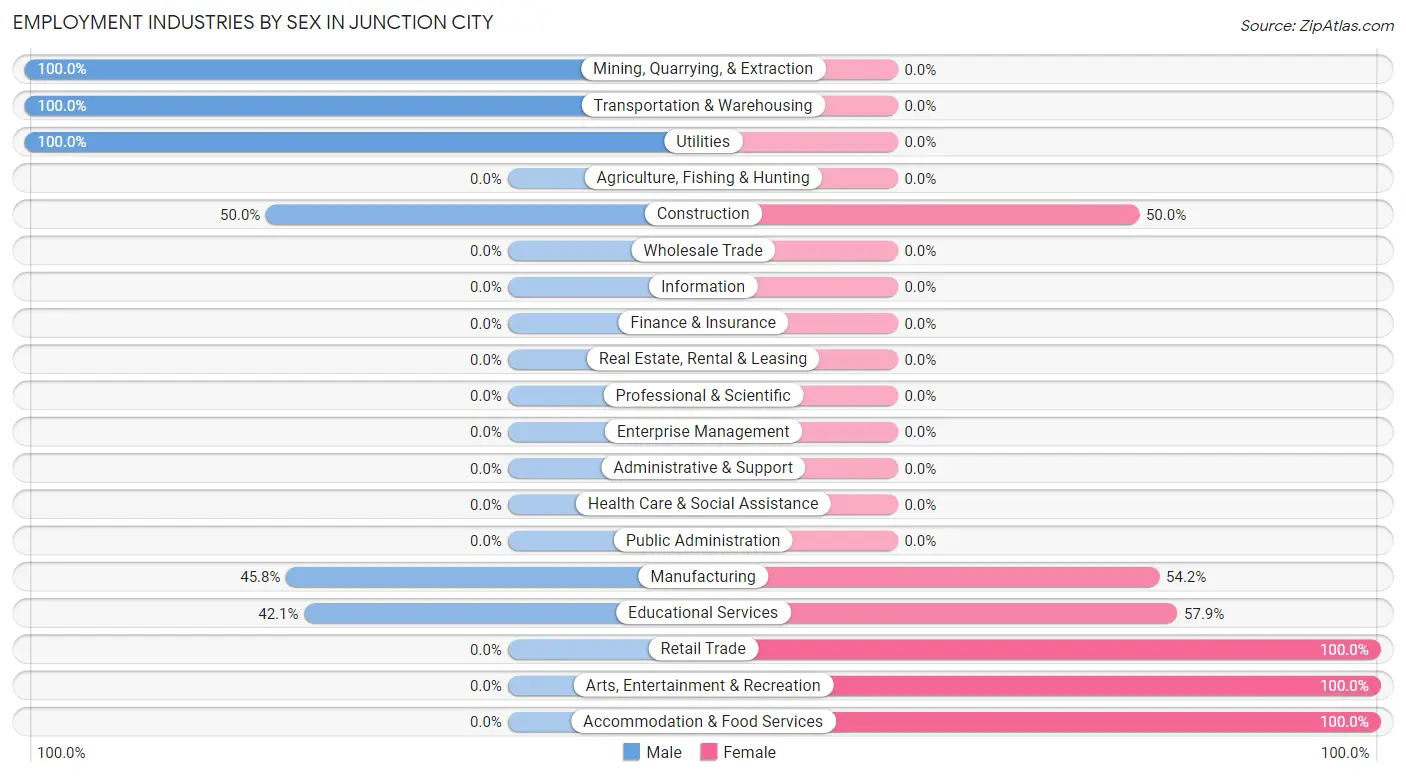
| Industry | Male | Female |
| Agriculture, Fishing & Hunting | 0 (0.0%) | 0 (0.0%) |
| Mining, Quarrying, & Extraction | 4 (100.0%) | 0 (0.0%) |
| Construction | 1 (50.0%) | 1 (50.0%) |
| Manufacturing | 11 (45.8%) | 13 (54.2%) |
| Wholesale Trade | 0 (0.0%) | 0 (0.0%) |
| Retail Trade | 0 (0.0%) | 32 (100.0%) |
| Transportation & Warehousing | 50 (100.0%) | 0 (0.0%) |
| Utilities | 3 (100.0%) | 0 (0.0%) |
| Information | 0 (0.0%) | 0 (0.0%) |
| Finance & Insurance | 0 (0.0%) | 0 (0.0%) |
| Real Estate, Rental & Leasing | 0 (0.0%) | 0 (0.0%) |
| Professional & Scientific | 0 (0.0%) | 0 (0.0%) |
| Enterprise Management | 0 (0.0%) | 0 (0.0%) |
| Administrative & Support | 0 (0.0%) | 0 (0.0%) |
| Educational Services | 8 (42.1%) | 11 (57.9%) |
| Health Care & Social Assistance | 0 (0.0%) | 0 (0.0%) |
| Arts, Entertainment & Recreation | 0 (0.0%) | 4 (100.0%) |
| Accommodation & Food Services | 0 (0.0%) | 2 (100.0%) |
| Public Administration | 0 (0.0%) | 0 (0.0%) |
| Total | 77 (55.0%) | 63 (45.0%) |
Education in Junction City
School Enrollment in Junction City
The most common levels of schooling among the 211 students in Junction City are middle school (78 | 37.0%), elementary school (52 | 24.6%), and high school (42 | 19.9%).
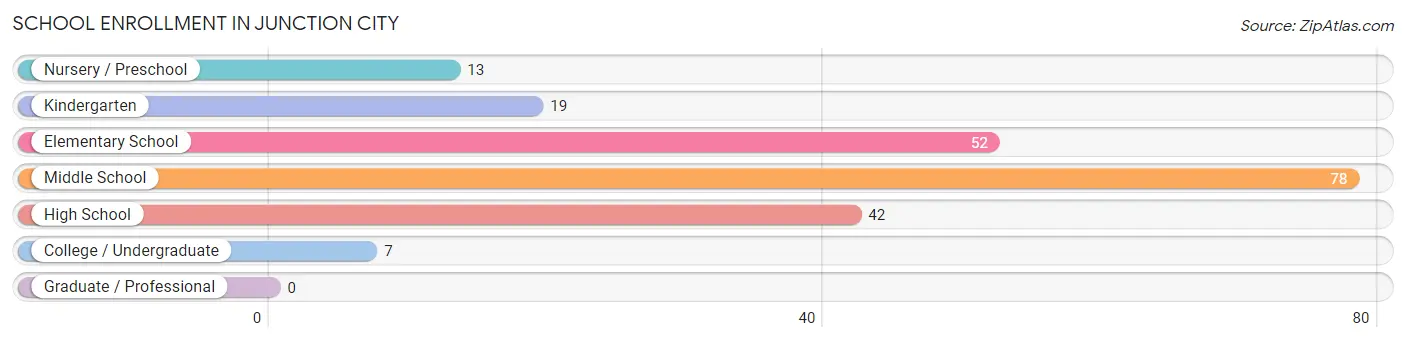
| School Level | # Students | % Students |
| Nursery / Preschool | 13 | 6.2% |
| Kindergarten | 19 | 9.0% |
| Elementary School | 52 | 24.6% |
| Middle School | 78 | 37.0% |
| High School | 42 | 19.9% |
| College / Undergraduate | 7 | 3.3% |
| Graduate / Professional | 0 | 0.0% |
| Total | 211 | 100.0% |
School Enrollment by Age by Funding Source in Junction City
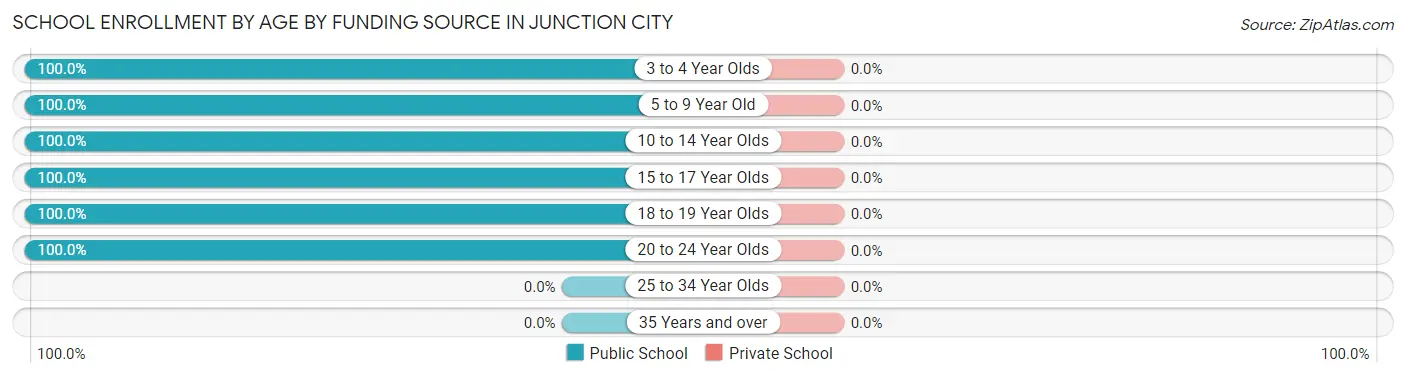
| Age Bracket | Public School | Private School |
| 3 to 4 Year Olds | 13 (100.0%) | 0 (0.0%) |
| 5 to 9 Year Old | 71 (100.0%) | 0 (0.0%) |
| 10 to 14 Year Olds | 78 (100.0%) | 0 (0.0%) |
| 15 to 17 Year Olds | 31 (100.0%) | 0 (0.0%) |
| 18 to 19 Year Olds | 11 (100.0%) | 0 (0.0%) |
| 20 to 24 Year Olds | 7 (100.0%) | 0 (0.0%) |
| 25 to 34 Year Olds | 0 (0.0%) | 0 (0.0%) |
| 35 Years and over | 0 (0.0%) | 0 (0.0%) |
| Total | 211 (100.0%) | 0 (0.0%) |
Educational Attainment by Field of Study in Junction City
Education (14 | 41.2%), science & technology (11 | 32.4%), and bio, nature & agricultural (9 | 26.5%) are the most common fields of study among 34 individuals in Junction City who have obtained a bachelor's degree or higher.
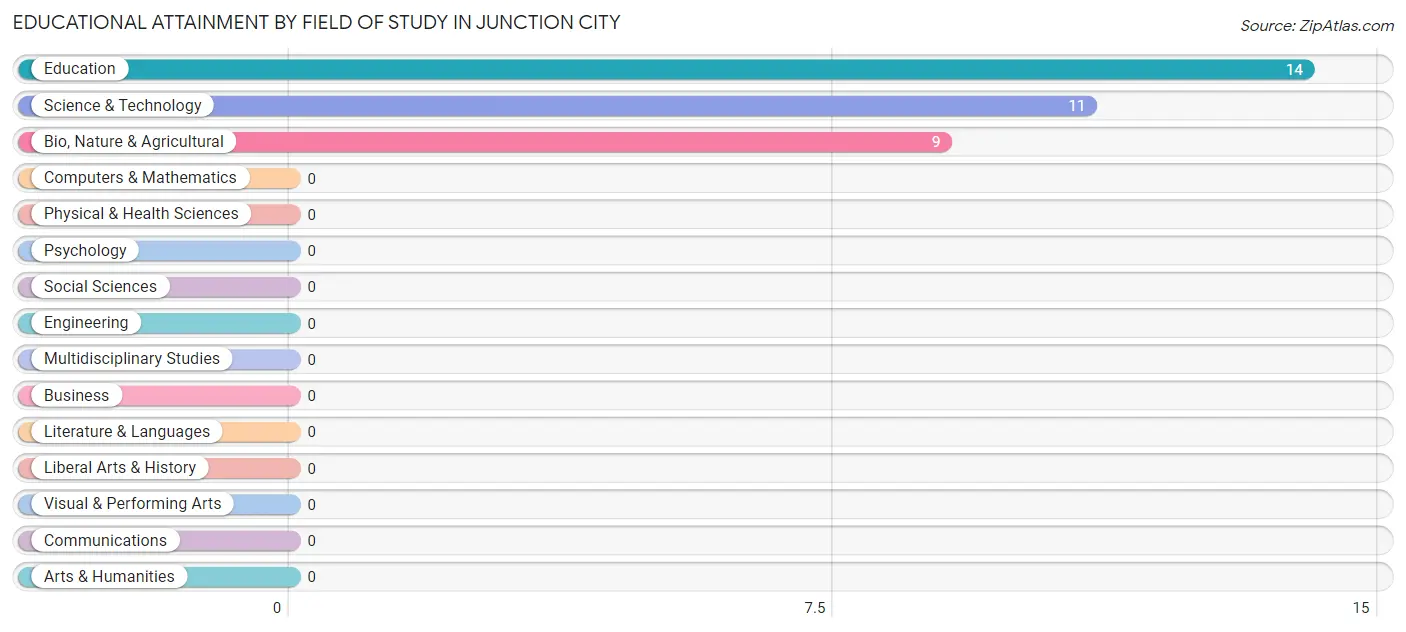
| Field of Study | # Graduates | % Graduates |
| Computers & Mathematics | 0 | 0.0% |
| Bio, Nature & Agricultural | 9 | 26.5% |
| Physical & Health Sciences | 0 | 0.0% |
| Psychology | 0 | 0.0% |
| Social Sciences | 0 | 0.0% |
| Engineering | 0 | 0.0% |
| Multidisciplinary Studies | 0 | 0.0% |
| Science & Technology | 11 | 32.4% |
| Business | 0 | 0.0% |
| Education | 14 | 41.2% |
| Literature & Languages | 0 | 0.0% |
| Liberal Arts & History | 0 | 0.0% |
| Visual & Performing Arts | 0 | 0.0% |
| Communications | 0 | 0.0% |
| Arts & Humanities | 0 | 0.0% |
| Total | 34 | 100.0% |
Transportation & Commute in Junction City
Vehicle Availability by Sex in Junction City
The most prevalent vehicle ownership categories in Junction City are males with 2 vehicles (52, accounting for 67.5%) and females with 2 vehicles (0, making up 82.5%).
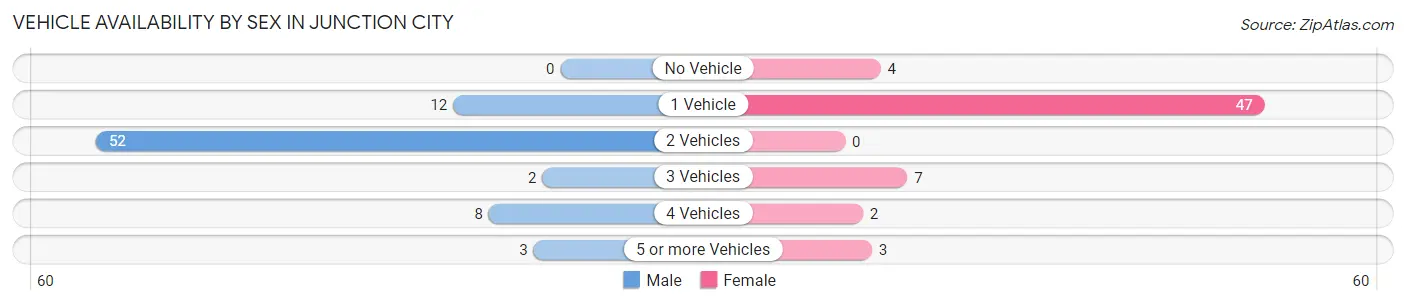
| Vehicles Available | Male | Female |
| No Vehicle | 0 (0.0%) | 4 (6.4%) |
| 1 Vehicle | 12 (15.6%) | 47 (74.6%) |
| 2 Vehicles | 52 (67.5%) | 0 (0.0%) |
| 3 Vehicles | 2 (2.6%) | 7 (11.1%) |
| 4 Vehicles | 8 (10.4%) | 2 (3.2%) |
| 5 or more Vehicles | 3 (3.9%) | 3 (4.8%) |
| Total | 77 (100.0%) | 63 (100.0%) |
Commute Time in Junction City
The most frequently occuring commute durations in Junction City are 60 to 89 minutes (56 commuters, 40.0%), 10 to 14 minutes (27 commuters, 19.3%), and 90 or more minutes (15 commuters, 10.7%).
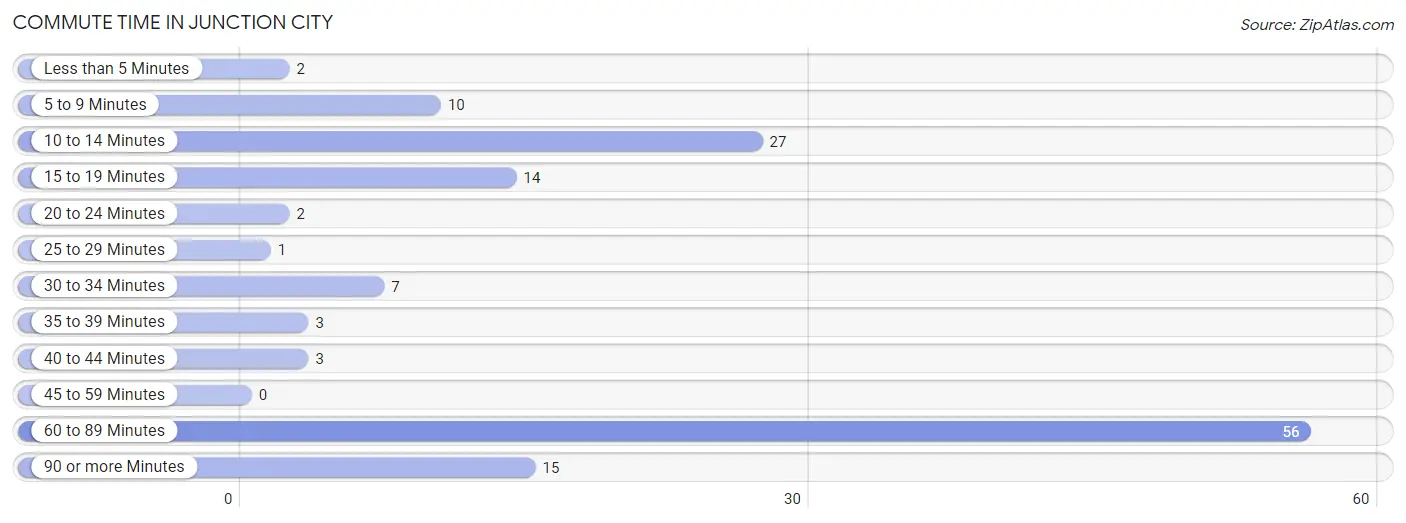
| Commute Time | # Commuters | % Commuters |
| Less than 5 Minutes | 2 | 1.4% |
| 5 to 9 Minutes | 10 | 7.1% |
| 10 to 14 Minutes | 27 | 19.3% |
| 15 to 19 Minutes | 14 | 10.0% |
| 20 to 24 Minutes | 2 | 1.4% |
| 25 to 29 Minutes | 1 | 0.7% |
| 30 to 34 Minutes | 7 | 5.0% |
| 35 to 39 Minutes | 3 | 2.1% |
| 40 to 44 Minutes | 3 | 2.1% |
| 45 to 59 Minutes | 0 | 0.0% |
| 60 to 89 Minutes | 56 | 40.0% |
| 90 or more Minutes | 15 | 10.7% |
Commute Time by Sex in Junction City
The most common commute times in Junction City are 60 to 89 minutes (48 commuters, 62.3%) for males and 10 to 14 minutes (27 commuters, 42.9%) for females.
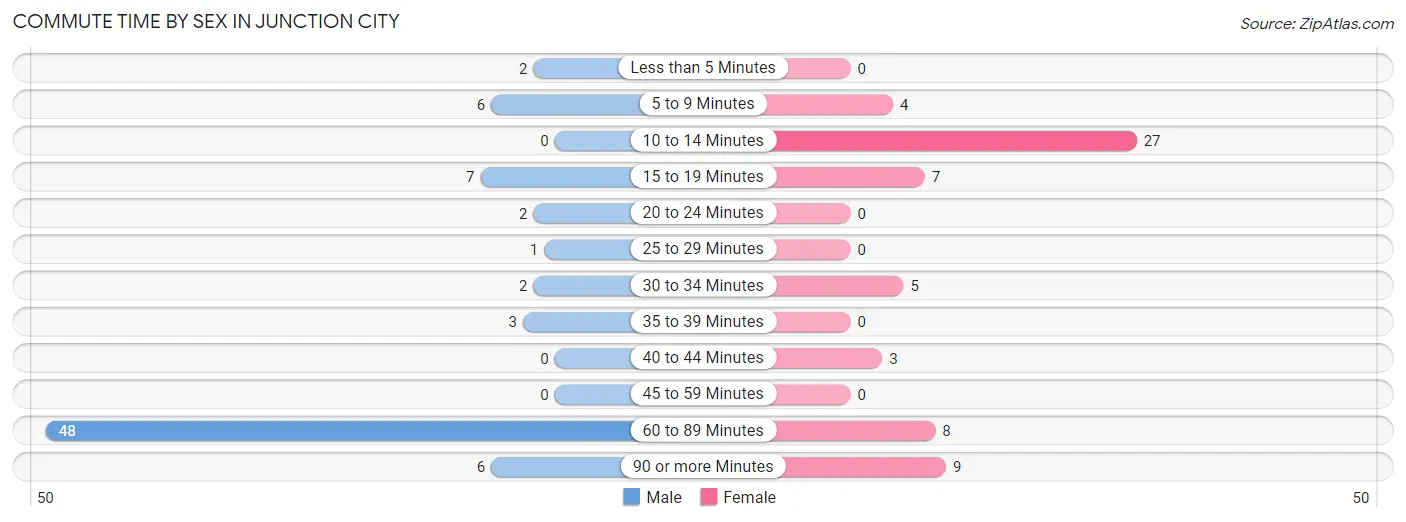
| Commute Time | Male | Female |
| Less than 5 Minutes | 2 (2.6%) | 0 (0.0%) |
| 5 to 9 Minutes | 6 (7.8%) | 4 (6.4%) |
| 10 to 14 Minutes | 0 (0.0%) | 27 (42.9%) |
| 15 to 19 Minutes | 7 (9.1%) | 7 (11.1%) |
| 20 to 24 Minutes | 2 (2.6%) | 0 (0.0%) |
| 25 to 29 Minutes | 1 (1.3%) | 0 (0.0%) |
| 30 to 34 Minutes | 2 (2.6%) | 5 (7.9%) |
| 35 to 39 Minutes | 3 (3.9%) | 0 (0.0%) |
| 40 to 44 Minutes | 0 (0.0%) | 3 (4.8%) |
| 45 to 59 Minutes | 0 (0.0%) | 0 (0.0%) |
| 60 to 89 Minutes | 48 (62.3%) | 8 (12.7%) |
| 90 or more Minutes | 6 (7.8%) | 9 (14.3%) |
Time of Departure to Work by Sex in Junction City
The most frequent times of departure to work in Junction City are 12:00 AM to 4:59 AM (52, 67.5%) for males and 7:00 AM to 7:29 AM (17, 27.0%) for females.
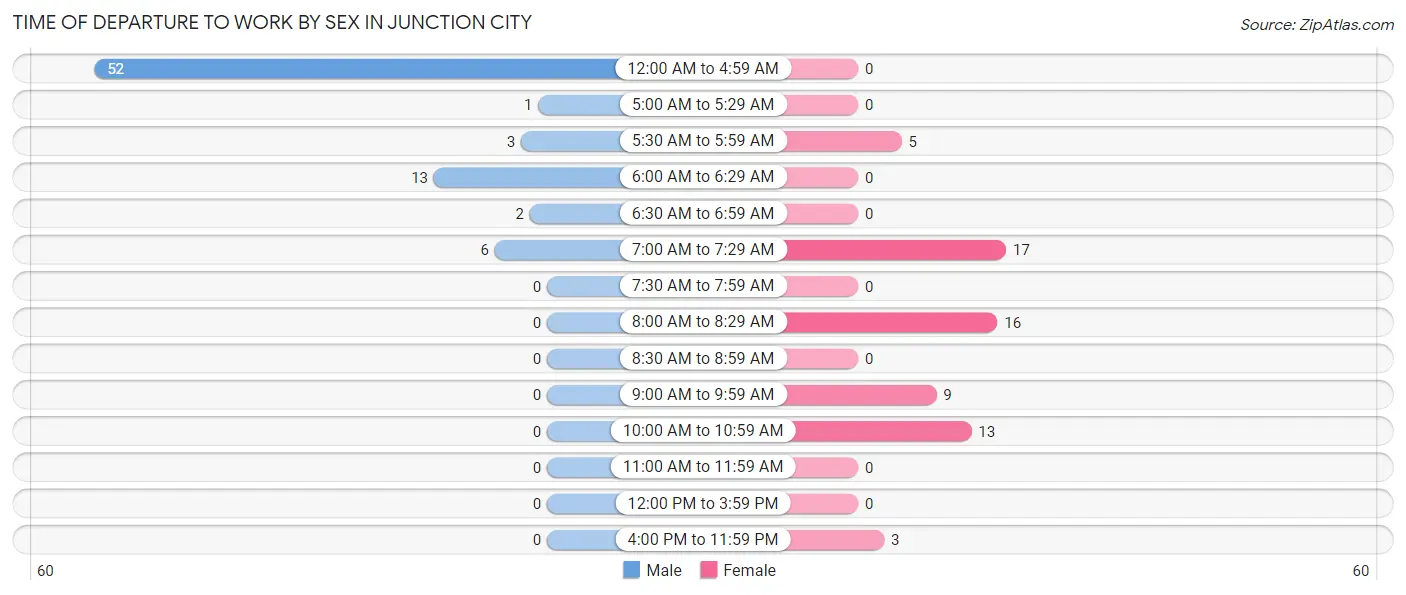
| Time of Departure | Male | Female |
| 12:00 AM to 4:59 AM | 52 (67.5%) | 0 (0.0%) |
| 5:00 AM to 5:29 AM | 1 (1.3%) | 0 (0.0%) |
| 5:30 AM to 5:59 AM | 3 (3.9%) | 5 (7.9%) |
| 6:00 AM to 6:29 AM | 13 (16.9%) | 0 (0.0%) |
| 6:30 AM to 6:59 AM | 2 (2.6%) | 0 (0.0%) |
| 7:00 AM to 7:29 AM | 6 (7.8%) | 17 (27.0%) |
| 7:30 AM to 7:59 AM | 0 (0.0%) | 0 (0.0%) |
| 8:00 AM to 8:29 AM | 0 (0.0%) | 16 (25.4%) |
| 8:30 AM to 8:59 AM | 0 (0.0%) | 0 (0.0%) |
| 9:00 AM to 9:59 AM | 0 (0.0%) | 9 (14.3%) |
| 10:00 AM to 10:59 AM | 0 (0.0%) | 13 (20.6%) |
| 11:00 AM to 11:59 AM | 0 (0.0%) | 0 (0.0%) |
| 12:00 PM to 3:59 PM | 0 (0.0%) | 0 (0.0%) |
| 4:00 PM to 11:59 PM | 0 (0.0%) | 3 (4.8%) |
| Total | 77 (100.0%) | 63 (100.0%) |
Housing Occupancy in Junction City
Occupancy by Ownership in Junction City
Of the total 244 dwellings in Junction City, owner-occupied units account for 126 (51.6%), while renter-occupied units make up 118 (48.4%).
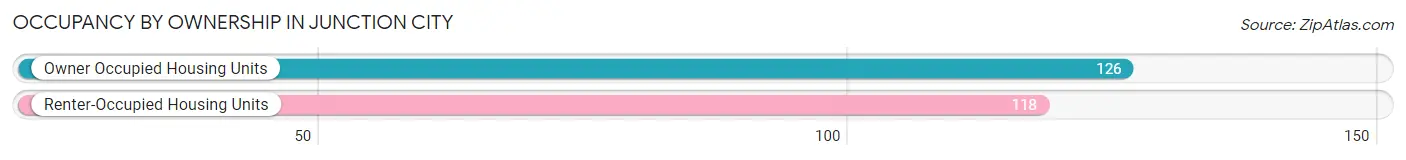
| Occupancy | # Housing Units | % Housing Units |
| Owner Occupied Housing Units | 126 | 51.6% |
| Renter-Occupied Housing Units | 118 | 48.4% |
| Total Occupied Housing Units | 244 | 100.0% |
Occupancy by Household Size in Junction City
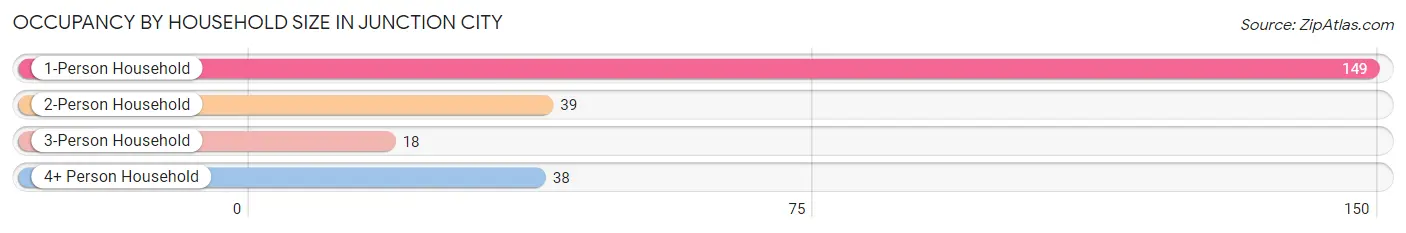
| Household Size | # Housing Units | % Housing Units |
| 1-Person Household | 149 | 61.1% |
| 2-Person Household | 39 | 16.0% |
| 3-Person Household | 18 | 7.4% |
| 4+ Person Household | 38 | 15.6% |
| Total Housing Units | 244 | 100.0% |
Occupancy by Ownership by Household Size in Junction City
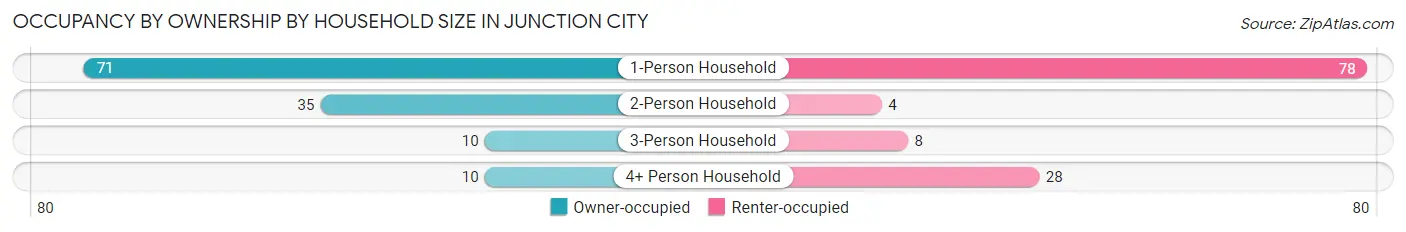
| Household Size | Owner-occupied | Renter-occupied |
| 1-Person Household | 71 (47.6%) | 78 (52.3%) |
| 2-Person Household | 35 (89.7%) | 4 (10.3%) |
| 3-Person Household | 10 (55.6%) | 8 (44.4%) |
| 4+ Person Household | 10 (26.3%) | 28 (73.7%) |
| Total Housing Units | 126 (51.6%) | 118 (48.4%) |
Occupancy by Educational Attainment in Junction City
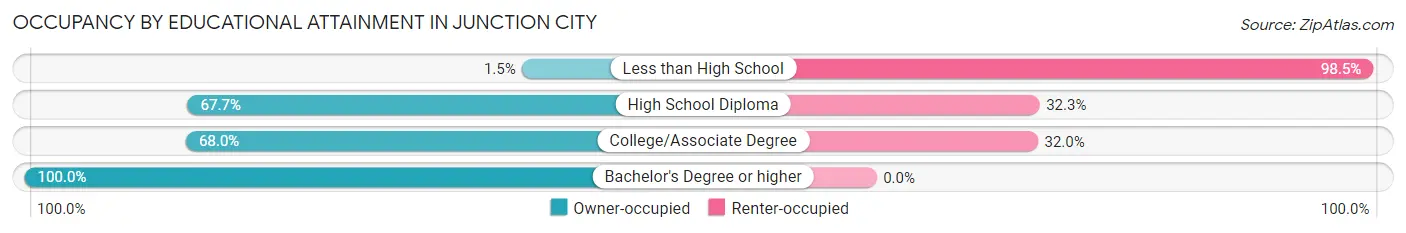
| Household Size | Owner-occupied | Renter-occupied |
| Less than High School | 1 (1.5%) | 67 (98.5%) |
| High School Diploma | 90 (67.7%) | 43 (32.3%) |
| College/Associate Degree | 17 (68.0%) | 8 (32.0%) |
| Bachelor's Degree or higher | 18 (100.0%) | 0 (0.0%) |
Occupancy by Age of Householder in Junction City
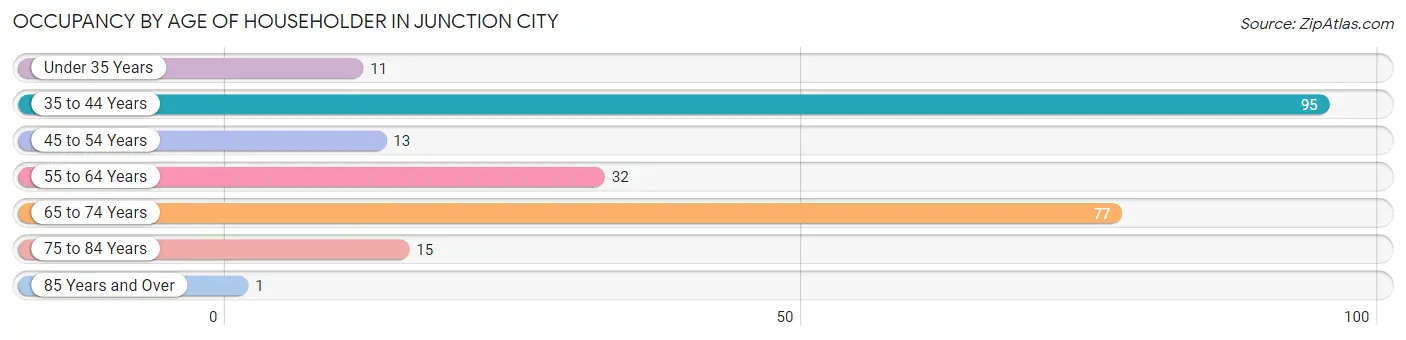
| Age Bracket | # Households | % Households |
| Under 35 Years | 11 | 4.5% |
| 35 to 44 Years | 95 | 38.9% |
| 45 to 54 Years | 13 | 5.3% |
| 55 to 64 Years | 32 | 13.1% |
| 65 to 74 Years | 77 | 31.6% |
| 75 to 84 Years | 15 | 6.1% |
| 85 Years and Over | 1 | 0.4% |
| Total | 244 | 100.0% |
Housing Finances in Junction City
Median Income by Occupancy in Junction City
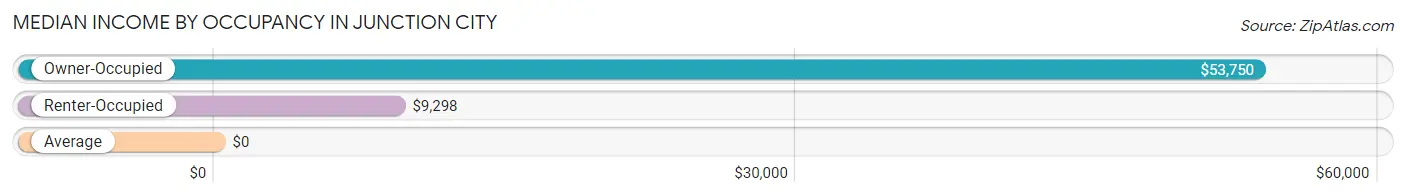
| Occupancy Type | # Households | Median Income |
| Owner-Occupied | 126 (51.6%) | $53,750 |
| Renter-Occupied | 118 (48.4%) | $9,298 |
| Average | 244 (100.0%) | $0 |
Occupancy by Householder Income Bracket in Junction City
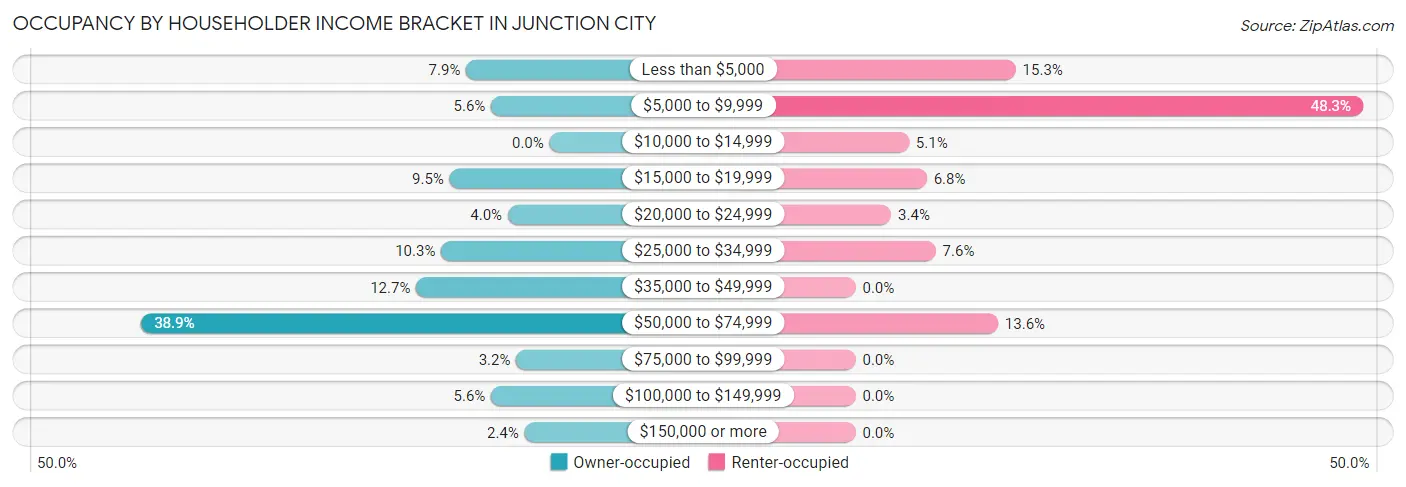
| Income Bracket | Owner-occupied | Renter-occupied |
| Less than $5,000 | 10 (7.9%) | 18 (15.2%) |
| $5,000 to $9,999 | 7 (5.6%) | 57 (48.3%) |
| $10,000 to $14,999 | 0 (0.0%) | 6 (5.1%) |
| $15,000 to $19,999 | 12 (9.5%) | 8 (6.8%) |
| $20,000 to $24,999 | 5 (4.0%) | 4 (3.4%) |
| $25,000 to $34,999 | 13 (10.3%) | 9 (7.6%) |
| $35,000 to $49,999 | 16 (12.7%) | 0 (0.0%) |
| $50,000 to $74,999 | 49 (38.9%) | 16 (13.6%) |
| $75,000 to $99,999 | 4 (3.2%) | 0 (0.0%) |
| $100,000 to $149,999 | 7 (5.6%) | 0 (0.0%) |
| $150,000 or more | 3 (2.4%) | 0 (0.0%) |
| Total | 126 (100.0%) | 118 (100.0%) |
Monthly Housing Cost Tiers in Junction City
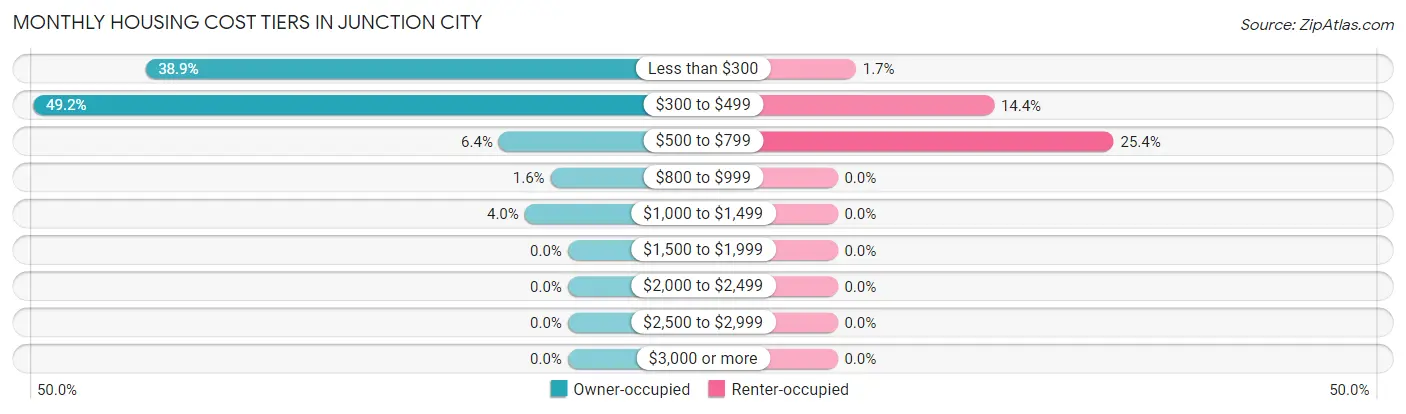
| Monthly Cost | Owner-occupied | Renter-occupied |
| Less than $300 | 49 (38.9%) | 2 (1.7%) |
| $300 to $499 | 62 (49.2%) | 17 (14.4%) |
| $500 to $799 | 8 (6.4%) | 30 (25.4%) |
| $800 to $999 | 2 (1.6%) | 0 (0.0%) |
| $1,000 to $1,499 | 5 (4.0%) | 0 (0.0%) |
| $1,500 to $1,999 | 0 (0.0%) | 0 (0.0%) |
| $2,000 to $2,499 | 0 (0.0%) | 0 (0.0%) |
| $2,500 to $2,999 | 0 (0.0%) | 0 (0.0%) |
| $3,000 or more | 0 (0.0%) | 0 (0.0%) |
| Total | 126 (100.0%) | 118 (100.0%) |
Physical Housing Characteristics in Junction City
Housing Structures in Junction City
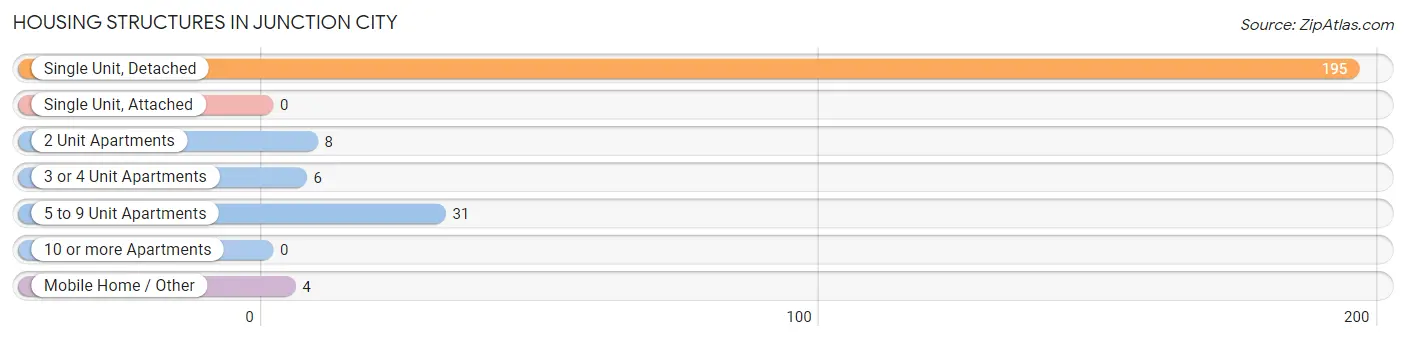
| Structure Type | # Housing Units | % Housing Units |
| Single Unit, Detached | 195 | 79.9% |
| Single Unit, Attached | 0 | 0.0% |
| 2 Unit Apartments | 8 | 3.3% |
| 3 or 4 Unit Apartments | 6 | 2.5% |
| 5 to 9 Unit Apartments | 31 | 12.7% |
| 10 or more Apartments | 0 | 0.0% |
| Mobile Home / Other | 4 | 1.6% |
| Total | 244 | 100.0% |
Housing Structures by Occupancy in Junction City
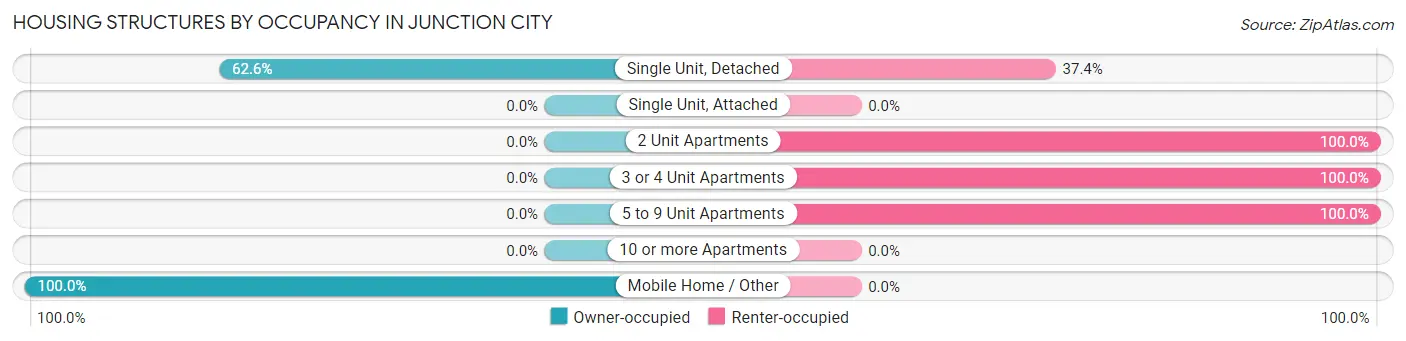
| Structure Type | Owner-occupied | Renter-occupied |
| Single Unit, Detached | 122 (62.6%) | 73 (37.4%) |
| Single Unit, Attached | 0 (0.0%) | 0 (0.0%) |
| 2 Unit Apartments | 0 (0.0%) | 8 (100.0%) |
| 3 or 4 Unit Apartments | 0 (0.0%) | 6 (100.0%) |
| 5 to 9 Unit Apartments | 0 (0.0%) | 31 (100.0%) |
| 10 or more Apartments | 0 (0.0%) | 0 (0.0%) |
| Mobile Home / Other | 4 (100.0%) | 0 (0.0%) |
| Total | 126 (51.6%) | 118 (48.4%) |
Housing Structures by Number of Rooms in Junction City
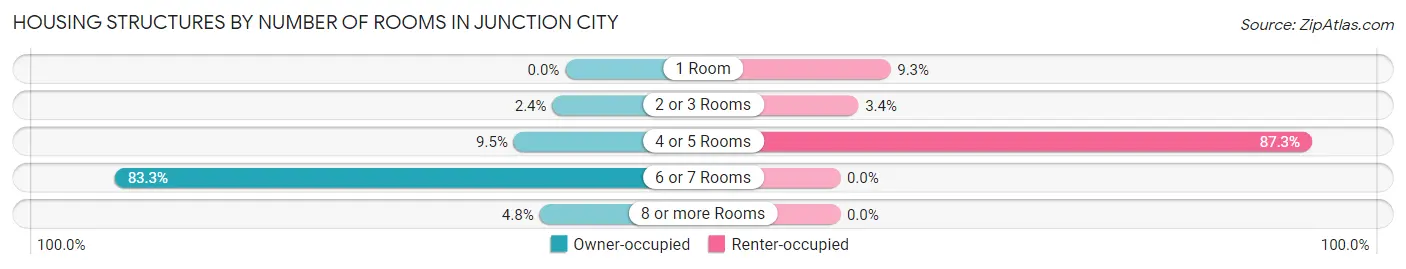
| Number of Rooms | Owner-occupied | Renter-occupied |
| 1 Room | 0 (0.0%) | 11 (9.3%) |
| 2 or 3 Rooms | 3 (2.4%) | 4 (3.4%) |
| 4 or 5 Rooms | 12 (9.5%) | 103 (87.3%) |
| 6 or 7 Rooms | 105 (83.3%) | 0 (0.0%) |
| 8 or more Rooms | 6 (4.8%) | 0 (0.0%) |
| Total | 126 (100.0%) | 118 (100.0%) |
Housing Structure by Heating Type in Junction City
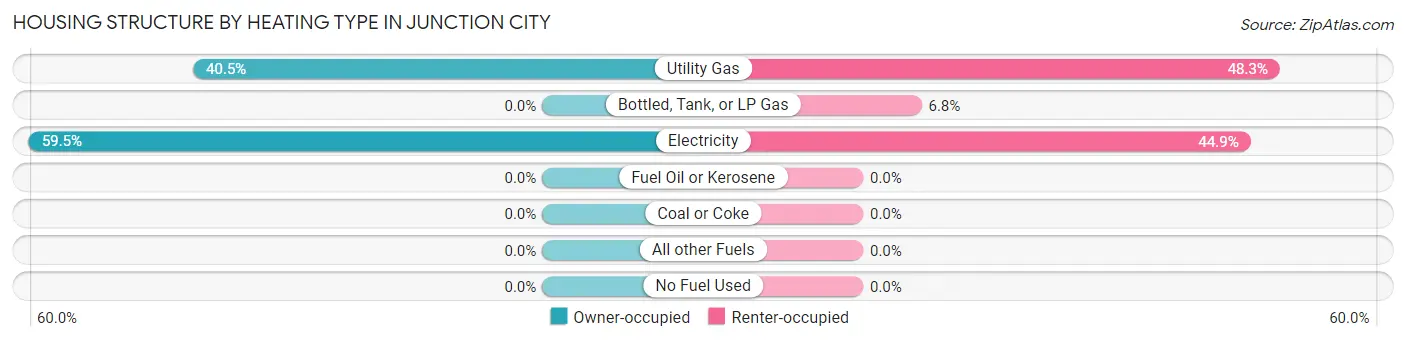
| Heating Type | Owner-occupied | Renter-occupied |
| Utility Gas | 51 (40.5%) | 57 (48.3%) |
| Bottled, Tank, or LP Gas | 0 (0.0%) | 8 (6.8%) |
| Electricity | 75 (59.5%) | 53 (44.9%) |
| Fuel Oil or Kerosene | 0 (0.0%) | 0 (0.0%) |
| Coal or Coke | 0 (0.0%) | 0 (0.0%) |
| All other Fuels | 0 (0.0%) | 0 (0.0%) |
| No Fuel Used | 0 (0.0%) | 0 (0.0%) |
| Total | 126 (100.0%) | 118 (100.0%) |
Household Vehicle Usage in Junction City
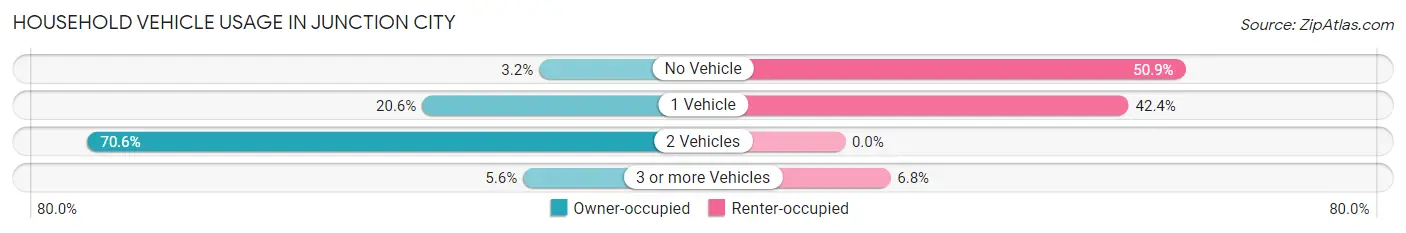
| Vehicles per Household | Owner-occupied | Renter-occupied |
| No Vehicle | 4 (3.2%) | 60 (50.8%) |
| 1 Vehicle | 26 (20.6%) | 50 (42.4%) |
| 2 Vehicles | 89 (70.6%) | 0 (0.0%) |
| 3 or more Vehicles | 7 (5.6%) | 8 (6.8%) |
| Total | 126 (100.0%) | 118 (100.0%) |
Real Estate & Mortgages in Junction City
Real Estate and Mortgage Overview in Junction City
| Characteristic | Without Mortgage | With Mortgage |
| Housing Units | 106 | 20 |
| Median Property Value | - | - |
| Median Household Income | $49,286 | $3 |
| Monthly Housing Costs | $400 | $0 |
| Real Estate Taxes | $600 | $6 |
Property Value by Mortgage Status in Junction City
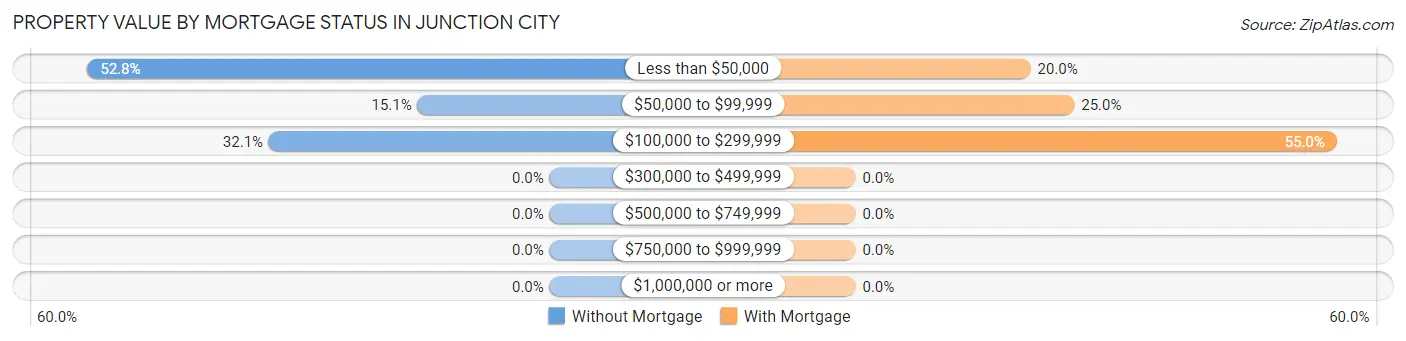
| Property Value | Without Mortgage | With Mortgage |
| Less than $50,000 | 56 (52.8%) | 4 (20.0%) |
| $50,000 to $99,999 | 16 (15.1%) | 5 (25.0%) |
| $100,000 to $299,999 | 34 (32.1%) | 11 (55.0%) |
| $300,000 to $499,999 | 0 (0.0%) | 0 (0.0%) |
| $500,000 to $749,999 | 0 (0.0%) | 0 (0.0%) |
| $750,000 to $999,999 | 0 (0.0%) | 0 (0.0%) |
| $1,000,000 or more | 0 (0.0%) | 0 (0.0%) |
| Total | 106 (100.0%) | 20 (100.0%) |
Household Income by Mortgage Status in Junction City
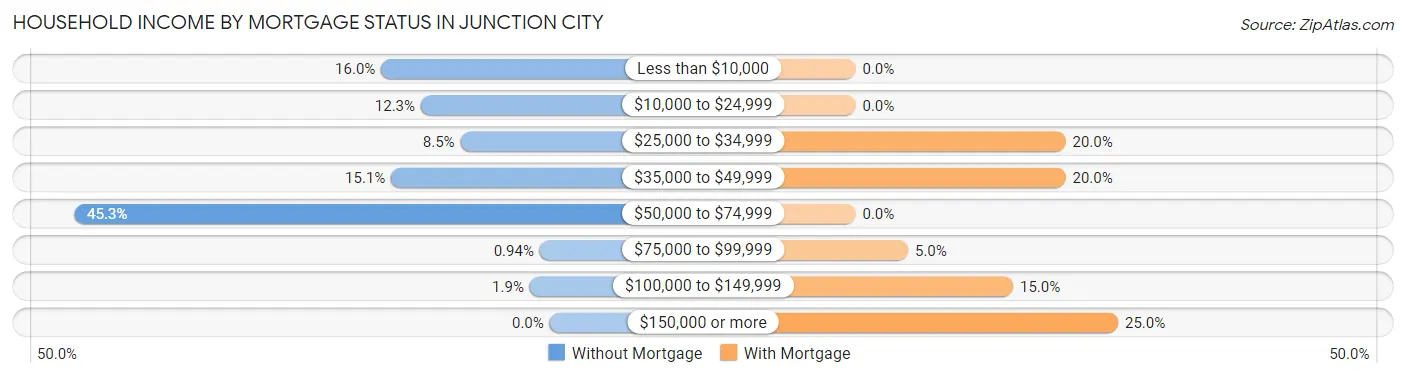
| Household Income | Without Mortgage | With Mortgage |
| Less than $10,000 | 17 (16.0%) | 0 (0.0%) |
| $10,000 to $24,999 | 13 (12.3%) | 0 (0.0%) |
| $25,000 to $34,999 | 9 (8.5%) | 4 (20.0%) |
| $35,000 to $49,999 | 16 (15.1%) | 4 (20.0%) |
| $50,000 to $74,999 | 48 (45.3%) | 0 (0.0%) |
| $75,000 to $99,999 | 1 (0.9%) | 1 (5.0%) |
| $100,000 to $149,999 | 2 (1.9%) | 3 (15.0%) |
| $150,000 or more | 0 (0.0%) | 5 (25.0%) |
| Total | 106 (100.0%) | 20 (100.0%) |
Property Value to Household Income Ratio in Junction City
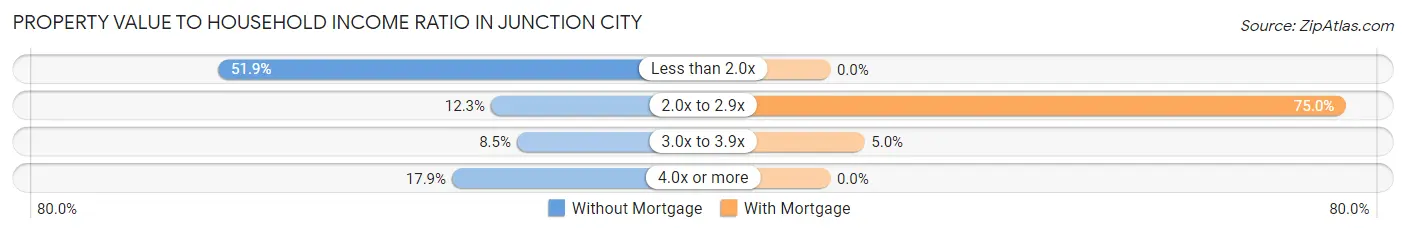
| Value-to-Income Ratio | Without Mortgage | With Mortgage |
| Less than 2.0x | 55 (51.9%) | 0 (0.0%) |
| 2.0x to 2.9x | 13 (12.3%) | 15 (75.0%) |
| 3.0x to 3.9x | 9 (8.5%) | 1 (5.0%) |
| 4.0x or more | 19 (17.9%) | 0 (0.0%) |
| Total | 106 (100.0%) | 20 (100.0%) |
Real Estate Taxes by Mortgage Status in Junction City
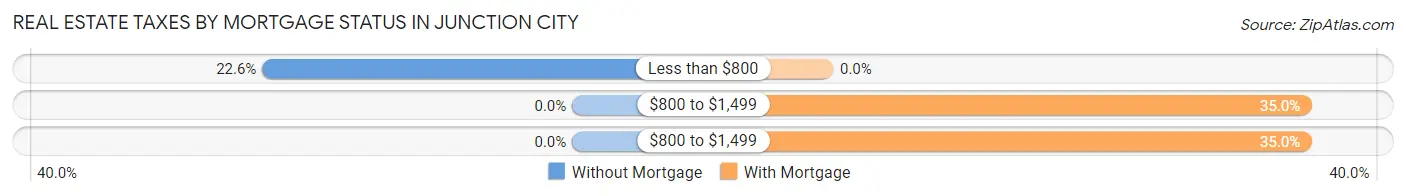
| Property Taxes | Without Mortgage | With Mortgage |
| Less than $800 | 24 (22.6%) | 0 (0.0%) |
| $800 to $1,499 | 0 (0.0%) | 7 (35.0%) |
| $800 to $1,499 | 0 (0.0%) | 7 (35.0%) |
| Total | 106 (100.0%) | 20 (100.0%) |
Health & Disability in Junction City
Health Insurance Coverage by Age in Junction City
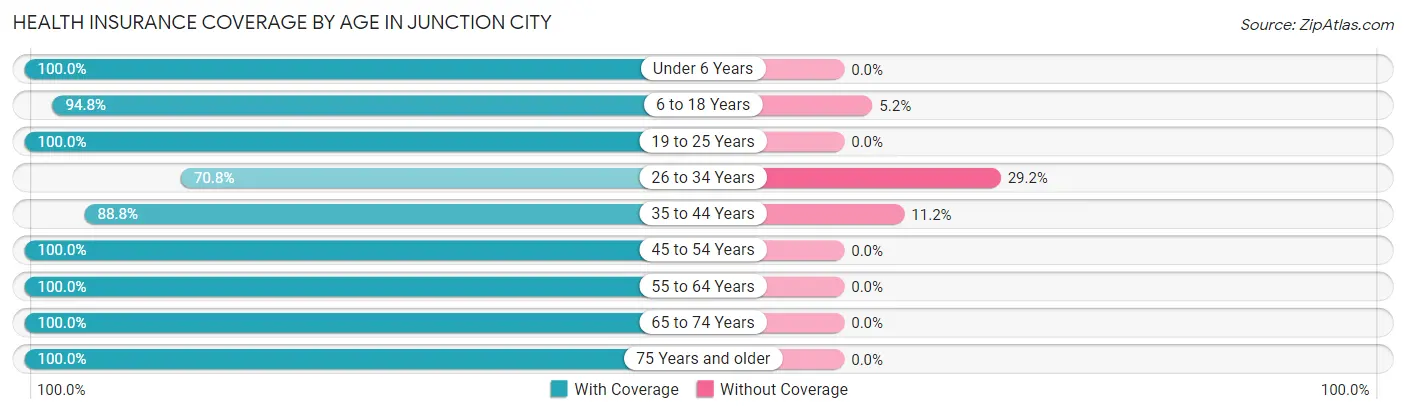
| Age Bracket | With Coverage | Without Coverage |
| Under 6 Years | 17 (100.0%) | 0 (0.0%) |
| 6 to 18 Years | 181 (94.8%) | 10 (5.2%) |
| 19 to 25 Years | 28 (100.0%) | 0 (0.0%) |
| 26 to 34 Years | 17 (70.8%) | 7 (29.2%) |
| 35 to 44 Years | 95 (88.8%) | 12 (11.2%) |
| 45 to 54 Years | 17 (100.0%) | 0 (0.0%) |
| 55 to 64 Years | 51 (100.0%) | 0 (0.0%) |
| 65 to 74 Years | 85 (100.0%) | 0 (0.0%) |
| 75 Years and older | 36 (100.0%) | 0 (0.0%) |
| Total | 527 (94.8%) | 29 (5.2%) |
Health Insurance Coverage by Citizenship Status in Junction City
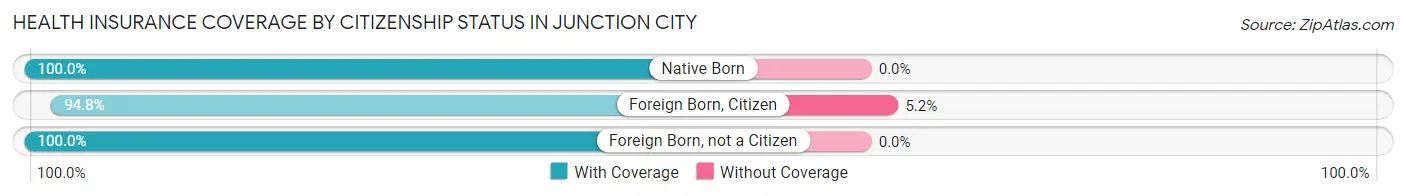
| Citizenship Status | With Coverage | Without Coverage |
| Native Born | 17 (100.0%) | 0 (0.0%) |
| Foreign Born, Citizen | 181 (94.8%) | 10 (5.2%) |
| Foreign Born, not a Citizen | 28 (100.0%) | 0 (0.0%) |
Health Insurance Coverage by Household Income in Junction City
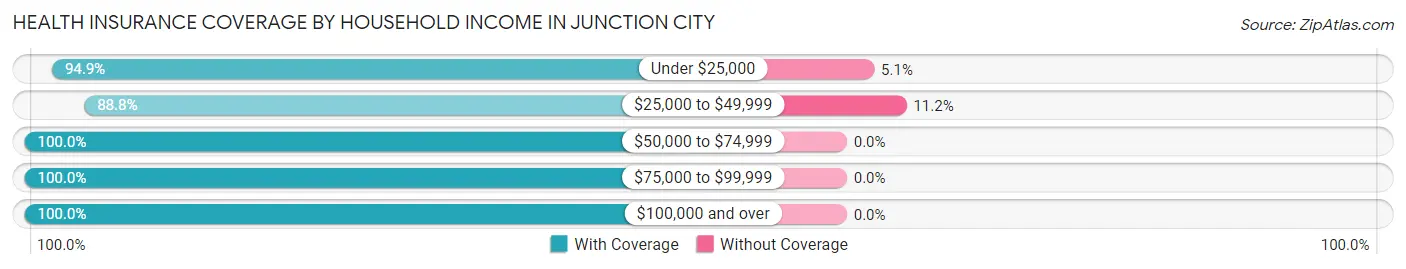
| Household Income | With Coverage | Without Coverage |
| Under $25,000 | 222 (94.9%) | 12 (5.1%) |
| $25,000 to $49,999 | 135 (88.8%) | 17 (11.2%) |
| $50,000 to $74,999 | 136 (100.0%) | 0 (0.0%) |
| $75,000 to $99,999 | 4 (100.0%) | 0 (0.0%) |
| $100,000 and over | 30 (100.0%) | 0 (0.0%) |
Public vs Private Health Insurance Coverage by Age in Junction City
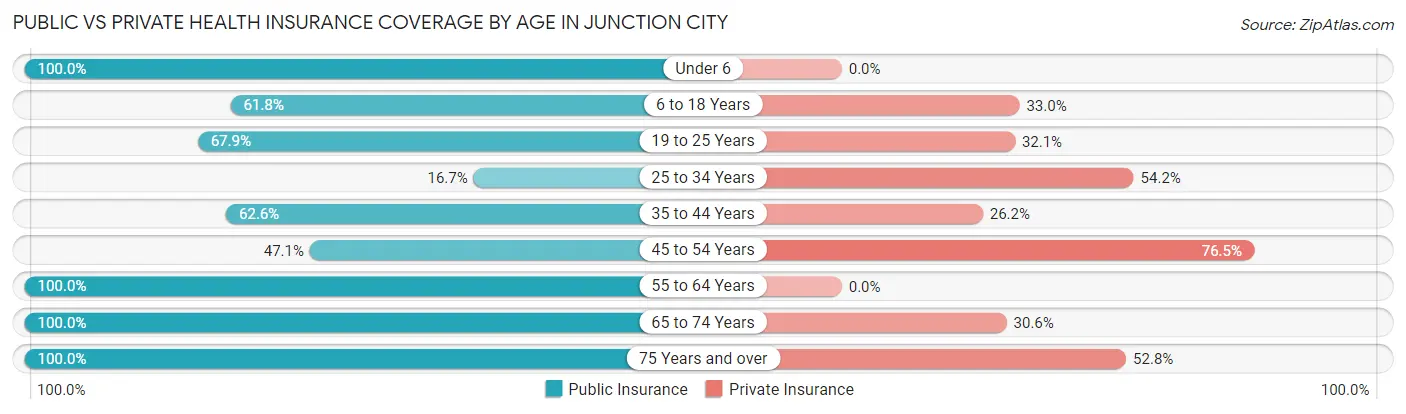
| Age Bracket | Public Insurance | Private Insurance |
| Under 6 | 17 (100.0%) | 0 (0.0%) |
| 6 to 18 Years | 118 (61.8%) | 63 (33.0%) |
| 19 to 25 Years | 19 (67.9%) | 9 (32.1%) |
| 25 to 34 Years | 4 (16.7%) | 13 (54.2%) |
| 35 to 44 Years | 67 (62.6%) | 28 (26.2%) |
| 45 to 54 Years | 8 (47.1%) | 13 (76.5%) |
| 55 to 64 Years | 51 (100.0%) | 0 (0.0%) |
| 65 to 74 Years | 85 (100.0%) | 26 (30.6%) |
| 75 Years and over | 36 (100.0%) | 19 (52.8%) |
| Total | 405 (72.8%) | 171 (30.8%) |
Disability Status by Sex by Age in Junction City
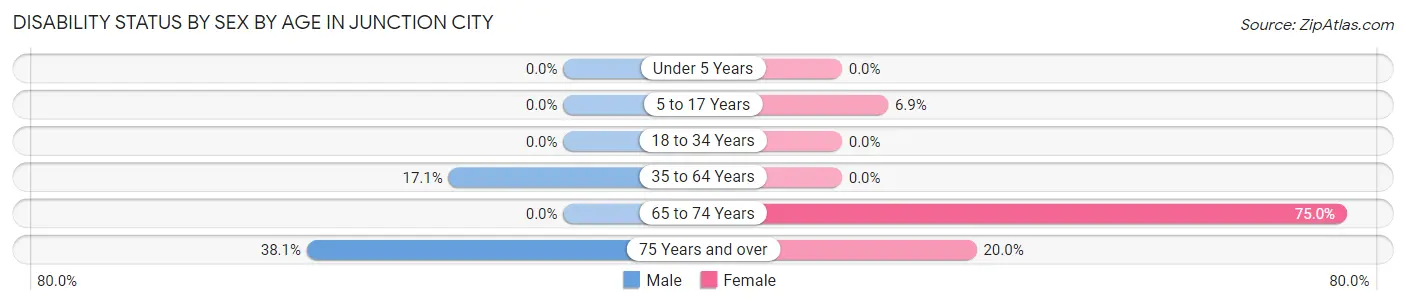
| Age Bracket | Male | Female |
| Under 5 Years | 0 (0.0%) | 0 (0.0%) |
| 5 to 17 Years | 0 (0.0%) | 7 (6.9%) |
| 18 to 34 Years | 0 (0.0%) | 0 (0.0%) |
| 35 to 64 Years | 15 (17.1%) | 0 (0.0%) |
| 65 to 74 Years | 0 (0.0%) | 54 (75.0%) |
| 75 Years and over | 8 (38.1%) | 3 (20.0%) |
Disability Class by Sex by Age in Junction City
Disability Class: Hearing Difficulty
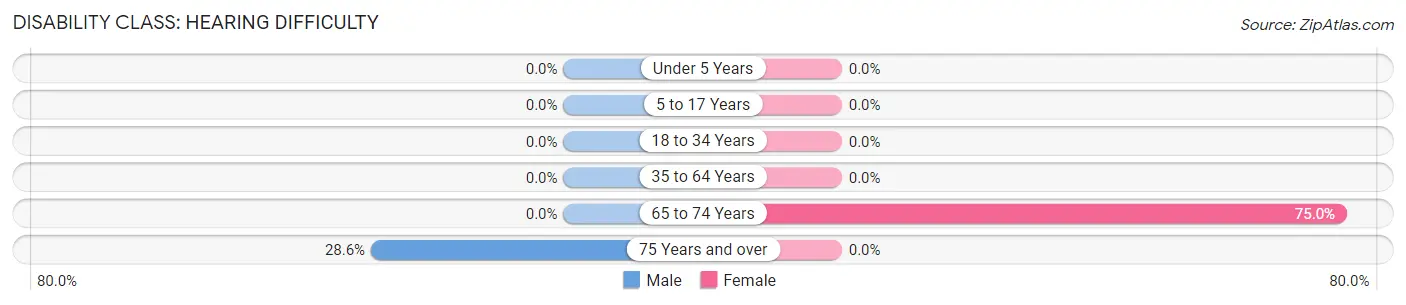
| Age Bracket | Male | Female |
| Under 5 Years | 0 (0.0%) | 0 (0.0%) |
| 5 to 17 Years | 0 (0.0%) | 0 (0.0%) |
| 18 to 34 Years | 0 (0.0%) | 0 (0.0%) |
| 35 to 64 Years | 0 (0.0%) | 0 (0.0%) |
| 65 to 74 Years | 0 (0.0%) | 54 (75.0%) |
| 75 Years and over | 6 (28.6%) | 0 (0.0%) |
Disability Class: Vision Difficulty
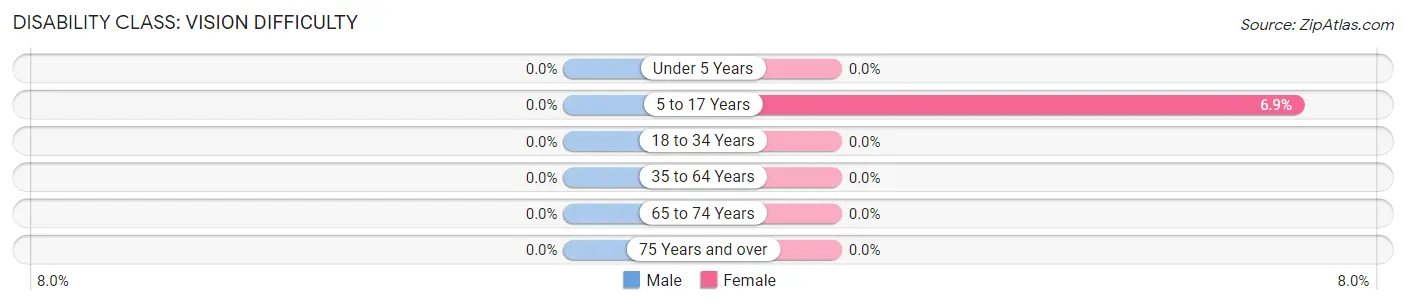
| Age Bracket | Male | Female |
| Under 5 Years | 0 (0.0%) | 0 (0.0%) |
| 5 to 17 Years | 0 (0.0%) | 7 (6.9%) |
| 18 to 34 Years | 0 (0.0%) | 0 (0.0%) |
| 35 to 64 Years | 0 (0.0%) | 0 (0.0%) |
| 65 to 74 Years | 0 (0.0%) | 0 (0.0%) |
| 75 Years and over | 0 (0.0%) | 0 (0.0%) |
Disability Class: Cognitive Difficulty
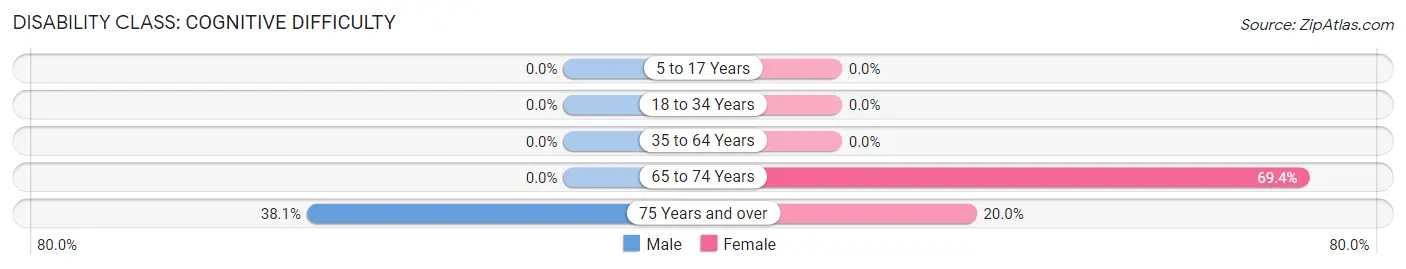
| Age Bracket | Male | Female |
| 5 to 17 Years | 0 (0.0%) | 0 (0.0%) |
| 18 to 34 Years | 0 (0.0%) | 0 (0.0%) |
| 35 to 64 Years | 0 (0.0%) | 0 (0.0%) |
| 65 to 74 Years | 0 (0.0%) | 50 (69.4%) |
| 75 Years and over | 8 (38.1%) | 3 (20.0%) |
Disability Class: Ambulatory Difficulty
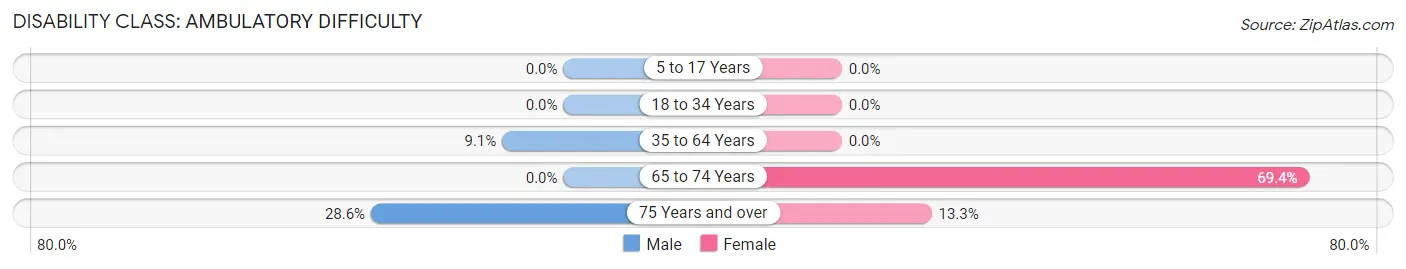
| Age Bracket | Male | Female |
| 5 to 17 Years | 0 (0.0%) | 0 (0.0%) |
| 18 to 34 Years | 0 (0.0%) | 0 (0.0%) |
| 35 to 64 Years | 8 (9.1%) | 0 (0.0%) |
| 65 to 74 Years | 0 (0.0%) | 50 (69.4%) |
| 75 Years and over | 6 (28.6%) | 2 (13.3%) |
Disability Class: Self-Care Difficulty
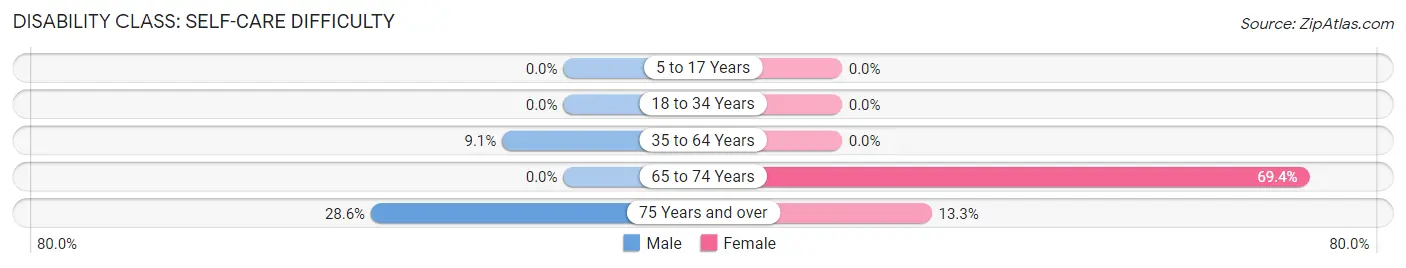
| Age Bracket | Male | Female |
| 5 to 17 Years | 0 (0.0%) | 0 (0.0%) |
| 18 to 34 Years | 0 (0.0%) | 0 (0.0%) |
| 35 to 64 Years | 8 (9.1%) | 0 (0.0%) |
| 65 to 74 Years | 0 (0.0%) | 50 (69.4%) |
| 75 Years and over | 6 (28.6%) | 2 (13.3%) |
Technology Access in Junction City
Computing Device Access in Junction City
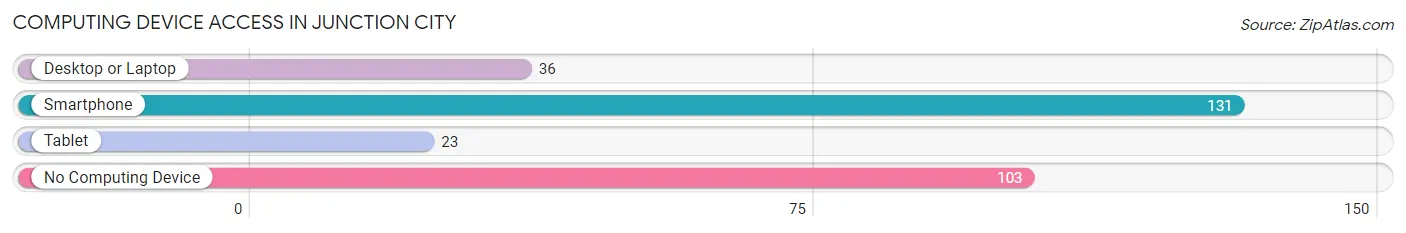
| Device Type | # Households | % Households |
| Desktop or Laptop | 36 | 14.7% |
| Smartphone | 131 | 53.7% |
| Tablet | 23 | 9.4% |
| No Computing Device | 103 | 42.2% |
| Total | 244 | 100.0% |
Internet Access in Junction City
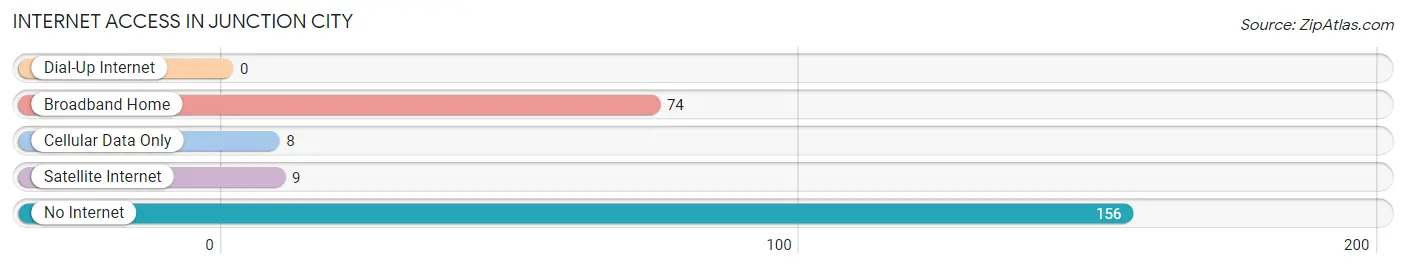
| Internet Type | # Households | % Households |
| Dial-Up Internet | 0 | 0.0% |
| Broadband Home | 74 | 30.3% |
| Cellular Data Only | 8 | 3.3% |
| Satellite Internet | 9 | 3.7% |
| No Internet | 156 | 63.9% |
| Total | 244 | 100.0% |
Junction City Summary
Junction City is a small town located in the state of Louisiana, in the United States. It is situated in the northern part of the state, in Union Parish, and is part of the Monroe Metropolitan Statistical Area. The town has a population of approximately 1,000 people, and is known for its rural charm and friendly atmosphere.
History
Junction City was founded in 1883 by a group of settlers from the nearby town of Farmerville. The town was named for its location at the junction of two railroads, the Vicksburg, Shreveport and Pacific Railroad and the Louisiana and Arkansas Railway. The town quickly grew, and by the early 1900s, it had become a thriving community with a population of over 1,000 people.
The town was home to a variety of businesses, including a sawmill, a cotton gin, a grist mill, and a general store. The town also had a school, a post office, and a number of churches.
In the early 1900s, Junction City was a popular destination for tourists, who came to enjoy the town’s rural charm and friendly atmosphere. The town was also known for its annual Fourth of July celebration, which included a parade, fireworks, and a carnival.
Geography
Junction City is located in the northern part of Louisiana, in Union Parish. The town is situated at the junction of two railroads, the Vicksburg, Shreveport and Pacific Railroad and the Louisiana and Arkansas Railway. The town is surrounded by rolling hills and farmland, and is located approximately 30 miles from the city of Monroe.
The climate in Junction City is humid subtropical, with hot, humid summers and mild winters. The average annual temperature is around 70 degrees Fahrenheit, and the average annual precipitation is around 50 inches.
Economy
The economy of Junction City is largely based on agriculture. The town is home to a number of farms, which produce a variety of crops, including cotton, soybeans, corn, and wheat. The town is also home to a number of small businesses, including a sawmill, a cotton gin, a grist mill, and a general store.
Demographics
As of the 2010 census, the population of Junction City was 1,000 people. The racial makeup of the town was 95.2% White, 2.2% African American, 0.7% Native American, 0.2% Asian, and 1.7% from other races. The median household income was $30,000, and the median family income was $35,000.
Conclusion
Junction City is a small town located in the northern part of Louisiana, in Union Parish. The town has a population of approximately 1,000 people, and is known for its rural charm and friendly atmosphere. The economy of Junction City is largely based on agriculture, and the town is home to a number of small businesses. The racial makeup of the town is predominantly White, with a small percentage of African American, Native American, and Asian residents.
Common Questions
What is Per Capita Income in Junction City?
Per Capita income in Junction City is $15,469.
What is the Median Family Income in Junction City?
Median Family Income in Junction City is $30,714.
What is Income or Wage Gap in Junction City?
Income or Wage Gap in Junction City is 73.1%.
Women in Junction City earn 26.9 cents for every dollar earned by a man.
What is Inequality or Gini Index in Junction City?
Inequality or Gini Index in Junction City is 0.49.
What is the Total Population of Junction City?
Total Population of Junction City is 556.
What is the Total Male Population of Junction City?
Total Male Population of Junction City is 239.
What is the Total Female Population of Junction City?
Total Female Population of Junction City is 317.
What is the Ratio of Males per 100 Females in Junction City?
There are 75.39 Males per 100 Females in Junction City.
What is the Ratio of Females per 100 Males in Junction City?
There are 132.64 Females per 100 Males in Junction City.
What is the Median Population Age in Junction City?
Median Population Age in Junction City is 36.6 Years.
What is the Average Family Size in Junction City
Average Family Size in Junction City is 4.2 People.
What is the Average Household Size in Junction City
Average Household Size in Junction City is 2.3 People.
How Large is the Labor Force in Junction City?
There are 140 People in the Labor Forcein in Junction City.
What is the Percentage of People in the Labor Force in Junction City?
37.0% of People are in the Labor Force in Junction City.