Zip Codes with the Highest Percentage of Families with Income Below $10,000 in Louisiana
RELATED REPORTS & OPTIONS
Family Income | $0-10k
Louisiana
Compare Zip Codes
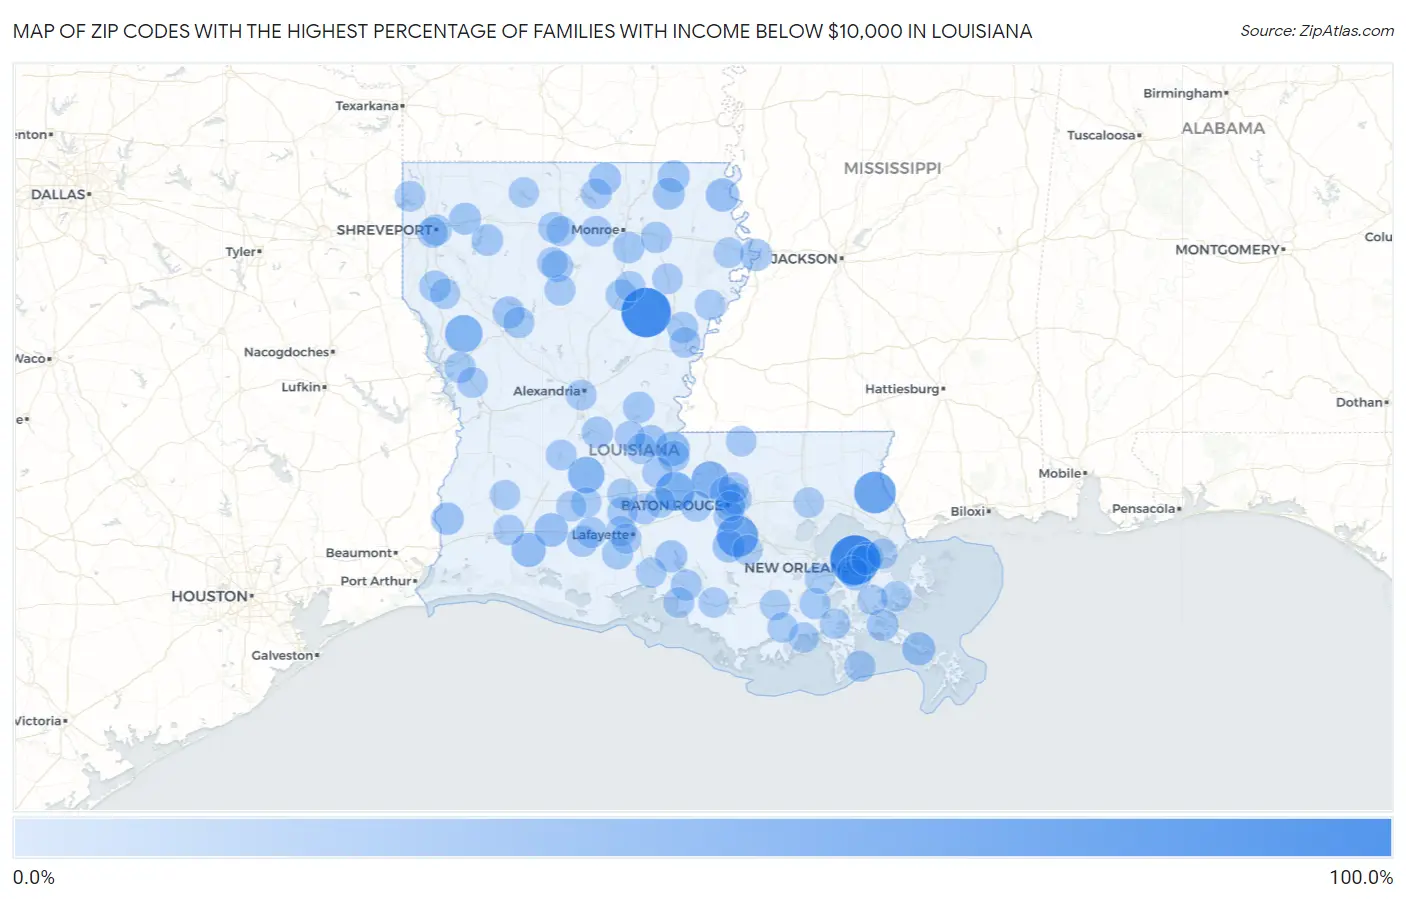
Map of Zip Codes with the Highest Percentage of Families with Income Below $10,000 in Louisiana
0.0%
100.0%
Zip Codes with the Highest Percentage of Families with Income Below $10,000 in Louisiana
| Zip Code | Families with Income < $10k | vs State | vs National | |
| 1. | 70148 | 100.0% | 4.9%(+95.1)#1 | 3.1%(+96.9)#3 |
| 2. | 71425 | 100.0% | 4.9%(+95.1)#2 | 3.1%(+96.9)#10 |
| 3. | 70464 | 61.9% | 4.9%(+57.0)#3 | 3.1%(+58.8)#37 |
| 4. | 70721 | 60.8% | 4.9%(+55.9)#4 | 3.1%(+57.7)#40 |
| 5. | 70756 | 48.2% | 4.9%(+43.3)#5 | 3.1%(+45.1)#72 |
| 6. | 71406 | 41.4% | 4.9%(+36.5)#6 | 3.1%(+38.3)#98 |
| 7. | 70736 | 41.0% | 4.9%(+36.1)#7 | 3.1%(+37.9)#101 |
| 8. | 70580 | 37.0% | 4.9%(+32.1)#8 | 3.1%(+33.9)#132 |
| 9. | 70747 | 26.9% | 4.9%(+22.0)#9 | 3.1%(+23.8)#253 |
| 10. | 70646 | 25.7% | 4.9%(+20.8)#10 | 3.1%(+22.6)#287 |
| 11. | 70581 | 23.8% | 4.9%(+18.9)#11 | 3.1%(+20.7)#341 |
| 12. | 71254 | 22.4% | 4.9%(+17.5)#12 | 3.1%(+19.3)#389 |
| 13. | 70041 | 21.4% | 4.9%(+16.5)#13 | 3.1%(+18.3)#421 |
| 14. | 70661 | 18.5% | 4.9%(+13.6)#14 | 3.1%(+15.4)#559 |
| 15. | 70788 | 18.4% | 4.9%(+13.5)#15 | 3.1%(+15.3)#563 |
| 16. | 71233 | 17.6% | 4.9%(+12.7)#16 | 3.1%(+14.5)#618 |
| 17. | 70552 | 16.7% | 4.9%(+11.8)#17 | 3.1%(+13.6)#689 |
| 18. | 71369 | 16.5% | 4.9%(+11.6)#18 | 3.1%(+13.4)#705 |
| 19. | 71260 | 16.4% | 4.9%(+11.5)#19 | 3.1%(+13.3)#714 |
| 20. | 71411 | 16.2% | 4.9%(+11.3)#20 | 3.1%(+13.1)#735 |
| 21. | 71223 | 16.0% | 4.9%(+11.1)#21 | 3.1%(+12.9)#750 |
| 22. | 71261 | 15.7% | 4.9%(+10.8)#22 | 3.1%(+12.6)#780 |
| 23. | 71067 | 15.6% | 4.9%(+10.7)#23 | 3.1%(+12.5)#789 |
| 24. | 70083 | 14.7% | 4.9%(+9.80)#24 | 3.1%(+11.6)#897 |
| 25. | 71351 | 14.3% | 4.9%(+9.40)#25 | 3.1%(+11.2)#929 |
| 26. | 71325 | 14.3% | 4.9%(+9.40)#26 | 3.1%(+11.2)#938 |
| 27. | 71039 | 14.0% | 4.9%(+9.10)#27 | 3.1%(+10.9)#970 |
| 28. | 70715 | 13.8% | 4.9%(+8.90)#28 | 3.1%(+10.7)#1,003 |
| 29. | 70128 | 13.5% | 4.9%(+8.60)#29 | 3.1%(+10.4)#1,044 |
| 30. | 71202 | 13.4% | 4.9%(+8.50)#30 | 3.1%(+10.3)#1,056 |
| 31. | 71269 | 12.8% | 4.9%(+7.90)#31 | 3.1%(+9.70)#1,154 |
| 32. | 71032 | 12.8% | 4.9%(+7.90)#32 | 3.1%(+9.70)#1,161 |
| 33. | 71251 | 12.5% | 4.9%(+7.60)#33 | 3.1%(+9.40)#1,219 |
| 34. | 71449 | 12.4% | 4.9%(+7.50)#34 | 3.1%(+9.30)#1,237 |
| 35. | 71414 | 12.3% | 4.9%(+7.40)#35 | 3.1%(+9.20)#1,273 |
| 36. | 71435 | 12.1% | 4.9%(+7.20)#36 | 3.1%(+9.00)#1,301 |
| 37. | 70534 | 12.1% | 4.9%(+7.20)#37 | 3.1%(+9.00)#1,308 |
| 38. | 70555 | 12.0% | 4.9%(+7.10)#38 | 3.1%(+8.90)#1,324 |
| 39. | 71326 | 12.0% | 4.9%(+7.10)#39 | 3.1%(+8.90)#1,332 |
| 40. | 71245 | 11.9% | 4.9%(+7.00)#40 | 3.1%(+8.80)#1,349 |
| 41. | 71422 | 11.6% | 4.9%(+6.70)#41 | 3.1%(+8.50)#1,424 |
| 42. | 70358 | 11.6% | 4.9%(+6.70)#42 | 3.1%(+8.50)#1,429 |
| 43. | 70805 | 11.5% | 4.9%(+6.60)#43 | 3.1%(+8.40)#1,444 |
| 44. | 70126 | 11.4% | 4.9%(+6.50)#44 | 3.1%(+8.30)#1,471 |
| 45. | 70812 | 11.3% | 4.9%(+6.40)#45 | 3.1%(+8.20)#1,501 |
| 46. | 71101 | 11.3% | 4.9%(+6.40)#46 | 3.1%(+8.20)#1,507 |
| 47. | 70514 | 11.3% | 4.9%(+6.40)#47 | 3.1%(+8.20)#1,511 |
| 48. | 70526 | 11.2% | 4.9%(+6.30)#48 | 3.1%(+8.10)#1,529 |
| 49. | 70807 | 11.2% | 4.9%(+6.30)#49 | 3.1%(+8.10)#1,531 |
| 50. | 70053 | 11.1% | 4.9%(+6.20)#50 | 3.1%(+8.00)#1,556 |
| 51. | 70355 | 11.1% | 4.9%(+6.20)#51 | 3.1%(+8.00)#1,568 |
| 52. | 70113 | 10.9% | 4.9%(+6.00)#52 | 3.1%(+7.80)#1,617 |
| 53. | 70772 | 10.8% | 4.9%(+5.90)#53 | 3.1%(+7.70)#1,665 |
| 54. | 71225 | 10.5% | 4.9%(+5.60)#54 | 3.1%(+7.40)#1,741 |
| 55. | 70538 | 10.4% | 4.9%(+5.50)#55 | 3.1%(+7.30)#1,778 |
| 56. | 71241 | 10.3% | 4.9%(+5.40)#56 | 3.1%(+7.20)#1,801 |
| 57. | 70512 | 10.2% | 4.9%(+5.30)#57 | 3.1%(+7.10)#1,837 |
| 58. | 71463 | 10.1% | 4.9%(+5.20)#58 | 3.1%(+7.00)#1,873 |
| 59. | 70584 | 10.1% | 4.9%(+5.20)#59 | 3.1%(+7.00)#1,874 |
| 60. | 71429 | 10.1% | 4.9%(+5.20)#60 | 3.1%(+7.00)#1,880 |
| 61. | 71061 | 10.0% | 4.9%(+5.10)#61 | 3.1%(+6.90)#1,921 |
| 62. | 71327 | 9.8% | 4.9%(+4.90)#62 | 3.1%(+6.70)#1,998 |
| 63. | 71353 | 9.7% | 4.9%(+4.80)#63 | 3.1%(+6.60)#2,051 |
| 64. | 70820 | 9.6% | 4.9%(+4.70)#64 | 3.1%(+6.50)#2,070 |
| 65. | 71247 | 9.6% | 4.9%(+4.70)#65 | 3.1%(+6.50)#2,089 |
| 66. | 71301 | 9.5% | 4.9%(+4.60)#66 | 3.1%(+6.40)#2,109 |
| 67. | 71295 | 9.3% | 4.9%(+4.40)#67 | 3.1%(+6.20)#2,197 |
| 68. | 70789 | 9.3% | 4.9%(+4.40)#68 | 3.1%(+6.20)#2,227 |
| 69. | 70615 | 9.2% | 4.9%(+4.30)#69 | 3.1%(+6.10)#2,253 |
| 70. | 70583 | 9.2% | 4.9%(+4.30)#70 | 3.1%(+6.10)#2,256 |
| 71. | 70085 | 9.2% | 4.9%(+4.30)#71 | 3.1%(+6.10)#2,261 |
| 72. | 70570 | 9.1% | 4.9%(+4.20)#72 | 3.1%(+6.00)#2,292 |
| 73. | 70714 | 9.0% | 4.9%(+4.10)#73 | 3.1%(+5.90)#2,361 |
| 74. | 71334 | 9.0% | 4.9%(+4.10)#74 | 3.1%(+5.90)#2,368 |
| 75. | 71052 | 8.9% | 4.9%(+4.00)#75 | 3.1%(+5.80)#2,411 |
| 76. | 71103 | 8.9% | 4.9%(+4.00)#76 | 3.1%(+5.80)#2,414 |
| 77. | 71362 | 8.9% | 4.9%(+4.00)#77 | 3.1%(+5.80)#2,425 |
| 78. | 71366 | 8.9% | 4.9%(+4.00)#78 | 3.1%(+5.80)#2,429 |
| 79. | 70750 | 8.8% | 4.9%(+3.90)#79 | 3.1%(+5.70)#2,480 |
| 80. | 70127 | 8.7% | 4.9%(+3.80)#80 | 3.1%(+5.60)#2,508 |
| 81. | 71282 | 8.7% | 4.9%(+3.80)#81 | 3.1%(+5.60)#2,515 |
| 82. | 70392 | 8.7% | 4.9%(+3.80)#82 | 3.1%(+5.60)#2,518 |
| 83. | 71040 | 8.7% | 4.9%(+3.80)#83 | 3.1%(+5.60)#2,520 |
| 84. | 70039 | 8.7% | 4.9%(+3.80)#84 | 3.1%(+5.60)#2,533 |
| 85. | 70535 | 8.6% | 4.9%(+3.70)#85 | 3.1%(+5.50)#2,570 |
| 86. | 70657 | 8.5% | 4.9%(+3.60)#86 | 3.1%(+5.40)#2,650 |
| 87. | 70515 | 8.5% | 4.9%(+3.60)#87 | 3.1%(+5.40)#2,653 |
| 88. | 70506 | 8.4% | 4.9%(+3.50)#88 | 3.1%(+5.30)#2,703 |
| 89. | 70403 | 8.4% | 4.9%(+3.50)#89 | 3.1%(+5.30)#2,709 |
| 90. | 70129 | 8.4% | 4.9%(+3.50)#90 | 3.1%(+5.30)#2,725 |
| 91. | 71418 | 8.4% | 4.9%(+3.50)#91 | 3.1%(+5.30)#2,730 |
| 92. | 70560 | 8.3% | 4.9%(+3.40)#92 | 3.1%(+5.20)#2,764 |
| 93. | 70802 | 8.3% | 4.9%(+3.40)#93 | 3.1%(+5.20)#2,769 |
| 94. | 70359 | 8.3% | 4.9%(+3.40)#94 | 3.1%(+5.20)#2,779 |
| 95. | 70345 | 8.3% | 4.9%(+3.40)#95 | 3.1%(+5.20)#2,782 |
| 96. | 70040 | 8.2% | 4.9%(+3.30)#96 | 3.1%(+5.10)#2,884 |
| 97. | 70363 | 8.1% | 4.9%(+3.20)#97 | 3.1%(+5.00)#2,904 |
| 98. | 70346 | 8.1% | 4.9%(+3.20)#98 | 3.1%(+5.00)#2,917 |
| 99. | 70377 | 8.1% | 4.9%(+3.20)#99 | 3.1%(+5.00)#2,920 |
| 100. | 71270 | 8.0% | 4.9%(+3.10)#100 | 3.1%(+4.90)#2,950 |
Common Questions
What are the Top 10 Zip Codes with the Highest Percentage of Families with Income Below $10,000 in Louisiana?
Top 10 Zip Codes with the Highest Percentage of Families with Income Below $10,000 in Louisiana are:
What zip code has the Highest Percentage of Families with Income Below $10,000 in Louisiana?
70148 has the Highest Percentage of Families with Income Below $10,000 in Louisiana with 100.0%.
What is the Percentage of Families with Income Below $10,000 in the State of Louisiana?
Percentage of Families with Income Below $10,000 in Louisiana is 4.9%.
What is the Percentage of Families with Income Below $10,000 in the United States?
Percentage of Families with Income Below $10,000 in the United States is 3.1%.