Estherwood, LA Map & Demographics
Estherwood Map
Estherwood Overview
$23,849
PER CAPITA INCOME
$60,147
AVG FAMILY INCOME
$46,000
AVG HOUSEHOLD INCOME
71.1%
WAGE / INCOME GAP [ % ]
28.9¢/ $1
WAGE / INCOME GAP [ $ ]
0.53
INEQUALITY / GINI INDEX
737
TOTAL POPULATION
378
MALE POPULATION
359
FEMALE POPULATION
105.29
MALES / 100 FEMALES
94.97
FEMALES / 100 MALES
31.5
MEDIAN AGE
3.6
AVG FAMILY SIZE
3.0
AVG HOUSEHOLD SIZE
277
LABOR FORCE [ PEOPLE ]
51.2%
PERCENT IN LABOR FORCE
19.9%
UNEMPLOYMENT RATE
Estherwood Zip Codes
Estherwood Area Codes
Income in Estherwood
Income Overview in Estherwood
Per Capita Income in Estherwood is $23,849, while median incomes of families and households are $60,147 and $46,000 respectively.
| Characteristic | Number | Measure |
| Per Capita Income | 737 | $23,849 |
| Median Family Income | 174 | $60,147 |
| Mean Family Income | 174 | $62,378 |
| Median Household Income | 242 | $46,000 |
| Mean Household Income | 242 | $65,696 |
| Income Deficit | 174 | $0 |
| Wage / Income Gap (%) | 737 | 71.06% |
| Wage / Income Gap ($) | 737 | 28.94¢ per $1 |
| Gini / Inequality Index | 737 | 0.53 |
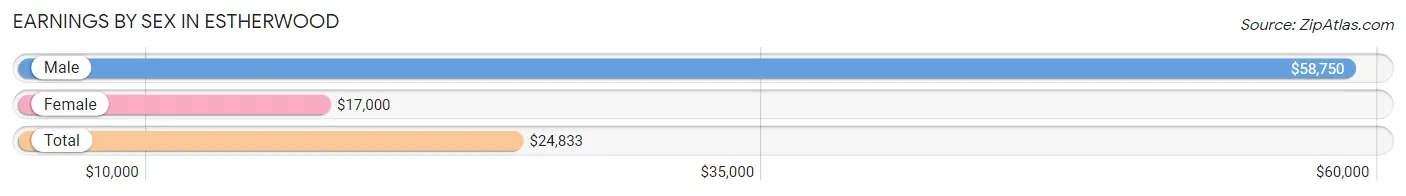
Earnings by Sex in Estherwood
Average Earnings in Estherwood are $24,833, $58,750 for men and $17,000 for women, a difference of 71.1%.
| Sex | Number | Average Earnings |
| Male | 136 (51.5%) | $58,750 |
| Female | 128 (48.5%) | $17,000 |
| Total | 264 (100.0%) | $24,833 |
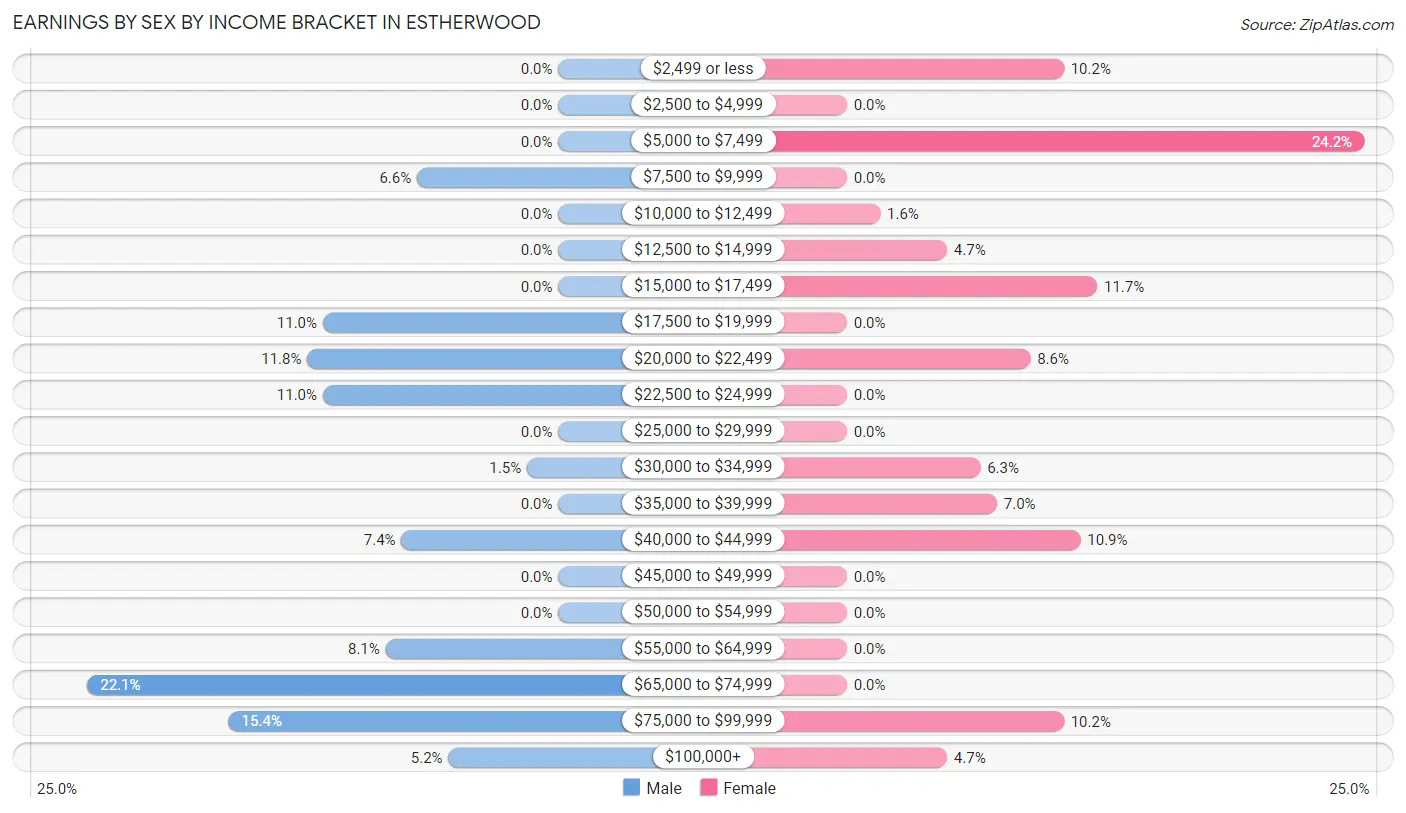
Earnings by Sex by Income Bracket in Estherwood
The most common earnings brackets in Estherwood are $65,000 to $74,999 for men (30 | 22.1%) and $5,000 to $7,499 for women (31 | 24.2%).
| Income | Male | Female |
| $2,499 or less | 0 (0.0%) | 13 (10.2%) |
| $2,500 to $4,999 | 0 (0.0%) | 0 (0.0%) |
| $5,000 to $7,499 | 0 (0.0%) | 31 (24.2%) |
| $7,500 to $9,999 | 9 (6.6%) | 0 (0.0%) |
| $10,000 to $12,499 | 0 (0.0%) | 2 (1.6%) |
| $12,500 to $14,999 | 0 (0.0%) | 6 (4.7%) |
| $15,000 to $17,499 | 0 (0.0%) | 15 (11.7%) |
| $17,500 to $19,999 | 15 (11.0%) | 0 (0.0%) |
| $20,000 to $22,499 | 16 (11.8%) | 11 (8.6%) |
| $22,500 to $24,999 | 15 (11.0%) | 0 (0.0%) |
| $25,000 to $29,999 | 0 (0.0%) | 0 (0.0%) |
| $30,000 to $34,999 | 2 (1.5%) | 8 (6.2%) |
| $35,000 to $39,999 | 0 (0.0%) | 9 (7.0%) |
| $40,000 to $44,999 | 10 (7.3%) | 14 (10.9%) |
| $45,000 to $49,999 | 0 (0.0%) | 0 (0.0%) |
| $50,000 to $54,999 | 0 (0.0%) | 0 (0.0%) |
| $55,000 to $64,999 | 11 (8.1%) | 0 (0.0%) |
| $65,000 to $74,999 | 30 (22.1%) | 0 (0.0%) |
| $75,000 to $99,999 | 21 (15.4%) | 13 (10.2%) |
| $100,000+ | 7 (5.1%) | 6 (4.7%) |
| Total | 136 (100.0%) | 128 (100.0%) |
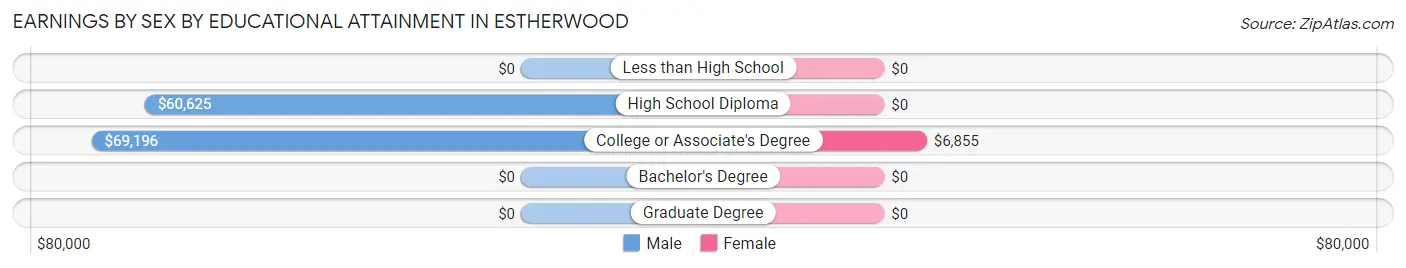
Earnings by Sex by Educational Attainment in Estherwood
Average earnings in Estherwood are $62,250 for men and $20,341 for women, a difference of 67.3%. Men with an educational attainment of college or associate's degree enjoy the highest average annual earnings of $69,196, while those with high school diploma education earn the least with $60,625. Women with an educational attainment of college or associate's degree earn the most with the average annual earnings of $6,855, while those with college or associate's degree education have the smallest earnings of $6,855.
| Educational Attainment | Male Income | Female Income |
| Less than High School | - | - |
| High School Diploma | $60,625 | $0 |
| College or Associate's Degree | $69,196 | $6,855 |
| Bachelor's Degree | - | - |
| Graduate Degree | - | - |
| Total | $62,250 | $20,341 |
Family Income in Estherwood
Family Income Brackets in Estherwood
According to the Estherwood family income data, there are 45 families falling into the $15,000 to $24,999 income range, which is the most common income bracket and makes up 25.9% of all families.
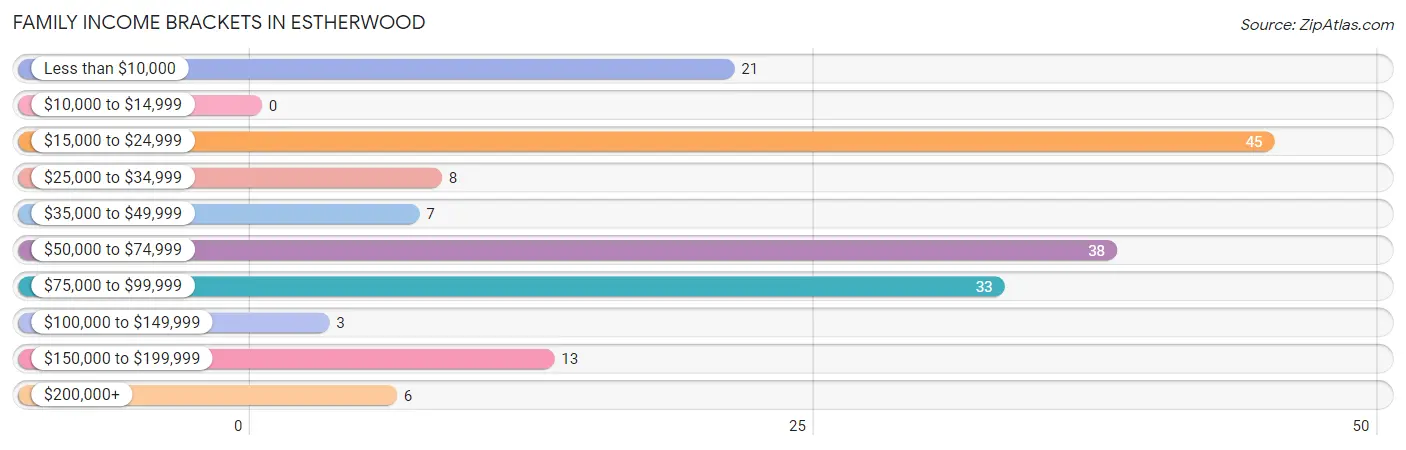
| Income Bracket | # Families | % Families |
| Less than $10,000 | 21 | 12.1% |
| $10,000 to $14,999 | 0 | 0.0% |
| $15,000 to $24,999 | 45 | 25.9% |
| $25,000 to $34,999 | 8 | 4.6% |
| $35,000 to $49,999 | 7 | 4.0% |
| $50,000 to $74,999 | 38 | 21.8% |
| $75,000 to $99,999 | 33 | 19.0% |
| $100,000 to $149,999 | 3 | 1.7% |
| $150,000 to $199,999 | 13 | 7.5% |
| $200,000+ | 6 | 3.4% |
Family Income by Famaliy Size in Estherwood
2-person families (85 | 48.8%) account for the highest median family income in Estherwood with $60,221 per family, while 2-person families (85 | 48.8%) have the highest median income of $30,110 per family member.
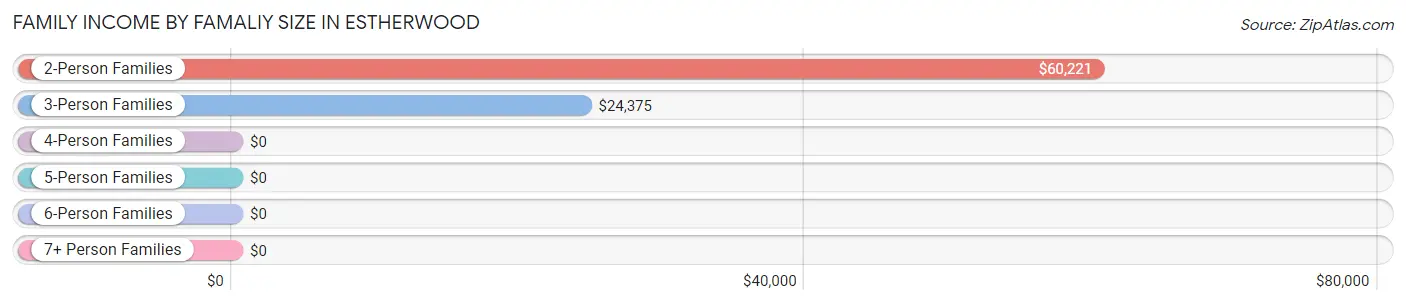
| Income Bracket | # Families | Median Income |
| 2-Person Families | 85 (48.8%) | $60,221 |
| 3-Person Families | 52 (29.9%) | $24,375 |
| 4-Person Families | 19 (10.9%) | $0 |
| 5-Person Families | 3 (1.7%) | $0 |
| 6-Person Families | 4 (2.3%) | $0 |
| 7+ Person Families | 11 (6.3%) | $0 |
| Total | 174 (100.0%) | $60,147 |
Family Income by Number of Earners in Estherwood
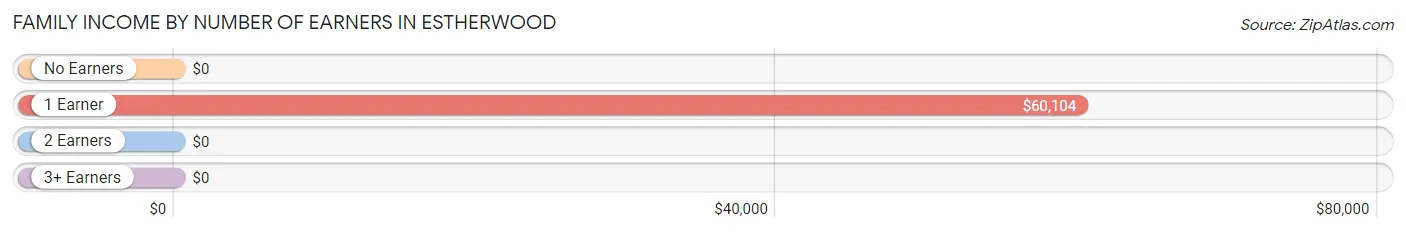
| Number of Earners | # Families | Median Income |
| No Earners | 35 (20.1%) | $0 |
| 1 Earner | 101 (58.1%) | $60,104 |
| 2 Earners | 32 (18.4%) | $0 |
| 3+ Earners | 6 (3.5%) | $0 |
| Total | 174 (100.0%) | $60,147 |
Household Income in Estherwood
Household Income Brackets in Estherwood
With 50 households falling in the category, the $15,000 to $24,999 income range is the most frequent in Estherwood, accounting for 20.7% of all households. In contrast, only 3 households (1.2%) fall into the $100,000 to $149,999 income bracket, making it the least populous group.
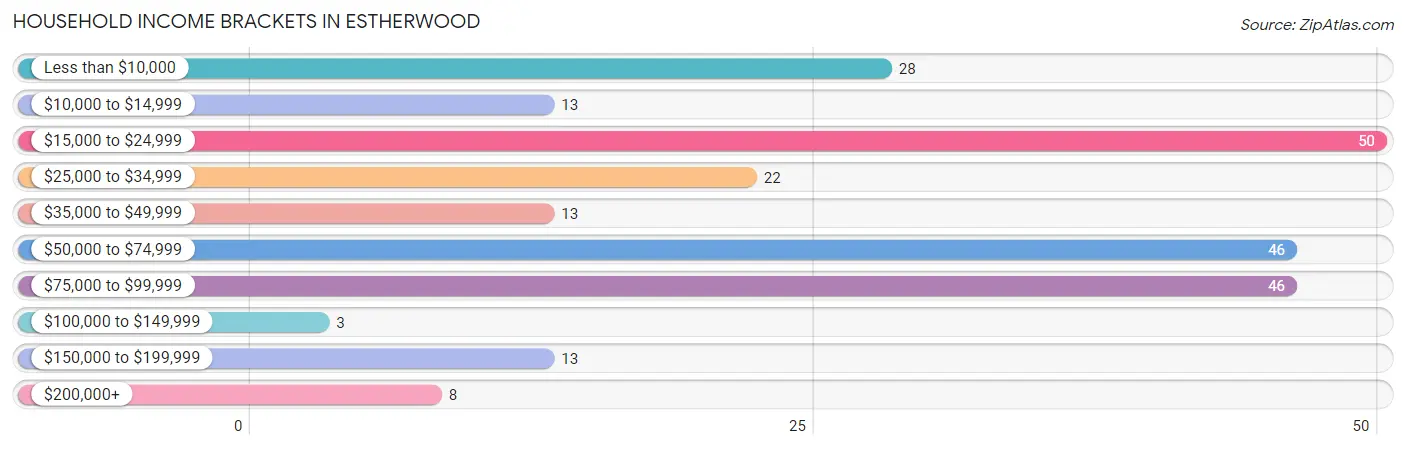
| Income Bracket | # Households | % Households |
| Less than $10,000 | 28 | 11.6% |
| $10,000 to $14,999 | 13 | 5.4% |
| $15,000 to $24,999 | 50 | 20.7% |
| $25,000 to $34,999 | 22 | 9.1% |
| $35,000 to $49,999 | 13 | 5.4% |
| $50,000 to $74,999 | 46 | 19.0% |
| $75,000 to $99,999 | 46 | 19.0% |
| $100,000 to $149,999 | 3 | 1.2% |
| $150,000 to $199,999 | 13 | 5.4% |
| $200,000+ | 8 | 3.3% |
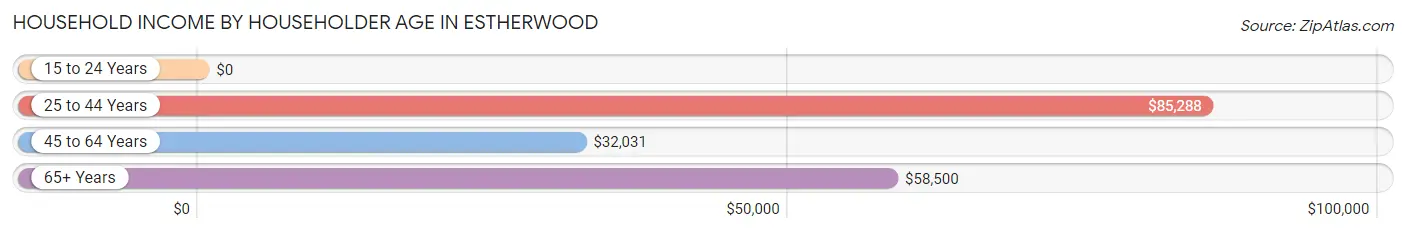
Household Income by Householder Age in Estherwood
The median household income in Estherwood is $46,000, with the highest median household income of $85,288 found in the 25 to 44 years age bracket for the primary householder. A total of 63 households (26.0%) fall into this category. Meanwhile, the 15 to 24 years age bracket for the primary householder has the lowest median household income of $0, with 6 households (2.5%) in this group.
| Income Bracket | # Households | Median Income |
| 15 to 24 Years | 6 (2.5%) | $0 |
| 25 to 44 Years | 63 (26.0%) | $85,288 |
| 45 to 64 Years | 111 (45.9%) | $32,031 |
| 65+ Years | 62 (25.6%) | $58,500 |
| Total | 242 (100.0%) | $46,000 |
Poverty in Estherwood
Income Below Poverty by Sex and Age in Estherwood
With 13.0% poverty level for males and 26.5% for females among the residents of Estherwood, 45 to 54 year old males and 12 to 14 year old females are the most vulnerable to poverty, with 10 males (62.5%) and 8 females (100.0%) in their respective age groups living below the poverty level.
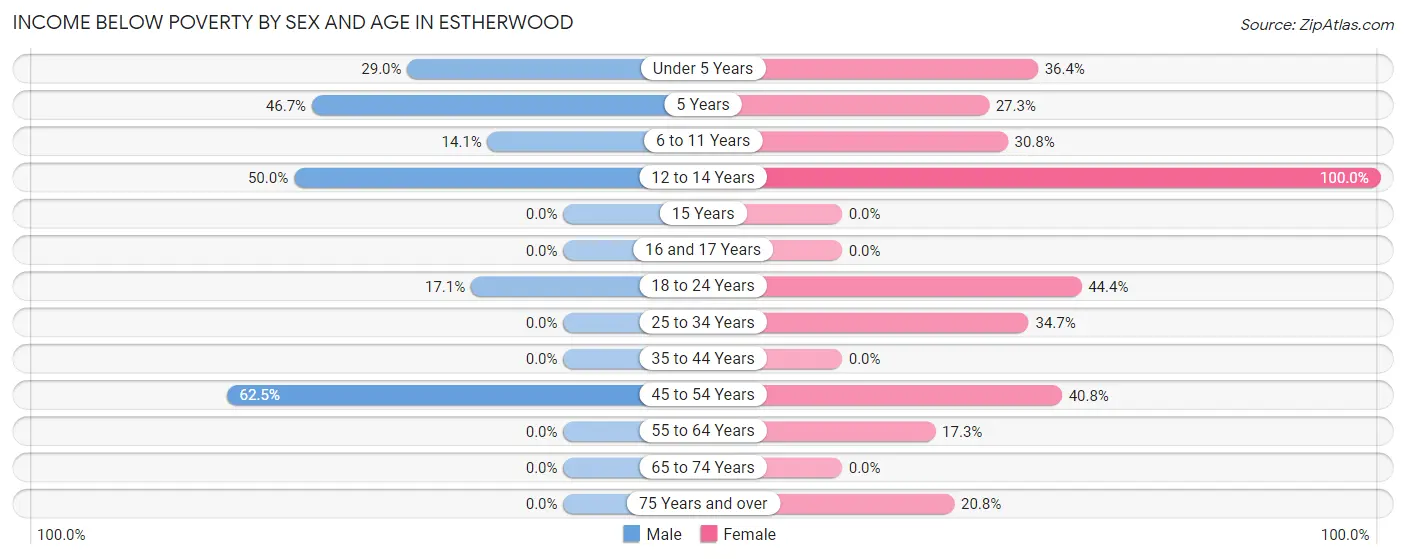
| Age Bracket | Male | Female |
| Under 5 Years | 11 (28.9%) | 8 (36.4%) |
| 5 Years | 7 (46.7%) | 3 (27.3%) |
| 6 to 11 Years | 9 (14.1%) | 8 (30.8%) |
| 12 to 14 Years | 6 (50.0%) | 8 (100.0%) |
| 15 Years | 0 (0.0%) | 0 (0.0%) |
| 16 and 17 Years | 0 (0.0%) | 0 (0.0%) |
| 18 to 24 Years | 6 (17.1%) | 4 (44.4%) |
| 25 to 34 Years | 0 (0.0%) | 26 (34.7%) |
| 35 to 44 Years | 0 (0.0%) | 0 (0.0%) |
| 45 to 54 Years | 10 (62.5%) | 20 (40.8%) |
| 55 to 64 Years | 0 (0.0%) | 13 (17.3%) |
| 65 to 74 Years | 0 (0.0%) | 0 (0.0%) |
| 75 Years and over | 0 (0.0%) | 5 (20.8%) |
| Total | 49 (13.0%) | 95 (26.5%) |
Income Above Poverty by Sex and Age in Estherwood
According to the poverty statistics in Estherwood, males aged 16 and 17 years and females aged 35 to 44 years are the age groups that are most secure financially, with 100.0% of males and 100.0% of females in these age groups living above the poverty line.
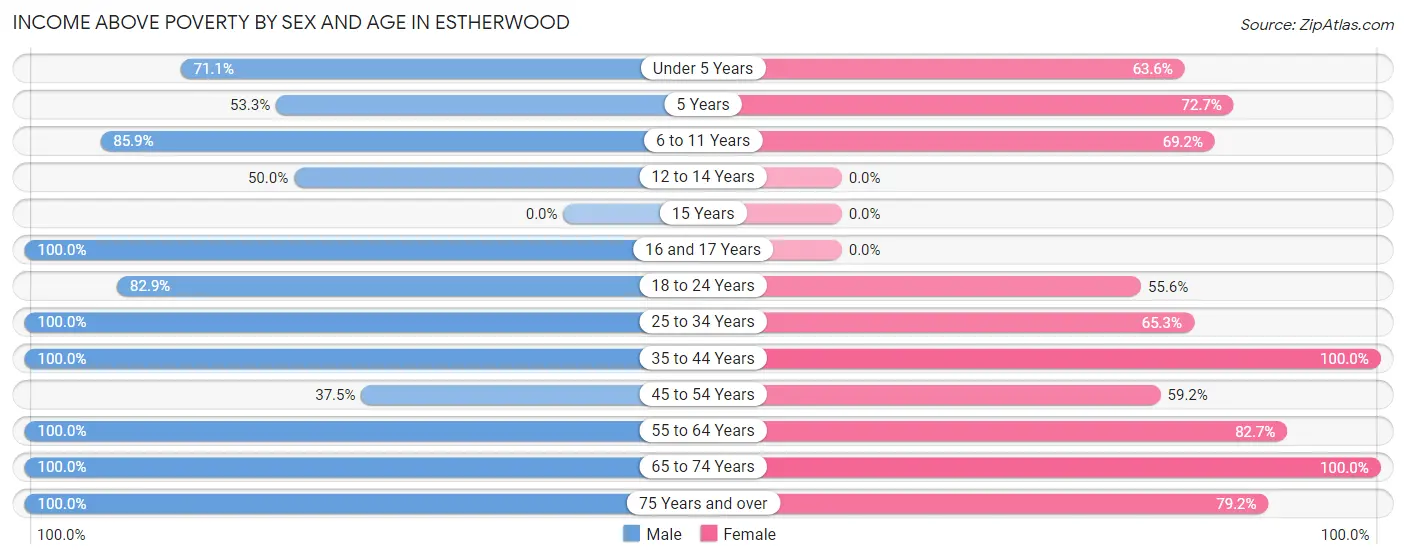
| Age Bracket | Male | Female |
| Under 5 Years | 27 (71.1%) | 14 (63.6%) |
| 5 Years | 8 (53.3%) | 8 (72.7%) |
| 6 to 11 Years | 55 (85.9%) | 18 (69.2%) |
| 12 to 14 Years | 6 (50.0%) | 0 (0.0%) |
| 15 Years | 0 (0.0%) | 0 (0.0%) |
| 16 and 17 Years | 6 (100.0%) | 0 (0.0%) |
| 18 to 24 Years | 29 (82.9%) | 5 (55.6%) |
| 25 to 34 Years | 59 (100.0%) | 49 (65.3%) |
| 35 to 44 Years | 15 (100.0%) | 27 (100.0%) |
| 45 to 54 Years | 6 (37.5%) | 29 (59.2%) |
| 55 to 64 Years | 63 (100.0%) | 62 (82.7%) |
| 65 to 74 Years | 36 (100.0%) | 33 (100.0%) |
| 75 Years and over | 19 (100.0%) | 19 (79.2%) |
| Total | 329 (87.0%) | 264 (73.5%) |
Income Below Poverty Among Married-Couple Families in Estherwood
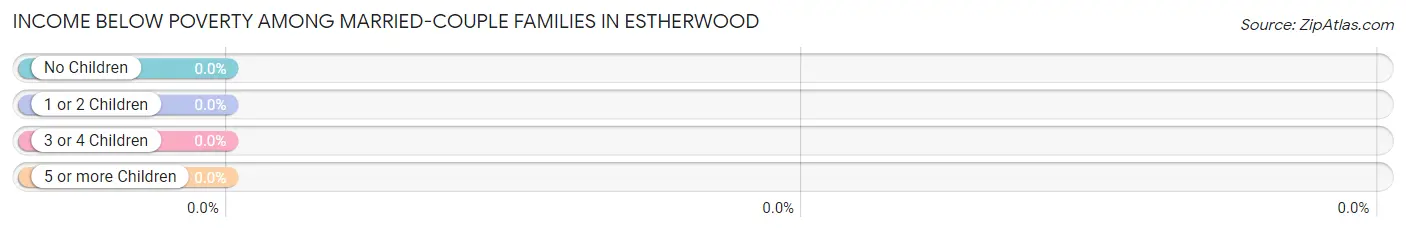
| Children | Above Poverty | Below Poverty |
| No Children | 62 (100.0%) | 0 (0.0%) |
| 1 or 2 Children | 22 (100.0%) | 0 (0.0%) |
| 3 or 4 Children | 15 (100.0%) | 0 (0.0%) |
| 5 or more Children | 0 (0.0%) | 0 (0.0%) |
| Total | 99 (100.0%) | 0 (0.0%) |
Income Below Poverty Among Single-Parent Households in Estherwood
According to the poverty data in Estherwood, 62.5% or 10 single-father households and 54.2% or 32 single-mother households are living below the poverty line. Among single-father households, those with 1 or 2 children have the highest poverty rate, with 6 households (100.0%) experiencing poverty. Likewise, among single-mother households, those with 1 or 2 children have the highest poverty rate, with 29 households (100.0%) falling below the poverty line.
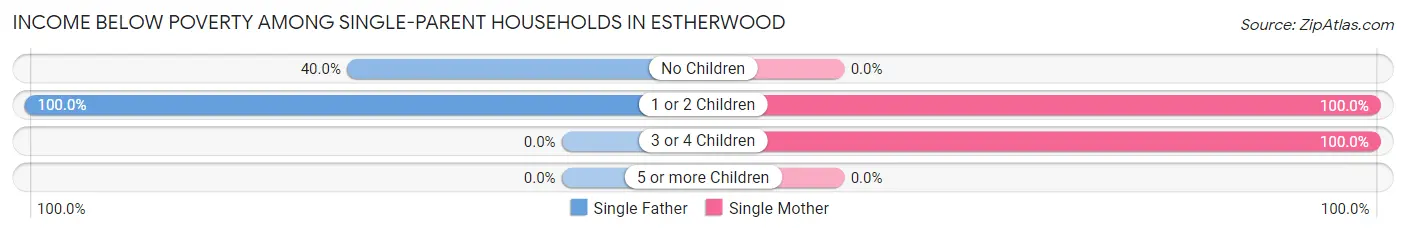
| Children | Single Father | Single Mother |
| No Children | 4 (40.0%) | 0 (0.0%) |
| 1 or 2 Children | 6 (100.0%) | 29 (100.0%) |
| 3 or 4 Children | 0 (0.0%) | 3 (100.0%) |
| 5 or more Children | 0 (0.0%) | 0 (0.0%) |
| Total | 10 (62.5%) | 32 (54.2%) |
Income Below Poverty Among Married-Couple vs Single-Parent Households in Estherwood
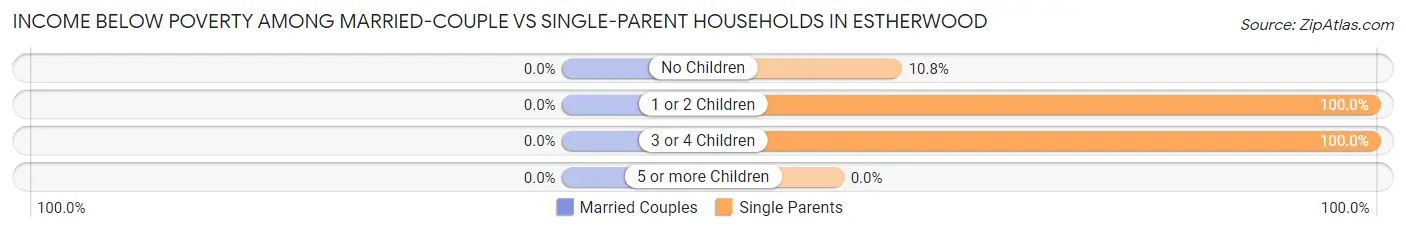
| Children | Married-Couple Families | Single-Parent Households |
| No Children | 0 (0.0%) | 4 (10.8%) |
| 1 or 2 Children | 0 (0.0%) | 35 (100.0%) |
| 3 or 4 Children | 0 (0.0%) | 3 (100.0%) |
| 5 or more Children | 0 (0.0%) | 0 (0.0%) |
| Total | 0 (0.0%) | 42 (56.0%) |
Race in Estherwood
The most populous races in Estherwood are White / Caucasian (713 | 96.7%), Two or more Races (20 | 2.7%), and Hispanic or Latino (16 | 2.2%).
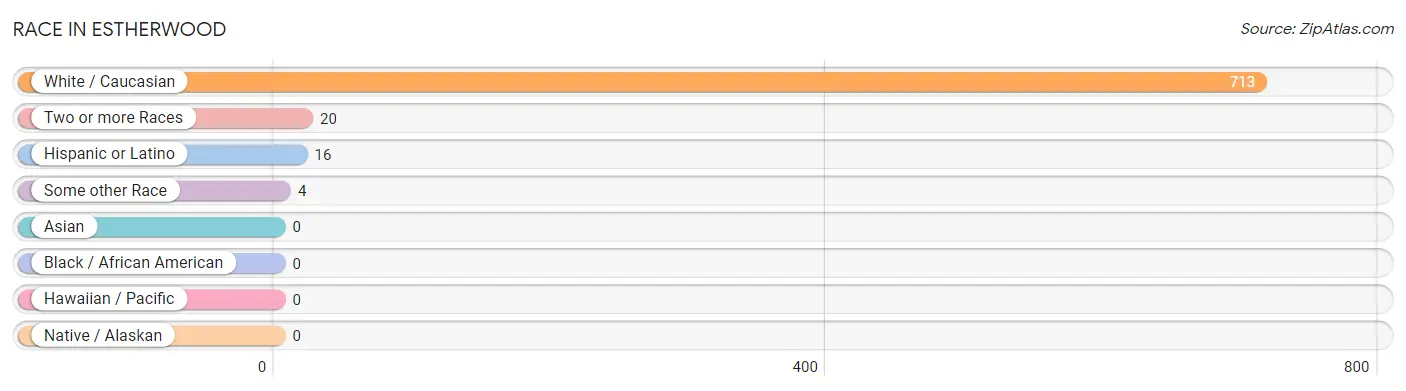
| Race | # Population | % Population |
| Asian | 0 | 0.0% |
| Black / African American | 0 | 0.0% |
| Hawaiian / Pacific | 0 | 0.0% |
| Hispanic or Latino | 16 | 2.2% |
| Native / Alaskan | 0 | 0.0% |
| White / Caucasian | 713 | 96.7% |
| Two or more Races | 20 | 2.7% |
| Some other Race | 4 | 0.5% |
| Total | 737 | 100.0% |
Ancestry in Estherwood
The most populous ancestries reported in Estherwood are French (379 | 51.4%), French Canadian (172 | 23.3%), English (80 | 10.8%), Irish (50 | 6.8%), and German (32 | 4.3%), together accounting for 96.7% of all Estherwood residents.
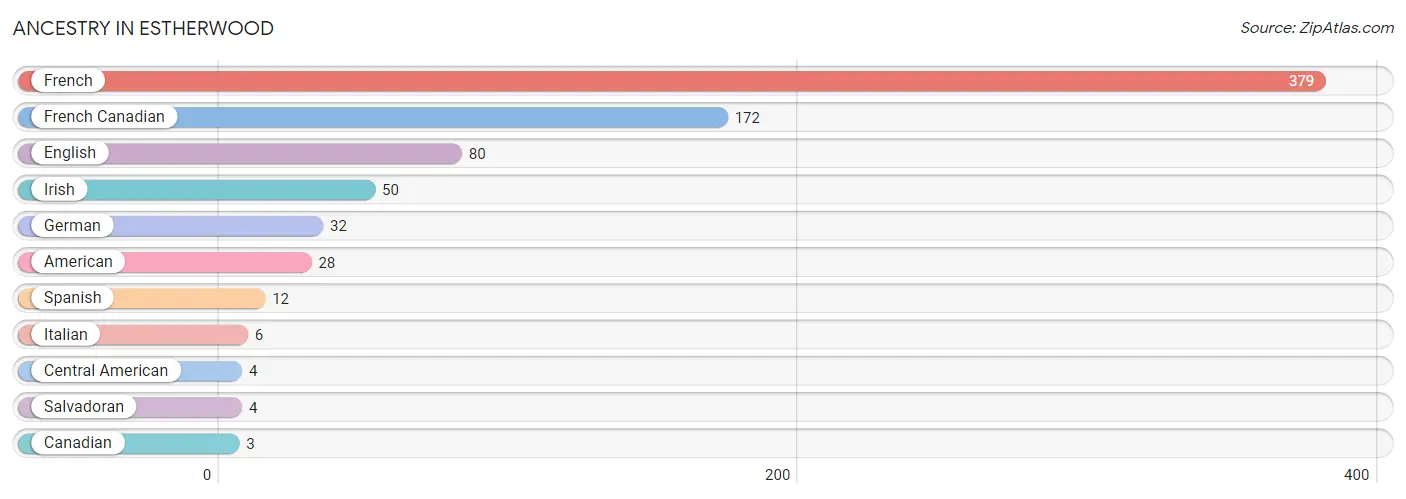
| Ancestry | # Population | % Population |
| American | 28 | 3.8% |
| Canadian | 3 | 0.4% |
| Central American | 4 | 0.5% |
| English | 80 | 10.8% |
| French | 379 | 51.4% |
| French Canadian | 172 | 23.3% |
| German | 32 | 4.3% |
| Irish | 50 | 6.8% |
| Italian | 6 | 0.8% |
| Salvadoran | 4 | 0.5% |
| Spanish | 12 | 1.6% | View All 11 Rows |
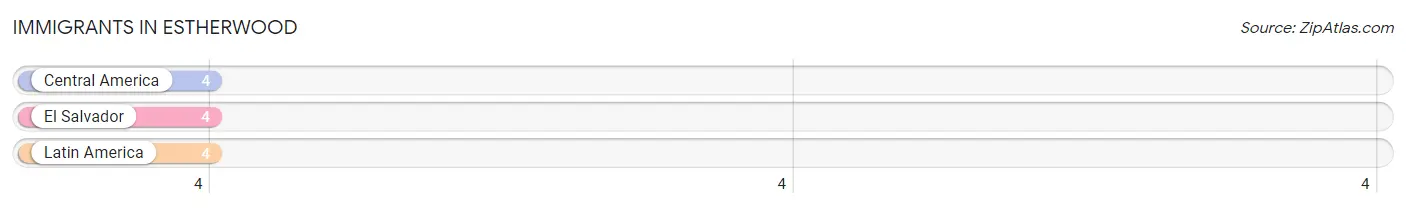
Immigrants in Estherwood
The most numerous immigrant groups reported in Estherwood came from Central America (4 | 0.5%), El Salvador (4 | 0.5%), and Latin America (4 | 0.5%), together accounting for 1.6% of all Estherwood residents.
| Immigration Origin | # Population | % Population |
| Central America | 4 | 0.5% |
| El Salvador | 4 | 0.5% |
| Latin America | 4 | 0.5% | View All 3 Rows |
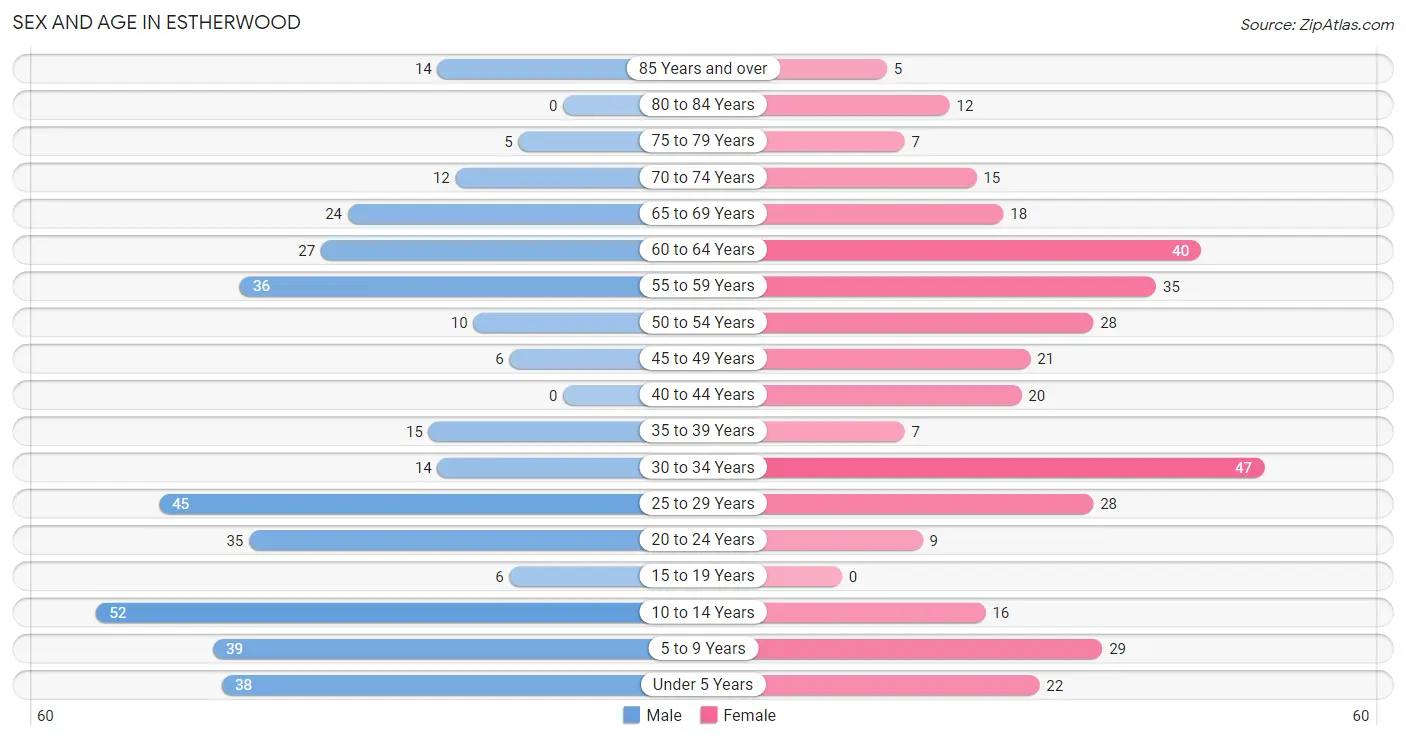
Sex and Age in Estherwood
Sex and Age in Estherwood
The most populous age groups in Estherwood are 10 to 14 Years (52 | 13.8%) for men and 30 to 34 Years (47 | 13.1%) for women.
| Age Bracket | Male | Female |
| Under 5 Years | 38 (10.1%) | 22 (6.1%) |
| 5 to 9 Years | 39 (10.3%) | 29 (8.1%) |
| 10 to 14 Years | 52 (13.8%) | 16 (4.5%) |
| 15 to 19 Years | 6 (1.6%) | 0 (0.0%) |
| 20 to 24 Years | 35 (9.3%) | 9 (2.5%) |
| 25 to 29 Years | 45 (11.9%) | 28 (7.8%) |
| 30 to 34 Years | 14 (3.7%) | 47 (13.1%) |
| 35 to 39 Years | 15 (4.0%) | 7 (1.9%) |
| 40 to 44 Years | 0 (0.0%) | 20 (5.6%) |
| 45 to 49 Years | 6 (1.6%) | 21 (5.9%) |
| 50 to 54 Years | 10 (2.6%) | 28 (7.8%) |
| 55 to 59 Years | 36 (9.5%) | 35 (9.8%) |
| 60 to 64 Years | 27 (7.1%) | 40 (11.1%) |
| 65 to 69 Years | 24 (6.4%) | 18 (5.0%) |
| 70 to 74 Years | 12 (3.2%) | 15 (4.2%) |
| 75 to 79 Years | 5 (1.3%) | 7 (1.9%) |
| 80 to 84 Years | 0 (0.0%) | 12 (3.3%) |
| 85 Years and over | 14 (3.7%) | 5 (1.4%) |
| Total | 378 (100.0%) | 359 (100.0%) |
Families and Households in Estherwood
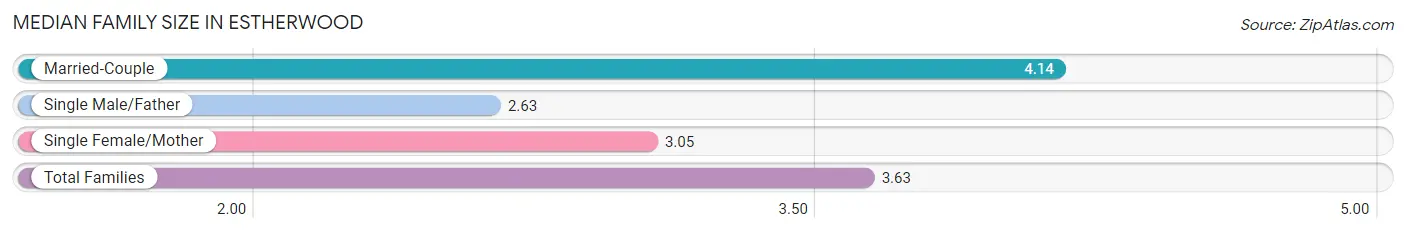
Median Family Size in Estherwood
The median family size in Estherwood is 3.63 persons per family, with married-couple families (99 | 56.9%) accounting for the largest median family size of 4.14 persons per family. On the other hand, single male/father families (16 | 9.2%) represent the smallest median family size with 2.63 persons per family.
| Family Type | # Families | Family Size |
| Married-Couple | 99 (56.9%) | 4.14 |
| Single Male/Father | 16 (9.2%) | 2.63 |
| Single Female/Mother | 59 (33.9%) | 3.05 |
| Total Families | 174 (100.0%) | 3.63 |
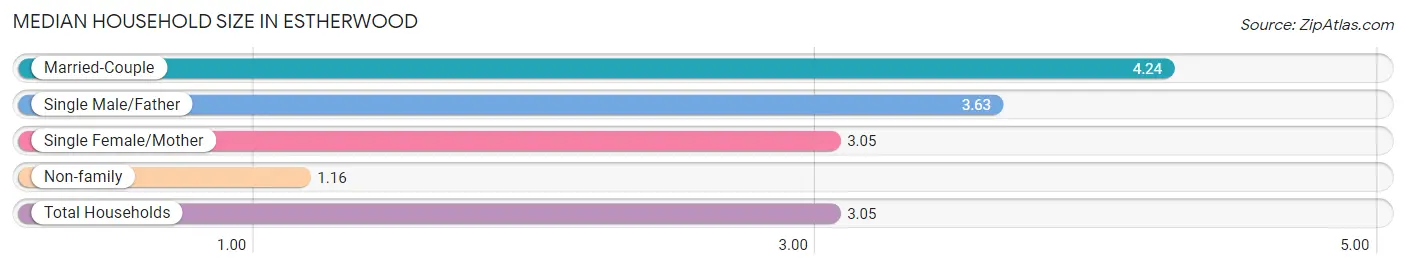
Median Household Size in Estherwood
The median household size in Estherwood is 3.05 persons per household, with married-couple households (99 | 40.9%) accounting for the largest median household size of 4.24 persons per household. non-family households (68 | 28.1%) represent the smallest median household size with 1.16 persons per household.
| Household Type | # Households | Household Size |
| Married-Couple | 99 (40.9%) | 4.24 |
| Single Male/Father | 16 (6.6%) | 3.63 |
| Single Female/Mother | 59 (24.4%) | 3.05 |
| Non-family | 68 (28.1%) | 1.16 |
| Total Households | 242 (100.0%) | 3.05 |
Household Size by Marriage Status in Estherwood
Out of a total of 242 households in Estherwood, 174 (71.9%) are family households, while 68 (28.1%) are nonfamily households. The most numerous type of family households are 2-person households, comprising 79, and the most common type of nonfamily households are 1-person households, comprising 54.
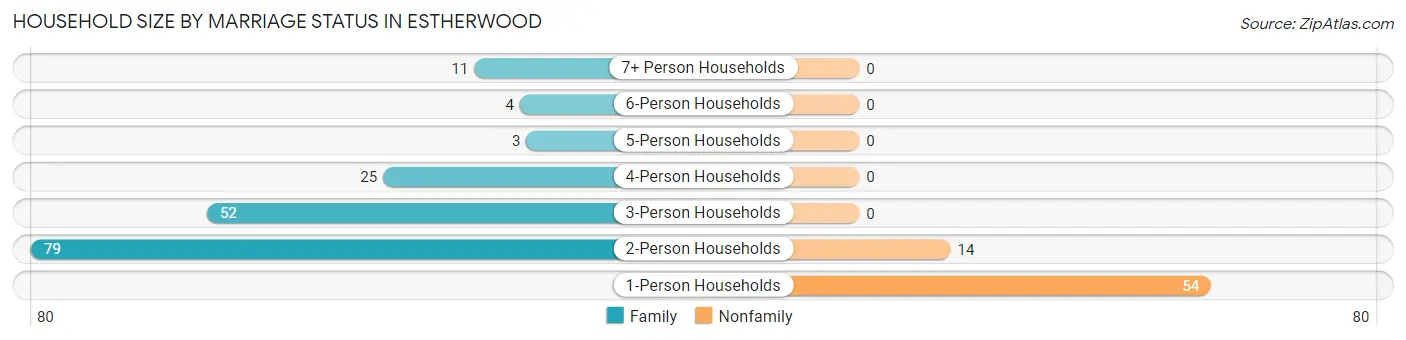
| Household Size | Family Households | Nonfamily Households |
| 1-Person Households | - | 54 (22.3%) |
| 2-Person Households | 79 (32.6%) | 14 (5.8%) |
| 3-Person Households | 52 (21.5%) | 0 (0.0%) |
| 4-Person Households | 25 (10.3%) | 0 (0.0%) |
| 5-Person Households | 3 (1.2%) | 0 (0.0%) |
| 6-Person Households | 4 (1.7%) | 0 (0.0%) |
| 7+ Person Households | 11 (4.5%) | 0 (0.0%) |
| Total | 174 (71.9%) | 68 (28.1%) |
Female Fertility in Estherwood
Fertility by Age in Estherwood
Average fertility rate in Estherwood is 29.0 births per 1,000 women. Women in the age bracket of 20 to 34 years have the highest fertility rate with 48.0 births per 1,000 women. Women in the age bracket of 20 to 34 years acount for 100.0% of all women with births.
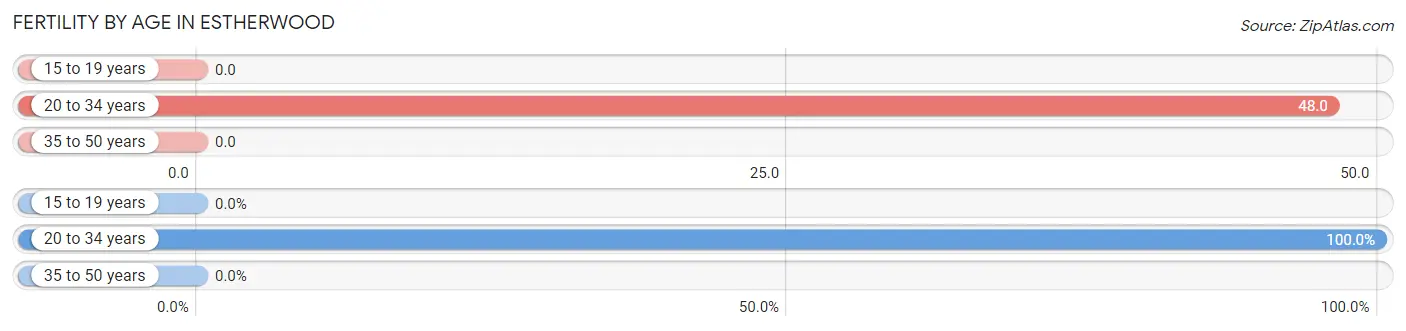
| Age Bracket | Women with Births | Births / 1,000 Women |
| 15 to 19 years | 0 (0.0%) | 0.0 |
| 20 to 34 years | 4 (100.0%) | 48.0 |
| 35 to 50 years | 0 (0.0%) | 0.0 |
| Total | 4 (100.0%) | 29.0 |
Fertility by Age by Marriage Status in Estherwood
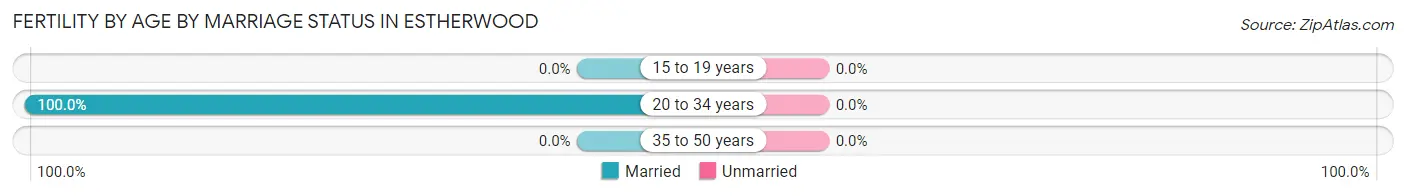
| Age Bracket | Married | Unmarried |
| 15 to 19 years | 0 (0.0%) | 0 (0.0%) |
| 20 to 34 years | 4 (100.0%) | 0 (0.0%) |
| 35 to 50 years | 0 (0.0%) | 0 (0.0%) |
| Total | 4 (100.0%) | 0 (0.0%) |
Fertility by Education in Estherwood
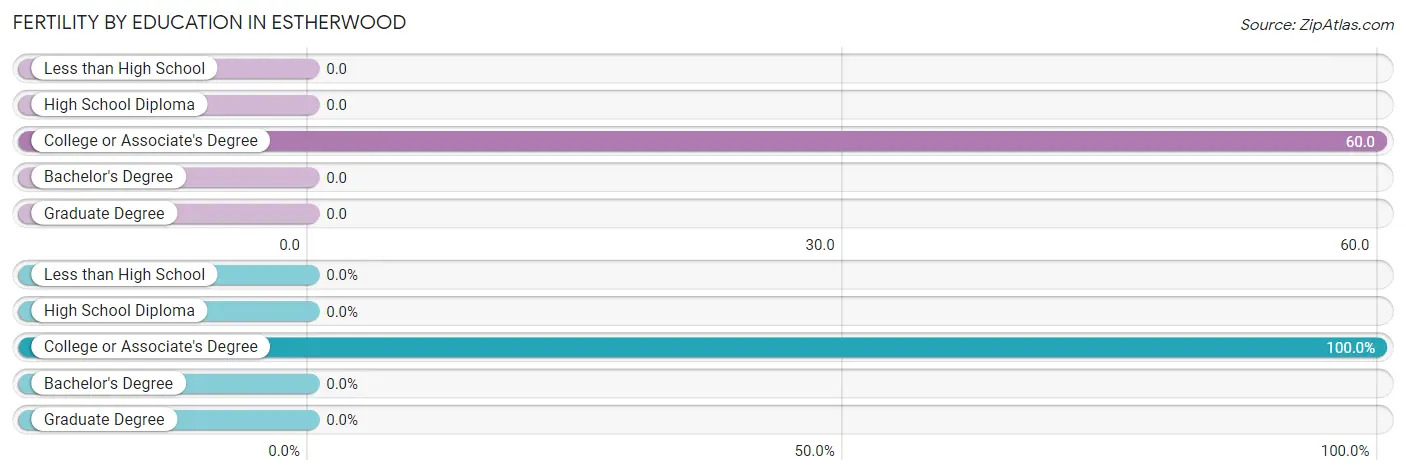
| Educational Attainment | Women with Births | Births / 1,000 Women |
| Less than High School | 0 (0.0%) | 0.0 |
| High School Diploma | 0 (0.0%) | 0.0 |
| College or Associate's Degree | 4 (100.0%) | 60.0 |
| Bachelor's Degree | 0 (0.0%) | 0.0 |
| Graduate Degree | 0 (0.0%) | 0.0 |
| Total | 4 (100.0%) | 29.0 |
Fertility by Education by Marriage Status in Estherwood
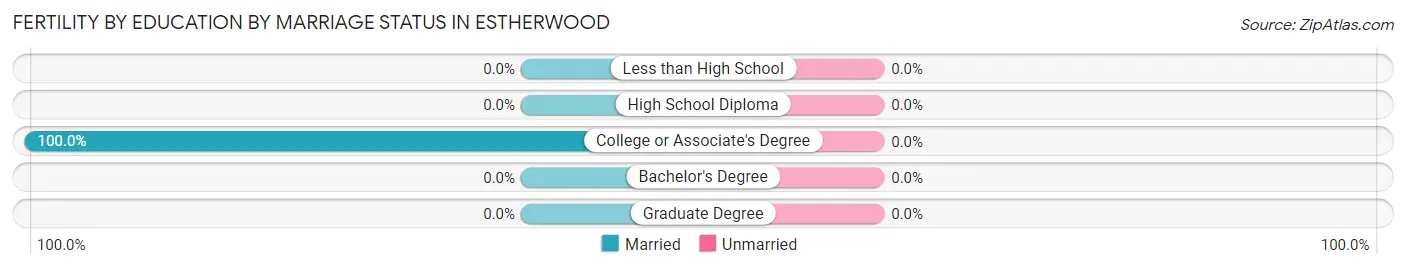
| Educational Attainment | Married | Unmarried |
| Less than High School | 0 (0.0%) | 0 (0.0%) |
| High School Diploma | 0 (0.0%) | 0 (0.0%) |
| College or Associate's Degree | 4 (100.0%) | 0 (0.0%) |
| Bachelor's Degree | 0 (0.0%) | 0 (0.0%) |
| Graduate Degree | 0 (0.0%) | 0 (0.0%) |
| Total | 4 (100.0%) | 0 (0.0%) |
Employment Characteristics in Estherwood
Employment by Class of Employer in Estherwood
Among the 222 employed individuals in Estherwood, private company employees (137 | 61.7%), self-employed (not incorporated) (25 | 11.3%), and local government employees (20 | 9.0%) make up the most common classes of employment.
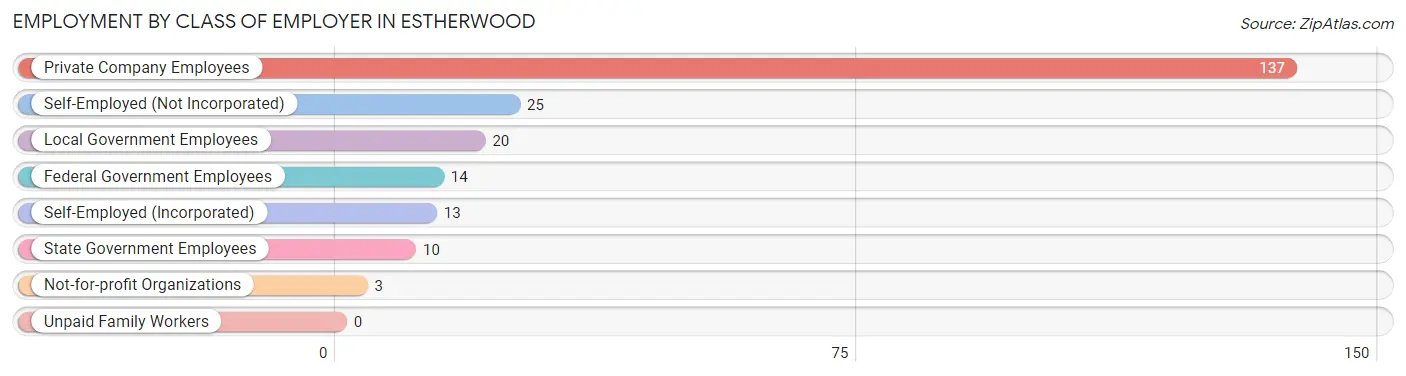
| Employer Class | # Employees | % Employees |
| Private Company Employees | 137 | 61.7% |
| Self-Employed (Incorporated) | 13 | 5.9% |
| Self-Employed (Not Incorporated) | 25 | 11.3% |
| Not-for-profit Organizations | 3 | 1.3% |
| Local Government Employees | 20 | 9.0% |
| State Government Employees | 10 | 4.5% |
| Federal Government Employees | 14 | 6.3% |
| Unpaid Family Workers | 0 | 0.0% |
| Total | 222 | 100.0% |
Employment Status by Age in Estherwood
According to the labor force statistics for Estherwood, out of the total population over 16 years of age (541), 51.2% or 277 individuals are in the labor force, with 19.9% or 55 of them unemployed. The age group with the highest labor force participation rate is 25 to 29 years, with 80.8% or 59 individuals in the labor force. Within the labor force, the 25 to 29 years age range has the highest percentage of unemployed individuals, with 37.3% or 22 of them being unemployed.
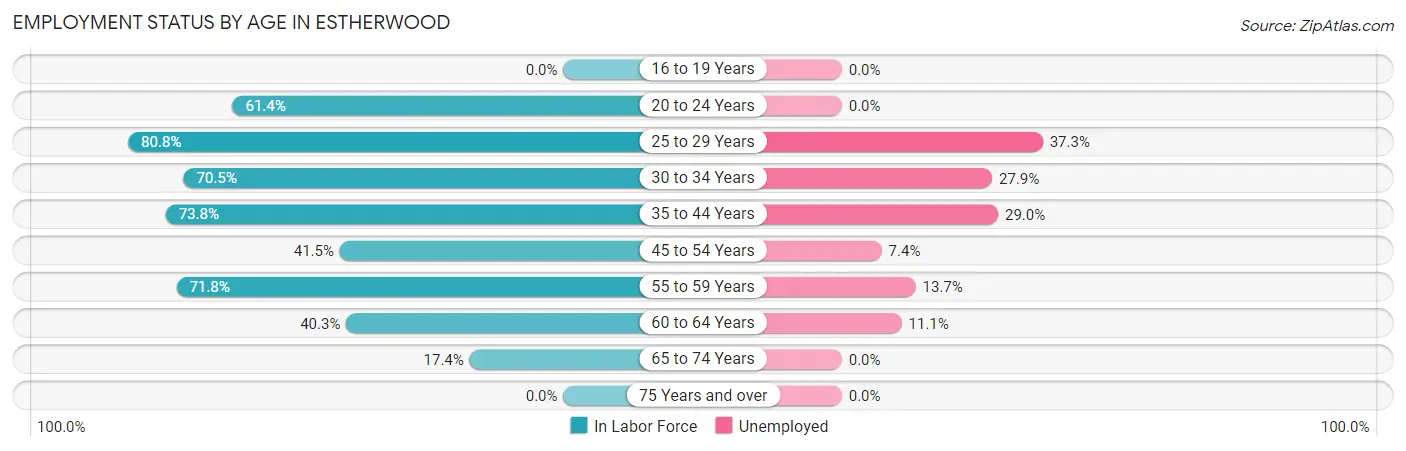
| Age Bracket | In Labor Force | Unemployed |
| 16 to 19 Years | 0 (0.0%) | 0 (0.0%) |
| 20 to 24 Years | 27 (61.4%) | 0 (0.0%) |
| 25 to 29 Years | 59 (80.8%) | 22 (37.3%) |
| 30 to 34 Years | 43 (70.5%) | 12 (27.9%) |
| 35 to 44 Years | 31 (73.8%) | 9 (29.0%) |
| 45 to 54 Years | 27 (41.5%) | 2 (7.4%) |
| 55 to 59 Years | 51 (71.8%) | 7 (13.7%) |
| 60 to 64 Years | 27 (40.3%) | 3 (11.1%) |
| 65 to 74 Years | 12 (17.4%) | 0 (0.0%) |
| 75 Years and over | 0 (0.0%) | 0 (0.0%) |
| Total | 277 (51.2%) | 55 (19.9%) |
Employment Status by Educational Attainment in Estherwood
According to labor force statistics for Estherwood, 62.8% of individuals (238) out of the total population between 25 and 64 years of age (379) are in the labor force, with 23.1% or 55 of them being unemployed. The group with the highest labor force participation rate are those with the educational attainment of bachelor's degree or higher, with 100.0% or 27 individuals in the labor force. Within the labor force, individuals with bachelor's degree or higher education have the highest percentage of unemployment, with 59.3% or 16 of them being unemployed.
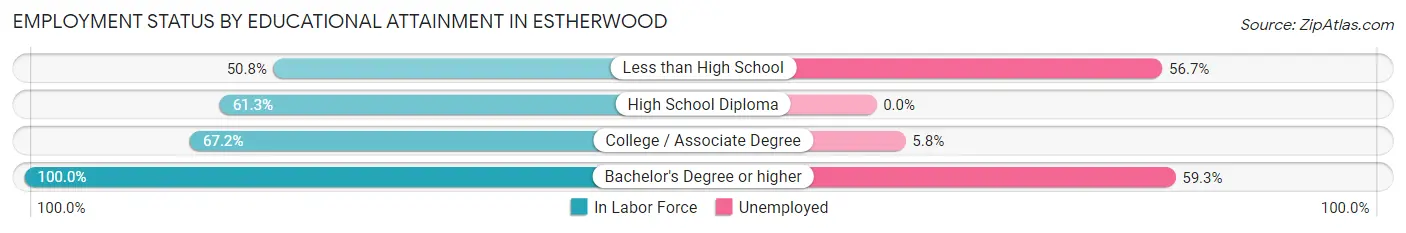
| Educational Attainment | In Labor Force | Unemployed |
| Less than High School | 60 (50.8%) | 67 (56.7%) |
| High School Diploma | 65 (61.3%) | 0 (0.0%) |
| College / Associate Degree | 86 (67.2%) | 7 (5.8%) |
| Bachelor's Degree or higher | 27 (100.0%) | 16 (59.3%) |
| Total | 238 (62.8%) | 88 (23.1%) |
Employment Occupations by Sex in Estherwood
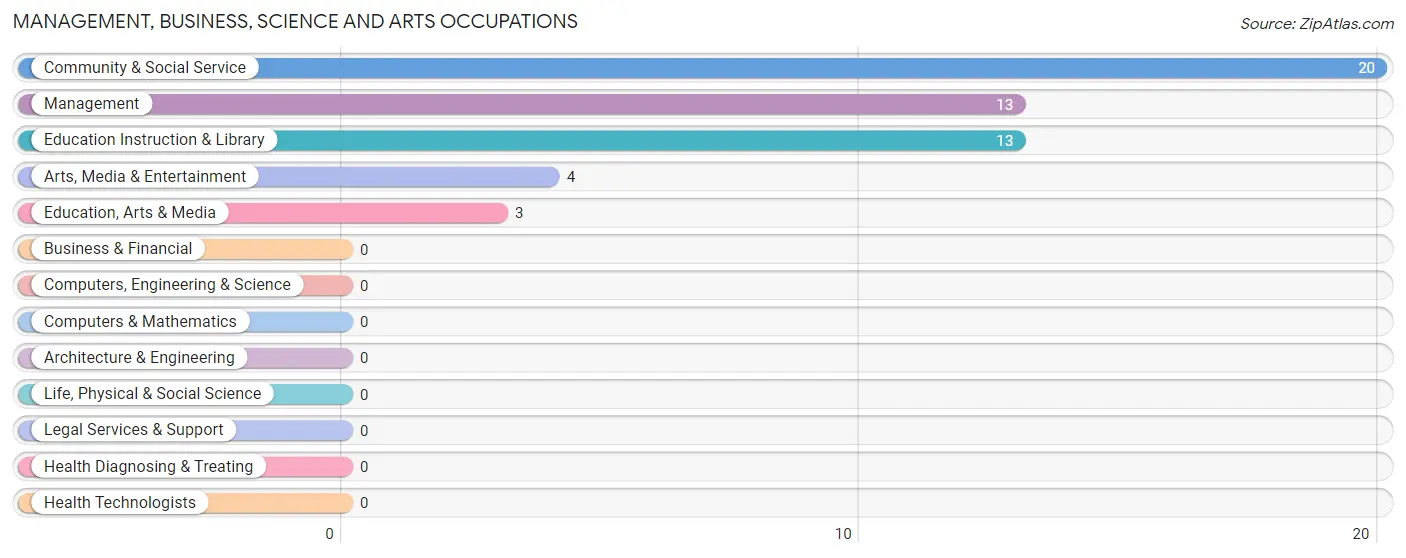
Management, Business, Science and Arts Occupations
The most common Management, Business, Science and Arts occupations in Estherwood are Community & Social Service (20 | 9.0%), Management (13 | 5.9%), Education Instruction & Library (13 | 5.9%), Arts, Media & Entertainment (4 | 1.8%), and Education, Arts & Media (3 | 1.3%).
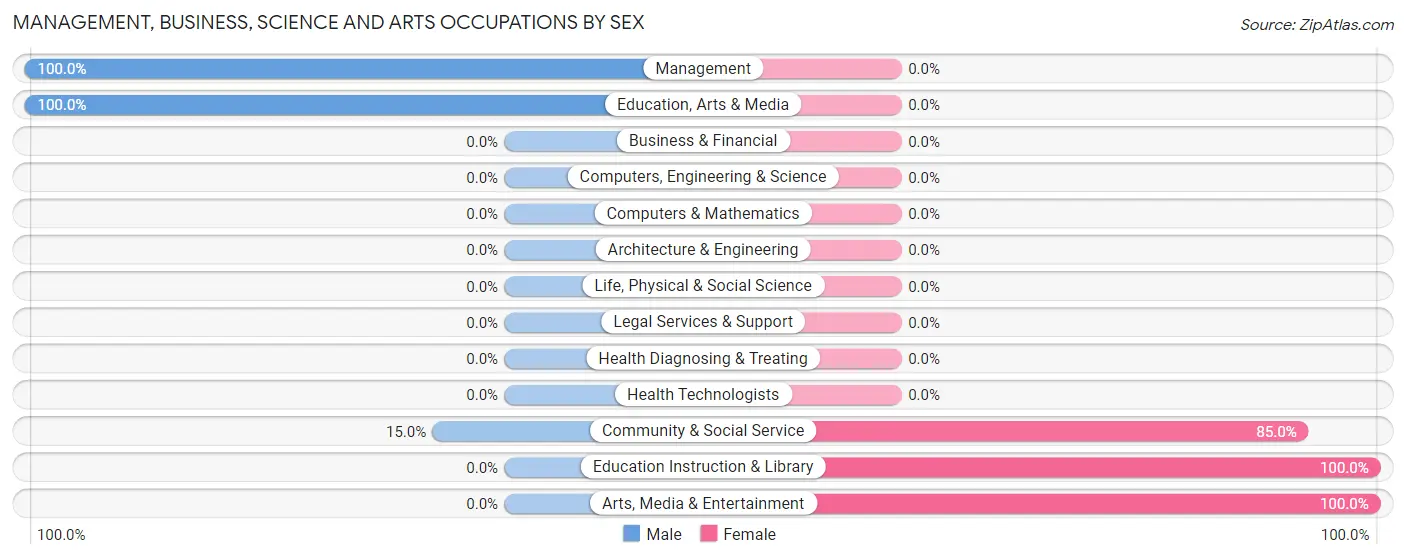
Management, Business, Science and Arts Occupations by Sex
Within the Management, Business, Science and Arts occupations in Estherwood, the most male-oriented occupations are Management (100.0%), Education, Arts & Media (100.0%), and Community & Social Service (15.0%), while the most female-oriented occupations are Education Instruction & Library (100.0%), Arts, Media & Entertainment (100.0%), and Community & Social Service (85.0%).
| Occupation | Male | Female |
| Management | 13 (100.0%) | 0 (0.0%) |
| Business & Financial | 0 (0.0%) | 0 (0.0%) |
| Computers, Engineering & Science | 0 (0.0%) | 0 (0.0%) |
| Computers & Mathematics | 0 (0.0%) | 0 (0.0%) |
| Architecture & Engineering | 0 (0.0%) | 0 (0.0%) |
| Life, Physical & Social Science | 0 (0.0%) | 0 (0.0%) |
| Community & Social Service | 3 (15.0%) | 17 (85.0%) |
| Education, Arts & Media | 3 (100.0%) | 0 (0.0%) |
| Legal Services & Support | 0 (0.0%) | 0 (0.0%) |
| Education Instruction & Library | 0 (0.0%) | 13 (100.0%) |
| Arts, Media & Entertainment | 0 (0.0%) | 4 (100.0%) |
| Health Diagnosing & Treating | 0 (0.0%) | 0 (0.0%) |
| Health Technologists | 0 (0.0%) | 0 (0.0%) |
| Total (Category) | 16 (48.5%) | 17 (51.5%) |
| Total (Overall) | 133 (59.9%) | 89 (40.1%) |
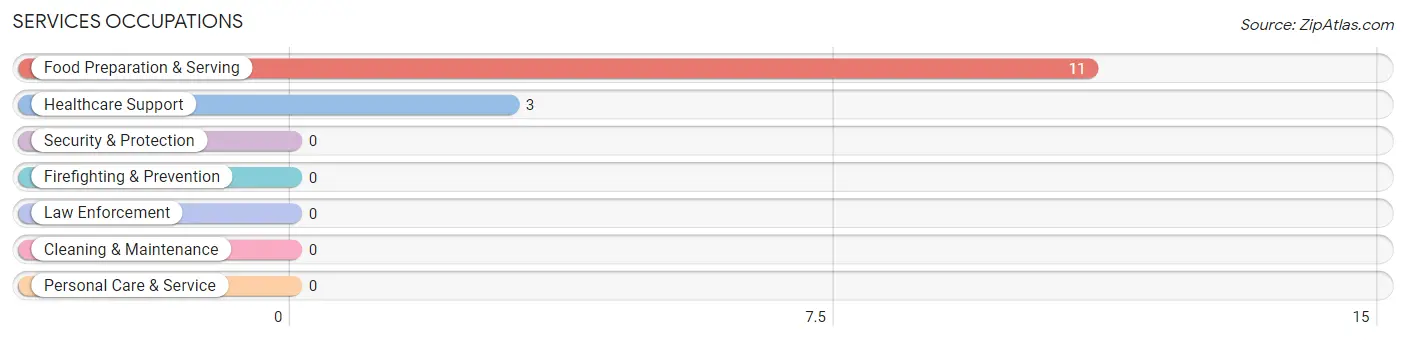
Services Occupations
The most common Services occupations in Estherwood are Food Preparation & Serving (11 | 5.0%), and Healthcare Support (3 | 1.3%).
Services Occupations by Sex
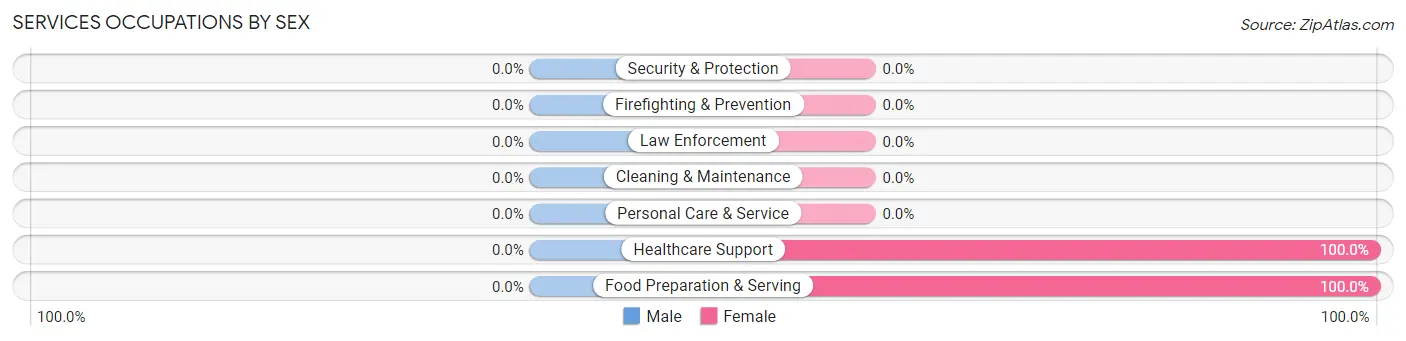
| Occupation | Male | Female |
| Healthcare Support | 0 (0.0%) | 3 (100.0%) |
| Security & Protection | 0 (0.0%) | 0 (0.0%) |
| Firefighting & Prevention | 0 (0.0%) | 0 (0.0%) |
| Law Enforcement | 0 (0.0%) | 0 (0.0%) |
| Food Preparation & Serving | 0 (0.0%) | 11 (100.0%) |
| Cleaning & Maintenance | 0 (0.0%) | 0 (0.0%) |
| Personal Care & Service | 0 (0.0%) | 0 (0.0%) |
| Total (Category) | 0 (0.0%) | 14 (100.0%) |
| Total (Overall) | 133 (59.9%) | 89 (40.1%) |
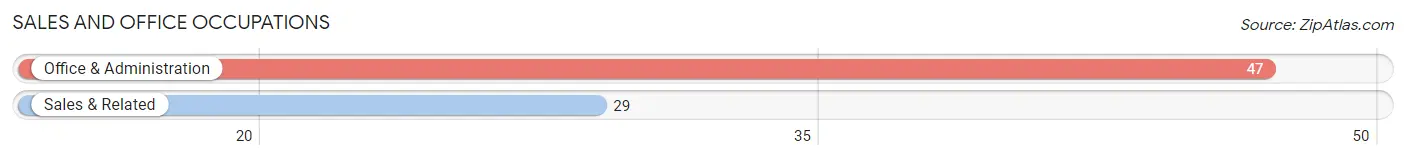
Sales and Office Occupations
The most common Sales and Office occupations in Estherwood are Office & Administration (47 | 21.2%), and Sales & Related (29 | 13.1%).
Sales and Office Occupations by Sex
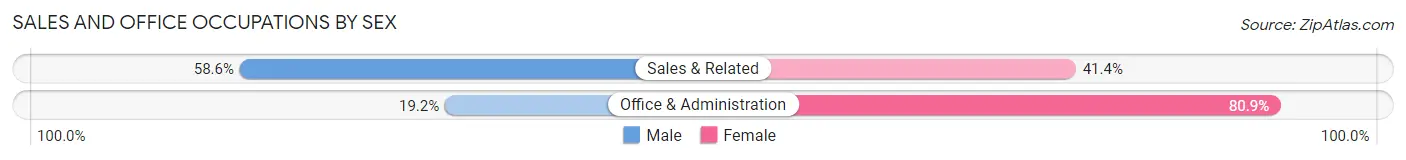
| Occupation | Male | Female |
| Sales & Related | 17 (58.6%) | 12 (41.4%) |
| Office & Administration | 9 (19.2%) | 38 (80.8%) |
| Total (Category) | 26 (34.2%) | 50 (65.8%) |
| Total (Overall) | 133 (59.9%) | 89 (40.1%) |
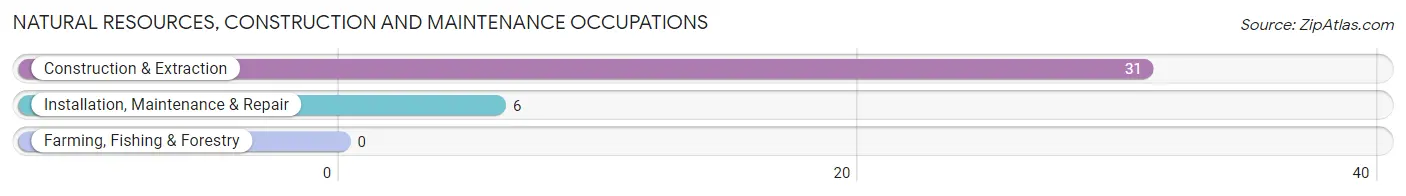
Natural Resources, Construction and Maintenance Occupations
The most common Natural Resources, Construction and Maintenance occupations in Estherwood are Construction & Extraction (31 | 14.0%), and Installation, Maintenance & Repair (6 | 2.7%).
Natural Resources, Construction and Maintenance Occupations by Sex
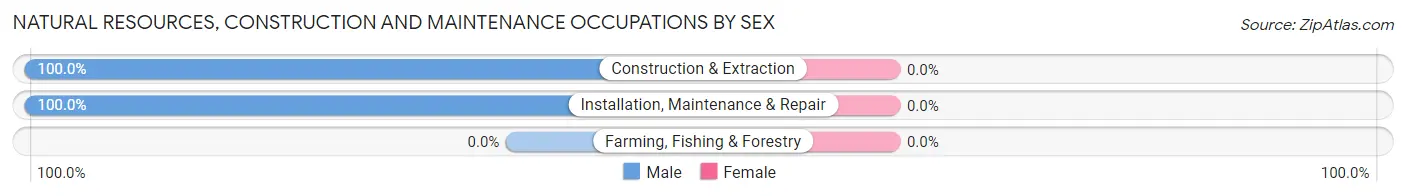
| Occupation | Male | Female |
| Farming, Fishing & Forestry | 0 (0.0%) | 0 (0.0%) |
| Construction & Extraction | 31 (100.0%) | 0 (0.0%) |
| Installation, Maintenance & Repair | 6 (100.0%) | 0 (0.0%) |
| Total (Category) | 37 (100.0%) | 0 (0.0%) |
| Total (Overall) | 133 (59.9%) | 89 (40.1%) |
Production, Transportation and Moving Occupations
The most common Production, Transportation and Moving occupations in Estherwood are Transportation (30 | 13.5%), Production (24 | 10.8%), and Material Moving (8 | 3.6%).
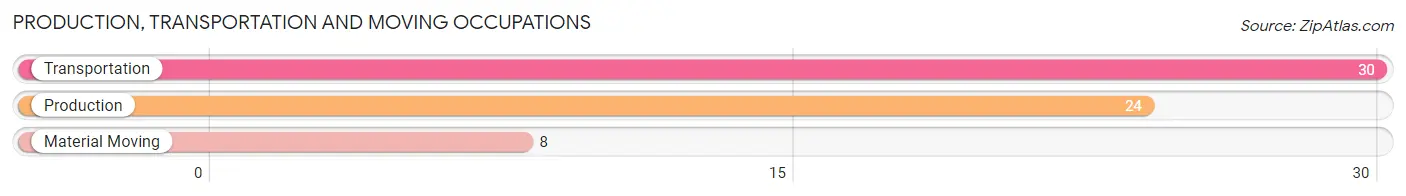
Production, Transportation and Moving Occupations by Sex
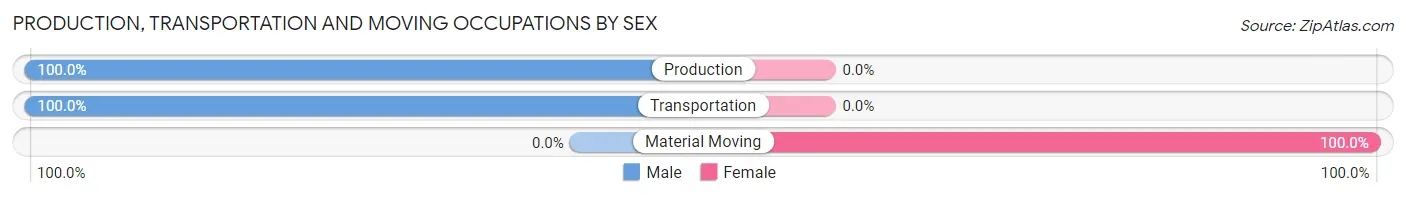
| Occupation | Male | Female |
| Production | 24 (100.0%) | 0 (0.0%) |
| Transportation | 30 (100.0%) | 0 (0.0%) |
| Material Moving | 0 (0.0%) | 8 (100.0%) |
| Total (Category) | 54 (87.1%) | 8 (12.9%) |
| Total (Overall) | 133 (59.9%) | 89 (40.1%) |
Employment Industries by Sex in Estherwood
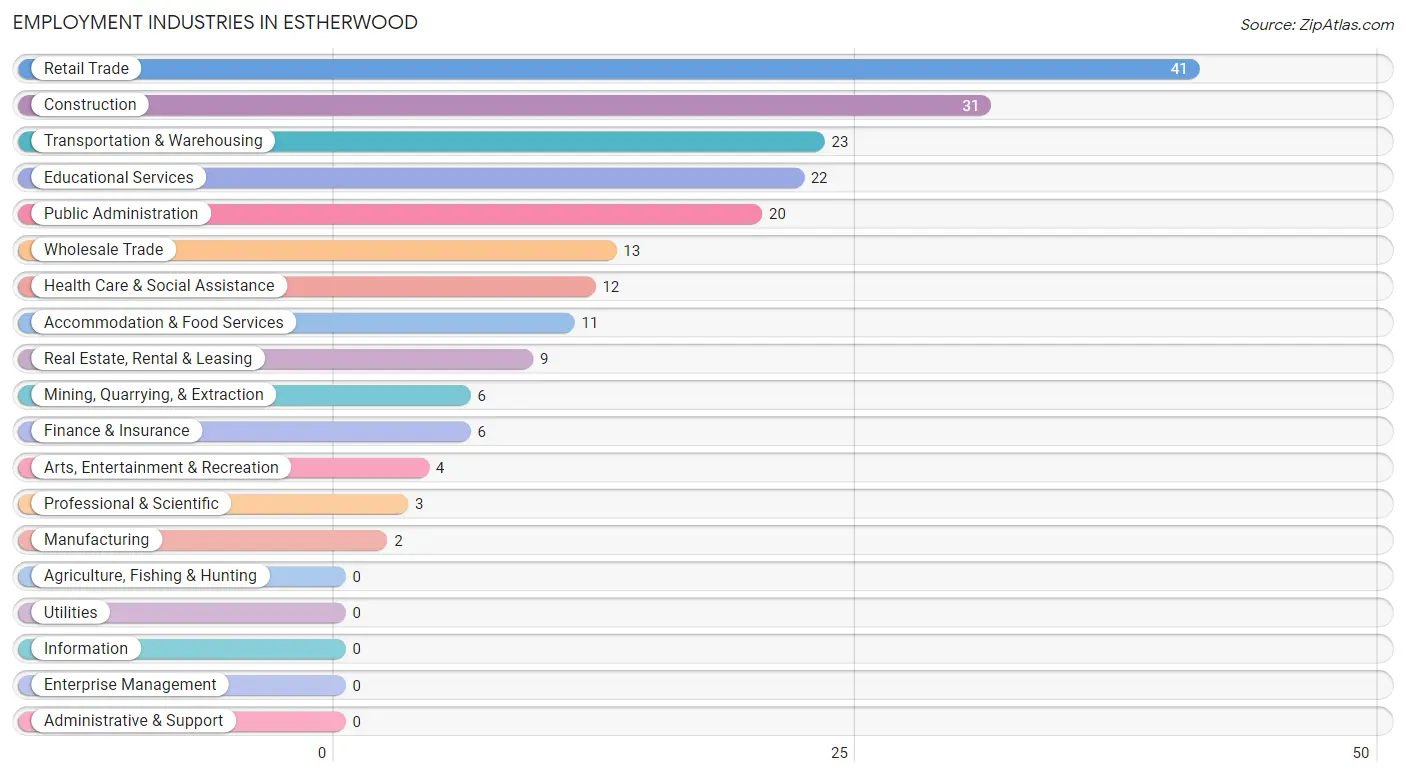
Employment Industries in Estherwood
The major employment industries in Estherwood include Retail Trade (41 | 18.5%), Construction (31 | 14.0%), Transportation & Warehousing (23 | 10.4%), Educational Services (22 | 9.9%), and Public Administration (20 | 9.0%).
Employment Industries by Sex in Estherwood
The Estherwood industries that see more men than women are Mining, Quarrying, & Extraction (100.0%), Construction (100.0%), and Manufacturing (100.0%), whereas the industries that tend to have a higher number of women are Finance & Insurance (100.0%), Arts, Entertainment & Recreation (100.0%), and Accommodation & Food Services (100.0%).
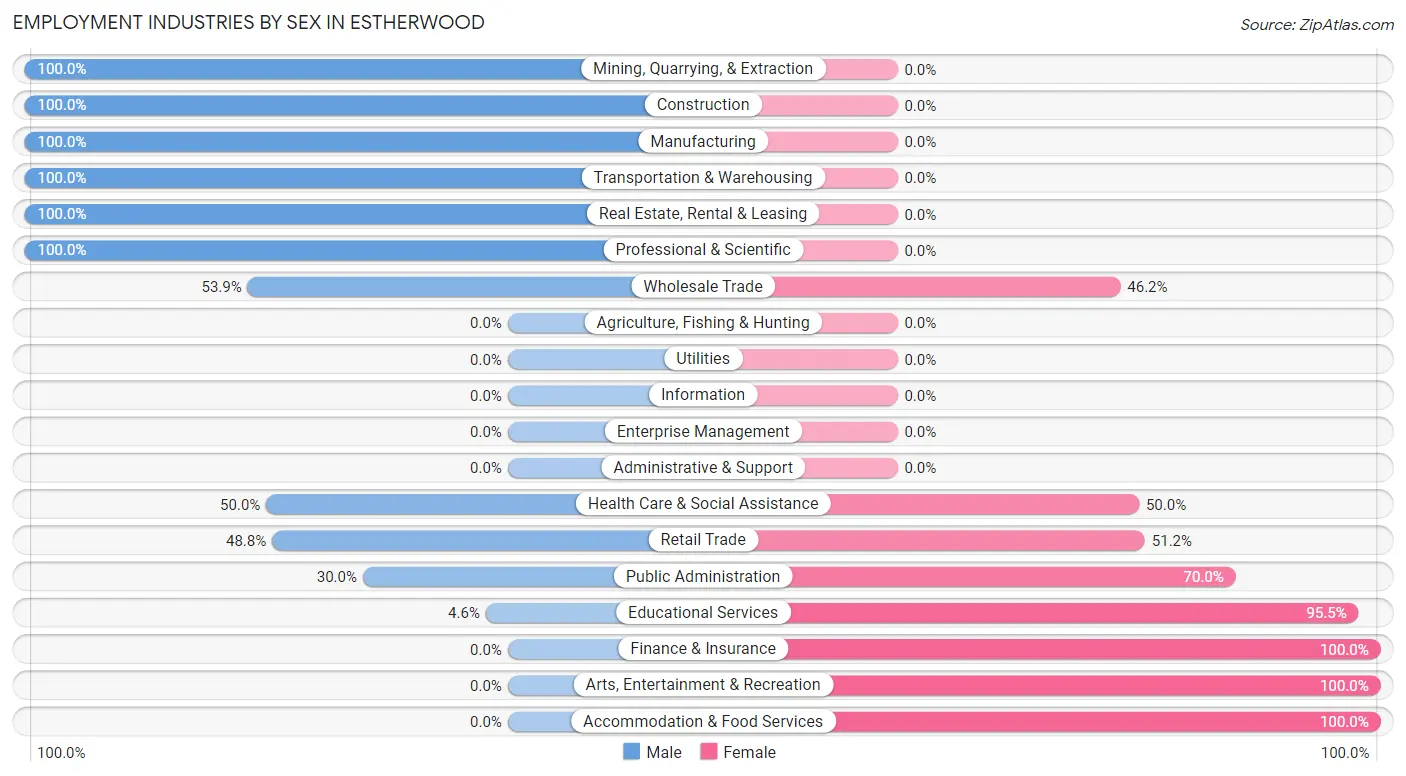
| Industry | Male | Female |
| Agriculture, Fishing & Hunting | 0 (0.0%) | 0 (0.0%) |
| Mining, Quarrying, & Extraction | 6 (100.0%) | 0 (0.0%) |
| Construction | 31 (100.0%) | 0 (0.0%) |
| Manufacturing | 2 (100.0%) | 0 (0.0%) |
| Wholesale Trade | 7 (53.8%) | 6 (46.2%) |
| Retail Trade | 20 (48.8%) | 21 (51.2%) |
| Transportation & Warehousing | 23 (100.0%) | 0 (0.0%) |
| Utilities | 0 (0.0%) | 0 (0.0%) |
| Information | 0 (0.0%) | 0 (0.0%) |
| Finance & Insurance | 0 (0.0%) | 6 (100.0%) |
| Real Estate, Rental & Leasing | 9 (100.0%) | 0 (0.0%) |
| Professional & Scientific | 3 (100.0%) | 0 (0.0%) |
| Enterprise Management | 0 (0.0%) | 0 (0.0%) |
| Administrative & Support | 0 (0.0%) | 0 (0.0%) |
| Educational Services | 1 (4.5%) | 21 (95.5%) |
| Health Care & Social Assistance | 6 (50.0%) | 6 (50.0%) |
| Arts, Entertainment & Recreation | 0 (0.0%) | 4 (100.0%) |
| Accommodation & Food Services | 0 (0.0%) | 11 (100.0%) |
| Public Administration | 6 (30.0%) | 14 (70.0%) |
| Total | 133 (59.9%) | 89 (40.1%) |
Education in Estherwood
School Enrollment in Estherwood
The most common levels of schooling among the 168 students in Estherwood are middle school (68 | 40.5%), elementary school (33 | 19.6%), and nursery / preschool (20 | 11.9%).
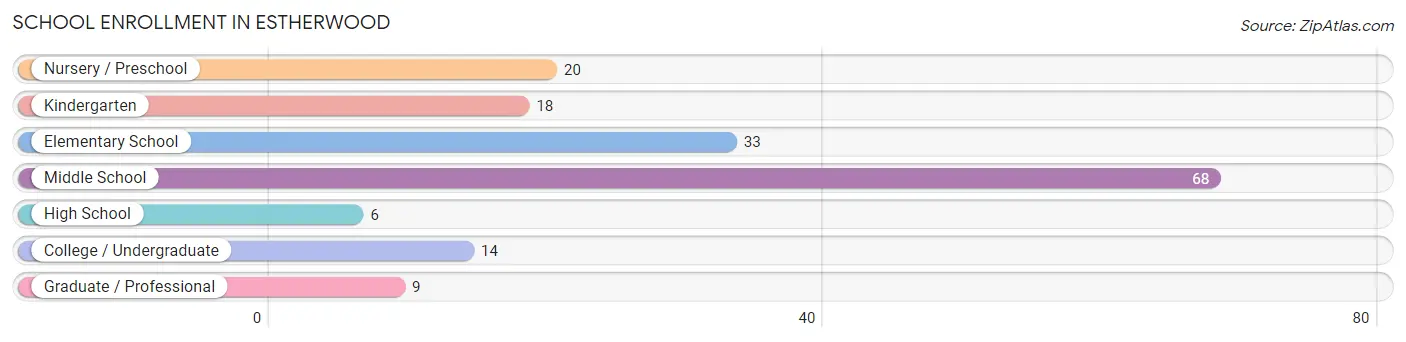
| School Level | # Students | % Students |
| Nursery / Preschool | 20 | 11.9% |
| Kindergarten | 18 | 10.7% |
| Elementary School | 33 | 19.6% |
| Middle School | 68 | 40.5% |
| High School | 6 | 3.6% |
| College / Undergraduate | 14 | 8.3% |
| Graduate / Professional | 9 | 5.4% |
| Total | 168 | 100.0% |
School Enrollment by Age by Funding Source in Estherwood
Out of a total of 168 students who are enrolled in schools in Estherwood, 9 (5.4%) attend a private institution, while the remaining 159 (94.6%) are enrolled in public schools. The age group of 5 to 9 year old has the highest likelihood of being enrolled in private schools, with 9 (17.6% in the age bracket) enrolled. Conversely, the age group of 3 to 4 year olds has the lowest likelihood of being enrolled in a private school, with 20 (100.0% in the age bracket) attending a public institution.
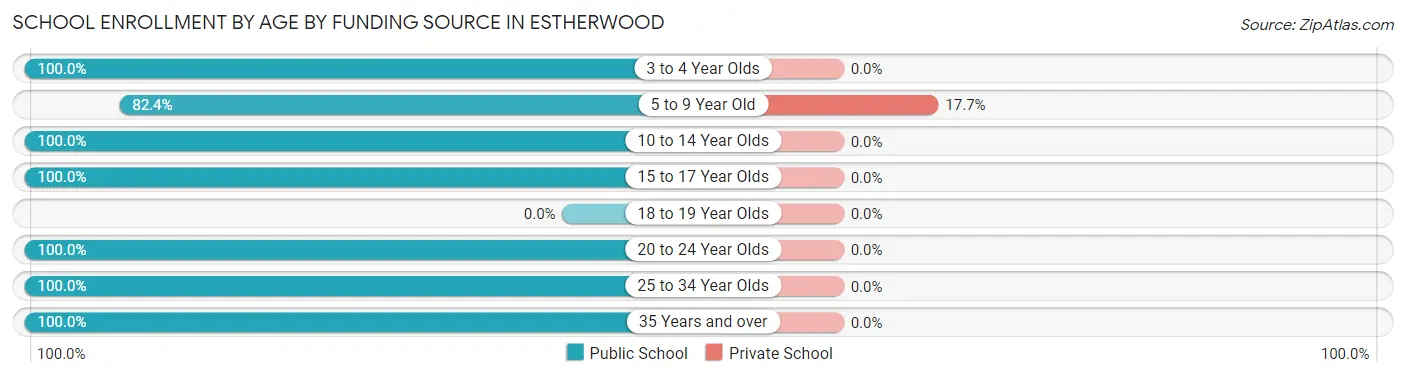
| Age Bracket | Public School | Private School |
| 3 to 4 Year Olds | 20 (100.0%) | 0 (0.0%) |
| 5 to 9 Year Old | 42 (82.4%) | 9 (17.6%) |
| 10 to 14 Year Olds | 68 (100.0%) | 0 (0.0%) |
| 15 to 17 Year Olds | 6 (100.0%) | 0 (0.0%) |
| 18 to 19 Year Olds | 0 (0.0%) | 0 (0.0%) |
| 20 to 24 Year Olds | 7 (100.0%) | 0 (0.0%) |
| 25 to 34 Year Olds | 5 (100.0%) | 0 (0.0%) |
| 35 Years and over | 11 (100.0%) | 0 (0.0%) |
| Total | 159 (94.6%) | 9 (5.4%) |
Educational Attainment by Field of Study in Estherwood
Education (19 | 34.5%), business (9 | 16.4%), literature & languages (9 | 16.4%), bio, nature & agricultural (6 | 10.9%), and science & technology (5 | 9.1%) are the most common fields of study among 55 individuals in Estherwood who have obtained a bachelor's degree or higher.
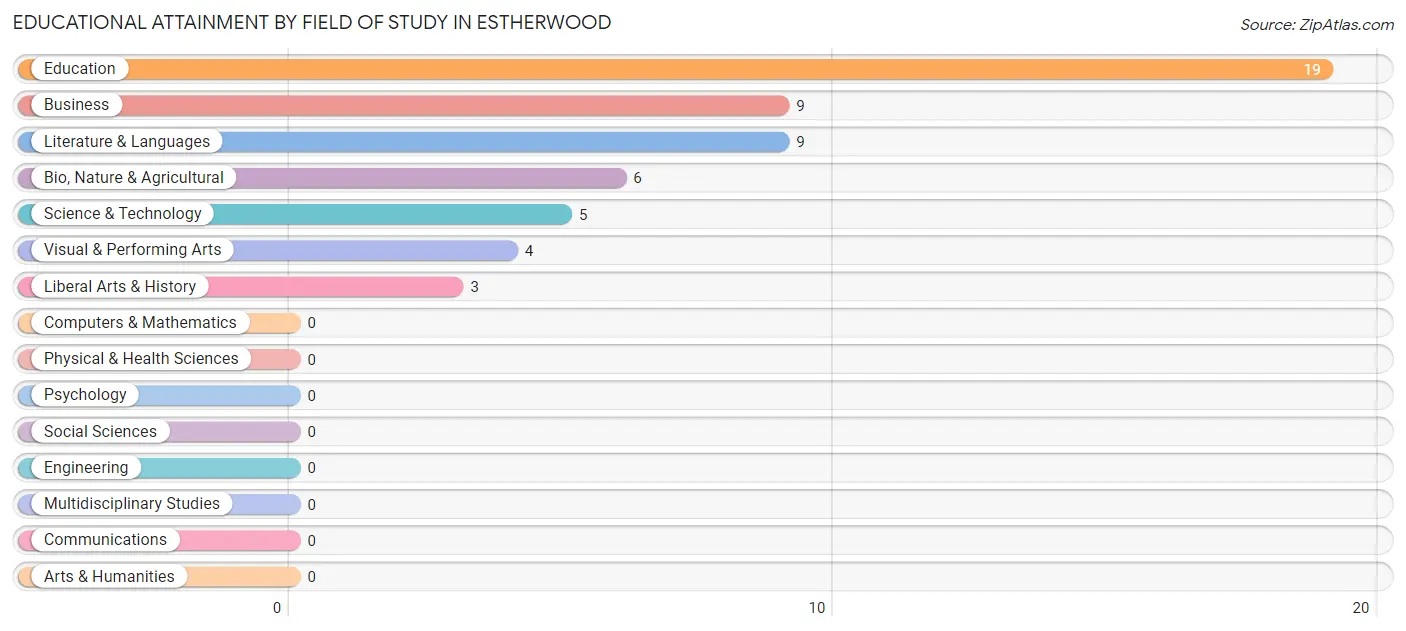
| Field of Study | # Graduates | % Graduates |
| Computers & Mathematics | 0 | 0.0% |
| Bio, Nature & Agricultural | 6 | 10.9% |
| Physical & Health Sciences | 0 | 0.0% |
| Psychology | 0 | 0.0% |
| Social Sciences | 0 | 0.0% |
| Engineering | 0 | 0.0% |
| Multidisciplinary Studies | 0 | 0.0% |
| Science & Technology | 5 | 9.1% |
| Business | 9 | 16.4% |
| Education | 19 | 34.5% |
| Literature & Languages | 9 | 16.4% |
| Liberal Arts & History | 3 | 5.4% |
| Visual & Performing Arts | 4 | 7.3% |
| Communications | 0 | 0.0% |
| Arts & Humanities | 0 | 0.0% |
| Total | 55 | 100.0% |
Transportation & Commute in Estherwood
Vehicle Availability by Sex in Estherwood
The most prevalent vehicle ownership categories in Estherwood are males with 2 vehicles (74, accounting for 55.6%) and females with 2 vehicles (57, making up 83.2%).
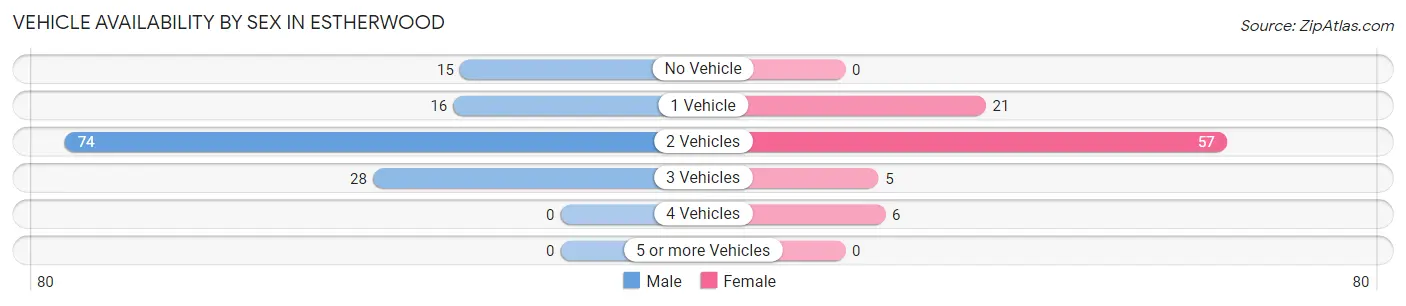
| Vehicles Available | Male | Female |
| No Vehicle | 15 (11.3%) | 0 (0.0%) |
| 1 Vehicle | 16 (12.0%) | 21 (23.6%) |
| 2 Vehicles | 74 (55.6%) | 57 (64.0%) |
| 3 Vehicles | 28 (21.0%) | 5 (5.6%) |
| 4 Vehicles | 0 (0.0%) | 6 (6.7%) |
| 5 or more Vehicles | 0 (0.0%) | 0 (0.0%) |
| Total | 133 (100.0%) | 89 (100.0%) |
Commute Time in Estherwood
The most frequently occuring commute durations in Estherwood are 15 to 19 minutes (48 commuters, 23.5%), 60 to 89 minutes (39 commuters, 19.1%), and 20 to 24 minutes (28 commuters, 13.7%).
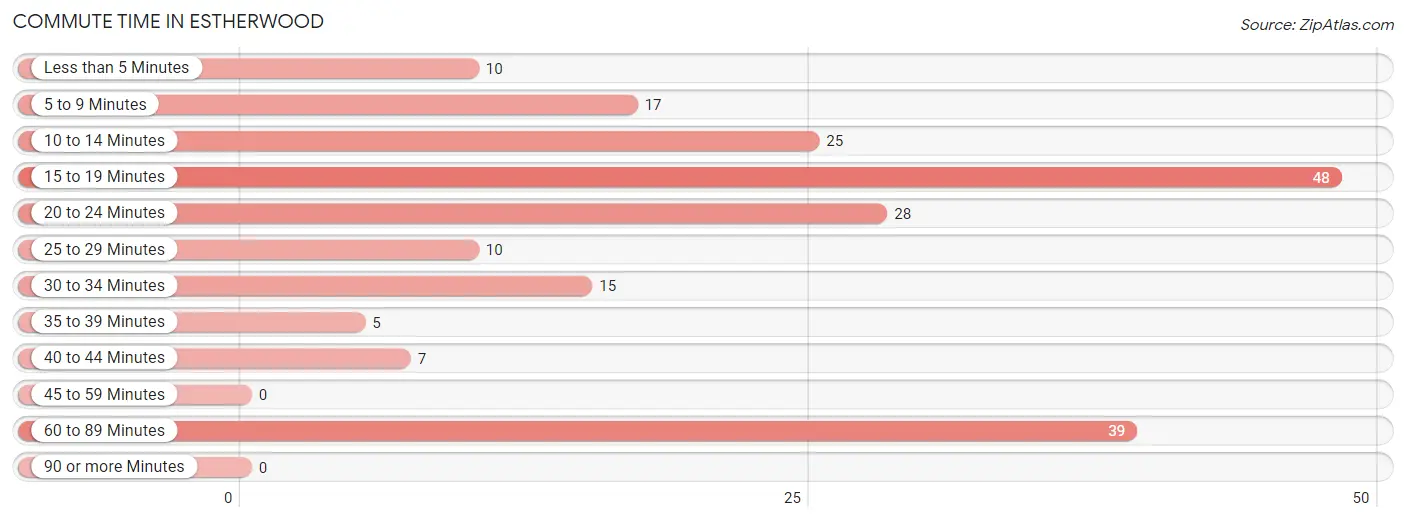
| Commute Time | # Commuters | % Commuters |
| Less than 5 Minutes | 10 | 4.9% |
| 5 to 9 Minutes | 17 | 8.3% |
| 10 to 14 Minutes | 25 | 12.2% |
| 15 to 19 Minutes | 48 | 23.5% |
| 20 to 24 Minutes | 28 | 13.7% |
| 25 to 29 Minutes | 10 | 4.9% |
| 30 to 34 Minutes | 15 | 7.3% |
| 35 to 39 Minutes | 5 | 2.5% |
| 40 to 44 Minutes | 7 | 3.4% |
| 45 to 59 Minutes | 0 | 0.0% |
| 60 to 89 Minutes | 39 | 19.1% |
| 90 or more Minutes | 0 | 0.0% |
Commute Time by Sex in Estherwood
The most common commute times in Estherwood are 60 to 89 minutes (31 commuters, 24.8%) for males and 15 to 19 minutes (29 commuters, 36.7%) for females.
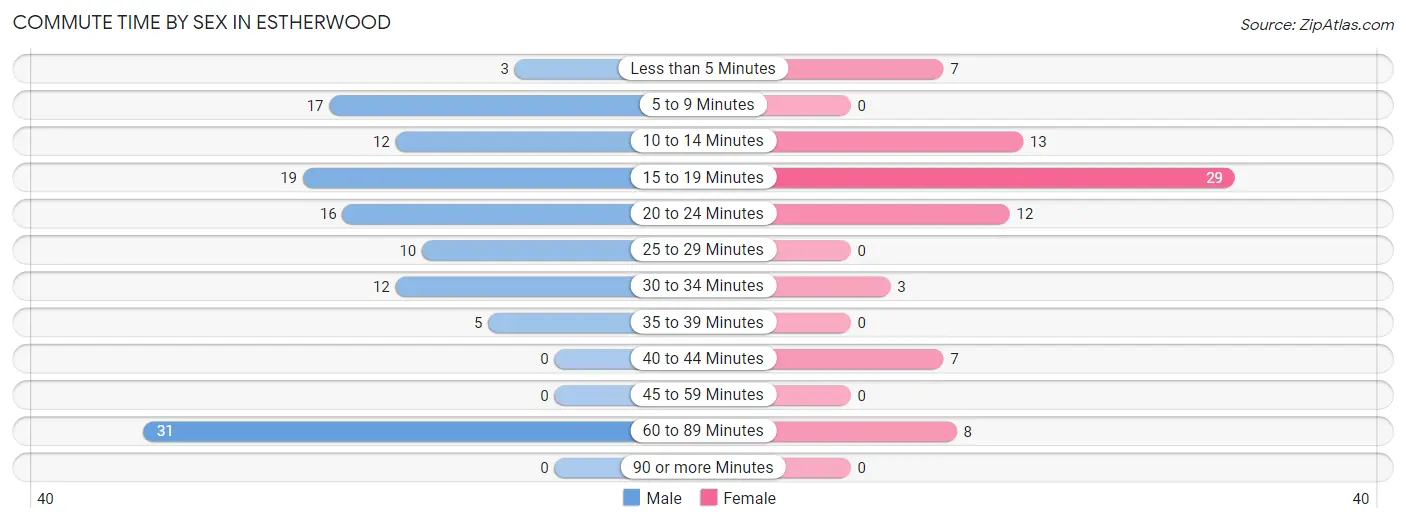
| Commute Time | Male | Female |
| Less than 5 Minutes | 3 (2.4%) | 7 (8.9%) |
| 5 to 9 Minutes | 17 (13.6%) | 0 (0.0%) |
| 10 to 14 Minutes | 12 (9.6%) | 13 (16.5%) |
| 15 to 19 Minutes | 19 (15.2%) | 29 (36.7%) |
| 20 to 24 Minutes | 16 (12.8%) | 12 (15.2%) |
| 25 to 29 Minutes | 10 (8.0%) | 0 (0.0%) |
| 30 to 34 Minutes | 12 (9.6%) | 3 (3.8%) |
| 35 to 39 Minutes | 5 (4.0%) | 0 (0.0%) |
| 40 to 44 Minutes | 0 (0.0%) | 7 (8.9%) |
| 45 to 59 Minutes | 0 (0.0%) | 0 (0.0%) |
| 60 to 89 Minutes | 31 (24.8%) | 8 (10.1%) |
| 90 or more Minutes | 0 (0.0%) | 0 (0.0%) |
Time of Departure to Work by Sex in Estherwood
The most frequent times of departure to work in Estherwood are 7:00 AM to 7:29 AM (28, 22.4%) for males and 7:00 AM to 7:29 AM (26, 32.9%) for females.
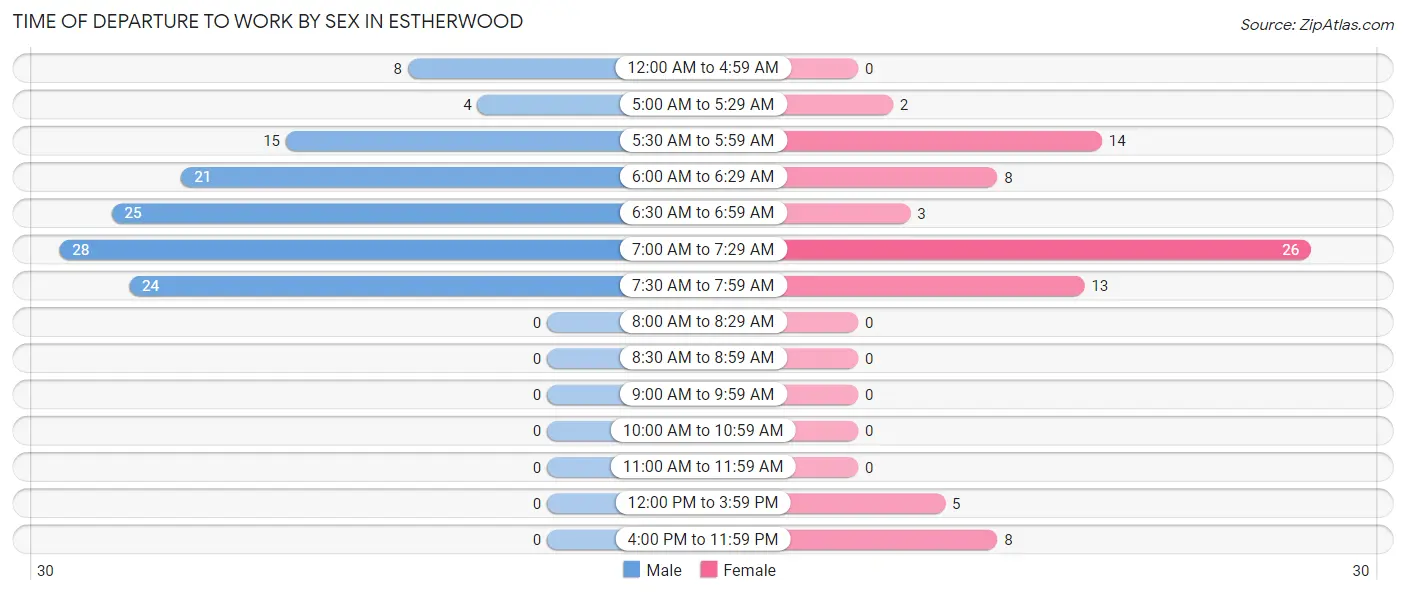
| Time of Departure | Male | Female |
| 12:00 AM to 4:59 AM | 8 (6.4%) | 0 (0.0%) |
| 5:00 AM to 5:29 AM | 4 (3.2%) | 2 (2.5%) |
| 5:30 AM to 5:59 AM | 15 (12.0%) | 14 (17.7%) |
| 6:00 AM to 6:29 AM | 21 (16.8%) | 8 (10.1%) |
| 6:30 AM to 6:59 AM | 25 (20.0%) | 3 (3.8%) |
| 7:00 AM to 7:29 AM | 28 (22.4%) | 26 (32.9%) |
| 7:30 AM to 7:59 AM | 24 (19.2%) | 13 (16.5%) |
| 8:00 AM to 8:29 AM | 0 (0.0%) | 0 (0.0%) |
| 8:30 AM to 8:59 AM | 0 (0.0%) | 0 (0.0%) |
| 9:00 AM to 9:59 AM | 0 (0.0%) | 0 (0.0%) |
| 10:00 AM to 10:59 AM | 0 (0.0%) | 0 (0.0%) |
| 11:00 AM to 11:59 AM | 0 (0.0%) | 0 (0.0%) |
| 12:00 PM to 3:59 PM | 0 (0.0%) | 5 (6.3%) |
| 4:00 PM to 11:59 PM | 0 (0.0%) | 8 (10.1%) |
| Total | 125 (100.0%) | 79 (100.0%) |
Housing Occupancy in Estherwood
Occupancy by Ownership in Estherwood
Of the total 242 dwellings in Estherwood, owner-occupied units account for 168 (69.4%), while renter-occupied units make up 74 (30.6%).
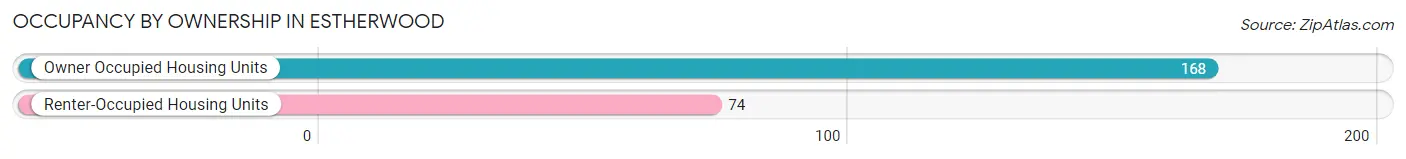
| Occupancy | # Housing Units | % Housing Units |
| Owner Occupied Housing Units | 168 | 69.4% |
| Renter-Occupied Housing Units | 74 | 30.6% |
| Total Occupied Housing Units | 242 | 100.0% |
Occupancy by Household Size in Estherwood
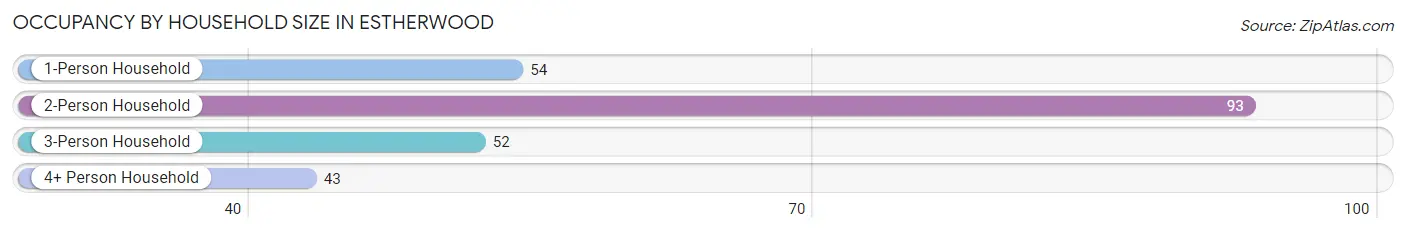
| Household Size | # Housing Units | % Housing Units |
| 1-Person Household | 54 | 22.3% |
| 2-Person Household | 93 | 38.4% |
| 3-Person Household | 52 | 21.5% |
| 4+ Person Household | 43 | 17.8% |
| Total Housing Units | 242 | 100.0% |
Occupancy by Ownership by Household Size in Estherwood
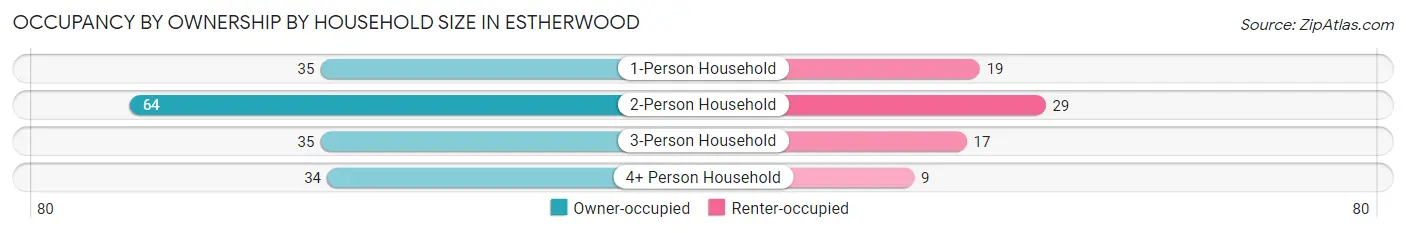
| Household Size | Owner-occupied | Renter-occupied |
| 1-Person Household | 35 (64.8%) | 19 (35.2%) |
| 2-Person Household | 64 (68.8%) | 29 (31.2%) |
| 3-Person Household | 35 (67.3%) | 17 (32.7%) |
| 4+ Person Household | 34 (79.1%) | 9 (20.9%) |
| Total Housing Units | 168 (69.4%) | 74 (30.6%) |
Occupancy by Educational Attainment in Estherwood
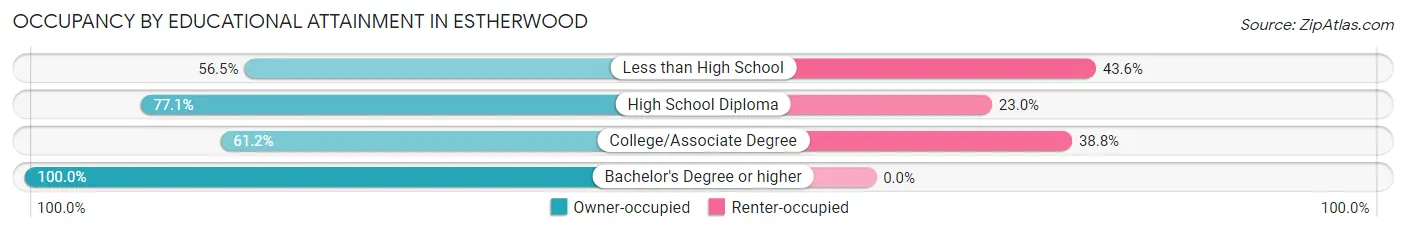
| Household Size | Owner-occupied | Renter-occupied |
| Less than High School | 35 (56.5%) | 27 (43.5%) |
| High School Diploma | 47 (77.0%) | 14 (23.0%) |
| College/Associate Degree | 52 (61.2%) | 33 (38.8%) |
| Bachelor's Degree or higher | 34 (100.0%) | 0 (0.0%) |
Occupancy by Age of Householder in Estherwood
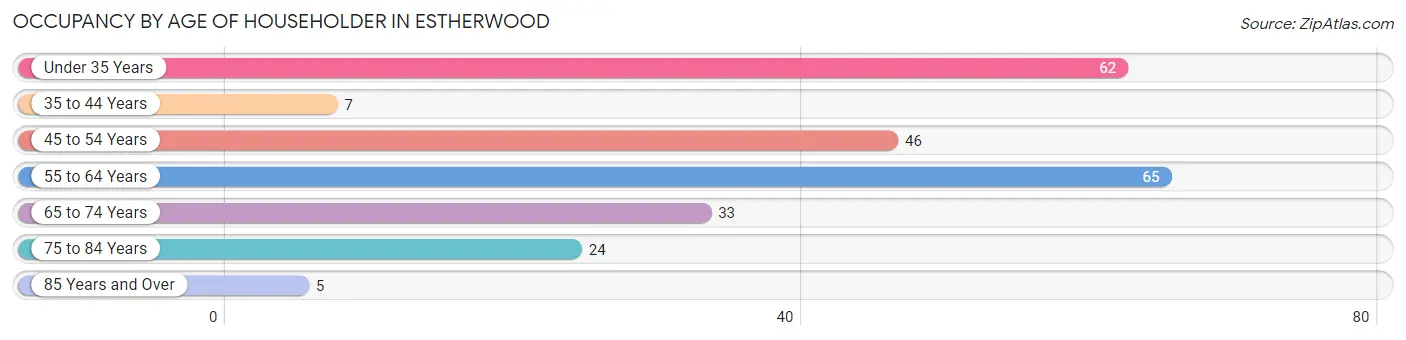
| Age Bracket | # Households | % Households |
| Under 35 Years | 62 | 25.6% |
| 35 to 44 Years | 7 | 2.9% |
| 45 to 54 Years | 46 | 19.0% |
| 55 to 64 Years | 65 | 26.9% |
| 65 to 74 Years | 33 | 13.6% |
| 75 to 84 Years | 24 | 9.9% |
| 85 Years and Over | 5 | 2.1% |
| Total | 242 | 100.0% |
Housing Finances in Estherwood
Median Income by Occupancy in Estherwood
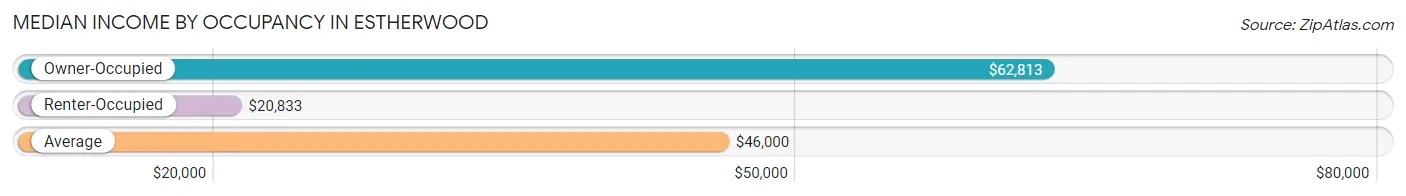
| Occupancy Type | # Households | Median Income |
| Owner-Occupied | 168 (69.4%) | $62,813 |
| Renter-Occupied | 74 (30.6%) | $20,833 |
| Average | 242 (100.0%) | $46,000 |
Occupancy by Householder Income Bracket in Estherwood
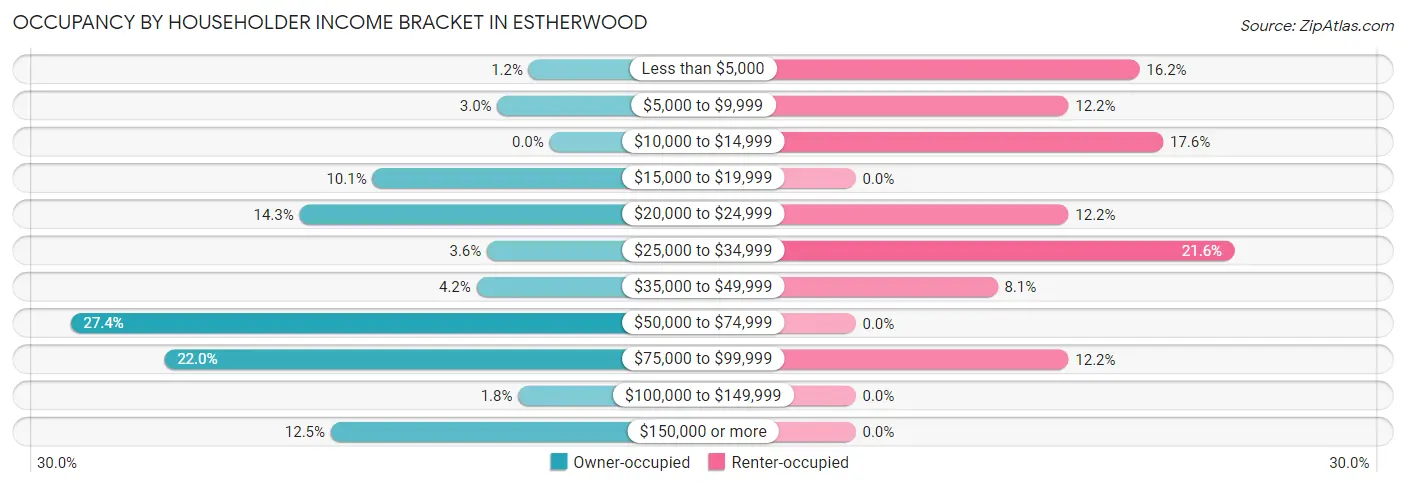
| Income Bracket | Owner-occupied | Renter-occupied |
| Less than $5,000 | 2 (1.2%) | 12 (16.2%) |
| $5,000 to $9,999 | 5 (3.0%) | 9 (12.2%) |
| $10,000 to $14,999 | 0 (0.0%) | 13 (17.6%) |
| $15,000 to $19,999 | 17 (10.1%) | 0 (0.0%) |
| $20,000 to $24,999 | 24 (14.3%) | 9 (12.2%) |
| $25,000 to $34,999 | 6 (3.6%) | 16 (21.6%) |
| $35,000 to $49,999 | 7 (4.2%) | 6 (8.1%) |
| $50,000 to $74,999 | 46 (27.4%) | 0 (0.0%) |
| $75,000 to $99,999 | 37 (22.0%) | 9 (12.2%) |
| $100,000 to $149,999 | 3 (1.8%) | 0 (0.0%) |
| $150,000 or more | 21 (12.5%) | 0 (0.0%) |
| Total | 168 (100.0%) | 74 (100.0%) |
Monthly Housing Cost Tiers in Estherwood
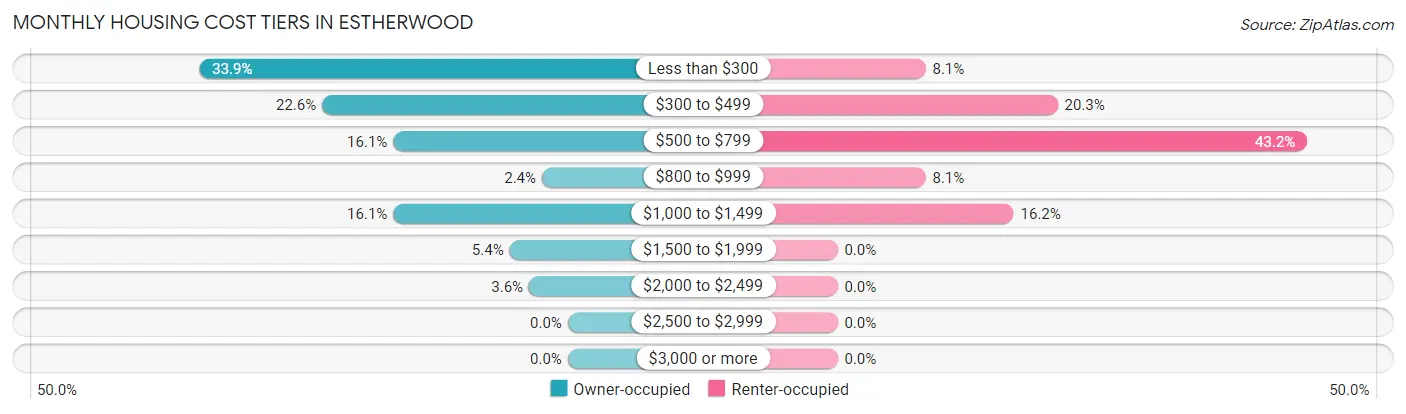
| Monthly Cost | Owner-occupied | Renter-occupied |
| Less than $300 | 57 (33.9%) | 6 (8.1%) |
| $300 to $499 | 38 (22.6%) | 15 (20.3%) |
| $500 to $799 | 27 (16.1%) | 32 (43.2%) |
| $800 to $999 | 4 (2.4%) | 6 (8.1%) |
| $1,000 to $1,499 | 27 (16.1%) | 12 (16.2%) |
| $1,500 to $1,999 | 9 (5.4%) | 0 (0.0%) |
| $2,000 to $2,499 | 6 (3.6%) | 0 (0.0%) |
| $2,500 to $2,999 | 0 (0.0%) | 0 (0.0%) |
| $3,000 or more | 0 (0.0%) | 0 (0.0%) |
| Total | 168 (100.0%) | 74 (100.0%) |
Physical Housing Characteristics in Estherwood
Housing Structures in Estherwood
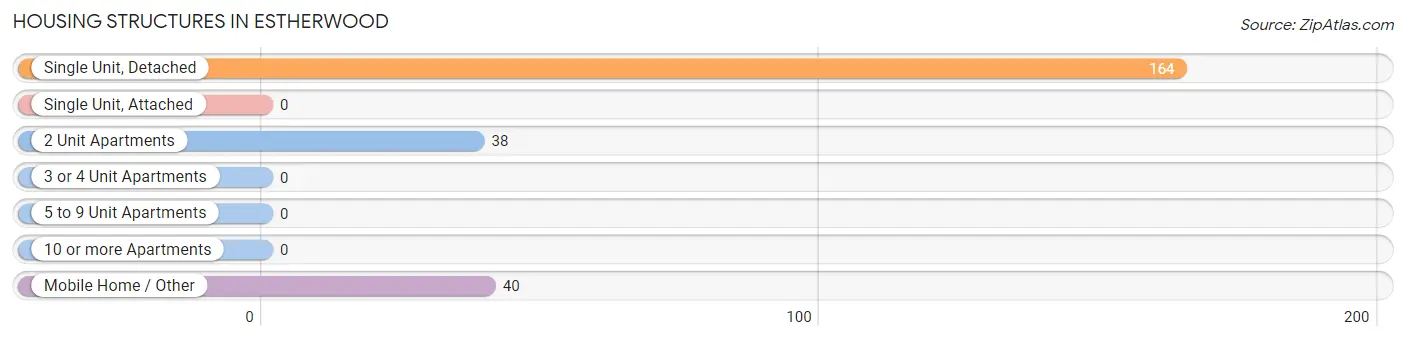
| Structure Type | # Housing Units | % Housing Units |
| Single Unit, Detached | 164 | 67.8% |
| Single Unit, Attached | 0 | 0.0% |
| 2 Unit Apartments | 38 | 15.7% |
| 3 or 4 Unit Apartments | 0 | 0.0% |
| 5 to 9 Unit Apartments | 0 | 0.0% |
| 10 or more Apartments | 0 | 0.0% |
| Mobile Home / Other | 40 | 16.5% |
| Total | 242 | 100.0% |
Housing Structures by Occupancy in Estherwood
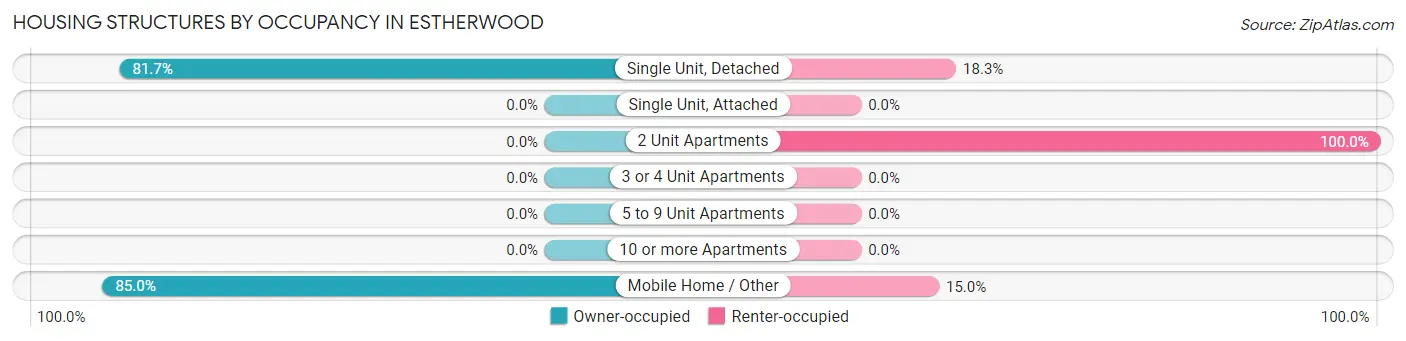
| Structure Type | Owner-occupied | Renter-occupied |
| Single Unit, Detached | 134 (81.7%) | 30 (18.3%) |
| Single Unit, Attached | 0 (0.0%) | 0 (0.0%) |
| 2 Unit Apartments | 0 (0.0%) | 38 (100.0%) |
| 3 or 4 Unit Apartments | 0 (0.0%) | 0 (0.0%) |
| 5 to 9 Unit Apartments | 0 (0.0%) | 0 (0.0%) |
| 10 or more Apartments | 0 (0.0%) | 0 (0.0%) |
| Mobile Home / Other | 34 (85.0%) | 6 (15.0%) |
| Total | 168 (69.4%) | 74 (30.6%) |
Housing Structures by Number of Rooms in Estherwood
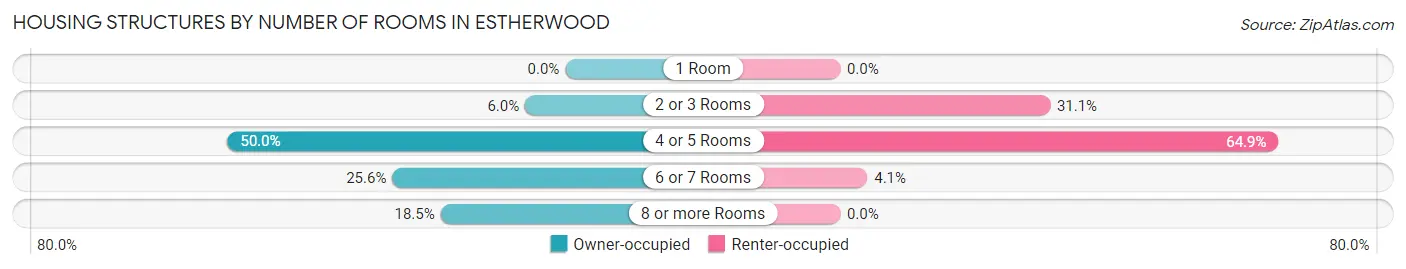
| Number of Rooms | Owner-occupied | Renter-occupied |
| 1 Room | 0 (0.0%) | 0 (0.0%) |
| 2 or 3 Rooms | 10 (5.9%) | 23 (31.1%) |
| 4 or 5 Rooms | 84 (50.0%) | 48 (64.9%) |
| 6 or 7 Rooms | 43 (25.6%) | 3 (4.1%) |
| 8 or more Rooms | 31 (18.4%) | 0 (0.0%) |
| Total | 168 (100.0%) | 74 (100.0%) |
Housing Structure by Heating Type in Estherwood
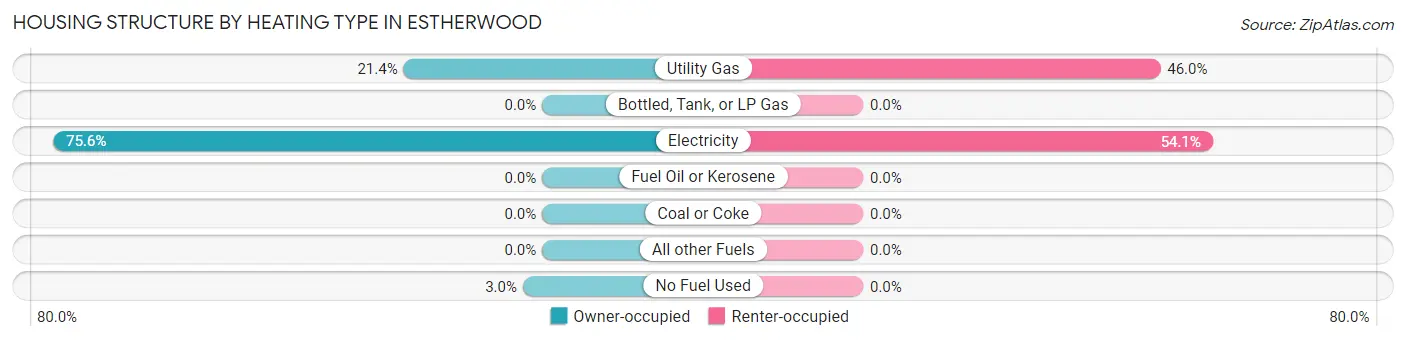
| Heating Type | Owner-occupied | Renter-occupied |
| Utility Gas | 36 (21.4%) | 34 (46.0%) |
| Bottled, Tank, or LP Gas | 0 (0.0%) | 0 (0.0%) |
| Electricity | 127 (75.6%) | 40 (54.0%) |
| Fuel Oil or Kerosene | 0 (0.0%) | 0 (0.0%) |
| Coal or Coke | 0 (0.0%) | 0 (0.0%) |
| All other Fuels | 0 (0.0%) | 0 (0.0%) |
| No Fuel Used | 5 (3.0%) | 0 (0.0%) |
| Total | 168 (100.0%) | 74 (100.0%) |
Household Vehicle Usage in Estherwood
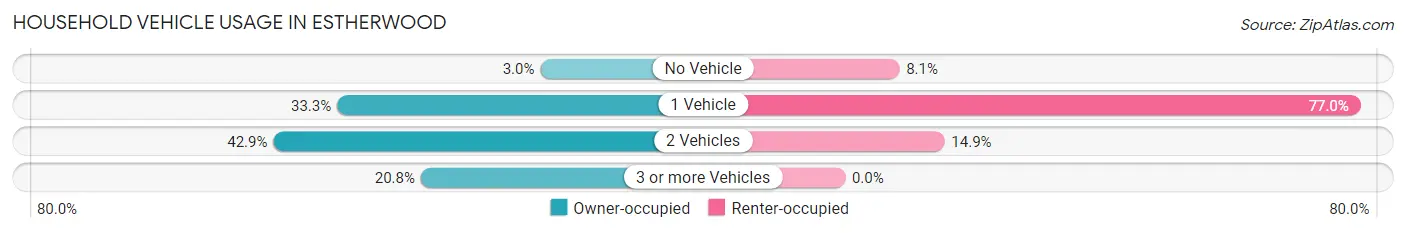
| Vehicles per Household | Owner-occupied | Renter-occupied |
| No Vehicle | 5 (3.0%) | 6 (8.1%) |
| 1 Vehicle | 56 (33.3%) | 57 (77.0%) |
| 2 Vehicles | 72 (42.9%) | 11 (14.9%) |
| 3 or more Vehicles | 35 (20.8%) | 0 (0.0%) |
| Total | 168 (100.0%) | 74 (100.0%) |
Real Estate & Mortgages in Estherwood
Real Estate and Mortgage Overview in Estherwood
| Characteristic | Without Mortgage | With Mortgage |
| Housing Units | 109 | 59 |
| Median Property Value | $73,500 | $121,200 |
| Median Household Income | $58,750 | $15 |
| Monthly Housing Costs | $296 | $0 |
| Real Estate Taxes | $199 | $11 |
Property Value by Mortgage Status in Estherwood
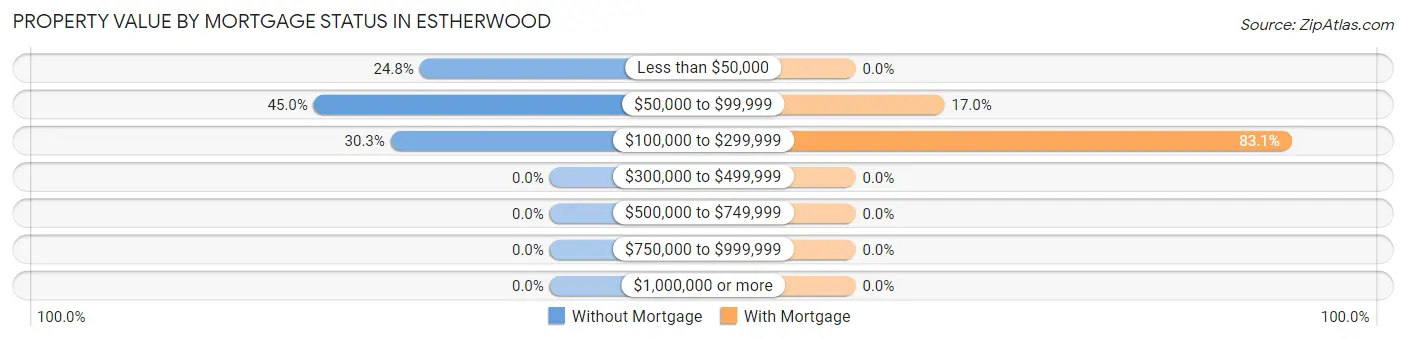
| Property Value | Without Mortgage | With Mortgage |
| Less than $50,000 | 27 (24.8%) | 0 (0.0%) |
| $50,000 to $99,999 | 49 (45.0%) | 10 (17.0%) |
| $100,000 to $299,999 | 33 (30.3%) | 49 (83.1%) |
| $300,000 to $499,999 | 0 (0.0%) | 0 (0.0%) |
| $500,000 to $749,999 | 0 (0.0%) | 0 (0.0%) |
| $750,000 to $999,999 | 0 (0.0%) | 0 (0.0%) |
| $1,000,000 or more | 0 (0.0%) | 0 (0.0%) |
| Total | 109 (100.0%) | 59 (100.0%) |
Household Income by Mortgage Status in Estherwood
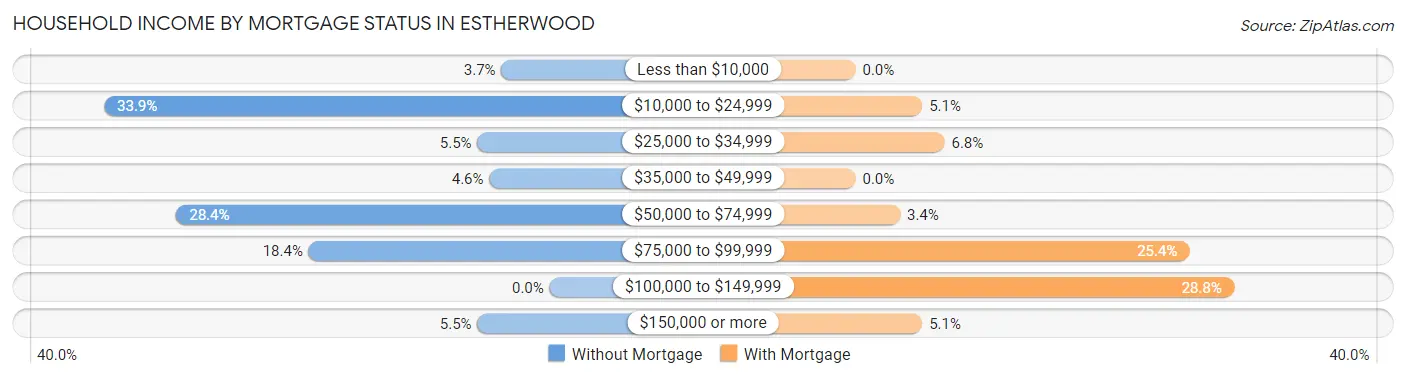
| Household Income | Without Mortgage | With Mortgage |
| Less than $10,000 | 4 (3.7%) | 0 (0.0%) |
| $10,000 to $24,999 | 37 (33.9%) | 3 (5.1%) |
| $25,000 to $34,999 | 6 (5.5%) | 4 (6.8%) |
| $35,000 to $49,999 | 5 (4.6%) | 0 (0.0%) |
| $50,000 to $74,999 | 31 (28.4%) | 2 (3.4%) |
| $75,000 to $99,999 | 20 (18.3%) | 15 (25.4%) |
| $100,000 to $149,999 | 0 (0.0%) | 17 (28.8%) |
| $150,000 or more | 6 (5.5%) | 3 (5.1%) |
| Total | 109 (100.0%) | 59 (100.0%) |
Property Value to Household Income Ratio in Estherwood
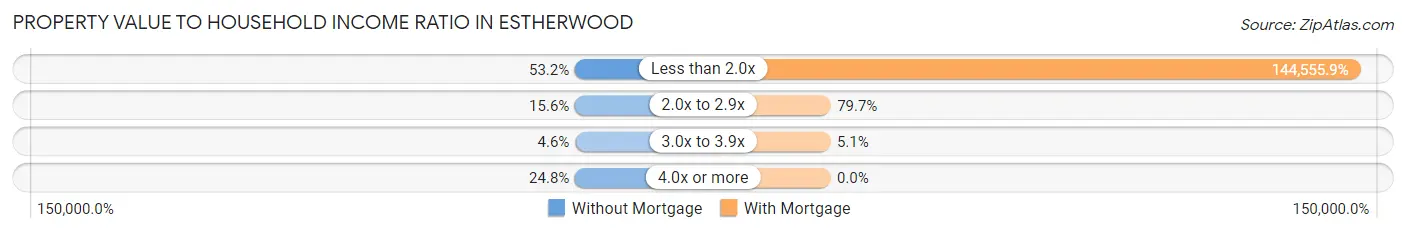
| Value-to-Income Ratio | Without Mortgage | With Mortgage |
| Less than 2.0x | 58 (53.2%) | 85,288 (144,555.9%) |
| 2.0x to 2.9x | 17 (15.6%) | 47 (79.7%) |
| 3.0x to 3.9x | 5 (4.6%) | 3 (5.1%) |
| 4.0x or more | 27 (24.8%) | 0 (0.0%) |
| Total | 109 (100.0%) | 59 (100.0%) |
Real Estate Taxes by Mortgage Status in Estherwood
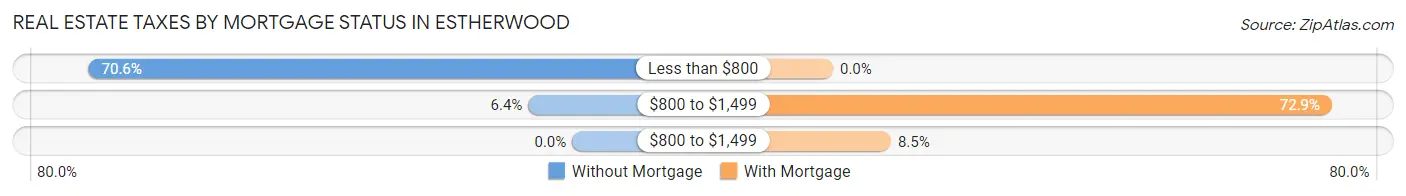
| Property Taxes | Without Mortgage | With Mortgage |
| Less than $800 | 77 (70.6%) | 0 (0.0%) |
| $800 to $1,499 | 7 (6.4%) | 43 (72.9%) |
| $800 to $1,499 | 0 (0.0%) | 5 (8.5%) |
| Total | 109 (100.0%) | 59 (100.0%) |
Health & Disability in Estherwood
Health Insurance Coverage by Age in Estherwood
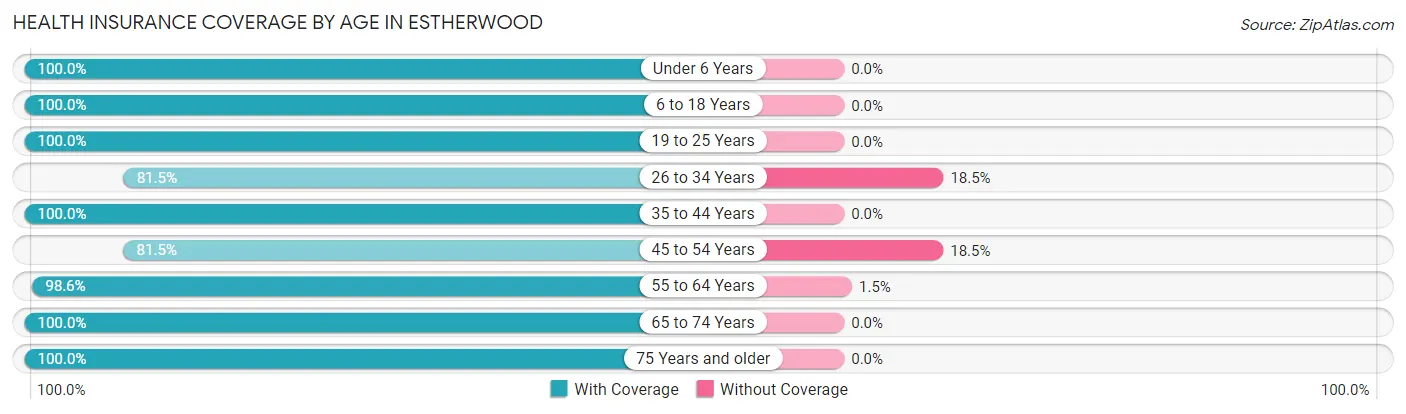
| Age Bracket | With Coverage | Without Coverage |
| Under 6 Years | 86 (100.0%) | 0 (0.0%) |
| 6 to 18 Years | 116 (100.0%) | 0 (0.0%) |
| 19 to 25 Years | 59 (100.0%) | 0 (0.0%) |
| 26 to 34 Years | 97 (81.5%) | 22 (18.5%) |
| 35 to 44 Years | 42 (100.0%) | 0 (0.0%) |
| 45 to 54 Years | 53 (81.5%) | 12 (18.5%) |
| 55 to 64 Years | 136 (98.6%) | 2 (1.5%) |
| 65 to 74 Years | 69 (100.0%) | 0 (0.0%) |
| 75 Years and older | 43 (100.0%) | 0 (0.0%) |
| Total | 701 (95.1%) | 36 (4.9%) |
Health Insurance Coverage by Citizenship Status in Estherwood
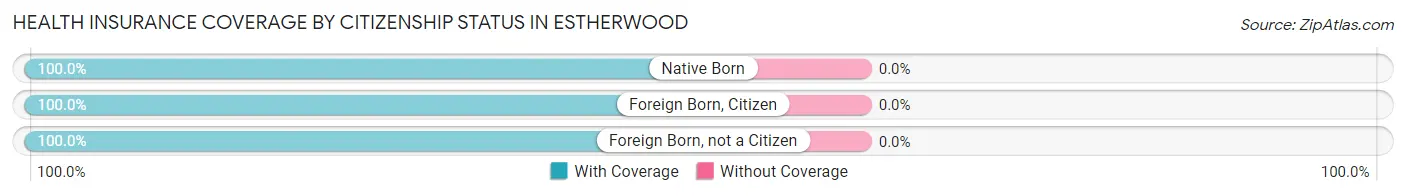
| Citizenship Status | With Coverage | Without Coverage |
| Native Born | 86 (100.0%) | 0 (0.0%) |
| Foreign Born, Citizen | 116 (100.0%) | 0 (0.0%) |
| Foreign Born, not a Citizen | 59 (100.0%) | 0 (0.0%) |
Health Insurance Coverage by Household Income in Estherwood
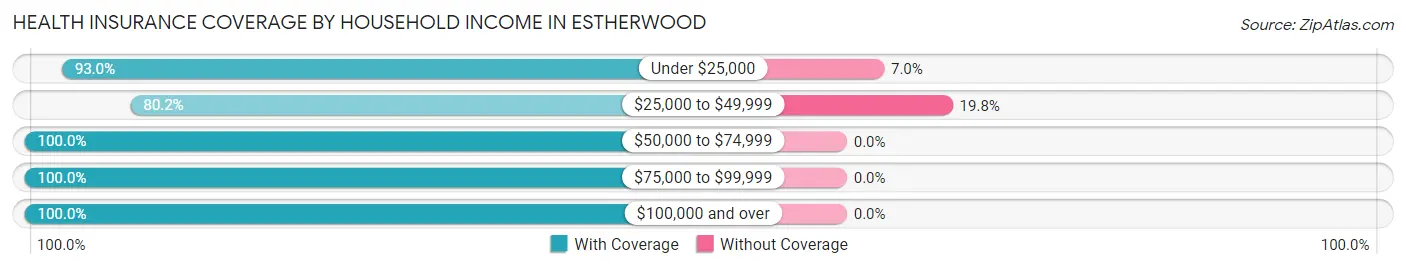
| Household Income | With Coverage | Without Coverage |
| Under $25,000 | 160 (93.0%) | 12 (7.0%) |
| $25,000 to $49,999 | 97 (80.2%) | 24 (19.8%) |
| $50,000 to $74,999 | 146 (100.0%) | 0 (0.0%) |
| $75,000 to $99,999 | 166 (100.0%) | 0 (0.0%) |
| $100,000 and over | 132 (100.0%) | 0 (0.0%) |
Public vs Private Health Insurance Coverage by Age in Estherwood
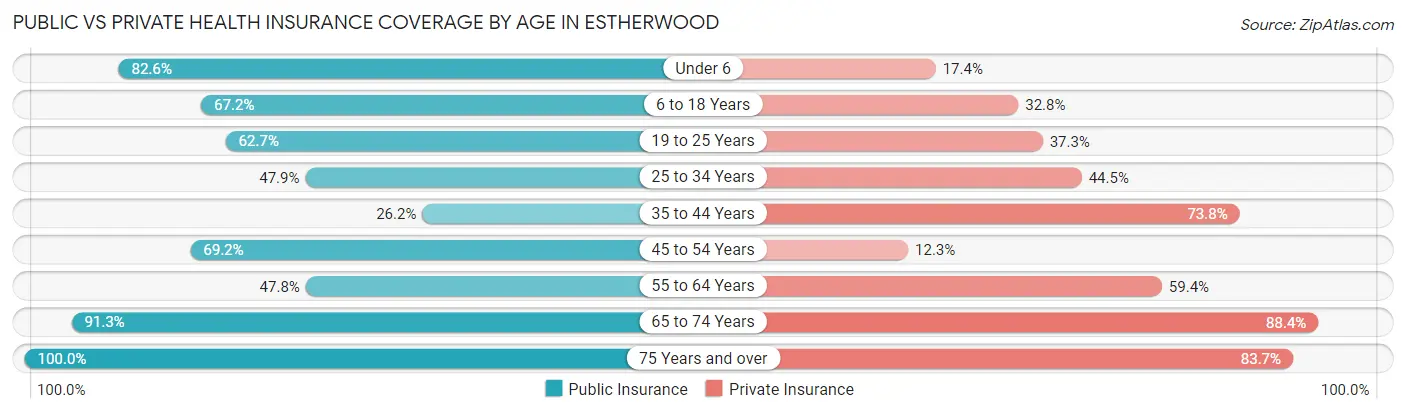
| Age Bracket | Public Insurance | Private Insurance |
| Under 6 | 71 (82.6%) | 15 (17.4%) |
| 6 to 18 Years | 78 (67.2%) | 38 (32.8%) |
| 19 to 25 Years | 37 (62.7%) | 22 (37.3%) |
| 25 to 34 Years | 57 (47.9%) | 53 (44.5%) |
| 35 to 44 Years | 11 (26.2%) | 31 (73.8%) |
| 45 to 54 Years | 45 (69.2%) | 8 (12.3%) |
| 55 to 64 Years | 66 (47.8%) | 82 (59.4%) |
| 65 to 74 Years | 63 (91.3%) | 61 (88.4%) |
| 75 Years and over | 43 (100.0%) | 36 (83.7%) |
| Total | 471 (63.9%) | 346 (46.9%) |
Disability Status by Sex by Age in Estherwood
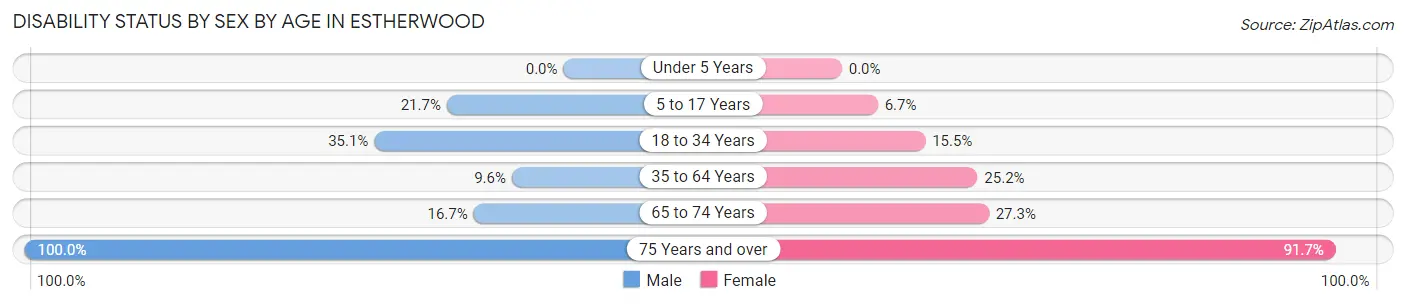
| Age Bracket | Male | Female |
| Under 5 Years | 0 (0.0%) | 0 (0.0%) |
| 5 to 17 Years | 21 (21.6%) | 3 (6.7%) |
| 18 to 34 Years | 33 (35.1%) | 13 (15.5%) |
| 35 to 64 Years | 9 (9.6%) | 38 (25.2%) |
| 65 to 74 Years | 6 (16.7%) | 9 (27.3%) |
| 75 Years and over | 19 (100.0%) | 22 (91.7%) |
Disability Class by Sex by Age in Estherwood
Disability Class: Hearing Difficulty
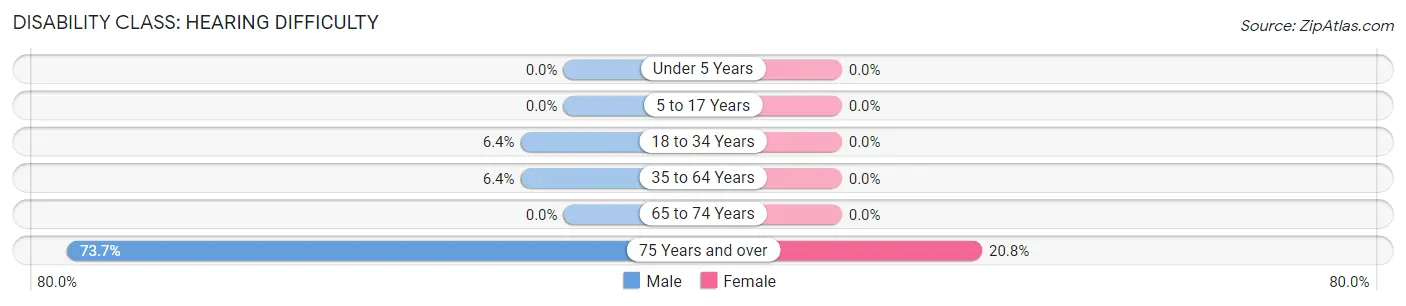
| Age Bracket | Male | Female |
| Under 5 Years | 0 (0.0%) | 0 (0.0%) |
| 5 to 17 Years | 0 (0.0%) | 0 (0.0%) |
| 18 to 34 Years | 6 (6.4%) | 0 (0.0%) |
| 35 to 64 Years | 6 (6.4%) | 0 (0.0%) |
| 65 to 74 Years | 0 (0.0%) | 0 (0.0%) |
| 75 Years and over | 14 (73.7%) | 5 (20.8%) |
Disability Class: Vision Difficulty
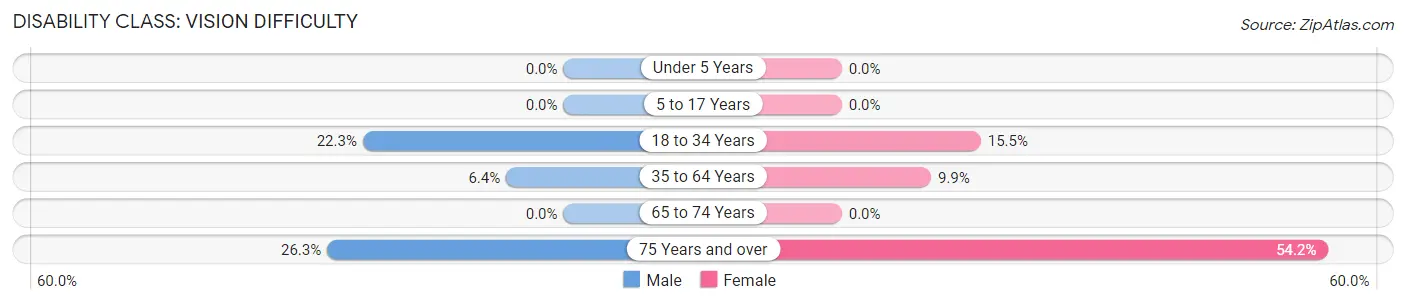
| Age Bracket | Male | Female |
| Under 5 Years | 0 (0.0%) | 0 (0.0%) |
| 5 to 17 Years | 0 (0.0%) | 0 (0.0%) |
| 18 to 34 Years | 21 (22.3%) | 13 (15.5%) |
| 35 to 64 Years | 6 (6.4%) | 15 (9.9%) |
| 65 to 74 Years | 0 (0.0%) | 0 (0.0%) |
| 75 Years and over | 5 (26.3%) | 13 (54.2%) |
Disability Class: Cognitive Difficulty
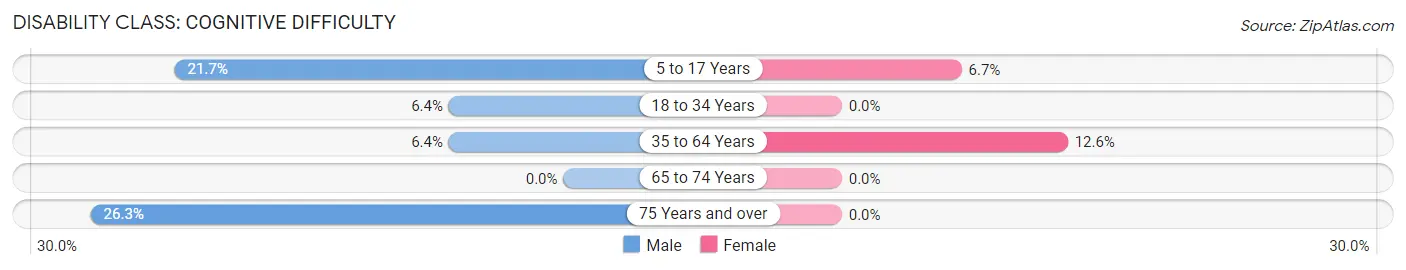
| Age Bracket | Male | Female |
| 5 to 17 Years | 21 (21.6%) | 3 (6.7%) |
| 18 to 34 Years | 6 (6.4%) | 0 (0.0%) |
| 35 to 64 Years | 6 (6.4%) | 19 (12.6%) |
| 65 to 74 Years | 0 (0.0%) | 0 (0.0%) |
| 75 Years and over | 5 (26.3%) | 0 (0.0%) |
Disability Class: Ambulatory Difficulty
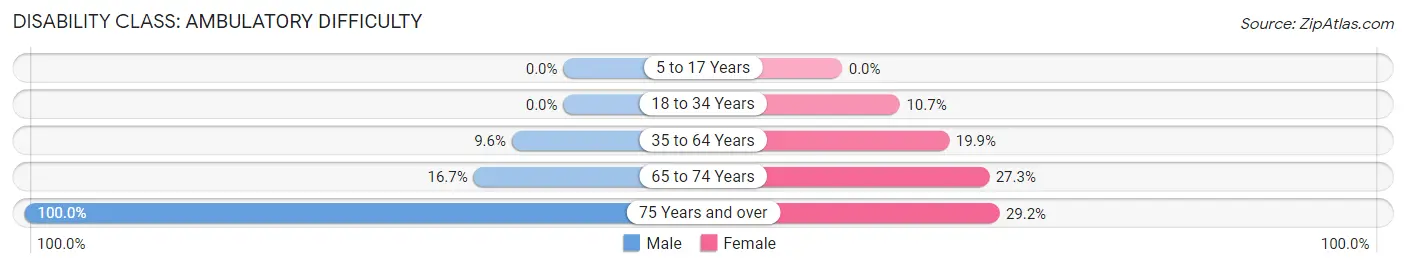
| Age Bracket | Male | Female |
| 5 to 17 Years | 0 (0.0%) | 0 (0.0%) |
| 18 to 34 Years | 0 (0.0%) | 9 (10.7%) |
| 35 to 64 Years | 9 (9.6%) | 30 (19.9%) |
| 65 to 74 Years | 6 (16.7%) | 9 (27.3%) |
| 75 Years and over | 19 (100.0%) | 7 (29.2%) |
Disability Class: Self-Care Difficulty
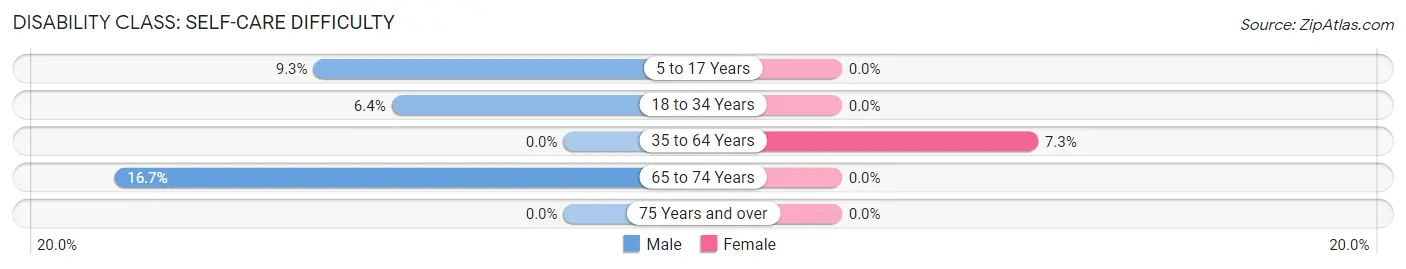
| Age Bracket | Male | Female |
| 5 to 17 Years | 9 (9.3%) | 0 (0.0%) |
| 18 to 34 Years | 6 (6.4%) | 0 (0.0%) |
| 35 to 64 Years | 0 (0.0%) | 11 (7.3%) |
| 65 to 74 Years | 6 (16.7%) | 0 (0.0%) |
| 75 Years and over | 0 (0.0%) | 0 (0.0%) |
Technology Access in Estherwood
Computing Device Access in Estherwood
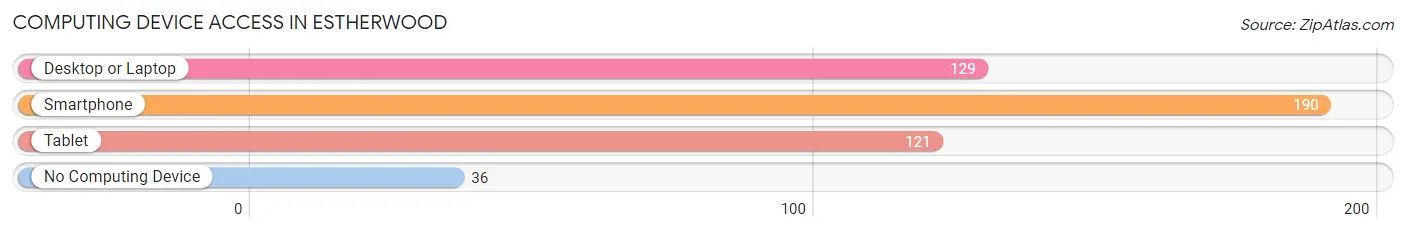
| Device Type | # Households | % Households |
| Desktop or Laptop | 129 | 53.3% |
| Smartphone | 190 | 78.5% |
| Tablet | 121 | 50.0% |
| No Computing Device | 36 | 14.9% |
| Total | 242 | 100.0% |
Internet Access in Estherwood
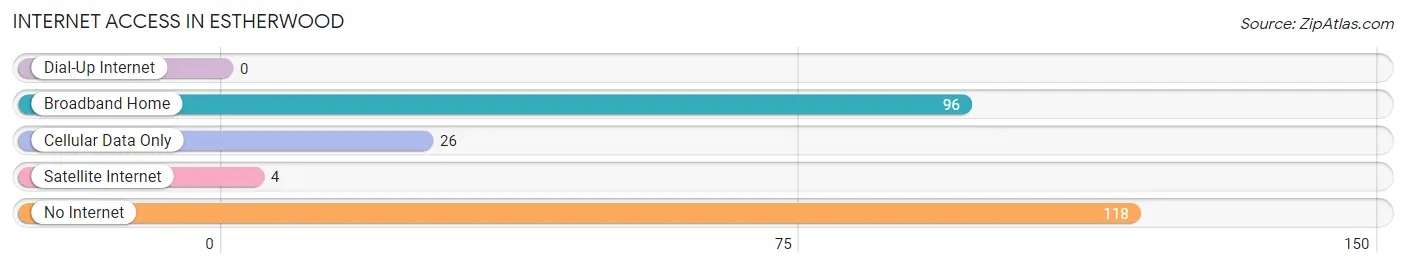
| Internet Type | # Households | % Households |
| Dial-Up Internet | 0 | 0.0% |
| Broadband Home | 96 | 39.7% |
| Cellular Data Only | 26 | 10.7% |
| Satellite Internet | 4 | 1.7% |
| No Internet | 118 | 48.8% |
| Total | 242 | 100.0% |
Estherwood Summary
Estherwood is a small town located in Acadia Parish, Louisiana. It is situated on the banks of the Mermentau River, approximately 20 miles south of Crowley, the parish seat. The town was founded in 1883 and named after Esther, the daughter of one of the first settlers. The population of Estherwood was 1,093 at the 2010 census, making it the second-smallest incorporated town in the state.
Geography
Estherwood is located at 30°17'25" North, 92°17'45" West (30.290278, -92.295833). According to the United States Census Bureau, the town has a total area of 1.2 square miles (3.1 km2), all land.
The town is located in the flat, coastal plain of south-central Louisiana. The terrain is mostly flat, with some rolling hills. The climate is humid subtropical, with hot, humid summers and mild winters. The average annual temperature is 68°F (20°C).
Economy
Estherwood is a small, rural town with a limited economy. The primary industries are agriculture and oil and gas production. The town is home to several small businesses, including a grocery store, a hardware store, and a few restaurants.
The town is also home to a number of small farms, which produce a variety of crops, including corn, soybeans, and cotton. The town is also home to a number of oil and gas wells, which provide jobs for many of the town's residents.
Demographics
As of the 2010 census, there were 1,093 people, 431 households, and 294 families residing in the town. The population density was 908.3 people per square mile (351.2/km2). There were 486 housing units at an average density of 405.8 per square mile (156.7/km2). The racial makeup of the town was 79.2% White, 17.7% African American, 0.2% Native American, 0.2% Asian, 0.1% Pacific Islander, 0.9% from other races, and 1.7% from two or more races. Hispanic or Latino of any race were 2.2% of the population.
There were 431 households, out of which 28.2% had children under the age of 18 living with them, 48.3% were married couples living together, 14.2% had a female householder with no husband present, and 33.2% were non-families. 29.2% of all households were made up of individuals, and 14.2% had someone living alone who was 65 years of age or older. The average household size was 2.53 and the average family size was 3.13.
In the town, the population was spread out, with 25.2% under the age of 18, 8.2% from 18 to 24, 24.2% from 25 to 44, 25.2% from 45 to 64, and 17.2% who were 65 years of age or older. The median age was 39 years. For every 100 females, there were 91.2 males. For every 100 females age 18 and over, there were 87.2 males.
The median income for a household in the town was $25,000, and the median income for a family was $31,250. Males had a median income of $30,000 versus $19,375 for females. The per capita income for the town was $13,945. About 17.2% of families and 20.2% of the population were below the poverty line, including 28.2% of those under age 18 and 15.2% of those age 65 or over.
Common Questions
What is Per Capita Income in Estherwood?
Per Capita income in Estherwood is $23,849.
What is the Median Family Income in Estherwood?
Median Family Income in Estherwood is $60,147.
What is the Median Household income in Estherwood?
Median Household Income in Estherwood is $46,000.
What is Income or Wage Gap in Estherwood?
Income or Wage Gap in Estherwood is 71.1%.
Women in Estherwood earn 28.9 cents for every dollar earned by a man.
What is Inequality or Gini Index in Estherwood?
Inequality or Gini Index in Estherwood is 0.53.
What is the Total Population of Estherwood?
Total Population of Estherwood is 737.
What is the Total Male Population of Estherwood?
Total Male Population of Estherwood is 378.
What is the Total Female Population of Estherwood?
Total Female Population of Estherwood is 359.
What is the Ratio of Males per 100 Females in Estherwood?
There are 105.29 Males per 100 Females in Estherwood.
What is the Ratio of Females per 100 Males in Estherwood?
There are 94.97 Females per 100 Males in Estherwood.
What is the Median Population Age in Estherwood?
Median Population Age in Estherwood is 31.5 Years.
What is the Average Family Size in Estherwood
Average Family Size in Estherwood is 3.6 People.
What is the Average Household Size in Estherwood
Average Household Size in Estherwood is 3.0 People.
How Large is the Labor Force in Estherwood?
There are 277 People in the Labor Forcein in Estherwood.
What is the Percentage of People in the Labor Force in Estherwood?
51.2% of People are in the Labor Force in Estherwood.
What is the Unemployment Rate in Estherwood?
Unemployment Rate in Estherwood is 19.9%.