Agenda, KS Map & Demographics
Agenda Map
Agenda Overview
$34,975
PER CAPITA INCOME
$43,750
AVG FAMILY INCOME
$44,531
AVG HOUSEHOLD INCOME
12.7%
WAGE / INCOME GAP [ % ]
87.3¢/ $1
WAGE / INCOME GAP [ $ ]
0.36
INEQUALITY / GINI INDEX
59
TOTAL POPULATION
34
MALE POPULATION
25
FEMALE POPULATION
136.00
MALES / 100 FEMALES
73.53
FEMALES / 100 MALES
62.3
MEDIAN AGE
2.2
AVG FAMILY SIZE
1.8
AVG HOUSEHOLD SIZE
30
LABOR FORCE [ PEOPLE ]
50.8%
PERCENT IN LABOR FORCE
Agenda Zip Codes
Agenda Area Codes
Income in Agenda
Income Overview in Agenda
Per Capita Income in Agenda is $34,975, while median incomes of families and households are $43,750 and $44,531 respectively.
| Characteristic | Number | Measure |
| Per Capita Income | 59 | $34,975 |
| Median Family Income | 20 | $43,750 |
| Mean Family Income | 20 | $47,480 |
| Median Household Income | 33 | $44,531 |
| Mean Household Income | 33 | $63,245 |
| Income Deficit | 20 | $0 |
| Wage / Income Gap (%) | 59 | 12.70% |
| Wage / Income Gap ($) | 59 | 87.30¢ per $1 |
| Gini / Inequality Index | 59 | 0.36 |
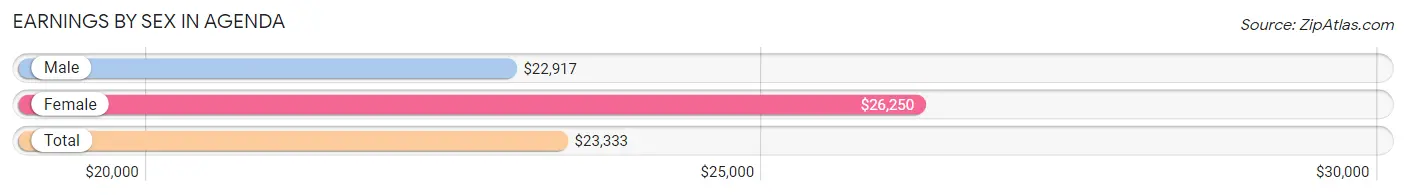
Earnings by Sex in Agenda
Average Earnings in Agenda are $23,333, $22,917 for men and $26,250 for women, a difference of 12.7%.
| Sex | Number | Average Earnings |
| Male | 24 (70.6%) | $22,917 |
| Female | 10 (29.4%) | $26,250 |
| Total | 34 (100.0%) | $23,333 |
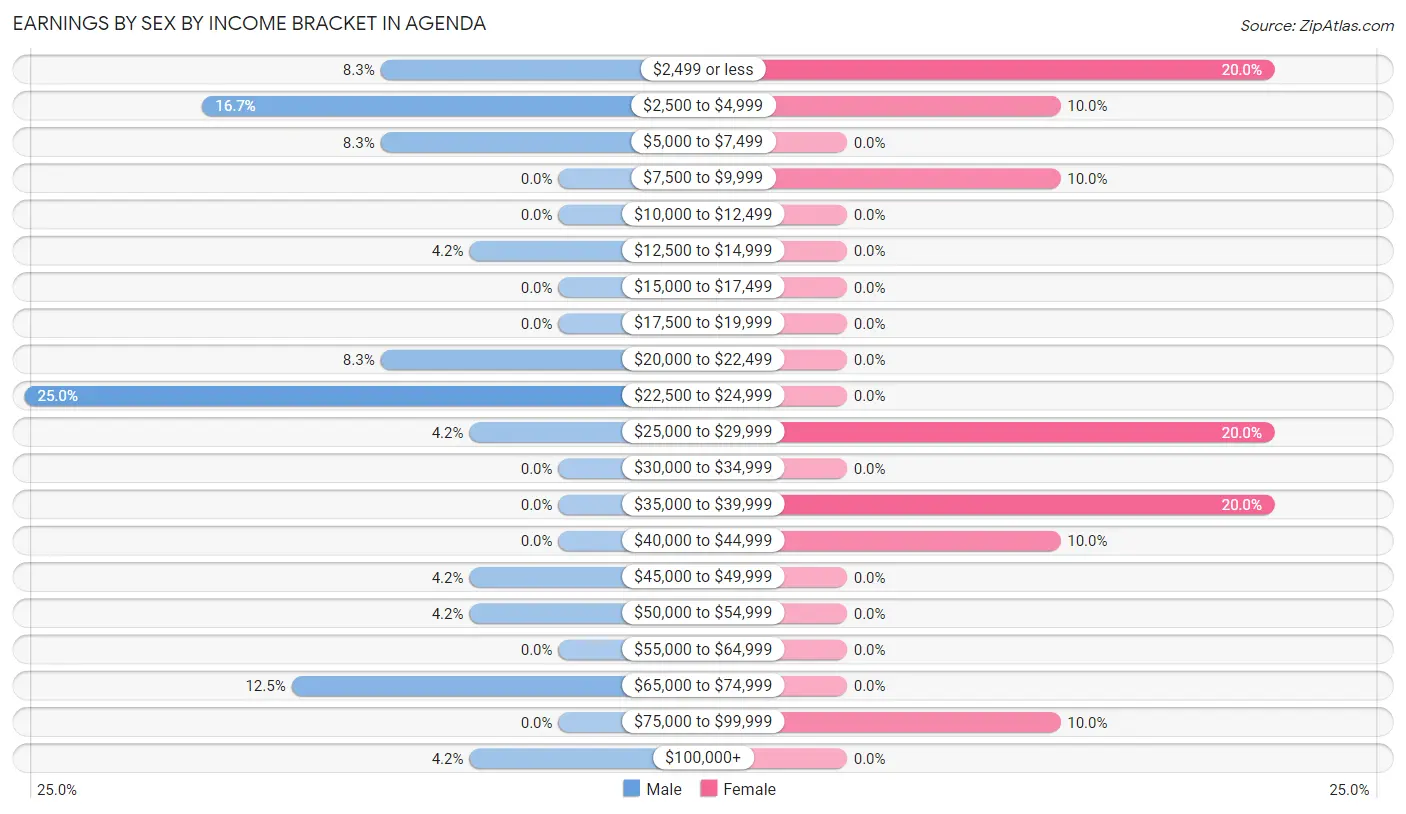
Earnings by Sex by Income Bracket in Agenda
The most common earnings brackets in Agenda are $22,500 to $24,999 for men (6 | 25.0%) and $2,499 or less for women (2 | 20.0%).
| Income | Male | Female |
| $2,499 or less | 2 (8.3%) | 2 (20.0%) |
| $2,500 to $4,999 | 4 (16.7%) | 1 (10.0%) |
| $5,000 to $7,499 | 2 (8.3%) | 0 (0.0%) |
| $7,500 to $9,999 | 0 (0.0%) | 1 (10.0%) |
| $10,000 to $12,499 | 0 (0.0%) | 0 (0.0%) |
| $12,500 to $14,999 | 1 (4.2%) | 0 (0.0%) |
| $15,000 to $17,499 | 0 (0.0%) | 0 (0.0%) |
| $17,500 to $19,999 | 0 (0.0%) | 0 (0.0%) |
| $20,000 to $22,499 | 2 (8.3%) | 0 (0.0%) |
| $22,500 to $24,999 | 6 (25.0%) | 0 (0.0%) |
| $25,000 to $29,999 | 1 (4.2%) | 2 (20.0%) |
| $30,000 to $34,999 | 0 (0.0%) | 0 (0.0%) |
| $35,000 to $39,999 | 0 (0.0%) | 2 (20.0%) |
| $40,000 to $44,999 | 0 (0.0%) | 1 (10.0%) |
| $45,000 to $49,999 | 1 (4.2%) | 0 (0.0%) |
| $50,000 to $54,999 | 1 (4.2%) | 0 (0.0%) |
| $55,000 to $64,999 | 0 (0.0%) | 0 (0.0%) |
| $65,000 to $74,999 | 3 (12.5%) | 0 (0.0%) |
| $75,000 to $99,999 | 0 (0.0%) | 1 (10.0%) |
| $100,000+ | 1 (4.2%) | 0 (0.0%) |
| Total | 24 (100.0%) | 10 (100.0%) |
Earnings by Sex by Educational Attainment in Agenda
| Educational Attainment | Male Income | Female Income |
| Less than High School | - | - |
| High School Diploma | - | - |
| College or Associate's Degree | - | - |
| Bachelor's Degree | - | - |
| Graduate Degree | - | - |
| Total | - | - |
Family Income in Agenda
Family Income Brackets in Agenda
According to the Agenda family income data, there are 8 families falling into the $35,000 to $49,999 income range, which is the most common income bracket and makes up 40.0% of all families.
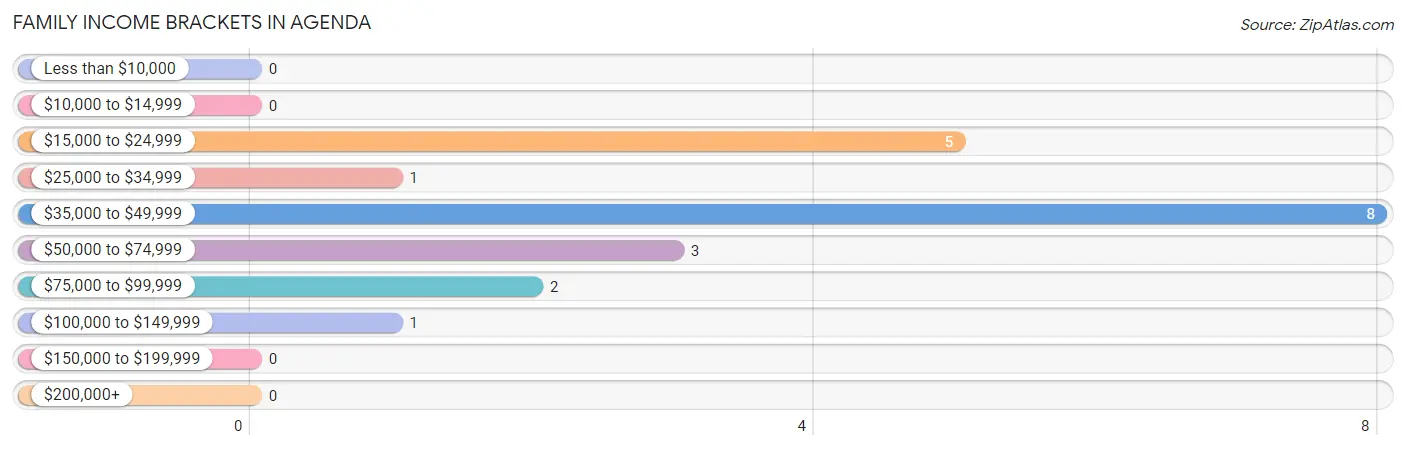
| Income Bracket | # Families | % Families |
| Less than $10,000 | 0 | 0.0% |
| $10,000 to $14,999 | 0 | 0.0% |
| $15,000 to $24,999 | 5 | 25.0% |
| $25,000 to $34,999 | 1 | 5.0% |
| $35,000 to $49,999 | 8 | 40.0% |
| $50,000 to $74,999 | 3 | 15.0% |
| $75,000 to $99,999 | 2 | 10.0% |
| $100,000 to $149,999 | 1 | 5.0% |
| $150,000 to $199,999 | 0 | 0.0% |
| $200,000+ | 0 | 0.0% |
Family Income by Famaliy Size in Agenda
2-person families (18 | 90.0%) account for the highest median family income in Agenda with $43,438 per family, while 2-person families (18 | 90.0%) have the highest median income of $21,719 per family member.
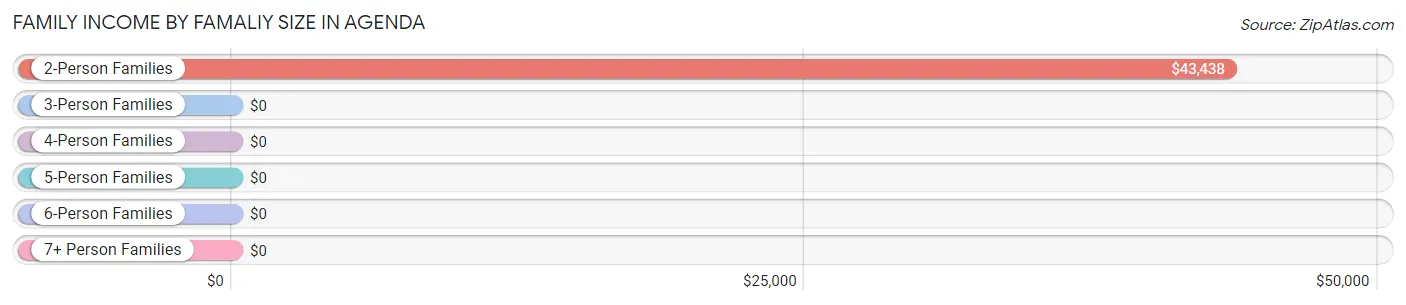
| Income Bracket | # Families | Median Income |
| 2-Person Families | 18 (90.0%) | $43,438 |
| 3-Person Families | 1 (5.0%) | $0 |
| 4-Person Families | 1 (5.0%) | $0 |
| 5-Person Families | 0 (0.0%) | $0 |
| 6-Person Families | 0 (0.0%) | $0 |
| 7+ Person Families | 0 (0.0%) | $0 |
| Total | 20 (100.0%) | $43,750 |
Family Income by Number of Earners in Agenda
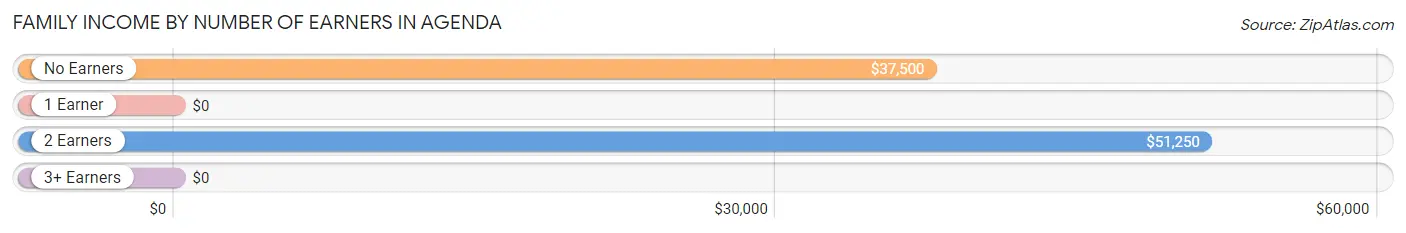
| Number of Earners | # Families | Median Income |
| No Earners | 8 (40.0%) | $37,500 |
| 1 Earner | 3 (15.0%) | $0 |
| 2 Earners | 8 (40.0%) | $51,250 |
| 3+ Earners | 1 (5.0%) | $0 |
| Total | 20 (100.0%) | $43,750 |
Household Income in Agenda
Household Income Brackets in Agenda
With 11 households falling in the category, the $35,000 to $49,999 income range is the most frequent in Agenda, accounting for 33.3% of all households.
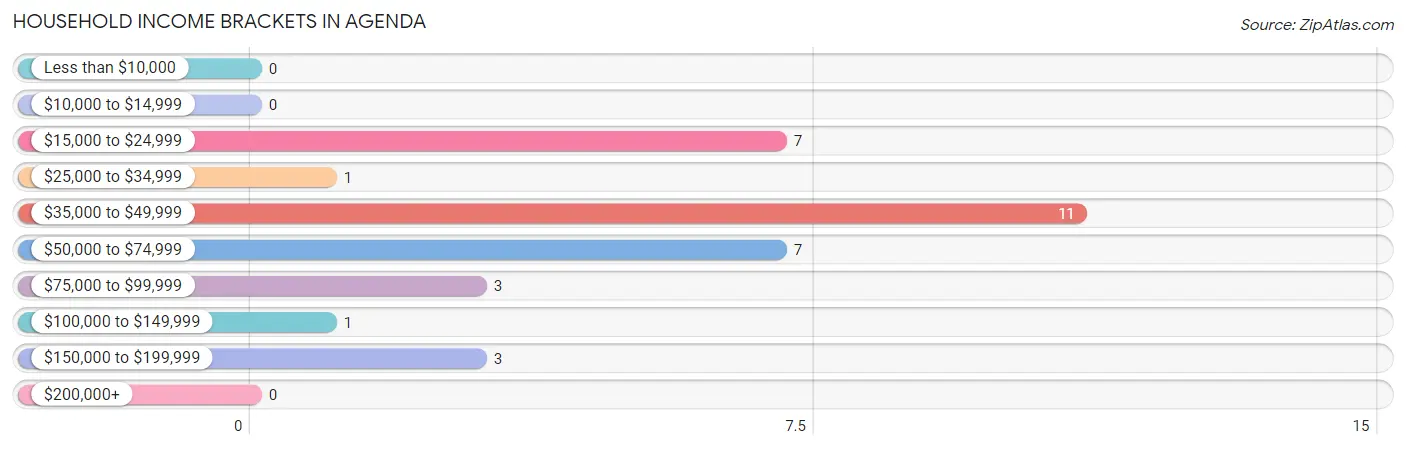
| Income Bracket | # Households | % Households |
| Less than $10,000 | 0 | 0.0% |
| $10,000 to $14,999 | 0 | 0.0% |
| $15,000 to $24,999 | 7 | 21.2% |
| $25,000 to $34,999 | 1 | 3.0% |
| $35,000 to $49,999 | 11 | 33.3% |
| $50,000 to $74,999 | 7 | 21.2% |
| $75,000 to $99,999 | 3 | 9.1% |
| $100,000 to $149,999 | 1 | 3.0% |
| $150,000 to $199,999 | 3 | 9.1% |
| $200,000+ | 0 | 0.0% |
Household Income by Householder Age in Agenda
The median household income in Agenda is $44,531, with the highest median household income of $66,250 found in the 45 to 64 years age bracket for the primary householder. A total of 10 households (30.3%) fall into this category. Meanwhile, the 15 to 24 years age bracket for the primary householder has the lowest median household income of $0, with 2 households (6.1%) in this group.
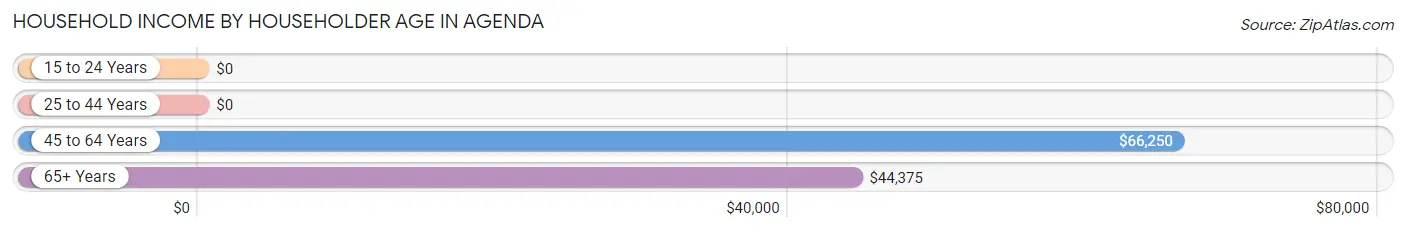
| Income Bracket | # Households | Median Income |
| 15 to 24 Years | 2 (6.1%) | $0 |
| 25 to 44 Years | 5 (15.1%) | $0 |
| 45 to 64 Years | 10 (30.3%) | $66,250 |
| 65+ Years | 16 (48.5%) | $44,375 |
| Total | 33 (100.0%) | $44,531 |
Poverty in Agenda
Income Below Poverty by Sex and Age in Agenda
With 8.8% poverty level for males and 16.0% for females among the residents of Agenda, 55 to 64 year old males and 55 to 64 year old females are the most vulnerable to poverty, with 3 males (50.0%) and 4 females (40.0%) in their respective age groups living below the poverty level.
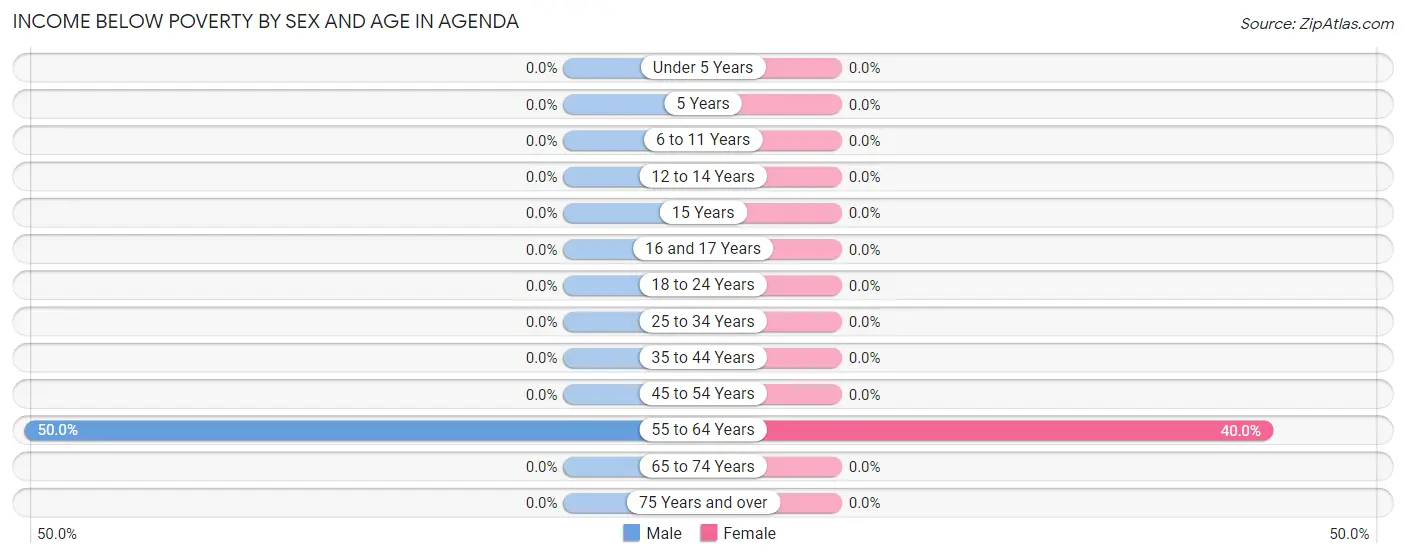
| Age Bracket | Male | Female |
| Under 5 Years | 0 (0.0%) | 0 (0.0%) |
| 5 Years | 0 (0.0%) | 0 (0.0%) |
| 6 to 11 Years | 0 (0.0%) | 0 (0.0%) |
| 12 to 14 Years | 0 (0.0%) | 0 (0.0%) |
| 15 Years | 0 (0.0%) | 0 (0.0%) |
| 16 and 17 Years | 0 (0.0%) | 0 (0.0%) |
| 18 to 24 Years | 0 (0.0%) | 0 (0.0%) |
| 25 to 34 Years | 0 (0.0%) | 0 (0.0%) |
| 35 to 44 Years | 0 (0.0%) | 0 (0.0%) |
| 45 to 54 Years | 0 (0.0%) | 0 (0.0%) |
| 55 to 64 Years | 3 (50.0%) | 4 (40.0%) |
| 65 to 74 Years | 0 (0.0%) | 0 (0.0%) |
| 75 Years and over | 0 (0.0%) | 0 (0.0%) |
| Total | 3 (8.8%) | 4 (16.0%) |
Income Above Poverty by Sex and Age in Agenda
According to the poverty statistics in Agenda, males aged 16 and 17 years and females aged 18 to 24 years are the age groups that are most secure financially, with 100.0% of males and 100.0% of females in these age groups living above the poverty line.
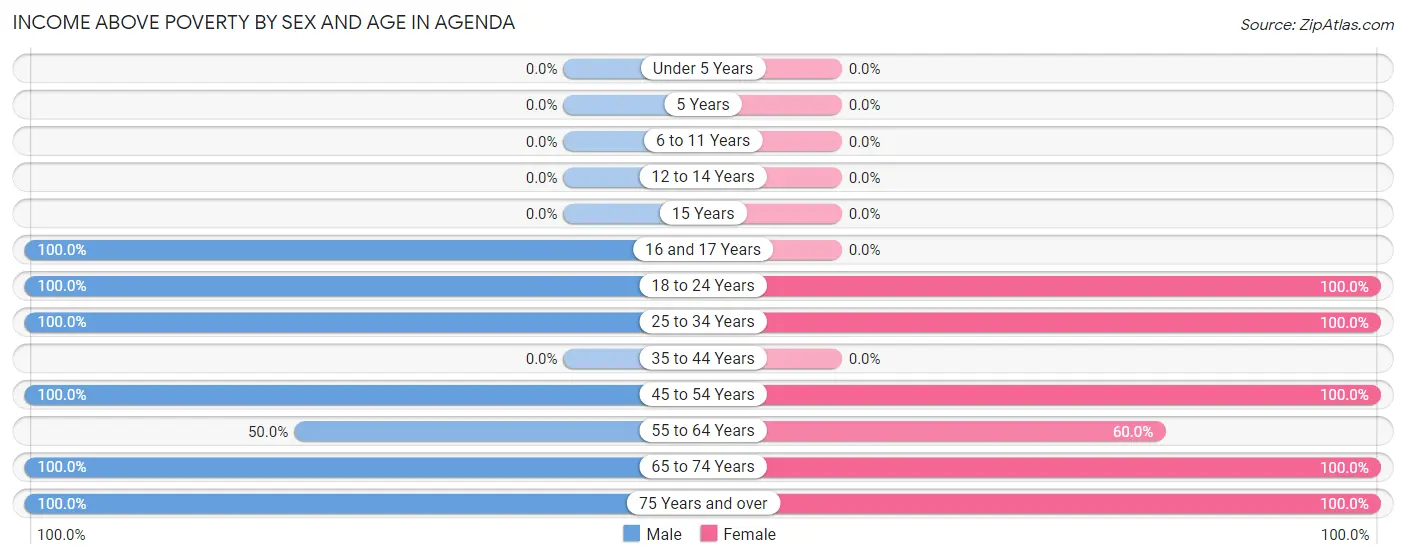
| Age Bracket | Male | Female |
| Under 5 Years | 0 (0.0%) | 0 (0.0%) |
| 5 Years | 0 (0.0%) | 0 (0.0%) |
| 6 to 11 Years | 0 (0.0%) | 0 (0.0%) |
| 12 to 14 Years | 0 (0.0%) | 0 (0.0%) |
| 15 Years | 0 (0.0%) | 0 (0.0%) |
| 16 and 17 Years | 2 (100.0%) | 0 (0.0%) |
| 18 to 24 Years | 6 (100.0%) | 2 (100.0%) |
| 25 to 34 Years | 5 (100.0%) | 3 (100.0%) |
| 35 to 44 Years | 0 (0.0%) | 0 (0.0%) |
| 45 to 54 Years | 1 (100.0%) | 1 (100.0%) |
| 55 to 64 Years | 3 (50.0%) | 6 (60.0%) |
| 65 to 74 Years | 8 (100.0%) | 2 (100.0%) |
| 75 Years and over | 6 (100.0%) | 7 (100.0%) |
| Total | 31 (91.2%) | 21 (84.0%) |
Income Below Poverty Among Married-Couple Families in Agenda
The poverty statistics for married-couple families in Agenda show that 15.8% or 3 of the total 19 families live below the poverty line. Families with no children have the highest poverty rate of 16.7%, comprising of 3 families. On the other hand, families with 1 or 2 children have the lowest poverty rate of 0.0%, which includes 0 families.
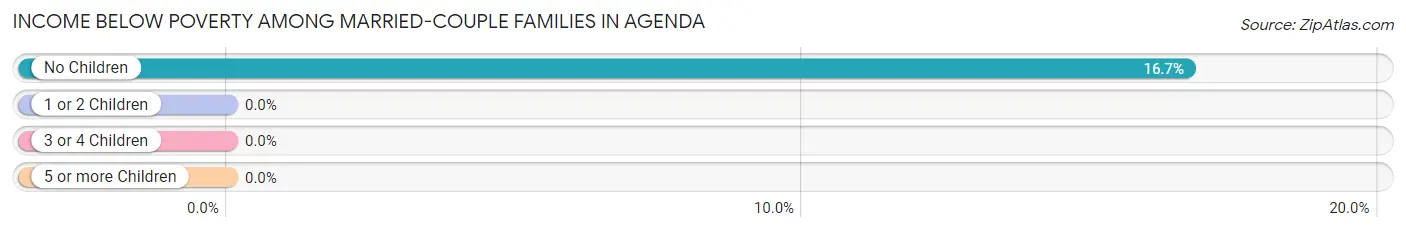
| Children | Above Poverty | Below Poverty |
| No Children | 15 (83.3%) | 3 (16.7%) |
| 1 or 2 Children | 1 (100.0%) | 0 (0.0%) |
| 3 or 4 Children | 0 (0.0%) | 0 (0.0%) |
| 5 or more Children | 0 (0.0%) | 0 (0.0%) |
| Total | 16 (84.2%) | 3 (15.8%) |
Income Below Poverty Among Single-Parent Households in Agenda
| Children | Single Father | Single Mother |
| No Children | 0 (0.0%) | 0 (0.0%) |
| 1 or 2 Children | 0 (0.0%) | 0 (0.0%) |
| 3 or 4 Children | 0 (0.0%) | 0 (0.0%) |
| 5 or more Children | 0 (0.0%) | 0 (0.0%) |
| Total | 0 (0.0%) | 0 (0.0%) |
Income Below Poverty Among Married-Couple vs Single-Parent Households in Agenda
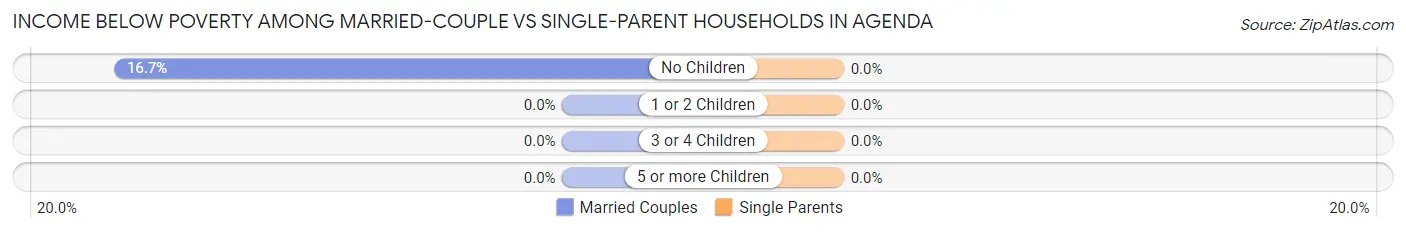
| Children | Married-Couple Families | Single-Parent Households |
| No Children | 3 (16.7%) | 0 (0.0%) |
| 1 or 2 Children | 0 (0.0%) | 0 (0.0%) |
| 3 or 4 Children | 0 (0.0%) | 0 (0.0%) |
| 5 or more Children | 0 (0.0%) | 0 (0.0%) |
| Total | 3 (15.8%) | 0 (0.0%) |
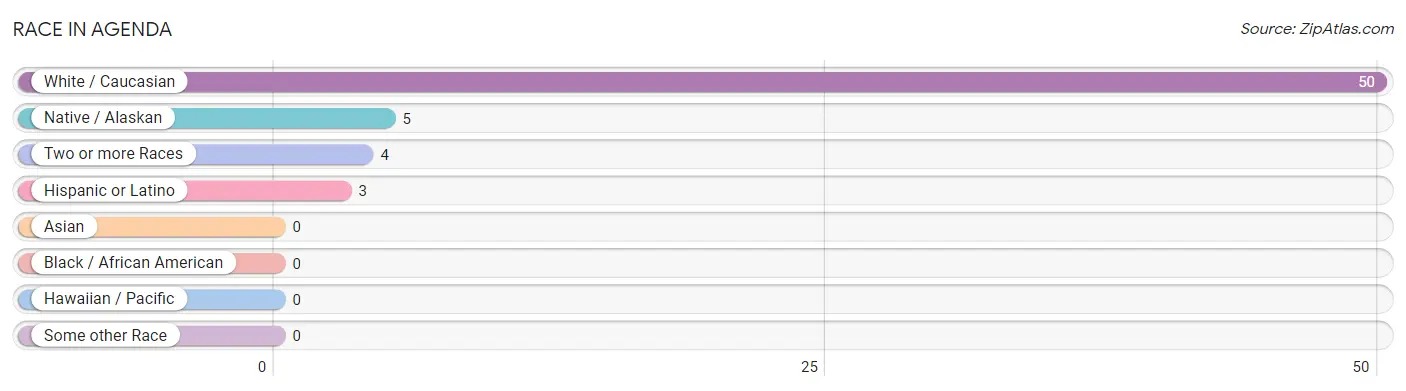
Race in Agenda
The most populous races in Agenda are White / Caucasian (50 | 84.8%), Native / Alaskan (5 | 8.5%), and Two or more Races (4 | 6.8%).
| Race | # Population | % Population |
| Asian | 0 | 0.0% |
| Black / African American | 0 | 0.0% |
| Hawaiian / Pacific | 0 | 0.0% |
| Hispanic or Latino | 3 | 5.1% |
| Native / Alaskan | 5 | 8.5% |
| White / Caucasian | 50 | 84.8% |
| Two or more Races | 4 | 6.8% |
| Some other Race | 0 | 0.0% |
| Total | 59 | 100.0% |
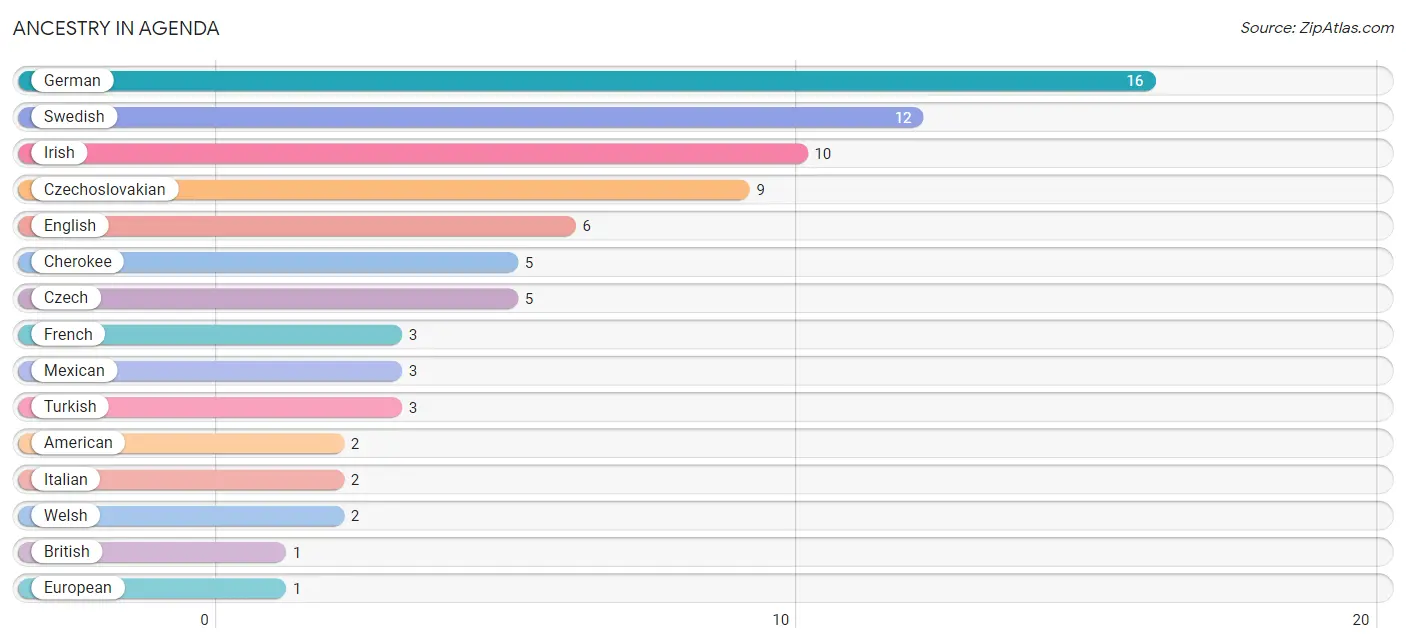
Ancestry in Agenda
The most populous ancestries reported in Agenda are German (16 | 27.1%), Swedish (12 | 20.3%), Irish (10 | 17.0%), Czechoslovakian (9 | 15.2%), and English (6 | 10.2%), together accounting for 89.8% of all Agenda residents.
| Ancestry | # Population | % Population |
| American | 2 | 3.4% |
| British | 1 | 1.7% |
| Cherokee | 5 | 8.5% |
| Czech | 5 | 8.5% |
| Czechoslovakian | 9 | 15.2% |
| English | 6 | 10.2% |
| European | 1 | 1.7% |
| French | 3 | 5.1% |
| German | 16 | 27.1% |
| Irish | 10 | 17.0% |
| Italian | 2 | 3.4% |
| Mexican | 3 | 5.1% |
| Swedish | 12 | 20.3% |
| Turkish | 3 | 5.1% |
| Welsh | 2 | 3.4% | View All 15 Rows |
Immigrants in Agenda
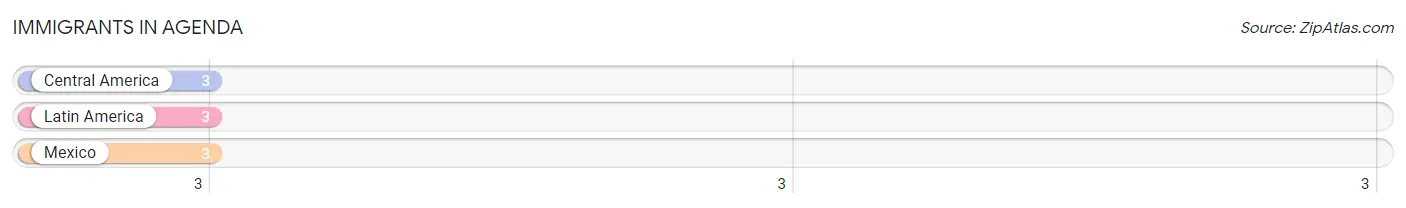
The most numerous immigrant groups reported in Agenda came from Central America (3 | 5.1%), Latin America (3 | 5.1%), and Mexico (3 | 5.1%), together accounting for 15.2% of all Agenda residents.
| Immigration Origin | # Population | % Population |
| Central America | 3 | 5.1% |
| Latin America | 3 | 5.1% |
| Mexico | 3 | 5.1% | View All 3 Rows |
Sex and Age in Agenda
Sex and Age in Agenda
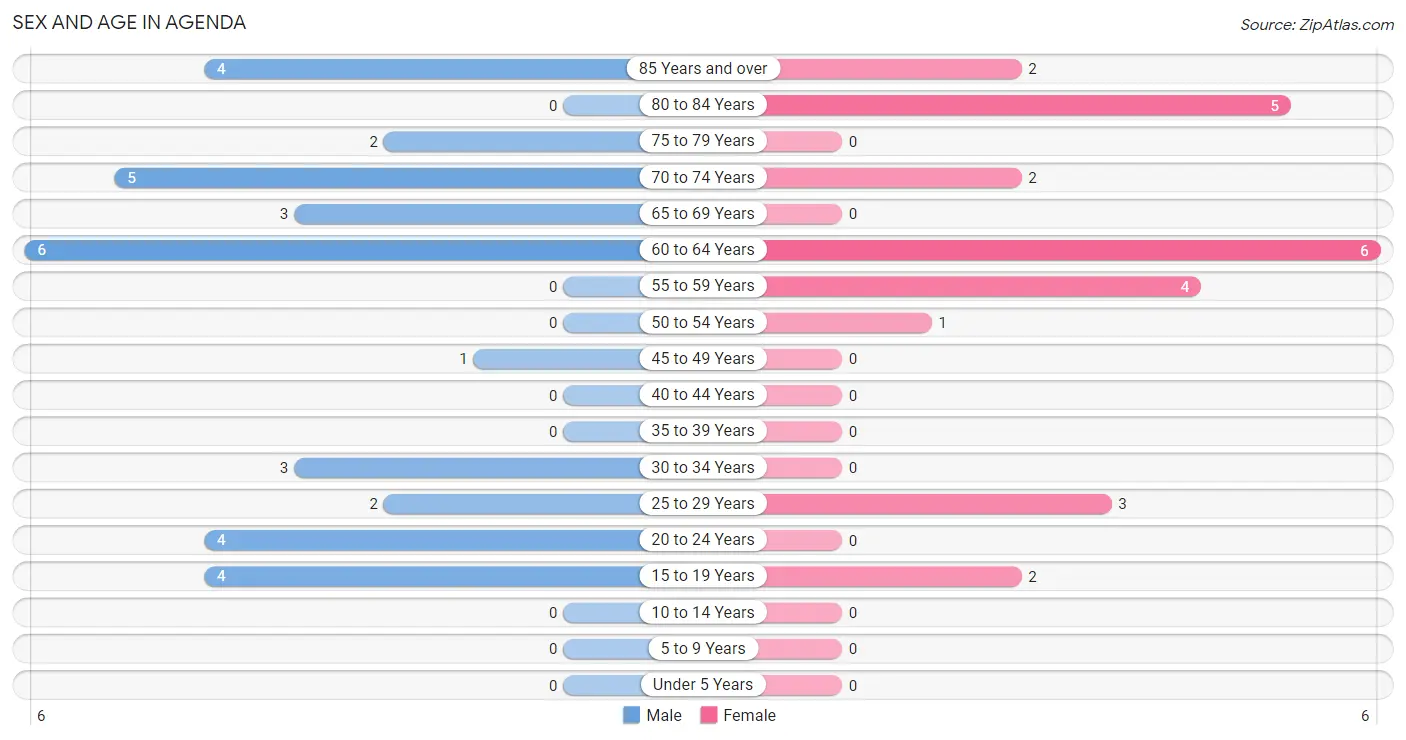
The most populous age groups in Agenda are 60 to 64 Years (6 | 17.6%) for men and 60 to 64 Years (6 | 24.0%) for women.
| Age Bracket | Male | Female |
| Under 5 Years | 0 (0.0%) | 0 (0.0%) |
| 5 to 9 Years | 0 (0.0%) | 0 (0.0%) |
| 10 to 14 Years | 0 (0.0%) | 0 (0.0%) |
| 15 to 19 Years | 4 (11.8%) | 2 (8.0%) |
| 20 to 24 Years | 4 (11.8%) | 0 (0.0%) |
| 25 to 29 Years | 2 (5.9%) | 3 (12.0%) |
| 30 to 34 Years | 3 (8.8%) | 0 (0.0%) |
| 35 to 39 Years | 0 (0.0%) | 0 (0.0%) |
| 40 to 44 Years | 0 (0.0%) | 0 (0.0%) |
| 45 to 49 Years | 1 (2.9%) | 0 (0.0%) |
| 50 to 54 Years | 0 (0.0%) | 1 (4.0%) |
| 55 to 59 Years | 0 (0.0%) | 4 (16.0%) |
| 60 to 64 Years | 6 (17.6%) | 6 (24.0%) |
| 65 to 69 Years | 3 (8.8%) | 0 (0.0%) |
| 70 to 74 Years | 5 (14.7%) | 2 (8.0%) |
| 75 to 79 Years | 2 (5.9%) | 0 (0.0%) |
| 80 to 84 Years | 0 (0.0%) | 5 (20.0%) |
| 85 Years and over | 4 (11.8%) | 2 (8.0%) |
| Total | 34 (100.0%) | 25 (100.0%) |
Families and Households in Agenda
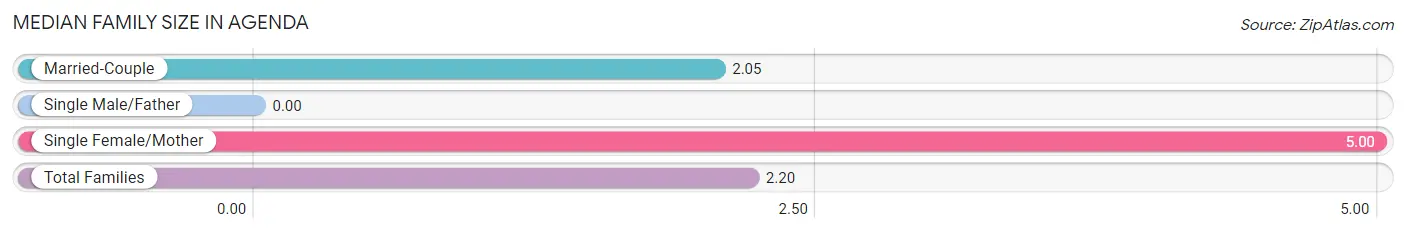
Median Family Size in Agenda
| Family Type | # Families | Family Size |
| Married-Couple | 19 (95.0%) | 2.05 |
| Single Male/Father | 0 (0.0%) | - |
| Single Female/Mother | 1 (5.0%) | 5.00 |
| Total Families | 20 (100.0%) | 2.20 |
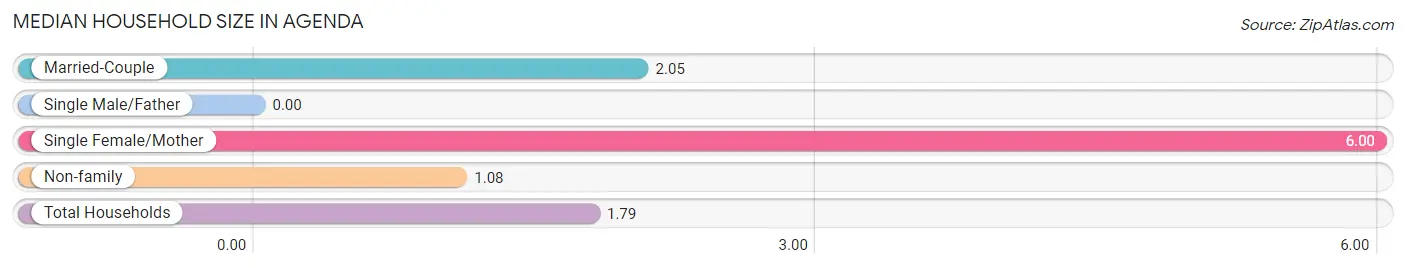
Median Household Size in Agenda
| Household Type | # Households | Household Size |
| Married-Couple | 19 (57.6%) | 2.05 |
| Single Male/Father | 0 (0.0%) | - |
| Single Female/Mother | 1 (3.0%) | 6.00 |
| Non-family | 13 (39.4%) | 1.08 |
| Total Households | 33 (100.0%) | 1.79 |
Household Size by Marriage Status in Agenda
Out of a total of 33 households in Agenda, 20 (60.6%) are family households, while 13 (39.4%) are nonfamily households. The most numerous type of family households are 2-person households, comprising 18, and the most common type of nonfamily households are 1-person households, comprising 12.
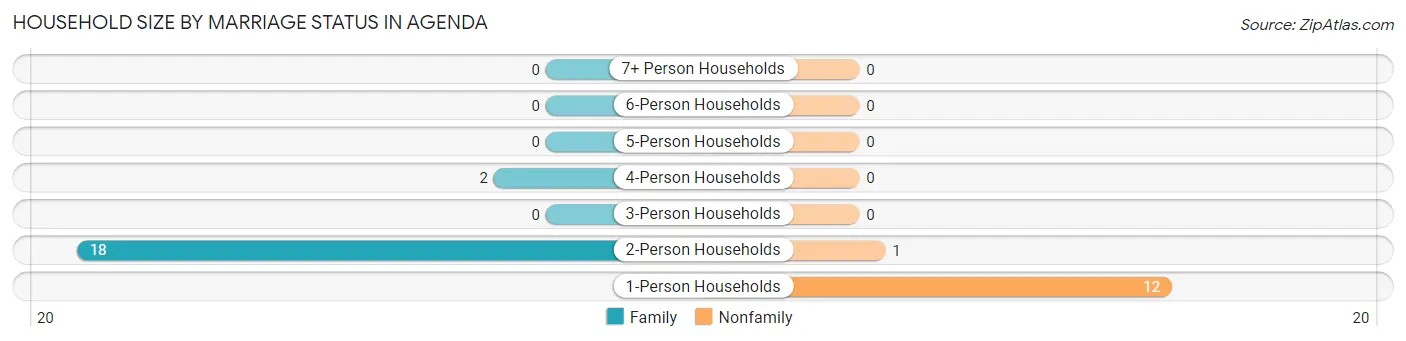
| Household Size | Family Households | Nonfamily Households |
| 1-Person Households | - | 12 (36.4%) |
| 2-Person Households | 18 (54.5%) | 1 (3.0%) |
| 3-Person Households | 0 (0.0%) | 0 (0.0%) |
| 4-Person Households | 2 (6.1%) | 0 (0.0%) |
| 5-Person Households | 0 (0.0%) | 0 (0.0%) |
| 6-Person Households | 0 (0.0%) | 0 (0.0%) |
| 7+ Person Households | 0 (0.0%) | 0 (0.0%) |
| Total | 20 (60.6%) | 13 (39.4%) |
Female Fertility in Agenda
Fertility by Age in Agenda
| Age Bracket | Women with Births | Births / 1,000 Women |
| 15 to 19 years | 0 (0.0%) | 0.0 |
| 20 to 34 years | 0 (0.0%) | 0.0 |
| 35 to 50 years | 0 (0.0%) | 0.0 |
| Total | 0 (0.0%) | 0.0 |
Fertility by Age by Marriage Status in Agenda
| Age Bracket | Married | Unmarried |
| 15 to 19 years | 0 (0.0%) | 0 (0.0%) |
| 20 to 34 years | 0 (0.0%) | 0 (0.0%) |
| 35 to 50 years | 0 (0.0%) | 0 (0.0%) |
| Total | 0 (0.0%) | 0 (0.0%) |
Fertility by Education in Agenda
| Educational Attainment | Women with Births | Births / 1,000 Women |
| Less than High School | 0 (0.0%) | 0.0 |
| High School Diploma | 0 (0.0%) | 0.0 |
| College or Associate's Degree | 0 (0.0%) | 0.0 |
| Bachelor's Degree | 0 (0.0%) | 0.0 |
| Graduate Degree | 0 (0.0%) | 0.0 |
| Total | 0 (0.0%) | 0.0 |
Fertility by Education by Marriage Status in Agenda
| Educational Attainment | Married | Unmarried |
| Less than High School | 0 (0.0%) | 0 (0.0%) |
| High School Diploma | 0 (0.0%) | 0 (0.0%) |
| College or Associate's Degree | 0 (0.0%) | 0 (0.0%) |
| Bachelor's Degree | 0 (0.0%) | 0 (0.0%) |
| Graduate Degree | 0 (0.0%) | 0 (0.0%) |
| Total | 0 (0.0%) | 0 (0.0%) |
Employment Characteristics in Agenda
Employment by Class of Employer in Agenda
Among the 30 employed individuals in Agenda, private company employees (15 | 50.0%), self-employed (not incorporated) (10 | 33.3%), and local government employees (4 | 13.3%) make up the most common classes of employment.
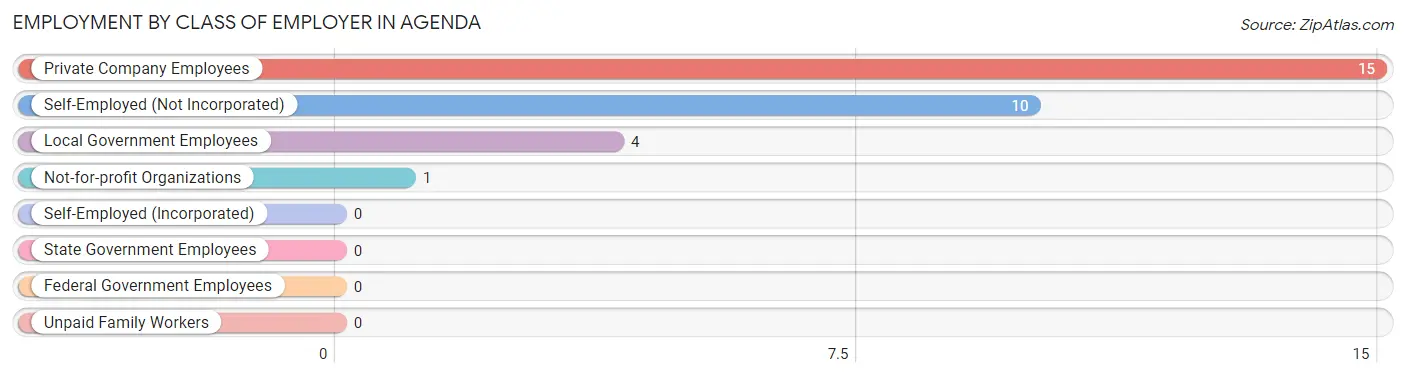
| Employer Class | # Employees | % Employees |
| Private Company Employees | 15 | 50.0% |
| Self-Employed (Incorporated) | 0 | 0.0% |
| Self-Employed (Not Incorporated) | 10 | 33.3% |
| Not-for-profit Organizations | 1 | 3.3% |
| Local Government Employees | 4 | 13.3% |
| State Government Employees | 0 | 0.0% |
| Federal Government Employees | 0 | 0.0% |
| Unpaid Family Workers | 0 | 0.0% |
| Total | 30 | 100.0% |
Employment Status by Age in Agenda
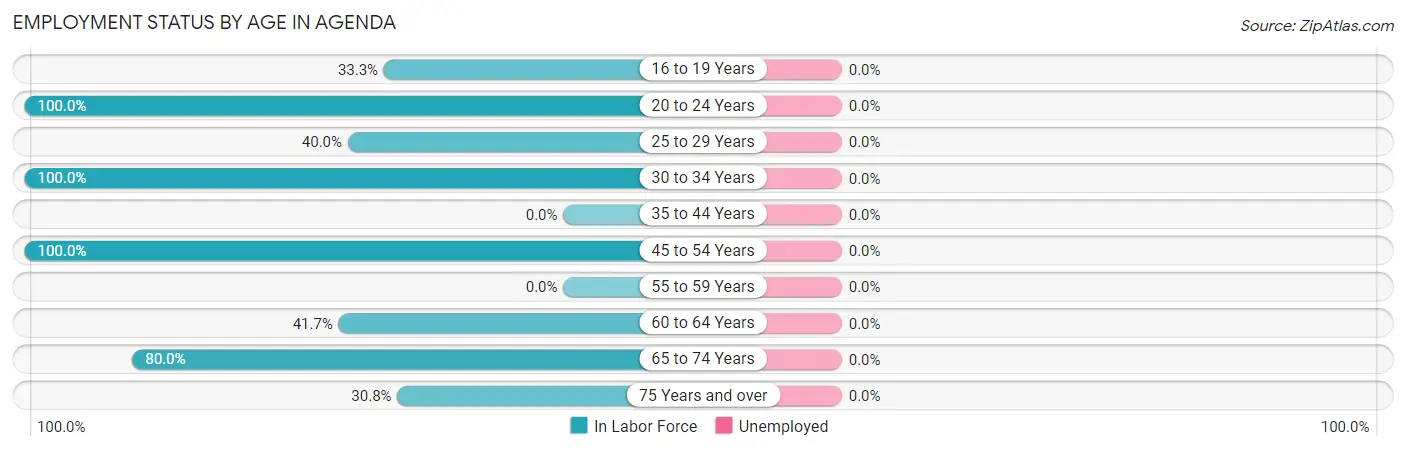
| Age Bracket | In Labor Force | Unemployed |
| 16 to 19 Years | 2 (33.3%) | 0 (0.0%) |
| 20 to 24 Years | 4 (100.0%) | 0 (0.0%) |
| 25 to 29 Years | 2 (40.0%) | 0 (0.0%) |
| 30 to 34 Years | 3 (100.0%) | 0 (0.0%) |
| 35 to 44 Years | 0 (0.0%) | 0 (0.0%) |
| 45 to 54 Years | 2 (100.0%) | 0 (0.0%) |
| 55 to 59 Years | 0 (0.0%) | 0 (0.0%) |
| 60 to 64 Years | 5 (41.7%) | 0 (0.0%) |
| 65 to 74 Years | 8 (80.0%) | 0 (0.0%) |
| 75 Years and over | 4 (30.8%) | 0 (0.0%) |
| Total | 30 (50.8%) | 0 (0.0%) |
Employment Status by Educational Attainment in Agenda
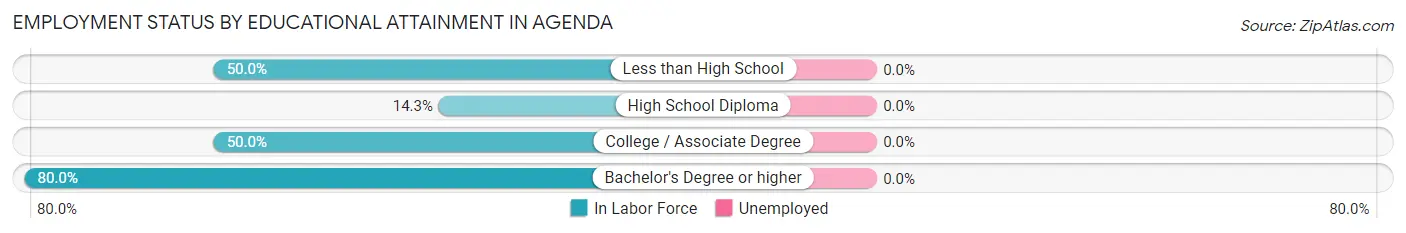
| Educational Attainment | In Labor Force | Unemployed |
| Less than High School | 3 (50.0%) | 0 (0.0%) |
| High School Diploma | 1 (14.3%) | 0 (0.0%) |
| College / Associate Degree | 4 (50.0%) | 0 (0.0%) |
| Bachelor's Degree or higher | 4 (80.0%) | 0 (0.0%) |
| Total | 12 (46.2%) | 0 (0.0%) |
Employment Occupations by Sex in Agenda
Management, Business, Science and Arts Occupations
The most common Management, Business, Science and Arts occupations in Agenda are Management (3 | 10.0%), Community & Social Service (2 | 6.7%), Legal Services & Support (2 | 6.7%), Health Diagnosing & Treating (1 | 3.3%), and Health Technologists (1 | 3.3%).
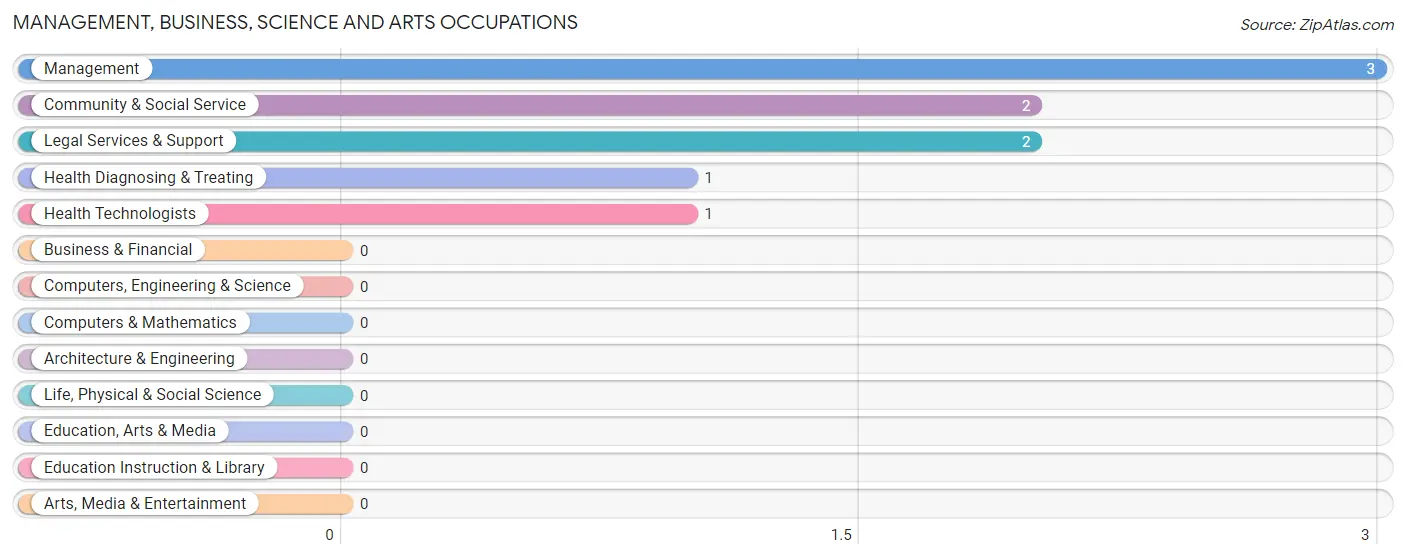
Management, Business, Science and Arts Occupations by Sex
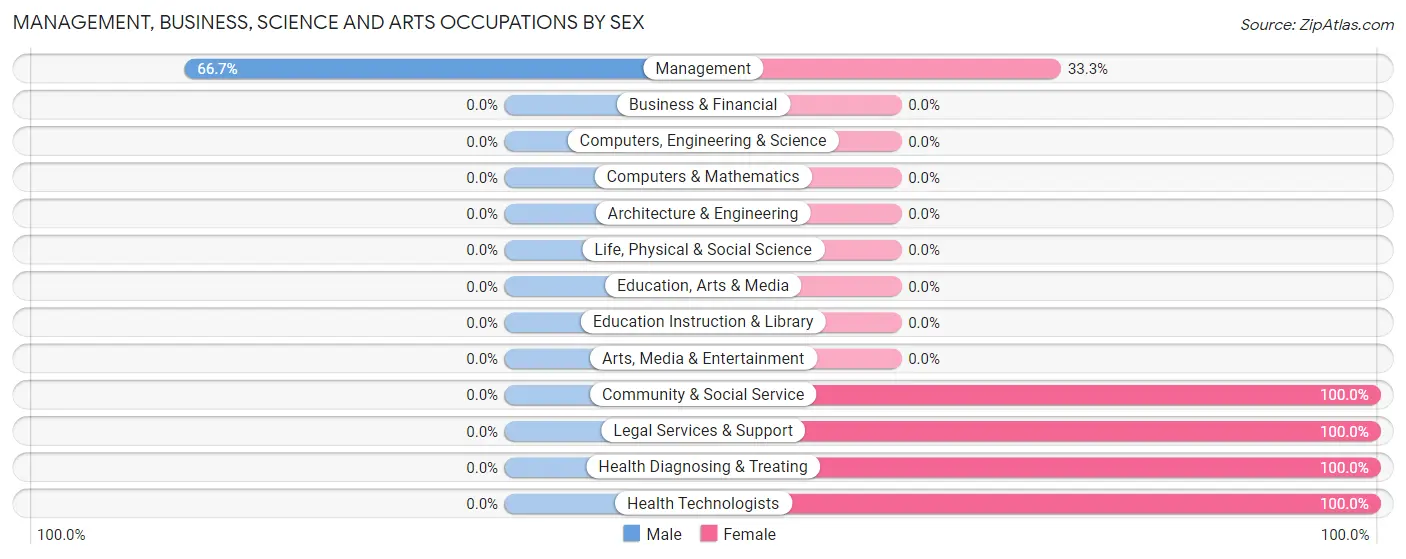
| Occupation | Male | Female |
| Management | 2 (66.7%) | 1 (33.3%) |
| Business & Financial | 0 (0.0%) | 0 (0.0%) |
| Computers, Engineering & Science | 0 (0.0%) | 0 (0.0%) |
| Computers & Mathematics | 0 (0.0%) | 0 (0.0%) |
| Architecture & Engineering | 0 (0.0%) | 0 (0.0%) |
| Life, Physical & Social Science | 0 (0.0%) | 0 (0.0%) |
| Community & Social Service | 0 (0.0%) | 2 (100.0%) |
| Education, Arts & Media | 0 (0.0%) | 0 (0.0%) |
| Legal Services & Support | 0 (0.0%) | 2 (100.0%) |
| Education Instruction & Library | 0 (0.0%) | 0 (0.0%) |
| Arts, Media & Entertainment | 0 (0.0%) | 0 (0.0%) |
| Health Diagnosing & Treating | 0 (0.0%) | 1 (100.0%) |
| Health Technologists | 0 (0.0%) | 1 (100.0%) |
| Total (Category) | 2 (33.3%) | 4 (66.7%) |
| Total (Overall) | 22 (73.3%) | 8 (26.7%) |
Services Occupations
The most common Services occupations in Agenda are Security & Protection (1 | 3.3%), Law Enforcement (1 | 3.3%), and Cleaning & Maintenance (1 | 3.3%).
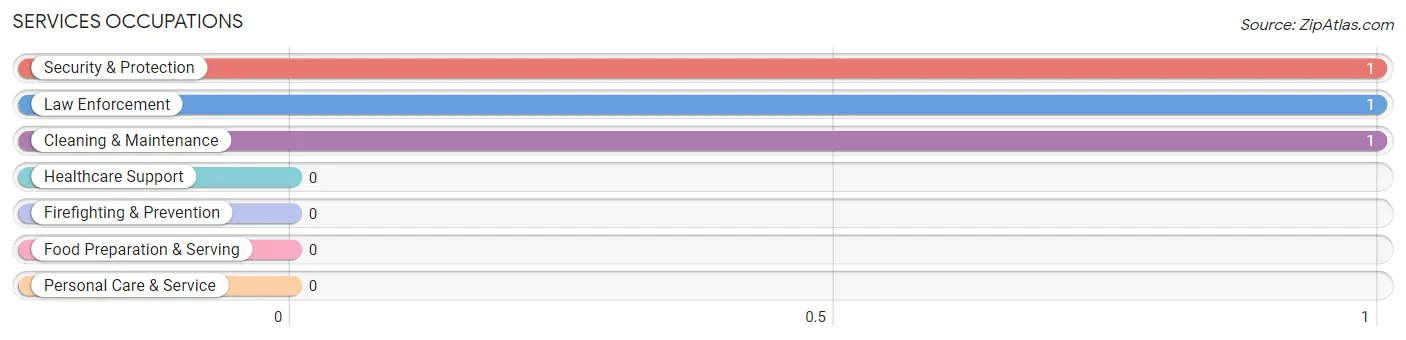
Services Occupations by Sex
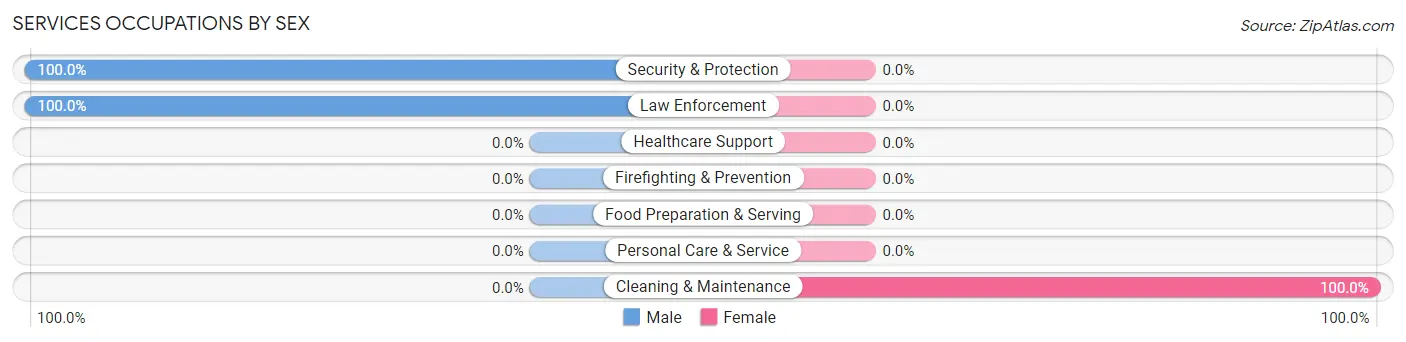
| Occupation | Male | Female |
| Healthcare Support | 0 (0.0%) | 0 (0.0%) |
| Security & Protection | 1 (100.0%) | 0 (0.0%) |
| Firefighting & Prevention | 0 (0.0%) | 0 (0.0%) |
| Law Enforcement | 1 (100.0%) | 0 (0.0%) |
| Food Preparation & Serving | 0 (0.0%) | 0 (0.0%) |
| Cleaning & Maintenance | 0 (0.0%) | 1 (100.0%) |
| Personal Care & Service | 0 (0.0%) | 0 (0.0%) |
| Total (Category) | 1 (50.0%) | 1 (50.0%) |
| Total (Overall) | 22 (73.3%) | 8 (26.7%) |
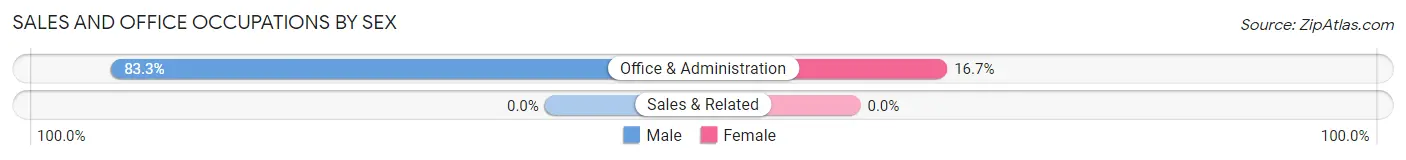
Sales and Office Occupations
The most common Sales and Office occupations in Agenda are , and Office & Administration (6 | 20.0%).
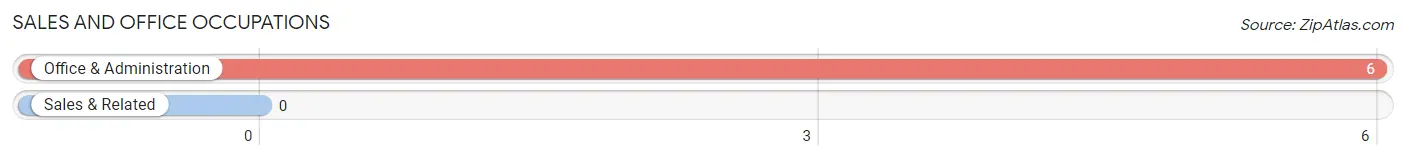
Sales and Office Occupations by Sex
| Occupation | Male | Female |
| Sales & Related | 0 (0.0%) | 0 (0.0%) |
| Office & Administration | 5 (83.3%) | 1 (16.7%) |
| Total (Category) | 5 (83.3%) | 1 (16.7%) |
| Total (Overall) | 22 (73.3%) | 8 (26.7%) |
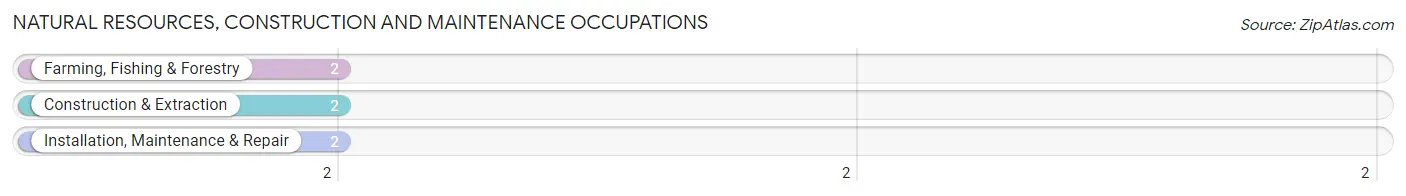
Natural Resources, Construction and Maintenance Occupations
The most common Natural Resources, Construction and Maintenance occupations in Agenda are Farming, Fishing & Forestry (2 | 6.7%), Construction & Extraction (2 | 6.7%), and Installation, Maintenance & Repair (2 | 6.7%).
Natural Resources, Construction and Maintenance Occupations by Sex
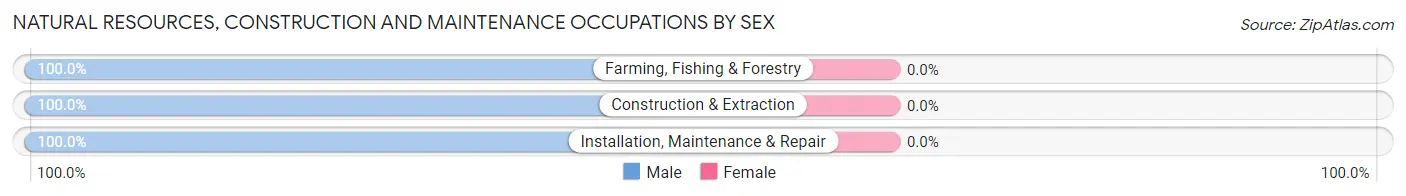
| Occupation | Male | Female |
| Farming, Fishing & Forestry | 2 (100.0%) | 0 (0.0%) |
| Construction & Extraction | 2 (100.0%) | 0 (0.0%) |
| Installation, Maintenance & Repair | 2 (100.0%) | 0 (0.0%) |
| Total (Category) | 6 (100.0%) | 0 (0.0%) |
| Total (Overall) | 22 (73.3%) | 8 (26.7%) |
Production, Transportation and Moving Occupations
The most common Production, Transportation and Moving occupations in Agenda are Transportation (6 | 20.0%), Production (2 | 6.7%), and Material Moving (2 | 6.7%).
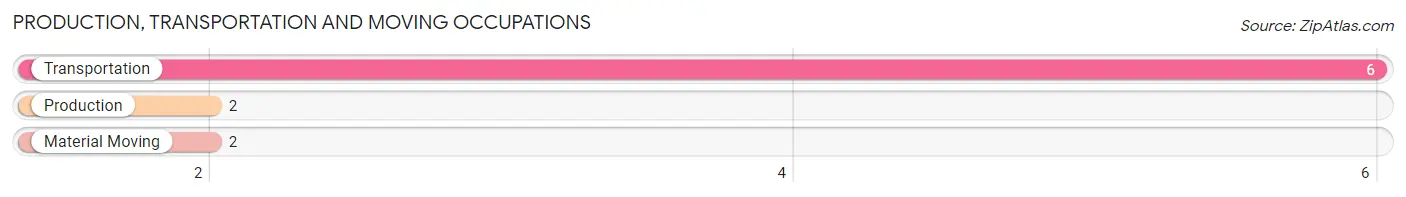
Production, Transportation and Moving Occupations by Sex
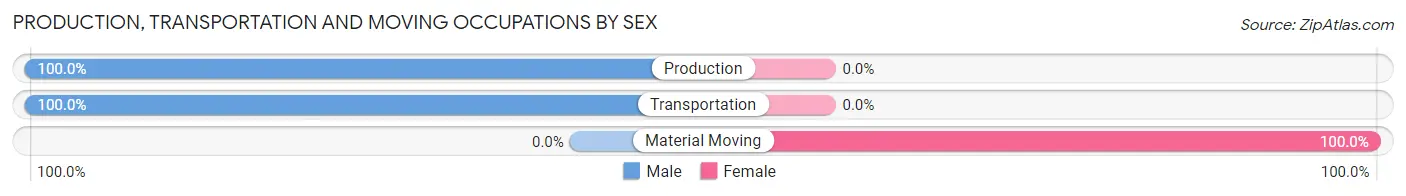
| Occupation | Male | Female |
| Production | 2 (100.0%) | 0 (0.0%) |
| Transportation | 6 (100.0%) | 0 (0.0%) |
| Material Moving | 0 (0.0%) | 2 (100.0%) |
| Total (Category) | 8 (80.0%) | 2 (20.0%) |
| Total (Overall) | 22 (73.3%) | 8 (26.7%) |
Employment Industries by Sex in Agenda
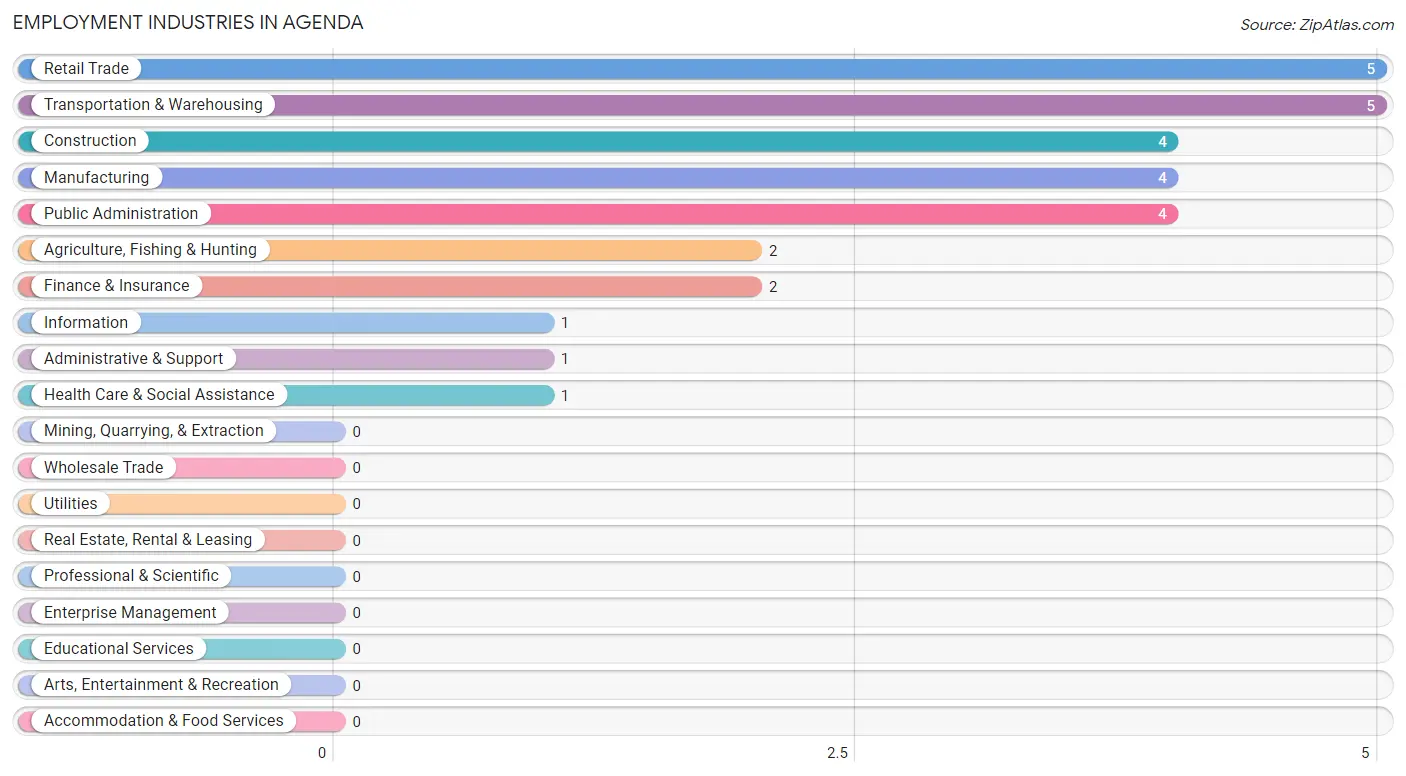
Employment Industries in Agenda
The major employment industries in Agenda include Retail Trade (5 | 16.7%), Transportation & Warehousing (5 | 16.7%), Construction (4 | 13.3%), Manufacturing (4 | 13.3%), and Public Administration (4 | 13.3%).
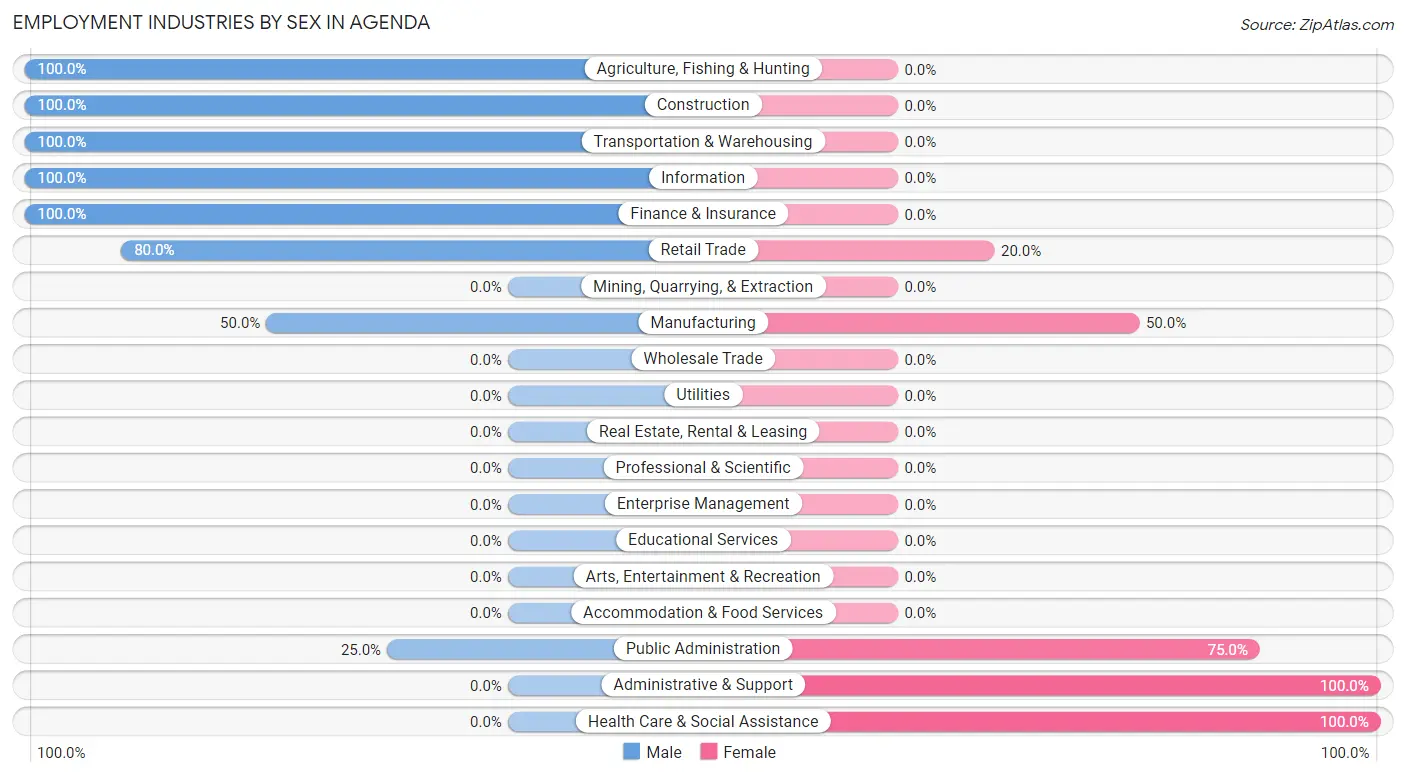
Employment Industries by Sex in Agenda
The Agenda industries that see more men than women are Agriculture, Fishing & Hunting (100.0%), Construction (100.0%), and Transportation & Warehousing (100.0%), whereas the industries that tend to have a higher number of women are Administrative & Support (100.0%), Health Care & Social Assistance (100.0%), and Public Administration (75.0%).
| Industry | Male | Female |
| Agriculture, Fishing & Hunting | 2 (100.0%) | 0 (0.0%) |
| Mining, Quarrying, & Extraction | 0 (0.0%) | 0 (0.0%) |
| Construction | 4 (100.0%) | 0 (0.0%) |
| Manufacturing | 2 (50.0%) | 2 (50.0%) |
| Wholesale Trade | 0 (0.0%) | 0 (0.0%) |
| Retail Trade | 4 (80.0%) | 1 (20.0%) |
| Transportation & Warehousing | 5 (100.0%) | 0 (0.0%) |
| Utilities | 0 (0.0%) | 0 (0.0%) |
| Information | 1 (100.0%) | 0 (0.0%) |
| Finance & Insurance | 2 (100.0%) | 0 (0.0%) |
| Real Estate, Rental & Leasing | 0 (0.0%) | 0 (0.0%) |
| Professional & Scientific | 0 (0.0%) | 0 (0.0%) |
| Enterprise Management | 0 (0.0%) | 0 (0.0%) |
| Administrative & Support | 0 (0.0%) | 1 (100.0%) |
| Educational Services | 0 (0.0%) | 0 (0.0%) |
| Health Care & Social Assistance | 0 (0.0%) | 1 (100.0%) |
| Arts, Entertainment & Recreation | 0 (0.0%) | 0 (0.0%) |
| Accommodation & Food Services | 0 (0.0%) | 0 (0.0%) |
| Public Administration | 1 (25.0%) | 3 (75.0%) |
| Total | 22 (73.3%) | 8 (26.7%) |
Education in Agenda
School Enrollment in Agenda
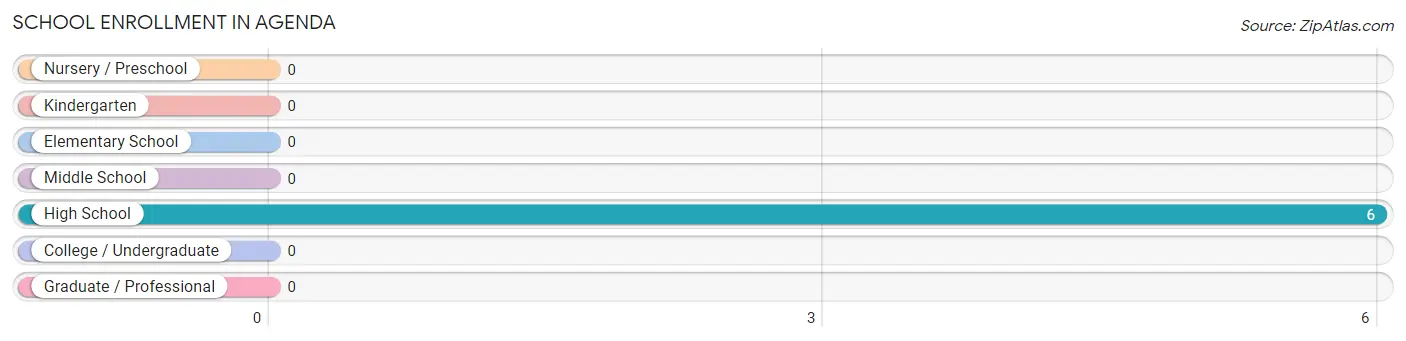
| School Level | # Students | % Students |
| Nursery / Preschool | 0 | 0.0% |
| Kindergarten | 0 | 0.0% |
| Elementary School | 0 | 0.0% |
| Middle School | 0 | 0.0% |
| High School | 6 | 100.0% |
| College / Undergraduate | 0 | 0.0% |
| Graduate / Professional | 0 | 0.0% |
| Total | 6 | 100.0% |
School Enrollment by Age by Funding Source in Agenda
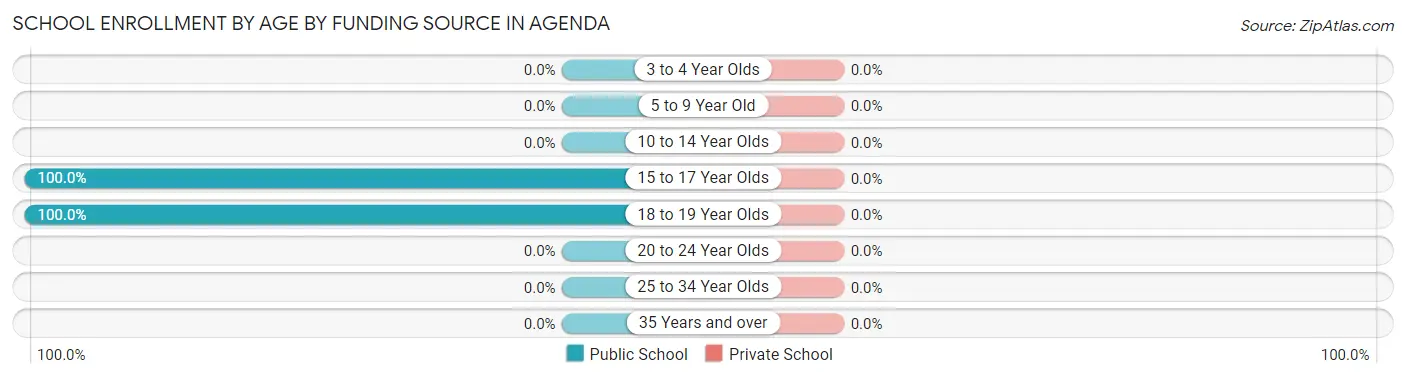
| Age Bracket | Public School | Private School |
| 3 to 4 Year Olds | 0 (0.0%) | 0 (0.0%) |
| 5 to 9 Year Old | 0 (0.0%) | 0 (0.0%) |
| 10 to 14 Year Olds | 0 (0.0%) | 0 (0.0%) |
| 15 to 17 Year Olds | 2 (100.0%) | 0 (0.0%) |
| 18 to 19 Year Olds | 4 (100.0%) | 0 (0.0%) |
| 20 to 24 Year Olds | 0 (0.0%) | 0 (0.0%) |
| 25 to 34 Year Olds | 0 (0.0%) | 0 (0.0%) |
| 35 Years and over | 0 (0.0%) | 0 (0.0%) |
| Total | 6 (100.0%) | 0 (0.0%) |
Educational Attainment by Field of Study in Agenda
Bio, nature & agricultural (5 | 71.4%), literature & languages (1 | 14.3%), and arts & humanities (1 | 14.3%) are the most common fields of study among 7 individuals in Agenda who have obtained a bachelor's degree or higher.
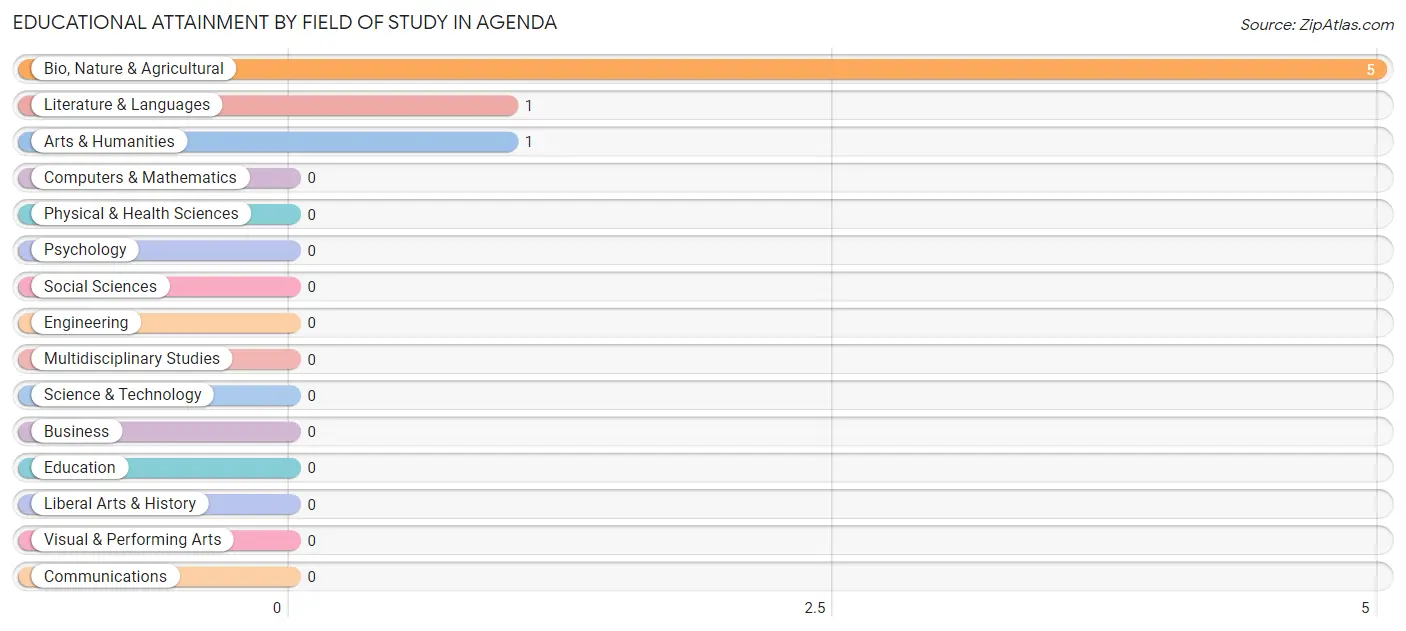
| Field of Study | # Graduates | % Graduates |
| Computers & Mathematics | 0 | 0.0% |
| Bio, Nature & Agricultural | 5 | 71.4% |
| Physical & Health Sciences | 0 | 0.0% |
| Psychology | 0 | 0.0% |
| Social Sciences | 0 | 0.0% |
| Engineering | 0 | 0.0% |
| Multidisciplinary Studies | 0 | 0.0% |
| Science & Technology | 0 | 0.0% |
| Business | 0 | 0.0% |
| Education | 0 | 0.0% |
| Literature & Languages | 1 | 14.3% |
| Liberal Arts & History | 0 | 0.0% |
| Visual & Performing Arts | 0 | 0.0% |
| Communications | 0 | 0.0% |
| Arts & Humanities | 1 | 14.3% |
| Total | 7 | 100.0% |
Transportation & Commute in Agenda
Vehicle Availability by Sex in Agenda
The most prevalent vehicle ownership categories in Agenda are males with 3 vehicles (9, accounting for 40.9%) and females with 3 vehicles (1, making up 112.5%).
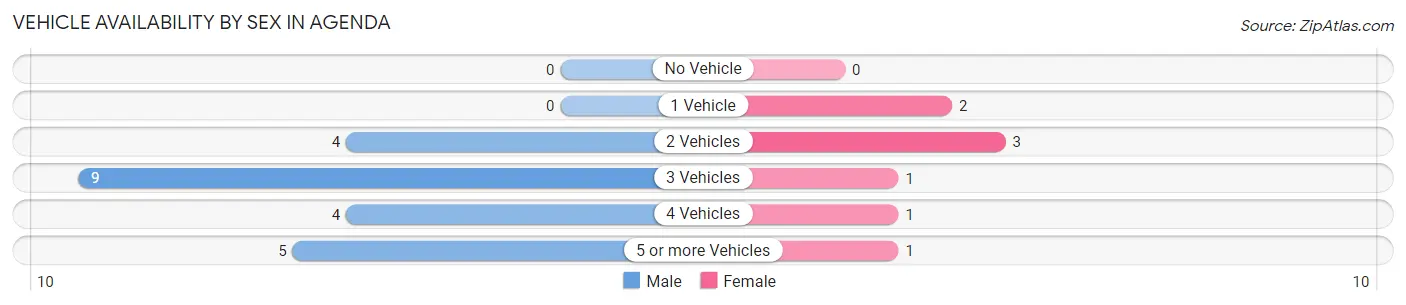
| Vehicles Available | Male | Female |
| No Vehicle | 0 (0.0%) | 0 (0.0%) |
| 1 Vehicle | 0 (0.0%) | 2 (25.0%) |
| 2 Vehicles | 4 (18.2%) | 3 (37.5%) |
| 3 Vehicles | 9 (40.9%) | 1 (12.5%) |
| 4 Vehicles | 4 (18.2%) | 1 (12.5%) |
| 5 or more Vehicles | 5 (22.7%) | 1 (12.5%) |
| Total | 22 (100.0%) | 8 (100.0%) |
Commute Time in Agenda
The most frequently occuring commute durations in Agenda are 15 to 19 minutes (10 commuters, 33.3%), 5 to 9 minutes (6 commuters, 20.0%), and 25 to 29 minutes (5 commuters, 16.7%).
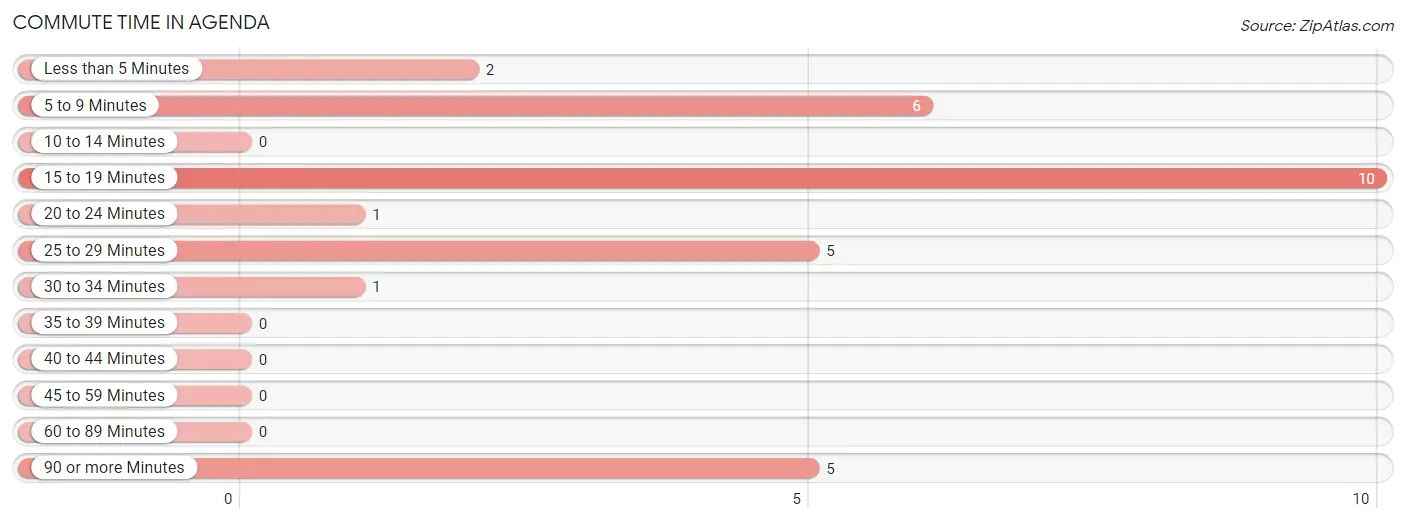
| Commute Time | # Commuters | % Commuters |
| Less than 5 Minutes | 2 | 6.7% |
| 5 to 9 Minutes | 6 | 20.0% |
| 10 to 14 Minutes | 0 | 0.0% |
| 15 to 19 Minutes | 10 | 33.3% |
| 20 to 24 Minutes | 1 | 3.3% |
| 25 to 29 Minutes | 5 | 16.7% |
| 30 to 34 Minutes | 1 | 3.3% |
| 35 to 39 Minutes | 0 | 0.0% |
| 40 to 44 Minutes | 0 | 0.0% |
| 45 to 59 Minutes | 0 | 0.0% |
| 60 to 89 Minutes | 0 | 0.0% |
| 90 or more Minutes | 5 | 16.7% |
Commute Time by Sex in Agenda
The most common commute times in Agenda are 15 to 19 minutes (7 commuters, 31.8%) for males and 15 to 19 minutes (3 commuters, 37.5%) for females.
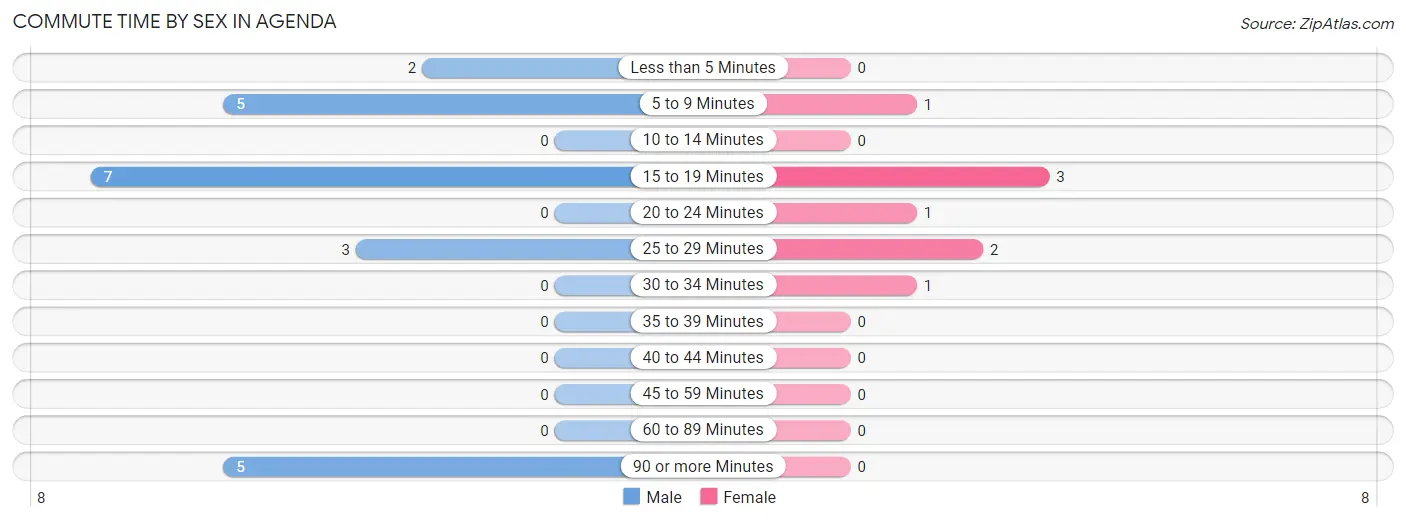
| Commute Time | Male | Female |
| Less than 5 Minutes | 2 (9.1%) | 0 (0.0%) |
| 5 to 9 Minutes | 5 (22.7%) | 1 (12.5%) |
| 10 to 14 Minutes | 0 (0.0%) | 0 (0.0%) |
| 15 to 19 Minutes | 7 (31.8%) | 3 (37.5%) |
| 20 to 24 Minutes | 0 (0.0%) | 1 (12.5%) |
| 25 to 29 Minutes | 3 (13.6%) | 2 (25.0%) |
| 30 to 34 Minutes | 0 (0.0%) | 1 (12.5%) |
| 35 to 39 Minutes | 0 (0.0%) | 0 (0.0%) |
| 40 to 44 Minutes | 0 (0.0%) | 0 (0.0%) |
| 45 to 59 Minutes | 0 (0.0%) | 0 (0.0%) |
| 60 to 89 Minutes | 0 (0.0%) | 0 (0.0%) |
| 90 or more Minutes | 5 (22.7%) | 0 (0.0%) |
Time of Departure to Work by Sex in Agenda
The most frequent times of departure to work in Agenda are 7:00 AM to 7:29 AM (8, 36.4%) for males and 6:00 AM to 6:29 AM (4, 50.0%) for females.
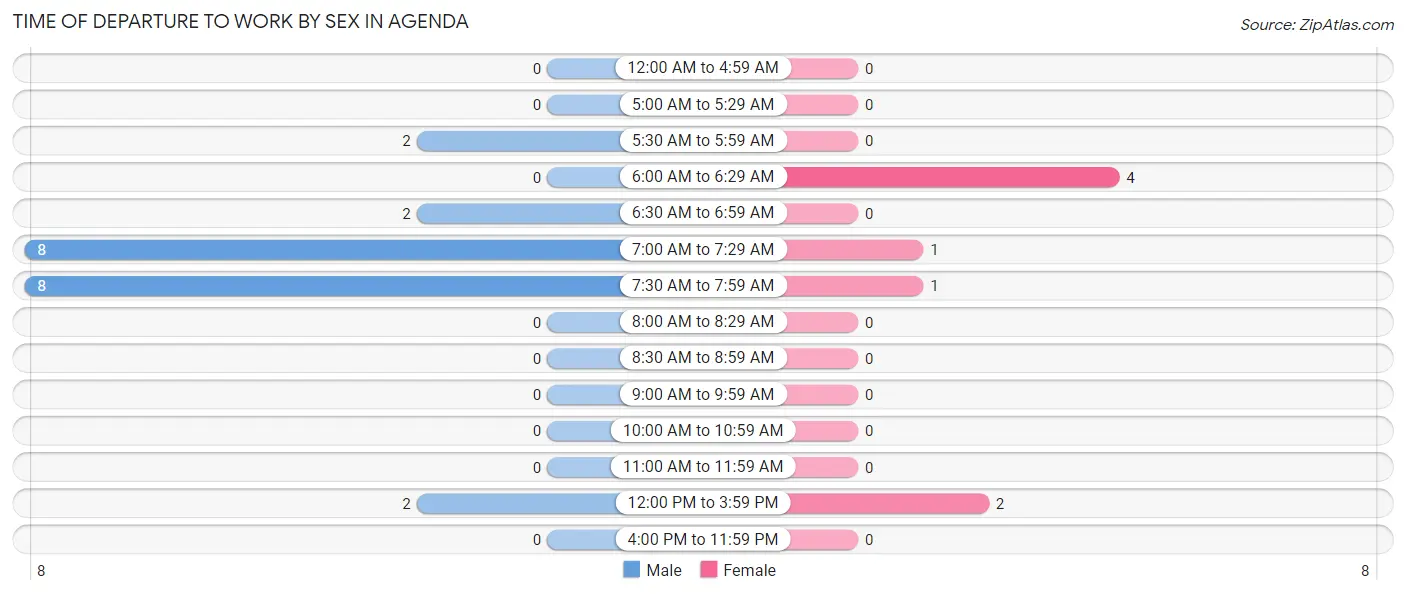
| Time of Departure | Male | Female |
| 12:00 AM to 4:59 AM | 0 (0.0%) | 0 (0.0%) |
| 5:00 AM to 5:29 AM | 0 (0.0%) | 0 (0.0%) |
| 5:30 AM to 5:59 AM | 2 (9.1%) | 0 (0.0%) |
| 6:00 AM to 6:29 AM | 0 (0.0%) | 4 (50.0%) |
| 6:30 AM to 6:59 AM | 2 (9.1%) | 0 (0.0%) |
| 7:00 AM to 7:29 AM | 8 (36.4%) | 1 (12.5%) |
| 7:30 AM to 7:59 AM | 8 (36.4%) | 1 (12.5%) |
| 8:00 AM to 8:29 AM | 0 (0.0%) | 0 (0.0%) |
| 8:30 AM to 8:59 AM | 0 (0.0%) | 0 (0.0%) |
| 9:00 AM to 9:59 AM | 0 (0.0%) | 0 (0.0%) |
| 10:00 AM to 10:59 AM | 0 (0.0%) | 0 (0.0%) |
| 11:00 AM to 11:59 AM | 0 (0.0%) | 0 (0.0%) |
| 12:00 PM to 3:59 PM | 2 (9.1%) | 2 (25.0%) |
| 4:00 PM to 11:59 PM | 0 (0.0%) | 0 (0.0%) |
| Total | 22 (100.0%) | 8 (100.0%) |
Housing Occupancy in Agenda
Occupancy by Ownership in Agenda
Of the total 33 dwellings in Agenda, owner-occupied units account for 29 (87.9%), while renter-occupied units make up 4 (12.1%).
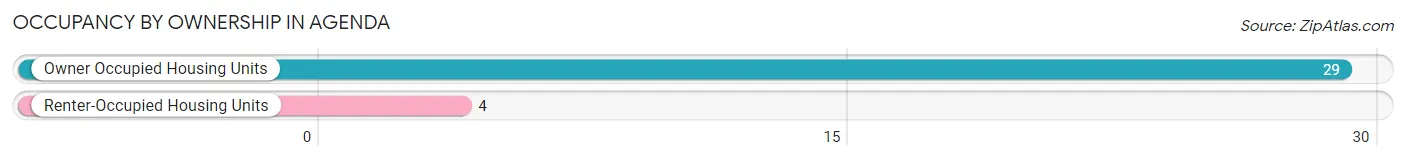
| Occupancy | # Housing Units | % Housing Units |
| Owner Occupied Housing Units | 29 | 87.9% |
| Renter-Occupied Housing Units | 4 | 12.1% |
| Total Occupied Housing Units | 33 | 100.0% |
Occupancy by Household Size in Agenda
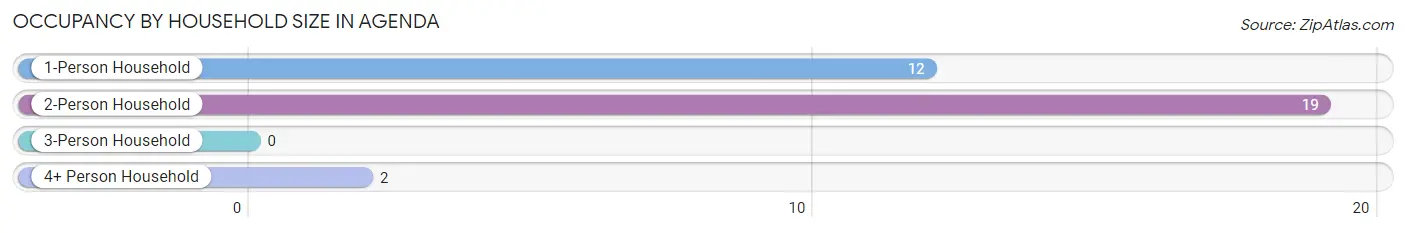
| Household Size | # Housing Units | % Housing Units |
| 1-Person Household | 12 | 36.4% |
| 2-Person Household | 19 | 57.6% |
| 3-Person Household | 0 | 0.0% |
| 4+ Person Household | 2 | 6.1% |
| Total Housing Units | 33 | 100.0% |
Occupancy by Ownership by Household Size in Agenda
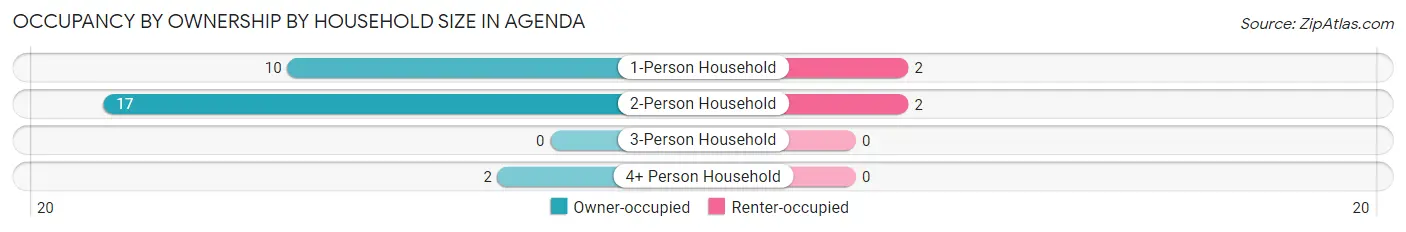
| Household Size | Owner-occupied | Renter-occupied |
| 1-Person Household | 10 (83.3%) | 2 (16.7%) |
| 2-Person Household | 17 (89.5%) | 2 (10.5%) |
| 3-Person Household | 0 (0.0%) | 0 (0.0%) |
| 4+ Person Household | 2 (100.0%) | 0 (0.0%) |
| Total Housing Units | 29 (87.9%) | 4 (12.1%) |
Occupancy by Educational Attainment in Agenda
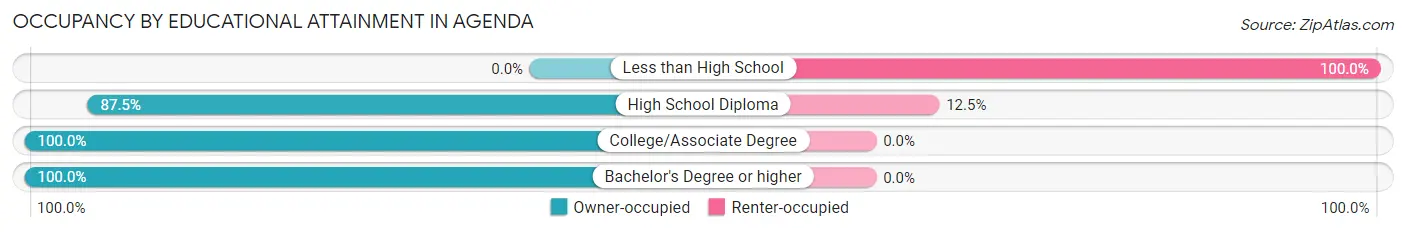
| Household Size | Owner-occupied | Renter-occupied |
| Less than High School | 0 (0.0%) | 2 (100.0%) |
| High School Diploma | 14 (87.5%) | 2 (12.5%) |
| College/Associate Degree | 9 (100.0%) | 0 (0.0%) |
| Bachelor's Degree or higher | 6 (100.0%) | 0 (0.0%) |
Occupancy by Age of Householder in Agenda
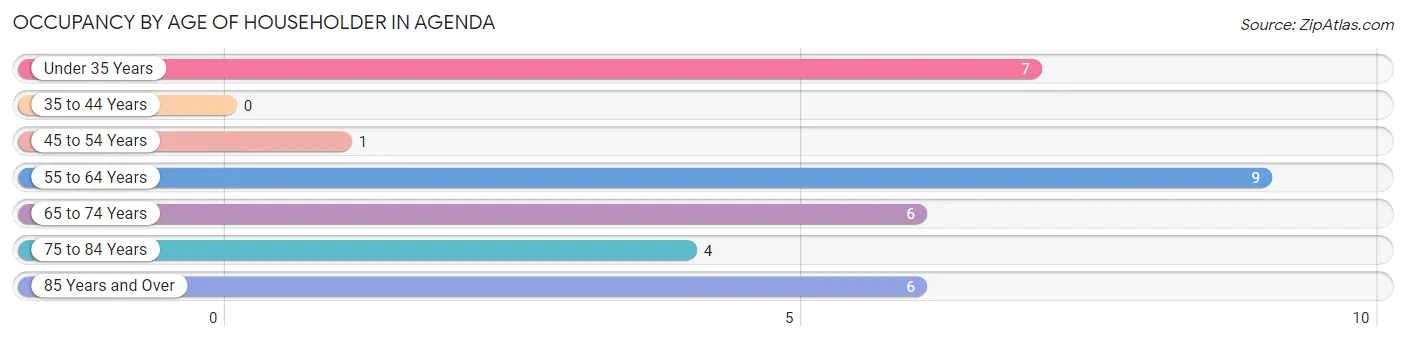
| Age Bracket | # Households | % Households |
| Under 35 Years | 7 | 21.2% |
| 35 to 44 Years | 0 | 0.0% |
| 45 to 54 Years | 1 | 3.0% |
| 55 to 64 Years | 9 | 27.3% |
| 65 to 74 Years | 6 | 18.2% |
| 75 to 84 Years | 4 | 12.1% |
| 85 Years and Over | 6 | 18.2% |
| Total | 33 | 100.0% |
Housing Finances in Agenda
Median Income by Occupancy in Agenda
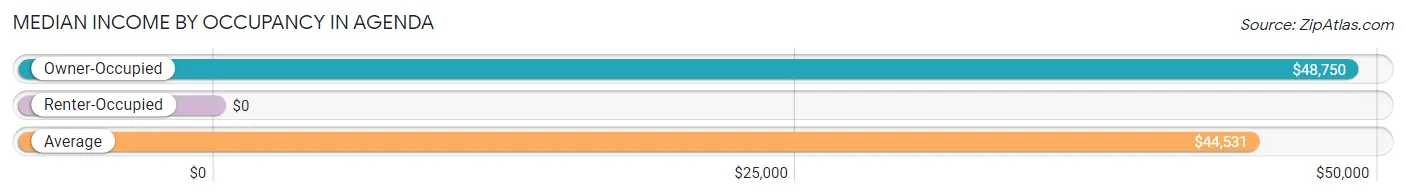
| Occupancy Type | # Households | Median Income |
| Owner-Occupied | 29 (87.9%) | $48,750 |
| Renter-Occupied | 4 (12.1%) | $0 |
| Average | 33 (100.0%) | $44,531 |
Occupancy by Householder Income Bracket in Agenda
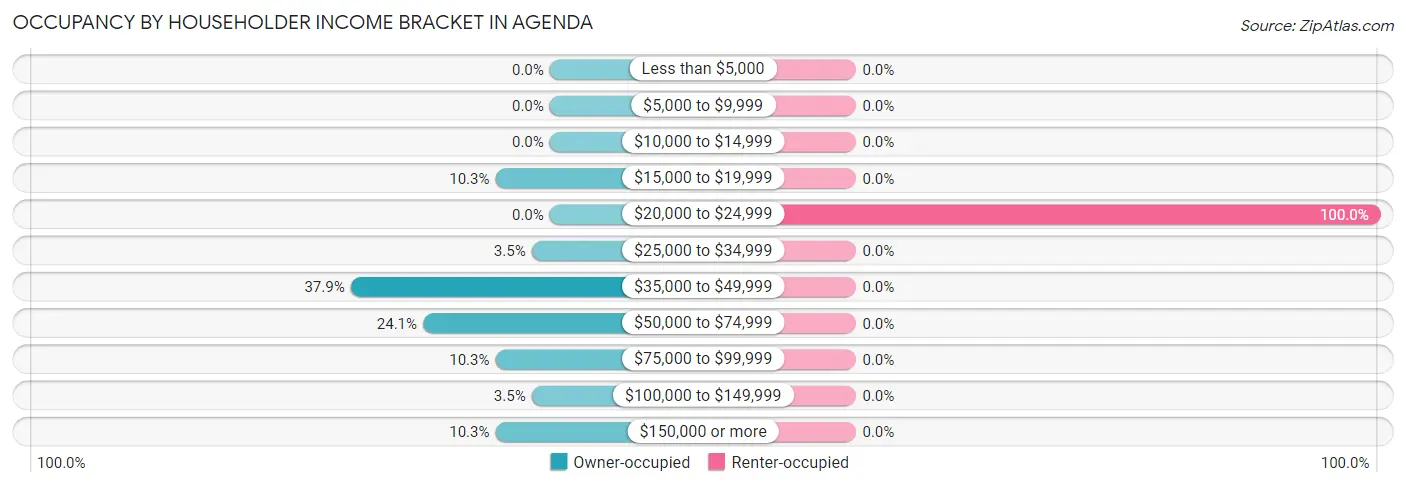
| Income Bracket | Owner-occupied | Renter-occupied |
| Less than $5,000 | 0 (0.0%) | 0 (0.0%) |
| $5,000 to $9,999 | 0 (0.0%) | 0 (0.0%) |
| $10,000 to $14,999 | 0 (0.0%) | 0 (0.0%) |
| $15,000 to $19,999 | 3 (10.3%) | 0 (0.0%) |
| $20,000 to $24,999 | 0 (0.0%) | 4 (100.0%) |
| $25,000 to $34,999 | 1 (3.5%) | 0 (0.0%) |
| $35,000 to $49,999 | 11 (37.9%) | 0 (0.0%) |
| $50,000 to $74,999 | 7 (24.1%) | 0 (0.0%) |
| $75,000 to $99,999 | 3 (10.3%) | 0 (0.0%) |
| $100,000 to $149,999 | 1 (3.5%) | 0 (0.0%) |
| $150,000 or more | 3 (10.3%) | 0 (0.0%) |
| Total | 29 (100.0%) | 4 (100.0%) |
Monthly Housing Cost Tiers in Agenda
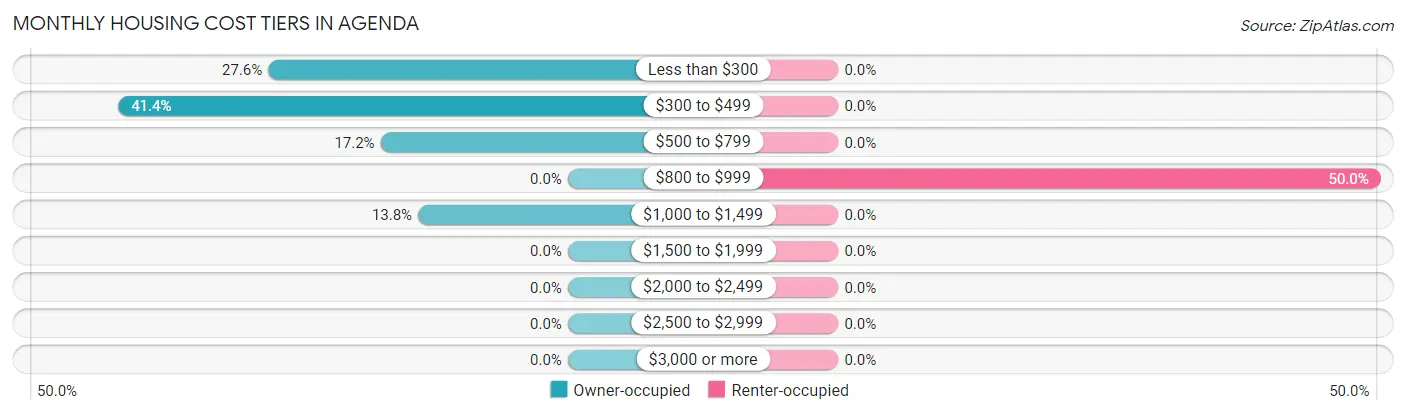
| Monthly Cost | Owner-occupied | Renter-occupied |
| Less than $300 | 8 (27.6%) | 0 (0.0%) |
| $300 to $499 | 12 (41.4%) | 0 (0.0%) |
| $500 to $799 | 5 (17.2%) | 0 (0.0%) |
| $800 to $999 | 0 (0.0%) | 2 (50.0%) |
| $1,000 to $1,499 | 4 (13.8%) | 0 (0.0%) |
| $1,500 to $1,999 | 0 (0.0%) | 0 (0.0%) |
| $2,000 to $2,499 | 0 (0.0%) | 0 (0.0%) |
| $2,500 to $2,999 | 0 (0.0%) | 0 (0.0%) |
| $3,000 or more | 0 (0.0%) | 0 (0.0%) |
| Total | 29 (100.0%) | 4 (100.0%) |
Physical Housing Characteristics in Agenda
Housing Structures in Agenda
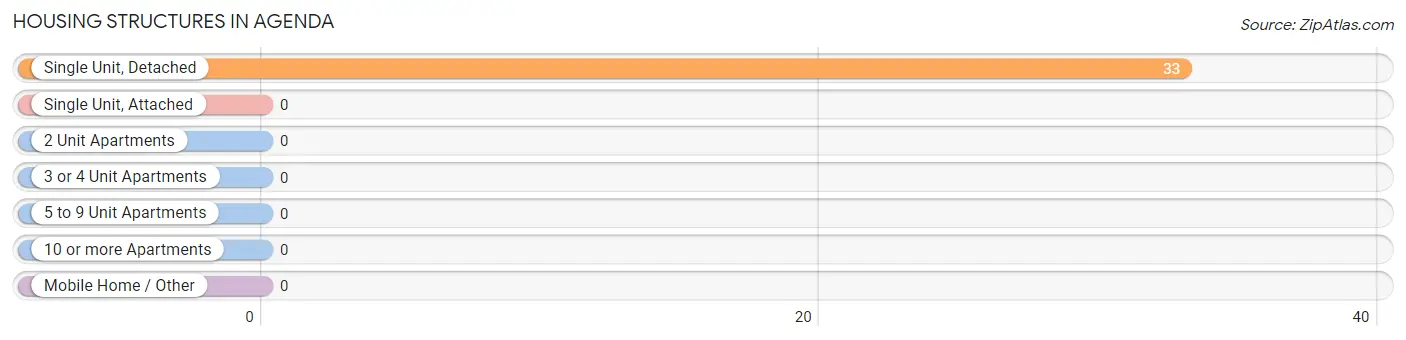
| Structure Type | # Housing Units | % Housing Units |
| Single Unit, Detached | 33 | 100.0% |
| Single Unit, Attached | 0 | 0.0% |
| 2 Unit Apartments | 0 | 0.0% |
| 3 or 4 Unit Apartments | 0 | 0.0% |
| 5 to 9 Unit Apartments | 0 | 0.0% |
| 10 or more Apartments | 0 | 0.0% |
| Mobile Home / Other | 0 | 0.0% |
| Total | 33 | 100.0% |
Housing Structures by Occupancy in Agenda
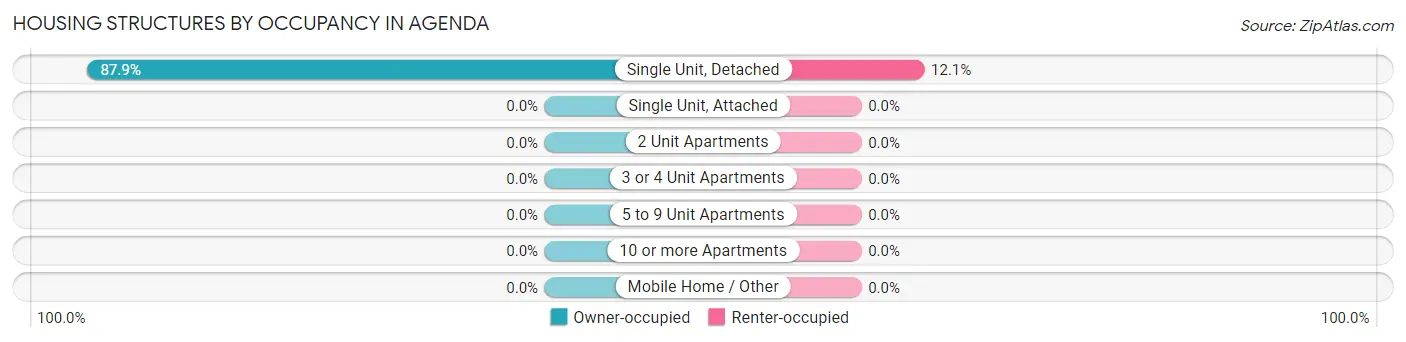
| Structure Type | Owner-occupied | Renter-occupied |
| Single Unit, Detached | 29 (87.9%) | 4 (12.1%) |
| Single Unit, Attached | 0 (0.0%) | 0 (0.0%) |
| 2 Unit Apartments | 0 (0.0%) | 0 (0.0%) |
| 3 or 4 Unit Apartments | 0 (0.0%) | 0 (0.0%) |
| 5 to 9 Unit Apartments | 0 (0.0%) | 0 (0.0%) |
| 10 or more Apartments | 0 (0.0%) | 0 (0.0%) |
| Mobile Home / Other | 0 (0.0%) | 0 (0.0%) |
| Total | 29 (87.9%) | 4 (12.1%) |
Housing Structures by Number of Rooms in Agenda
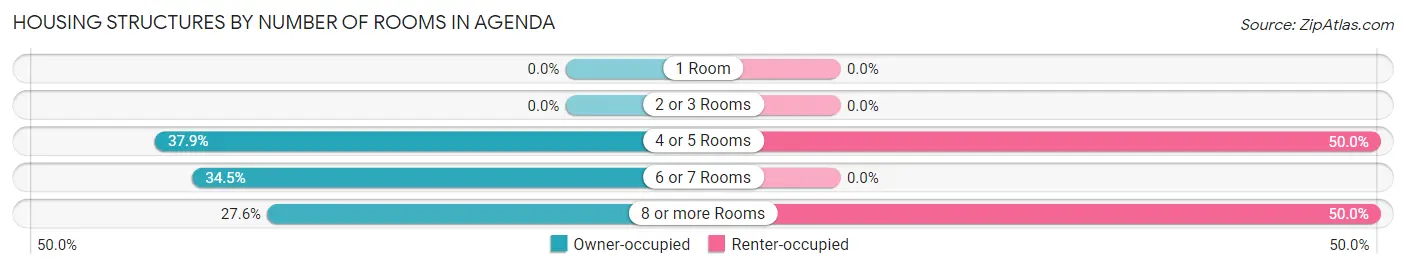
| Number of Rooms | Owner-occupied | Renter-occupied |
| 1 Room | 0 (0.0%) | 0 (0.0%) |
| 2 or 3 Rooms | 0 (0.0%) | 0 (0.0%) |
| 4 or 5 Rooms | 11 (37.9%) | 2 (50.0%) |
| 6 or 7 Rooms | 10 (34.5%) | 0 (0.0%) |
| 8 or more Rooms | 8 (27.6%) | 2 (50.0%) |
| Total | 29 (100.0%) | 4 (100.0%) |
Housing Structure by Heating Type in Agenda
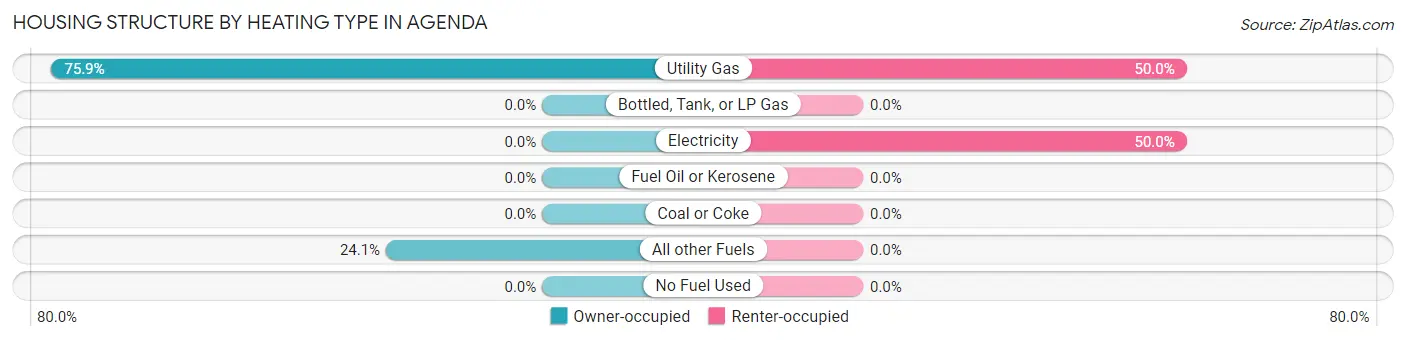
| Heating Type | Owner-occupied | Renter-occupied |
| Utility Gas | 22 (75.9%) | 2 (50.0%) |
| Bottled, Tank, or LP Gas | 0 (0.0%) | 0 (0.0%) |
| Electricity | 0 (0.0%) | 2 (50.0%) |
| Fuel Oil or Kerosene | 0 (0.0%) | 0 (0.0%) |
| Coal or Coke | 0 (0.0%) | 0 (0.0%) |
| All other Fuels | 7 (24.1%) | 0 (0.0%) |
| No Fuel Used | 0 (0.0%) | 0 (0.0%) |
| Total | 29 (100.0%) | 4 (100.0%) |
Household Vehicle Usage in Agenda
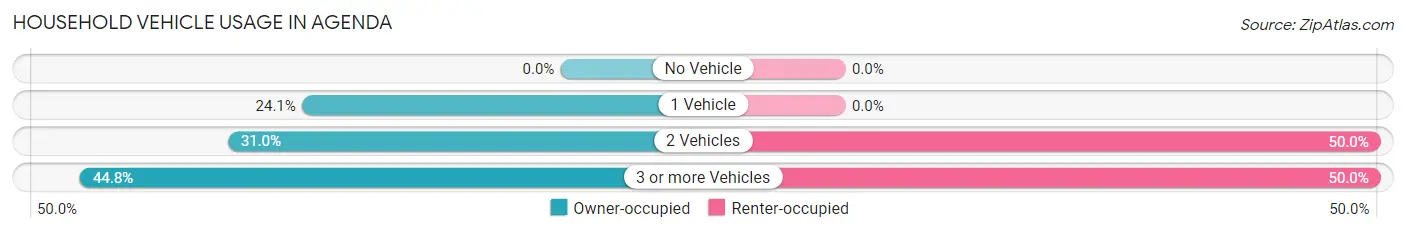
| Vehicles per Household | Owner-occupied | Renter-occupied |
| No Vehicle | 0 (0.0%) | 0 (0.0%) |
| 1 Vehicle | 7 (24.1%) | 0 (0.0%) |
| 2 Vehicles | 9 (31.0%) | 2 (50.0%) |
| 3 or more Vehicles | 13 (44.8%) | 2 (50.0%) |
| Total | 29 (100.0%) | 4 (100.0%) |
Real Estate & Mortgages in Agenda
Real Estate and Mortgage Overview in Agenda
| Characteristic | Without Mortgage | With Mortgage |
| Housing Units | 24 | 5 |
| Median Property Value | - | - |
| Median Household Income | $44,375 | $0 |
| Monthly Housing Costs | $333 | $0 |
| Real Estate Taxes | - | - |
Property Value by Mortgage Status in Agenda
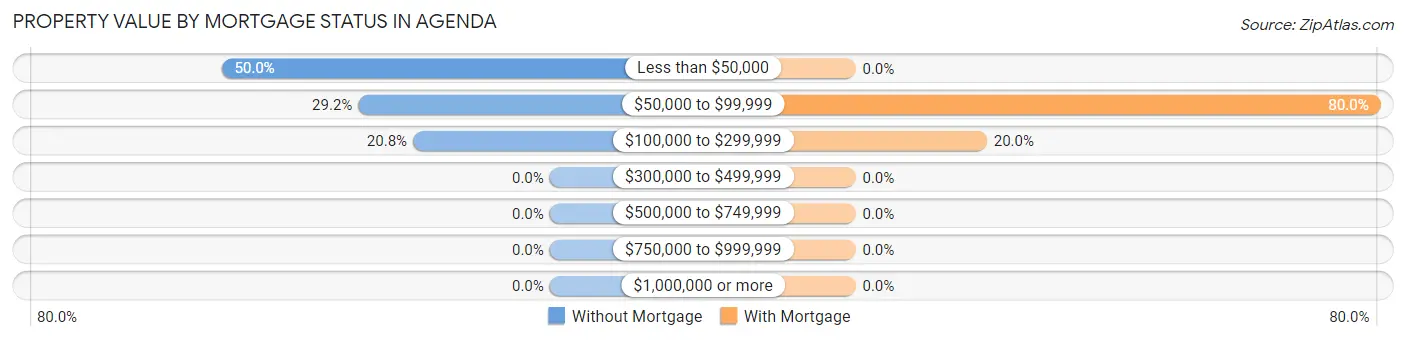
| Property Value | Without Mortgage | With Mortgage |
| Less than $50,000 | 12 (50.0%) | 0 (0.0%) |
| $50,000 to $99,999 | 7 (29.2%) | 4 (80.0%) |
| $100,000 to $299,999 | 5 (20.8%) | 1 (20.0%) |
| $300,000 to $499,999 | 0 (0.0%) | 0 (0.0%) |
| $500,000 to $749,999 | 0 (0.0%) | 0 (0.0%) |
| $750,000 to $999,999 | 0 (0.0%) | 0 (0.0%) |
| $1,000,000 or more | 0 (0.0%) | 0 (0.0%) |
| Total | 24 (100.0%) | 5 (100.0%) |
Household Income by Mortgage Status in Agenda
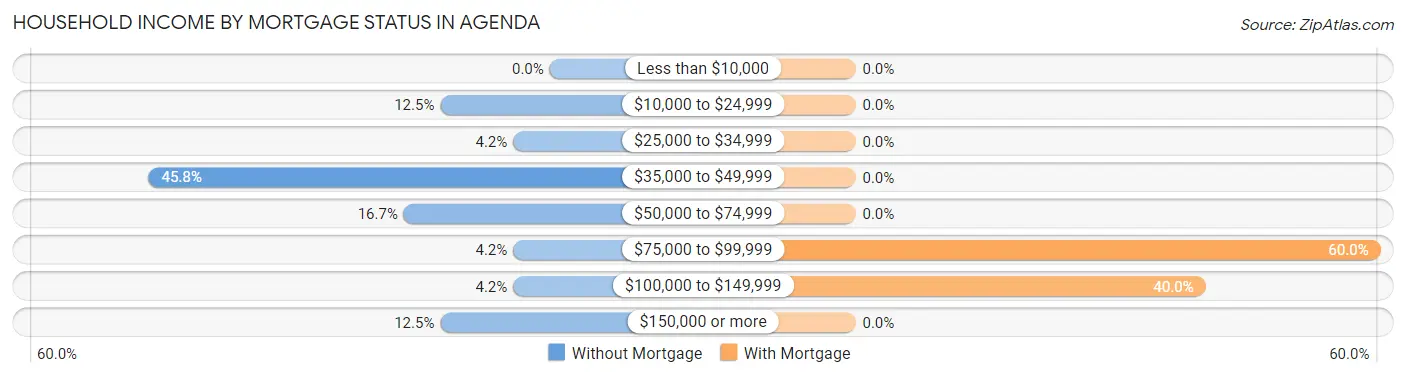
| Household Income | Without Mortgage | With Mortgage |
| Less than $10,000 | 0 (0.0%) | 0 (0.0%) |
| $10,000 to $24,999 | 3 (12.5%) | 0 (0.0%) |
| $25,000 to $34,999 | 1 (4.2%) | 0 (0.0%) |
| $35,000 to $49,999 | 11 (45.8%) | 0 (0.0%) |
| $50,000 to $74,999 | 4 (16.7%) | 0 (0.0%) |
| $75,000 to $99,999 | 1 (4.2%) | 3 (60.0%) |
| $100,000 to $149,999 | 1 (4.2%) | 2 (40.0%) |
| $150,000 or more | 3 (12.5%) | 0 (0.0%) |
| Total | 24 (100.0%) | 5 (100.0%) |
Property Value to Household Income Ratio in Agenda
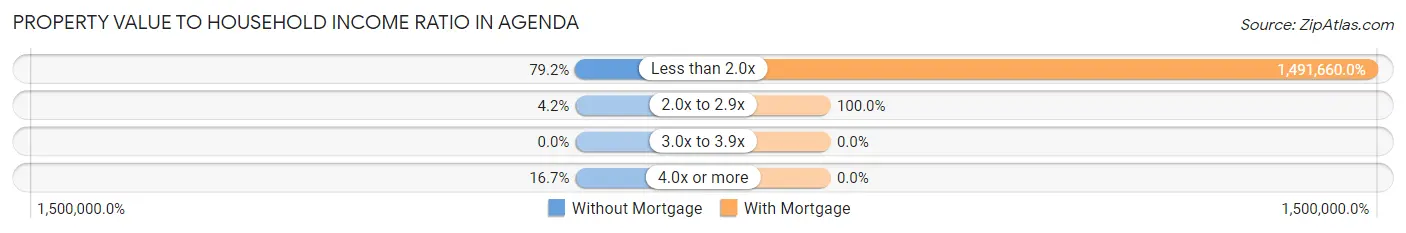
| Value-to-Income Ratio | Without Mortgage | With Mortgage |
| Less than 2.0x | 19 (79.2%) | 74,583 (1,491,660.0%) |
| 2.0x to 2.9x | 1 (4.2%) | 5 (100.0%) |
| 3.0x to 3.9x | 0 (0.0%) | 0 (0.0%) |
| 4.0x or more | 4 (16.7%) | 0 (0.0%) |
| Total | 24 (100.0%) | 5 (100.0%) |
Real Estate Taxes by Mortgage Status in Agenda
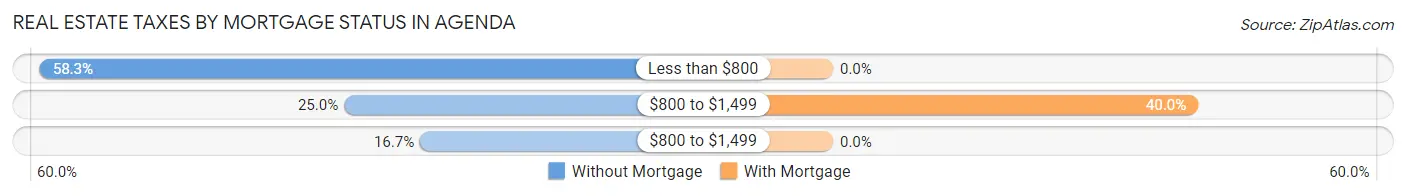
| Property Taxes | Without Mortgage | With Mortgage |
| Less than $800 | 14 (58.3%) | 0 (0.0%) |
| $800 to $1,499 | 6 (25.0%) | 2 (40.0%) |
| $800 to $1,499 | 4 (16.7%) | 0 (0.0%) |
| Total | 24 (100.0%) | 5 (100.0%) |
Health & Disability in Agenda
Health Insurance Coverage by Age in Agenda
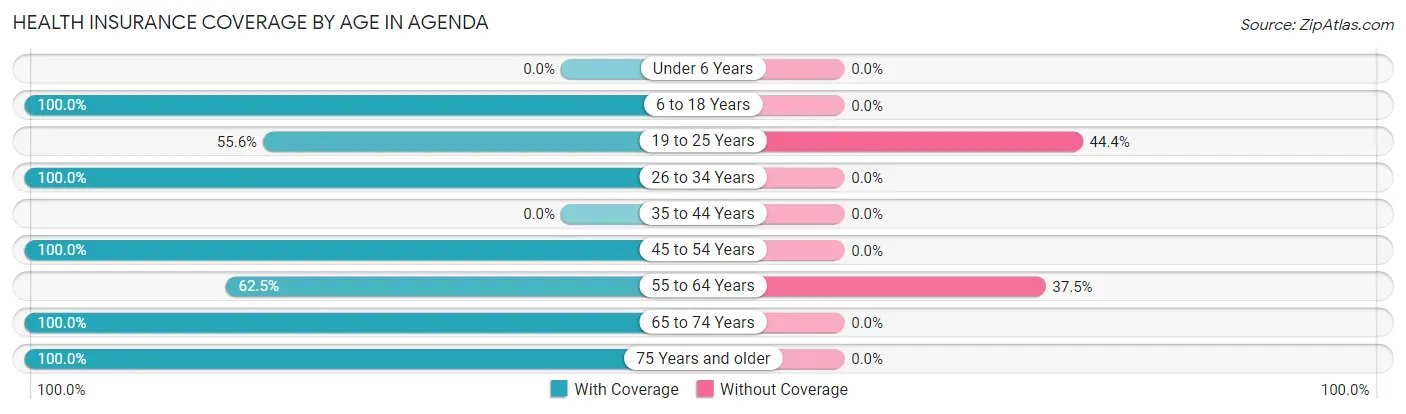
| Age Bracket | With Coverage | Without Coverage |
| Under 6 Years | 0 (0.0%) | 0 (0.0%) |
| 6 to 18 Years | 4 (100.0%) | 0 (0.0%) |
| 19 to 25 Years | 5 (55.6%) | 4 (44.4%) |
| 26 to 34 Years | 5 (100.0%) | 0 (0.0%) |
| 35 to 44 Years | 0 (0.0%) | 0 (0.0%) |
| 45 to 54 Years | 2 (100.0%) | 0 (0.0%) |
| 55 to 64 Years | 10 (62.5%) | 6 (37.5%) |
| 65 to 74 Years | 10 (100.0%) | 0 (0.0%) |
| 75 Years and older | 13 (100.0%) | 0 (0.0%) |
| Total | 49 (83.1%) | 10 (17.0%) |
Health Insurance Coverage by Citizenship Status in Agenda
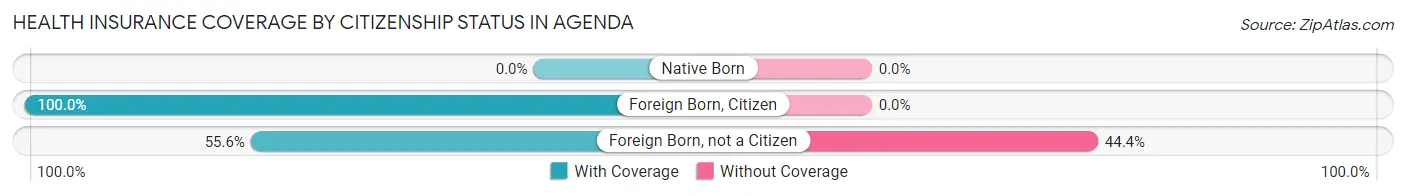
| Citizenship Status | With Coverage | Without Coverage |
| Native Born | 0 (0.0%) | 0 (0.0%) |
| Foreign Born, Citizen | 4 (100.0%) | 0 (0.0%) |
| Foreign Born, not a Citizen | 5 (55.6%) | 4 (44.4%) |
Health Insurance Coverage by Household Income in Agenda
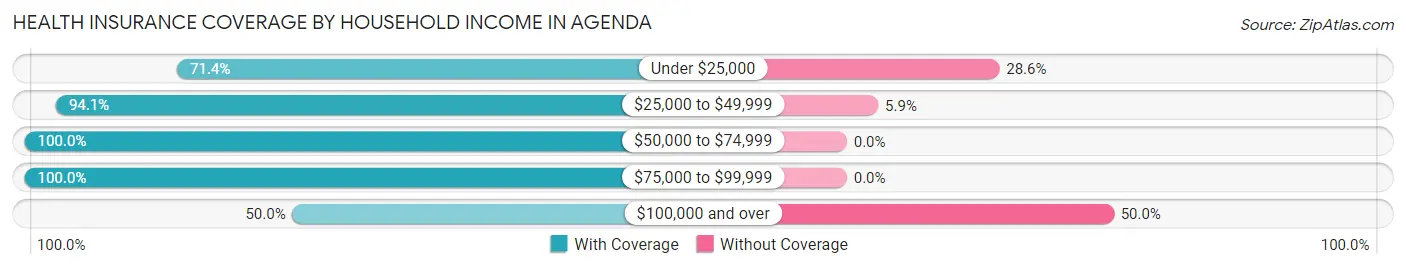
| Household Income | With Coverage | Without Coverage |
| Under $25,000 | 10 (71.4%) | 4 (28.6%) |
| $25,000 to $49,999 | 16 (94.1%) | 1 (5.9%) |
| $50,000 to $74,999 | 8 (100.0%) | 0 (0.0%) |
| $75,000 to $99,999 | 10 (100.0%) | 0 (0.0%) |
| $100,000 and over | 5 (50.0%) | 5 (50.0%) |
Public vs Private Health Insurance Coverage by Age in Agenda
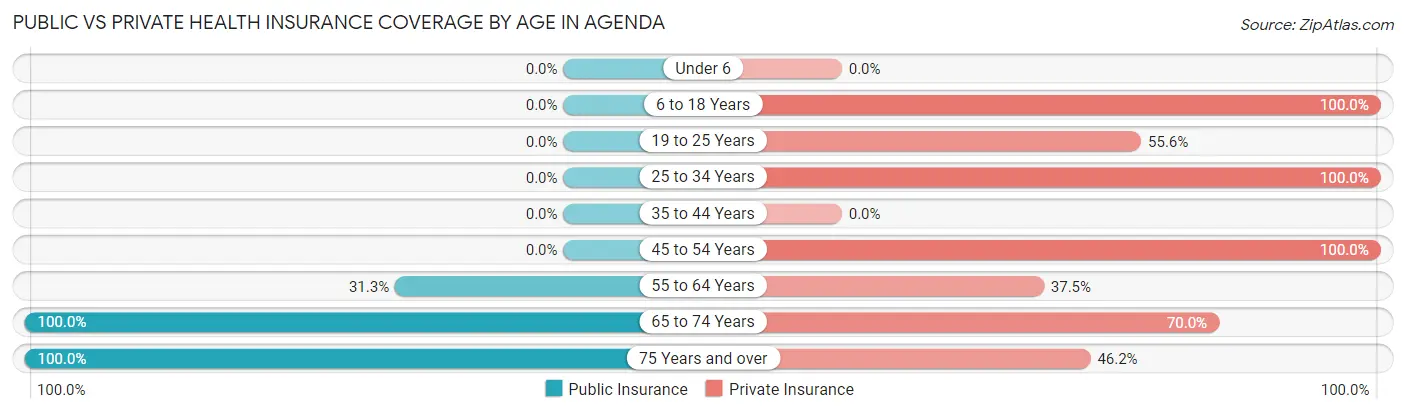
| Age Bracket | Public Insurance | Private Insurance |
| Under 6 | 0 (0.0%) | 0 (0.0%) |
| 6 to 18 Years | 0 (0.0%) | 4 (100.0%) |
| 19 to 25 Years | 0 (0.0%) | 5 (55.6%) |
| 25 to 34 Years | 0 (0.0%) | 5 (100.0%) |
| 35 to 44 Years | 0 (0.0%) | 0 (0.0%) |
| 45 to 54 Years | 0 (0.0%) | 2 (100.0%) |
| 55 to 64 Years | 5 (31.2%) | 6 (37.5%) |
| 65 to 74 Years | 10 (100.0%) | 7 (70.0%) |
| 75 Years and over | 13 (100.0%) | 6 (46.2%) |
| Total | 28 (47.5%) | 35 (59.3%) |
Disability Status by Sex by Age in Agenda
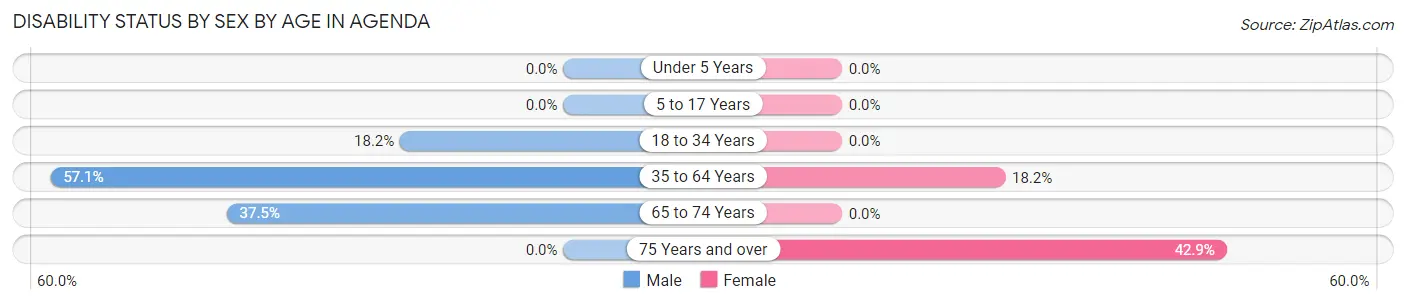
| Age Bracket | Male | Female |
| Under 5 Years | 0 (0.0%) | 0 (0.0%) |
| 5 to 17 Years | 0 (0.0%) | 0 (0.0%) |
| 18 to 34 Years | 2 (18.2%) | 0 (0.0%) |
| 35 to 64 Years | 4 (57.1%) | 2 (18.2%) |
| 65 to 74 Years | 3 (37.5%) | 0 (0.0%) |
| 75 Years and over | 0 (0.0%) | 3 (42.9%) |
Disability Class by Sex by Age in Agenda
Disability Class: Hearing Difficulty
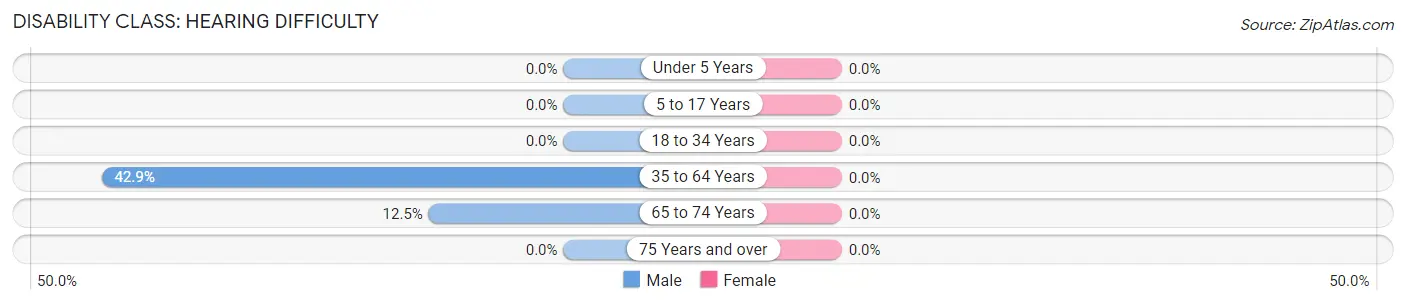
| Age Bracket | Male | Female |
| Under 5 Years | 0 (0.0%) | 0 (0.0%) |
| 5 to 17 Years | 0 (0.0%) | 0 (0.0%) |
| 18 to 34 Years | 0 (0.0%) | 0 (0.0%) |
| 35 to 64 Years | 3 (42.9%) | 0 (0.0%) |
| 65 to 74 Years | 1 (12.5%) | 0 (0.0%) |
| 75 Years and over | 0 (0.0%) | 0 (0.0%) |
Disability Class: Vision Difficulty
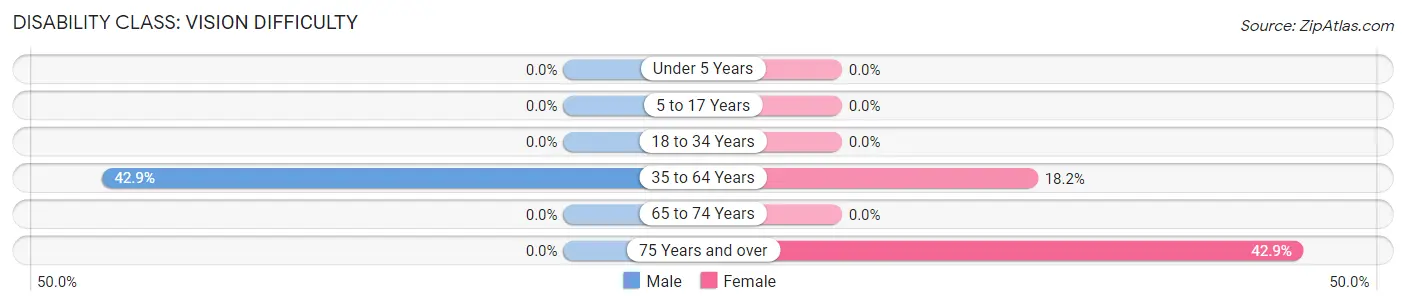
| Age Bracket | Male | Female |
| Under 5 Years | 0 (0.0%) | 0 (0.0%) |
| 5 to 17 Years | 0 (0.0%) | 0 (0.0%) |
| 18 to 34 Years | 0 (0.0%) | 0 (0.0%) |
| 35 to 64 Years | 3 (42.9%) | 2 (18.2%) |
| 65 to 74 Years | 0 (0.0%) | 0 (0.0%) |
| 75 Years and over | 0 (0.0%) | 3 (42.9%) |
Disability Class: Cognitive Difficulty
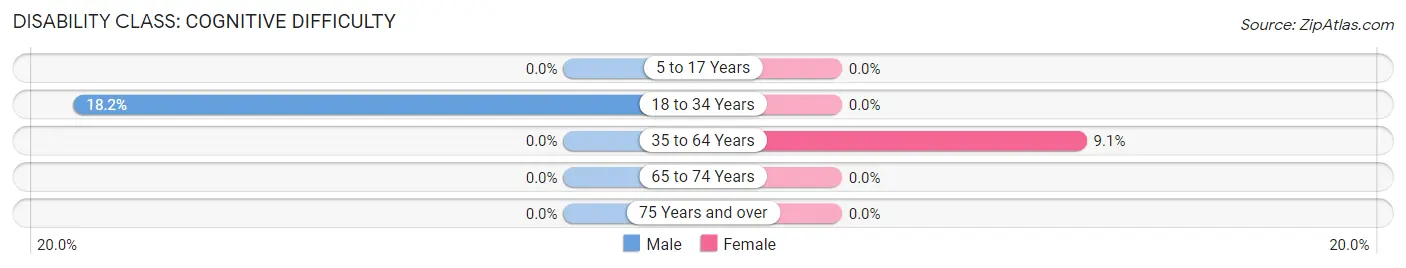
| Age Bracket | Male | Female |
| 5 to 17 Years | 0 (0.0%) | 0 (0.0%) |
| 18 to 34 Years | 2 (18.2%) | 0 (0.0%) |
| 35 to 64 Years | 0 (0.0%) | 1 (9.1%) |
| 65 to 74 Years | 0 (0.0%) | 0 (0.0%) |
| 75 Years and over | 0 (0.0%) | 0 (0.0%) |
Disability Class: Ambulatory Difficulty
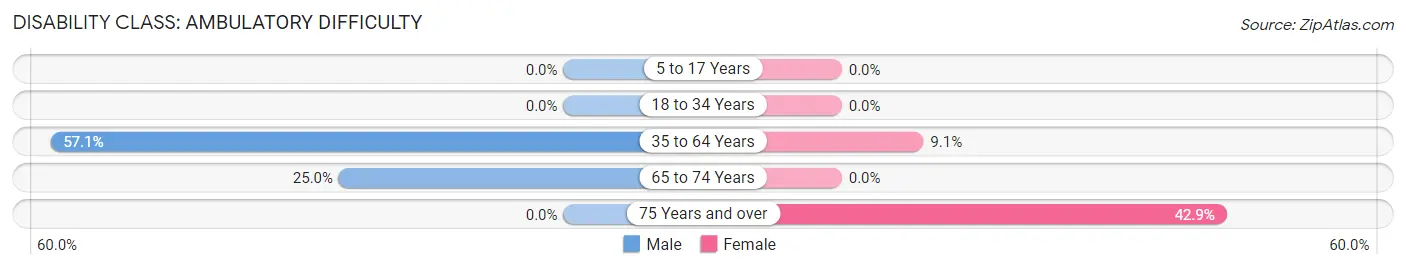
| Age Bracket | Male | Female |
| 5 to 17 Years | 0 (0.0%) | 0 (0.0%) |
| 18 to 34 Years | 0 (0.0%) | 0 (0.0%) |
| 35 to 64 Years | 4 (57.1%) | 1 (9.1%) |
| 65 to 74 Years | 2 (25.0%) | 0 (0.0%) |
| 75 Years and over | 0 (0.0%) | 3 (42.9%) |
Disability Class: Self-Care Difficulty
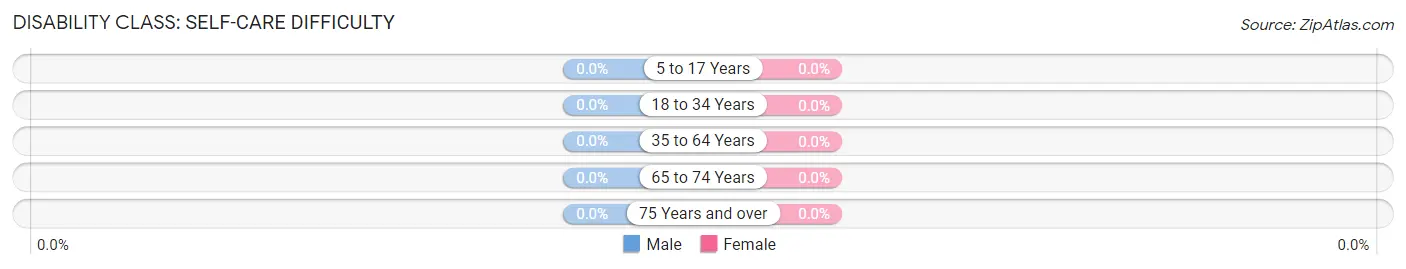
| Age Bracket | Male | Female |
| 5 to 17 Years | 0 (0.0%) | 0 (0.0%) |
| 18 to 34 Years | 0 (0.0%) | 0 (0.0%) |
| 35 to 64 Years | 0 (0.0%) | 0 (0.0%) |
| 65 to 74 Years | 0 (0.0%) | 0 (0.0%) |
| 75 Years and over | 0 (0.0%) | 0 (0.0%) |
Technology Access in Agenda
Computing Device Access in Agenda
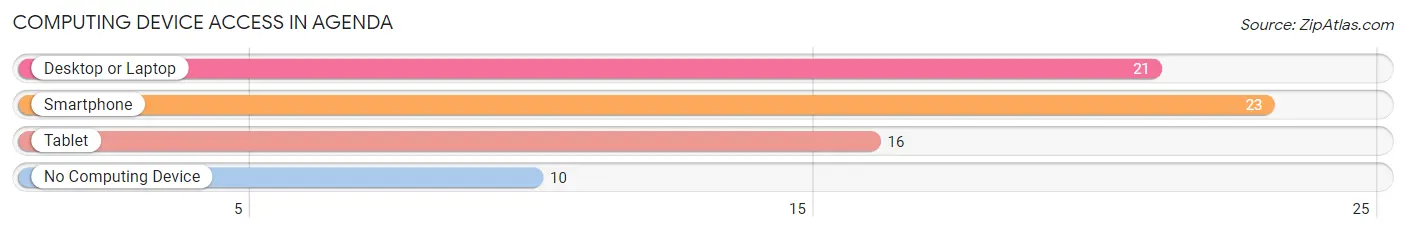
| Device Type | # Households | % Households |
| Desktop or Laptop | 21 | 63.6% |
| Smartphone | 23 | 69.7% |
| Tablet | 16 | 48.5% |
| No Computing Device | 10 | 30.3% |
| Total | 33 | 100.0% |
Internet Access in Agenda
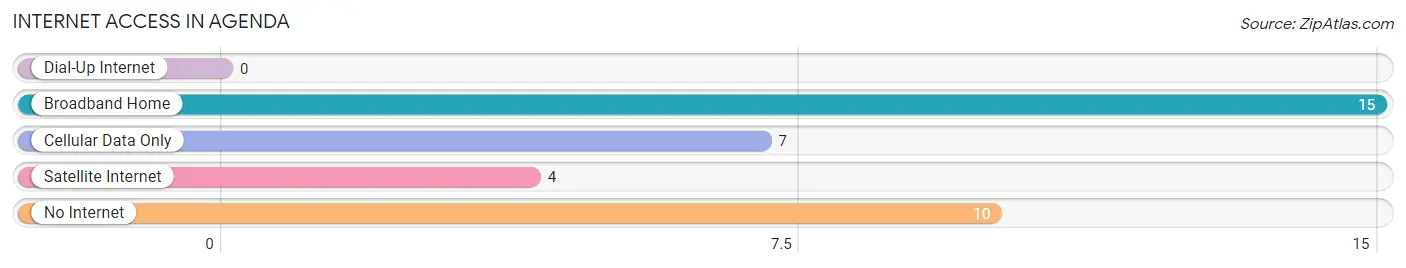
| Internet Type | # Households | % Households |
| Dial-Up Internet | 0 | 0.0% |
| Broadband Home | 15 | 45.5% |
| Cellular Data Only | 7 | 21.2% |
| Satellite Internet | 4 | 12.1% |
| No Internet | 10 | 30.3% |
| Total | 33 | 100.0% |
Agenda Summary
Agenda
Kansas is a state located in the Midwestern United States. It is bordered by Nebraska to the north, Missouri to the east, Oklahoma to the south, and Colorado to the west. Kansas is the 15th most populous state in the United States, with an estimated population of 2,913,314 in 2019. The state capital is Topeka, and the largest city is Wichita.
History
The area now known as Kansas was first inhabited by Native American tribes, including the Kansa, Osage, Pawnee, and Wichita. The first European to explore the area was the Spanish explorer Francisco Vásquez de Coronado, who visited the area in 1541. The area was part of the Louisiana Purchase in 1803, and became part of the United States in 1854 when it was admitted to the Union as a free state.
Geography
Kansas is located in the Midwestern United States, and is bordered by Nebraska to the north, Missouri to the east, Oklahoma to the south, and Colorado to the west. The state has a total area of 82,278 square miles, making it the 15th largest state in the country. The eastern two-thirds of the state is covered by the Great Plains, while the western third is part of the High Plains. The highest point in the state is Mount Sunflower, which has an elevation of 4,041 feet.
Economy
The economy of Kansas is largely based on agriculture, with wheat, sorghum, corn, and soybeans being the main crops. The state is also a major producer of beef, pork, and dairy products. Manufacturing is also an important part of the economy, with aircraft, transportation equipment, food processing, and printing being the main industries. The state is also home to several major oil and gas fields.
Demographics
As of 2019, the population of Kansas was estimated to be 2,913,314. The state has a population density of 35.3 people per square mile, making it the 33rd most densely populated state in the country. The racial makeup of the state is 85.3% White, 6.3% Black or African American, 2.7% Asian, 0.7% Native American, and 4.0% from other races. The median household income in the state is $54,935, and the median age is 37.7 years.
Conclusion
Kansas is a state located in the Midwestern United States, with a population of 2,913,314 in 2019. The state has a diverse economy, with agriculture, manufacturing, and oil and gas being the main industries. The population of the state is largely white, with 85.3% of the population identifying as such. The median household income in the state is $54,935, and the median age is 37.7 years.
Common Questions
What is Per Capita Income in Agenda?
Per Capita income in Agenda is $34,975.
What is the Median Family Income in Agenda?
Median Family Income in Agenda is $43,750.
What is the Median Household income in Agenda?
Median Household Income in Agenda is $44,531.
What is Income or Wage Gap in Agenda?
Income or Wage Gap in Agenda is 12.7%.
Women in Agenda earn 87.3 cents for every dollar earned by a man.
What is Inequality or Gini Index in Agenda?
Inequality or Gini Index in Agenda is 0.36.
What is the Total Population of Agenda?
Total Population of Agenda is 59.
What is the Total Male Population of Agenda?
Total Male Population of Agenda is 34.
What is the Total Female Population of Agenda?
Total Female Population of Agenda is 25.
What is the Ratio of Males per 100 Females in Agenda?
There are 136.00 Males per 100 Females in Agenda.
What is the Ratio of Females per 100 Males in Agenda?
There are 73.53 Females per 100 Males in Agenda.
What is the Median Population Age in Agenda?
Median Population Age in Agenda is 62.3 Years.
What is the Average Family Size in Agenda
Average Family Size in Agenda is 2.2 People.
What is the Average Household Size in Agenda
Average Household Size in Agenda is 1.8 People.
How Large is the Labor Force in Agenda?
There are 30 People in the Labor Forcein in Agenda.
What is the Percentage of People in the Labor Force in Agenda?
50.8% of People are in the Labor Force in Agenda.