Quenemo, KS Map & Demographics
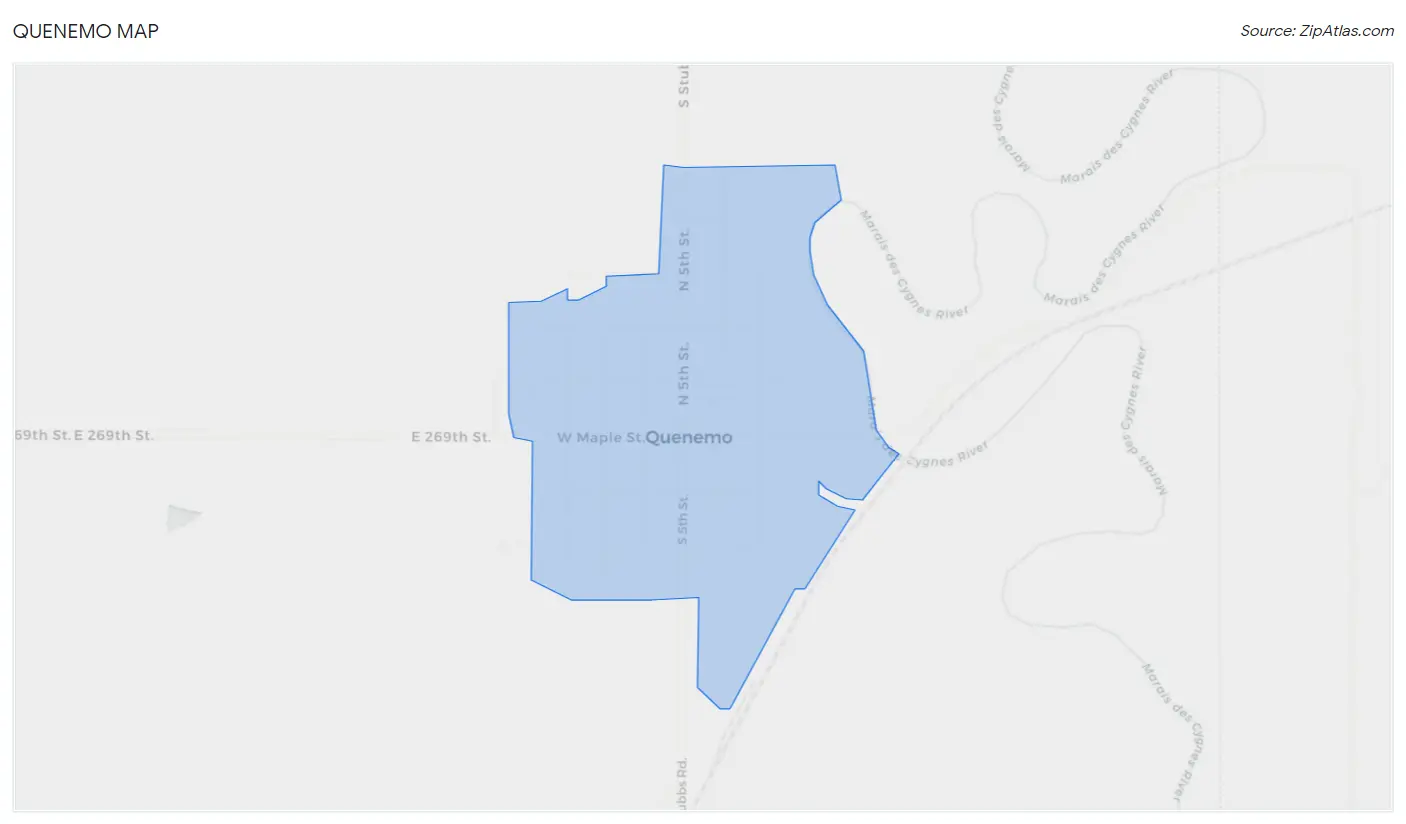
Quenemo Map
Quenemo Overview
$20,038
PER CAPITA INCOME
$48,750
AVG FAMILY INCOME
$45,625
AVG HOUSEHOLD INCOME
29.6%
WAGE / INCOME GAP [ % ]
70.4¢/ $1
WAGE / INCOME GAP [ $ ]
0.47
INEQUALITY / GINI INDEX
362
TOTAL POPULATION
203
MALE POPULATION
159
FEMALE POPULATION
127.67
MALES / 100 FEMALES
78.33
FEMALES / 100 MALES
38.9
MEDIAN AGE
3.8
AVG FAMILY SIZE
3.4
AVG HOUSEHOLD SIZE
127
LABOR FORCE [ PEOPLE ]
45.7%
PERCENT IN LABOR FORCE
Quenemo Zip Codes
Quenemo Area Codes
Income in Quenemo
Income Overview in Quenemo
Per Capita Income in Quenemo is $20,038, while median incomes of families and households are $48,750 and $45,625 respectively.
| Characteristic | Number | Measure |
| Per Capita Income | 362 | $20,038 |
| Median Family Income | 75 | $48,750 |
| Mean Family Income | 75 | $56,811 |
| Median Household Income | 108 | $45,625 |
| Mean Household Income | 108 | $56,213 |
| Income Deficit | 75 | $0 |
| Wage / Income Gap (%) | 362 | 29.60% |
| Wage / Income Gap ($) | 362 | 70.40¢ per $1 |
| Gini / Inequality Index | 362 | 0.47 |
Earnings by Sex in Quenemo
Average Earnings in Quenemo are $27,639, $36,964 for men and $26,023 for women, a difference of 29.6%.
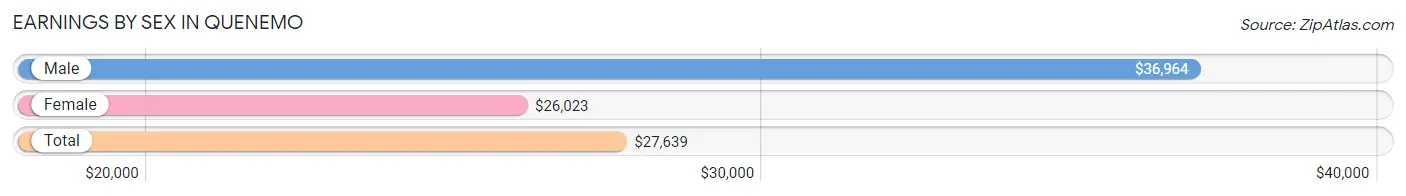
| Sex | Number | Average Earnings |
| Male | 75 (54.7%) | $36,964 |
| Female | 62 (45.3%) | $26,023 |
| Total | 137 (100.0%) | $27,639 |
Earnings by Sex by Income Bracket in Quenemo
The most common earnings brackets in Quenemo are $35,000 to $39,999 for men (9 | 12.0%) and $25,000 to $29,999 for women (28 | 45.2%).
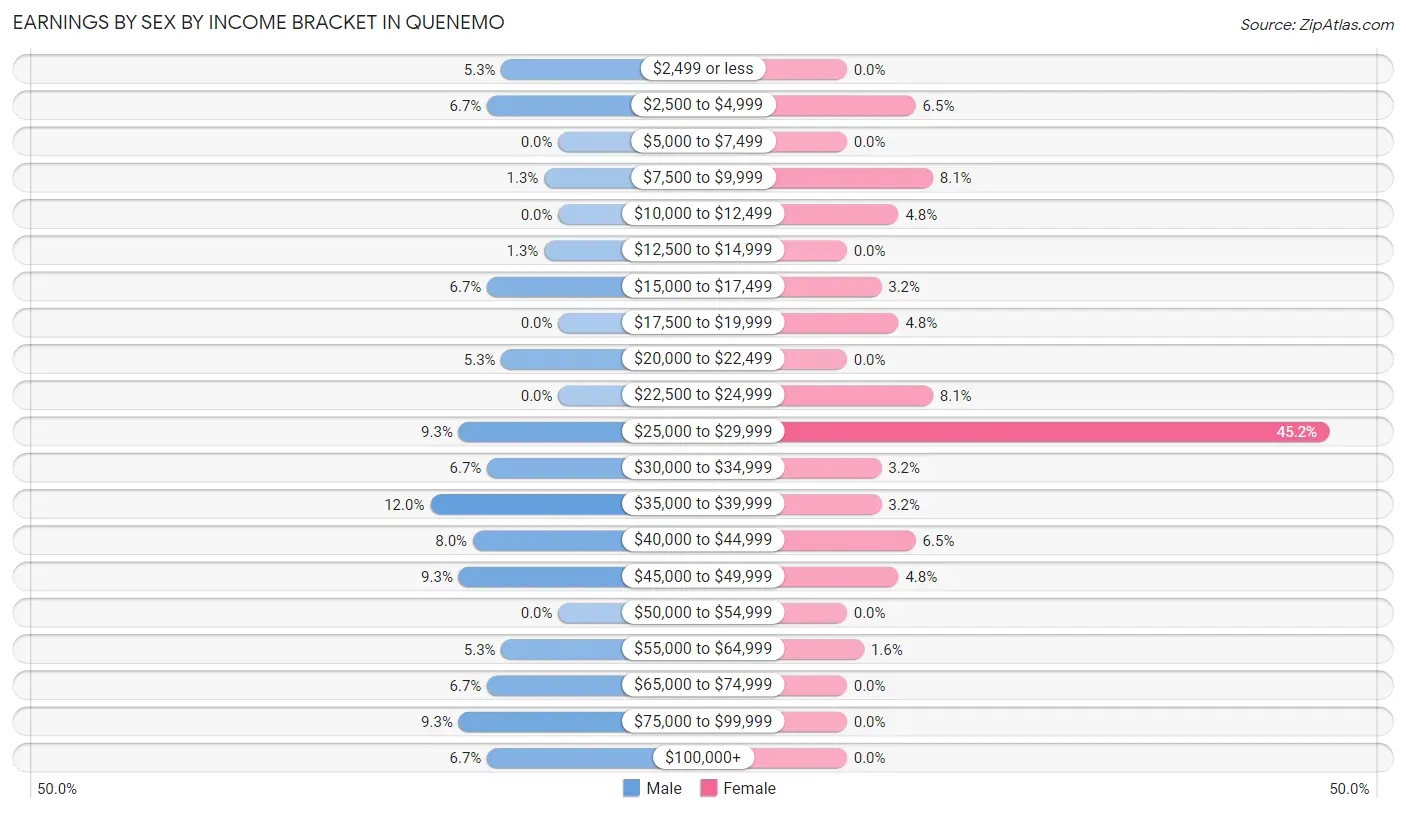
| Income | Male | Female |
| $2,499 or less | 4 (5.3%) | 0 (0.0%) |
| $2,500 to $4,999 | 5 (6.7%) | 4 (6.5%) |
| $5,000 to $7,499 | 0 (0.0%) | 0 (0.0%) |
| $7,500 to $9,999 | 1 (1.3%) | 5 (8.1%) |
| $10,000 to $12,499 | 0 (0.0%) | 3 (4.8%) |
| $12,500 to $14,999 | 1 (1.3%) | 0 (0.0%) |
| $15,000 to $17,499 | 5 (6.7%) | 2 (3.2%) |
| $17,500 to $19,999 | 0 (0.0%) | 3 (4.8%) |
| $20,000 to $22,499 | 4 (5.3%) | 0 (0.0%) |
| $22,500 to $24,999 | 0 (0.0%) | 5 (8.1%) |
| $25,000 to $29,999 | 7 (9.3%) | 28 (45.2%) |
| $30,000 to $34,999 | 5 (6.7%) | 2 (3.2%) |
| $35,000 to $39,999 | 9 (12.0%) | 2 (3.2%) |
| $40,000 to $44,999 | 6 (8.0%) | 4 (6.5%) |
| $45,000 to $49,999 | 7 (9.3%) | 3 (4.8%) |
| $50,000 to $54,999 | 0 (0.0%) | 0 (0.0%) |
| $55,000 to $64,999 | 4 (5.3%) | 1 (1.6%) |
| $65,000 to $74,999 | 5 (6.7%) | 0 (0.0%) |
| $75,000 to $99,999 | 7 (9.3%) | 0 (0.0%) |
| $100,000+ | 5 (6.7%) | 0 (0.0%) |
| Total | 75 (100.0%) | 62 (100.0%) |
Earnings by Sex by Educational Attainment in Quenemo
Average earnings in Quenemo are $39,375 for men and $26,250 for women, a difference of 33.3%. Men with an educational attainment of college or associate's degree enjoy the highest average annual earnings of $115,625, while those with less than high school education earn the least with $38,750. Women with an educational attainment of bachelor's degree earn the most with the average annual earnings of $48,750, while those with high school diploma education have the smallest earnings of $25,750.
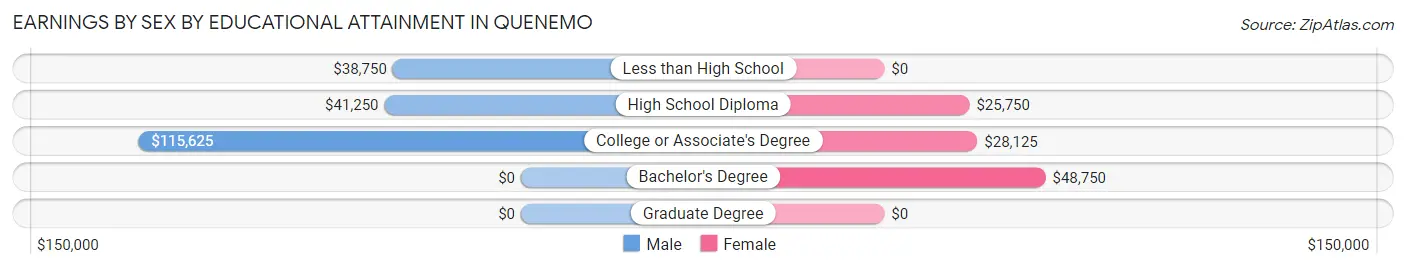
| Educational Attainment | Male Income | Female Income |
| Less than High School | $38,750 | $0 |
| High School Diploma | $41,250 | $25,750 |
| College or Associate's Degree | $115,625 | $28,125 |
| Bachelor's Degree | - | - |
| Graduate Degree | - | - |
| Total | $39,375 | $26,250 |
Family Income in Quenemo
Family Income Brackets in Quenemo
According to the Quenemo family income data, there are 21 families falling into the $50,000 to $74,999 income range, which is the most common income bracket and makes up 28.0% of all families.
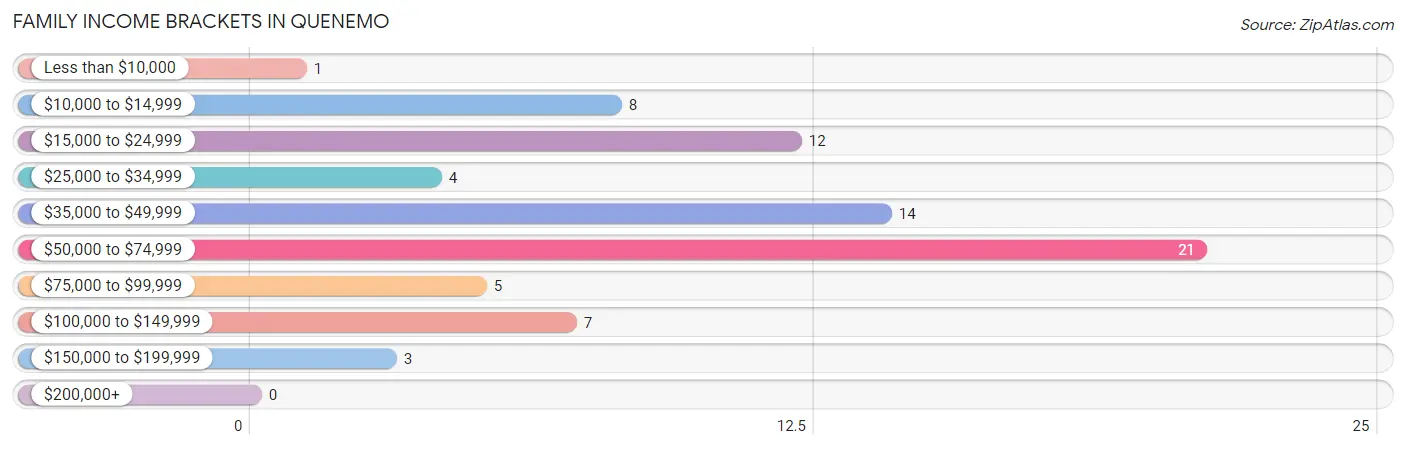
| Income Bracket | # Families | % Families |
| Less than $10,000 | 1 | 1.3% |
| $10,000 to $14,999 | 8 | 10.7% |
| $15,000 to $24,999 | 12 | 16.0% |
| $25,000 to $34,999 | 4 | 5.3% |
| $35,000 to $49,999 | 14 | 18.7% |
| $50,000 to $74,999 | 21 | 28.0% |
| $75,000 to $99,999 | 5 | 6.7% |
| $100,000 to $149,999 | 7 | 9.3% |
| $150,000 to $199,999 | 3 | 4.0% |
| $200,000+ | 0 | 0.0% |
Family Income by Famaliy Size in Quenemo
4-person families (11 | 14.7%) account for the highest median family income in Quenemo with $106,875 per family, while 4-person families (11 | 14.7%) have the highest median income of $26,719 per family member.
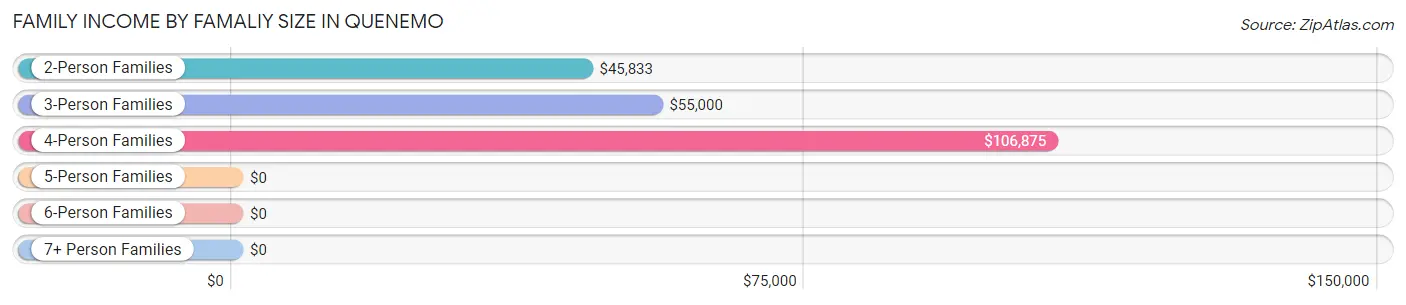
| Income Bracket | # Families | Median Income |
| 2-Person Families | 40 (53.3%) | $45,833 |
| 3-Person Families | 16 (21.3%) | $55,000 |
| 4-Person Families | 11 (14.7%) | $106,875 |
| 5-Person Families | 1 (1.3%) | $0 |
| 6-Person Families | 7 (9.3%) | $0 |
| 7+ Person Families | 0 (0.0%) | $0 |
| Total | 75 (100.0%) | $48,750 |
Family Income by Number of Earners in Quenemo
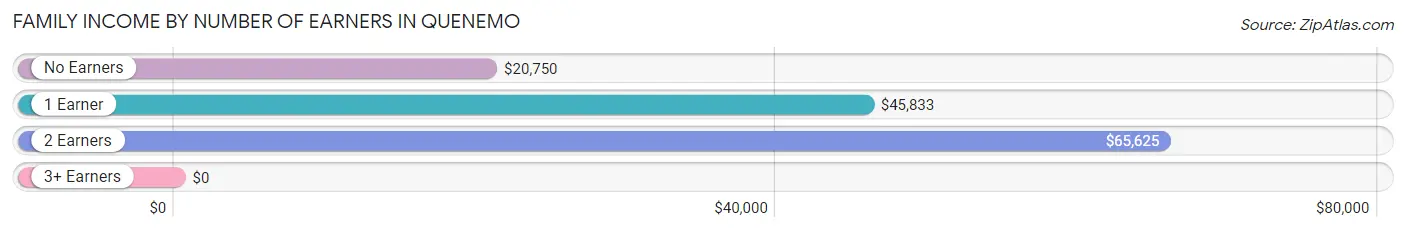
| Number of Earners | # Families | Median Income |
| No Earners | 21 (28.0%) | $20,750 |
| 1 Earner | 30 (40.0%) | $45,833 |
| 2 Earners | 19 (25.3%) | $65,625 |
| 3+ Earners | 5 (6.7%) | $0 |
| Total | 75 (100.0%) | $48,750 |
Household Income in Quenemo
Household Income Brackets in Quenemo
With 19 households falling in the category, the $35,000 to $49,999 income range is the most frequent in Quenemo, accounting for 17.6% of all households. In contrast, only 2 households (1.8%) fall into the $200,000+ income bracket, making it the least populous group.
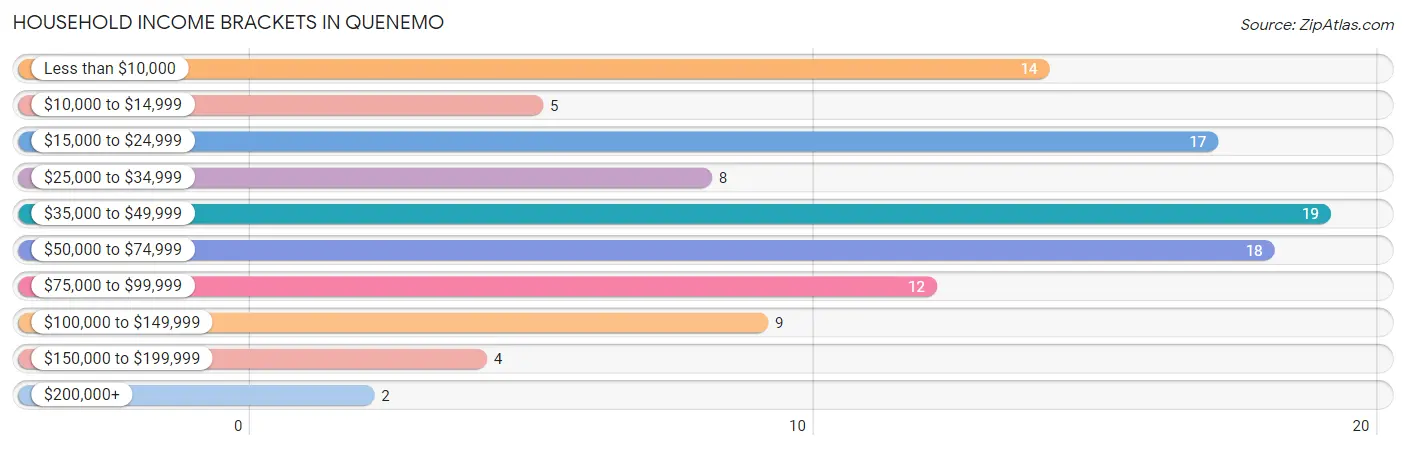
| Income Bracket | # Households | % Households |
| Less than $10,000 | 14 | 13.0% |
| $10,000 to $14,999 | 5 | 4.6% |
| $15,000 to $24,999 | 17 | 15.7% |
| $25,000 to $34,999 | 8 | 7.4% |
| $35,000 to $49,999 | 19 | 17.6% |
| $50,000 to $74,999 | 18 | 16.7% |
| $75,000 to $99,999 | 12 | 11.1% |
| $100,000 to $149,999 | 9 | 8.3% |
| $150,000 to $199,999 | 4 | 3.7% |
| $200,000+ | 2 | 1.9% |
Household Income by Householder Age in Quenemo
The median household income in Quenemo is $45,625, with the highest median household income of $46,071 found in the 25 to 44 years age bracket for the primary householder. A total of 36 households (33.3%) fall into this category. Meanwhile, the 15 to 24 years age bracket for the primary householder has the lowest median household income of $0, with 4 households (3.7%) in this group.
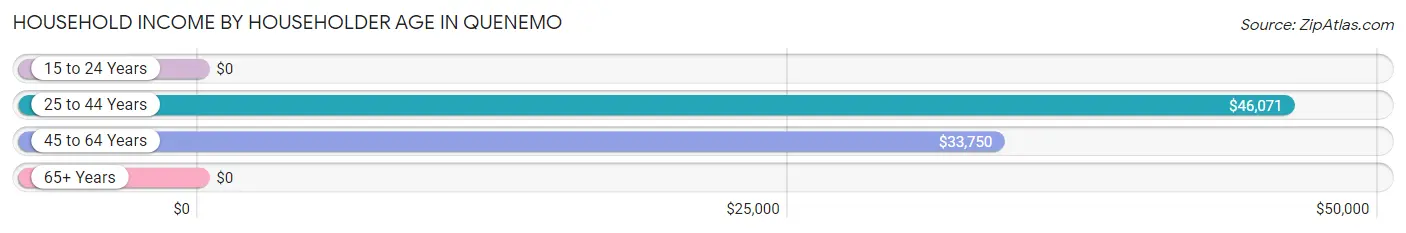
| Income Bracket | # Households | Median Income |
| 15 to 24 Years | 4 (3.7%) | $0 |
| 25 to 44 Years | 36 (33.3%) | $46,071 |
| 45 to 64 Years | 37 (34.3%) | $33,750 |
| 65+ Years | 31 (28.7%) | $0 |
| Total | 108 (100.0%) | $45,625 |
Poverty in Quenemo
Income Below Poverty by Sex and Age in Quenemo
With 18.2% poverty level for males and 32.7% for females among the residents of Quenemo, 12 to 14 year old males and 15 year old females are the most vulnerable to poverty, with 6 males (75.0%) and 2 females (100.0%) in their respective age groups living below the poverty level.
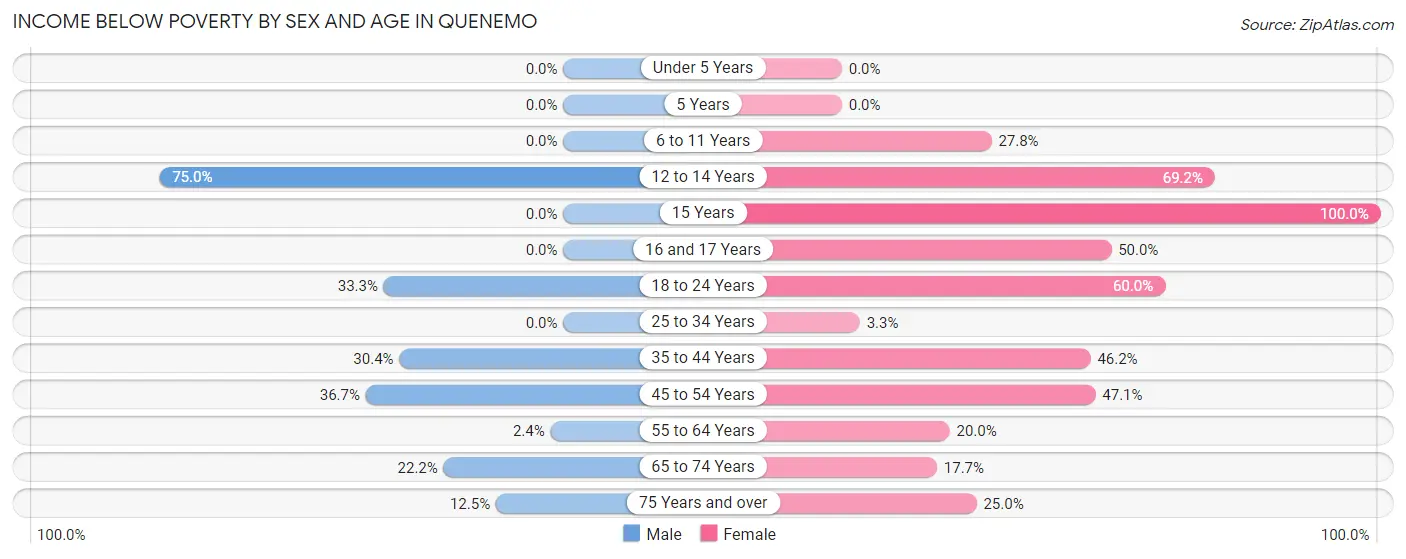
| Age Bracket | Male | Female |
| Under 5 Years | 0 (0.0%) | 0 (0.0%) |
| 5 Years | 0 (0.0%) | 0 (0.0%) |
| 6 to 11 Years | 0 (0.0%) | 5 (27.8%) |
| 12 to 14 Years | 6 (75.0%) | 9 (69.2%) |
| 15 Years | 0 (0.0%) | 2 (100.0%) |
| 16 and 17 Years | 0 (0.0%) | 2 (50.0%) |
| 18 to 24 Years | 5 (33.3%) | 6 (60.0%) |
| 25 to 34 Years | 0 (0.0%) | 1 (3.3%) |
| 35 to 44 Years | 7 (30.4%) | 12 (46.2%) |
| 45 to 54 Years | 11 (36.7%) | 8 (47.1%) |
| 55 to 64 Years | 1 (2.4%) | 3 (20.0%) |
| 65 to 74 Years | 4 (22.2%) | 3 (17.6%) |
| 75 Years and over | 1 (12.5%) | 1 (25.0%) |
| Total | 35 (18.2%) | 52 (32.7%) |
Income Above Poverty by Sex and Age in Quenemo
According to the poverty statistics in Quenemo, males aged under 5 years and females aged under 5 years are the age groups that are most secure financially, with 100.0% of males and 100.0% of females in these age groups living above the poverty line.
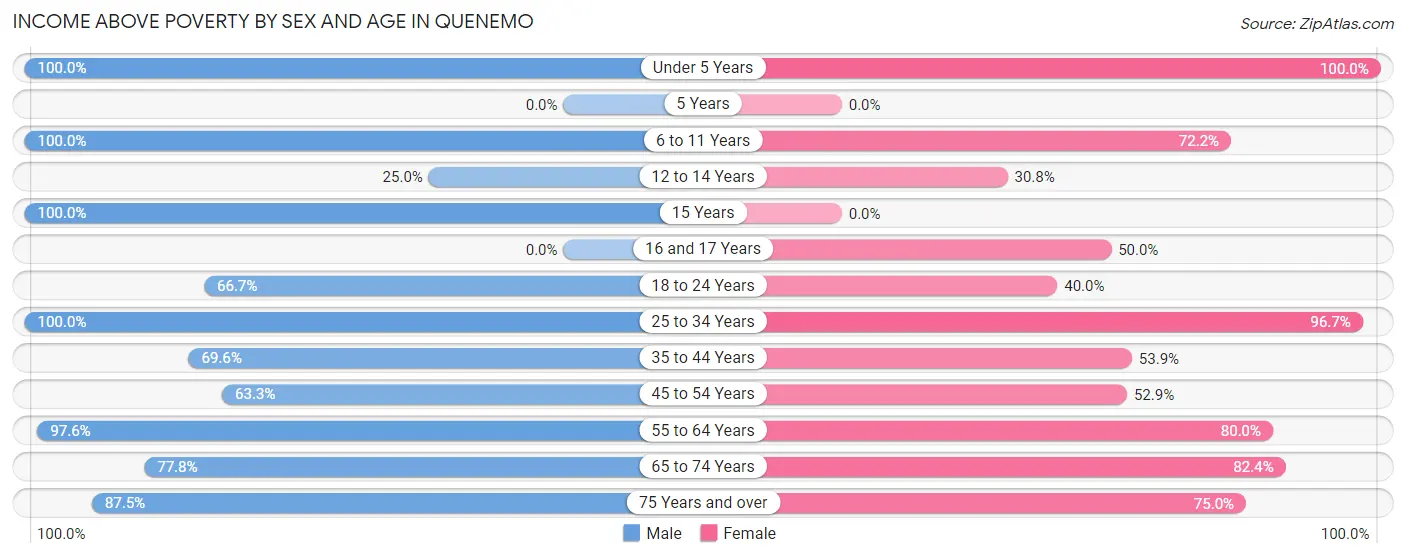
| Age Bracket | Male | Female |
| Under 5 Years | 3 (100.0%) | 3 (100.0%) |
| 5 Years | 0 (0.0%) | 0 (0.0%) |
| 6 to 11 Years | 14 (100.0%) | 13 (72.2%) |
| 12 to 14 Years | 2 (25.0%) | 4 (30.8%) |
| 15 Years | 12 (100.0%) | 0 (0.0%) |
| 16 and 17 Years | 0 (0.0%) | 2 (50.0%) |
| 18 to 24 Years | 10 (66.7%) | 4 (40.0%) |
| 25 to 34 Years | 19 (100.0%) | 29 (96.7%) |
| 35 to 44 Years | 16 (69.6%) | 14 (53.8%) |
| 45 to 54 Years | 19 (63.3%) | 9 (52.9%) |
| 55 to 64 Years | 41 (97.6%) | 12 (80.0%) |
| 65 to 74 Years | 14 (77.8%) | 14 (82.4%) |
| 75 Years and over | 7 (87.5%) | 3 (75.0%) |
| Total | 157 (81.8%) | 107 (67.3%) |
Income Below Poverty Among Married-Couple Families in Quenemo
The poverty statistics for married-couple families in Quenemo show that 17.8% or 8 of the total 45 families live below the poverty line. Families with 1 or 2 children have the highest poverty rate of 35.7%, comprising of 5 families. On the other hand, families with 3 or 4 children have the lowest poverty rate of 0.0%, which includes 0 families.
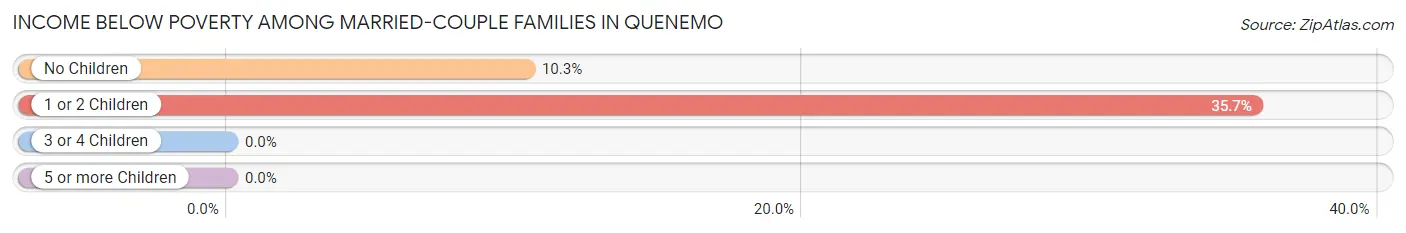
| Children | Above Poverty | Below Poverty |
| No Children | 26 (89.7%) | 3 (10.3%) |
| 1 or 2 Children | 9 (64.3%) | 5 (35.7%) |
| 3 or 4 Children | 2 (100.0%) | 0 (0.0%) |
| 5 or more Children | 0 (0.0%) | 0 (0.0%) |
| Total | 37 (82.2%) | 8 (17.8%) |
Income Below Poverty Among Single-Parent Households in Quenemo
According to the poverty data in Quenemo, 13.3% or 2 single-father households and 33.3% or 5 single-mother households are living below the poverty line. Among single-father households, those with 3 or 4 children have the highest poverty rate, with 2 households (100.0%) experiencing poverty. Likewise, among single-mother households, those with 1 or 2 children have the highest poverty rate, with 5 households (38.5%) falling below the poverty line.
| Children | Single Father | Single Mother |
| No Children | 0 (0.0%) | 0 (0.0%) |
| 1 or 2 Children | 0 (0.0%) | 5 (38.5%) |
| 3 or 4 Children | 2 (100.0%) | 0 (0.0%) |
| 5 or more Children | 0 (0.0%) | 0 (0.0%) |
| Total | 2 (13.3%) | 5 (33.3%) |
Income Below Poverty Among Married-Couple vs Single-Parent Households in Quenemo
The poverty data for Quenemo shows that 8 of the married-couple family households (17.8%) and 7 of the single-parent households (23.3%) are living below the poverty level. Within the married-couple family households, those with 1 or 2 children have the highest poverty rate, with 5 households (35.7%) falling below the poverty line. Among the single-parent households, those with 3 or 4 children have the highest poverty rate, with 2 household (100.0%) living below poverty.
| Children | Married-Couple Families | Single-Parent Households |
| No Children | 3 (10.3%) | 0 (0.0%) |
| 1 or 2 Children | 5 (35.7%) | 5 (26.3%) |
| 3 or 4 Children | 0 (0.0%) | 2 (100.0%) |
| 5 or more Children | 0 (0.0%) | 0 (0.0%) |
| Total | 8 (17.8%) | 7 (23.3%) |
Race in Quenemo
The most populous races in Quenemo are White / Caucasian (354 | 97.8%), Hispanic or Latino (20 | 5.5%), and Two or more Races (8 | 2.2%).
| Race | # Population | % Population |
| Asian | 0 | 0.0% |
| Black / African American | 0 | 0.0% |
| Hawaiian / Pacific | 0 | 0.0% |
| Hispanic or Latino | 20 | 5.5% |
| Native / Alaskan | 0 | 0.0% |
| White / Caucasian | 354 | 97.8% |
| Two or more Races | 8 | 2.2% |
| Some other Race | 0 | 0.0% |
| Total | 362 | 100.0% |
Ancestry in Quenemo
The most populous ancestries reported in Quenemo are European (109 | 30.1%), German (34 | 9.4%), Mexican (20 | 5.5%), Irish (19 | 5.2%), and Swedish (19 | 5.2%), together accounting for 55.5% of all Quenemo residents.
| Ancestry | # Population | % Population |
| American | 16 | 4.4% |
| Blackfeet | 2 | 0.5% |
| British | 2 | 0.5% |
| Dutch | 5 | 1.4% |
| English | 3 | 0.8% |
| European | 109 | 30.1% |
| French | 3 | 0.8% |
| German | 34 | 9.4% |
| Irish | 19 | 5.2% |
| Mexican | 20 | 5.5% |
| Norwegian | 3 | 0.8% |
| Polish | 5 | 1.4% |
| Scotch-Irish | 2 | 0.5% |
| Scottish | 3 | 0.8% |
| Swedish | 19 | 5.2% | View All 15 Rows |
Immigrants in Quenemo

| Immigration Origin | # Population | % Population | View All 0 Rows |
Sex and Age in Quenemo
Sex and Age in Quenemo
The most populous age groups in Quenemo are 60 to 64 Years (33 | 16.3%) for men and 25 to 29 Years (21 | 13.2%) for women.
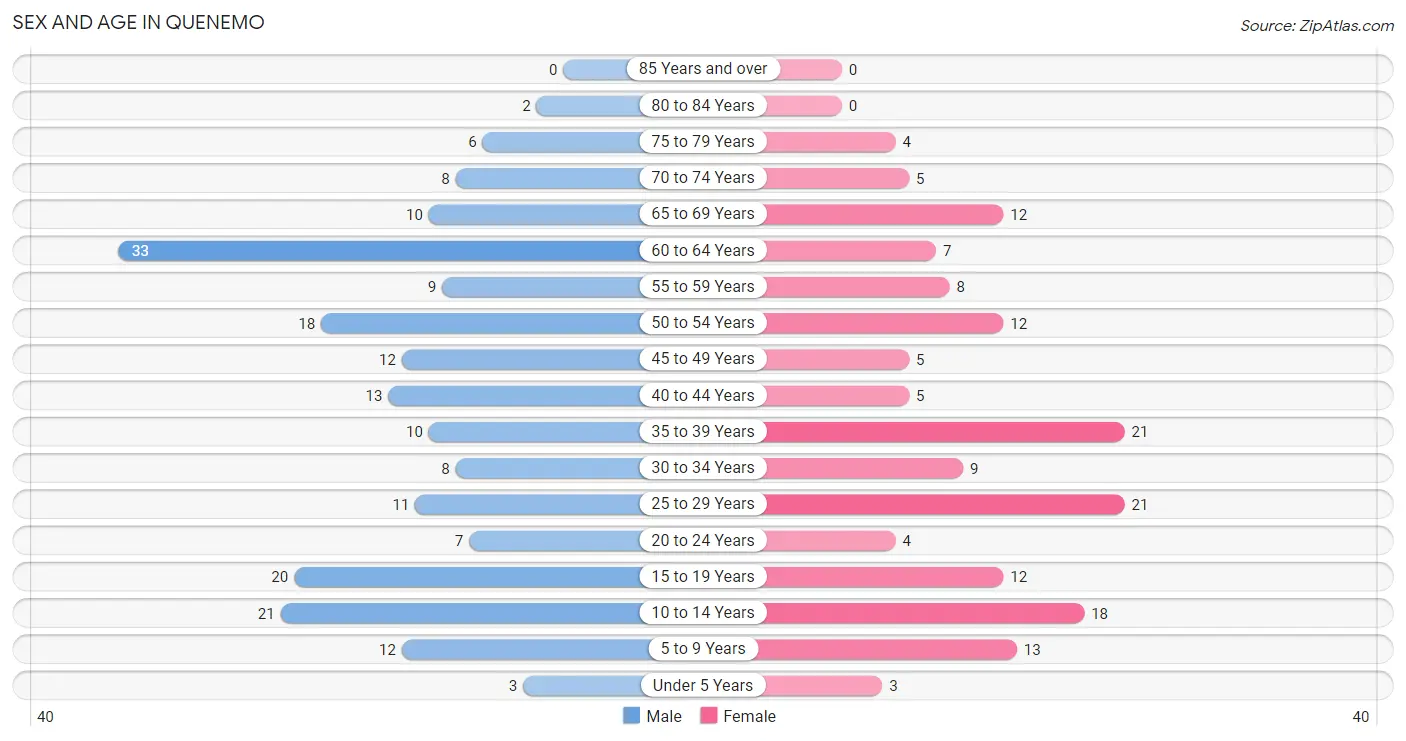
| Age Bracket | Male | Female |
| Under 5 Years | 3 (1.5%) | 3 (1.9%) |
| 5 to 9 Years | 12 (5.9%) | 13 (8.2%) |
| 10 to 14 Years | 21 (10.3%) | 18 (11.3%) |
| 15 to 19 Years | 20 (9.9%) | 12 (7.5%) |
| 20 to 24 Years | 7 (3.5%) | 4 (2.5%) |
| 25 to 29 Years | 11 (5.4%) | 21 (13.2%) |
| 30 to 34 Years | 8 (3.9%) | 9 (5.7%) |
| 35 to 39 Years | 10 (4.9%) | 21 (13.2%) |
| 40 to 44 Years | 13 (6.4%) | 5 (3.1%) |
| 45 to 49 Years | 12 (5.9%) | 5 (3.1%) |
| 50 to 54 Years | 18 (8.9%) | 12 (7.5%) |
| 55 to 59 Years | 9 (4.4%) | 8 (5.0%) |
| 60 to 64 Years | 33 (16.3%) | 7 (4.4%) |
| 65 to 69 Years | 10 (4.9%) | 12 (7.5%) |
| 70 to 74 Years | 8 (3.9%) | 5 (3.1%) |
| 75 to 79 Years | 6 (3.0%) | 4 (2.5%) |
| 80 to 84 Years | 2 (1.0%) | 0 (0.0%) |
| 85 Years and over | 0 (0.0%) | 0 (0.0%) |
| Total | 203 (100.0%) | 159 (100.0%) |
Families and Households in Quenemo
Median Family Size in Quenemo
The median family size in Quenemo is 3.80 persons per family, with single female/mother families (15 | 20.0%) accounting for the largest median family size of 4.87 persons per family. On the other hand, single male/father families (15 | 20.0%) represent the smallest median family size with 3.47 persons per family.
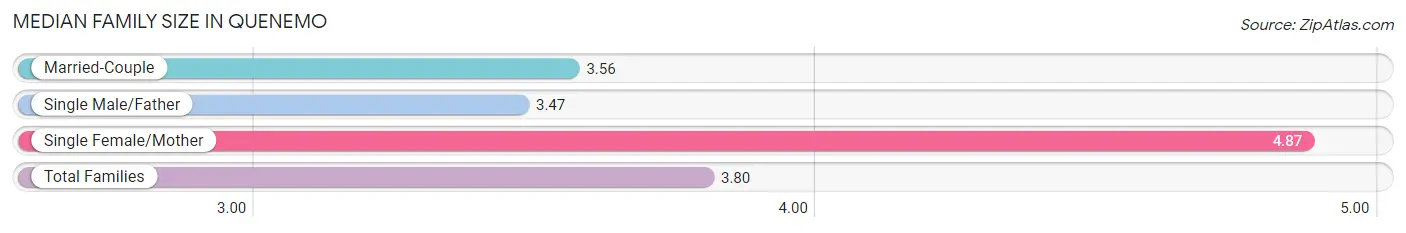
| Family Type | # Families | Family Size |
| Married-Couple | 45 (60.0%) | 3.56 |
| Single Male/Father | 15 (20.0%) | 3.47 |
| Single Female/Mother | 15 (20.0%) | 4.87 |
| Total Families | 75 (100.0%) | 3.80 |
Median Household Size in Quenemo
The median household size in Quenemo is 3.35 persons per household, with single female/mother households (15 | 13.9%) accounting for the largest median household size of 5.67 persons per household. non-family households (33 | 30.6%) represent the smallest median household size with 1.09 persons per household.
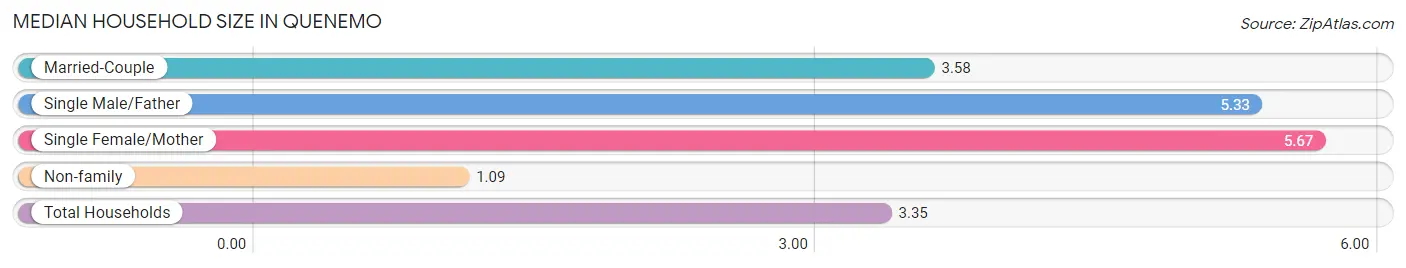
| Household Type | # Households | Household Size |
| Married-Couple | 45 (41.7%) | 3.58 |
| Single Male/Father | 15 (13.9%) | 5.33 |
| Single Female/Mother | 15 (13.9%) | 5.67 |
| Non-family | 33 (30.6%) | 1.09 |
| Total Households | 108 (100.0%) | 3.35 |
Household Size by Marriage Status in Quenemo
Out of a total of 108 households in Quenemo, 75 (69.4%) are family households, while 33 (30.6%) are nonfamily households. The most numerous type of family households are 2-person households, comprising 33, and the most common type of nonfamily households are 1-person households, comprising 31.
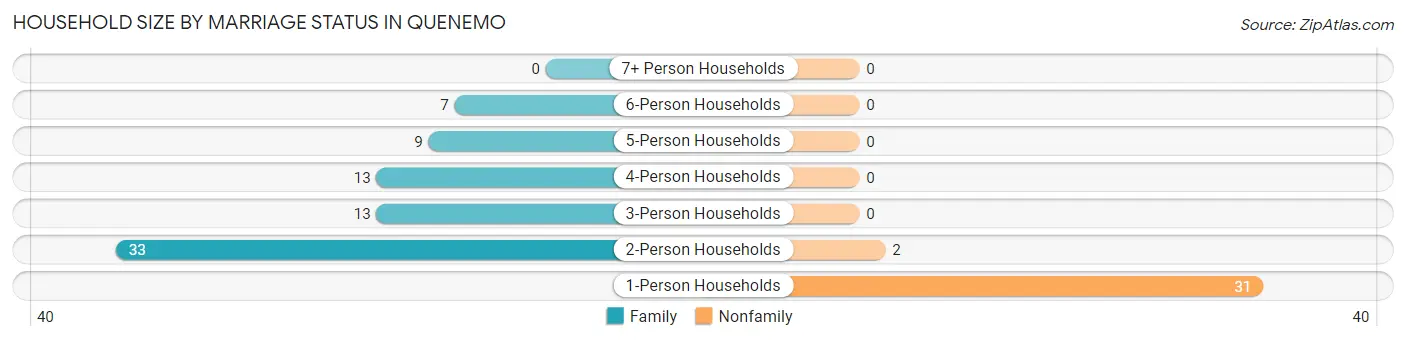
| Household Size | Family Households | Nonfamily Households |
| 1-Person Households | - | 31 (28.7%) |
| 2-Person Households | 33 (30.6%) | 2 (1.8%) |
| 3-Person Households | 13 (12.0%) | 0 (0.0%) |
| 4-Person Households | 13 (12.0%) | 0 (0.0%) |
| 5-Person Households | 9 (8.3%) | 0 (0.0%) |
| 6-Person Households | 7 (6.5%) | 0 (0.0%) |
| 7+ Person Households | 0 (0.0%) | 0 (0.0%) |
| Total | 75 (69.4%) | 33 (30.6%) |
Female Fertility in Quenemo
Fertility by Age in Quenemo
Average fertility rate in Quenemo is 24.0 births per 1,000 women. Women in the age bracket of 20 to 34 years have the highest fertility rate with 59.0 births per 1,000 women. Women in the age bracket of 20 to 34 years acount for 100.0% of all women with births.
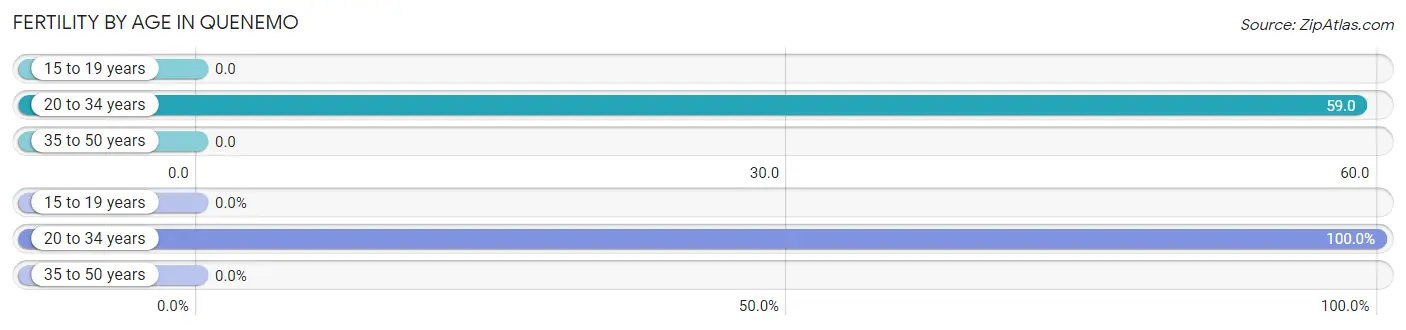
| Age Bracket | Women with Births | Births / 1,000 Women |
| 15 to 19 years | 0 (0.0%) | 0.0 |
| 20 to 34 years | 2 (100.0%) | 59.0 |
| 35 to 50 years | 0 (0.0%) | 0.0 |
| Total | 2 (100.0%) | 24.0 |
Fertility by Age by Marriage Status in Quenemo
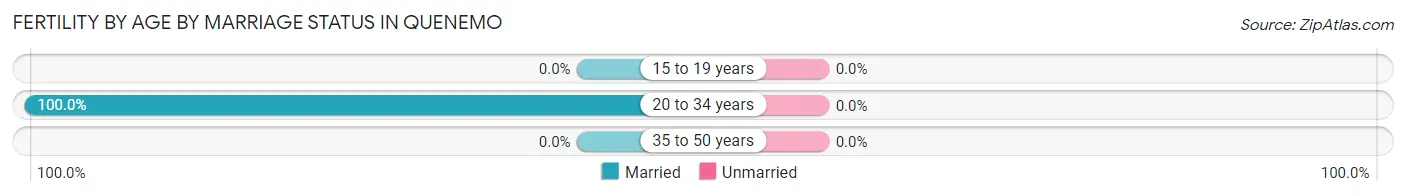
| Age Bracket | Married | Unmarried |
| 15 to 19 years | 0 (0.0%) | 0 (0.0%) |
| 20 to 34 years | 2 (100.0%) | 0 (0.0%) |
| 35 to 50 years | 0 (0.0%) | 0 (0.0%) |
| Total | 2 (100.0%) | 0 (0.0%) |
Fertility by Education in Quenemo
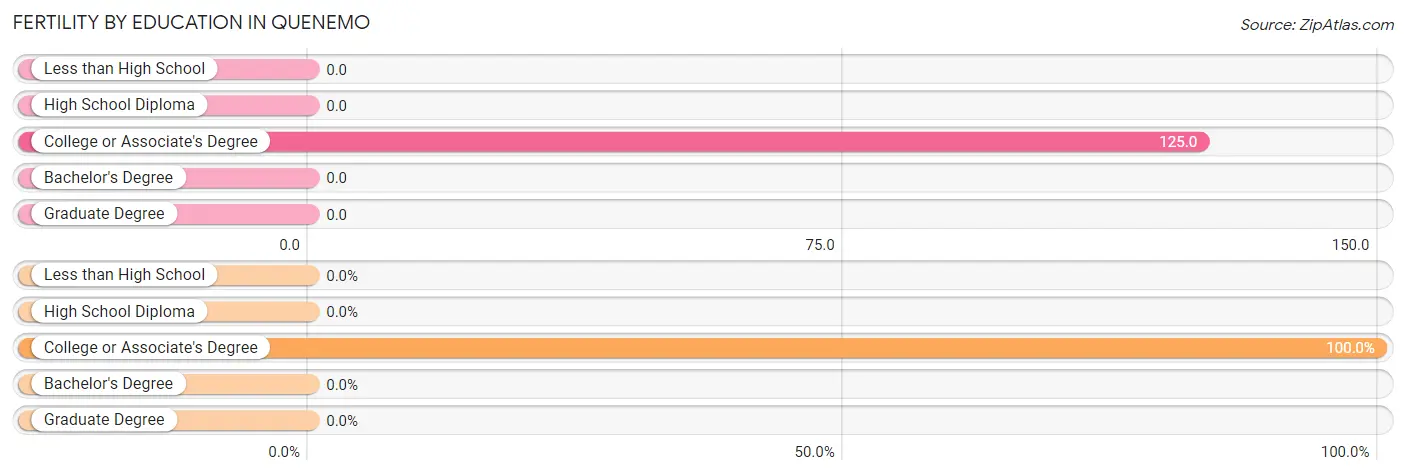
| Educational Attainment | Women with Births | Births / 1,000 Women |
| Less than High School | 0 (0.0%) | 0.0 |
| High School Diploma | 0 (0.0%) | 0.0 |
| College or Associate's Degree | 2 (100.0%) | 125.0 |
| Bachelor's Degree | 0 (0.0%) | 0.0 |
| Graduate Degree | 0 (0.0%) | 0.0 |
| Total | 2 (100.0%) | 24.0 |
Fertility by Education by Marriage Status in Quenemo
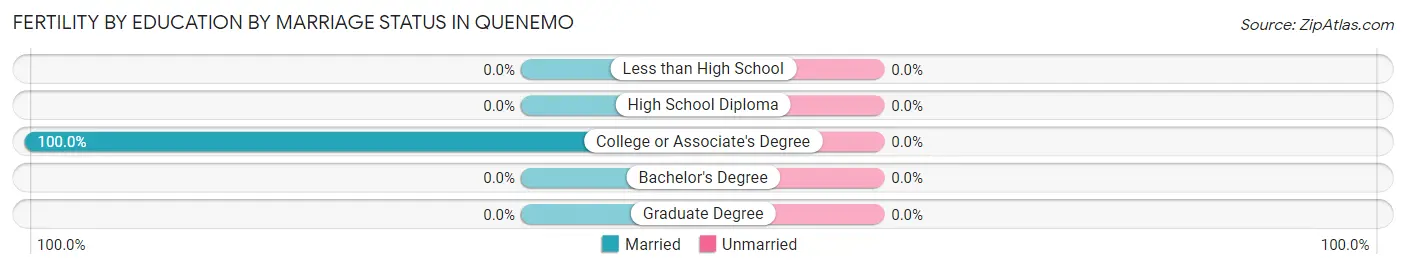
| Educational Attainment | Married | Unmarried |
| Less than High School | 0 (0.0%) | 0 (0.0%) |
| High School Diploma | 0 (0.0%) | 0 (0.0%) |
| College or Associate's Degree | 2 (100.0%) | 0 (0.0%) |
| Bachelor's Degree | 0 (0.0%) | 0 (0.0%) |
| Graduate Degree | 0 (0.0%) | 0 (0.0%) |
| Total | 2 (100.0%) | 0 (0.0%) |
Employment Characteristics in Quenemo
Employment by Class of Employer in Quenemo
Among the 127 employed individuals in Quenemo, private company employees (93 | 73.2%), local government employees (14 | 11.0%), and not-for-profit organizations (11 | 8.7%) make up the most common classes of employment.
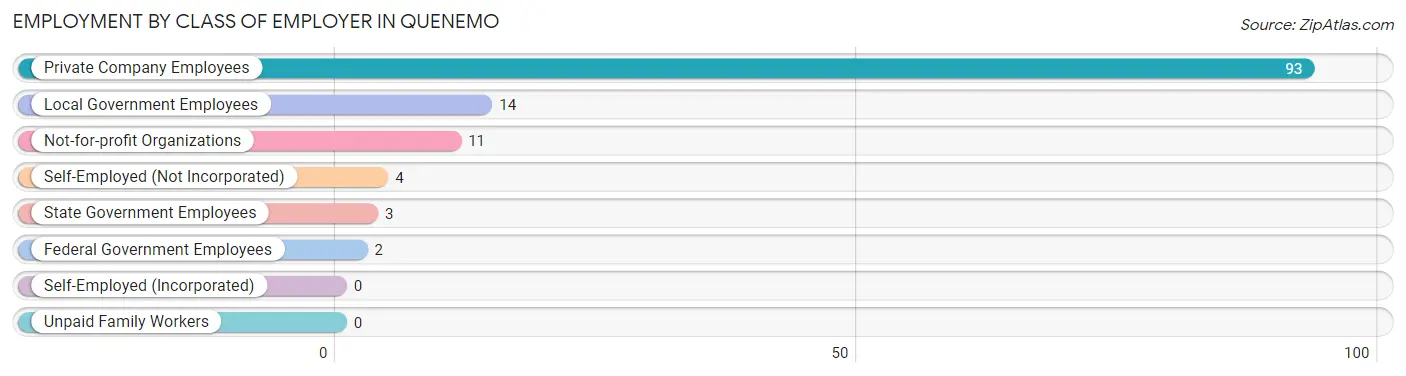
| Employer Class | # Employees | % Employees |
| Private Company Employees | 93 | 73.2% |
| Self-Employed (Incorporated) | 0 | 0.0% |
| Self-Employed (Not Incorporated) | 4 | 3.2% |
| Not-for-profit Organizations | 11 | 8.7% |
| Local Government Employees | 14 | 11.0% |
| State Government Employees | 3 | 2.4% |
| Federal Government Employees | 2 | 1.6% |
| Unpaid Family Workers | 0 | 0.0% |
| Total | 127 | 100.0% |
Employment Status by Age in Quenemo
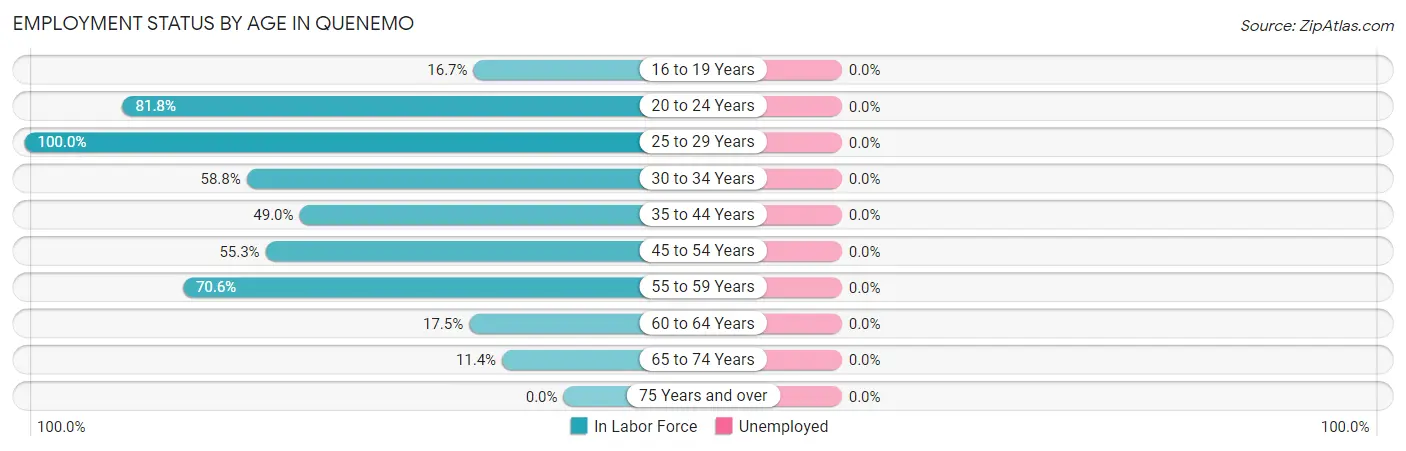
| Age Bracket | In Labor Force | Unemployed |
| 16 to 19 Years | 3 (16.7%) | 0 (0.0%) |
| 20 to 24 Years | 9 (81.8%) | 0 (0.0%) |
| 25 to 29 Years | 32 (100.0%) | 0 (0.0%) |
| 30 to 34 Years | 10 (58.8%) | 0 (0.0%) |
| 35 to 44 Years | 24 (49.0%) | 0 (0.0%) |
| 45 to 54 Years | 26 (55.3%) | 0 (0.0%) |
| 55 to 59 Years | 12 (70.6%) | 0 (0.0%) |
| 60 to 64 Years | 7 (17.5%) | 0 (0.0%) |
| 65 to 74 Years | 4 (11.4%) | 0 (0.0%) |
| 75 Years and over | 0 (0.0%) | 0 (0.0%) |
| Total | 127 (45.7%) | 0 (0.0%) |
Employment Status by Educational Attainment in Quenemo
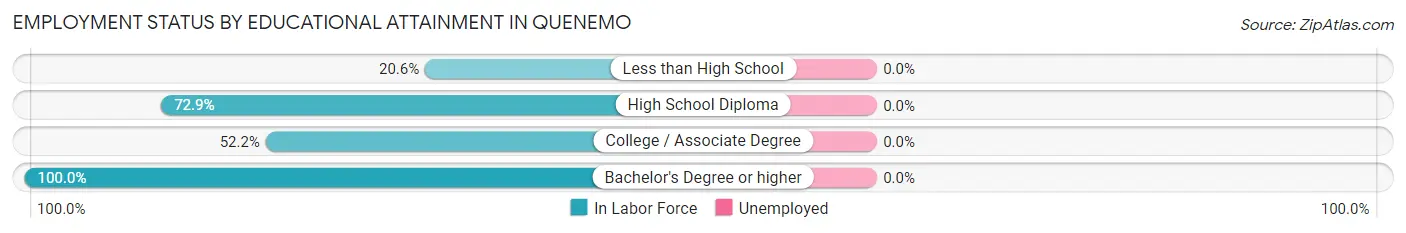
| Educational Attainment | In Labor Force | Unemployed |
| Less than High School | 14 (20.6%) | 0 (0.0%) |
| High School Diploma | 70 (72.9%) | 0 (0.0%) |
| College / Associate Degree | 12 (52.2%) | 0 (0.0%) |
| Bachelor's Degree or higher | 15 (100.0%) | 0 (0.0%) |
| Total | 111 (55.0%) | 0 (0.0%) |
Employment Occupations by Sex in Quenemo
Management, Business, Science and Arts Occupations
The most common Management, Business, Science and Arts occupations in Quenemo are Community & Social Service (5 | 3.9%), Education Instruction & Library (4 | 3.2%), Management (3 | 2.4%), Business & Financial (2 | 1.6%), and Legal Services & Support (1 | 0.8%).
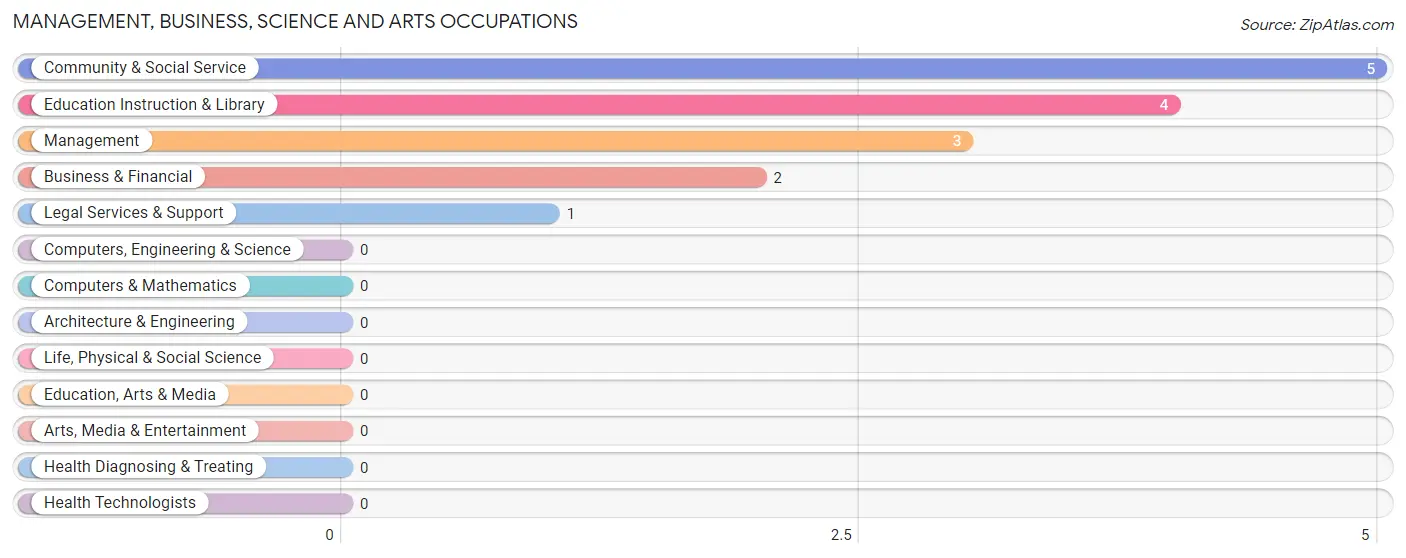
Management, Business, Science and Arts Occupations by Sex
Within the Management, Business, Science and Arts occupations in Quenemo, the most male-oriented occupations are Business & Financial (100.0%), and Management (33.3%), while the most female-oriented occupations are Community & Social Service (100.0%), Legal Services & Support (100.0%), and Education Instruction & Library (100.0%).
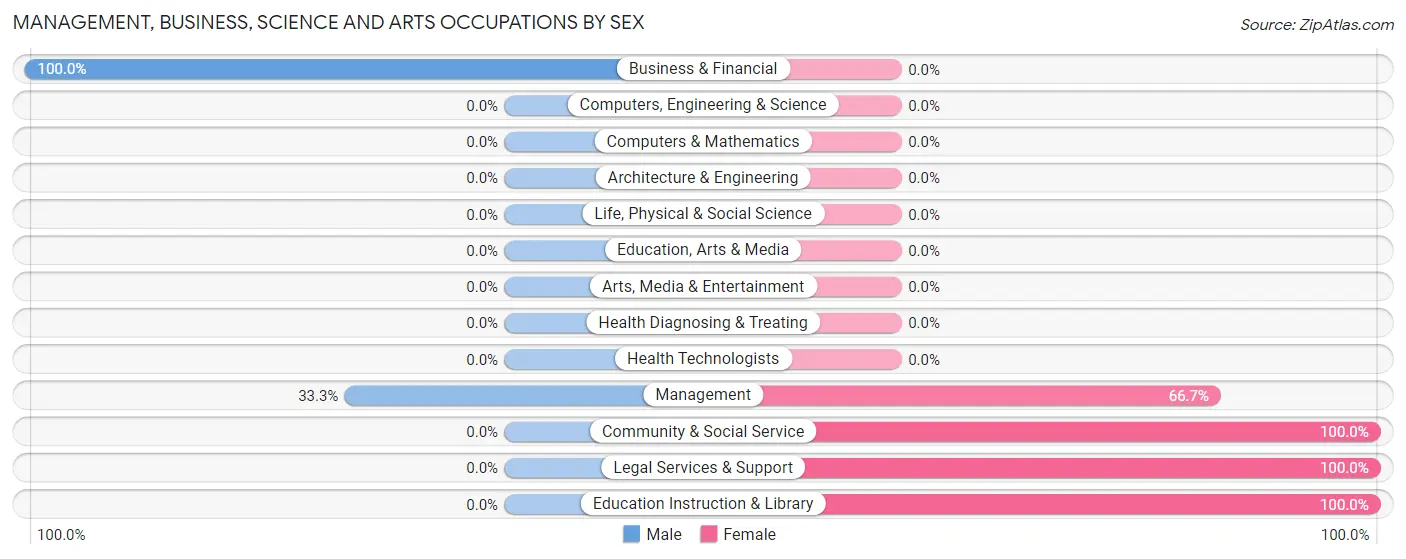
| Occupation | Male | Female |
| Management | 1 (33.3%) | 2 (66.7%) |
| Business & Financial | 2 (100.0%) | 0 (0.0%) |
| Computers, Engineering & Science | 0 (0.0%) | 0 (0.0%) |
| Computers & Mathematics | 0 (0.0%) | 0 (0.0%) |
| Architecture & Engineering | 0 (0.0%) | 0 (0.0%) |
| Life, Physical & Social Science | 0 (0.0%) | 0 (0.0%) |
| Community & Social Service | 0 (0.0%) | 5 (100.0%) |
| Education, Arts & Media | 0 (0.0%) | 0 (0.0%) |
| Legal Services & Support | 0 (0.0%) | 1 (100.0%) |
| Education Instruction & Library | 0 (0.0%) | 4 (100.0%) |
| Arts, Media & Entertainment | 0 (0.0%) | 0 (0.0%) |
| Health Diagnosing & Treating | 0 (0.0%) | 0 (0.0%) |
| Health Technologists | 0 (0.0%) | 0 (0.0%) |
| Total (Category) | 3 (30.0%) | 7 (70.0%) |
| Total (Overall) | 72 (56.7%) | 55 (43.3%) |
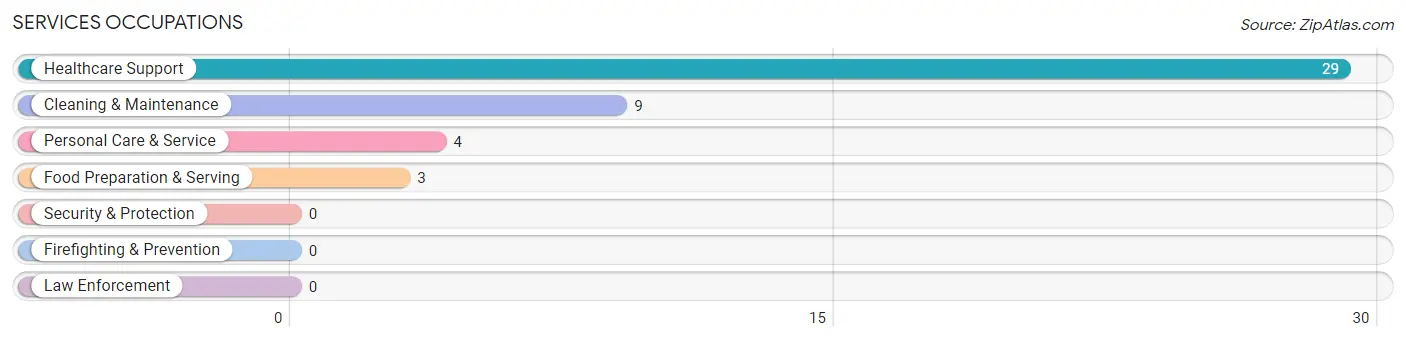
Services Occupations
The most common Services occupations in Quenemo are Healthcare Support (29 | 22.8%), Cleaning & Maintenance (9 | 7.1%), Personal Care & Service (4 | 3.2%), and Food Preparation & Serving (3 | 2.4%).
Services Occupations by Sex
Within the Services occupations in Quenemo, the most male-oriented occupations are Food Preparation & Serving (66.7%), Cleaning & Maintenance (55.6%), and Healthcare Support (13.8%), while the most female-oriented occupations are Personal Care & Service (100.0%), Healthcare Support (86.2%), and Cleaning & Maintenance (44.4%).
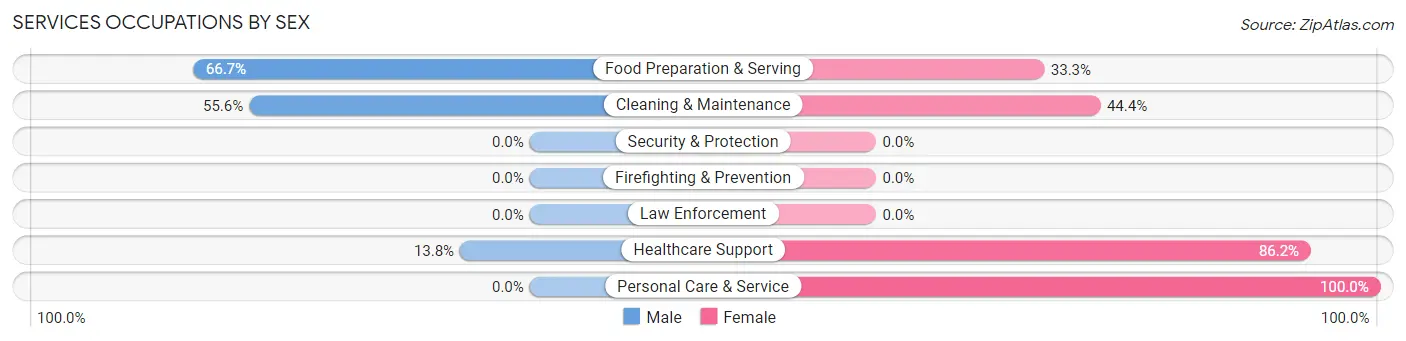
| Occupation | Male | Female |
| Healthcare Support | 4 (13.8%) | 25 (86.2%) |
| Security & Protection | 0 (0.0%) | 0 (0.0%) |
| Firefighting & Prevention | 0 (0.0%) | 0 (0.0%) |
| Law Enforcement | 0 (0.0%) | 0 (0.0%) |
| Food Preparation & Serving | 2 (66.7%) | 1 (33.3%) |
| Cleaning & Maintenance | 5 (55.6%) | 4 (44.4%) |
| Personal Care & Service | 0 (0.0%) | 4 (100.0%) |
| Total (Category) | 11 (24.4%) | 34 (75.6%) |
| Total (Overall) | 72 (56.7%) | 55 (43.3%) |
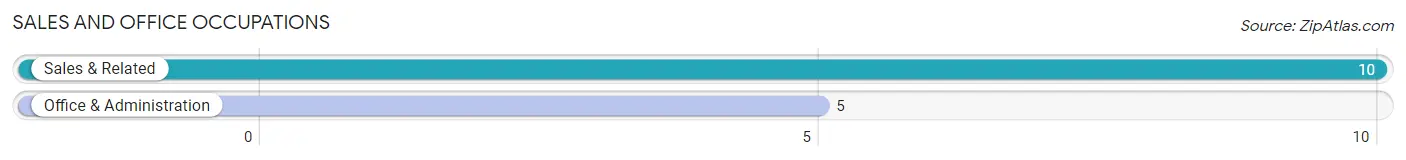
Sales and Office Occupations
The most common Sales and Office occupations in Quenemo are Sales & Related (10 | 7.9%), and Office & Administration (5 | 3.9%).
Sales and Office Occupations by Sex
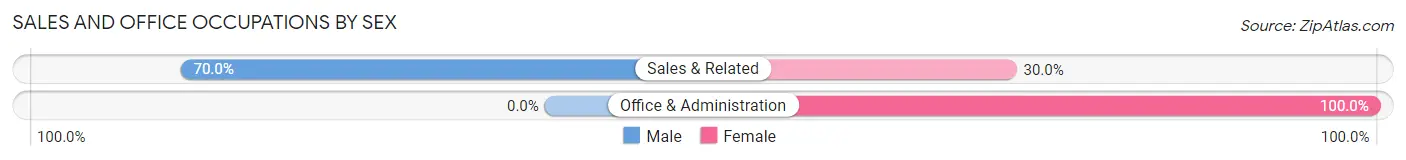
| Occupation | Male | Female |
| Sales & Related | 7 (70.0%) | 3 (30.0%) |
| Office & Administration | 0 (0.0%) | 5 (100.0%) |
| Total (Category) | 7 (46.7%) | 8 (53.3%) |
| Total (Overall) | 72 (56.7%) | 55 (43.3%) |
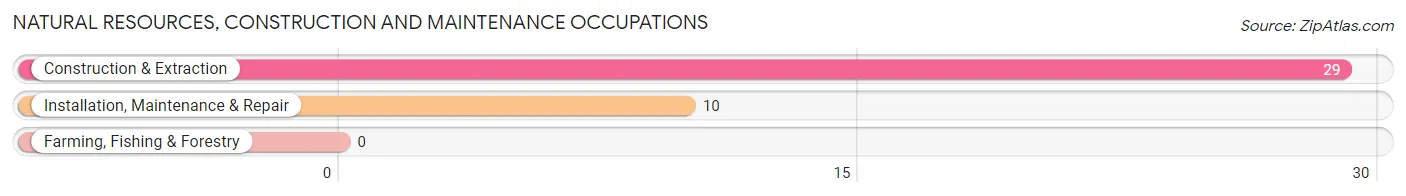
Natural Resources, Construction and Maintenance Occupations
The most common Natural Resources, Construction and Maintenance occupations in Quenemo are Construction & Extraction (29 | 22.8%), and Installation, Maintenance & Repair (10 | 7.9%).
Natural Resources, Construction and Maintenance Occupations by Sex
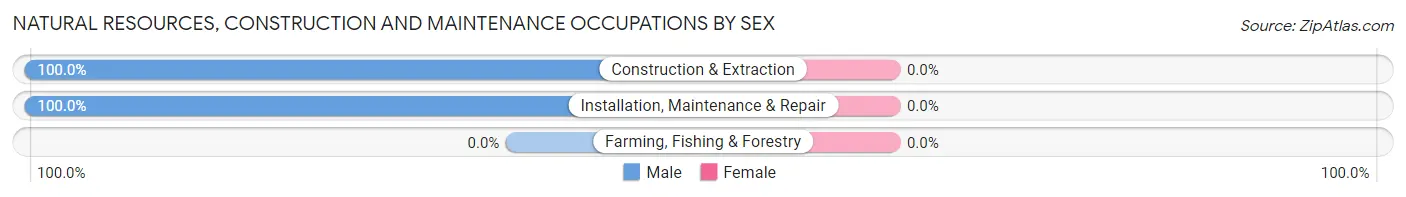
| Occupation | Male | Female |
| Farming, Fishing & Forestry | 0 (0.0%) | 0 (0.0%) |
| Construction & Extraction | 29 (100.0%) | 0 (0.0%) |
| Installation, Maintenance & Repair | 10 (100.0%) | 0 (0.0%) |
| Total (Category) | 39 (100.0%) | 0 (0.0%) |
| Total (Overall) | 72 (56.7%) | 55 (43.3%) |
Production, Transportation and Moving Occupations
The most common Production, Transportation and Moving occupations in Quenemo are Production (8 | 6.3%), Material Moving (7 | 5.5%), and Transportation (3 | 2.4%).
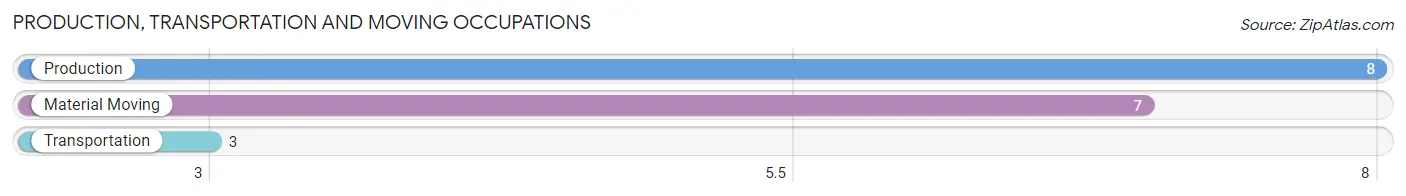
Production, Transportation and Moving Occupations by Sex
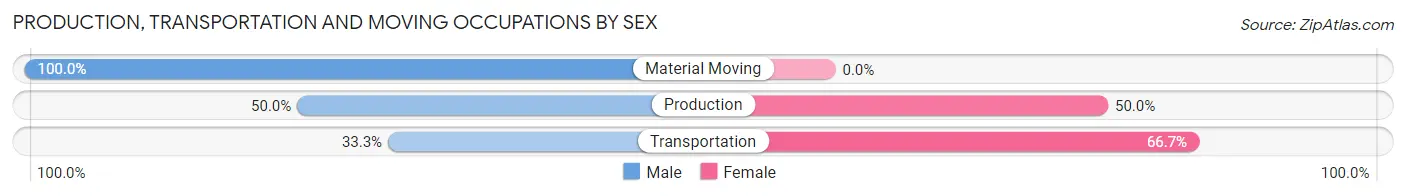
| Occupation | Male | Female |
| Production | 4 (50.0%) | 4 (50.0%) |
| Transportation | 1 (33.3%) | 2 (66.7%) |
| Material Moving | 7 (100.0%) | 0 (0.0%) |
| Total (Category) | 12 (66.7%) | 6 (33.3%) |
| Total (Overall) | 72 (56.7%) | 55 (43.3%) |
Employment Industries by Sex in Quenemo
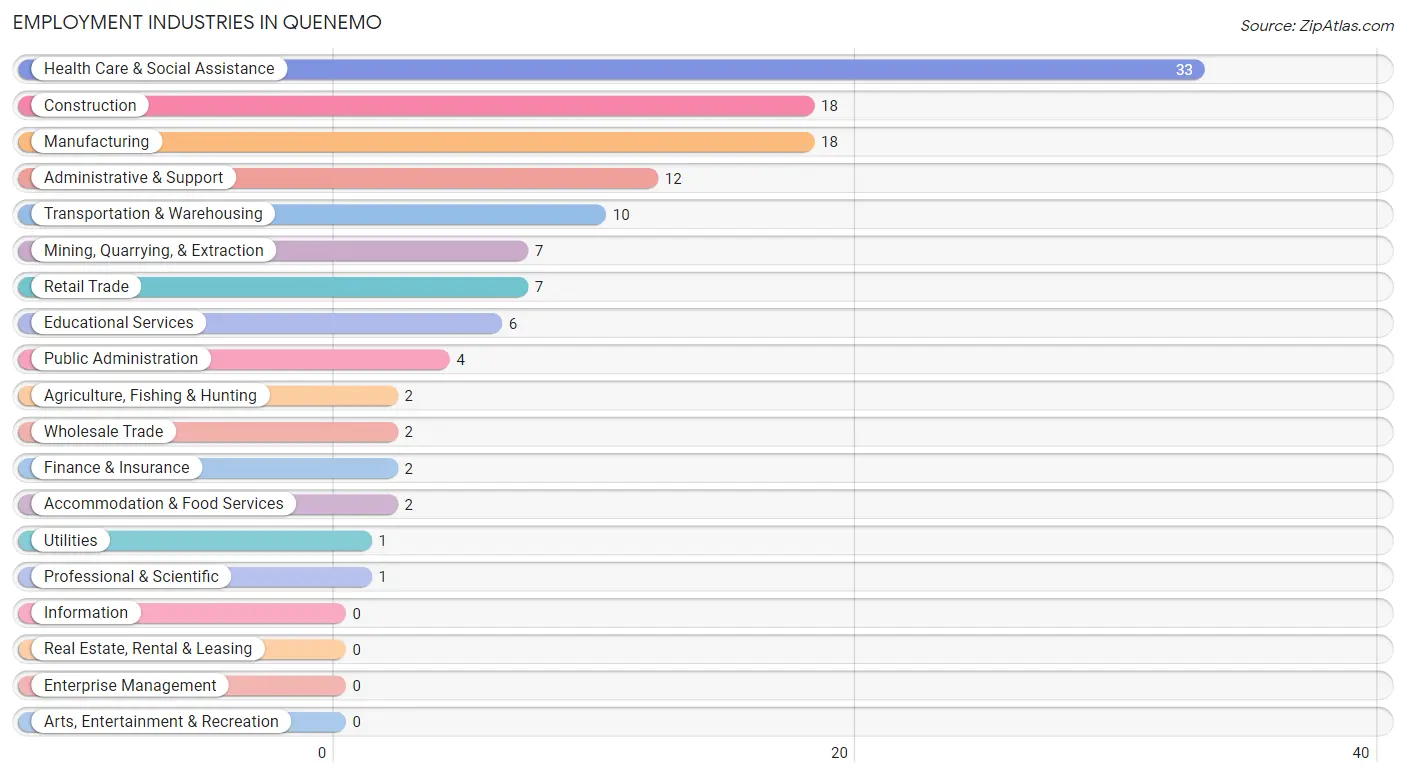
Employment Industries in Quenemo
The major employment industries in Quenemo include Health Care & Social Assistance (33 | 26.0%), Construction (18 | 14.2%), Manufacturing (18 | 14.2%), Administrative & Support (12 | 9.5%), and Transportation & Warehousing (10 | 7.9%).
Employment Industries by Sex in Quenemo
The Quenemo industries that see more men than women are Agriculture, Fishing & Hunting (100.0%), Mining, Quarrying, & Extraction (100.0%), and Construction (100.0%), whereas the industries that tend to have a higher number of women are Finance & Insurance (100.0%), Professional & Scientific (100.0%), and Educational Services (100.0%).
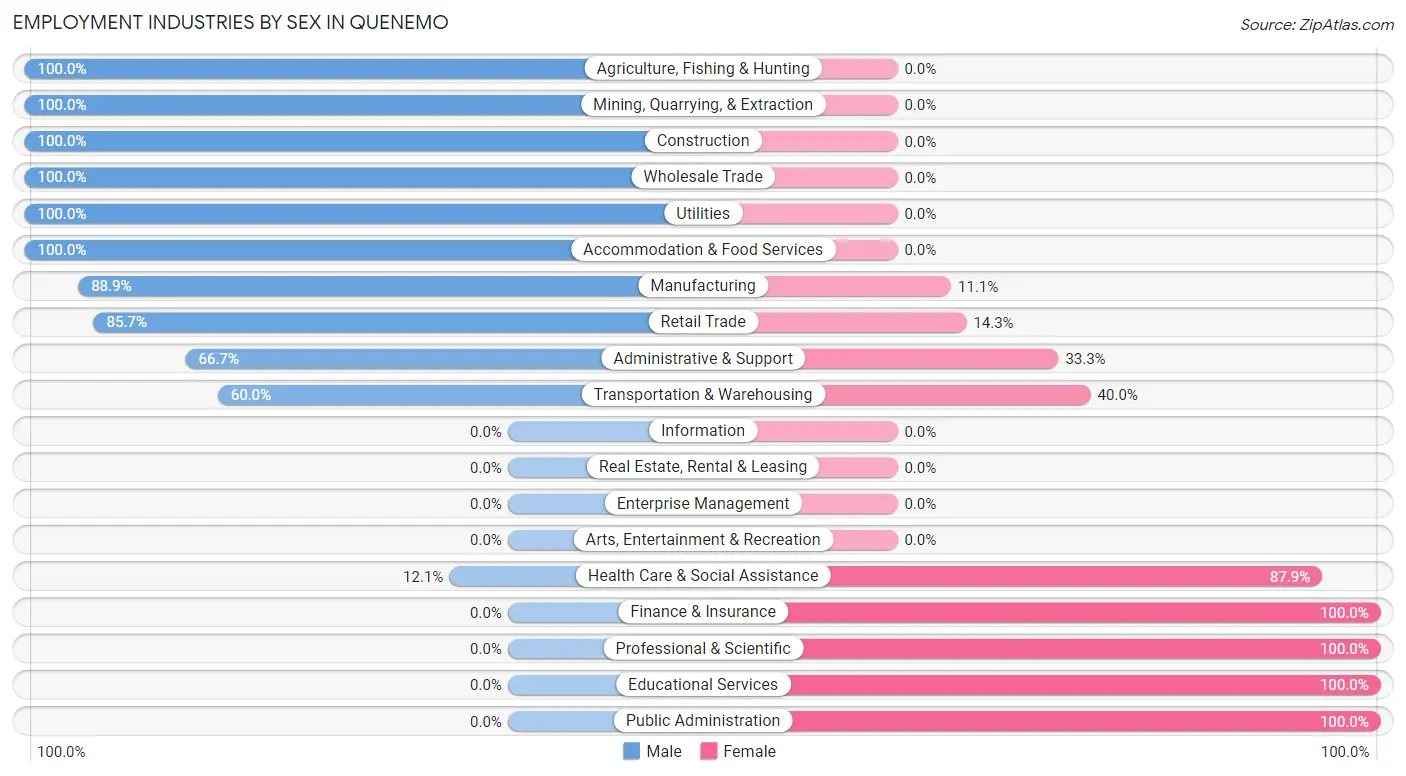
| Industry | Male | Female |
| Agriculture, Fishing & Hunting | 2 (100.0%) | 0 (0.0%) |
| Mining, Quarrying, & Extraction | 7 (100.0%) | 0 (0.0%) |
| Construction | 18 (100.0%) | 0 (0.0%) |
| Manufacturing | 16 (88.9%) | 2 (11.1%) |
| Wholesale Trade | 2 (100.0%) | 0 (0.0%) |
| Retail Trade | 6 (85.7%) | 1 (14.3%) |
| Transportation & Warehousing | 6 (60.0%) | 4 (40.0%) |
| Utilities | 1 (100.0%) | 0 (0.0%) |
| Information | 0 (0.0%) | 0 (0.0%) |
| Finance & Insurance | 0 (0.0%) | 2 (100.0%) |
| Real Estate, Rental & Leasing | 0 (0.0%) | 0 (0.0%) |
| Professional & Scientific | 0 (0.0%) | 1 (100.0%) |
| Enterprise Management | 0 (0.0%) | 0 (0.0%) |
| Administrative & Support | 8 (66.7%) | 4 (33.3%) |
| Educational Services | 0 (0.0%) | 6 (100.0%) |
| Health Care & Social Assistance | 4 (12.1%) | 29 (87.9%) |
| Arts, Entertainment & Recreation | 0 (0.0%) | 0 (0.0%) |
| Accommodation & Food Services | 2 (100.0%) | 0 (0.0%) |
| Public Administration | 0 (0.0%) | 4 (100.0%) |
| Total | 72 (56.7%) | 55 (43.3%) |
Education in Quenemo
School Enrollment in Quenemo
The most common levels of schooling among the 97 students in Quenemo are middle school (32 | 33.0%), high school (30 | 30.9%), and kindergarten (13 | 13.4%).
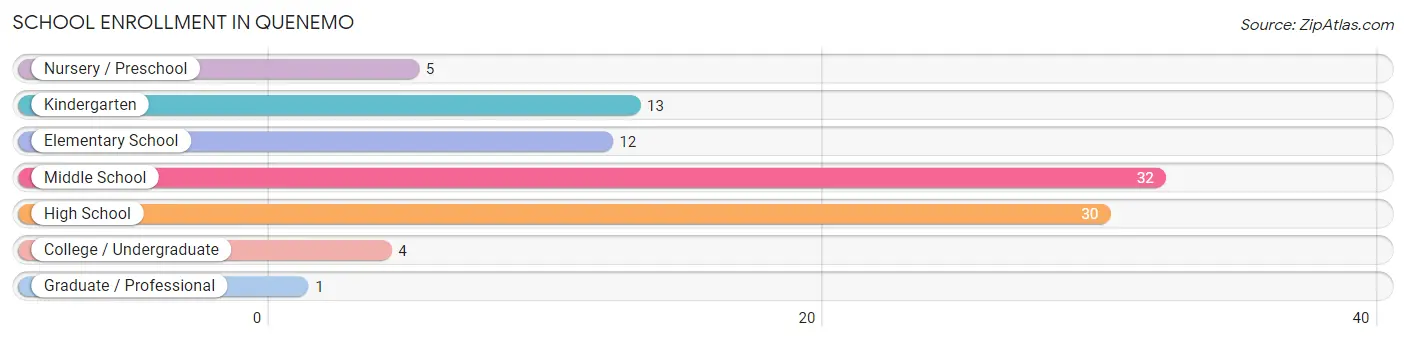
| School Level | # Students | % Students |
| Nursery / Preschool | 5 | 5.1% |
| Kindergarten | 13 | 13.4% |
| Elementary School | 12 | 12.4% |
| Middle School | 32 | 33.0% |
| High School | 30 | 30.9% |
| College / Undergraduate | 4 | 4.1% |
| Graduate / Professional | 1 | 1.0% |
| Total | 97 | 100.0% |
School Enrollment by Age by Funding Source in Quenemo
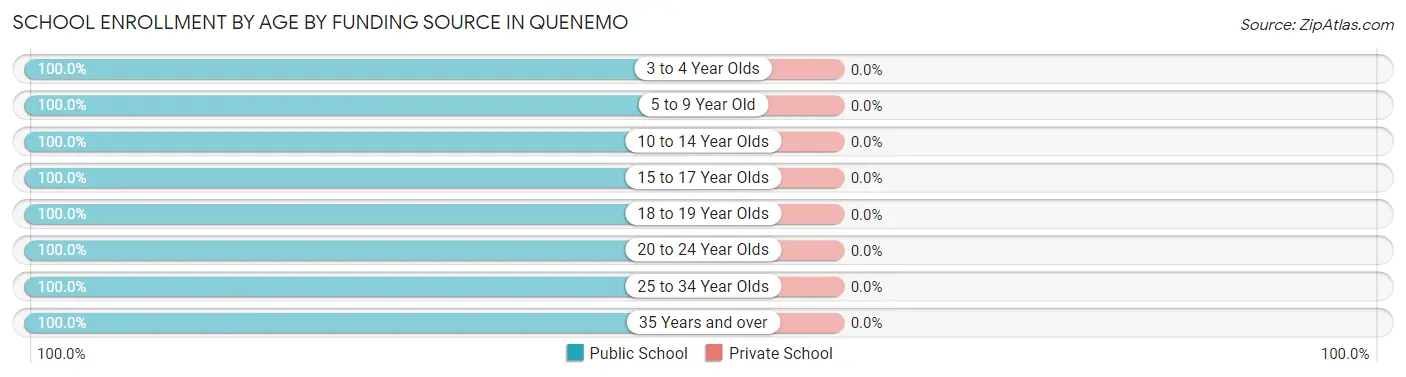
| Age Bracket | Public School | Private School |
| 3 to 4 Year Olds | 5 (100.0%) | 0 (0.0%) |
| 5 to 9 Year Old | 25 (100.0%) | 0 (0.0%) |
| 10 to 14 Year Olds | 39 (100.0%) | 0 (0.0%) |
| 15 to 17 Year Olds | 18 (100.0%) | 0 (0.0%) |
| 18 to 19 Year Olds | 3 (100.0%) | 0 (0.0%) |
| 20 to 24 Year Olds | 4 (100.0%) | 0 (0.0%) |
| 25 to 34 Year Olds | 1 (100.0%) | 0 (0.0%) |
| 35 Years and over | 2 (100.0%) | 0 (0.0%) |
| Total | 97 (100.0%) | 0 (0.0%) |
Educational Attainment by Field of Study in Quenemo
Arts & humanities (10 | 45.5%), science & technology (6 | 27.3%), business (3 | 13.6%), psychology (1 | 4.5%), and social sciences (1 | 4.5%) are the most common fields of study among 22 individuals in Quenemo who have obtained a bachelor's degree or higher.
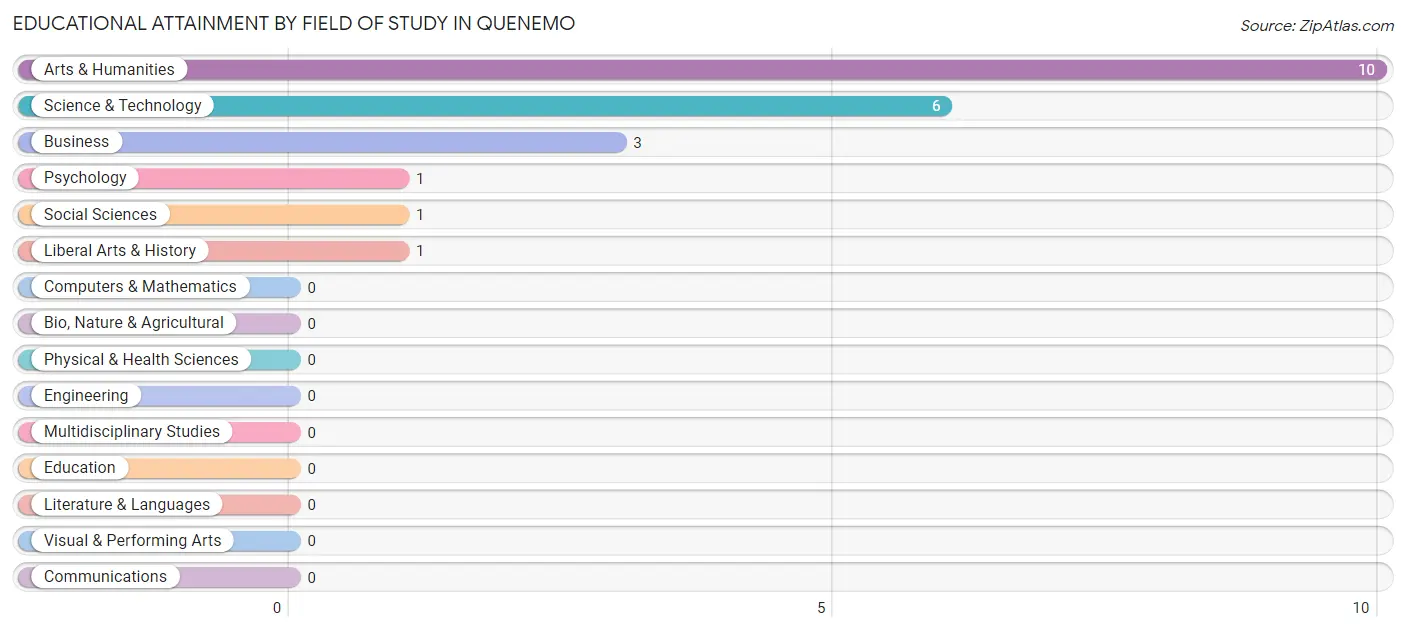
| Field of Study | # Graduates | % Graduates |
| Computers & Mathematics | 0 | 0.0% |
| Bio, Nature & Agricultural | 0 | 0.0% |
| Physical & Health Sciences | 0 | 0.0% |
| Psychology | 1 | 4.5% |
| Social Sciences | 1 | 4.5% |
| Engineering | 0 | 0.0% |
| Multidisciplinary Studies | 0 | 0.0% |
| Science & Technology | 6 | 27.3% |
| Business | 3 | 13.6% |
| Education | 0 | 0.0% |
| Literature & Languages | 0 | 0.0% |
| Liberal Arts & History | 1 | 4.5% |
| Visual & Performing Arts | 0 | 0.0% |
| Communications | 0 | 0.0% |
| Arts & Humanities | 10 | 45.5% |
| Total | 22 | 100.0% |
Transportation & Commute in Quenemo
Vehicle Availability by Sex in Quenemo
The most prevalent vehicle ownership categories in Quenemo are males with 2 vehicles (26, accounting for 36.1%) and females with 2 vehicles (16, making up 47.3%).
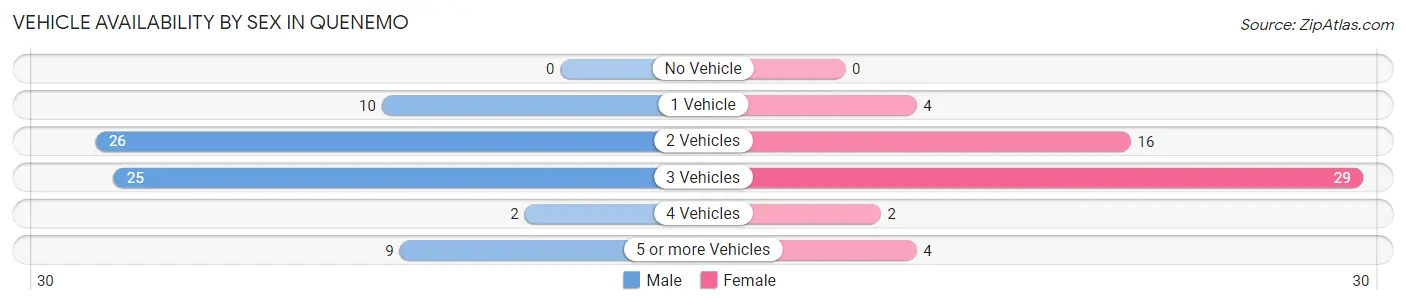
| Vehicles Available | Male | Female |
| No Vehicle | 0 (0.0%) | 0 (0.0%) |
| 1 Vehicle | 10 (13.9%) | 4 (7.3%) |
| 2 Vehicles | 26 (36.1%) | 16 (29.1%) |
| 3 Vehicles | 25 (34.7%) | 29 (52.7%) |
| 4 Vehicles | 2 (2.8%) | 2 (3.6%) |
| 5 or more Vehicles | 9 (12.5%) | 4 (7.3%) |
| Total | 72 (100.0%) | 55 (100.0%) |
Commute Time in Quenemo
The most frequently occuring commute durations in Quenemo are 15 to 19 minutes (24 commuters, 19.1%), 60 to 89 minutes (17 commuters, 13.5%), and 25 to 29 minutes (15 commuters, 11.9%).
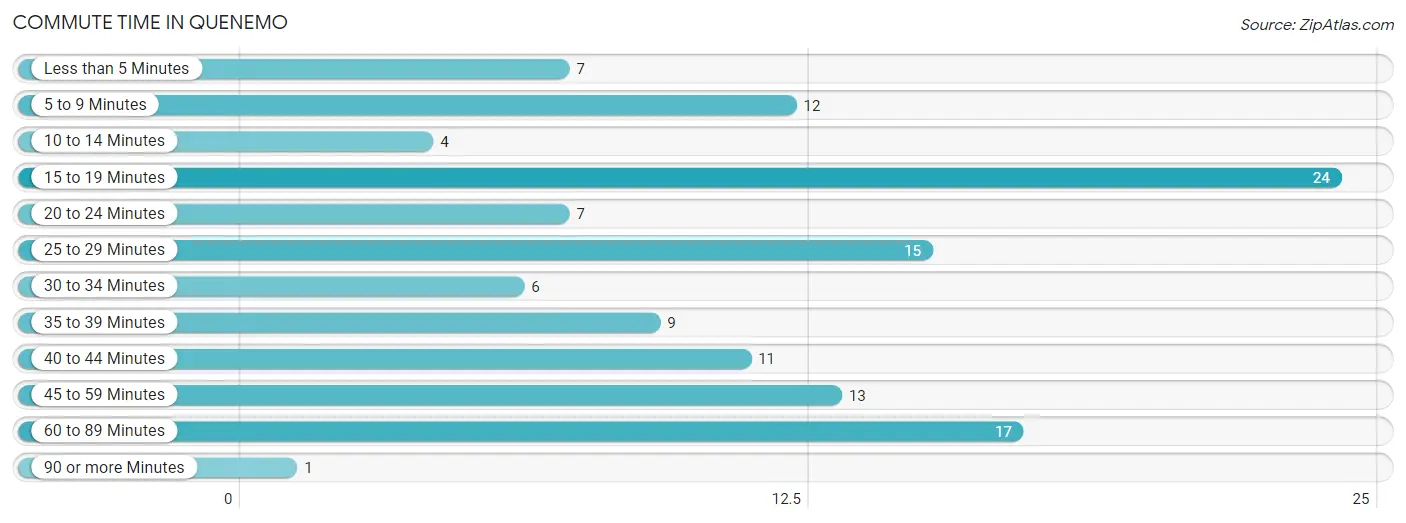
| Commute Time | # Commuters | % Commuters |
| Less than 5 Minutes | 7 | 5.6% |
| 5 to 9 Minutes | 12 | 9.5% |
| 10 to 14 Minutes | 4 | 3.2% |
| 15 to 19 Minutes | 24 | 19.1% |
| 20 to 24 Minutes | 7 | 5.6% |
| 25 to 29 Minutes | 15 | 11.9% |
| 30 to 34 Minutes | 6 | 4.8% |
| 35 to 39 Minutes | 9 | 7.1% |
| 40 to 44 Minutes | 11 | 8.7% |
| 45 to 59 Minutes | 13 | 10.3% |
| 60 to 89 Minutes | 17 | 13.5% |
| 90 or more Minutes | 1 | 0.8% |
Commute Time by Sex in Quenemo
The most common commute times in Quenemo are 25 to 29 minutes (13 commuters, 18.3%) for males and 15 to 19 minutes (20 commuters, 36.4%) for females.
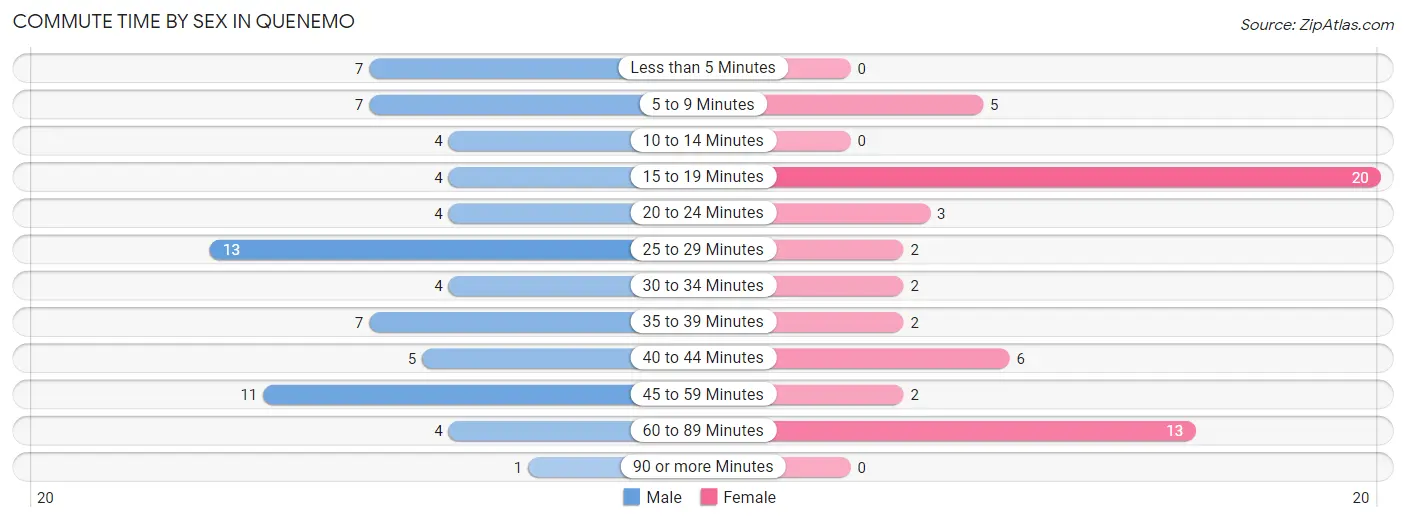
| Commute Time | Male | Female |
| Less than 5 Minutes | 7 (9.9%) | 0 (0.0%) |
| 5 to 9 Minutes | 7 (9.9%) | 5 (9.1%) |
| 10 to 14 Minutes | 4 (5.6%) | 0 (0.0%) |
| 15 to 19 Minutes | 4 (5.6%) | 20 (36.4%) |
| 20 to 24 Minutes | 4 (5.6%) | 3 (5.4%) |
| 25 to 29 Minutes | 13 (18.3%) | 2 (3.6%) |
| 30 to 34 Minutes | 4 (5.6%) | 2 (3.6%) |
| 35 to 39 Minutes | 7 (9.9%) | 2 (3.6%) |
| 40 to 44 Minutes | 5 (7.0%) | 6 (10.9%) |
| 45 to 59 Minutes | 11 (15.5%) | 2 (3.6%) |
| 60 to 89 Minutes | 4 (5.6%) | 13 (23.6%) |
| 90 or more Minutes | 1 (1.4%) | 0 (0.0%) |
Time of Departure to Work by Sex in Quenemo
The most frequent times of departure to work in Quenemo are 6:00 AM to 6:29 AM (15, 21.1%) for males and 6:00 AM to 6:29 AM (24, 43.6%) for females.
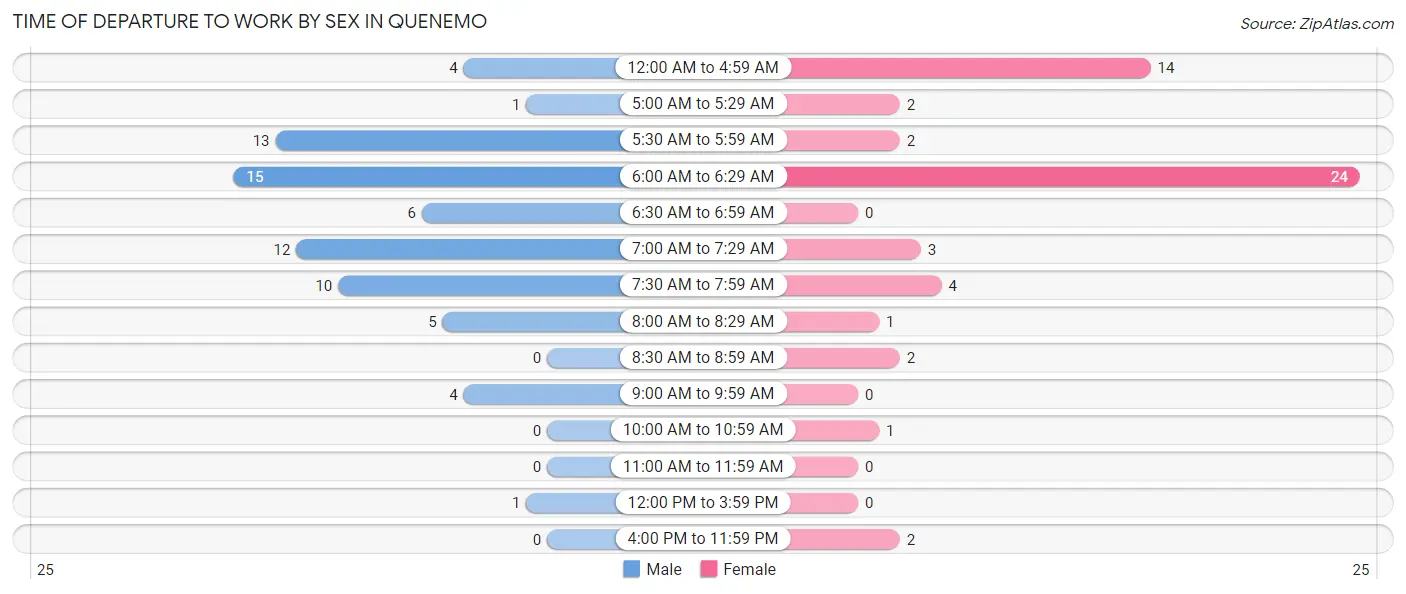
| Time of Departure | Male | Female |
| 12:00 AM to 4:59 AM | 4 (5.6%) | 14 (25.5%) |
| 5:00 AM to 5:29 AM | 1 (1.4%) | 2 (3.6%) |
| 5:30 AM to 5:59 AM | 13 (18.3%) | 2 (3.6%) |
| 6:00 AM to 6:29 AM | 15 (21.1%) | 24 (43.6%) |
| 6:30 AM to 6:59 AM | 6 (8.5%) | 0 (0.0%) |
| 7:00 AM to 7:29 AM | 12 (16.9%) | 3 (5.4%) |
| 7:30 AM to 7:59 AM | 10 (14.1%) | 4 (7.3%) |
| 8:00 AM to 8:29 AM | 5 (7.0%) | 1 (1.8%) |
| 8:30 AM to 8:59 AM | 0 (0.0%) | 2 (3.6%) |
| 9:00 AM to 9:59 AM | 4 (5.6%) | 0 (0.0%) |
| 10:00 AM to 10:59 AM | 0 (0.0%) | 1 (1.8%) |
| 11:00 AM to 11:59 AM | 0 (0.0%) | 0 (0.0%) |
| 12:00 PM to 3:59 PM | 1 (1.4%) | 0 (0.0%) |
| 4:00 PM to 11:59 PM | 0 (0.0%) | 2 (3.6%) |
| Total | 71 (100.0%) | 55 (100.0%) |
Housing Occupancy in Quenemo
Occupancy by Ownership in Quenemo
Of the total 108 dwellings in Quenemo, owner-occupied units account for 80 (74.1%), while renter-occupied units make up 28 (25.9%).
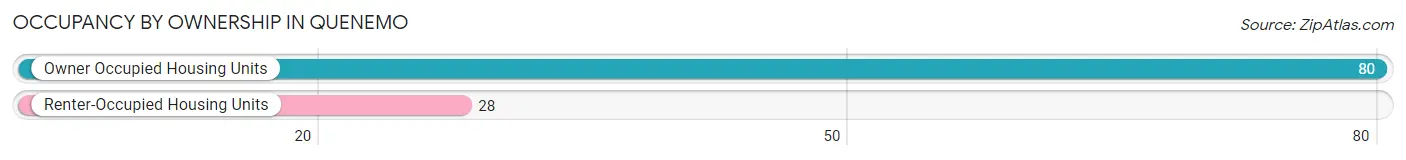
| Occupancy | # Housing Units | % Housing Units |
| Owner Occupied Housing Units | 80 | 74.1% |
| Renter-Occupied Housing Units | 28 | 25.9% |
| Total Occupied Housing Units | 108 | 100.0% |
Occupancy by Household Size in Quenemo
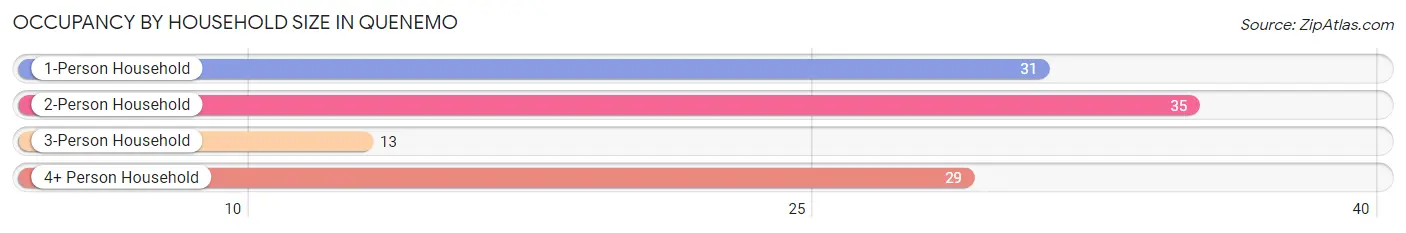
| Household Size | # Housing Units | % Housing Units |
| 1-Person Household | 31 | 28.7% |
| 2-Person Household | 35 | 32.4% |
| 3-Person Household | 13 | 12.0% |
| 4+ Person Household | 29 | 26.9% |
| Total Housing Units | 108 | 100.0% |
Occupancy by Ownership by Household Size in Quenemo
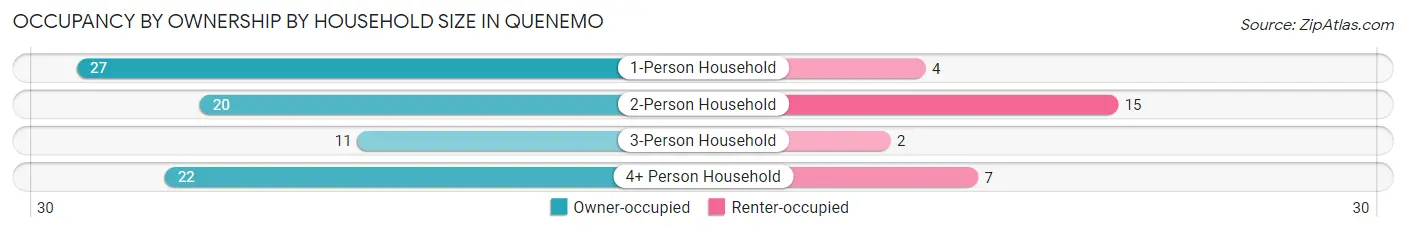
| Household Size | Owner-occupied | Renter-occupied |
| 1-Person Household | 27 (87.1%) | 4 (12.9%) |
| 2-Person Household | 20 (57.1%) | 15 (42.9%) |
| 3-Person Household | 11 (84.6%) | 2 (15.4%) |
| 4+ Person Household | 22 (75.9%) | 7 (24.1%) |
| Total Housing Units | 80 (74.1%) | 28 (25.9%) |
Occupancy by Educational Attainment in Quenemo
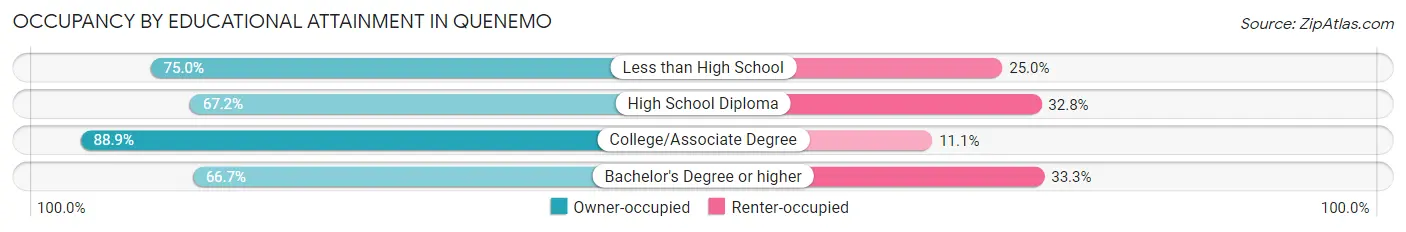
| Household Size | Owner-occupied | Renter-occupied |
| Less than High School | 15 (75.0%) | 5 (25.0%) |
| High School Diploma | 39 (67.2%) | 19 (32.8%) |
| College/Associate Degree | 24 (88.9%) | 3 (11.1%) |
| Bachelor's Degree or higher | 2 (66.7%) | 1 (33.3%) |
Occupancy by Age of Householder in Quenemo
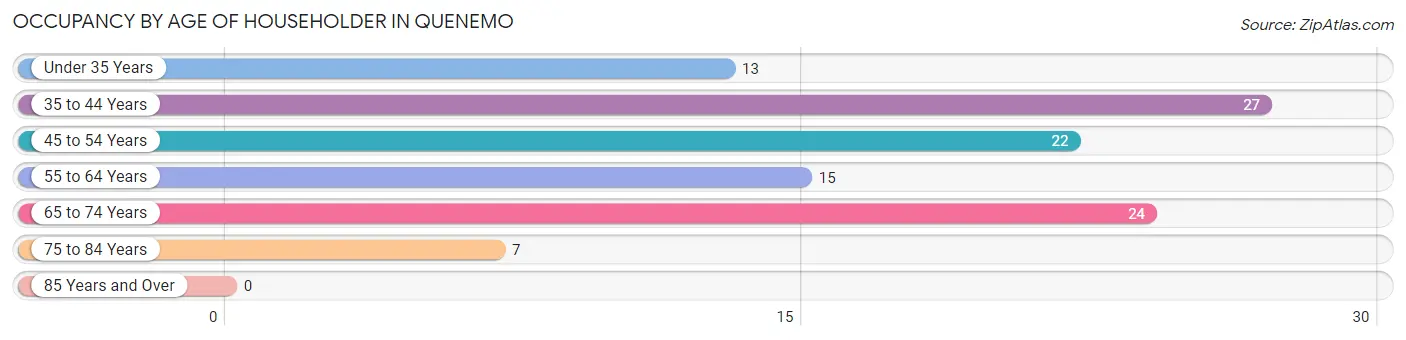
| Age Bracket | # Households | % Households |
| Under 35 Years | 13 | 12.0% |
| 35 to 44 Years | 27 | 25.0% |
| 45 to 54 Years | 22 | 20.4% |
| 55 to 64 Years | 15 | 13.9% |
| 65 to 74 Years | 24 | 22.2% |
| 75 to 84 Years | 7 | 6.5% |
| 85 Years and Over | 0 | 0.0% |
| Total | 108 | 100.0% |
Housing Finances in Quenemo
Median Income by Occupancy in Quenemo
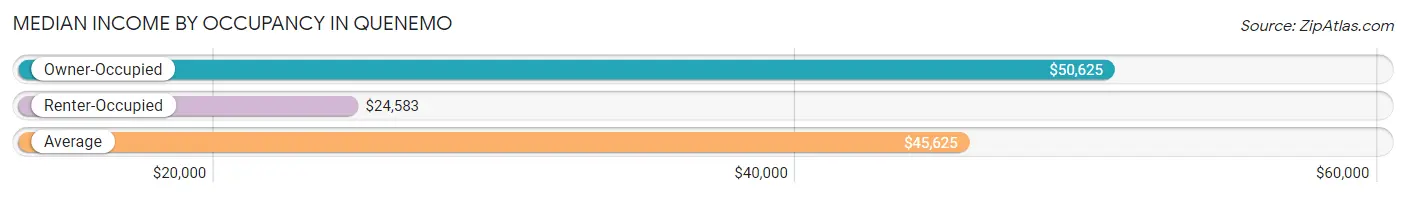
| Occupancy Type | # Households | Median Income |
| Owner-Occupied | 80 (74.1%) | $50,625 |
| Renter-Occupied | 28 (25.9%) | $24,583 |
| Average | 108 (100.0%) | $45,625 |
Occupancy by Householder Income Bracket in Quenemo
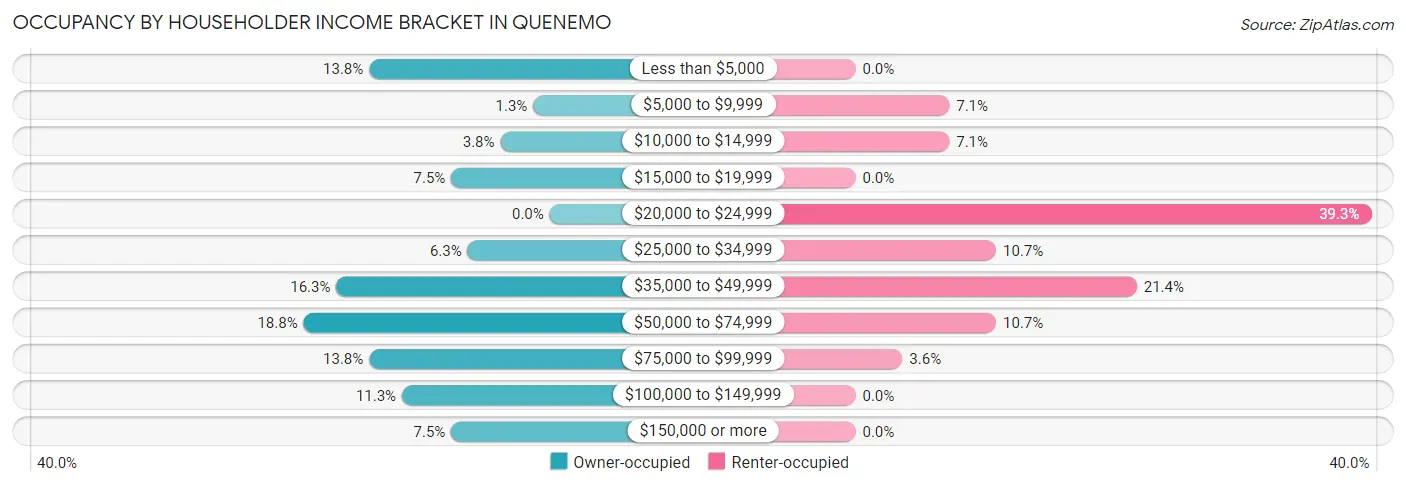
| Income Bracket | Owner-occupied | Renter-occupied |
| Less than $5,000 | 11 (13.8%) | 0 (0.0%) |
| $5,000 to $9,999 | 1 (1.3%) | 2 (7.1%) |
| $10,000 to $14,999 | 3 (3.7%) | 2 (7.1%) |
| $15,000 to $19,999 | 6 (7.5%) | 0 (0.0%) |
| $20,000 to $24,999 | 0 (0.0%) | 11 (39.3%) |
| $25,000 to $34,999 | 5 (6.2%) | 3 (10.7%) |
| $35,000 to $49,999 | 13 (16.3%) | 6 (21.4%) |
| $50,000 to $74,999 | 15 (18.8%) | 3 (10.7%) |
| $75,000 to $99,999 | 11 (13.8%) | 1 (3.6%) |
| $100,000 to $149,999 | 9 (11.3%) | 0 (0.0%) |
| $150,000 or more | 6 (7.5%) | 0 (0.0%) |
| Total | 80 (100.0%) | 28 (100.0%) |
Monthly Housing Cost Tiers in Quenemo
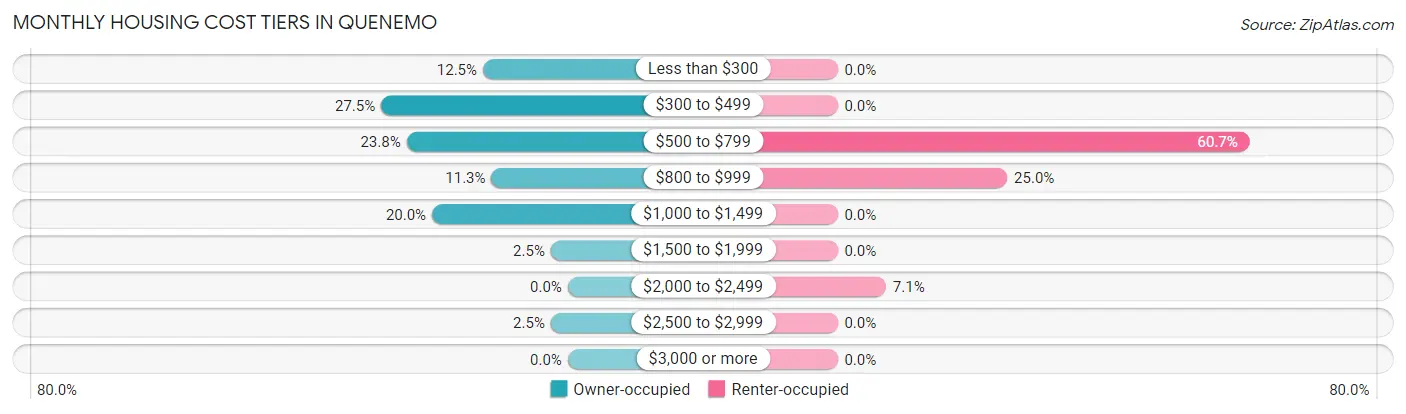
| Monthly Cost | Owner-occupied | Renter-occupied |
| Less than $300 | 10 (12.5%) | 0 (0.0%) |
| $300 to $499 | 22 (27.5%) | 0 (0.0%) |
| $500 to $799 | 19 (23.7%) | 17 (60.7%) |
| $800 to $999 | 9 (11.3%) | 7 (25.0%) |
| $1,000 to $1,499 | 16 (20.0%) | 0 (0.0%) |
| $1,500 to $1,999 | 2 (2.5%) | 0 (0.0%) |
| $2,000 to $2,499 | 0 (0.0%) | 2 (7.1%) |
| $2,500 to $2,999 | 2 (2.5%) | 0 (0.0%) |
| $3,000 or more | 0 (0.0%) | 0 (0.0%) |
| Total | 80 (100.0%) | 28 (100.0%) |
Physical Housing Characteristics in Quenemo
Housing Structures in Quenemo
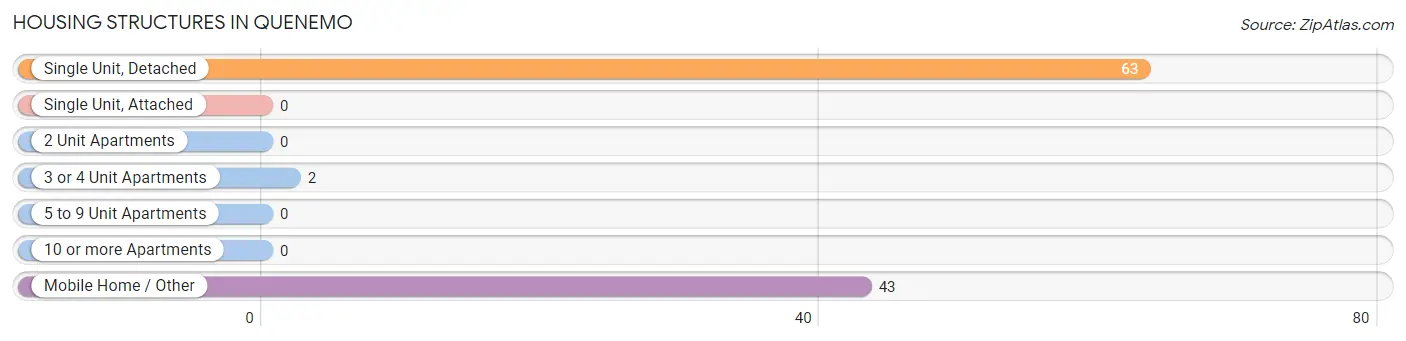
| Structure Type | # Housing Units | % Housing Units |
| Single Unit, Detached | 63 | 58.3% |
| Single Unit, Attached | 0 | 0.0% |
| 2 Unit Apartments | 0 | 0.0% |
| 3 or 4 Unit Apartments | 2 | 1.8% |
| 5 to 9 Unit Apartments | 0 | 0.0% |
| 10 or more Apartments | 0 | 0.0% |
| Mobile Home / Other | 43 | 39.8% |
| Total | 108 | 100.0% |
Housing Structures by Occupancy in Quenemo
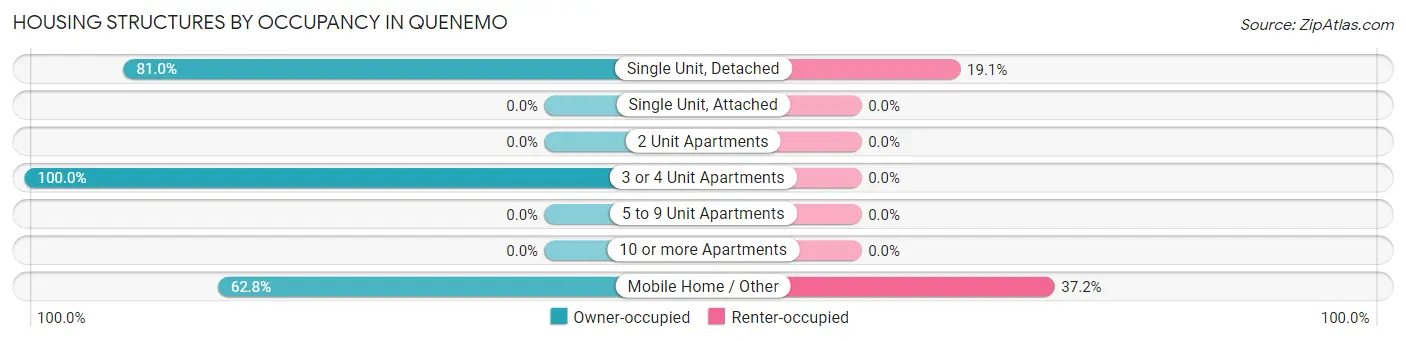
| Structure Type | Owner-occupied | Renter-occupied |
| Single Unit, Detached | 51 (80.9%) | 12 (19.1%) |
| Single Unit, Attached | 0 (0.0%) | 0 (0.0%) |
| 2 Unit Apartments | 0 (0.0%) | 0 (0.0%) |
| 3 or 4 Unit Apartments | 2 (100.0%) | 0 (0.0%) |
| 5 to 9 Unit Apartments | 0 (0.0%) | 0 (0.0%) |
| 10 or more Apartments | 0 (0.0%) | 0 (0.0%) |
| Mobile Home / Other | 27 (62.8%) | 16 (37.2%) |
| Total | 80 (74.1%) | 28 (25.9%) |
Housing Structures by Number of Rooms in Quenemo
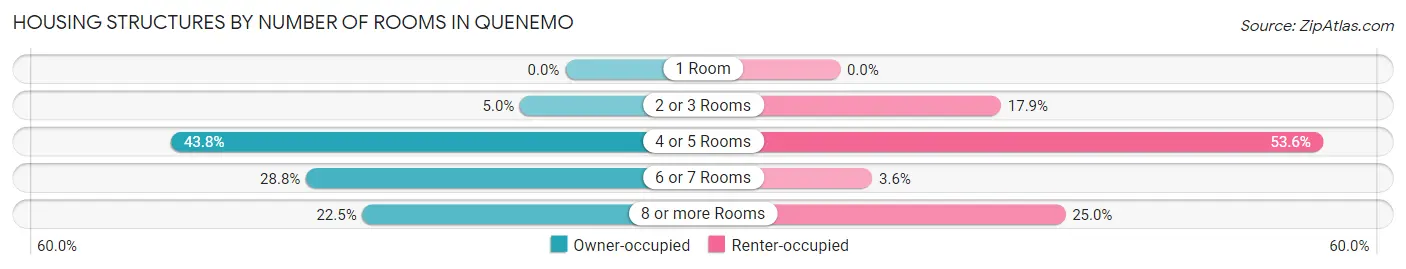
| Number of Rooms | Owner-occupied | Renter-occupied |
| 1 Room | 0 (0.0%) | 0 (0.0%) |
| 2 or 3 Rooms | 4 (5.0%) | 5 (17.9%) |
| 4 or 5 Rooms | 35 (43.8%) | 15 (53.6%) |
| 6 or 7 Rooms | 23 (28.7%) | 1 (3.6%) |
| 8 or more Rooms | 18 (22.5%) | 7 (25.0%) |
| Total | 80 (100.0%) | 28 (100.0%) |
Housing Structure by Heating Type in Quenemo
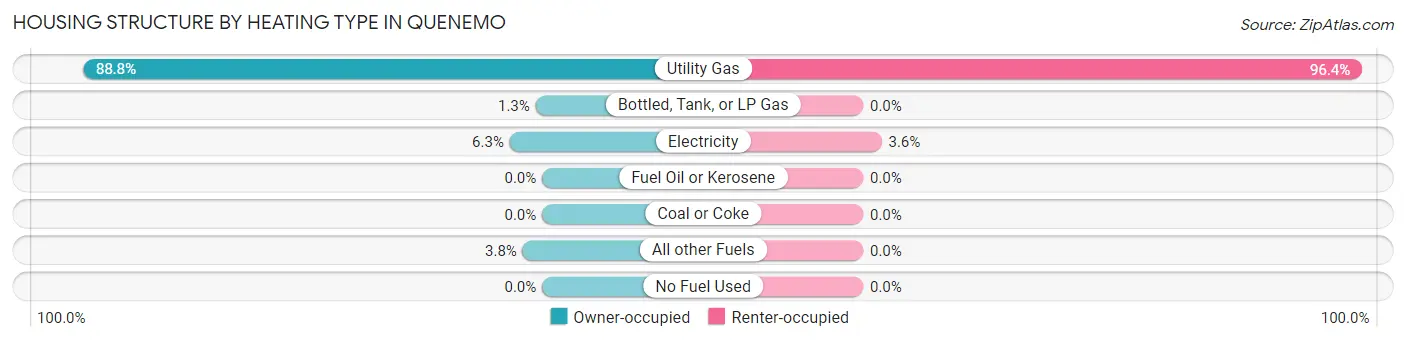
| Heating Type | Owner-occupied | Renter-occupied |
| Utility Gas | 71 (88.7%) | 27 (96.4%) |
| Bottled, Tank, or LP Gas | 1 (1.3%) | 0 (0.0%) |
| Electricity | 5 (6.2%) | 1 (3.6%) |
| Fuel Oil or Kerosene | 0 (0.0%) | 0 (0.0%) |
| Coal or Coke | 0 (0.0%) | 0 (0.0%) |
| All other Fuels | 3 (3.7%) | 0 (0.0%) |
| No Fuel Used | 0 (0.0%) | 0 (0.0%) |
| Total | 80 (100.0%) | 28 (100.0%) |
Household Vehicle Usage in Quenemo
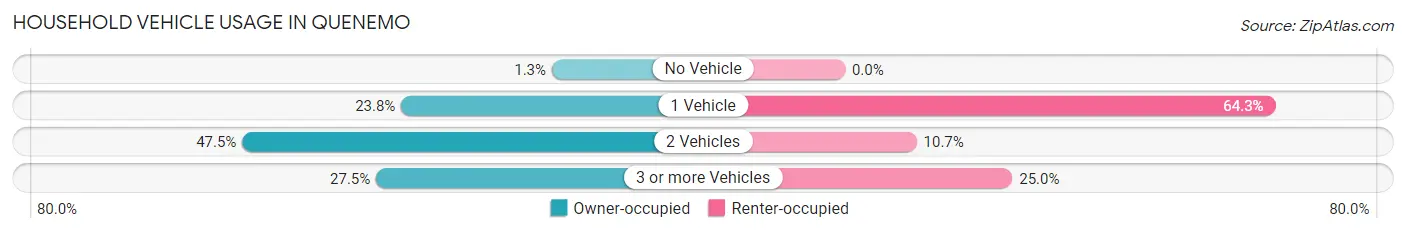
| Vehicles per Household | Owner-occupied | Renter-occupied |
| No Vehicle | 1 (1.3%) | 0 (0.0%) |
| 1 Vehicle | 19 (23.7%) | 18 (64.3%) |
| 2 Vehicles | 38 (47.5%) | 3 (10.7%) |
| 3 or more Vehicles | 22 (27.5%) | 7 (25.0%) |
| Total | 80 (100.0%) | 28 (100.0%) |
Real Estate & Mortgages in Quenemo
Real Estate and Mortgage Overview in Quenemo
| Characteristic | Without Mortgage | With Mortgage |
| Housing Units | 55 | 25 |
| Median Property Value | $38,800 | $0 |
| Median Household Income | $45,625 | $3 |
| Monthly Housing Costs | $465 | $0 |
| Real Estate Taxes | $980 | $2 |
Property Value by Mortgage Status in Quenemo
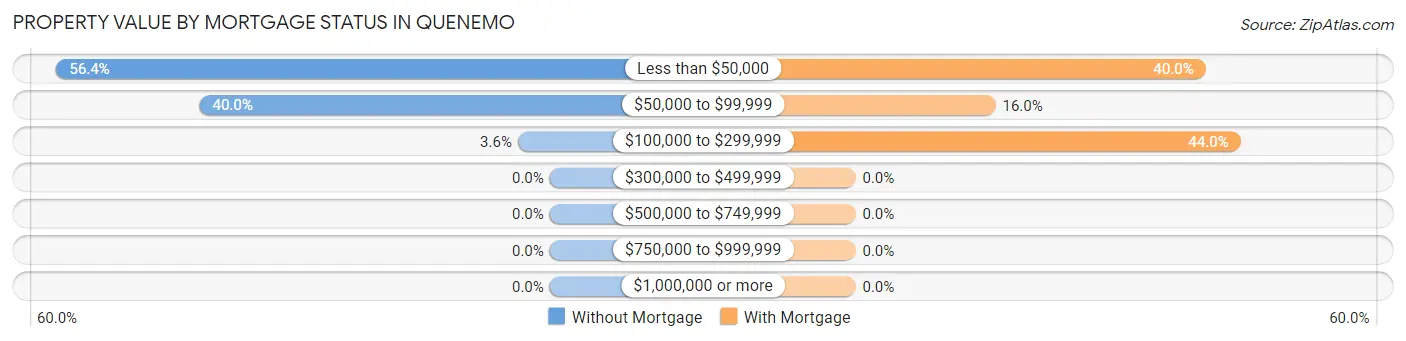
| Property Value | Without Mortgage | With Mortgage |
| Less than $50,000 | 31 (56.4%) | 10 (40.0%) |
| $50,000 to $99,999 | 22 (40.0%) | 4 (16.0%) |
| $100,000 to $299,999 | 2 (3.6%) | 11 (44.0%) |
| $300,000 to $499,999 | 0 (0.0%) | 0 (0.0%) |
| $500,000 to $749,999 | 0 (0.0%) | 0 (0.0%) |
| $750,000 to $999,999 | 0 (0.0%) | 0 (0.0%) |
| $1,000,000 or more | 0 (0.0%) | 0 (0.0%) |
| Total | 55 (100.0%) | 25 (100.0%) |
Household Income by Mortgage Status in Quenemo
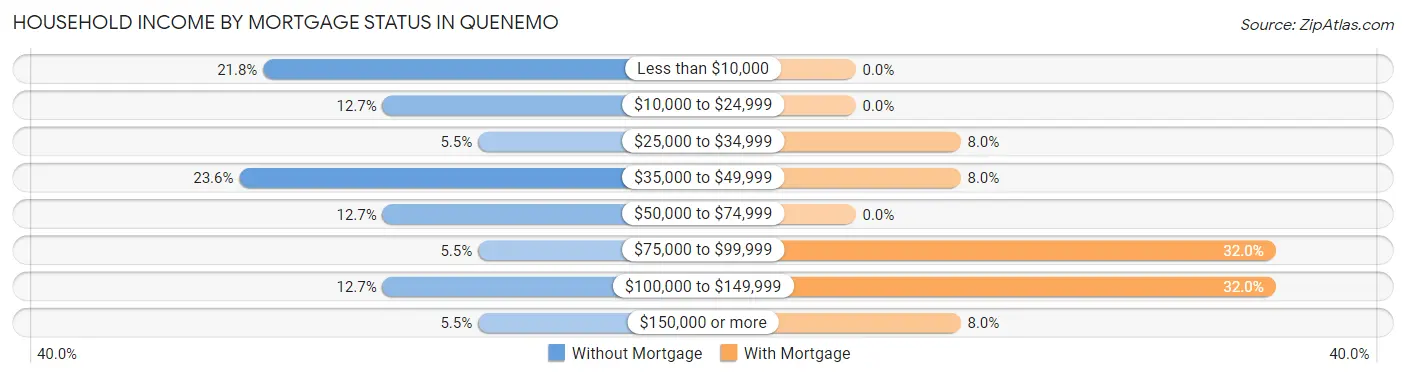
| Household Income | Without Mortgage | With Mortgage |
| Less than $10,000 | 12 (21.8%) | 0 (0.0%) |
| $10,000 to $24,999 | 7 (12.7%) | 0 (0.0%) |
| $25,000 to $34,999 | 3 (5.4%) | 2 (8.0%) |
| $35,000 to $49,999 | 13 (23.6%) | 2 (8.0%) |
| $50,000 to $74,999 | 7 (12.7%) | 0 (0.0%) |
| $75,000 to $99,999 | 3 (5.4%) | 8 (32.0%) |
| $100,000 to $149,999 | 7 (12.7%) | 8 (32.0%) |
| $150,000 or more | 3 (5.4%) | 2 (8.0%) |
| Total | 55 (100.0%) | 25 (100.0%) |
Property Value to Household Income Ratio in Quenemo
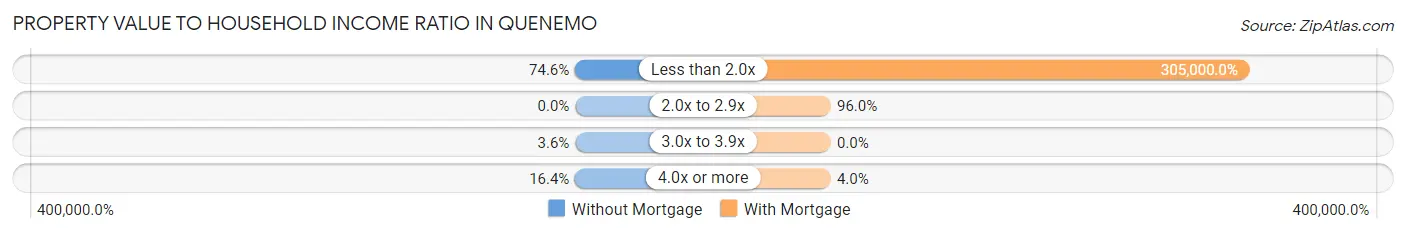
| Value-to-Income Ratio | Without Mortgage | With Mortgage |
| Less than 2.0x | 41 (74.6%) | 76,250 (305,000.0%) |
| 2.0x to 2.9x | 0 (0.0%) | 24 (96.0%) |
| 3.0x to 3.9x | 2 (3.6%) | 0 (0.0%) |
| 4.0x or more | 9 (16.4%) | 1 (4.0%) |
| Total | 55 (100.0%) | 25 (100.0%) |
Real Estate Taxes by Mortgage Status in Quenemo
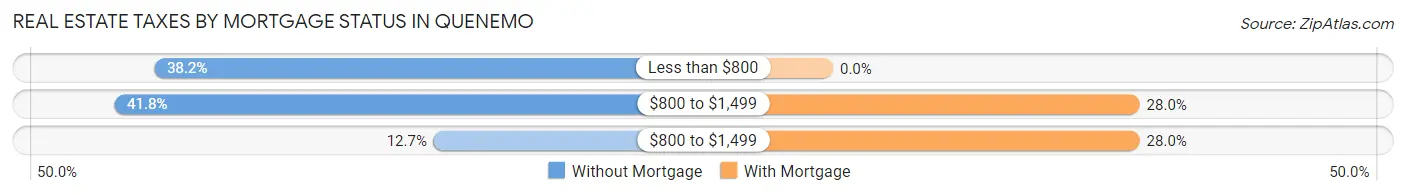
| Property Taxes | Without Mortgage | With Mortgage |
| Less than $800 | 21 (38.2%) | 0 (0.0%) |
| $800 to $1,499 | 23 (41.8%) | 7 (28.0%) |
| $800 to $1,499 | 7 (12.7%) | 7 (28.0%) |
| Total | 55 (100.0%) | 25 (100.0%) |
Health & Disability in Quenemo
Health Insurance Coverage by Age in Quenemo
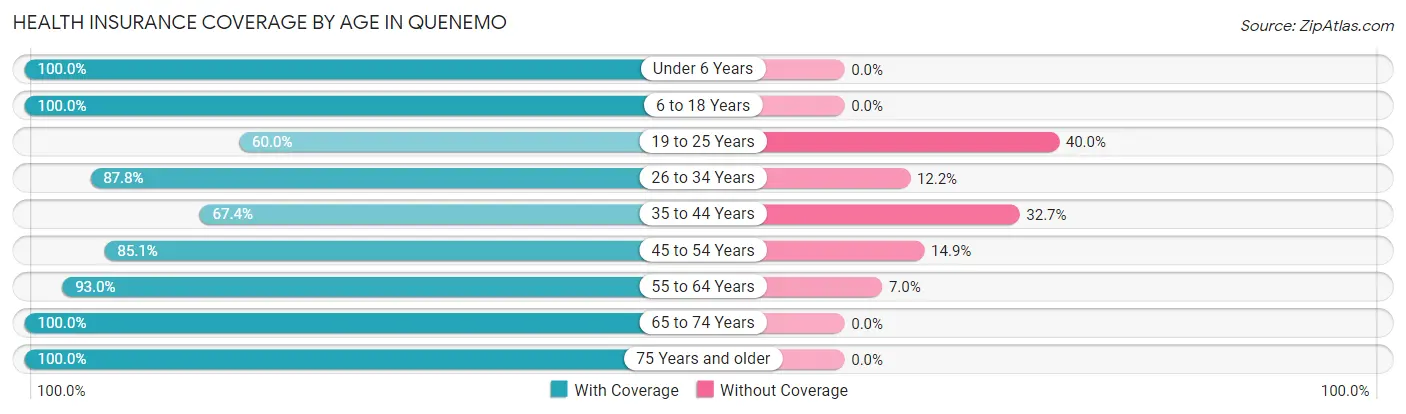
| Age Bracket | With Coverage | Without Coverage |
| Under 6 Years | 6 (100.0%) | 0 (0.0%) |
| 6 to 18 Years | 82 (100.0%) | 0 (0.0%) |
| 19 to 25 Years | 15 (60.0%) | 10 (40.0%) |
| 26 to 34 Years | 43 (87.8%) | 6 (12.2%) |
| 35 to 44 Years | 33 (67.3%) | 16 (32.7%) |
| 45 to 54 Years | 40 (85.1%) | 7 (14.9%) |
| 55 to 64 Years | 53 (93.0%) | 4 (7.0%) |
| 65 to 74 Years | 35 (100.0%) | 0 (0.0%) |
| 75 Years and older | 12 (100.0%) | 0 (0.0%) |
| Total | 319 (88.1%) | 43 (11.9%) |
Health Insurance Coverage by Citizenship Status in Quenemo
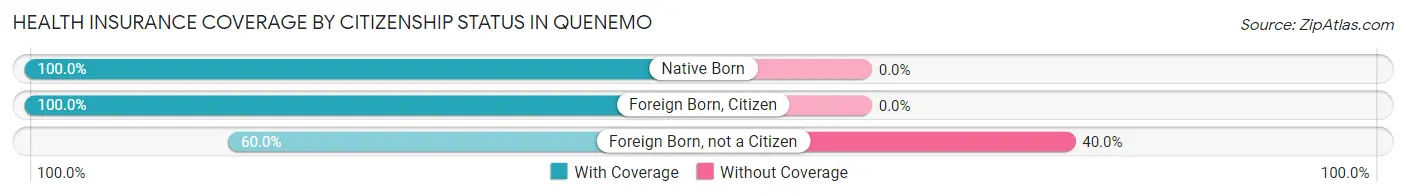
| Citizenship Status | With Coverage | Without Coverage |
| Native Born | 6 (100.0%) | 0 (0.0%) |
| Foreign Born, Citizen | 82 (100.0%) | 0 (0.0%) |
| Foreign Born, not a Citizen | 15 (60.0%) | 10 (40.0%) |
Health Insurance Coverage by Household Income in Quenemo
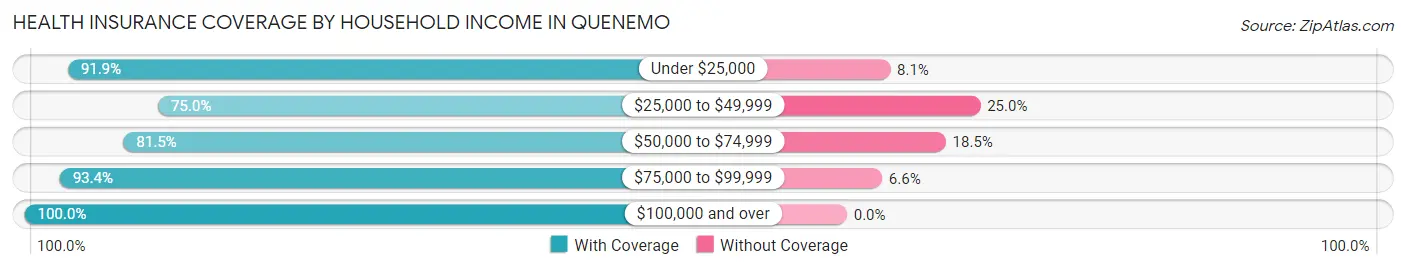
| Household Income | With Coverage | Without Coverage |
| Under $25,000 | 102 (91.9%) | 9 (8.1%) |
| $25,000 to $49,999 | 57 (75.0%) | 19 (25.0%) |
| $50,000 to $74,999 | 44 (81.5%) | 10 (18.5%) |
| $75,000 to $99,999 | 71 (93.4%) | 5 (6.6%) |
| $100,000 and over | 45 (100.0%) | 0 (0.0%) |
Public vs Private Health Insurance Coverage by Age in Quenemo
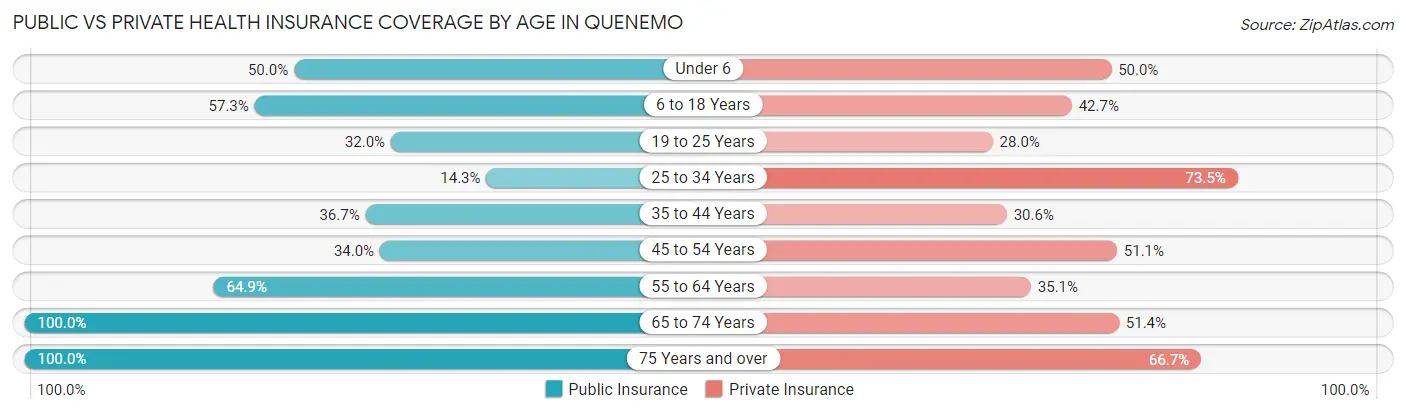
| Age Bracket | Public Insurance | Private Insurance |
| Under 6 | 3 (50.0%) | 3 (50.0%) |
| 6 to 18 Years | 47 (57.3%) | 35 (42.7%) |
| 19 to 25 Years | 8 (32.0%) | 7 (28.0%) |
| 25 to 34 Years | 7 (14.3%) | 36 (73.5%) |
| 35 to 44 Years | 18 (36.7%) | 15 (30.6%) |
| 45 to 54 Years | 16 (34.0%) | 24 (51.1%) |
| 55 to 64 Years | 37 (64.9%) | 20 (35.1%) |
| 65 to 74 Years | 35 (100.0%) | 18 (51.4%) |
| 75 Years and over | 12 (100.0%) | 8 (66.7%) |
| Total | 183 (50.5%) | 166 (45.9%) |
Disability Status by Sex by Age in Quenemo
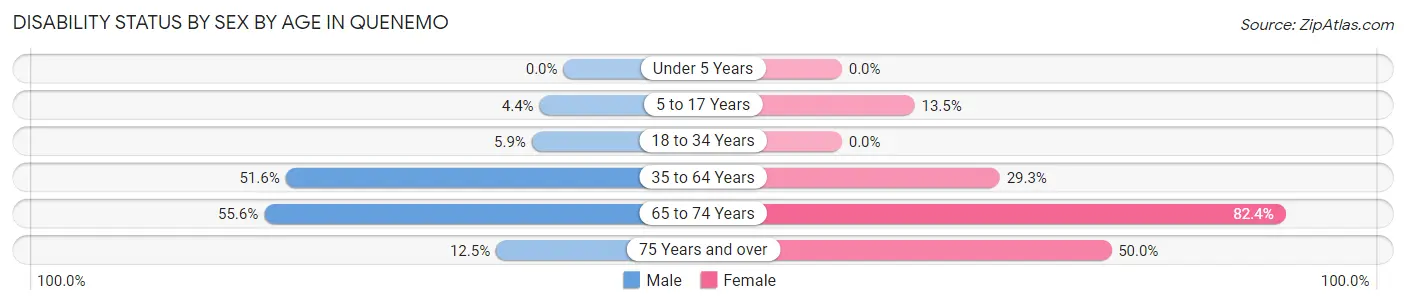
| Age Bracket | Male | Female |
| Under 5 Years | 0 (0.0%) | 0 (0.0%) |
| 5 to 17 Years | 2 (4.4%) | 5 (13.5%) |
| 18 to 34 Years | 2 (5.9%) | 0 (0.0%) |
| 35 to 64 Years | 49 (51.6%) | 17 (29.3%) |
| 65 to 74 Years | 10 (55.6%) | 14 (82.4%) |
| 75 Years and over | 1 (12.5%) | 2 (50.0%) |
Disability Class by Sex by Age in Quenemo
Disability Class: Hearing Difficulty
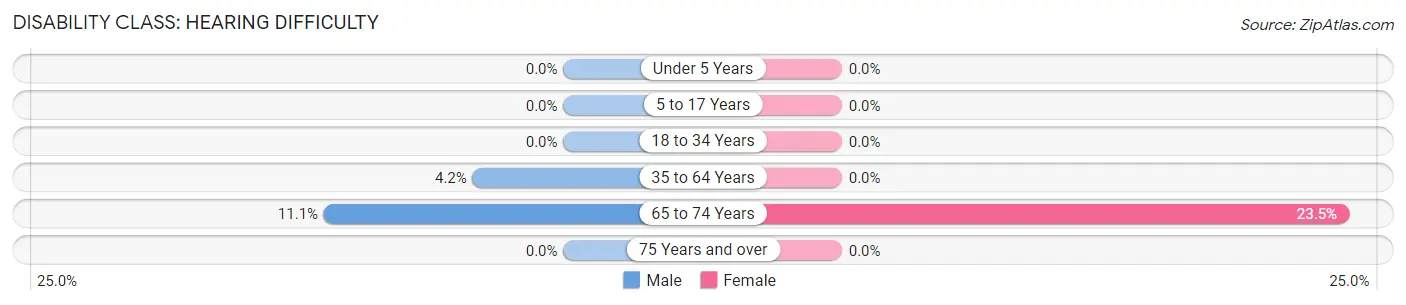
| Age Bracket | Male | Female |
| Under 5 Years | 0 (0.0%) | 0 (0.0%) |
| 5 to 17 Years | 0 (0.0%) | 0 (0.0%) |
| 18 to 34 Years | 0 (0.0%) | 0 (0.0%) |
| 35 to 64 Years | 4 (4.2%) | 0 (0.0%) |
| 65 to 74 Years | 2 (11.1%) | 4 (23.5%) |
| 75 Years and over | 0 (0.0%) | 0 (0.0%) |
Disability Class: Vision Difficulty
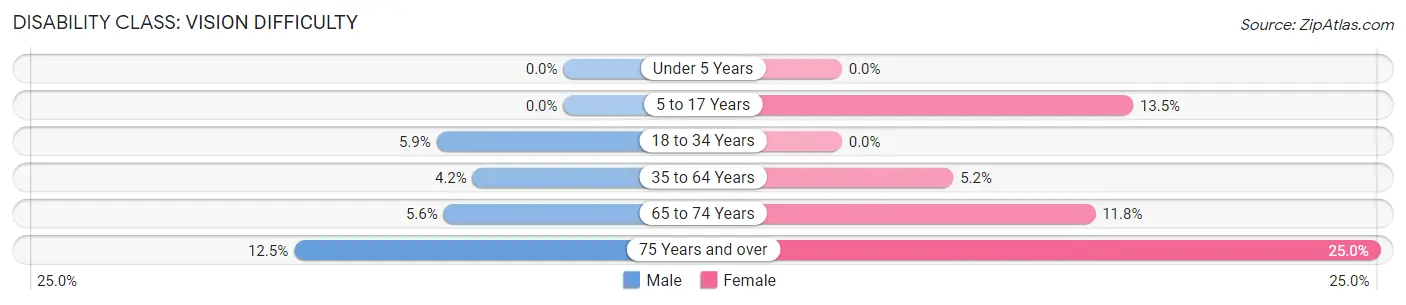
| Age Bracket | Male | Female |
| Under 5 Years | 0 (0.0%) | 0 (0.0%) |
| 5 to 17 Years | 0 (0.0%) | 5 (13.5%) |
| 18 to 34 Years | 2 (5.9%) | 0 (0.0%) |
| 35 to 64 Years | 4 (4.2%) | 3 (5.2%) |
| 65 to 74 Years | 1 (5.6%) | 2 (11.8%) |
| 75 Years and over | 1 (12.5%) | 1 (25.0%) |
Disability Class: Cognitive Difficulty
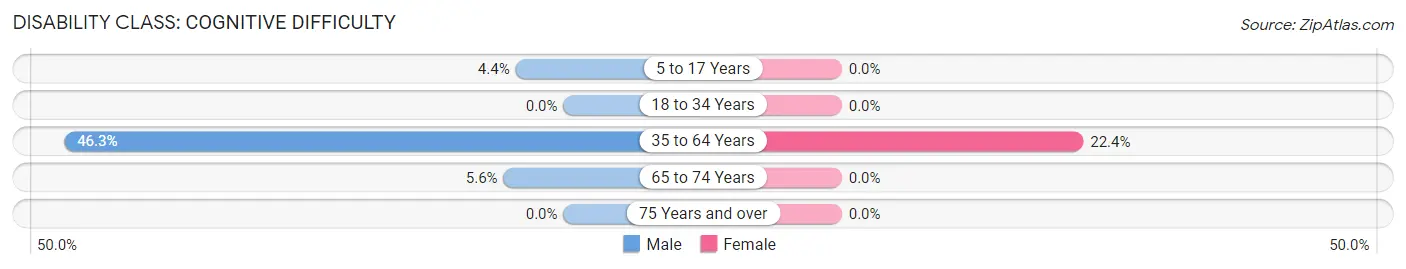
| Age Bracket | Male | Female |
| 5 to 17 Years | 2 (4.4%) | 0 (0.0%) |
| 18 to 34 Years | 0 (0.0%) | 0 (0.0%) |
| 35 to 64 Years | 44 (46.3%) | 13 (22.4%) |
| 65 to 74 Years | 1 (5.6%) | 0 (0.0%) |
| 75 Years and over | 0 (0.0%) | 0 (0.0%) |
Disability Class: Ambulatory Difficulty
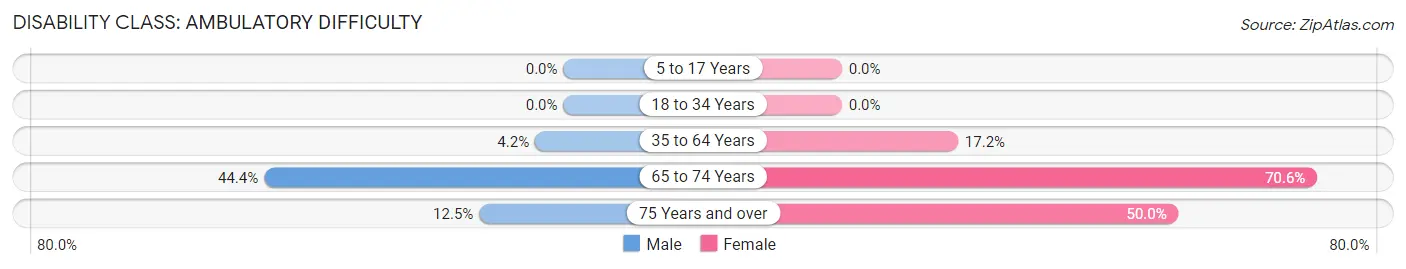
| Age Bracket | Male | Female |
| 5 to 17 Years | 0 (0.0%) | 0 (0.0%) |
| 18 to 34 Years | 0 (0.0%) | 0 (0.0%) |
| 35 to 64 Years | 4 (4.2%) | 10 (17.2%) |
| 65 to 74 Years | 8 (44.4%) | 12 (70.6%) |
| 75 Years and over | 1 (12.5%) | 2 (50.0%) |
Disability Class: Self-Care Difficulty
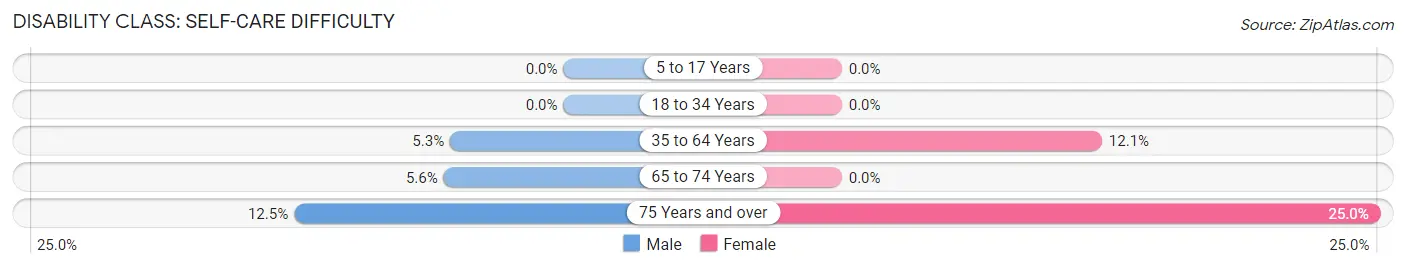
| Age Bracket | Male | Female |
| 5 to 17 Years | 0 (0.0%) | 0 (0.0%) |
| 18 to 34 Years | 0 (0.0%) | 0 (0.0%) |
| 35 to 64 Years | 5 (5.3%) | 7 (12.1%) |
| 65 to 74 Years | 1 (5.6%) | 0 (0.0%) |
| 75 Years and over | 1 (12.5%) | 1 (25.0%) |
Technology Access in Quenemo
Computing Device Access in Quenemo
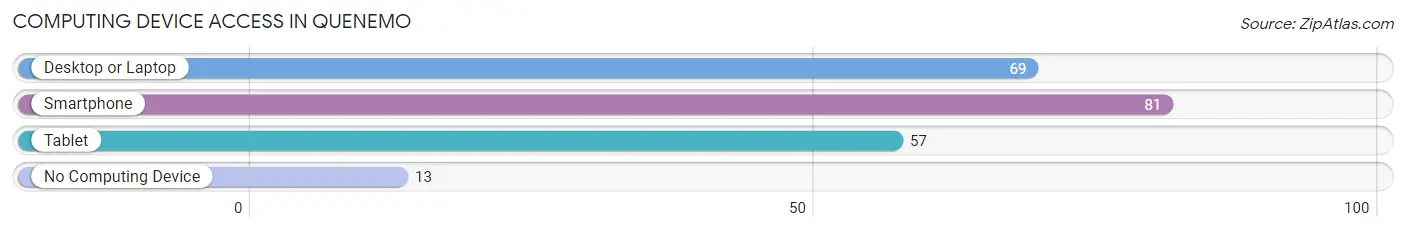
| Device Type | # Households | % Households |
| Desktop or Laptop | 69 | 63.9% |
| Smartphone | 81 | 75.0% |
| Tablet | 57 | 52.8% |
| No Computing Device | 13 | 12.0% |
| Total | 108 | 100.0% |
Internet Access in Quenemo
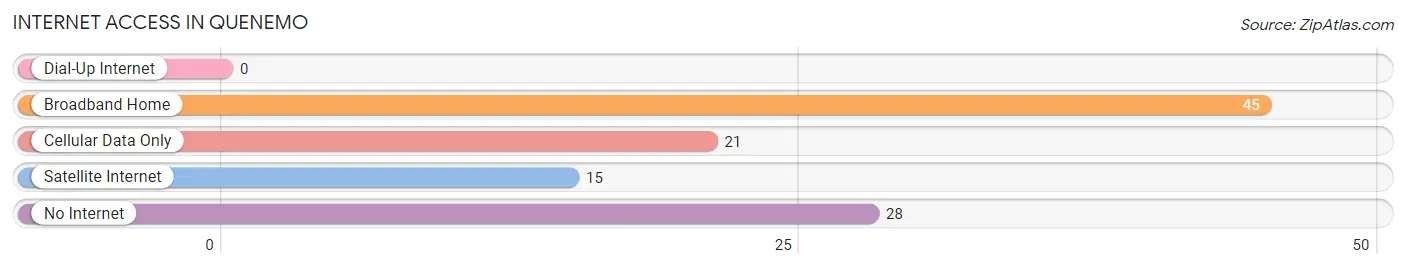
| Internet Type | # Households | % Households |
| Dial-Up Internet | 0 | 0.0% |
| Broadband Home | 45 | 41.7% |
| Cellular Data Only | 21 | 19.4% |
| Satellite Internet | 15 | 13.9% |
| No Internet | 28 | 25.9% |
| Total | 108 | 100.0% |
Quenemo Summary
Quenemo, Kansas is a small town located in Osage County, Kansas. It is situated on the banks of the Marais des Cygnes River, about 25 miles south of Topeka. The population of Quenemo was estimated to be around 200 people in 2020.
History
Quenemo was founded in 1869 by a group of settlers from Ohio. The town was named after the Quenemo Indian tribe, which had lived in the area for centuries. The town was originally a trading post for the local Native American tribes. In 1871, the first post office was established in Quenemo.
In the late 19th century, Quenemo became a popular destination for settlers from the East Coast. The town was known for its abundance of natural resources, including timber, coal, and limestone. The town also had a thriving agricultural industry, with many farmers growing wheat, corn, and other crops.
In the early 20th century, Quenemo experienced a period of growth and prosperity. The town was home to several businesses, including a bank, a hotel, a general store, and a lumber mill. The town also had a school, a library, and a newspaper.
Geography
Quenemo is located in Osage County, Kansas. It is situated on the banks of the Marais des Cygnes River, about 25 miles south of Topeka. The town is surrounded by rolling hills and farmland. The climate in Quenemo is generally mild, with hot summers and cold winters.
Economy
The economy of Quenemo is largely based on agriculture. The town is home to several farms, which grow wheat, corn, and other crops. The town also has a few small businesses, including a general store, a lumber mill, and a bank.
Demographics
As of 2020, the population of Quenemo was estimated to be around 200 people. The town is predominantly white, with a small Hispanic population. The median household income in Quenemo is around $35,000. The town has a low unemployment rate and a high rate of homeownership.
Conclusion
Quenemo, Kansas is a small town located in Osage County, Kansas. It is situated on the banks of the Marais des Cygnes River, about 25 miles south of Topeka. The population of Quenemo was estimated to be around 200 people in 2020. The town has a long history, dating back to the 19th century. The economy of Quenemo is largely based on agriculture, with many farms growing wheat, corn, and other crops. The town is predominantly white, with a small Hispanic population. The median household income in Quenemo is around $35,000. The town has a low unemployment rate and a high rate of homeownership.
Common Questions
What is Per Capita Income in Quenemo?
Per Capita income in Quenemo is $20,038.
What is the Median Family Income in Quenemo?
Median Family Income in Quenemo is $48,750.
What is the Median Household income in Quenemo?
Median Household Income in Quenemo is $45,625.
What is Income or Wage Gap in Quenemo?
Income or Wage Gap in Quenemo is 29.6%.
Women in Quenemo earn 70.4 cents for every dollar earned by a man.
What is Inequality or Gini Index in Quenemo?
Inequality or Gini Index in Quenemo is 0.47.
What is the Total Population of Quenemo?
Total Population of Quenemo is 362.
What is the Total Male Population of Quenemo?
Total Male Population of Quenemo is 203.
What is the Total Female Population of Quenemo?
Total Female Population of Quenemo is 159.
What is the Ratio of Males per 100 Females in Quenemo?
There are 127.67 Males per 100 Females in Quenemo.
What is the Ratio of Females per 100 Males in Quenemo?
There are 78.33 Females per 100 Males in Quenemo.
What is the Median Population Age in Quenemo?
Median Population Age in Quenemo is 38.9 Years.
What is the Average Family Size in Quenemo
Average Family Size in Quenemo is 3.8 People.
What is the Average Household Size in Quenemo
Average Household Size in Quenemo is 3.4 People.
How Large is the Labor Force in Quenemo?
There are 127 People in the Labor Forcein in Quenemo.
What is the Percentage of People in the Labor Force in Quenemo?
45.7% of People are in the Labor Force in Quenemo.