Sharon Springs, KS Map & Demographics
Sharon Springs Map
Sharon Springs Overview
$32,225
PER CAPITA INCOME
$63,472
AVG FAMILY INCOME
$54,097
AVG HOUSEHOLD INCOME
31.9%
WAGE / INCOME GAP [ % ]
68.1¢/ $1
WAGE / INCOME GAP [ $ ]
$9,843
FAMILY INCOME DEFICIT
0.47
INEQUALITY / GINI INDEX
869
TOTAL POPULATION
443
MALE POPULATION
426
FEMALE POPULATION
103.99
MALES / 100 FEMALES
96.16
FEMALES / 100 MALES
42.6
MEDIAN AGE
2.9
AVG FAMILY SIZE
2.3
AVG HOUSEHOLD SIZE
368
LABOR FORCE [ PEOPLE ]
55.3%
PERCENT IN LABOR FORCE
3.5%
UNEMPLOYMENT RATE
Sharon Springs Zip Codes
Sharon Springs Area Codes
Income in Sharon Springs
Income Overview in Sharon Springs
Per Capita Income in Sharon Springs is $32,225, while median incomes of families and households are $63,472 and $54,097 respectively.
| Characteristic | Number | Measure |
| Per Capita Income | 869 | $32,225 |
| Median Family Income | 233 | $63,472 |
| Mean Family Income | 233 | $85,979 |
| Median Household Income | 372 | $54,097 |
| Mean Household Income | 372 | $69,465 |
| Income Deficit | 233 | $9,843 |
| Wage / Income Gap (%) | 869 | 31.94% |
| Wage / Income Gap ($) | 869 | 68.06¢ per $1 |
| Gini / Inequality Index | 869 | 0.47 |
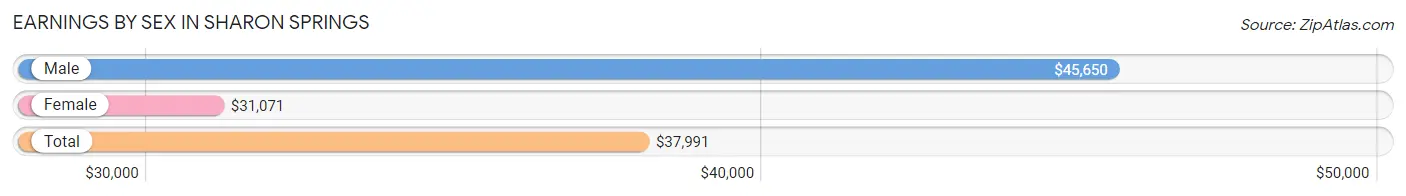
Earnings by Sex in Sharon Springs
Average Earnings in Sharon Springs are $37,991, $45,650 for men and $31,071 for women, a difference of 31.9%.
| Sex | Number | Average Earnings |
| Male | 195 (51.2%) | $45,650 |
| Female | 186 (48.8%) | $31,071 |
| Total | 381 (100.0%) | $37,991 |
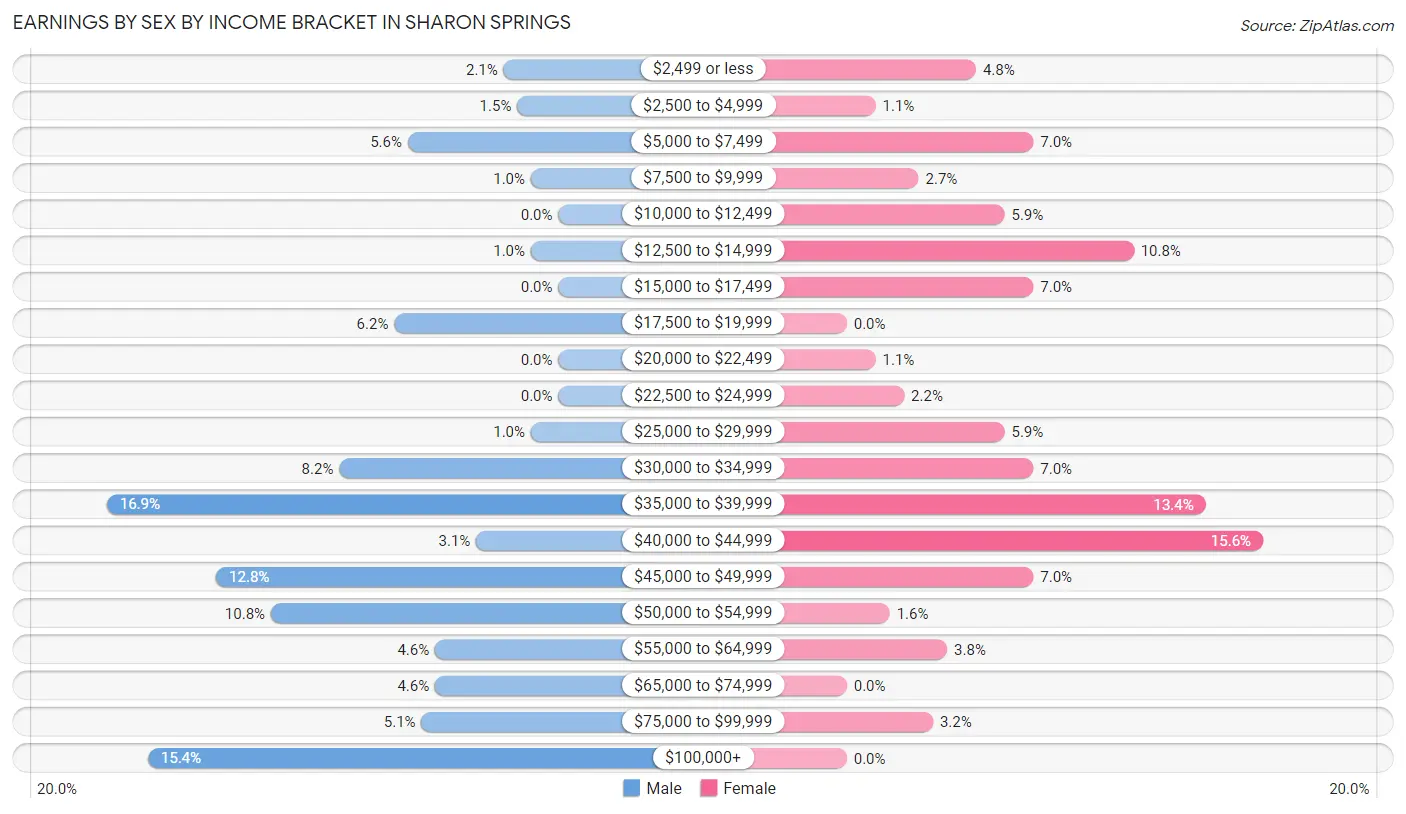
Earnings by Sex by Income Bracket in Sharon Springs
The most common earnings brackets in Sharon Springs are $35,000 to $39,999 for men (33 | 16.9%) and $40,000 to $44,999 for women (29 | 15.6%).
| Income | Male | Female |
| $2,499 or less | 4 (2.1%) | 9 (4.8%) |
| $2,500 to $4,999 | 3 (1.5%) | 2 (1.1%) |
| $5,000 to $7,499 | 11 (5.6%) | 13 (7.0%) |
| $7,500 to $9,999 | 2 (1.0%) | 5 (2.7%) |
| $10,000 to $12,499 | 0 (0.0%) | 11 (5.9%) |
| $12,500 to $14,999 | 2 (1.0%) | 20 (10.7%) |
| $15,000 to $17,499 | 0 (0.0%) | 13 (7.0%) |
| $17,500 to $19,999 | 12 (6.1%) | 0 (0.0%) |
| $20,000 to $22,499 | 0 (0.0%) | 2 (1.1%) |
| $22,500 to $24,999 | 0 (0.0%) | 4 (2.1%) |
| $25,000 to $29,999 | 2 (1.0%) | 11 (5.9%) |
| $30,000 to $34,999 | 16 (8.2%) | 13 (7.0%) |
| $35,000 to $39,999 | 33 (16.9%) | 25 (13.4%) |
| $40,000 to $44,999 | 6 (3.1%) | 29 (15.6%) |
| $45,000 to $49,999 | 25 (12.8%) | 13 (7.0%) |
| $50,000 to $54,999 | 21 (10.8%) | 3 (1.6%) |
| $55,000 to $64,999 | 9 (4.6%) | 7 (3.8%) |
| $65,000 to $74,999 | 9 (4.6%) | 0 (0.0%) |
| $75,000 to $99,999 | 10 (5.1%) | 6 (3.2%) |
| $100,000+ | 30 (15.4%) | 0 (0.0%) |
| Total | 195 (100.0%) | 186 (100.0%) |
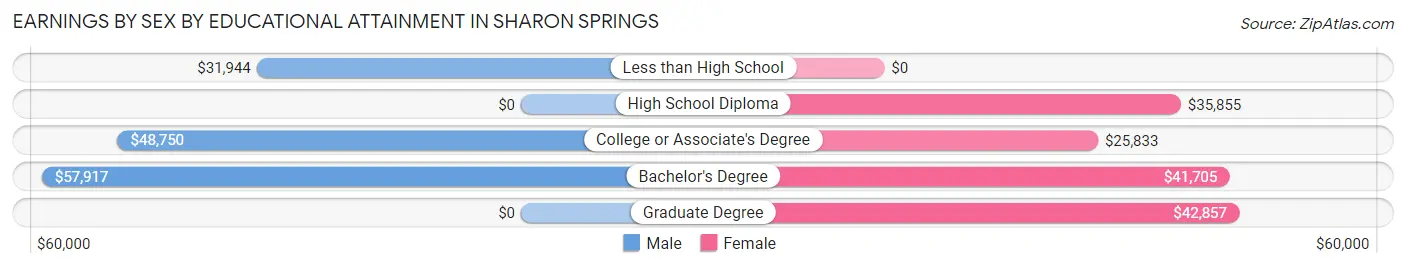
Earnings by Sex by Educational Attainment in Sharon Springs
Average earnings in Sharon Springs are $48,750 for men and $36,071 for women, a difference of 26.0%. Men with an educational attainment of bachelor's degree enjoy the highest average annual earnings of $57,917, while those with less than high school education earn the least with $31,944. Women with an educational attainment of graduate degree earn the most with the average annual earnings of $42,857, while those with college or associate's degree education have the smallest earnings of $25,833.
| Educational Attainment | Male Income | Female Income |
| Less than High School | $31,944 | $0 |
| High School Diploma | - | - |
| College or Associate's Degree | $48,750 | $25,833 |
| Bachelor's Degree | $57,917 | $41,705 |
| Graduate Degree | - | - |
| Total | $48,750 | $36,071 |
Family Income in Sharon Springs
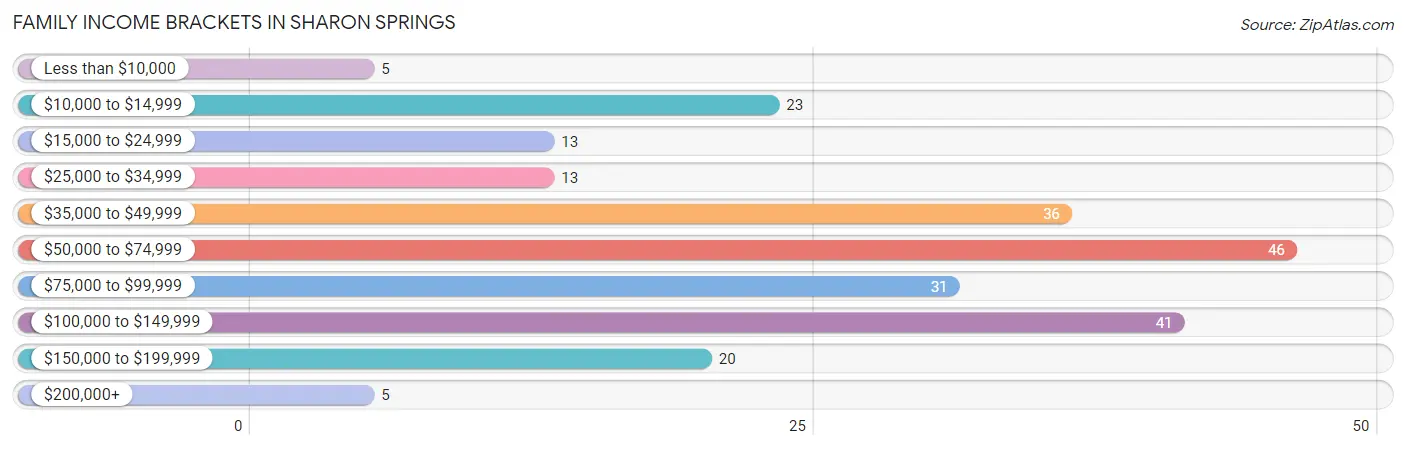
Family Income Brackets in Sharon Springs
According to the Sharon Springs family income data, there are 46 families falling into the $50,000 to $74,999 income range, which is the most common income bracket and makes up 19.7% of all families. Conversely, the less than $10,000 income bracket is the least frequent group with only 5 families (2.1%) belonging to this category.
| Income Bracket | # Families | % Families |
| Less than $10,000 | 5 | 2.1% |
| $10,000 to $14,999 | 23 | 9.9% |
| $15,000 to $24,999 | 13 | 5.6% |
| $25,000 to $34,999 | 13 | 5.6% |
| $35,000 to $49,999 | 36 | 15.5% |
| $50,000 to $74,999 | 46 | 19.7% |
| $75,000 to $99,999 | 31 | 13.3% |
| $100,000 to $149,999 | 41 | 17.6% |
| $150,000 to $199,999 | 20 | 8.6% |
| $200,000+ | 5 | 2.1% |
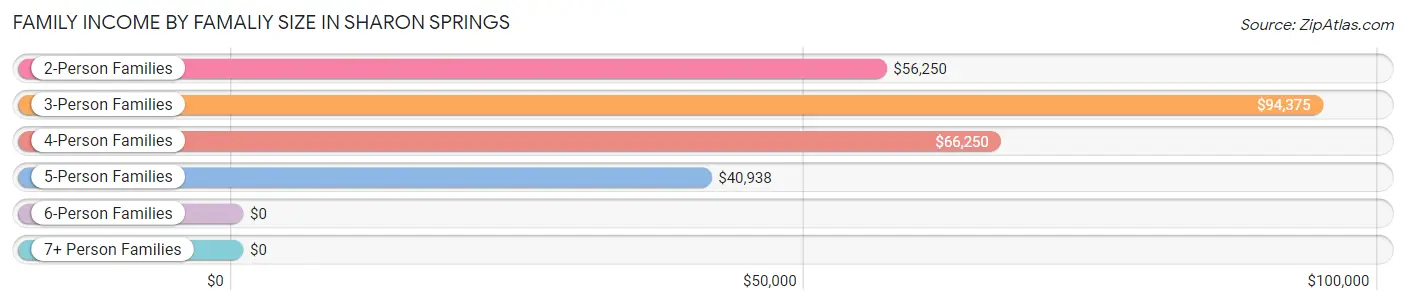
Family Income by Famaliy Size in Sharon Springs
3-person families (43 | 18.4%) account for the highest median family income in Sharon Springs with $94,375 per family, while 3-person families (43 | 18.4%) have the highest median income of $31,458 per family member.
| Income Bracket | # Families | Median Income |
| 2-Person Families | 132 (56.7%) | $56,250 |
| 3-Person Families | 43 (18.4%) | $94,375 |
| 4-Person Families | 8 (3.4%) | $66,250 |
| 5-Person Families | 23 (9.9%) | $40,938 |
| 6-Person Families | 18 (7.7%) | $0 |
| 7+ Person Families | 9 (3.9%) | $0 |
| Total | 233 (100.0%) | $63,472 |
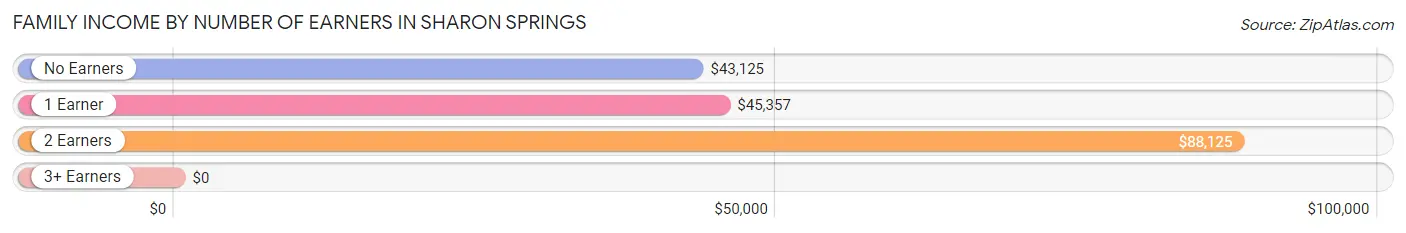
Family Income by Number of Earners in Sharon Springs
| Number of Earners | # Families | Median Income |
| No Earners | 35 (15.0%) | $43,125 |
| 1 Earner | 96 (41.2%) | $45,357 |
| 2 Earners | 80 (34.3%) | $88,125 |
| 3+ Earners | 22 (9.4%) | $0 |
| Total | 233 (100.0%) | $63,472 |
Household Income in Sharon Springs
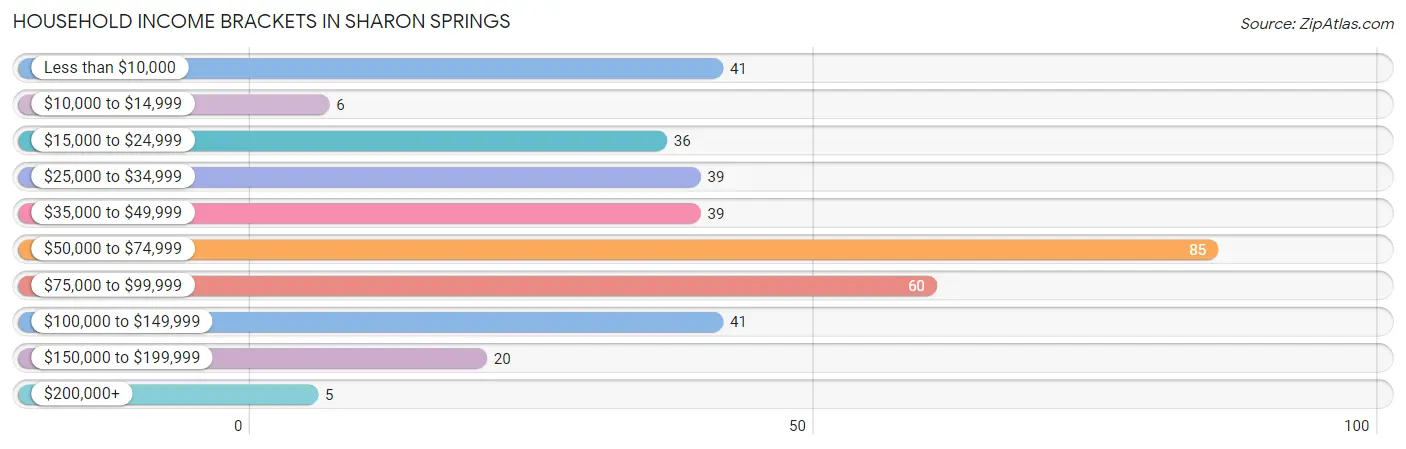
Household Income Brackets in Sharon Springs
With 85 households falling in the category, the $50,000 to $74,999 income range is the most frequent in Sharon Springs, accounting for 22.9% of all households. In contrast, only 5 households (1.3%) fall into the $200,000+ income bracket, making it the least populous group.
| Income Bracket | # Households | % Households |
| Less than $10,000 | 41 | 11.0% |
| $10,000 to $14,999 | 6 | 1.6% |
| $15,000 to $24,999 | 36 | 9.7% |
| $25,000 to $34,999 | 39 | 10.5% |
| $35,000 to $49,999 | 39 | 10.5% |
| $50,000 to $74,999 | 85 | 22.8% |
| $75,000 to $99,999 | 60 | 16.1% |
| $100,000 to $149,999 | 41 | 11.0% |
| $150,000 to $199,999 | 20 | 5.4% |
| $200,000+ | 5 | 1.3% |
Household Income by Householder Age in Sharon Springs
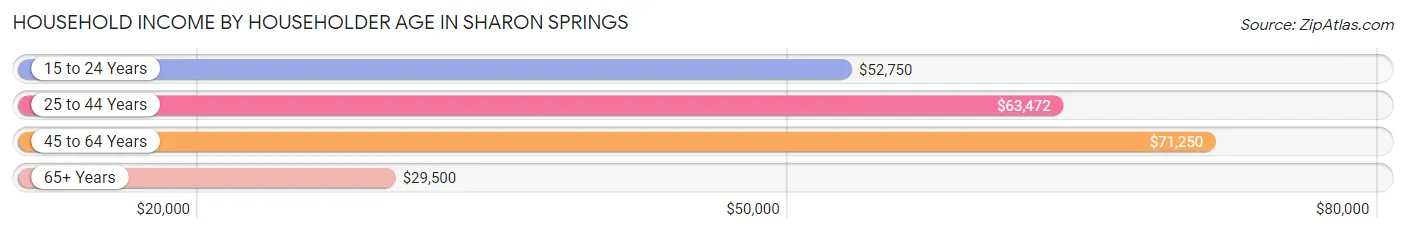
The median household income in Sharon Springs is $54,097, with the highest median household income of $71,250 found in the 45 to 64 years age bracket for the primary householder. A total of 127 households (34.1%) fall into this category. Meanwhile, the 65+ years age bracket for the primary householder has the lowest median household income of $29,500, with 112 households (30.1%) in this group.
| Income Bracket | # Households | Median Income |
| 15 to 24 Years | 36 (9.7%) | $52,750 |
| 25 to 44 Years | 97 (26.1%) | $63,472 |
| 45 to 64 Years | 127 (34.1%) | $71,250 |
| 65+ Years | 112 (30.1%) | $29,500 |
| Total | 372 (100.0%) | $54,097 |
Poverty in Sharon Springs
Income Below Poverty by Sex and Age in Sharon Springs
With 17.3% poverty level for males and 25.5% for females among the residents of Sharon Springs, under 5 year old males and 35 to 44 year old females are the most vulnerable to poverty, with 35 males (76.1%) and 30 females (83.3%) in their respective age groups living below the poverty level.
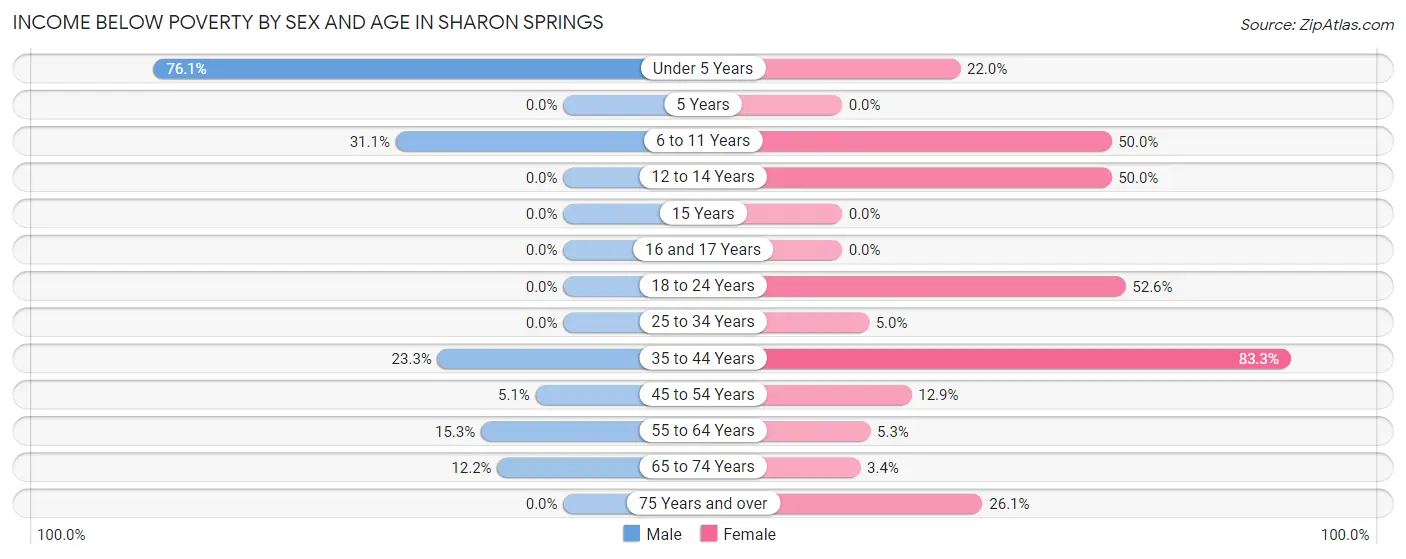
| Age Bracket | Male | Female |
| Under 5 Years | 35 (76.1%) | 9 (22.0%) |
| 5 Years | 0 (0.0%) | 0 (0.0%) |
| 6 to 11 Years | 14 (31.1%) | 14 (50.0%) |
| 12 to 14 Years | 0 (0.0%) | 9 (50.0%) |
| 15 Years | 0 (0.0%) | 0 (0.0%) |
| 16 and 17 Years | 0 (0.0%) | 0 (0.0%) |
| 18 to 24 Years | 0 (0.0%) | 20 (52.6%) |
| 25 to 34 Years | 0 (0.0%) | 2 (5.0%) |
| 35 to 44 Years | 7 (23.3%) | 30 (83.3%) |
| 45 to 54 Years | 2 (5.1%) | 4 (12.9%) |
| 55 to 64 Years | 11 (15.3%) | 3 (5.3%) |
| 65 to 74 Years | 6 (12.2%) | 2 (3.4%) |
| 75 Years and over | 0 (0.0%) | 12 (26.1%) |
| Total | 75 (17.3%) | 105 (25.5%) |
Income Above Poverty by Sex and Age in Sharon Springs
According to the poverty statistics in Sharon Springs, males aged 5 years and females aged 5 years are the age groups that are most secure financially, with 100.0% of males and 100.0% of females in these age groups living above the poverty line.
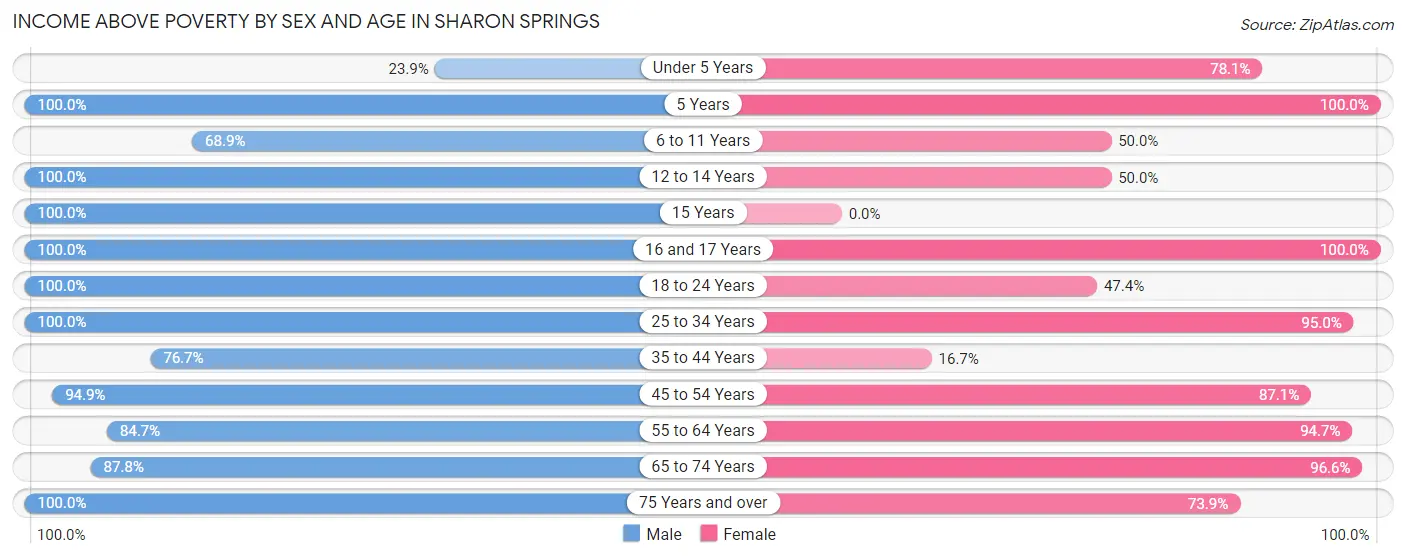
| Age Bracket | Male | Female |
| Under 5 Years | 11 (23.9%) | 32 (78.0%) |
| 5 Years | 2 (100.0%) | 13 (100.0%) |
| 6 to 11 Years | 31 (68.9%) | 14 (50.0%) |
| 12 to 14 Years | 7 (100.0%) | 9 (50.0%) |
| 15 Years | 4 (100.0%) | 0 (0.0%) |
| 16 and 17 Years | 13 (100.0%) | 5 (100.0%) |
| 18 to 24 Years | 41 (100.0%) | 18 (47.4%) |
| 25 to 34 Years | 35 (100.0%) | 38 (95.0%) |
| 35 to 44 Years | 23 (76.7%) | 6 (16.7%) |
| 45 to 54 Years | 37 (94.9%) | 27 (87.1%) |
| 55 to 64 Years | 61 (84.7%) | 54 (94.7%) |
| 65 to 74 Years | 43 (87.8%) | 57 (96.6%) |
| 75 Years and over | 51 (100.0%) | 34 (73.9%) |
| Total | 359 (82.7%) | 307 (74.5%) |
Income Below Poverty Among Married-Couple Families in Sharon Springs
The poverty statistics for married-couple families in Sharon Springs show that 10.1% or 15 of the total 149 families live below the poverty line. Families with 3 or 4 children have the highest poverty rate of 38.7%, comprising of 12 families. On the other hand, families with 1 or 2 children have the lowest poverty rate of 0.0%, which includes 0 families.
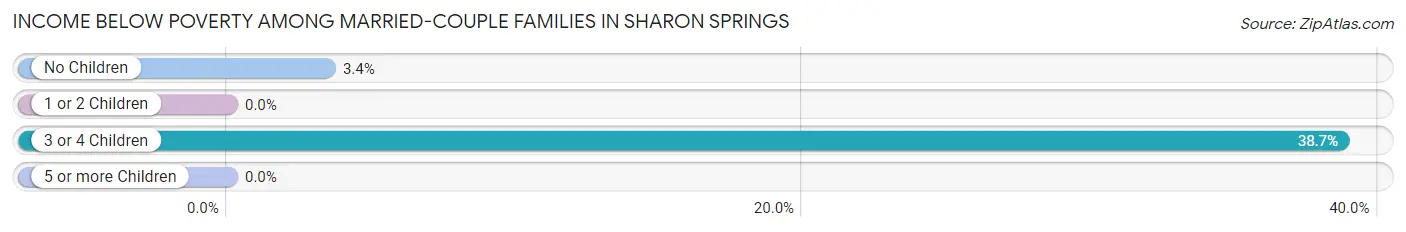
| Children | Above Poverty | Below Poverty |
| No Children | 85 (96.6%) | 3 (3.4%) |
| 1 or 2 Children | 21 (100.0%) | 0 (0.0%) |
| 3 or 4 Children | 19 (61.3%) | 12 (38.7%) |
| 5 or more Children | 9 (100.0%) | 0 (0.0%) |
| Total | 134 (89.9%) | 15 (10.1%) |
Income Below Poverty Among Single-Parent Households in Sharon Springs
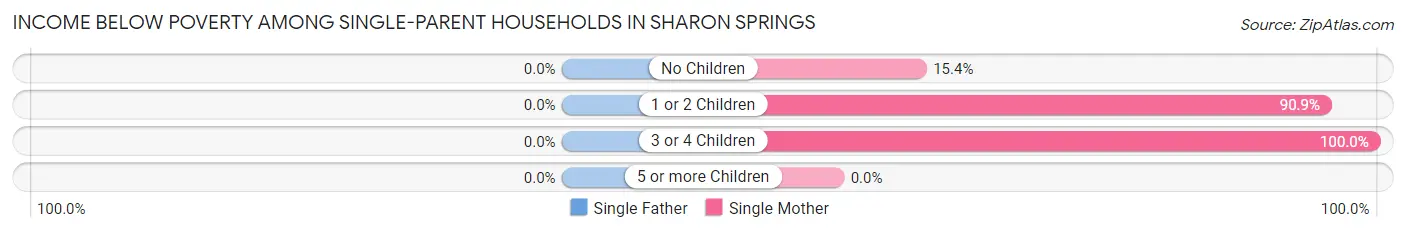
| Children | Single Father | Single Mother |
| No Children | 0 (0.0%) | 2 (15.4%) |
| 1 or 2 Children | 0 (0.0%) | 20 (90.9%) |
| 3 or 4 Children | 0 (0.0%) | 10 (100.0%) |
| 5 or more Children | 0 (0.0%) | 0 (0.0%) |
| Total | 0 (0.0%) | 32 (71.1%) |
Income Below Poverty Among Married-Couple vs Single-Parent Households in Sharon Springs
The poverty data for Sharon Springs shows that 15 of the married-couple family households (10.1%) and 32 of the single-parent households (38.1%) are living below the poverty level. Within the married-couple family households, those with 3 or 4 children have the highest poverty rate, with 12 households (38.7%) falling below the poverty line. Among the single-parent households, those with 3 or 4 children have the highest poverty rate, with 10 household (100.0%) living below poverty.
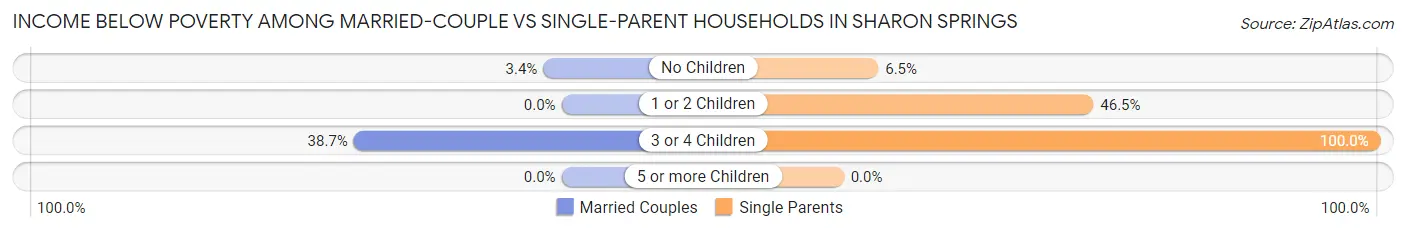
| Children | Married-Couple Families | Single-Parent Households |
| No Children | 3 (3.4%) | 2 (6.5%) |
| 1 or 2 Children | 0 (0.0%) | 20 (46.5%) |
| 3 or 4 Children | 12 (38.7%) | 10 (100.0%) |
| 5 or more Children | 0 (0.0%) | 0 (0.0%) |
| Total | 15 (10.1%) | 32 (38.1%) |
Race in Sharon Springs
The most populous races in Sharon Springs are White / Caucasian (808 | 93.0%), Hispanic or Latino (52 | 6.0%), and Two or more Races (30 | 3.5%).
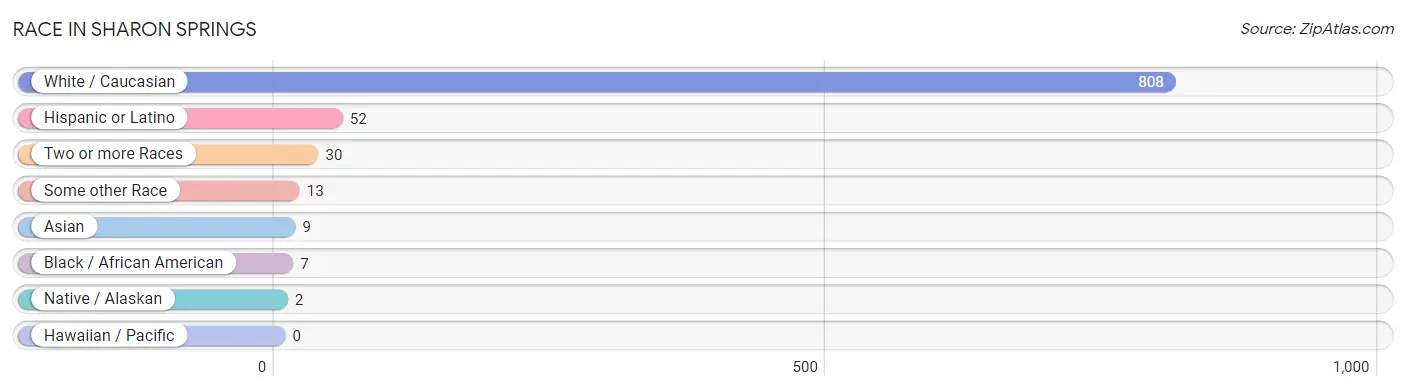
| Race | # Population | % Population |
| Asian | 9 | 1.0% |
| Black / African American | 7 | 0.8% |
| Hawaiian / Pacific | 0 | 0.0% |
| Hispanic or Latino | 52 | 6.0% |
| Native / Alaskan | 2 | 0.2% |
| White / Caucasian | 808 | 93.0% |
| Two or more Races | 30 | 3.5% |
| Some other Race | 13 | 1.5% |
| Total | 869 | 100.0% |
Ancestry in Sharon Springs
The most populous ancestries reported in Sharon Springs are German (235 | 27.0%), English (123 | 14.1%), Irish (83 | 9.6%), American (52 | 6.0%), and Mexican (50 | 5.8%), together accounting for 62.5% of all Sharon Springs residents.
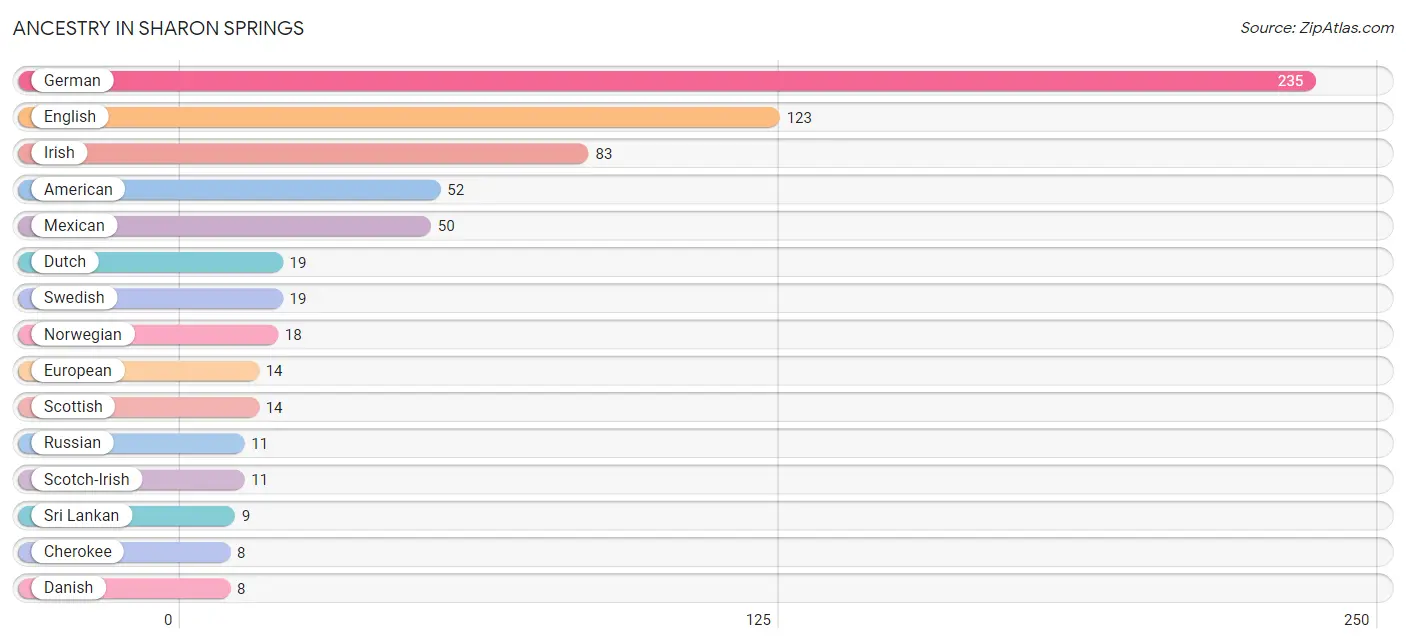
| Ancestry | # Population | % Population |
| American | 52 | 6.0% |
| Cherokee | 8 | 0.9% |
| Danish | 8 | 0.9% |
| Dutch | 19 | 2.2% |
| English | 123 | 14.1% |
| European | 14 | 1.6% |
| Finnish | 1 | 0.1% |
| French | 3 | 0.4% |
| German | 235 | 27.0% |
| Irish | 83 | 9.6% |
| Italian | 3 | 0.4% |
| Mexican | 50 | 5.8% |
| Mexican American Indian | 2 | 0.2% |
| Norwegian | 18 | 2.1% |
| Russian | 11 | 1.3% |
| Scotch-Irish | 11 | 1.3% |
| Scottish | 14 | 1.6% |
| Sri Lankan | 9 | 1.0% |
| Swedish | 19 | 2.2% |
| Swiss | 8 | 0.9% |
| Welsh | 6 | 0.7% | View All 21 Rows |
Immigrants in Sharon Springs
The most numerous immigrant groups reported in Sharon Springs came from Central America (25 | 2.9%), Latin America (25 | 2.9%), Mexico (25 | 2.9%), Asia (9 | 1.0%), and South Eastern Asia (9 | 1.0%), together accounting for 10.7% of all Sharon Springs residents.
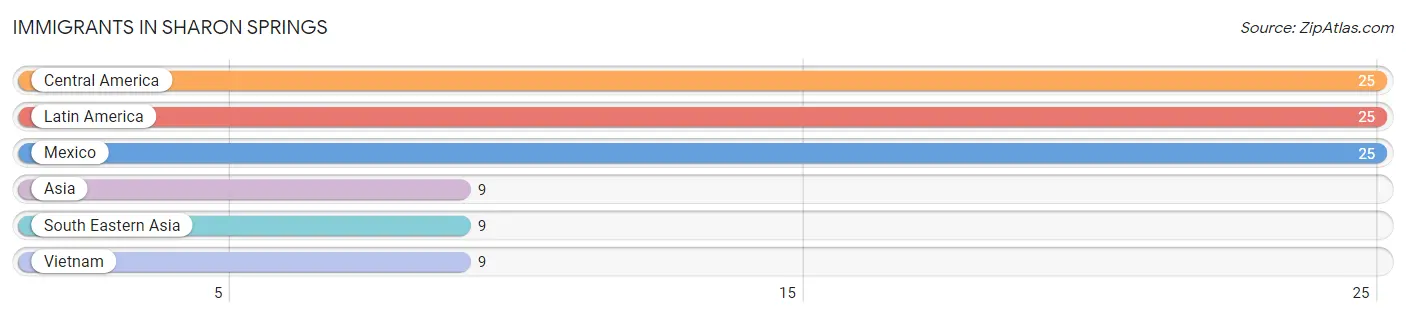
| Immigration Origin | # Population | % Population |
| Asia | 9 | 1.0% |
| Central America | 25 | 2.9% |
| Latin America | 25 | 2.9% |
| Mexico | 25 | 2.9% |
| South Eastern Asia | 9 | 1.0% |
| Vietnam | 9 | 1.0% | View All 6 Rows |
Sex and Age in Sharon Springs
Sex and Age in Sharon Springs
The most populous age groups in Sharon Springs are Under 5 Years (46 | 10.4%) for men and 70 to 74 Years (45 | 10.6%) for women.
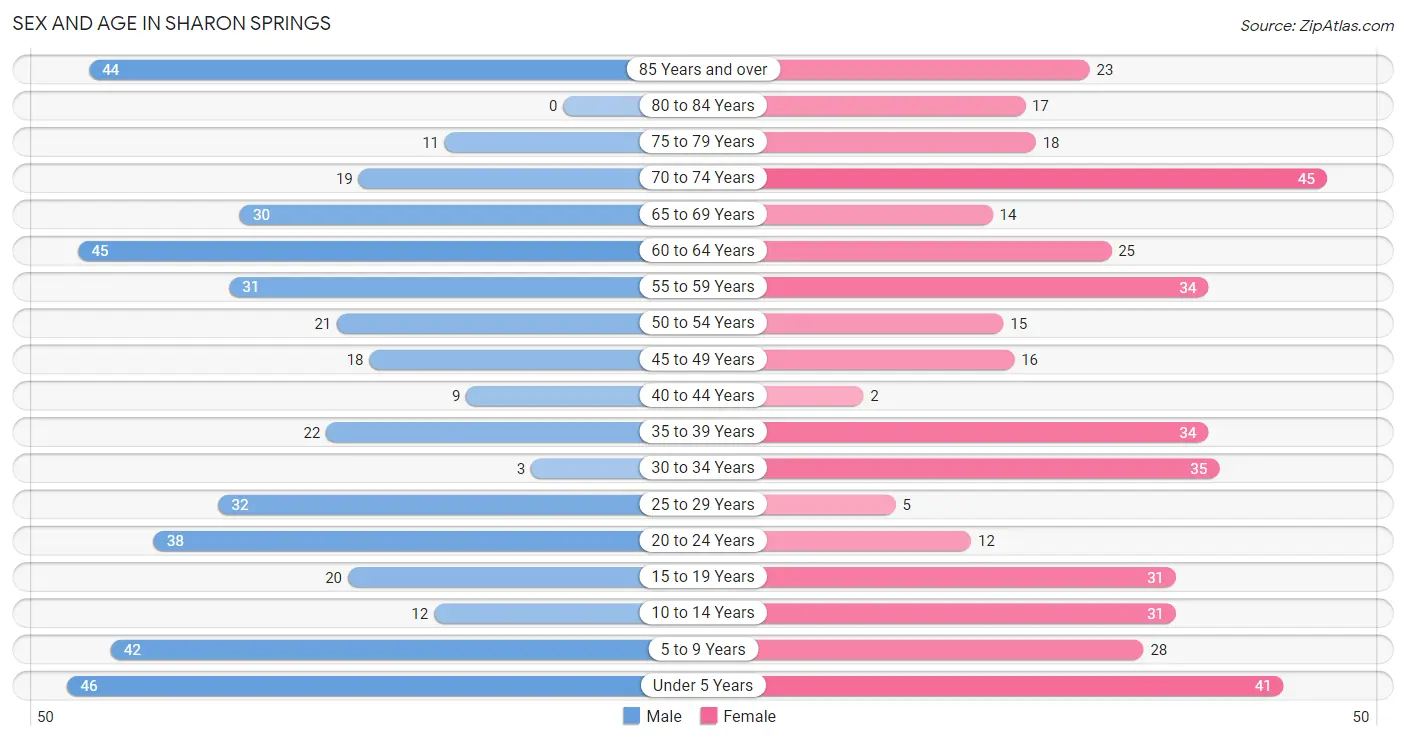
| Age Bracket | Male | Female |
| Under 5 Years | 46 (10.4%) | 41 (9.6%) |
| 5 to 9 Years | 42 (9.5%) | 28 (6.6%) |
| 10 to 14 Years | 12 (2.7%) | 31 (7.3%) |
| 15 to 19 Years | 20 (4.5%) | 31 (7.3%) |
| 20 to 24 Years | 38 (8.6%) | 12 (2.8%) |
| 25 to 29 Years | 32 (7.2%) | 5 (1.2%) |
| 30 to 34 Years | 3 (0.7%) | 35 (8.2%) |
| 35 to 39 Years | 22 (5.0%) | 34 (8.0%) |
| 40 to 44 Years | 9 (2.0%) | 2 (0.5%) |
| 45 to 49 Years | 18 (4.1%) | 16 (3.8%) |
| 50 to 54 Years | 21 (4.7%) | 15 (3.5%) |
| 55 to 59 Years | 31 (7.0%) | 34 (8.0%) |
| 60 to 64 Years | 45 (10.2%) | 25 (5.9%) |
| 65 to 69 Years | 30 (6.8%) | 14 (3.3%) |
| 70 to 74 Years | 19 (4.3%) | 45 (10.6%) |
| 75 to 79 Years | 11 (2.5%) | 18 (4.2%) |
| 80 to 84 Years | 0 (0.0%) | 17 (4.0%) |
| 85 Years and over | 44 (9.9%) | 23 (5.4%) |
| Total | 443 (100.0%) | 426 (100.0%) |
Families and Households in Sharon Springs
Median Family Size in Sharon Springs
The median family size in Sharon Springs is 2.90 persons per family, with married-couple families (149 | 63.9%) accounting for the largest median family size of 3.49 persons per family. On the other hand, single male/father families (39 | 16.7%) represent the smallest median family size with 1.38 persons per family.
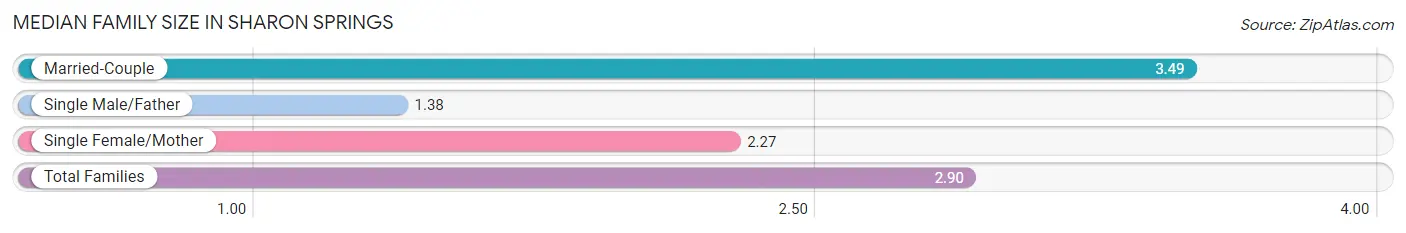
| Family Type | # Families | Family Size |
| Married-Couple | 149 (63.9%) | 3.49 |
| Single Male/Father | 39 (16.7%) | 1.38 |
| Single Female/Mother | 45 (19.3%) | 2.27 |
| Total Families | 233 (100.0%) | 2.90 |
Median Household Size in Sharon Springs
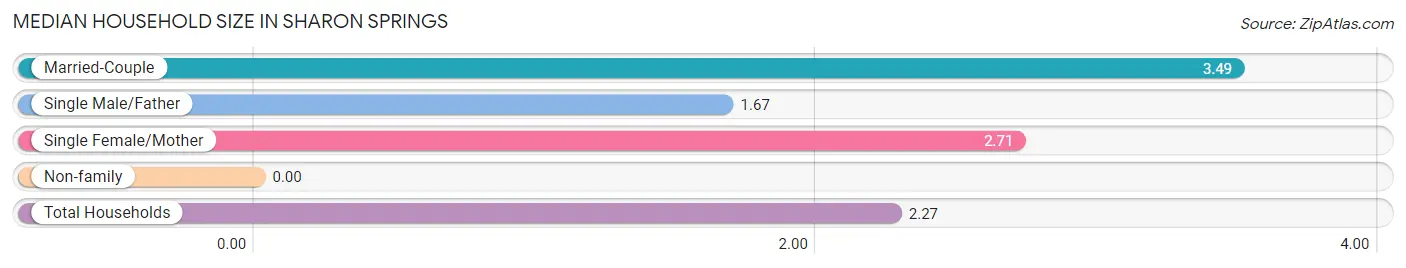
| Household Type | # Households | Household Size |
| Married-Couple | 149 (40.1%) | 3.49 |
| Single Male/Father | 39 (10.5%) | 1.67 |
| Single Female/Mother | 45 (12.1%) | 2.71 |
| Non-family | 139 (37.4%) | - |
| Total Households | 372 (100.0%) | 2.27 |
Household Size by Marriage Status in Sharon Springs
Out of a total of 372 households in Sharon Springs, 233 (62.6%) are family households, while 139 (37.4%) are nonfamily households. The most numerous type of family households are 2-person households, comprising 90, and the most common type of nonfamily households are 1-person households, comprising 139.
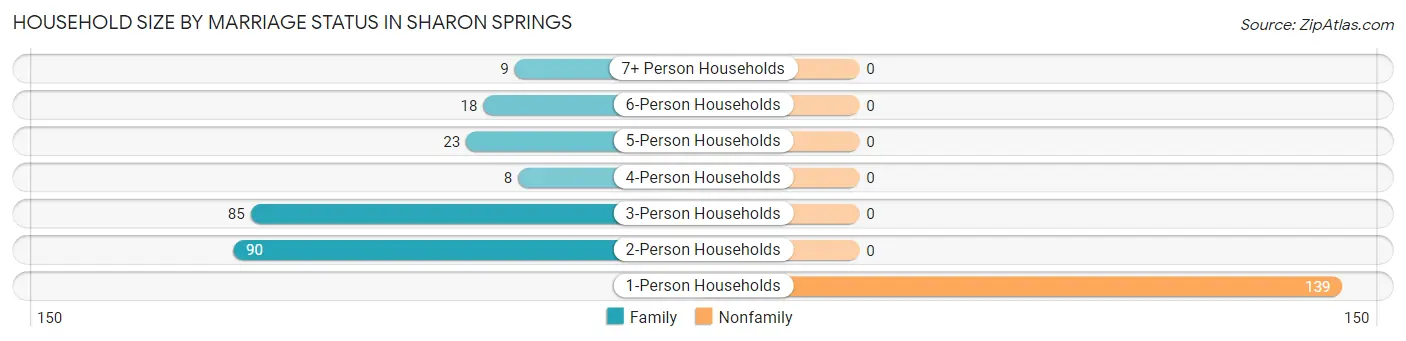
| Household Size | Family Households | Nonfamily Households |
| 1-Person Households | - | 139 (37.4%) |
| 2-Person Households | 90 (24.2%) | 0 (0.0%) |
| 3-Person Households | 85 (22.9%) | 0 (0.0%) |
| 4-Person Households | 8 (2.1%) | 0 (0.0%) |
| 5-Person Households | 23 (6.2%) | 0 (0.0%) |
| 6-Person Households | 18 (4.8%) | 0 (0.0%) |
| 7+ Person Households | 9 (2.4%) | 0 (0.0%) |
| Total | 233 (62.6%) | 139 (37.4%) |
Female Fertility in Sharon Springs
Fertility by Age in Sharon Springs
Average fertility rate in Sharon Springs is 259.0 births per 1,000 women. Women in the age bracket of 15 to 19 years have the highest fertility rate with 645.0 births per 1,000 women. Women in the age bracket of 15 to 19 years acount for 54.0% of all women with births.
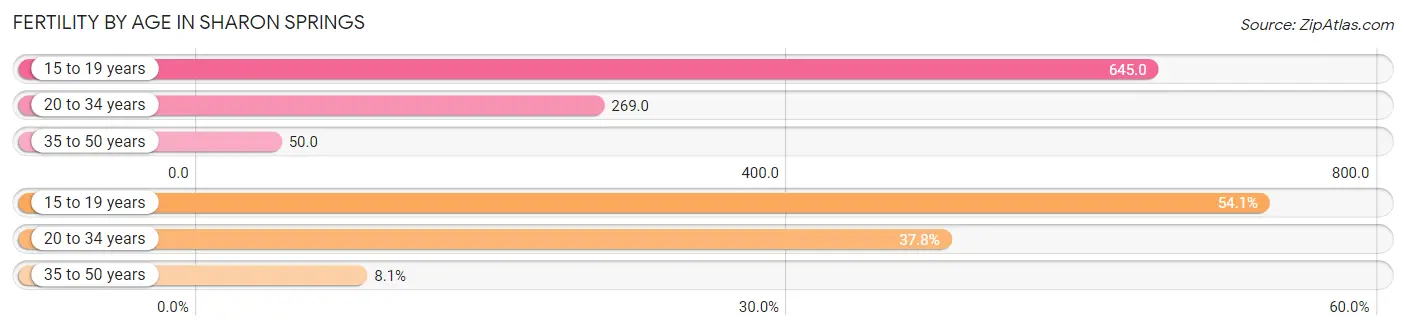
| Age Bracket | Women with Births | Births / 1,000 Women |
| 15 to 19 years | 20 (54.0%) | 645.0 |
| 20 to 34 years | 14 (37.8%) | 269.0 |
| 35 to 50 years | 3 (8.1%) | 50.0 |
| Total | 37 (100.0%) | 259.0 |
Fertility by Age by Marriage Status in Sharon Springs
45.9% of women with births (37) in Sharon Springs are married. The highest percentage of unmarried women with births falls into 15 to 19 years age bracket with 100.0% of them unmarried at the time of birth, while the lowest percentage of unmarried women with births belong to 20 to 34 years age bracket with 0.0% of them unmarried.
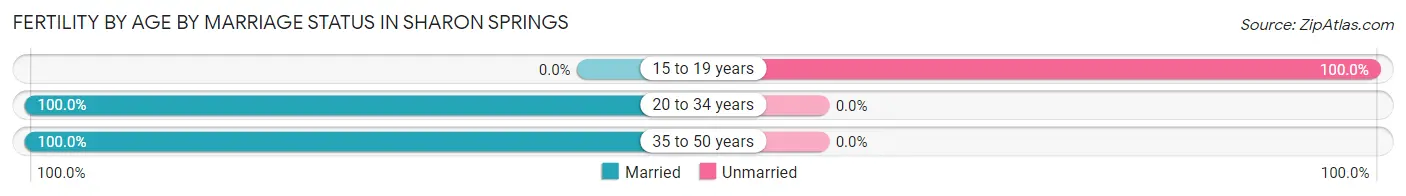
| Age Bracket | Married | Unmarried |
| 15 to 19 years | 0 (0.0%) | 20 (100.0%) |
| 20 to 34 years | 14 (100.0%) | 0 (0.0%) |
| 35 to 50 years | 3 (100.0%) | 0 (0.0%) |
| Total | 17 (46.0%) | 20 (54.0%) |
Fertility by Education in Sharon Springs
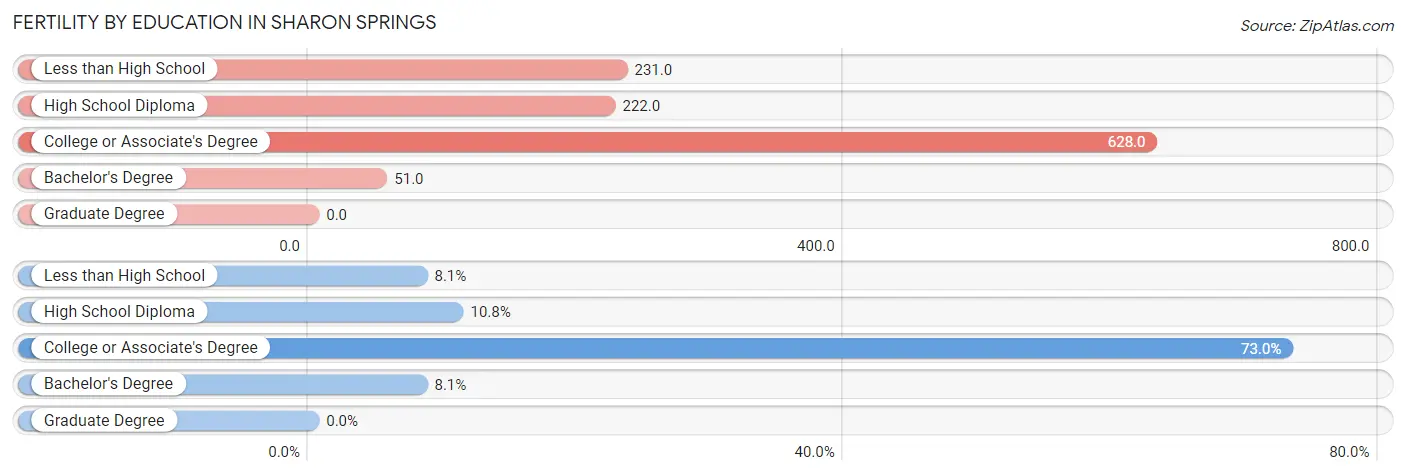
| Educational Attainment | Women with Births | Births / 1,000 Women |
| Less than High School | 3 (8.1%) | 231.0 |
| High School Diploma | 4 (10.8%) | 222.0 |
| College or Associate's Degree | 27 (73.0%) | 628.0 |
| Bachelor's Degree | 3 (8.1%) | 51.0 |
| Graduate Degree | 0 (0.0%) | 0.0 |
| Total | 37 (100.0%) | 259.0 |
Fertility by Education by Marriage Status in Sharon Springs
54.0% of women with births in Sharon Springs are unmarried. Women with the educational attainment of less than high school are most likely to be married with 100.0% of them married at childbirth, while women with the educational attainment of college or associate's degree are least likely to be married with 74.1% of them unmarried at childbirth.
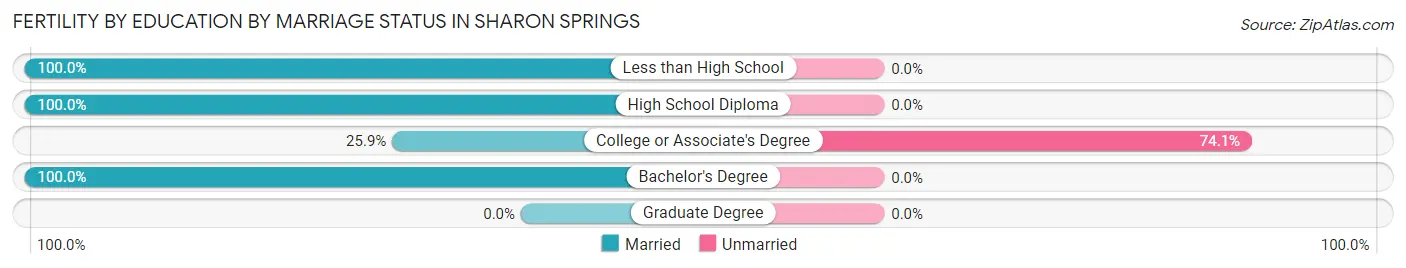
| Educational Attainment | Married | Unmarried |
| Less than High School | 3 (100.0%) | 0 (0.0%) |
| High School Diploma | 4 (100.0%) | 0 (0.0%) |
| College or Associate's Degree | 7 (25.9%) | 20 (74.1%) |
| Bachelor's Degree | 3 (100.0%) | 0 (0.0%) |
| Graduate Degree | 0 (0.0%) | 0 (0.0%) |
| Total | 17 (46.0%) | 20 (54.0%) |
Employment Characteristics in Sharon Springs
Employment by Class of Employer in Sharon Springs
Among the 345 employed individuals in Sharon Springs, private company employees (192 | 55.6%), local government employees (51 | 14.8%), and self-employed (incorporated) (36 | 10.4%) make up the most common classes of employment.
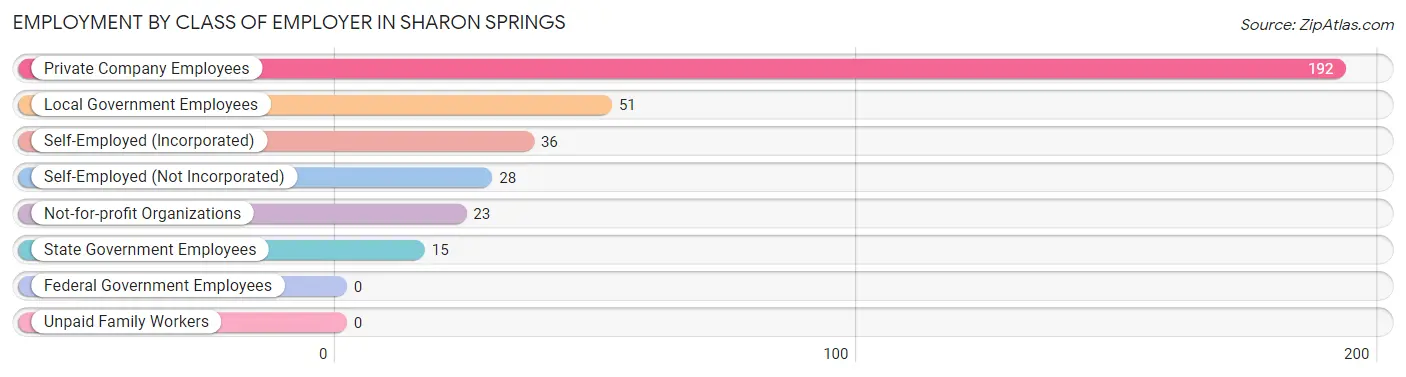
| Employer Class | # Employees | % Employees |
| Private Company Employees | 192 | 55.6% |
| Self-Employed (Incorporated) | 36 | 10.4% |
| Self-Employed (Not Incorporated) | 28 | 8.1% |
| Not-for-profit Organizations | 23 | 6.7% |
| Local Government Employees | 51 | 14.8% |
| State Government Employees | 15 | 4.3% |
| Federal Government Employees | 0 | 0.0% |
| Unpaid Family Workers | 0 | 0.0% |
| Total | 345 | 100.0% |
Employment Status by Age in Sharon Springs
According to the labor force statistics for Sharon Springs, out of the total population over 16 years of age (665), 55.3% or 368 individuals are in the labor force, with 3.5% or 13 of them unemployed. The age group with the highest labor force participation rate is 30 to 34 years, with 94.7% or 36 individuals in the labor force. Within the labor force, the 65 to 74 years age range has the highest percentage of unemployed individuals, with 21.0% or 13 of them being unemployed.
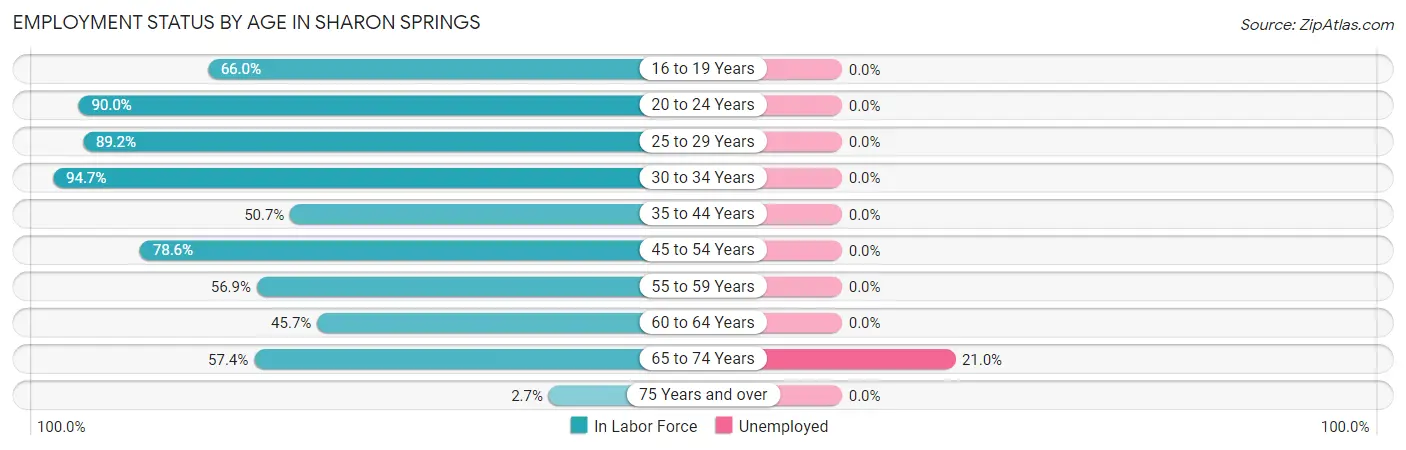
| Age Bracket | In Labor Force | Unemployed |
| 16 to 19 Years | 31 (66.0%) | 0 (0.0%) |
| 20 to 24 Years | 45 (90.0%) | 0 (0.0%) |
| 25 to 29 Years | 33 (89.2%) | 0 (0.0%) |
| 30 to 34 Years | 36 (94.7%) | 0 (0.0%) |
| 35 to 44 Years | 34 (50.7%) | 0 (0.0%) |
| 45 to 54 Years | 55 (78.6%) | 0 (0.0%) |
| 55 to 59 Years | 37 (56.9%) | 0 (0.0%) |
| 60 to 64 Years | 32 (45.7%) | 0 (0.0%) |
| 65 to 74 Years | 62 (57.4%) | 13 (21.0%) |
| 75 Years and over | 3 (2.7%) | 0 (0.0%) |
| Total | 368 (55.3%) | 13 (3.5%) |
Employment Status by Educational Attainment in Sharon Springs
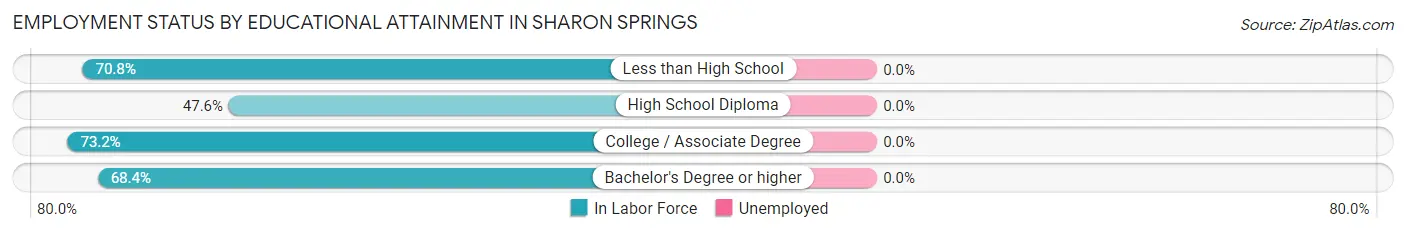
| Educational Attainment | In Labor Force | Unemployed |
| Less than High School | 17 (70.8%) | 0 (0.0%) |
| High School Diploma | 39 (47.6%) | 0 (0.0%) |
| College / Associate Degree | 93 (73.2%) | 0 (0.0%) |
| Bachelor's Degree or higher | 78 (68.4%) | 0 (0.0%) |
| Total | 227 (65.4%) | 0 (0.0%) |
Employment Occupations by Sex in Sharon Springs
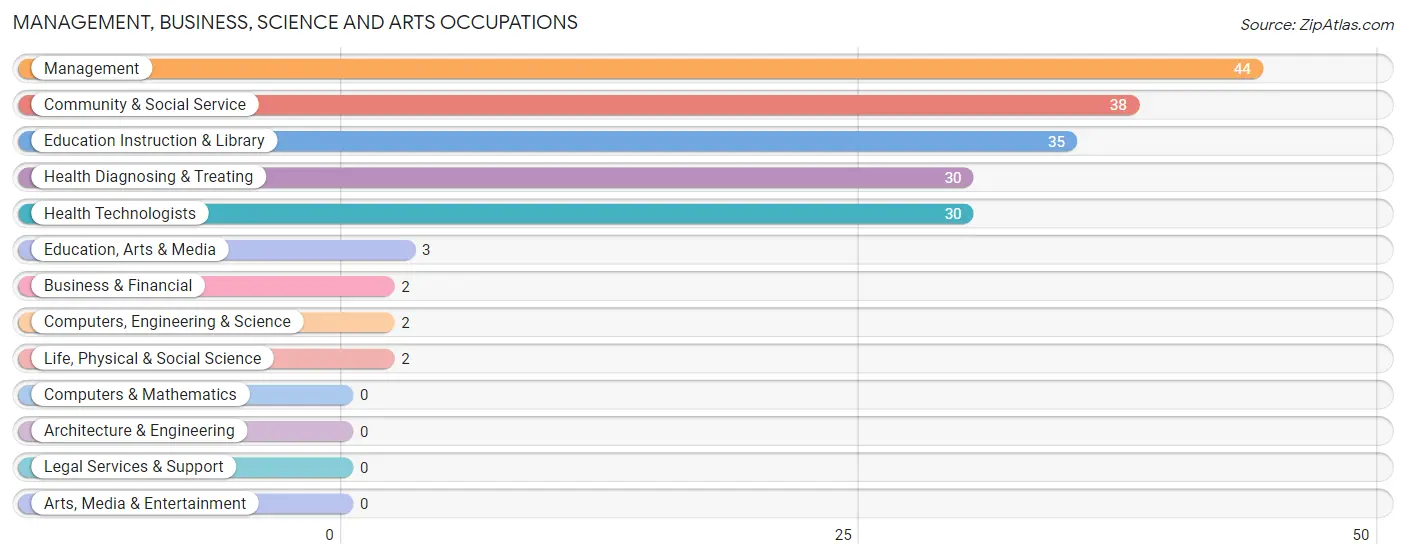
Management, Business, Science and Arts Occupations
The most common Management, Business, Science and Arts occupations in Sharon Springs are Management (44 | 12.4%), Community & Social Service (38 | 10.7%), Education Instruction & Library (35 | 9.9%), Health Diagnosing & Treating (30 | 8.5%), and Health Technologists (30 | 8.5%).
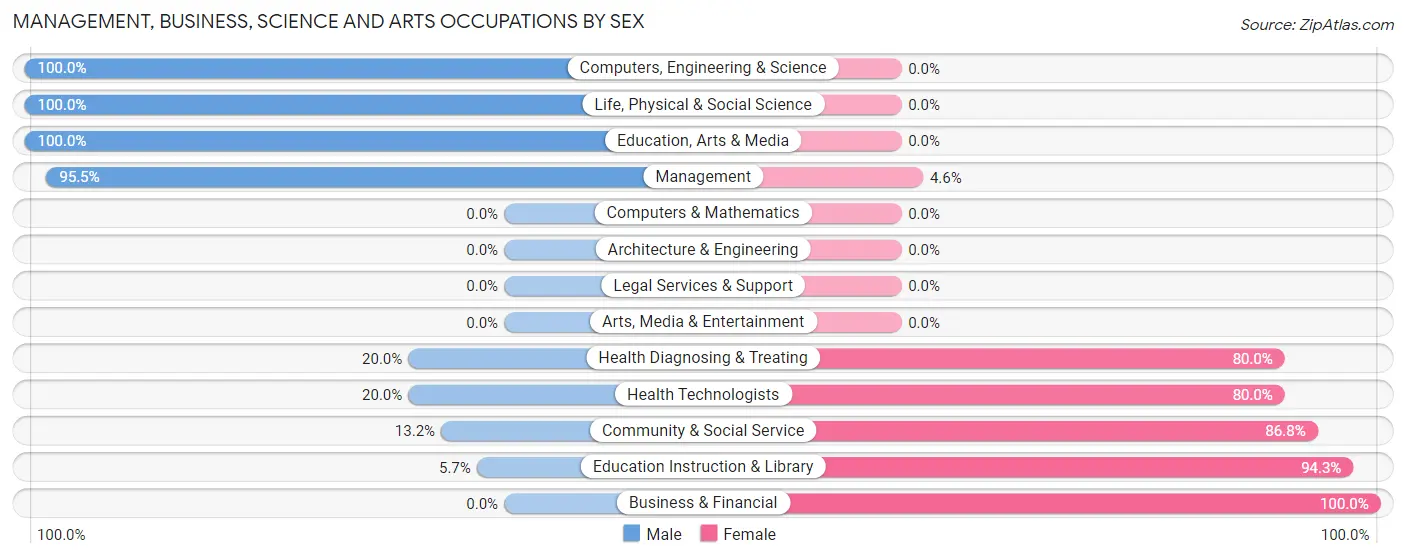
Management, Business, Science and Arts Occupations by Sex
Within the Management, Business, Science and Arts occupations in Sharon Springs, the most male-oriented occupations are Computers, Engineering & Science (100.0%), Life, Physical & Social Science (100.0%), and Education, Arts & Media (100.0%), while the most female-oriented occupations are Business & Financial (100.0%), Education Instruction & Library (94.3%), and Community & Social Service (86.8%).
| Occupation | Male | Female |
| Management | 42 (95.5%) | 2 (4.5%) |
| Business & Financial | 0 (0.0%) | 2 (100.0%) |
| Computers, Engineering & Science | 2 (100.0%) | 0 (0.0%) |
| Computers & Mathematics | 0 (0.0%) | 0 (0.0%) |
| Architecture & Engineering | 0 (0.0%) | 0 (0.0%) |
| Life, Physical & Social Science | 2 (100.0%) | 0 (0.0%) |
| Community & Social Service | 5 (13.2%) | 33 (86.8%) |
| Education, Arts & Media | 3 (100.0%) | 0 (0.0%) |
| Legal Services & Support | 0 (0.0%) | 0 (0.0%) |
| Education Instruction & Library | 2 (5.7%) | 33 (94.3%) |
| Arts, Media & Entertainment | 0 (0.0%) | 0 (0.0%) |
| Health Diagnosing & Treating | 6 (20.0%) | 24 (80.0%) |
| Health Technologists | 6 (20.0%) | 24 (80.0%) |
| Total (Category) | 55 (47.4%) | 61 (52.6%) |
| Total (Overall) | 180 (50.7%) | 175 (49.3%) |
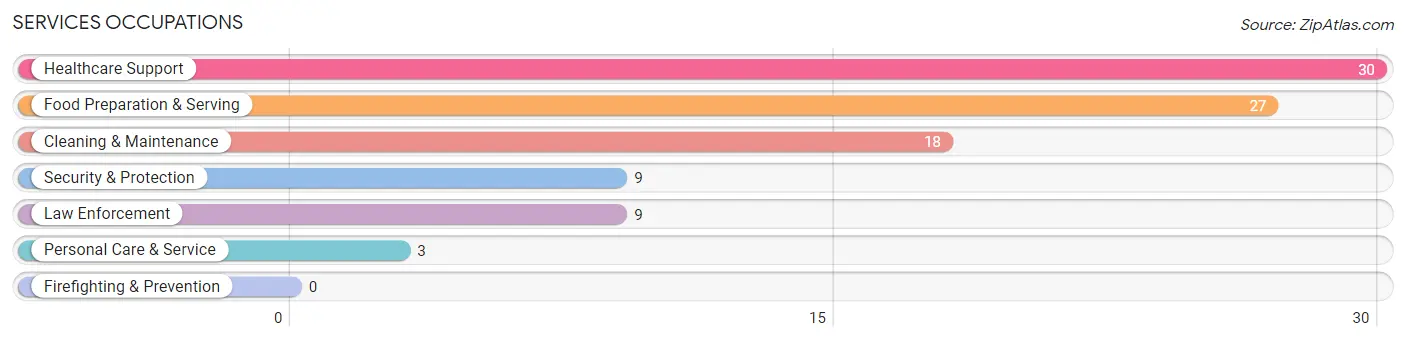
Services Occupations
The most common Services occupations in Sharon Springs are Healthcare Support (30 | 8.5%), Food Preparation & Serving (27 | 7.6%), Cleaning & Maintenance (18 | 5.1%), Security & Protection (9 | 2.5%), and Law Enforcement (9 | 2.5%).
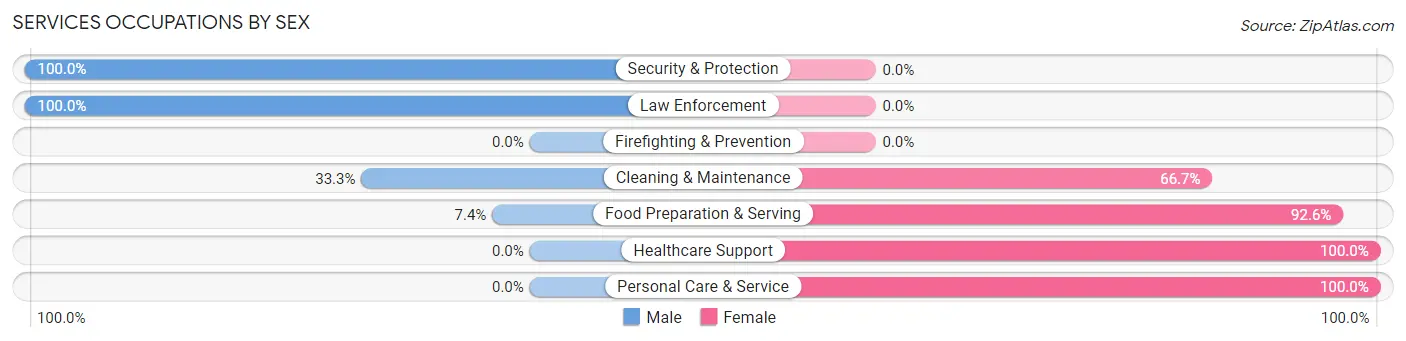
Services Occupations by Sex
Within the Services occupations in Sharon Springs, the most male-oriented occupations are Security & Protection (100.0%), Law Enforcement (100.0%), and Cleaning & Maintenance (33.3%), while the most female-oriented occupations are Healthcare Support (100.0%), Personal Care & Service (100.0%), and Food Preparation & Serving (92.6%).
| Occupation | Male | Female |
| Healthcare Support | 0 (0.0%) | 30 (100.0%) |
| Security & Protection | 9 (100.0%) | 0 (0.0%) |
| Firefighting & Prevention | 0 (0.0%) | 0 (0.0%) |
| Law Enforcement | 9 (100.0%) | 0 (0.0%) |
| Food Preparation & Serving | 2 (7.4%) | 25 (92.6%) |
| Cleaning & Maintenance | 6 (33.3%) | 12 (66.7%) |
| Personal Care & Service | 0 (0.0%) | 3 (100.0%) |
| Total (Category) | 17 (19.5%) | 70 (80.5%) |
| Total (Overall) | 180 (50.7%) | 175 (49.3%) |
Sales and Office Occupations
The most common Sales and Office occupations in Sharon Springs are Office & Administration (37 | 10.4%), and Sales & Related (16 | 4.5%).
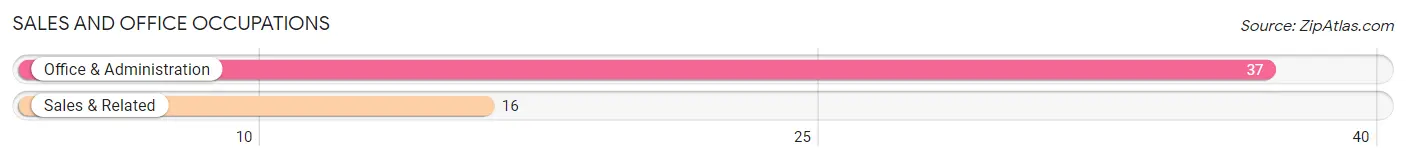
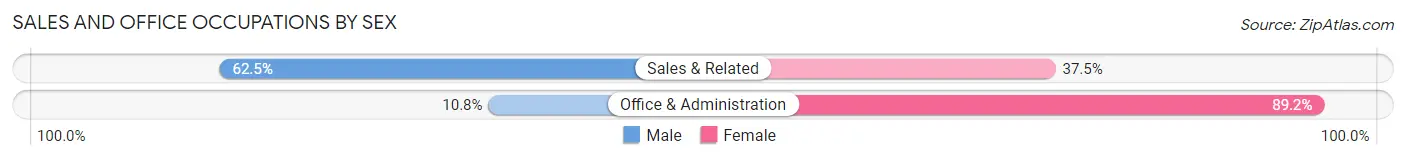
Sales and Office Occupations by Sex
| Occupation | Male | Female |
| Sales & Related | 10 (62.5%) | 6 (37.5%) |
| Office & Administration | 4 (10.8%) | 33 (89.2%) |
| Total (Category) | 14 (26.4%) | 39 (73.6%) |
| Total (Overall) | 180 (50.7%) | 175 (49.3%) |
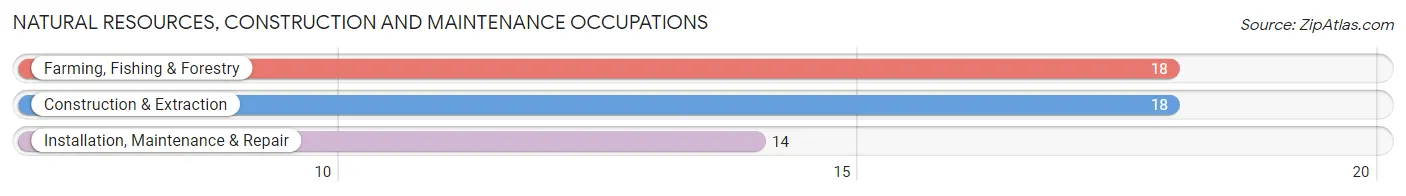
Natural Resources, Construction and Maintenance Occupations
The most common Natural Resources, Construction and Maintenance occupations in Sharon Springs are Farming, Fishing & Forestry (18 | 5.1%), Construction & Extraction (18 | 5.1%), and Installation, Maintenance & Repair (14 | 3.9%).
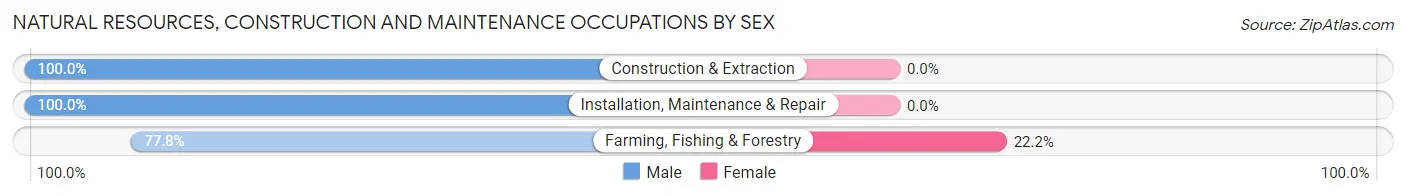
Natural Resources, Construction and Maintenance Occupations by Sex
| Occupation | Male | Female |
| Farming, Fishing & Forestry | 14 (77.8%) | 4 (22.2%) |
| Construction & Extraction | 18 (100.0%) | 0 (0.0%) |
| Installation, Maintenance & Repair | 14 (100.0%) | 0 (0.0%) |
| Total (Category) | 46 (92.0%) | 4 (8.0%) |
| Total (Overall) | 180 (50.7%) | 175 (49.3%) |
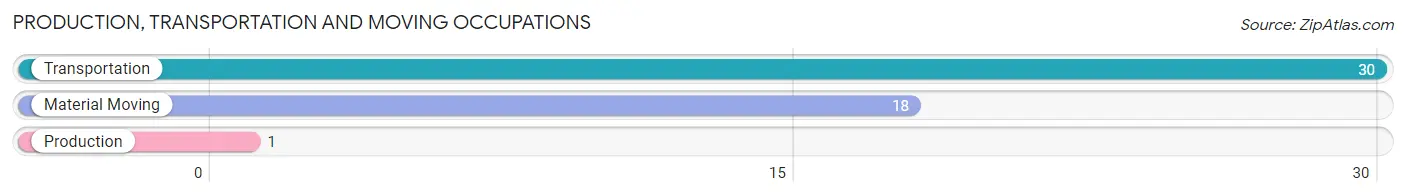
Production, Transportation and Moving Occupations
The most common Production, Transportation and Moving occupations in Sharon Springs are Transportation (30 | 8.5%), Material Moving (18 | 5.1%), and Production (1 | 0.3%).
Production, Transportation and Moving Occupations by Sex
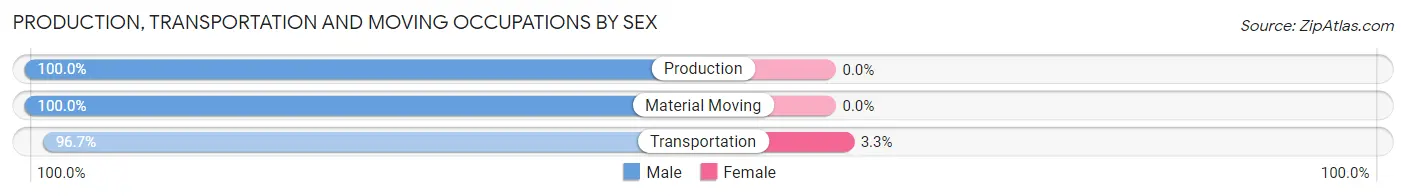
| Occupation | Male | Female |
| Production | 1 (100.0%) | 0 (0.0%) |
| Transportation | 29 (96.7%) | 1 (3.3%) |
| Material Moving | 18 (100.0%) | 0 (0.0%) |
| Total (Category) | 48 (98.0%) | 1 (2.0%) |
| Total (Overall) | 180 (50.7%) | 175 (49.3%) |
Employment Industries by Sex in Sharon Springs
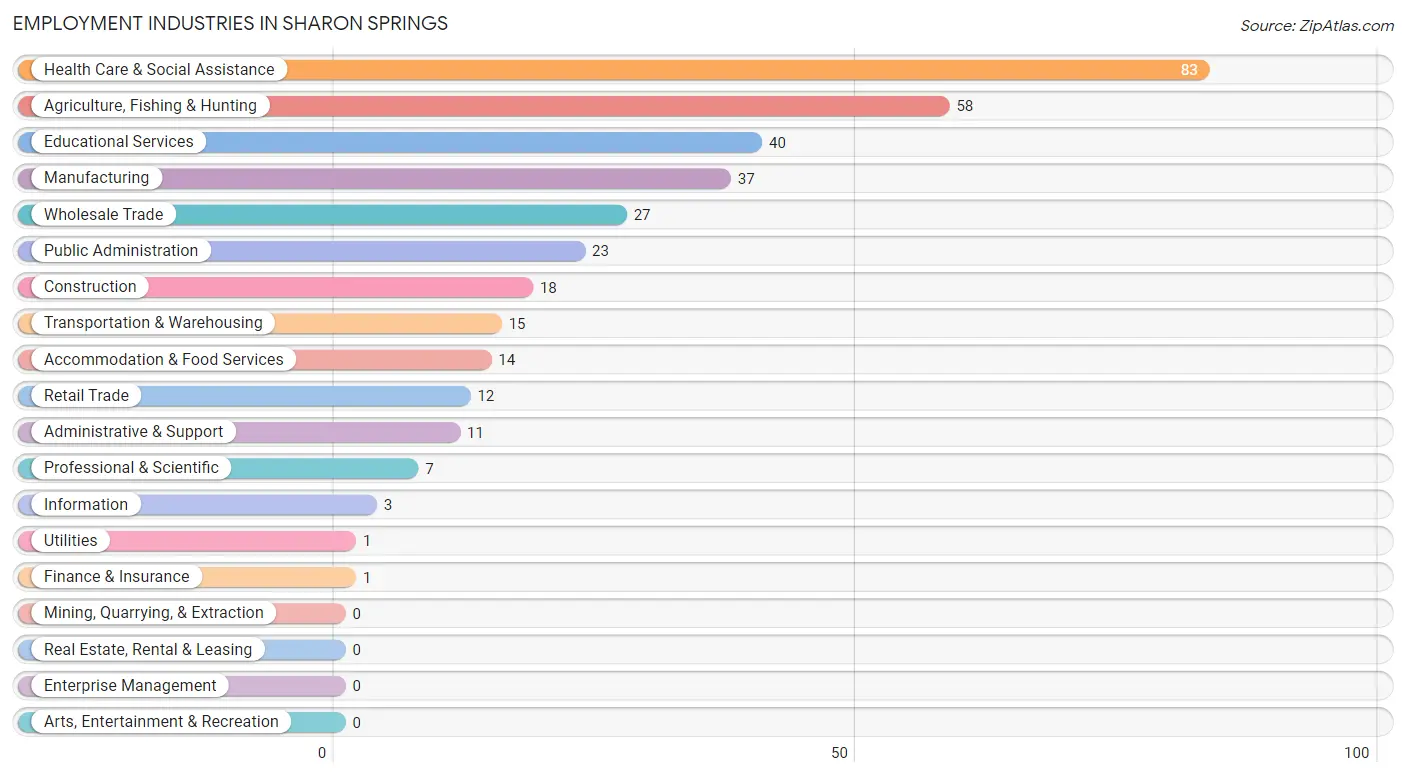
Employment Industries in Sharon Springs
The major employment industries in Sharon Springs include Health Care & Social Assistance (83 | 23.4%), Agriculture, Fishing & Hunting (58 | 16.3%), Educational Services (40 | 11.3%), Manufacturing (37 | 10.4%), and Wholesale Trade (27 | 7.6%).
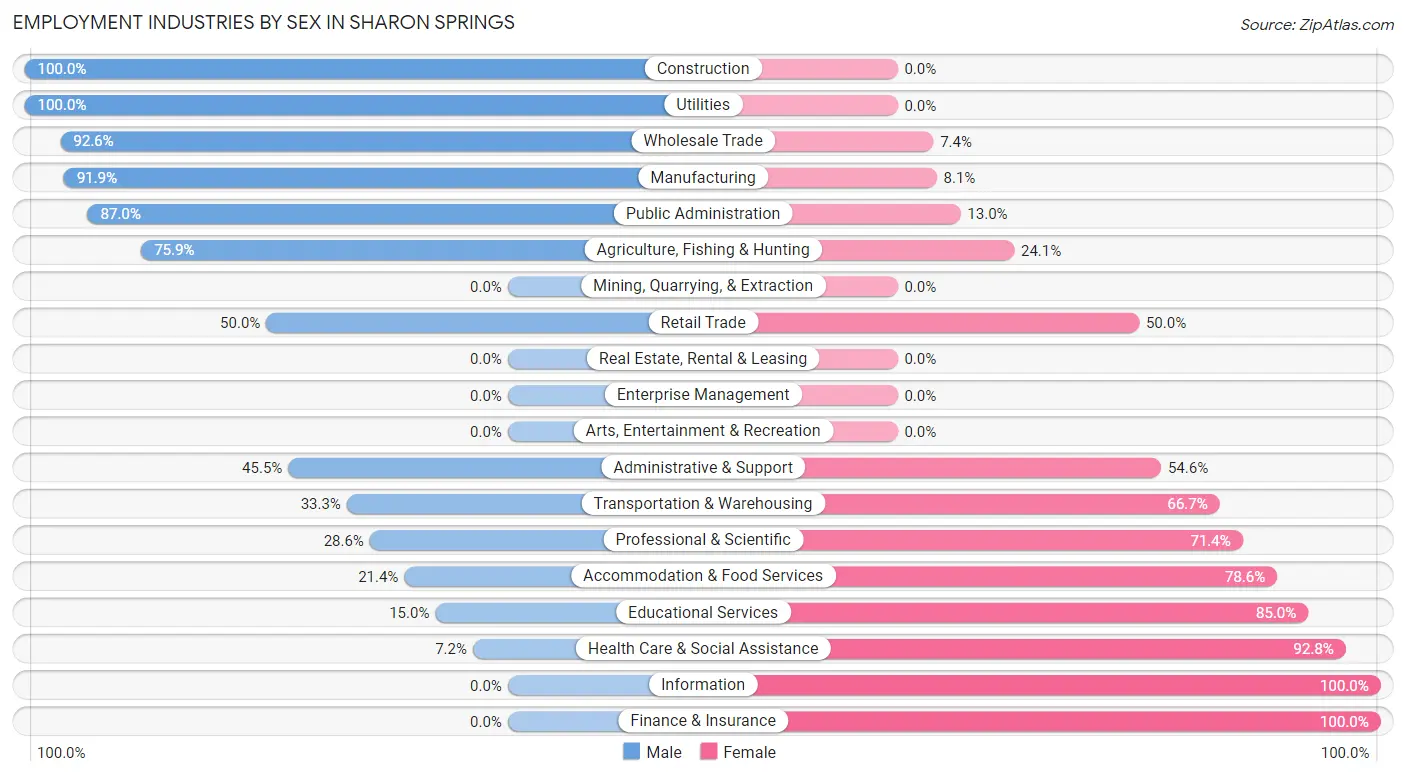
Employment Industries by Sex in Sharon Springs
The Sharon Springs industries that see more men than women are Construction (100.0%), Utilities (100.0%), and Wholesale Trade (92.6%), whereas the industries that tend to have a higher number of women are Information (100.0%), Finance & Insurance (100.0%), and Health Care & Social Assistance (92.8%).
| Industry | Male | Female |
| Agriculture, Fishing & Hunting | 44 (75.9%) | 14 (24.1%) |
| Mining, Quarrying, & Extraction | 0 (0.0%) | 0 (0.0%) |
| Construction | 18 (100.0%) | 0 (0.0%) |
| Manufacturing | 34 (91.9%) | 3 (8.1%) |
| Wholesale Trade | 25 (92.6%) | 2 (7.4%) |
| Retail Trade | 6 (50.0%) | 6 (50.0%) |
| Transportation & Warehousing | 5 (33.3%) | 10 (66.7%) |
| Utilities | 1 (100.0%) | 0 (0.0%) |
| Information | 0 (0.0%) | 3 (100.0%) |
| Finance & Insurance | 0 (0.0%) | 1 (100.0%) |
| Real Estate, Rental & Leasing | 0 (0.0%) | 0 (0.0%) |
| Professional & Scientific | 2 (28.6%) | 5 (71.4%) |
| Enterprise Management | 0 (0.0%) | 0 (0.0%) |
| Administrative & Support | 5 (45.5%) | 6 (54.5%) |
| Educational Services | 6 (15.0%) | 34 (85.0%) |
| Health Care & Social Assistance | 6 (7.2%) | 77 (92.8%) |
| Arts, Entertainment & Recreation | 0 (0.0%) | 0 (0.0%) |
| Accommodation & Food Services | 3 (21.4%) | 11 (78.6%) |
| Public Administration | 20 (87.0%) | 3 (13.0%) |
| Total | 180 (50.7%) | 175 (49.3%) |
Education in Sharon Springs
School Enrollment in Sharon Springs
The most common levels of schooling among the 169 students in Sharon Springs are elementary school (44 | 26.0%), middle school (36 | 21.3%), and nursery / preschool (34 | 20.1%).
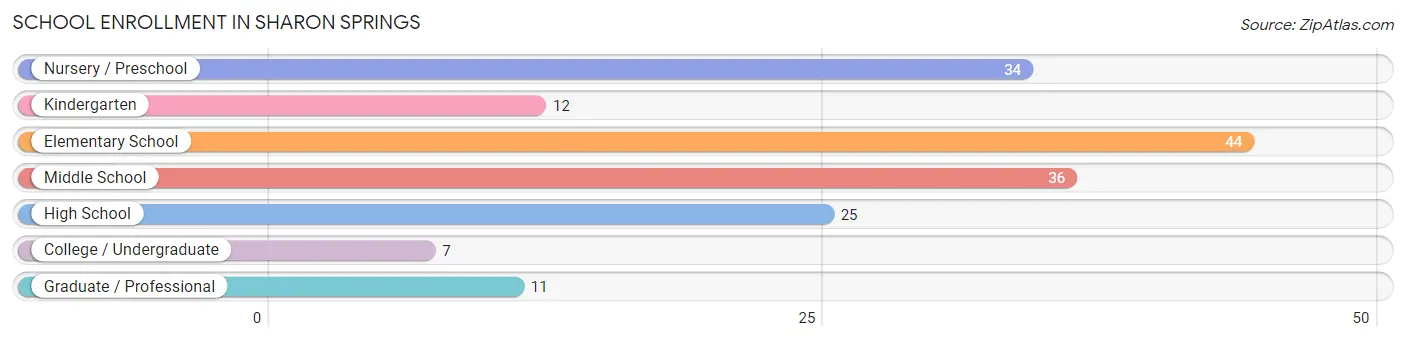
| School Level | # Students | % Students |
| Nursery / Preschool | 34 | 20.1% |
| Kindergarten | 12 | 7.1% |
| Elementary School | 44 | 26.0% |
| Middle School | 36 | 21.3% |
| High School | 25 | 14.8% |
| College / Undergraduate | 7 | 4.1% |
| Graduate / Professional | 11 | 6.5% |
| Total | 169 | 100.0% |
School Enrollment by Age by Funding Source in Sharon Springs
Out of a total of 169 students who are enrolled in schools in Sharon Springs, 16 (9.5%) attend a private institution, while the remaining 153 (90.5%) are enrolled in public schools. The age group of 15 to 17 year olds has the highest likelihood of being enrolled in private schools, with 8 (36.4% in the age bracket) enrolled. Conversely, the age group of 3 to 4 year olds has the lowest likelihood of being enrolled in a private school, with 21 (100.0% in the age bracket) attending a public institution.
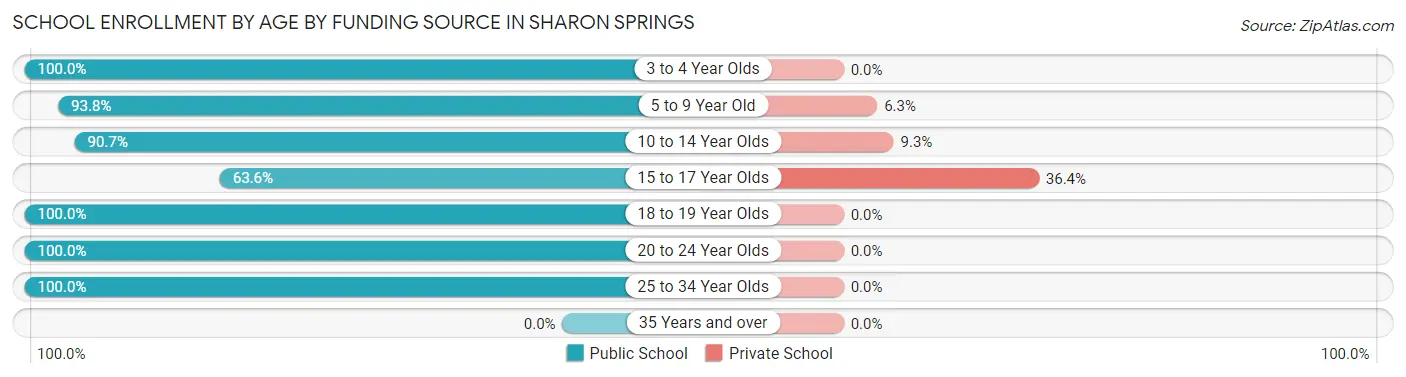
| Age Bracket | Public School | Private School |
| 3 to 4 Year Olds | 21 (100.0%) | 0 (0.0%) |
| 5 to 9 Year Old | 60 (93.8%) | 4 (6.2%) |
| 10 to 14 Year Olds | 39 (90.7%) | 4 (9.3%) |
| 15 to 17 Year Olds | 14 (63.6%) | 8 (36.4%) |
| 18 to 19 Year Olds | 3 (100.0%) | 0 (0.0%) |
| 20 to 24 Year Olds | 3 (100.0%) | 0 (0.0%) |
| 25 to 34 Year Olds | 13 (100.0%) | 0 (0.0%) |
| 35 Years and over | 0 (0.0%) | 0 (0.0%) |
| Total | 153 (90.5%) | 16 (9.5%) |
Educational Attainment by Field of Study in Sharon Springs
Education (37 | 29.4%), business (32 | 25.4%), science & technology (15 | 11.9%), bio, nature & agricultural (11 | 8.7%), and visual & performing arts (9 | 7.1%) are the most common fields of study among 126 individuals in Sharon Springs who have obtained a bachelor's degree or higher.
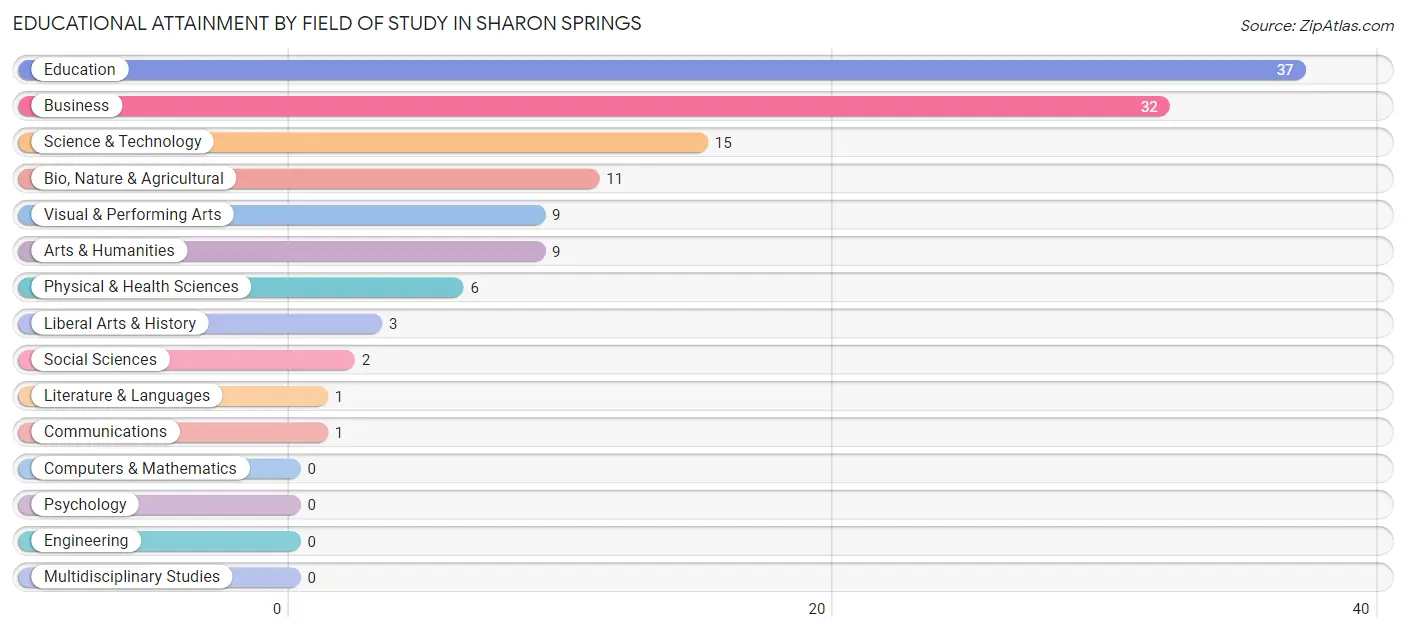
| Field of Study | # Graduates | % Graduates |
| Computers & Mathematics | 0 | 0.0% |
| Bio, Nature & Agricultural | 11 | 8.7% |
| Physical & Health Sciences | 6 | 4.8% |
| Psychology | 0 | 0.0% |
| Social Sciences | 2 | 1.6% |
| Engineering | 0 | 0.0% |
| Multidisciplinary Studies | 0 | 0.0% |
| Science & Technology | 15 | 11.9% |
| Business | 32 | 25.4% |
| Education | 37 | 29.4% |
| Literature & Languages | 1 | 0.8% |
| Liberal Arts & History | 3 | 2.4% |
| Visual & Performing Arts | 9 | 7.1% |
| Communications | 1 | 0.8% |
| Arts & Humanities | 9 | 7.1% |
| Total | 126 | 100.0% |
Transportation & Commute in Sharon Springs
Vehicle Availability by Sex in Sharon Springs
The most prevalent vehicle ownership categories in Sharon Springs are males with 3 vehicles (62, accounting for 34.4%) and females with 3 vehicles (39, making up 37.6%).
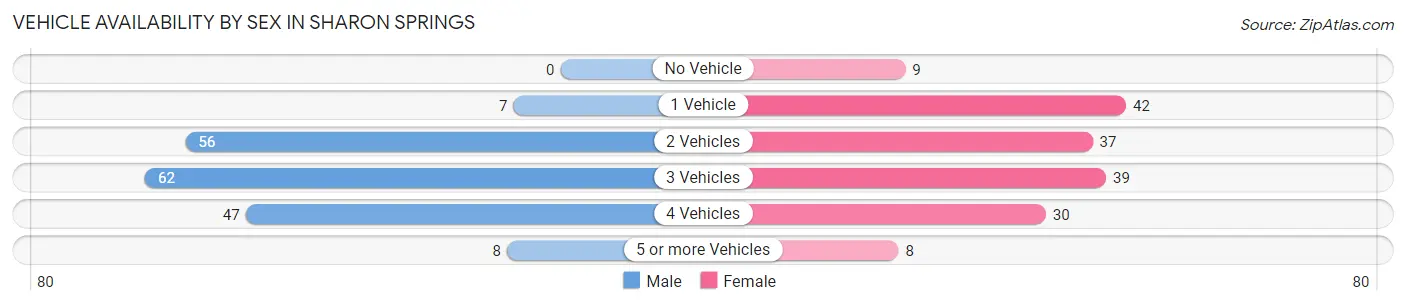
| Vehicles Available | Male | Female |
| No Vehicle | 0 (0.0%) | 9 (5.4%) |
| 1 Vehicle | 7 (3.9%) | 42 (25.5%) |
| 2 Vehicles | 56 (31.1%) | 37 (22.4%) |
| 3 Vehicles | 62 (34.4%) | 39 (23.6%) |
| 4 Vehicles | 47 (26.1%) | 30 (18.2%) |
| 5 or more Vehicles | 8 (4.4%) | 8 (4.9%) |
| Total | 180 (100.0%) | 165 (100.0%) |
Commute Time in Sharon Springs
The most frequently occuring commute durations in Sharon Springs are less than 5 minutes (105 commuters, 30.7%), 5 to 9 minutes (102 commuters, 29.8%), and 15 to 19 minutes (44 commuters, 12.9%).
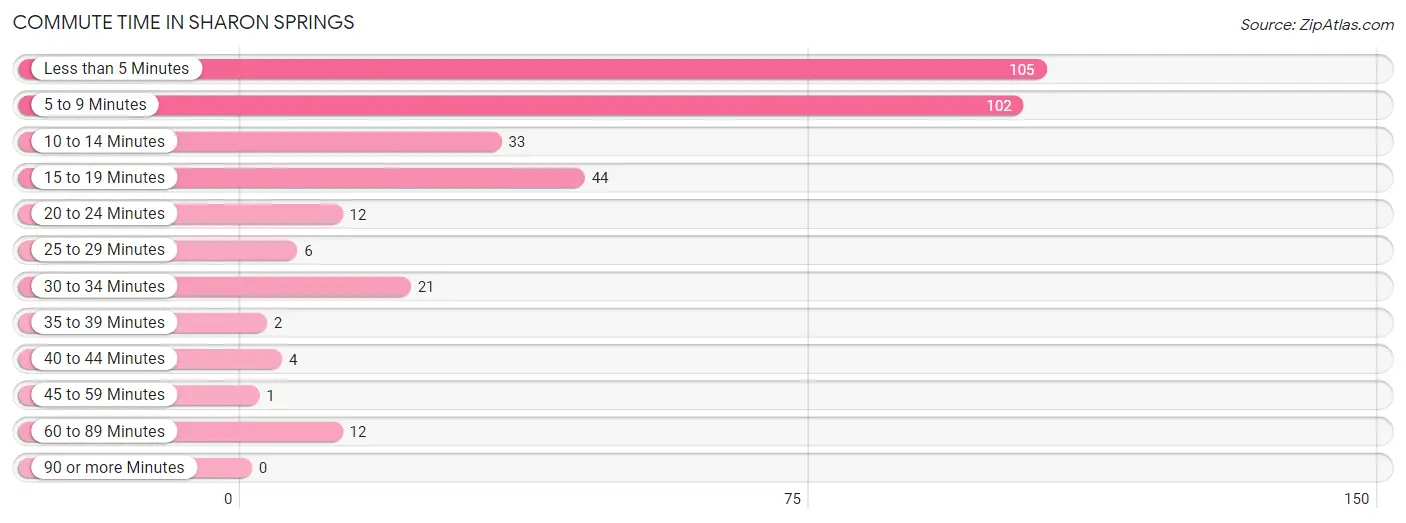
| Commute Time | # Commuters | % Commuters |
| Less than 5 Minutes | 105 | 30.7% |
| 5 to 9 Minutes | 102 | 29.8% |
| 10 to 14 Minutes | 33 | 9.7% |
| 15 to 19 Minutes | 44 | 12.9% |
| 20 to 24 Minutes | 12 | 3.5% |
| 25 to 29 Minutes | 6 | 1.8% |
| 30 to 34 Minutes | 21 | 6.1% |
| 35 to 39 Minutes | 2 | 0.6% |
| 40 to 44 Minutes | 4 | 1.2% |
| 45 to 59 Minutes | 1 | 0.3% |
| 60 to 89 Minutes | 12 | 3.5% |
| 90 or more Minutes | 0 | 0.0% |
Commute Time by Sex in Sharon Springs
The most common commute times in Sharon Springs are less than 5 minutes (50 commuters, 28.1%) for males and less than 5 minutes (55 commuters, 33.5%) for females.
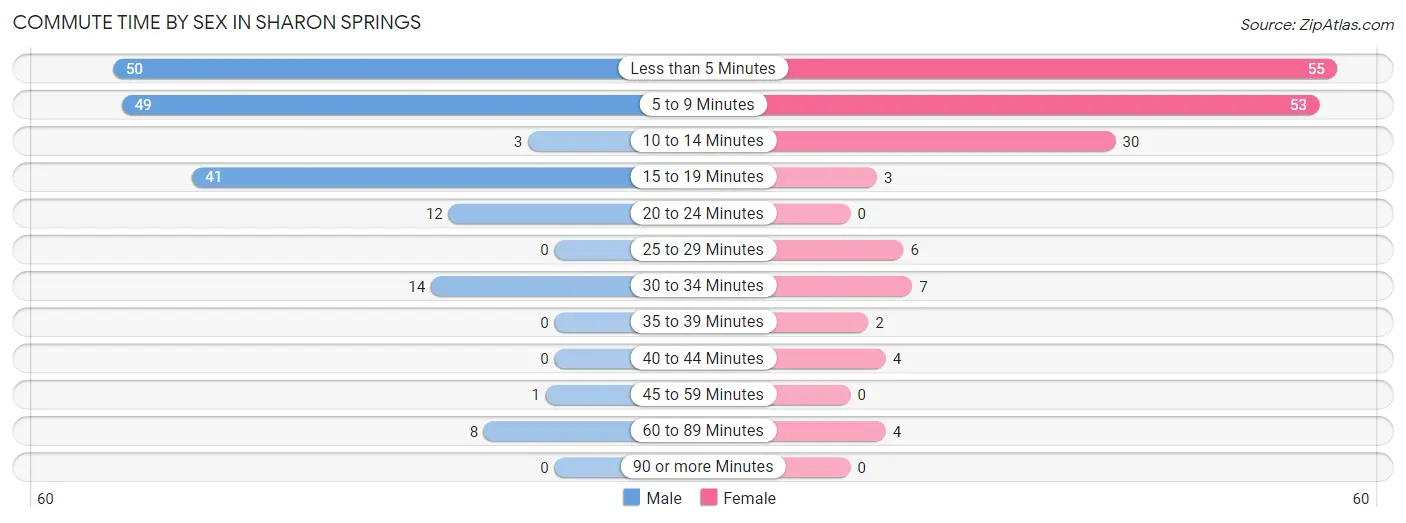
| Commute Time | Male | Female |
| Less than 5 Minutes | 50 (28.1%) | 55 (33.5%) |
| 5 to 9 Minutes | 49 (27.5%) | 53 (32.3%) |
| 10 to 14 Minutes | 3 (1.7%) | 30 (18.3%) |
| 15 to 19 Minutes | 41 (23.0%) | 3 (1.8%) |
| 20 to 24 Minutes | 12 (6.7%) | 0 (0.0%) |
| 25 to 29 Minutes | 0 (0.0%) | 6 (3.7%) |
| 30 to 34 Minutes | 14 (7.9%) | 7 (4.3%) |
| 35 to 39 Minutes | 0 (0.0%) | 2 (1.2%) |
| 40 to 44 Minutes | 0 (0.0%) | 4 (2.4%) |
| 45 to 59 Minutes | 1 (0.6%) | 0 (0.0%) |
| 60 to 89 Minutes | 8 (4.5%) | 4 (2.4%) |
| 90 or more Minutes | 0 (0.0%) | 0 (0.0%) |
Time of Departure to Work by Sex in Sharon Springs
The most frequent times of departure to work in Sharon Springs are 7:00 AM to 7:29 AM (57, 32.0%) for males and 7:00 AM to 7:29 AM (70, 42.7%) for females.
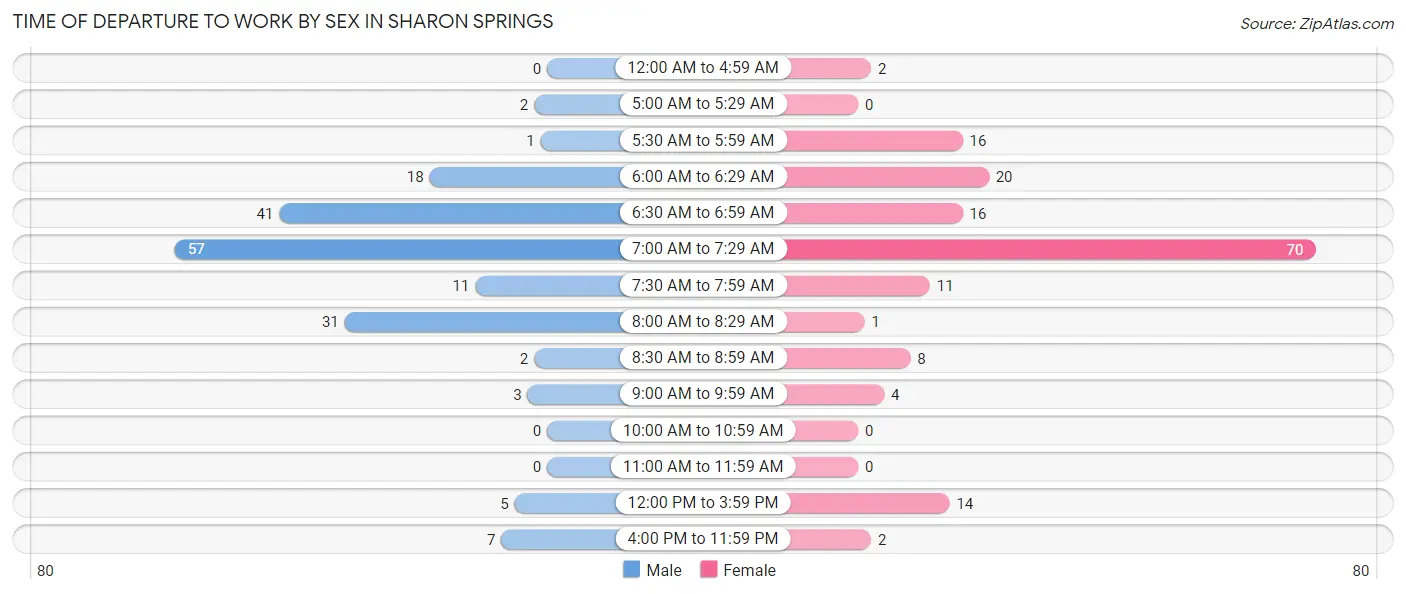
| Time of Departure | Male | Female |
| 12:00 AM to 4:59 AM | 0 (0.0%) | 2 (1.2%) |
| 5:00 AM to 5:29 AM | 2 (1.1%) | 0 (0.0%) |
| 5:30 AM to 5:59 AM | 1 (0.6%) | 16 (9.8%) |
| 6:00 AM to 6:29 AM | 18 (10.1%) | 20 (12.2%) |
| 6:30 AM to 6:59 AM | 41 (23.0%) | 16 (9.8%) |
| 7:00 AM to 7:29 AM | 57 (32.0%) | 70 (42.7%) |
| 7:30 AM to 7:59 AM | 11 (6.2%) | 11 (6.7%) |
| 8:00 AM to 8:29 AM | 31 (17.4%) | 1 (0.6%) |
| 8:30 AM to 8:59 AM | 2 (1.1%) | 8 (4.9%) |
| 9:00 AM to 9:59 AM | 3 (1.7%) | 4 (2.4%) |
| 10:00 AM to 10:59 AM | 0 (0.0%) | 0 (0.0%) |
| 11:00 AM to 11:59 AM | 0 (0.0%) | 0 (0.0%) |
| 12:00 PM to 3:59 PM | 5 (2.8%) | 14 (8.5%) |
| 4:00 PM to 11:59 PM | 7 (3.9%) | 2 (1.2%) |
| Total | 178 (100.0%) | 164 (100.0%) |
Housing Occupancy in Sharon Springs
Occupancy by Ownership in Sharon Springs
Of the total 372 dwellings in Sharon Springs, owner-occupied units account for 259 (69.6%), while renter-occupied units make up 113 (30.4%).
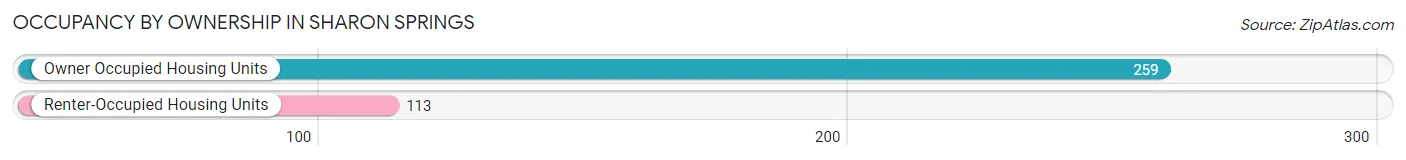
| Occupancy | # Housing Units | % Housing Units |
| Owner Occupied Housing Units | 259 | 69.6% |
| Renter-Occupied Housing Units | 113 | 30.4% |
| Total Occupied Housing Units | 372 | 100.0% |
Occupancy by Household Size in Sharon Springs
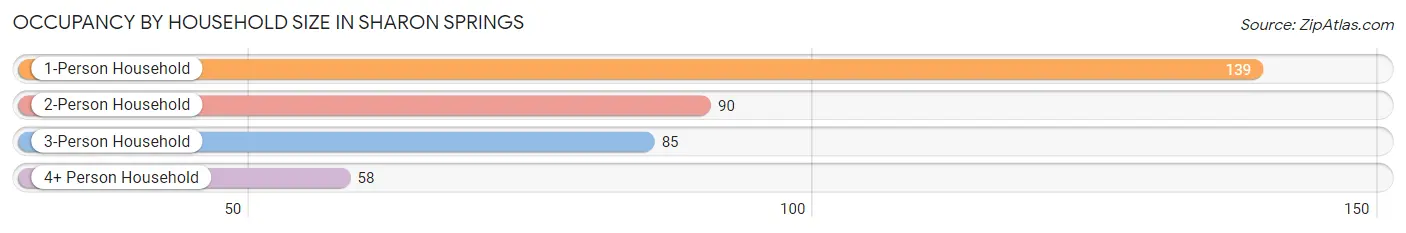
| Household Size | # Housing Units | % Housing Units |
| 1-Person Household | 139 | 37.4% |
| 2-Person Household | 90 | 24.2% |
| 3-Person Household | 85 | 22.9% |
| 4+ Person Household | 58 | 15.6% |
| Total Housing Units | 372 | 100.0% |
Occupancy by Ownership by Household Size in Sharon Springs
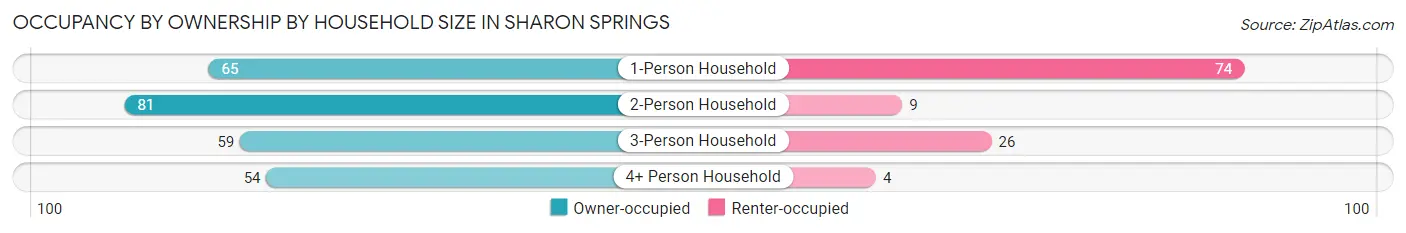
| Household Size | Owner-occupied | Renter-occupied |
| 1-Person Household | 65 (46.8%) | 74 (53.2%) |
| 2-Person Household | 81 (90.0%) | 9 (10.0%) |
| 3-Person Household | 59 (69.4%) | 26 (30.6%) |
| 4+ Person Household | 54 (93.1%) | 4 (6.9%) |
| Total Housing Units | 259 (69.6%) | 113 (30.4%) |
Occupancy by Educational Attainment in Sharon Springs
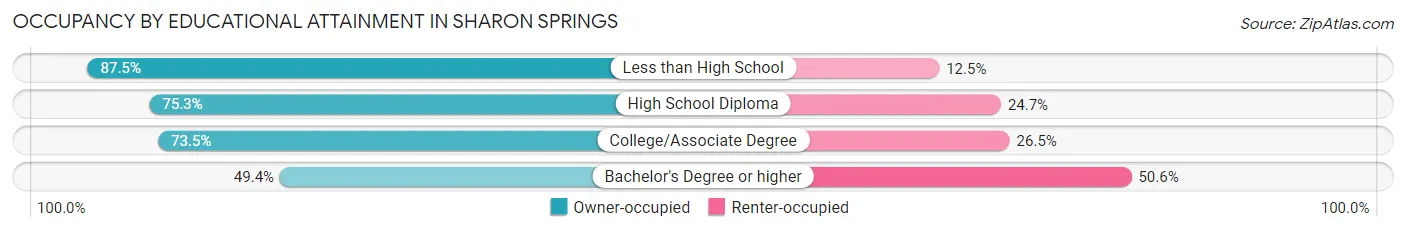
| Household Size | Owner-occupied | Renter-occupied |
| Less than High School | 21 (87.5%) | 3 (12.5%) |
| High School Diploma | 73 (75.3%) | 24 (24.7%) |
| College/Associate Degree | 125 (73.5%) | 45 (26.5%) |
| Bachelor's Degree or higher | 40 (49.4%) | 41 (50.6%) |
Occupancy by Age of Householder in Sharon Springs
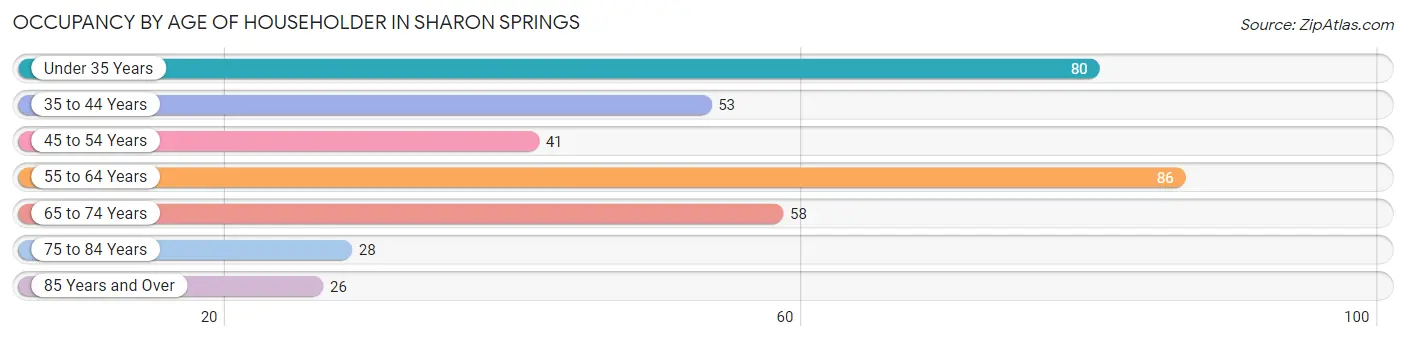
| Age Bracket | # Households | % Households |
| Under 35 Years | 80 | 21.5% |
| 35 to 44 Years | 53 | 14.2% |
| 45 to 54 Years | 41 | 11.0% |
| 55 to 64 Years | 86 | 23.1% |
| 65 to 74 Years | 58 | 15.6% |
| 75 to 84 Years | 28 | 7.5% |
| 85 Years and Over | 26 | 7.0% |
| Total | 372 | 100.0% |
Housing Finances in Sharon Springs
Median Income by Occupancy in Sharon Springs
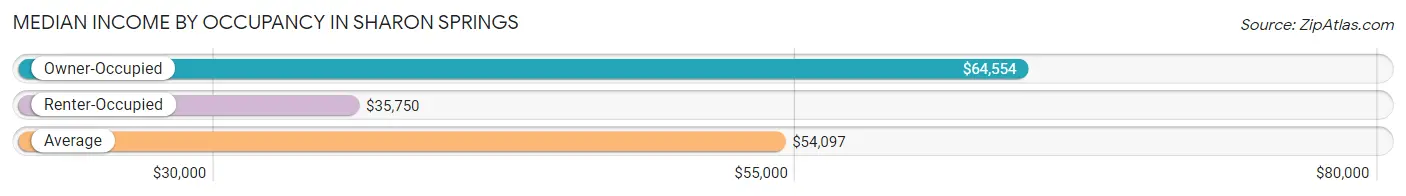
| Occupancy Type | # Households | Median Income |
| Owner-Occupied | 259 (69.6%) | $64,554 |
| Renter-Occupied | 113 (30.4%) | $35,750 |
| Average | 372 (100.0%) | $54,097 |
Occupancy by Householder Income Bracket in Sharon Springs
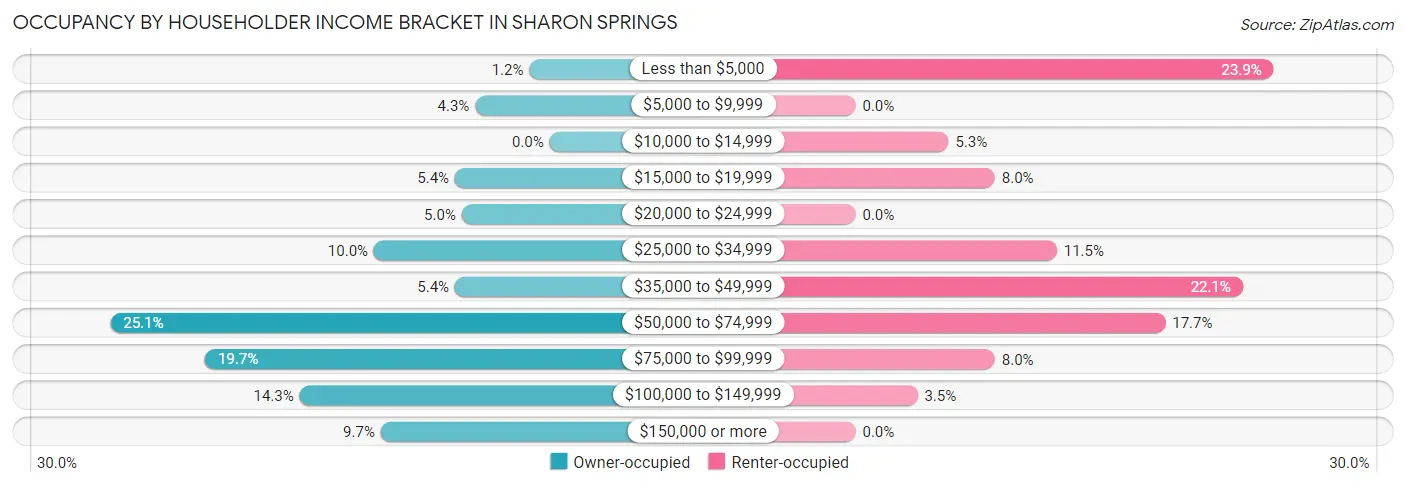
| Income Bracket | Owner-occupied | Renter-occupied |
| Less than $5,000 | 3 (1.2%) | 27 (23.9%) |
| $5,000 to $9,999 | 11 (4.3%) | 0 (0.0%) |
| $10,000 to $14,999 | 0 (0.0%) | 6 (5.3%) |
| $15,000 to $19,999 | 14 (5.4%) | 9 (8.0%) |
| $20,000 to $24,999 | 13 (5.0%) | 0 (0.0%) |
| $25,000 to $34,999 | 26 (10.0%) | 13 (11.5%) |
| $35,000 to $49,999 | 14 (5.4%) | 25 (22.1%) |
| $50,000 to $74,999 | 65 (25.1%) | 20 (17.7%) |
| $75,000 to $99,999 | 51 (19.7%) | 9 (8.0%) |
| $100,000 to $149,999 | 37 (14.3%) | 4 (3.5%) |
| $150,000 or more | 25 (9.7%) | 0 (0.0%) |
| Total | 259 (100.0%) | 113 (100.0%) |
Monthly Housing Cost Tiers in Sharon Springs
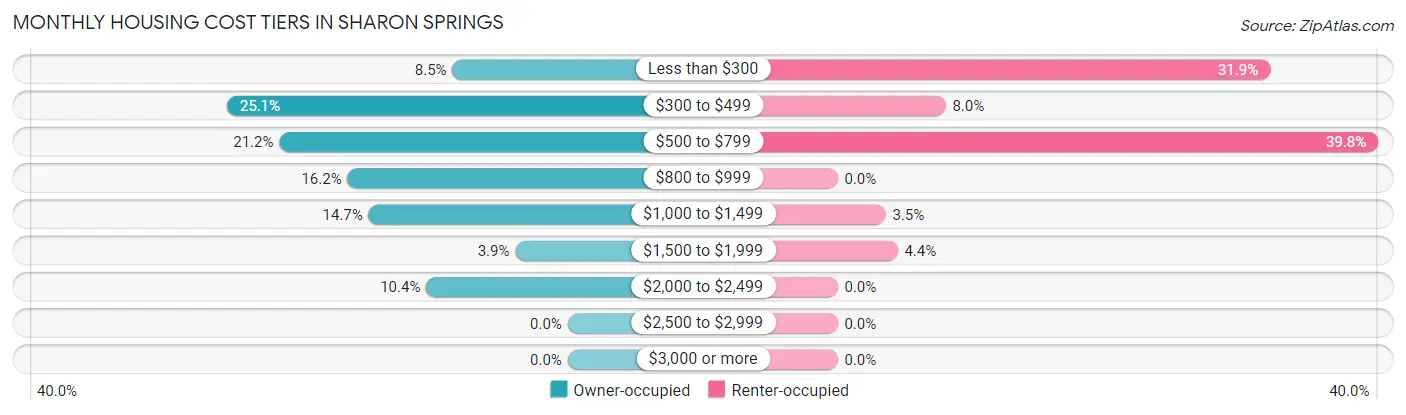
| Monthly Cost | Owner-occupied | Renter-occupied |
| Less than $300 | 22 (8.5%) | 36 (31.9%) |
| $300 to $499 | 65 (25.1%) | 9 (8.0%) |
| $500 to $799 | 55 (21.2%) | 45 (39.8%) |
| $800 to $999 | 42 (16.2%) | 0 (0.0%) |
| $1,000 to $1,499 | 38 (14.7%) | 4 (3.5%) |
| $1,500 to $1,999 | 10 (3.9%) | 5 (4.4%) |
| $2,000 to $2,499 | 27 (10.4%) | 0 (0.0%) |
| $2,500 to $2,999 | 0 (0.0%) | 0 (0.0%) |
| $3,000 or more | 0 (0.0%) | 0 (0.0%) |
| Total | 259 (100.0%) | 113 (100.0%) |
Physical Housing Characteristics in Sharon Springs
Housing Structures in Sharon Springs
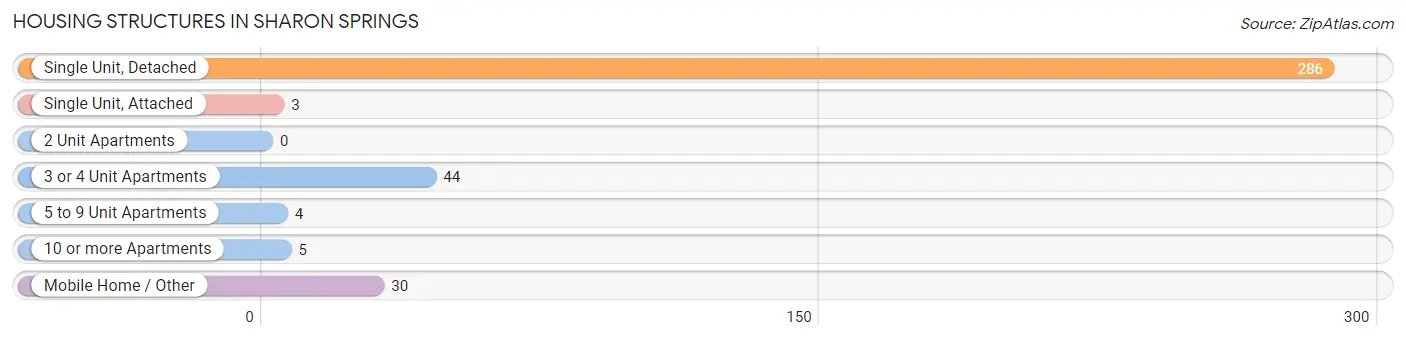
| Structure Type | # Housing Units | % Housing Units |
| Single Unit, Detached | 286 | 76.9% |
| Single Unit, Attached | 3 | 0.8% |
| 2 Unit Apartments | 0 | 0.0% |
| 3 or 4 Unit Apartments | 44 | 11.8% |
| 5 to 9 Unit Apartments | 4 | 1.1% |
| 10 or more Apartments | 5 | 1.3% |
| Mobile Home / Other | 30 | 8.1% |
| Total | 372 | 100.0% |
Housing Structures by Occupancy in Sharon Springs
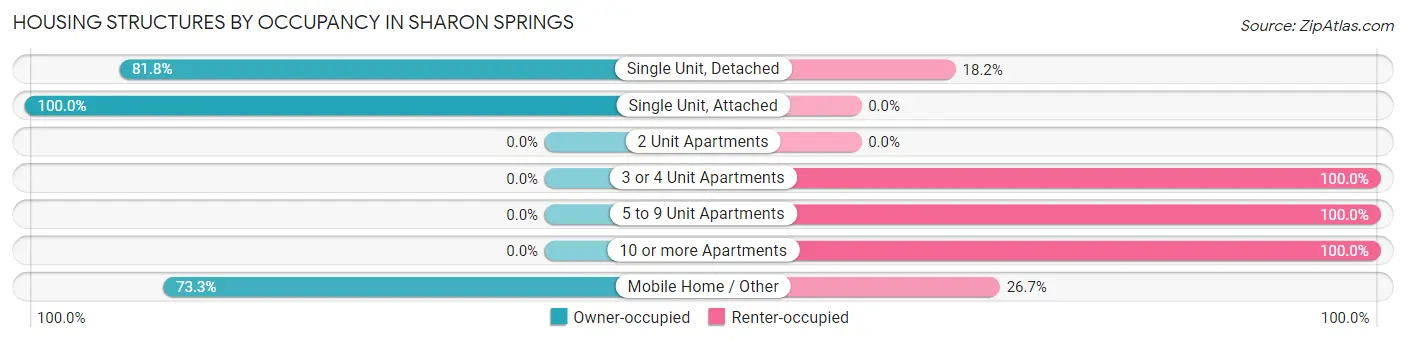
| Structure Type | Owner-occupied | Renter-occupied |
| Single Unit, Detached | 234 (81.8%) | 52 (18.2%) |
| Single Unit, Attached | 3 (100.0%) | 0 (0.0%) |
| 2 Unit Apartments | 0 (0.0%) | 0 (0.0%) |
| 3 or 4 Unit Apartments | 0 (0.0%) | 44 (100.0%) |
| 5 to 9 Unit Apartments | 0 (0.0%) | 4 (100.0%) |
| 10 or more Apartments | 0 (0.0%) | 5 (100.0%) |
| Mobile Home / Other | 22 (73.3%) | 8 (26.7%) |
| Total | 259 (69.6%) | 113 (30.4%) |
Housing Structures by Number of Rooms in Sharon Springs
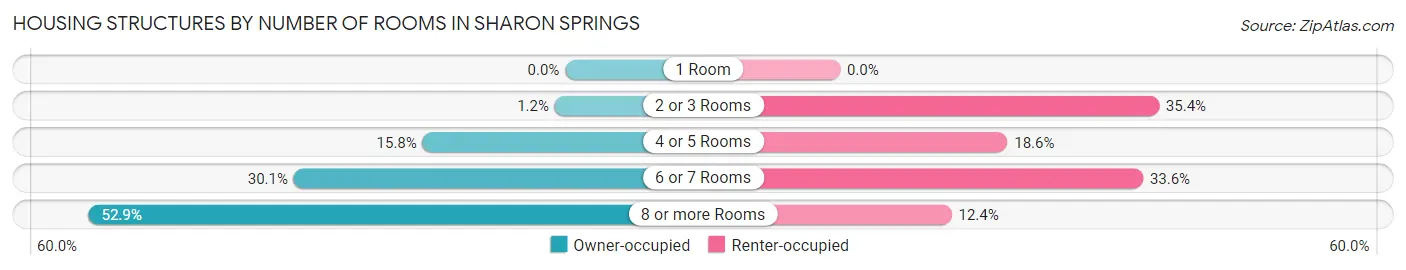
| Number of Rooms | Owner-occupied | Renter-occupied |
| 1 Room | 0 (0.0%) | 0 (0.0%) |
| 2 or 3 Rooms | 3 (1.2%) | 40 (35.4%) |
| 4 or 5 Rooms | 41 (15.8%) | 21 (18.6%) |
| 6 or 7 Rooms | 78 (30.1%) | 38 (33.6%) |
| 8 or more Rooms | 137 (52.9%) | 14 (12.4%) |
| Total | 259 (100.0%) | 113 (100.0%) |
Housing Structure by Heating Type in Sharon Springs
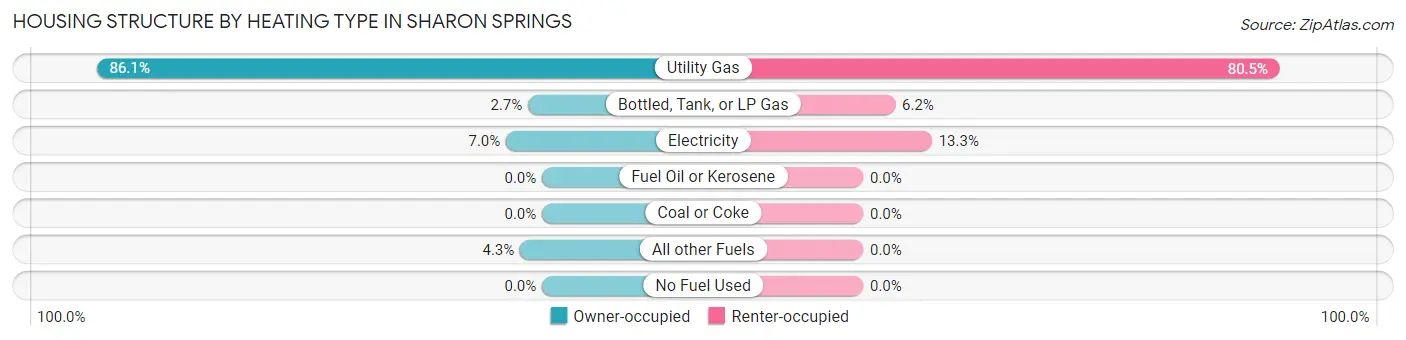
| Heating Type | Owner-occupied | Renter-occupied |
| Utility Gas | 223 (86.1%) | 91 (80.5%) |
| Bottled, Tank, or LP Gas | 7 (2.7%) | 7 (6.2%) |
| Electricity | 18 (7.0%) | 15 (13.3%) |
| Fuel Oil or Kerosene | 0 (0.0%) | 0 (0.0%) |
| Coal or Coke | 0 (0.0%) | 0 (0.0%) |
| All other Fuels | 11 (4.3%) | 0 (0.0%) |
| No Fuel Used | 0 (0.0%) | 0 (0.0%) |
| Total | 259 (100.0%) | 113 (100.0%) |
Household Vehicle Usage in Sharon Springs
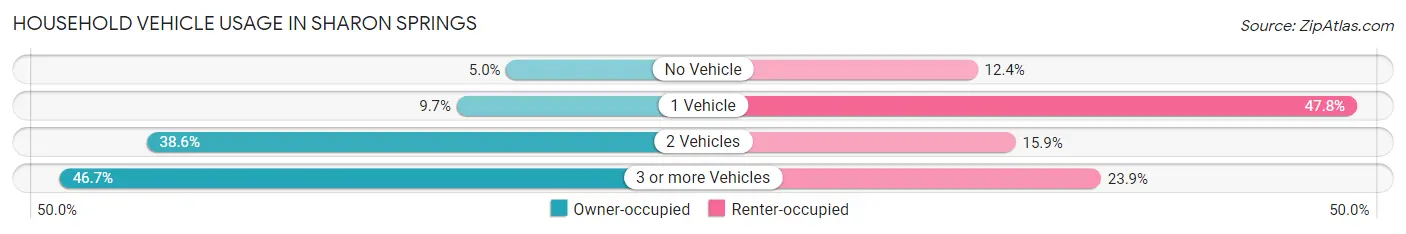
| Vehicles per Household | Owner-occupied | Renter-occupied |
| No Vehicle | 13 (5.0%) | 14 (12.4%) |
| 1 Vehicle | 25 (9.7%) | 54 (47.8%) |
| 2 Vehicles | 100 (38.6%) | 18 (15.9%) |
| 3 or more Vehicles | 121 (46.7%) | 27 (23.9%) |
| Total | 259 (100.0%) | 113 (100.0%) |
Real Estate & Mortgages in Sharon Springs
Real Estate and Mortgage Overview in Sharon Springs
| Characteristic | Without Mortgage | With Mortgage |
| Housing Units | 155 | 104 |
| Median Property Value | $69,500 | $98,300 |
| Median Household Income | $59,250 | $14 |
| Monthly Housing Costs | $441 | $0 |
| Real Estate Taxes | $1,491 | $0 |
Property Value by Mortgage Status in Sharon Springs
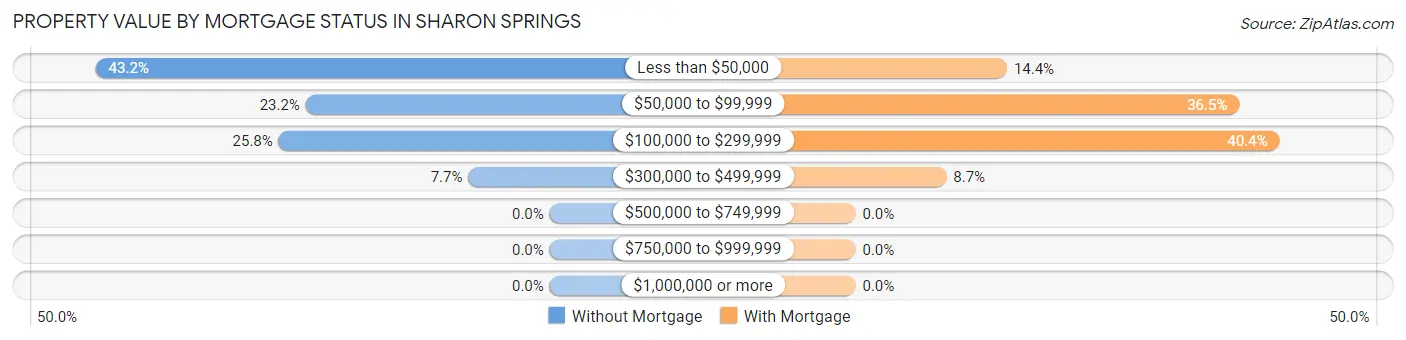
| Property Value | Without Mortgage | With Mortgage |
| Less than $50,000 | 67 (43.2%) | 15 (14.4%) |
| $50,000 to $99,999 | 36 (23.2%) | 38 (36.5%) |
| $100,000 to $299,999 | 40 (25.8%) | 42 (40.4%) |
| $300,000 to $499,999 | 12 (7.7%) | 9 (8.6%) |
| $500,000 to $749,999 | 0 (0.0%) | 0 (0.0%) |
| $750,000 to $999,999 | 0 (0.0%) | 0 (0.0%) |
| $1,000,000 or more | 0 (0.0%) | 0 (0.0%) |
| Total | 155 (100.0%) | 104 (100.0%) |
Household Income by Mortgage Status in Sharon Springs
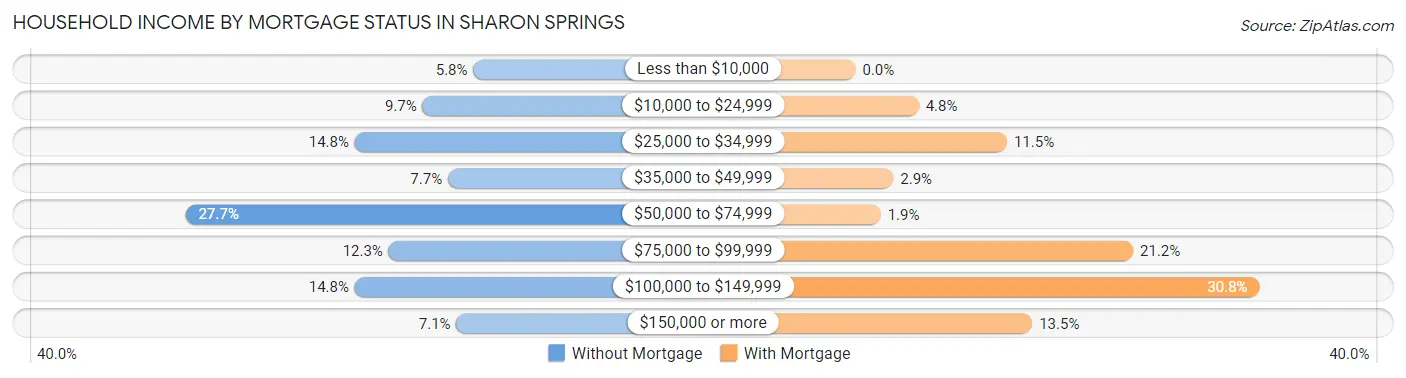
| Household Income | Without Mortgage | With Mortgage |
| Less than $10,000 | 9 (5.8%) | 0 (0.0%) |
| $10,000 to $24,999 | 15 (9.7%) | 5 (4.8%) |
| $25,000 to $34,999 | 23 (14.8%) | 12 (11.5%) |
| $35,000 to $49,999 | 12 (7.7%) | 3 (2.9%) |
| $50,000 to $74,999 | 43 (27.7%) | 2 (1.9%) |
| $75,000 to $99,999 | 19 (12.3%) | 22 (21.1%) |
| $100,000 to $149,999 | 23 (14.8%) | 32 (30.8%) |
| $150,000 or more | 11 (7.1%) | 14 (13.5%) |
| Total | 155 (100.0%) | 104 (100.0%) |
Property Value to Household Income Ratio in Sharon Springs
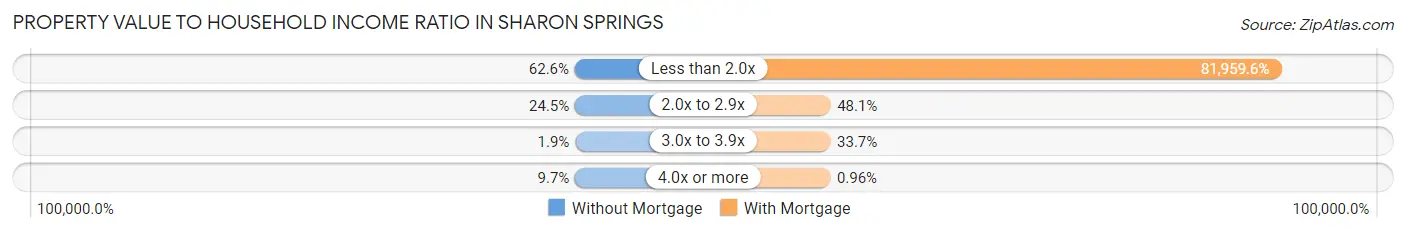
| Value-to-Income Ratio | Without Mortgage | With Mortgage |
| Less than 2.0x | 97 (62.6%) | 85,238 (81,959.6%) |
| 2.0x to 2.9x | 38 (24.5%) | 50 (48.1%) |
| 3.0x to 3.9x | 3 (1.9%) | 35 (33.7%) |
| 4.0x or more | 15 (9.7%) | 1 (1.0%) |
| Total | 155 (100.0%) | 104 (100.0%) |
Real Estate Taxes by Mortgage Status in Sharon Springs
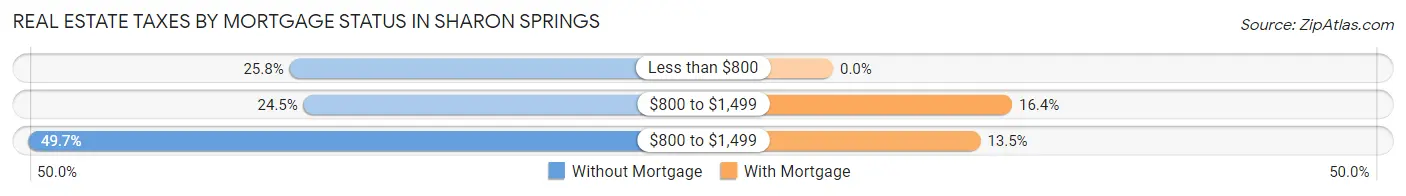
| Property Taxes | Without Mortgage | With Mortgage |
| Less than $800 | 40 (25.8%) | 0 (0.0%) |
| $800 to $1,499 | 38 (24.5%) | 17 (16.4%) |
| $800 to $1,499 | 77 (49.7%) | 14 (13.5%) |
| Total | 155 (100.0%) | 104 (100.0%) |
Health & Disability in Sharon Springs
Health Insurance Coverage by Age in Sharon Springs
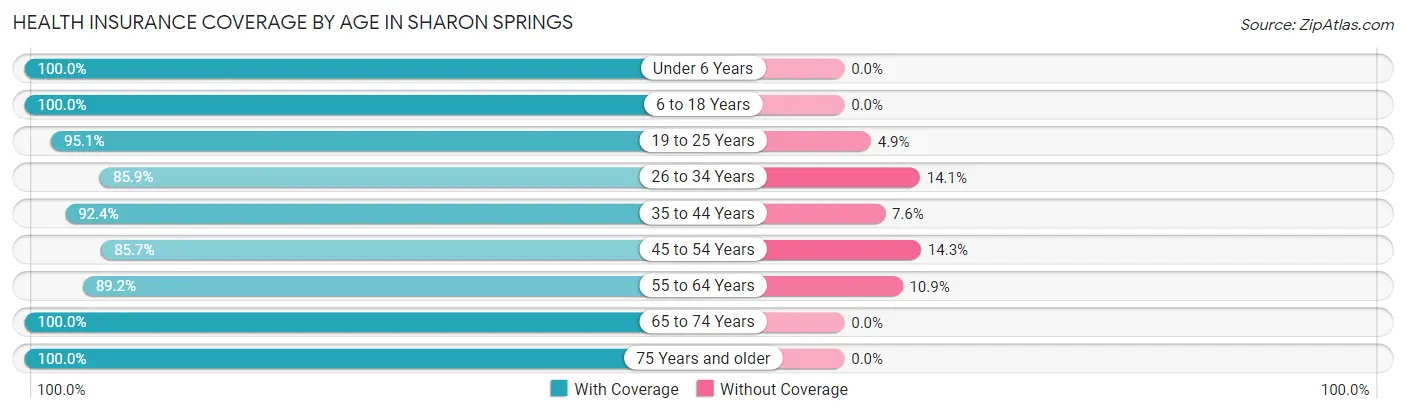
| Age Bracket | With Coverage | Without Coverage |
| Under 6 Years | 102 (100.0%) | 0 (0.0%) |
| 6 to 18 Years | 122 (100.0%) | 0 (0.0%) |
| 19 to 25 Years | 77 (95.1%) | 4 (4.9%) |
| 26 to 34 Years | 61 (85.9%) | 10 (14.1%) |
| 35 to 44 Years | 61 (92.4%) | 5 (7.6%) |
| 45 to 54 Years | 60 (85.7%) | 10 (14.3%) |
| 55 to 64 Years | 115 (89.1%) | 14 (10.8%) |
| 65 to 74 Years | 108 (100.0%) | 0 (0.0%) |
| 75 Years and older | 97 (100.0%) | 0 (0.0%) |
| Total | 803 (94.9%) | 43 (5.1%) |
Health Insurance Coverage by Citizenship Status in Sharon Springs
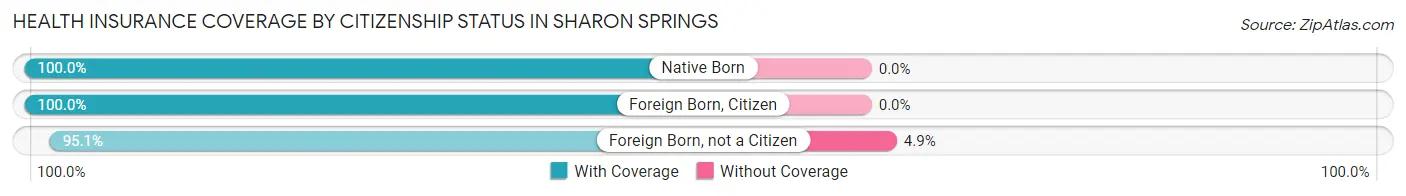
| Citizenship Status | With Coverage | Without Coverage |
| Native Born | 102 (100.0%) | 0 (0.0%) |
| Foreign Born, Citizen | 122 (100.0%) | 0 (0.0%) |
| Foreign Born, not a Citizen | 77 (95.1%) | 4 (4.9%) |
Health Insurance Coverage by Household Income in Sharon Springs
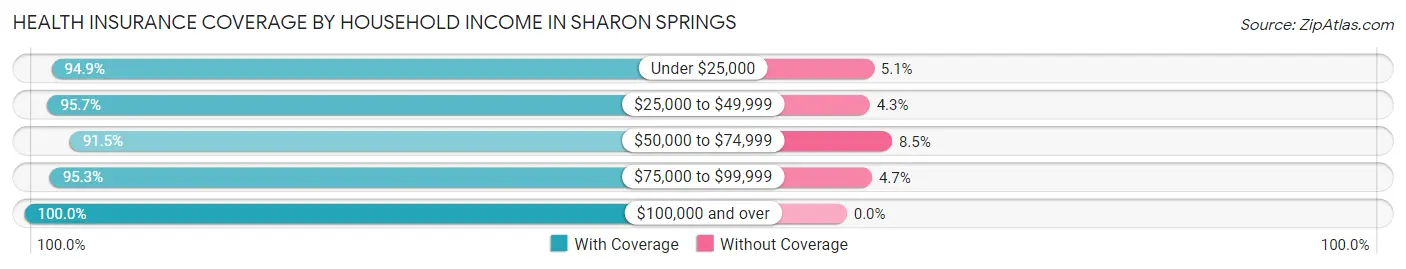
| Household Income | With Coverage | Without Coverage |
| Under $25,000 | 131 (94.9%) | 7 (5.1%) |
| $25,000 to $49,999 | 156 (95.7%) | 7 (4.3%) |
| $50,000 to $74,999 | 249 (91.5%) | 23 (8.5%) |
| $75,000 to $99,999 | 121 (95.3%) | 6 (4.7%) |
| $100,000 and over | 146 (100.0%) | 0 (0.0%) |
Public vs Private Health Insurance Coverage by Age in Sharon Springs
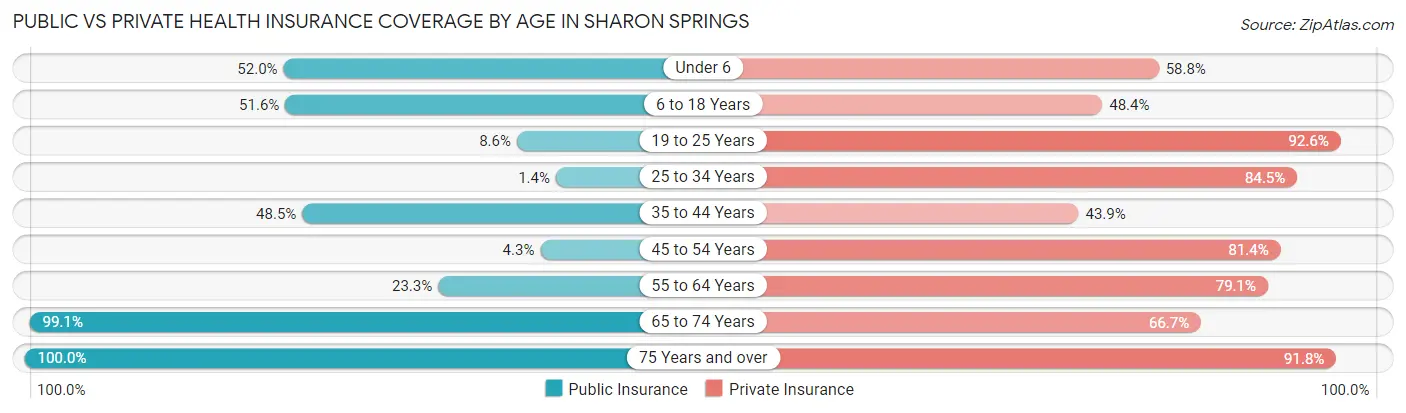
| Age Bracket | Public Insurance | Private Insurance |
| Under 6 | 53 (52.0%) | 60 (58.8%) |
| 6 to 18 Years | 63 (51.6%) | 59 (48.4%) |
| 19 to 25 Years | 7 (8.6%) | 75 (92.6%) |
| 25 to 34 Years | 1 (1.4%) | 60 (84.5%) |
| 35 to 44 Years | 32 (48.5%) | 29 (43.9%) |
| 45 to 54 Years | 3 (4.3%) | 57 (81.4%) |
| 55 to 64 Years | 30 (23.3%) | 102 (79.1%) |
| 65 to 74 Years | 107 (99.1%) | 72 (66.7%) |
| 75 Years and over | 97 (100.0%) | 89 (91.7%) |
| Total | 393 (46.5%) | 603 (71.3%) |
Disability Status by Sex by Age in Sharon Springs
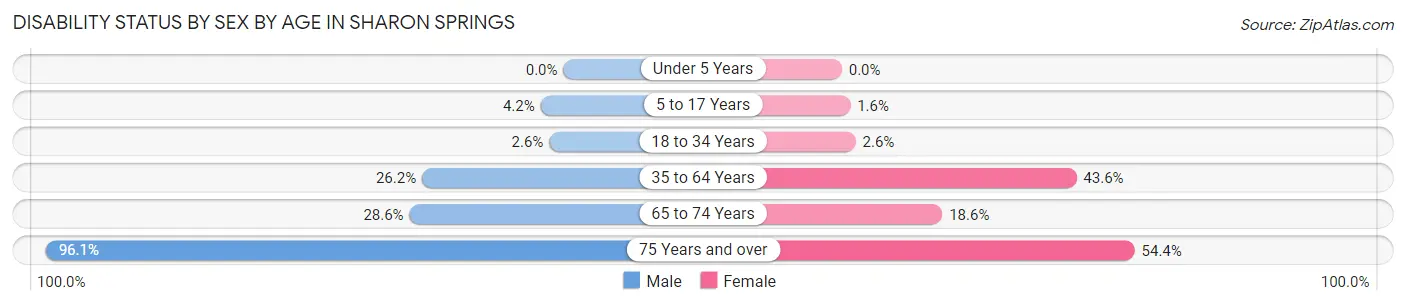
| Age Bracket | Male | Female |
| Under 5 Years | 0 (0.0%) | 0 (0.0%) |
| 5 to 17 Years | 3 (4.2%) | 1 (1.6%) |
| 18 to 34 Years | 2 (2.6%) | 2 (2.6%) |
| 35 to 64 Years | 37 (26.2%) | 54 (43.5%) |
| 65 to 74 Years | 14 (28.6%) | 11 (18.6%) |
| 75 Years and over | 49 (96.1%) | 25 (54.3%) |
Disability Class by Sex by Age in Sharon Springs
Disability Class: Hearing Difficulty
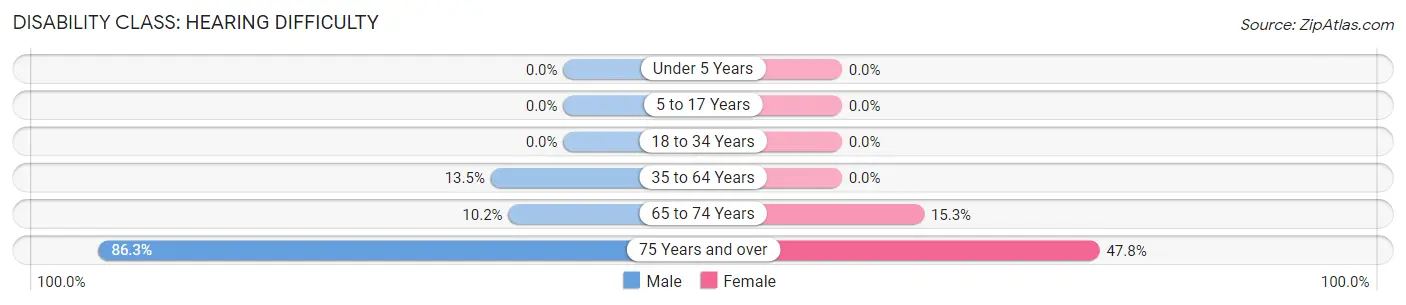
| Age Bracket | Male | Female |
| Under 5 Years | 0 (0.0%) | 0 (0.0%) |
| 5 to 17 Years | 0 (0.0%) | 0 (0.0%) |
| 18 to 34 Years | 0 (0.0%) | 0 (0.0%) |
| 35 to 64 Years | 19 (13.5%) | 0 (0.0%) |
| 65 to 74 Years | 5 (10.2%) | 9 (15.2%) |
| 75 Years and over | 44 (86.3%) | 22 (47.8%) |
Disability Class: Vision Difficulty
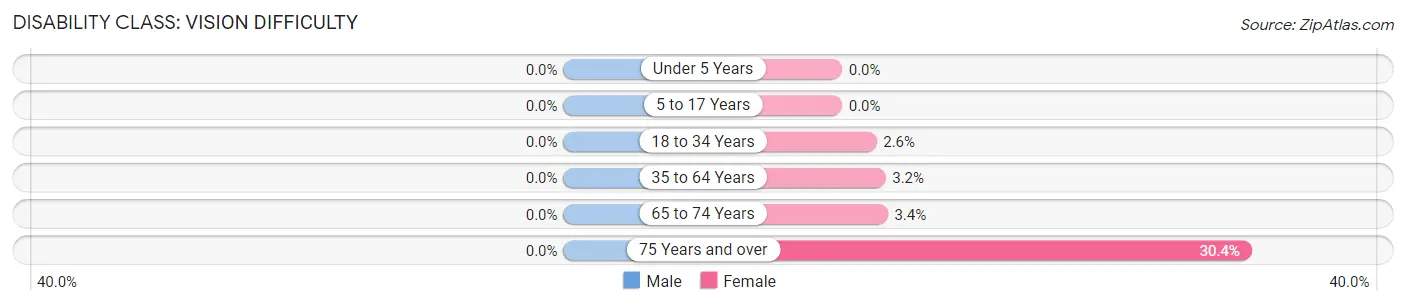
| Age Bracket | Male | Female |
| Under 5 Years | 0 (0.0%) | 0 (0.0%) |
| 5 to 17 Years | 0 (0.0%) | 0 (0.0%) |
| 18 to 34 Years | 0 (0.0%) | 2 (2.6%) |
| 35 to 64 Years | 0 (0.0%) | 4 (3.2%) |
| 65 to 74 Years | 0 (0.0%) | 2 (3.4%) |
| 75 Years and over | 0 (0.0%) | 14 (30.4%) |
Disability Class: Cognitive Difficulty
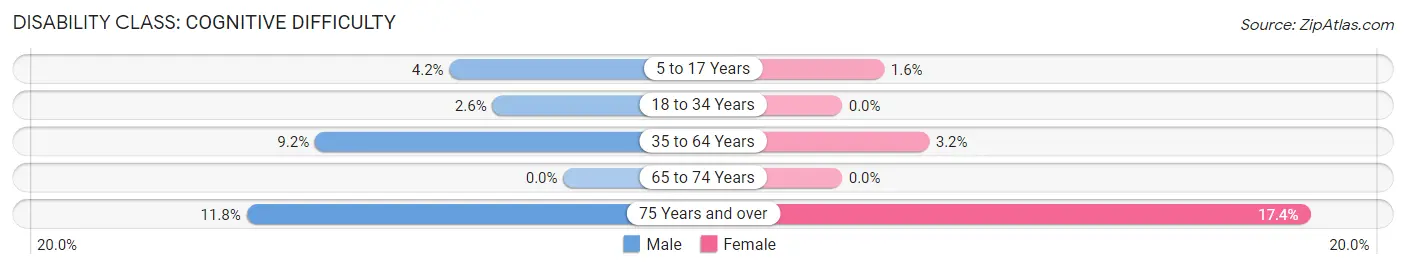
| Age Bracket | Male | Female |
| 5 to 17 Years | 3 (4.2%) | 1 (1.6%) |
| 18 to 34 Years | 2 (2.6%) | 0 (0.0%) |
| 35 to 64 Years | 13 (9.2%) | 4 (3.2%) |
| 65 to 74 Years | 0 (0.0%) | 0 (0.0%) |
| 75 Years and over | 6 (11.8%) | 8 (17.4%) |
Disability Class: Ambulatory Difficulty
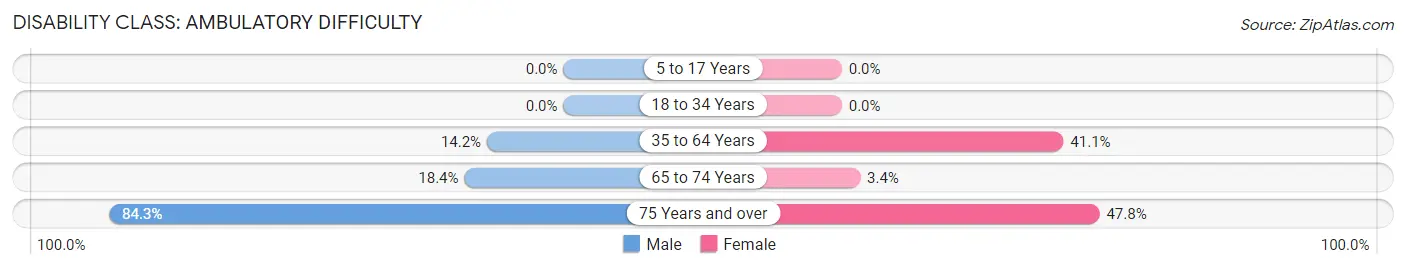
| Age Bracket | Male | Female |
| 5 to 17 Years | 0 (0.0%) | 0 (0.0%) |
| 18 to 34 Years | 0 (0.0%) | 0 (0.0%) |
| 35 to 64 Years | 20 (14.2%) | 51 (41.1%) |
| 65 to 74 Years | 9 (18.4%) | 2 (3.4%) |
| 75 Years and over | 43 (84.3%) | 22 (47.8%) |
Disability Class: Self-Care Difficulty
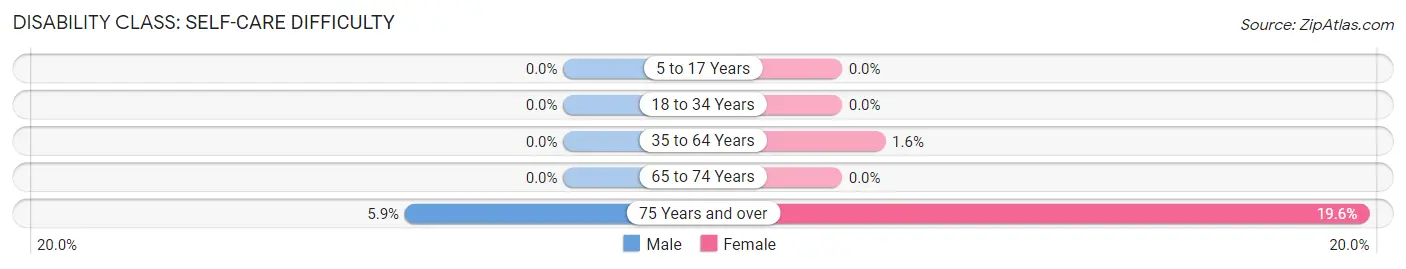
| Age Bracket | Male | Female |
| 5 to 17 Years | 0 (0.0%) | 0 (0.0%) |
| 18 to 34 Years | 0 (0.0%) | 0 (0.0%) |
| 35 to 64 Years | 0 (0.0%) | 2 (1.6%) |
| 65 to 74 Years | 0 (0.0%) | 0 (0.0%) |
| 75 Years and over | 3 (5.9%) | 9 (19.6%) |
Technology Access in Sharon Springs
Computing Device Access in Sharon Springs
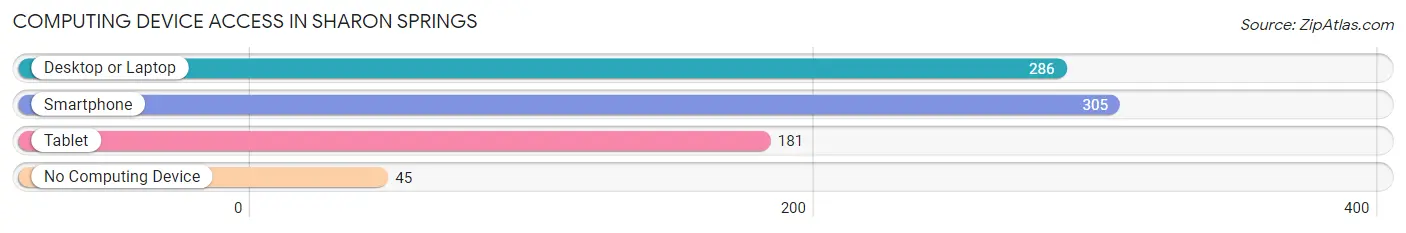
| Device Type | # Households | % Households |
| Desktop or Laptop | 286 | 76.9% |
| Smartphone | 305 | 82.0% |
| Tablet | 181 | 48.7% |
| No Computing Device | 45 | 12.1% |
| Total | 372 | 100.0% |
Internet Access in Sharon Springs
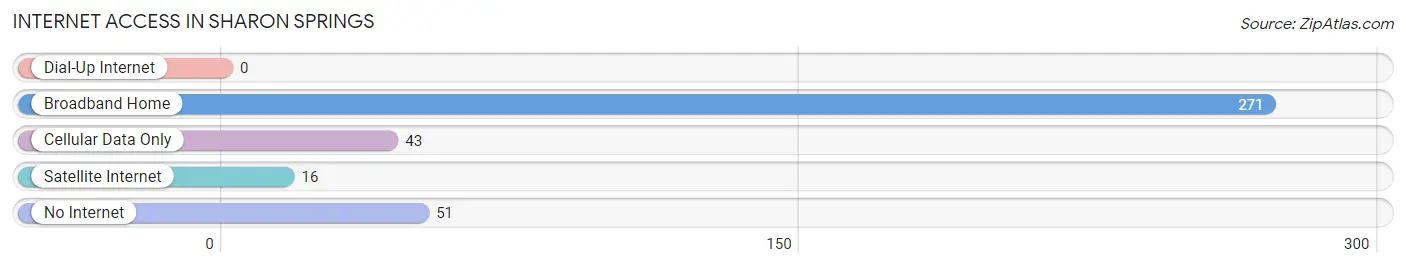
| Internet Type | # Households | % Households |
| Dial-Up Internet | 0 | 0.0% |
| Broadband Home | 271 | 72.9% |
| Cellular Data Only | 43 | 11.6% |
| Satellite Internet | 16 | 4.3% |
| No Internet | 51 | 13.7% |
| Total | 372 | 100.0% |
Sharon Springs Summary
Sharon Springs is a small town located in Wallace County, Kansas, United States. The population was 545 at the 2010 census. It is the county seat of Wallace County.
History
Sharon Springs was founded in 1885 by the Union Pacific Railroad. The town was named after the nearby Sharon Springs, which were discovered by the railroad surveyors. The springs were named after the daughter of a railroad official.
The town was incorporated in 1887 and quickly became a center of commerce for the surrounding area. The town was home to a variety of businesses, including a bank, a hotel, a newspaper, a lumberyard, and a variety of other stores.
In the early 1900s, Sharon Springs was a popular destination for tourists. The town was known for its mineral springs, which were believed to have healing properties. The town also had a variety of recreational activities, including a swimming pool, a golf course, and a racetrack.
In the 1950s, the town began to decline as the railroad industry declined. The town's population dropped from a peak of 1,000 in the 1940s to just over 500 in the 2000s.
Geography
Sharon Springs is located at 38°25'17" North, 101°17'45" West (38.4214, -101.2958). The town is situated in the High Plains region of the Great Plains.
The town is located in Wallace County, which is part of the High Plains region of the Great Plains. The county is bordered by Greeley County to the north, Wichita County to the east, Logan County to the south, and Sherman County to the west.
The town is located at an elevation of 3 717 feet 1 133 m
Economy
The economy of Sharon Springs is largely based on agriculture. The town is home to a variety of farms, including wheat, corn, and cattle.
The town is also home to a variety of small businesses, including a grocery store, a hardware store, and a variety of restaurants.
Demographics
As of the 2010 census, the population of Sharon Springs was 545. The racial makeup of the town was 97.3% White, 0.2% African American, 0.2% Native American, 0.2% Asian, 0.4% from other races, and 1.7% from two or more races. Hispanic or Latino of any race were 1.3% of the population.
The median household income in Sharon Springs was $37,500, and the median family income was $45,000. The per capita income for the town was $17,857. About 11.2% of families and 14.2% of the population were below the poverty line, including 18.2% of those under age 18 and 8.3% of those age 65 or over.
Common Questions
What is Per Capita Income in Sharon Springs?
Per Capita income in Sharon Springs is $32,225.
What is the Median Family Income in Sharon Springs?
Median Family Income in Sharon Springs is $63,472.
What is the Median Household income in Sharon Springs?
Median Household Income in Sharon Springs is $54,097.
What is Income or Wage Gap in Sharon Springs?
Income or Wage Gap in Sharon Springs is 31.9%.
Women in Sharon Springs earn 68.1 cents for every dollar earned by a man.
What is Family Income Deficit in Sharon Springs?
Family Income Deficit in Sharon Springs is $9,843.
Families that are below poverty line in Sharon Springs earn $9,843 less on average than the poverty threshold level.
What is Inequality or Gini Index in Sharon Springs?
Inequality or Gini Index in Sharon Springs is 0.47.
What is the Total Population of Sharon Springs?
Total Population of Sharon Springs is 869.
What is the Total Male Population of Sharon Springs?
Total Male Population of Sharon Springs is 443.
What is the Total Female Population of Sharon Springs?
Total Female Population of Sharon Springs is 426.
What is the Ratio of Males per 100 Females in Sharon Springs?
There are 103.99 Males per 100 Females in Sharon Springs.
What is the Ratio of Females per 100 Males in Sharon Springs?
There are 96.16 Females per 100 Males in Sharon Springs.
What is the Median Population Age in Sharon Springs?
Median Population Age in Sharon Springs is 42.6 Years.
What is the Average Family Size in Sharon Springs
Average Family Size in Sharon Springs is 2.9 People.
What is the Average Household Size in Sharon Springs
Average Household Size in Sharon Springs is 2.3 People.
How Large is the Labor Force in Sharon Springs?
There are 368 People in the Labor Forcein in Sharon Springs.
What is the Percentage of People in the Labor Force in Sharon Springs?
55.3% of People are in the Labor Force in Sharon Springs.
What is the Unemployment Rate in Sharon Springs?
Unemployment Rate in Sharon Springs is 3.5%.