Zip Codes with the Highest Percentage of Population with a Degree in Arts and Humanities in Idaho
RELATED REPORTS & OPTIONS
Arts and Humanities
Idaho
Compare Zip Codes
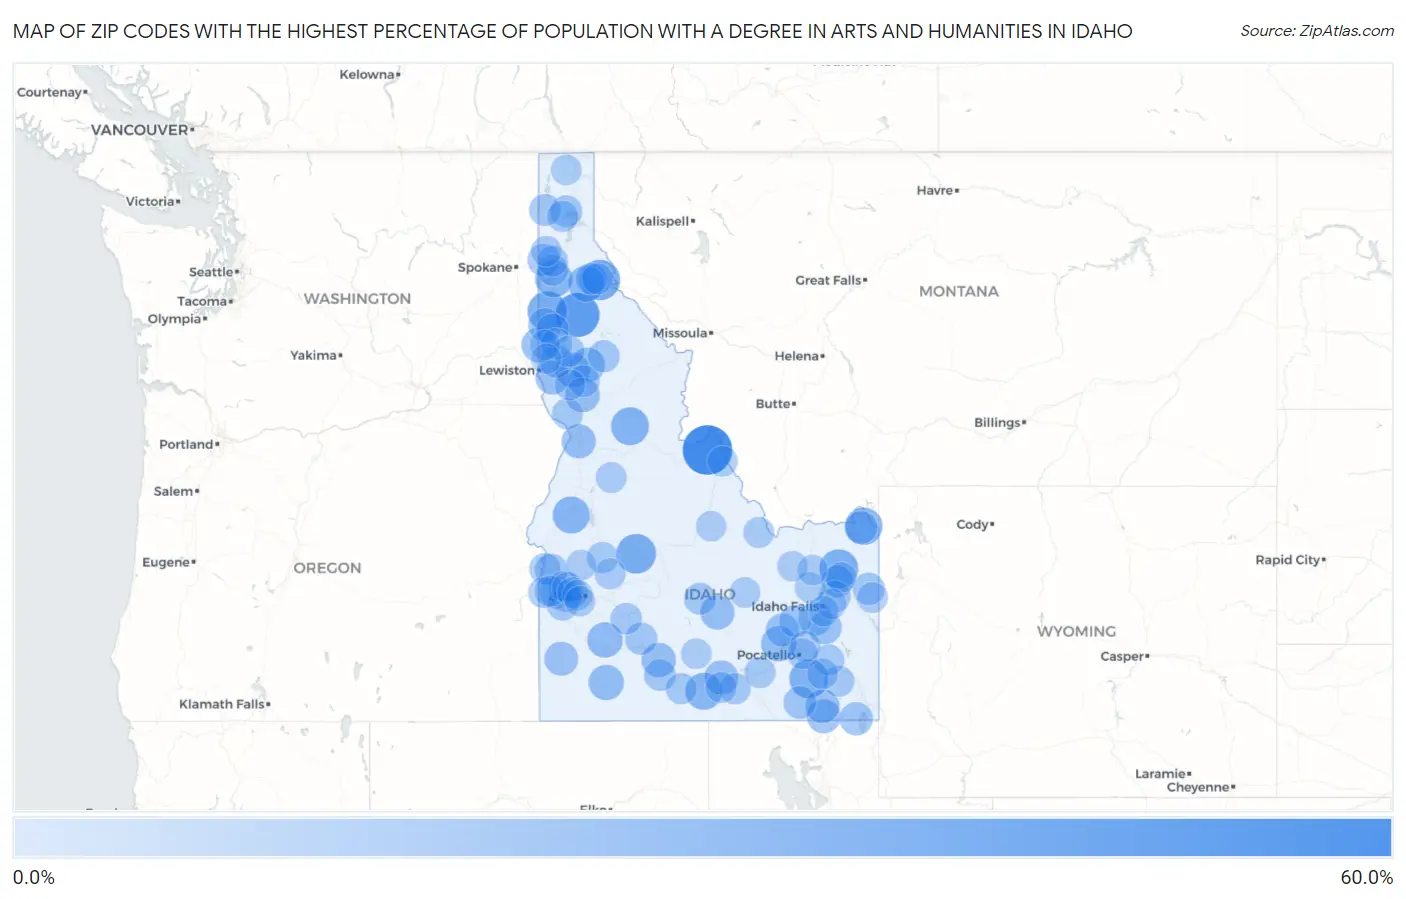
Map of Zip Codes with the Highest Percentage of Population with a Degree in Arts and Humanities in Idaho
0.0%
60.0%
Zip Codes with the Highest Percentage of Population with a Degree in Arts and Humanities in Idaho
| Zip Code | % Graduates | vs State | vs National | |
| 1. | 83466 | 56.5% | 6.9%(+49.7)#1 | 6.0%(+50.5)#170 |
| 2. | 83830 | 42.3% | 6.9%(+35.4)#2 | 6.0%(+36.3)#311 |
| 3. | 83867 | 32.4% | 6.9%(+25.5)#3 | 6.0%(+26.4)#564 |
| 4. | 83870 | 31.0% | 6.9%(+24.2)#4 | 6.0%(+25.0)#621 |
| 5. | 83637 | 30.8% | 6.9%(+23.9)#5 | 6.0%(+24.8)#633 |
| 6. | 83438 | 28.6% | 6.9%(+21.7)#6 | 6.0%(+22.6)#724 |
| 7. | 83214 | 28.2% | 6.9%(+21.4)#7 | 6.0%(+22.2)#745 |
| 8. | 83525 | 25.8% | 6.9%(+18.9)#8 | 6.0%(+19.8)#901 |
| 9. | 83433 | 25.0% | 6.9%(+18.1)#9 | 6.0%(+19.0)#982 |
| 10. | 83833 | 24.1% | 6.9%(+17.2)#10 | 6.0%(+18.1)#1,029 |
| 11. | 83643 | 24.0% | 6.9%(+17.1)#11 | 6.0%(+18.0)#1,036 |
| 12. | 83344 | 23.7% | 6.9%(+16.8)#12 | 6.0%(+17.7)#1,054 |
| 13. | 83850 | 21.9% | 6.9%(+15.1)#13 | 6.0%(+15.9)#1,244 |
| 14. | 83648 | 20.2% | 6.9%(+13.3)#14 | 6.0%(+14.2)#1,460 |
| 15. | 83604 | 19.4% | 6.9%(+12.6)#15 | 6.0%(+13.4)#1,582 |
| 16. | 83210 | 19.4% | 6.9%(+12.5)#16 | 6.0%(+13.4)#1,591 |
| 17. | 83844 | 17.9% | 6.9%(+11.0)#17 | 6.0%(+11.9)#1,874 |
| 18. | 83545 | 17.8% | 6.9%(+10.9)#18 | 6.0%(+11.8)#1,896 |
| 19. | 83544 | 17.8% | 6.9%(+10.9)#19 | 6.0%(+11.8)#1,899 |
| 20. | 83533 | 17.5% | 6.9%(+10.6)#20 | 6.0%(+11.5)#1,972 |
| 21. | 83332 | 17.4% | 6.9%(+10.6)#21 | 6.0%(+11.4)#1,983 |
| 22. | 83320 | 16.7% | 6.9%(+9.81)#22 | 6.0%(+10.7)#2,151 |
| 23. | 83542 | 16.7% | 6.9%(+9.81)#23 | 6.0%(+10.7)#2,177 |
| 24. | 83336 | 16.3% | 6.9%(+9.49)#24 | 6.0%(+10.4)#2,248 |
| 25. | 83540 | 16.3% | 6.9%(+9.47)#25 | 6.0%(+10.3)#2,255 |
| 26. | 83286 | 16.1% | 6.9%(+9.21)#26 | 6.0%(+10.1)#2,323 |
| 27. | 83228 | 16.1% | 6.9%(+9.20)#27 | 6.0%(+10.1)#2,329 |
| 28. | 83650 | 15.7% | 6.9%(+8.83)#28 | 6.0%(+9.69)#2,427 |
| 29. | 83855 | 15.0% | 6.9%(+8.18)#29 | 6.0%(+9.04)#2,658 |
| 30. | 83218 | 15.0% | 6.9%(+8.14)#30 | 6.0%(+9.00)#2,672 |
| 31. | 83236 | 14.7% | 6.9%(+7.85)#31 | 6.0%(+8.71)#2,793 |
| 32. | 83262 | 14.5% | 6.9%(+7.69)#32 | 6.0%(+8.55)#2,861 |
| 33. | 83535 | 14.4% | 6.9%(+7.53)#33 | 6.0%(+8.40)#2,933 |
| 34. | 83287 | 14.3% | 6.9%(+7.43)#34 | 6.0%(+8.29)#2,993 |
| 35. | 83857 | 13.3% | 6.9%(+6.47)#35 | 6.0%(+7.34)#3,440 |
| 36. | 83252 | 13.1% | 6.9%(+6.27)#36 | 6.0%(+7.13)#3,562 |
| 37. | 83429 | 12.9% | 6.9%(+6.03)#37 | 6.0%(+6.90)#3,713 |
| 38. | 83655 | 12.5% | 6.9%(+5.61)#38 | 6.0%(+6.48)#4,005 |
| 39. | 83854 | 12.4% | 6.9%(+5.58)#39 | 6.0%(+6.45)#4,021 |
| 40. | 83607 | 11.9% | 6.9%(+5.02)#40 | 6.0%(+5.88)#4,400 |
| 41. | 83633 | 11.8% | 6.9%(+4.91)#41 | 6.0%(+5.77)#4,491 |
| 42. | 83422 | 11.3% | 6.9%(+4.41)#42 | 6.0%(+5.27)#4,894 |
| 43. | 83440 | 11.2% | 6.9%(+4.38)#43 | 6.0%(+5.24)#4,926 |
| 44. | 83546 | 11.1% | 6.9%(+4.25)#44 | 6.0%(+5.12)#5,043 |
| 45. | 83852 | 11.0% | 6.9%(+4.17)#45 | 6.0%(+5.03)#5,121 |
| 46. | 83221 | 10.9% | 6.9%(+4.01)#46 | 6.0%(+4.87)#5,256 |
| 47. | 83333 | 10.7% | 6.9%(+3.84)#47 | 6.0%(+4.71)#5,419 |
| 48. | 83856 | 10.7% | 6.9%(+3.82)#48 | 6.0%(+4.68)#5,455 |
| 49. | 83316 | 10.6% | 6.9%(+3.79)#49 | 6.0%(+4.65)#5,483 |
| 50. | 83543 | 10.5% | 6.9%(+3.62)#50 | 6.0%(+4.48)#5,669 |
| 51. | 83647 | 10.0% | 6.9%(+3.18)#51 | 6.0%(+4.05)#6,179 |
| 52. | 83442 | 10.0% | 6.9%(+3.15)#52 | 6.0%(+4.02)#6,213 |
| 53. | 83871 | 9.9% | 6.9%(+3.04)#53 | 6.0%(+3.90)#6,388 |
| 54. | 83537 | 9.9% | 6.9%(+3.03)#54 | 6.0%(+3.89)#6,396 |
| 55. | 83837 | 9.9% | 6.9%(+3.00)#55 | 6.0%(+3.87)#6,445 |
| 56. | 83619 | 9.6% | 6.9%(+2.75)#56 | 6.0%(+3.61)#6,763 |
| 57. | 83311 | 9.5% | 6.9%(+2.60)#57 | 6.0%(+3.46)#6,993 |
| 58. | 83814 | 9.5% | 6.9%(+2.59)#58 | 6.0%(+3.46)#7,002 |
| 59. | 83622 | 9.3% | 6.9%(+2.48)#59 | 6.0%(+3.35)#7,177 |
| 60. | 83687 | 9.3% | 6.9%(+2.39)#60 | 6.0%(+3.26)#7,318 |
| 61. | 83241 | 9.2% | 6.9%(+2.33)#61 | 6.0%(+3.20)#7,430 |
| 62. | 83825 | 9.1% | 6.9%(+2.23)#62 | 6.0%(+3.10)#7,607 |
| 63. | 83676 | 9.1% | 6.9%(+2.20)#63 | 6.0%(+3.07)#7,659 |
| 64. | 83849 | 9.0% | 6.9%(+2.17)#64 | 6.0%(+3.03)#7,701 |
| 65. | 83211 | 9.0% | 6.9%(+2.13)#65 | 6.0%(+3.00)#7,759 |
| 66. | 83301 | 9.0% | 6.9%(+2.12)#66 | 6.0%(+2.99)#7,783 |
| 67. | 83686 | 8.9% | 6.9%(+2.04)#67 | 6.0%(+2.90)#7,913 |
| 68. | 83644 | 8.9% | 6.9%(+1.99)#68 | 6.0%(+2.86)#7,984 |
| 69. | 83626 | 8.8% | 6.9%(+1.98)#69 | 6.0%(+2.84)#8,004 |
| 70. | 83522 | 8.8% | 6.9%(+1.90)#70 | 6.0%(+2.76)#8,154 |
| 71. | 83217 | 8.8% | 6.9%(+1.90)#71 | 6.0%(+2.76)#8,156 |
| 72. | 83318 | 8.7% | 6.9%(+1.84)#72 | 6.0%(+2.71)#8,255 |
| 73. | 83815 | 8.7% | 6.9%(+1.84)#73 | 6.0%(+2.70)#8,257 |
| 74. | 83669 | 8.5% | 6.9%(+1.63)#74 | 6.0%(+2.49)#8,653 |
| 75. | 83202 | 8.5% | 6.9%(+1.62)#75 | 6.0%(+2.49)#8,669 |
| 76. | 83638 | 8.5% | 6.9%(+1.62)#76 | 6.0%(+2.48)#8,679 |
| 77. | 83631 | 8.3% | 6.9%(+1.47)#77 | 6.0%(+2.34)#8,940 |
| 78. | 83464 | 8.3% | 6.9%(+1.47)#78 | 6.0%(+2.34)#8,971 |
| 79. | 83455 | 8.3% | 6.9%(+1.42)#79 | 6.0%(+2.29)#9,074 |
| 80. | 83523 | 8.1% | 6.9%(+1.27)#80 | 6.0%(+2.13)#9,379 |
| 81. | 83201 | 8.1% | 6.9%(+1.25)#81 | 6.0%(+2.12)#9,407 |
| 82. | 83246 | 8.1% | 6.9%(+1.24)#82 | 6.0%(+2.10)#9,455 |
| 83. | 83858 | 7.9% | 6.9%(+1.04)#83 | 6.0%(+1.90)#9,851 |
| 84. | 83213 | 7.8% | 6.9%(+0.912)#84 | 6.0%(+1.78)#10,122 |
| 85. | 83324 | 7.7% | 6.9%(+0.833)#85 | 6.0%(+1.70)#10,300 |
| 86. | 83462 | 7.7% | 6.9%(+0.833)#86 | 6.0%(+1.70)#10,313 |
| 87. | 83805 | 7.6% | 6.9%(+0.783)#87 | 6.0%(+1.65)#10,406 |
| 88. | 83670 | 7.6% | 6.9%(+0.749)#88 | 6.0%(+1.61)#10,464 |
| 89. | 83448 | 7.6% | 6.9%(+0.744)#89 | 6.0%(+1.61)#10,476 |
| 90. | 83646 | 7.6% | 6.9%(+0.741)#90 | 6.0%(+1.61)#10,481 |
| 91. | 83401 | 7.6% | 6.9%(+0.731)#91 | 6.0%(+1.60)#10,506 |
| 92. | 83404 | 7.6% | 6.9%(+0.705)#92 | 6.0%(+1.57)#10,568 |
| 93. | 83444 | 7.4% | 6.9%(+0.548)#93 | 6.0%(+1.41)#10,954 |
| 94. | 83435 | 7.4% | 6.9%(+0.548)#94 | 6.0%(+1.41)#10,964 |
| 95. | 83843 | 7.3% | 6.9%(+0.474)#95 | 6.0%(+1.34)#11,129 |
| 96. | 83832 | 7.3% | 6.9%(+0.428)#96 | 6.0%(+1.29)#11,247 |
| 97. | 83425 | 7.3% | 6.9%(+0.413)#97 | 6.0%(+1.28)#11,280 |
| 98. | 83713 | 7.3% | 6.9%(+0.408)#98 | 6.0%(+1.27)#11,296 |
| 99. | 83226 | 7.2% | 6.9%(+0.332)#99 | 6.0%(+1.20)#11,487 |
| 100. | 83709 | 7.1% | 6.9%(+0.273)#100 | 6.0%(+1.14)#11,653 |
Common Questions
What are the Top 10 Zip Codes with the Highest Percentage of Population with a Degree in Arts and Humanities in Idaho?
Top 10 Zip Codes with the Highest Percentage of Population with a Degree in Arts and Humanities in Idaho are:
What zip code has the Highest Percentage of Population with a Degree in Arts and Humanities in Idaho?
83466 has the Highest Percentage of Population with a Degree in Arts and Humanities in Idaho with 56.5%.
What is the Percentage of Population with a Degree in Arts and Humanities in the State of Idaho?
Percentage of Population with a Degree in Arts and Humanities in Idaho is 6.9%.
What is the Percentage of Population with a Degree in Arts and Humanities in the United States?
Percentage of Population with a Degree in Arts and Humanities in the United States is 6.0%.