Haiku Pauwela, HI Map & Demographics
Haiku Pauwela Map
Haiku Pauwela Overview
$41,010
PER CAPITA INCOME
$94,193
AVG FAMILY INCOME
$94,495
AVG HOUSEHOLD INCOME
3.5%
WAGE / INCOME GAP [ % ]
96.5¢/ $1
WAGE / INCOME GAP [ $ ]
0.37
INEQUALITY / GINI INDEX
9,245
TOTAL POPULATION
4,674
MALE POPULATION
4,571
FEMALE POPULATION
102.25
MALES / 100 FEMALES
97.80
FEMALES / 100 MALES
37.9
MEDIAN AGE
3.2
AVG FAMILY SIZE
2.8
AVG HOUSEHOLD SIZE
4,846
LABOR FORCE [ PEOPLE ]
68.1%
PERCENT IN LABOR FORCE
6.6%
UNEMPLOYMENT RATE
Income in Haiku Pauwela
Income Overview in Haiku Pauwela
Per Capita Income in Haiku Pauwela is $41,010, while median incomes of families and households are $94,193 and $94,495 respectively.
| Characteristic | Number | Measure |
| Per Capita Income | 9,245 | $41,010 |
| Median Family Income | 2,389 | $94,193 |
| Mean Family Income | 2,389 | $120,919 |
| Median Household Income | 3,268 | $94,495 |
| Mean Household Income | 3,268 | $114,817 |
| Income Deficit | 2,389 | $0 |
| Wage / Income Gap (%) | 9,245 | 3.51% |
| Wage / Income Gap ($) | 9,245 | 96.49¢ per $1 |
| Gini / Inequality Index | 9,245 | 0.37 |
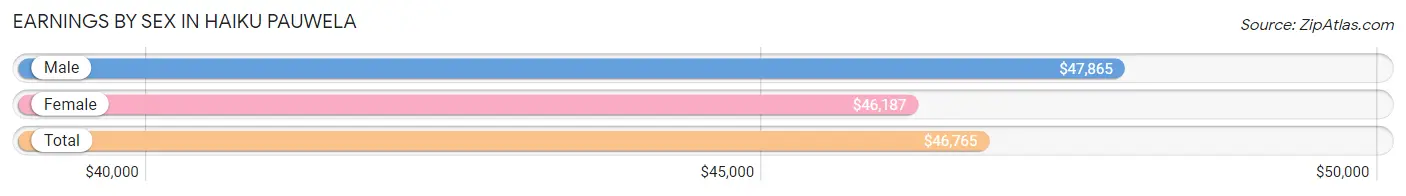
Earnings by Sex in Haiku Pauwela
Average Earnings in Haiku Pauwela are $46,765, $47,865 for men and $46,187 for women, a difference of 3.5%.
| Sex | Number | Average Earnings |
| Male | 2,583 (51.2%) | $47,865 |
| Female | 2,458 (48.8%) | $46,187 |
| Total | 5,041 (100.0%) | $46,765 |
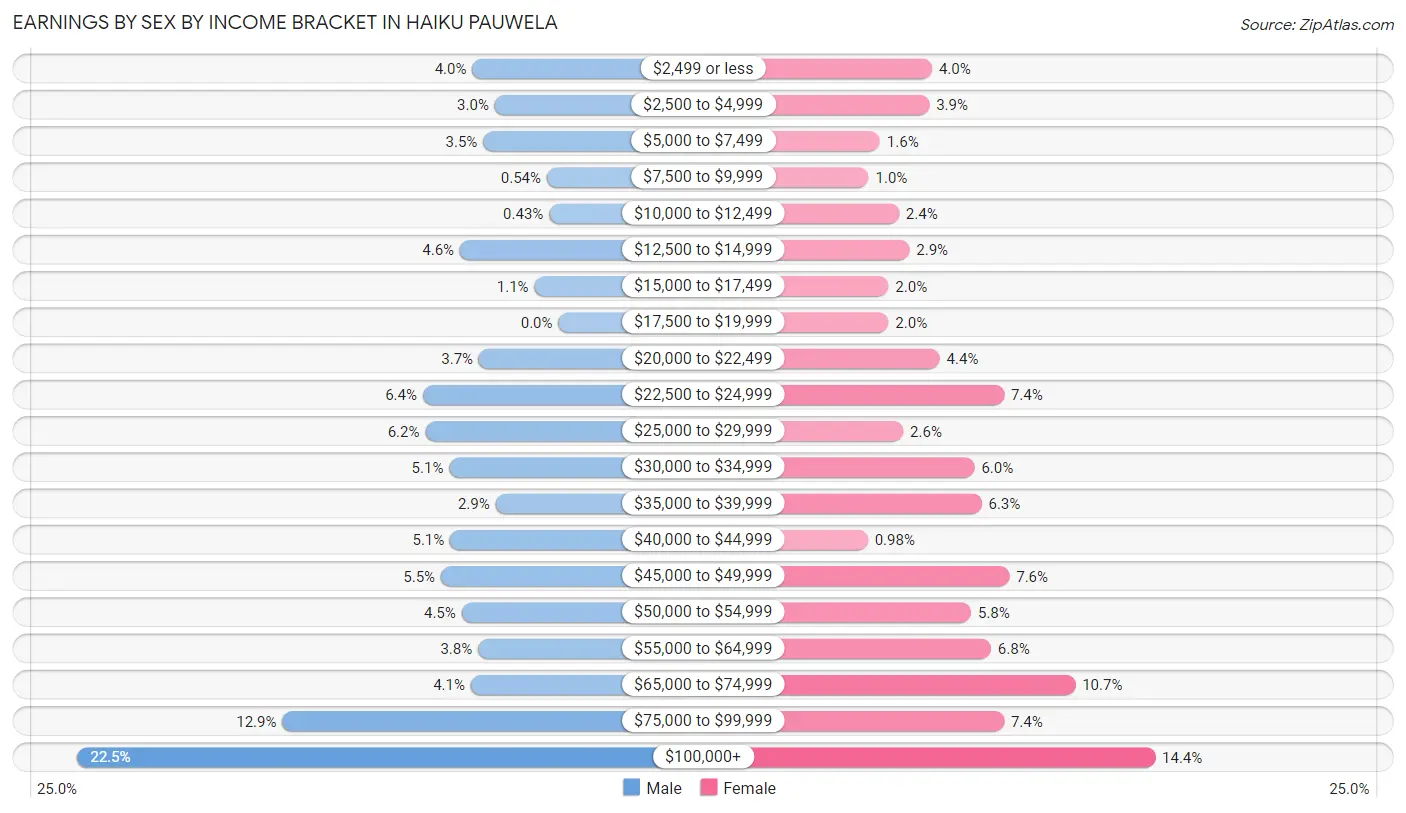
Earnings by Sex by Income Bracket in Haiku Pauwela
The most common earnings brackets in Haiku Pauwela are $100,000+ for men (582 | 22.5%) and $100,000+ for women (355 | 14.4%).
| Income | Male | Female |
| $2,499 or less | 104 (4.0%) | 98 (4.0%) |
| $2,500 to $4,999 | 77 (3.0%) | 95 (3.9%) |
| $5,000 to $7,499 | 91 (3.5%) | 38 (1.5%) |
| $7,500 to $9,999 | 14 (0.5%) | 25 (1.0%) |
| $10,000 to $12,499 | 11 (0.4%) | 60 (2.4%) |
| $12,500 to $14,999 | 119 (4.6%) | 72 (2.9%) |
| $15,000 to $17,499 | 29 (1.1%) | 48 (1.9%) |
| $17,500 to $19,999 | 0 (0.0%) | 48 (1.9%) |
| $20,000 to $22,499 | 96 (3.7%) | 107 (4.3%) |
| $22,500 to $24,999 | 164 (6.4%) | 181 (7.4%) |
| $25,000 to $29,999 | 161 (6.2%) | 65 (2.6%) |
| $30,000 to $34,999 | 132 (5.1%) | 147 (6.0%) |
| $35,000 to $39,999 | 76 (2.9%) | 155 (6.3%) |
| $40,000 to $44,999 | 131 (5.1%) | 24 (1.0%) |
| $45,000 to $49,999 | 142 (5.5%) | 187 (7.6%) |
| $50,000 to $54,999 | 117 (4.5%) | 143 (5.8%) |
| $55,000 to $64,999 | 97 (3.8%) | 166 (6.8%) |
| $65,000 to $74,999 | 106 (4.1%) | 263 (10.7%) |
| $75,000 to $99,999 | 334 (12.9%) | 181 (7.4%) |
| $100,000+ | 582 (22.5%) | 355 (14.4%) |
| Total | 2,583 (100.0%) | 2,458 (100.0%) |
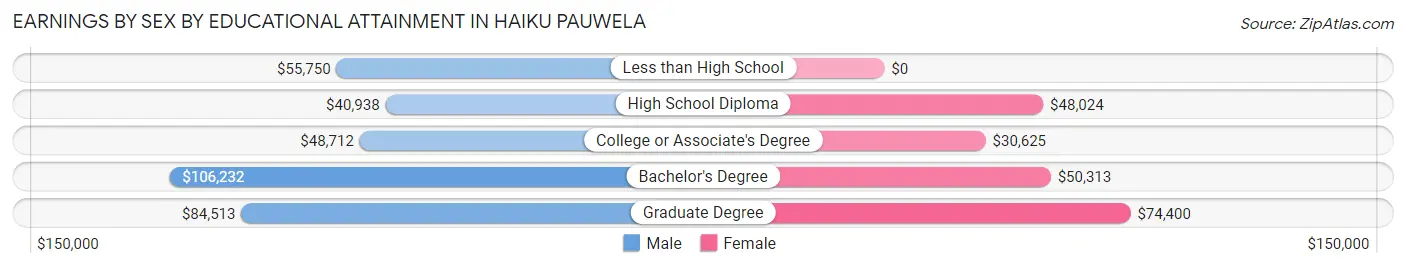
Earnings by Sex by Educational Attainment in Haiku Pauwela
Average earnings in Haiku Pauwela are $52,219 for men and $48,099 for women, a difference of 7.9%. Men with an educational attainment of bachelor's degree enjoy the highest average annual earnings of $106,232, while those with high school diploma education earn the least with $40,938. Women with an educational attainment of graduate degree earn the most with the average annual earnings of $74,400, while those with college or associate's degree education have the smallest earnings of $30,625.
| Educational Attainment | Male Income | Female Income |
| Less than High School | $55,750 | $0 |
| High School Diploma | $40,938 | $48,024 |
| College or Associate's Degree | $48,712 | $30,625 |
| Bachelor's Degree | $106,232 | $50,313 |
| Graduate Degree | $84,513 | $74,400 |
| Total | $52,219 | $48,099 |
Family Income in Haiku Pauwela
Family Income Brackets in Haiku Pauwela
According to the Haiku Pauwela family income data, there are 805 families falling into the $75,000 to $99,999 income range, which is the most common income bracket and makes up 33.7% of all families. Conversely, the $10,000 to $14,999 income bracket is the least frequent group with only 7 families (0.3%) belonging to this category.
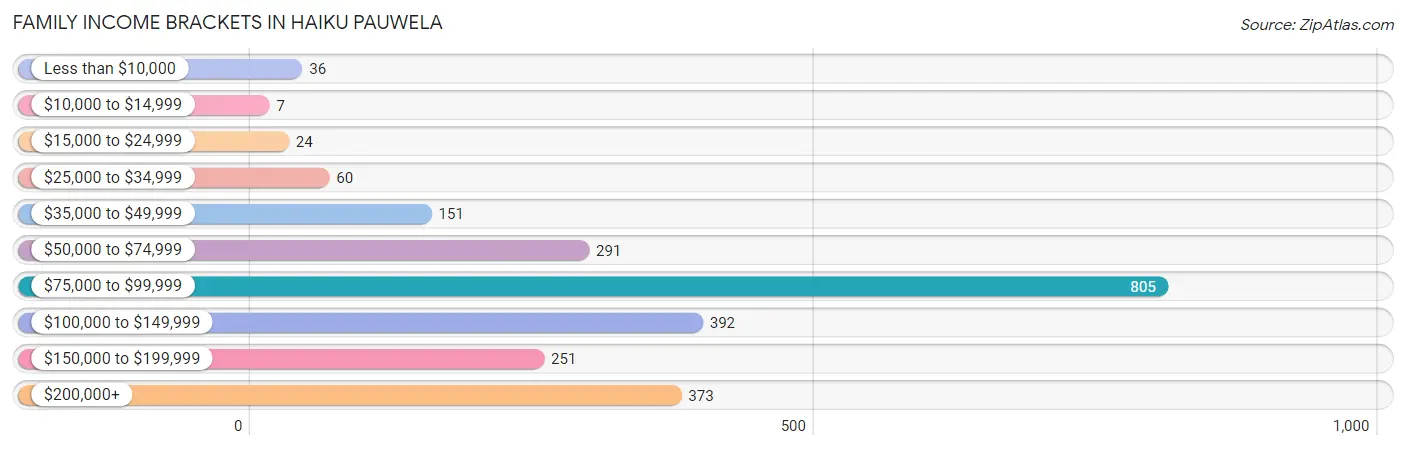
| Income Bracket | # Families | % Families |
| Less than $10,000 | 36 | 1.5% |
| $10,000 to $14,999 | 7 | 0.3% |
| $15,000 to $24,999 | 24 | 1.0% |
| $25,000 to $34,999 | 60 | 2.5% |
| $35,000 to $49,999 | 151 | 6.3% |
| $50,000 to $74,999 | 291 | 12.2% |
| $75,000 to $99,999 | 805 | 33.7% |
| $100,000 to $149,999 | 392 | 16.4% |
| $150,000 to $199,999 | 251 | 10.5% |
| $200,000+ | 373 | 15.6% |
Family Income by Famaliy Size in Haiku Pauwela
4-person families (476 | 19.9%) account for the highest median family income in Haiku Pauwela with $154,904 per family, while 2-person families (800 | 33.5%) have the highest median income of $41,806 per family member.
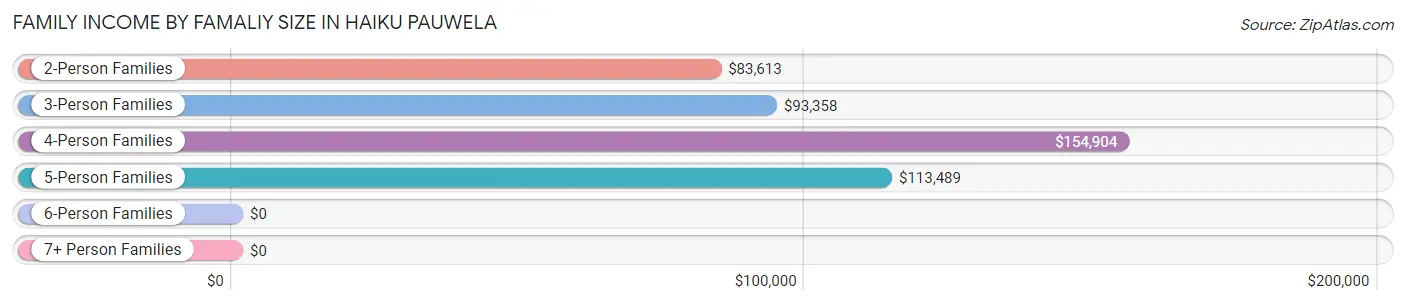
| Income Bracket | # Families | Median Income |
| 2-Person Families | 800 (33.5%) | $83,613 |
| 3-Person Families | 800 (33.5%) | $93,358 |
| 4-Person Families | 476 (19.9%) | $154,904 |
| 5-Person Families | 237 (9.9%) | $113,489 |
| 6-Person Families | 76 (3.2%) | $0 |
| 7+ Person Families | 0 (0.0%) | $0 |
| Total | 2,389 (100.0%) | $94,193 |
Family Income by Number of Earners in Haiku Pauwela
The median family income in Haiku Pauwela is $94,193, with families comprising 3+ earners (282) having the highest median family income of $165,679, while families with no earners (241) have the lowest median family income of $62,438, accounting for 11.8% and 10.1% of families, respectively.
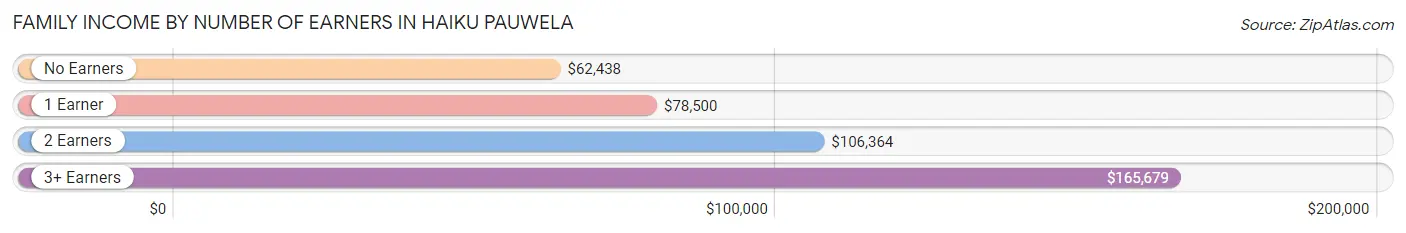
| Number of Earners | # Families | Median Income |
| No Earners | 241 (10.1%) | $62,438 |
| 1 Earner | 846 (35.4%) | $78,500 |
| 2 Earners | 1,020 (42.7%) | $106,364 |
| 3+ Earners | 282 (11.8%) | $165,679 |
| Total | 2,389 (100.0%) | $94,193 |
Household Income in Haiku Pauwela
Household Income Brackets in Haiku Pauwela
With 791 households falling in the category, the $75,000 to $99,999 income range is the most frequent in Haiku Pauwela, accounting for 24.2% of all households. In contrast, only 23 households (0.7%) fall into the $10,000 to $14,999 income bracket, making it the least populous group.
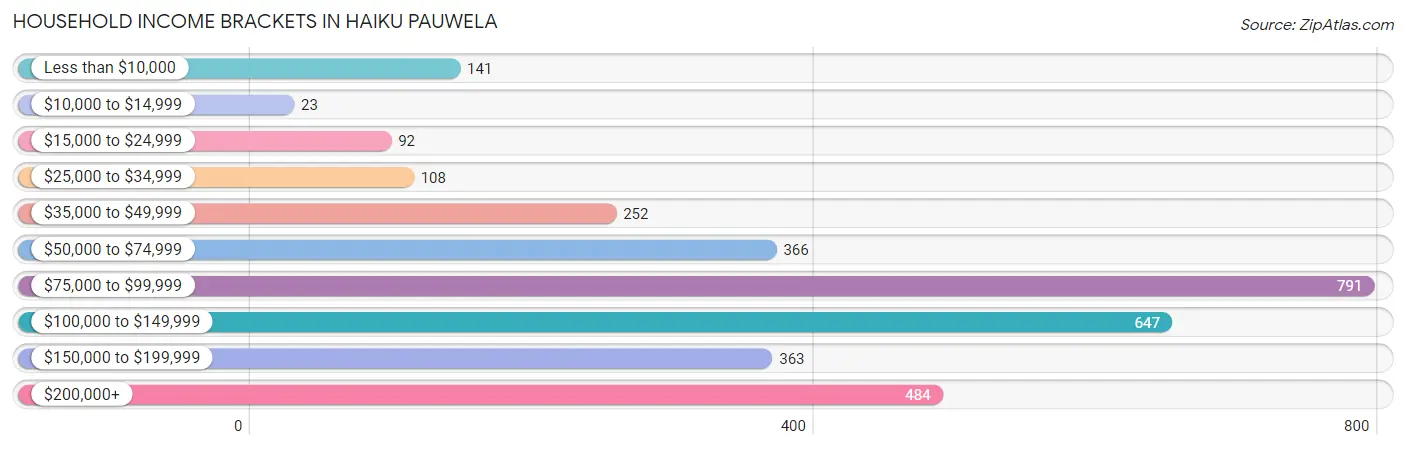
| Income Bracket | # Households | % Households |
| Less than $10,000 | 141 | 4.3% |
| $10,000 to $14,999 | 23 | 0.7% |
| $15,000 to $24,999 | 92 | 2.8% |
| $25,000 to $34,999 | 108 | 3.3% |
| $35,000 to $49,999 | 252 | 7.7% |
| $50,000 to $74,999 | 366 | 11.2% |
| $75,000 to $99,999 | 791 | 24.2% |
| $100,000 to $149,999 | 647 | 19.8% |
| $150,000 to $199,999 | 363 | 11.1% |
| $200,000+ | 484 | 14.8% |
Household Income by Householder Age in Haiku Pauwela
The median household income in Haiku Pauwela is $94,495, with the highest median household income of $106,637 found in the 45 to 64 years age bracket for the primary householder. A total of 1,215 households (37.2%) fall into this category. Meanwhile, the 15 to 24 years age bracket for the primary householder has the lowest median household income of $0, with 32 households (1.0%) in this group.
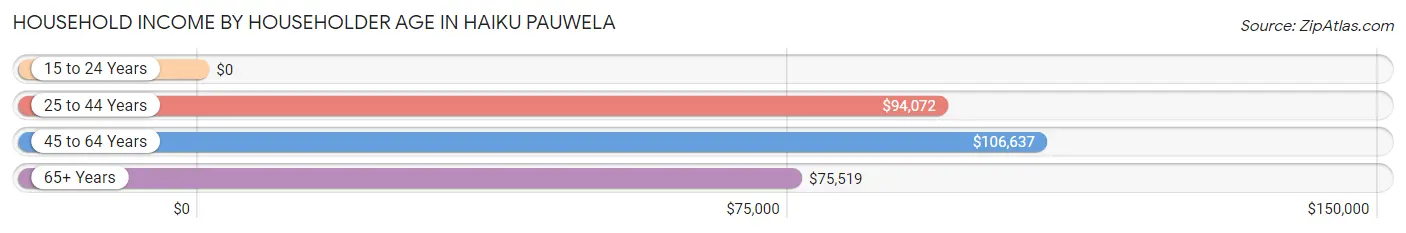
| Income Bracket | # Households | Median Income |
| 15 to 24 Years | 32 (1.0%) | $0 |
| 25 to 44 Years | 1,281 (39.2%) | $94,072 |
| 45 to 64 Years | 1,215 (37.2%) | $106,637 |
| 65+ Years | 740 (22.6%) | $75,519 |
| Total | 3,268 (100.0%) | $94,495 |
Poverty in Haiku Pauwela
Income Below Poverty by Sex and Age in Haiku Pauwela
With 6.1% poverty level for males and 4.5% for females among the residents of Haiku Pauwela, 75 year old and over males and 18 to 24 year old females are the most vulnerable to poverty, with 17 males (15.7%) and 20 females (12.8%) in their respective age groups living below the poverty level.
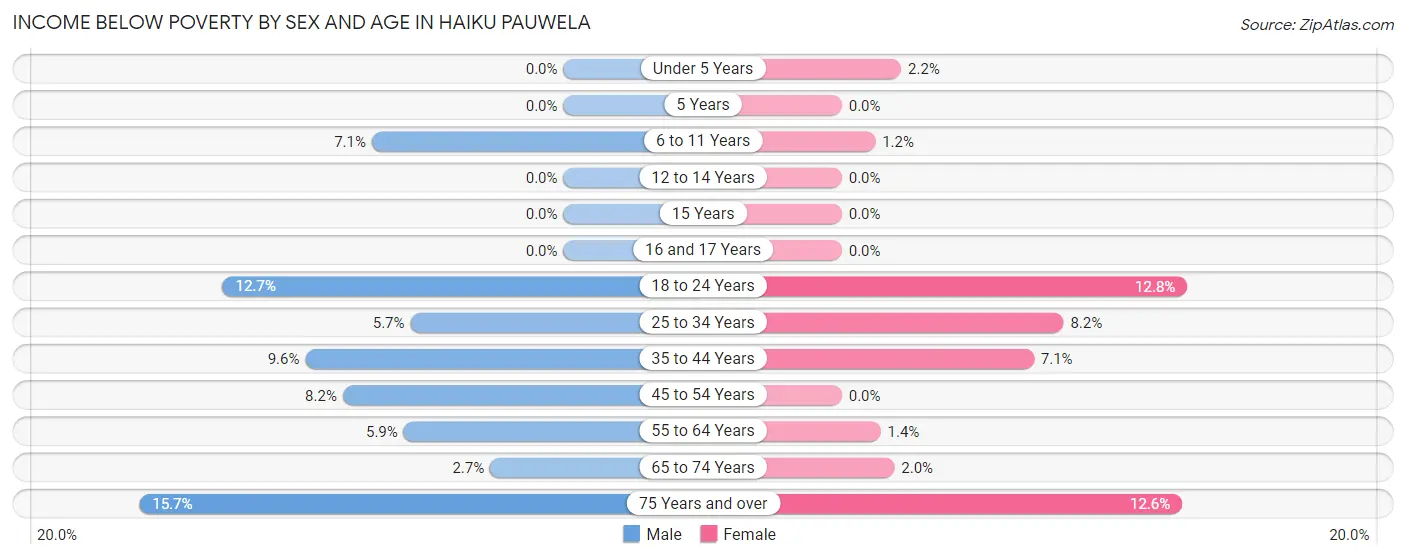
| Age Bracket | Male | Female |
| Under 5 Years | 0 (0.0%) | 8 (2.2%) |
| 5 Years | 0 (0.0%) | 0 (0.0%) |
| 6 to 11 Years | 33 (7.1%) | 5 (1.2%) |
| 12 to 14 Years | 0 (0.0%) | 0 (0.0%) |
| 15 Years | 0 (0.0%) | 0 (0.0%) |
| 16 and 17 Years | 0 (0.0%) | 0 (0.0%) |
| 18 to 24 Years | 32 (12.7%) | 20 (12.8%) |
| 25 to 34 Years | 44 (5.7%) | 58 (8.2%) |
| 35 to 44 Years | 60 (9.6%) | 61 (7.1%) |
| 45 to 54 Years | 44 (8.2%) | 0 (0.0%) |
| 55 to 64 Years | 36 (5.9%) | 9 (1.4%) |
| 65 to 74 Years | 16 (2.7%) | 7 (1.9%) |
| 75 Years and over | 17 (15.7%) | 36 (12.6%) |
| Total | 282 (6.1%) | 204 (4.5%) |
Income Above Poverty by Sex and Age in Haiku Pauwela
According to the poverty statistics in Haiku Pauwela, males aged under 5 years and females aged 5 years are the age groups that are most secure financially, with 100.0% of males and 100.0% of females in these age groups living above the poverty line.
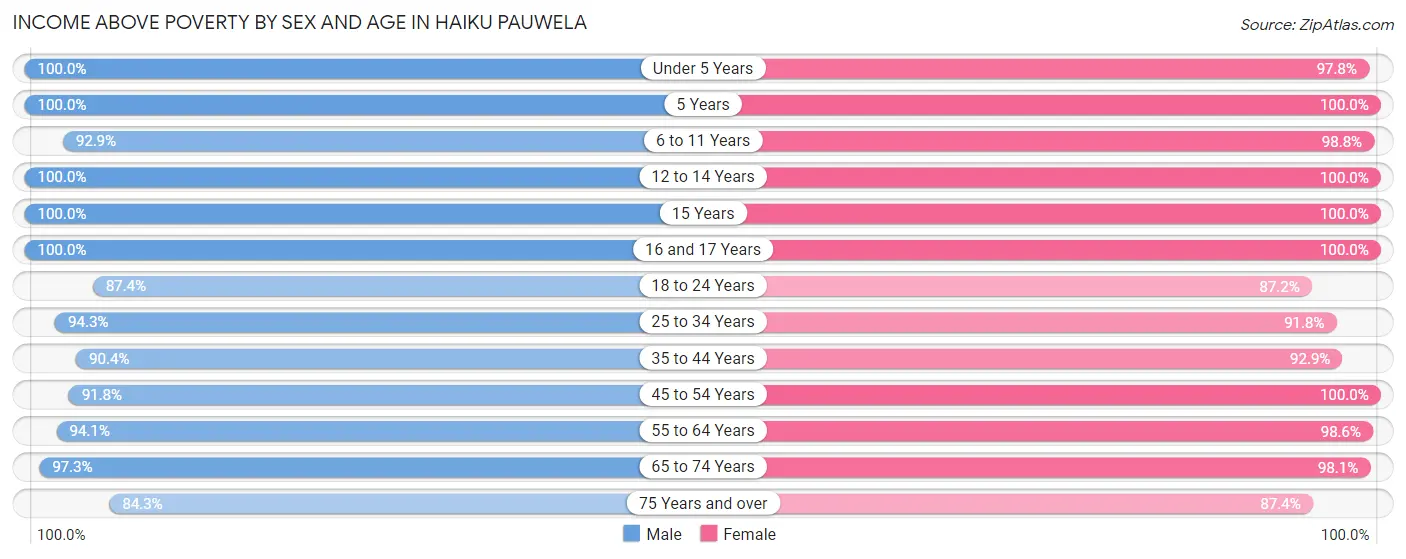
| Age Bracket | Male | Female |
| Under 5 Years | 256 (100.0%) | 356 (97.8%) |
| 5 Years | 137 (100.0%) | 88 (100.0%) |
| 6 to 11 Years | 431 (92.9%) | 398 (98.8%) |
| 12 to 14 Years | 165 (100.0%) | 128 (100.0%) |
| 15 Years | 22 (100.0%) | 43 (100.0%) |
| 16 and 17 Years | 93 (100.0%) | 31 (100.0%) |
| 18 to 24 Years | 221 (87.4%) | 136 (87.2%) |
| 25 to 34 Years | 731 (94.3%) | 647 (91.8%) |
| 35 to 44 Years | 566 (90.4%) | 795 (92.9%) |
| 45 to 54 Years | 493 (91.8%) | 510 (100.0%) |
| 55 to 64 Years | 571 (94.1%) | 618 (98.6%) |
| 65 to 74 Years | 572 (97.3%) | 352 (98.1%) |
| 75 Years and over | 91 (84.3%) | 249 (87.4%) |
| Total | 4,349 (93.9%) | 4,351 (95.5%) |
Income Below Poverty Among Married-Couple Families in Haiku Pauwela
The poverty statistics for married-couple families in Haiku Pauwela show that 1.0% or 18 of the total 1,823 families live below the poverty line. Families with no children have the highest poverty rate of 1.7%, comprising of 18 families. On the other hand, families with 1 or 2 children have the lowest poverty rate of 0.0%, which includes 0 families.
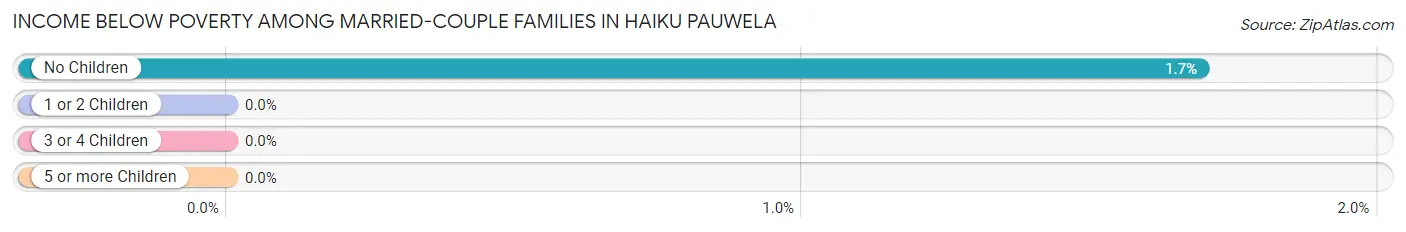
| Children | Above Poverty | Below Poverty |
| No Children | 1,046 (98.3%) | 18 (1.7%) |
| 1 or 2 Children | 558 (100.0%) | 0 (0.0%) |
| 3 or 4 Children | 201 (100.0%) | 0 (0.0%) |
| 5 or more Children | 0 (0.0%) | 0 (0.0%) |
| Total | 1,805 (99.0%) | 18 (1.0%) |
Income Below Poverty Among Single-Parent Households in Haiku Pauwela
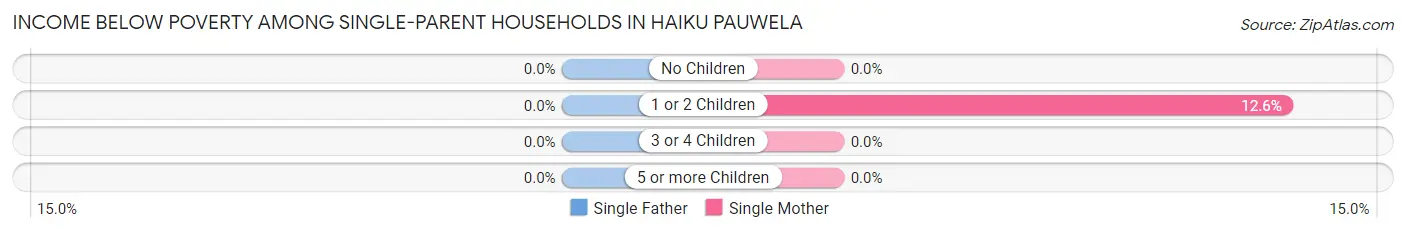
| Children | Single Father | Single Mother |
| No Children | 0 (0.0%) | 0 (0.0%) |
| 1 or 2 Children | 0 (0.0%) | 48 (12.6%) |
| 3 or 4 Children | 0 (0.0%) | 0 (0.0%) |
| 5 or more Children | 0 (0.0%) | 0 (0.0%) |
| Total | 0 (0.0%) | 48 (9.4%) |
Income Below Poverty Among Married-Couple vs Single-Parent Households in Haiku Pauwela
The poverty data for Haiku Pauwela shows that 18 of the married-couple family households (1.0%) and 48 of the single-parent households (8.5%) are living below the poverty level. Within the married-couple family households, those with no children have the highest poverty rate, with 18 households (1.7%) falling below the poverty line. Among the single-parent households, those with 1 or 2 children have the highest poverty rate, with 48 household (11.2%) living below poverty.
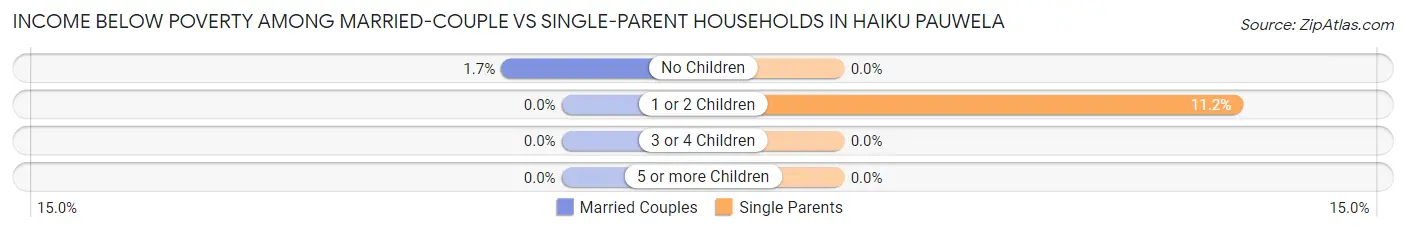
| Children | Married-Couple Families | Single-Parent Households |
| No Children | 18 (1.7%) | 0 (0.0%) |
| 1 or 2 Children | 0 (0.0%) | 48 (11.2%) |
| 3 or 4 Children | 0 (0.0%) | 0 (0.0%) |
| 5 or more Children | 0 (0.0%) | 0 (0.0%) |
| Total | 18 (1.0%) | 48 (8.5%) |
Race in Haiku Pauwela
The most populous races in Haiku Pauwela are White / Caucasian (5,002 | 54.1%), Two or more Races (2,887 | 31.2%), and Hispanic or Latino (1,348 | 14.6%).
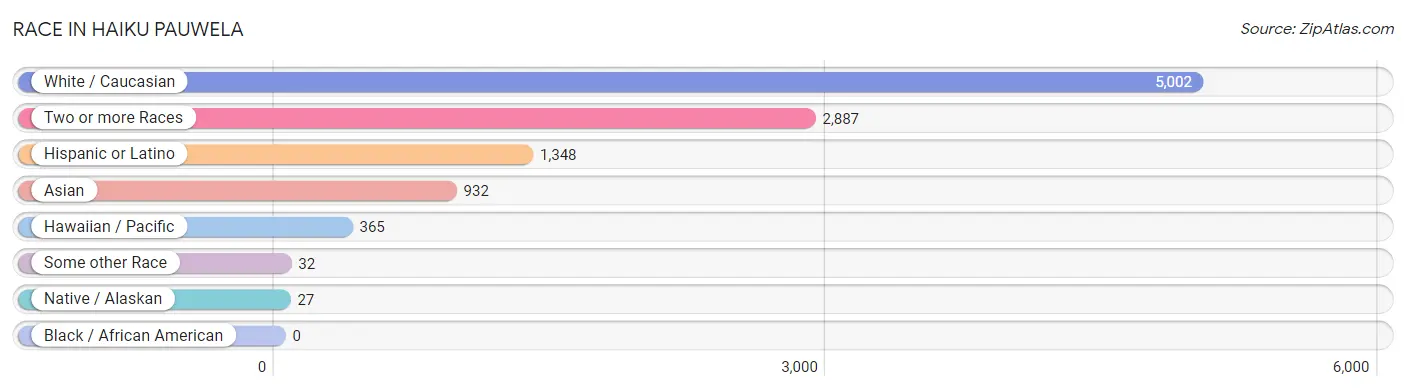
| Race | # Population | % Population |
| Asian | 932 | 10.1% |
| Black / African American | 0 | 0.0% |
| Hawaiian / Pacific | 365 | 4.0% |
| Hispanic or Latino | 1,348 | 14.6% |
| Native / Alaskan | 27 | 0.3% |
| White / Caucasian | 5,002 | 54.1% |
| Two or more Races | 2,887 | 31.2% |
| Some other Race | 32 | 0.4% |
| Total | 9,245 | 100.0% |
Ancestry in Haiku Pauwela
The most populous ancestries reported in Haiku Pauwela are Native Hawaiian (2,115 | 22.9%), Indian (Asian) (1,459 | 15.8%), Bhutanese (1,455 | 15.7%), Korean (1,444 | 15.6%), and English (729 | 7.9%), together accounting for 77.9% of all Haiku Pauwela residents.
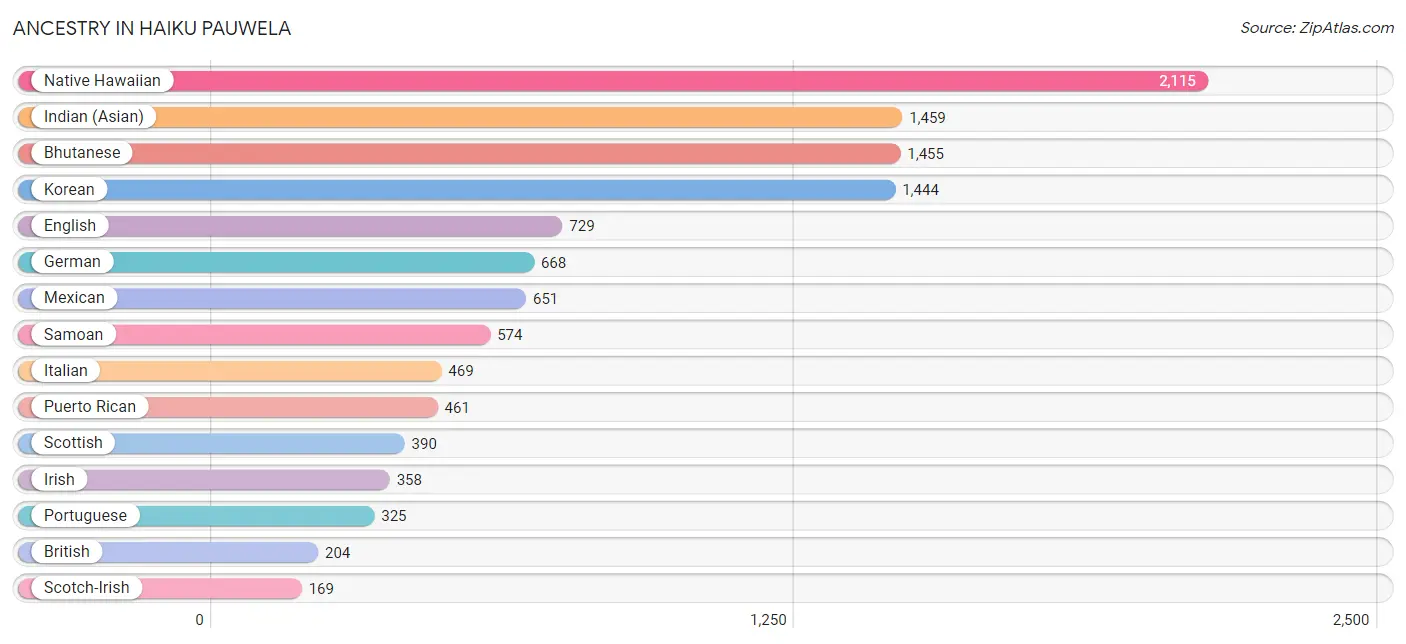
| Ancestry | # Population | % Population |
| American | 99 | 1.1% |
| Arab | 24 | 0.3% |
| Argentinean | 75 | 0.8% |
| Belgian | 12 | 0.1% |
| Bhutanese | 1,455 | 15.7% |
| Brazilian | 10 | 0.1% |
| British | 204 | 2.2% |
| Burmese | 116 | 1.3% |
| Cherokee | 133 | 1.4% |
| Danish | 11 | 0.1% |
| Dutch | 46 | 0.5% |
| Eastern European | 70 | 0.8% |
| Egyptian | 24 | 0.3% |
| English | 729 | 7.9% |
| Estonian | 60 | 0.6% |
| European | 110 | 1.2% |
| French | 55 | 0.6% |
| French Canadian | 105 | 1.1% |
| German | 668 | 7.2% |
| Guamanian / Chamorro | 51 | 0.5% |
| Hungarian | 26 | 0.3% |
| Indian (Asian) | 1,459 | 15.8% |
| Irish | 358 | 3.9% |
| Italian | 469 | 5.1% |
| Korean | 1,444 | 15.6% |
| Laotian | 21 | 0.2% |
| Mexican | 651 | 7.0% |
| Mongolian | 8 | 0.1% |
| Native Hawaiian | 2,115 | 22.9% |
| Northern European | 157 | 1.7% |
| Norwegian | 134 | 1.5% |
| Pakistani | 11 | 0.1% |
| Peruvian | 31 | 0.3% |
| Polish | 75 | 0.8% |
| Portuguese | 325 | 3.5% |
| Puerto Rican | 461 | 5.0% |
| Romanian | 7 | 0.1% |
| Russian | 29 | 0.3% |
| Samoan | 574 | 6.2% |
| Scandinavian | 70 | 0.8% |
| Scotch-Irish | 169 | 1.8% |
| Scottish | 390 | 4.2% |
| South African | 169 | 1.8% |
| South American | 152 | 1.6% |
| South American Indian | 31 | 0.3% |
| Spanish | 84 | 0.9% |
| Sri Lankan | 14 | 0.2% |
| Subsaharan African | 169 | 1.8% |
| Swedish | 165 | 1.8% |
| Swiss | 43 | 0.5% |
| Turkish | 12 | 0.1% |
| Venezuelan | 46 | 0.5% |
| Welsh | 39 | 0.4% | View All 53 Rows |
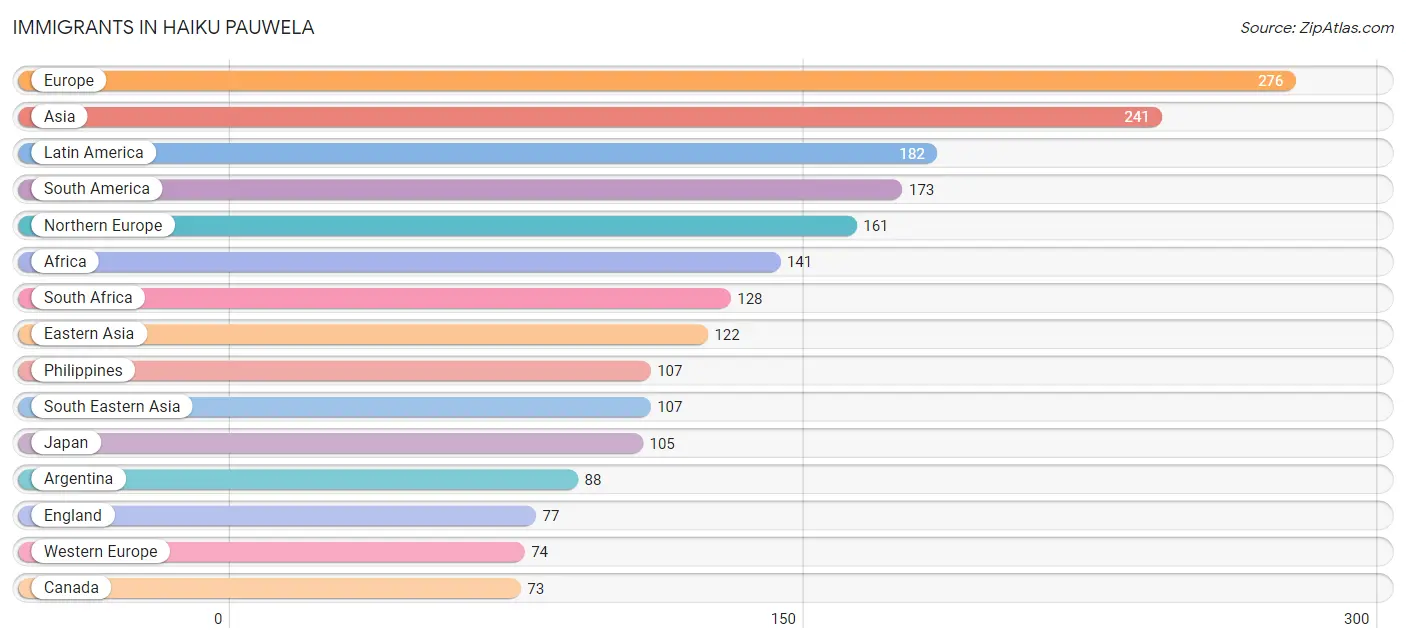
Immigrants in Haiku Pauwela
The most numerous immigrant groups reported in Haiku Pauwela came from Europe (276 | 3.0%), Asia (241 | 2.6%), Latin America (182 | 2.0%), South America (173 | 1.9%), and Northern Europe (161 | 1.7%), together accounting for 11.2% of all Haiku Pauwela residents.
| Immigration Origin | # Population | % Population |
| Africa | 141 | 1.5% |
| Argentina | 88 | 0.9% |
| Asia | 241 | 2.6% |
| Belgium | 12 | 0.1% |
| Brazil | 61 | 0.7% |
| Canada | 73 | 0.8% |
| Central America | 9 | 0.1% |
| China | 17 | 0.2% |
| Eastern Asia | 122 | 1.3% |
| Eastern Europe | 8 | 0.1% |
| Egypt | 13 | 0.1% |
| England | 77 | 0.8% |
| Europe | 276 | 3.0% |
| Germany | 62 | 0.7% |
| Italy | 17 | 0.2% |
| Japan | 105 | 1.1% |
| Latin America | 182 | 2.0% |
| Mexico | 9 | 0.1% |
| Northern Africa | 13 | 0.1% |
| Northern Europe | 161 | 1.7% |
| Oceania | 25 | 0.3% |
| Philippines | 107 | 1.2% |
| Poland | 8 | 0.1% |
| Portugal | 16 | 0.2% |
| South Africa | 128 | 1.4% |
| South America | 173 | 1.9% |
| South Eastern Asia | 107 | 1.2% |
| Southern Europe | 33 | 0.4% |
| Taiwan | 17 | 0.2% |
| Turkey | 12 | 0.1% |
| Venezuela | 24 | 0.3% |
| Western Asia | 12 | 0.1% |
| Western Europe | 74 | 0.8% | View All 33 Rows |
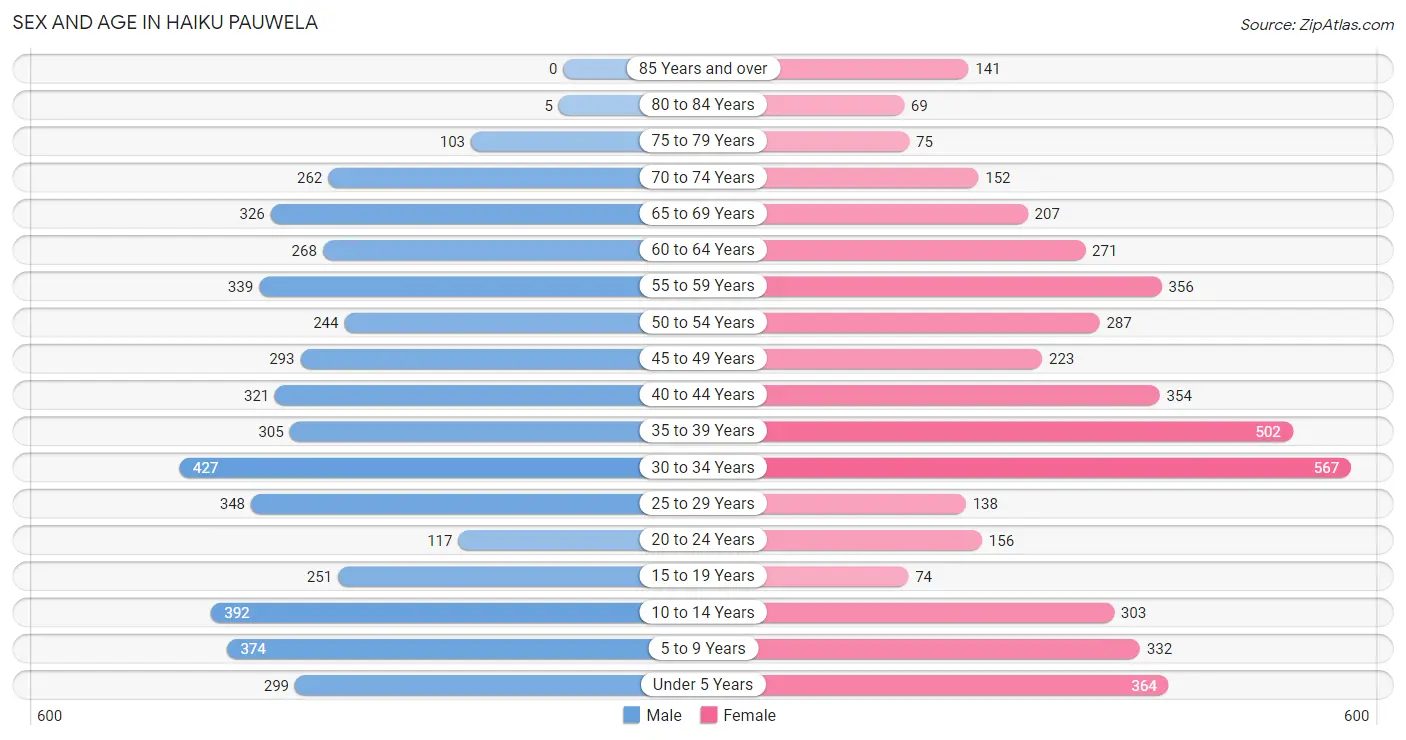
Sex and Age in Haiku Pauwela
Sex and Age in Haiku Pauwela
The most populous age groups in Haiku Pauwela are 30 to 34 Years (427 | 9.1%) for men and 30 to 34 Years (567 | 12.4%) for women.
| Age Bracket | Male | Female |
| Under 5 Years | 299 (6.4%) | 364 (8.0%) |
| 5 to 9 Years | 374 (8.0%) | 332 (7.3%) |
| 10 to 14 Years | 392 (8.4%) | 303 (6.6%) |
| 15 to 19 Years | 251 (5.4%) | 74 (1.6%) |
| 20 to 24 Years | 117 (2.5%) | 156 (3.4%) |
| 25 to 29 Years | 348 (7.4%) | 138 (3.0%) |
| 30 to 34 Years | 427 (9.1%) | 567 (12.4%) |
| 35 to 39 Years | 305 (6.5%) | 502 (11.0%) |
| 40 to 44 Years | 321 (6.9%) | 354 (7.7%) |
| 45 to 49 Years | 293 (6.3%) | 223 (4.9%) |
| 50 to 54 Years | 244 (5.2%) | 287 (6.3%) |
| 55 to 59 Years | 339 (7.2%) | 356 (7.8%) |
| 60 to 64 Years | 268 (5.7%) | 271 (5.9%) |
| 65 to 69 Years | 326 (7.0%) | 207 (4.5%) |
| 70 to 74 Years | 262 (5.6%) | 152 (3.3%) |
| 75 to 79 Years | 103 (2.2%) | 75 (1.6%) |
| 80 to 84 Years | 5 (0.1%) | 69 (1.5%) |
| 85 Years and over | 0 (0.0%) | 141 (3.1%) |
| Total | 4,674 (100.0%) | 4,571 (100.0%) |
Families and Households in Haiku Pauwela
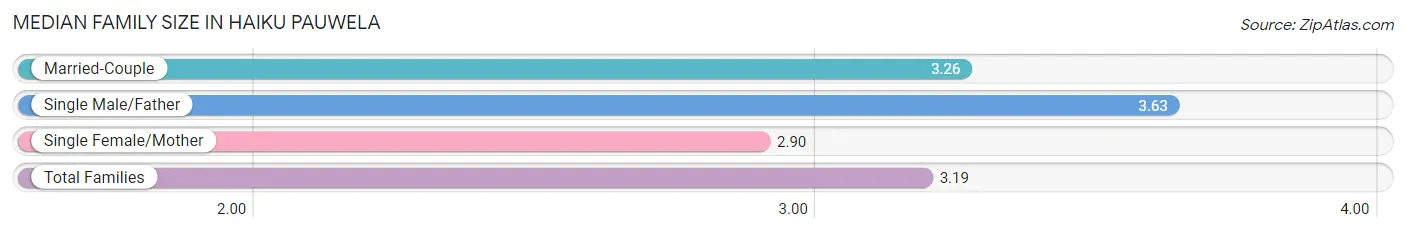
Median Family Size in Haiku Pauwela
The median family size in Haiku Pauwela is 3.19 persons per family, with single male/father families (57 | 2.4%) accounting for the largest median family size of 3.63 persons per family. On the other hand, single female/mother families (509 | 21.3%) represent the smallest median family size with 2.90 persons per family.
| Family Type | # Families | Family Size |
| Married-Couple | 1,823 (76.3%) | 3.26 |
| Single Male/Father | 57 (2.4%) | 3.63 |
| Single Female/Mother | 509 (21.3%) | 2.90 |
| Total Families | 2,389 (100.0%) | 3.19 |
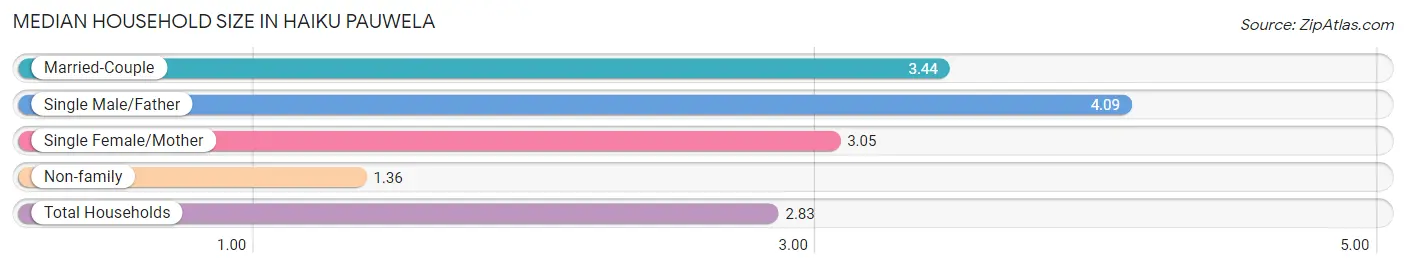
Median Household Size in Haiku Pauwela
The median household size in Haiku Pauwela is 2.83 persons per household, with single male/father households (57 | 1.7%) accounting for the largest median household size of 4.09 persons per household. non-family households (879 | 26.9%) represent the smallest median household size with 1.36 persons per household.
| Household Type | # Households | Household Size |
| Married-Couple | 1,823 (55.8%) | 3.44 |
| Single Male/Father | 57 (1.7%) | 4.09 |
| Single Female/Mother | 509 (15.6%) | 3.05 |
| Non-family | 879 (26.9%) | 1.36 |
| Total Households | 3,268 (100.0%) | 2.83 |
Household Size by Marriage Status in Haiku Pauwela
Out of a total of 3,268 households in Haiku Pauwela, 2,389 (73.1%) are family households, while 879 (26.9%) are nonfamily households. The most numerous type of family households are 3-person households, comprising 777, and the most common type of nonfamily households are 1-person households, comprising 582.
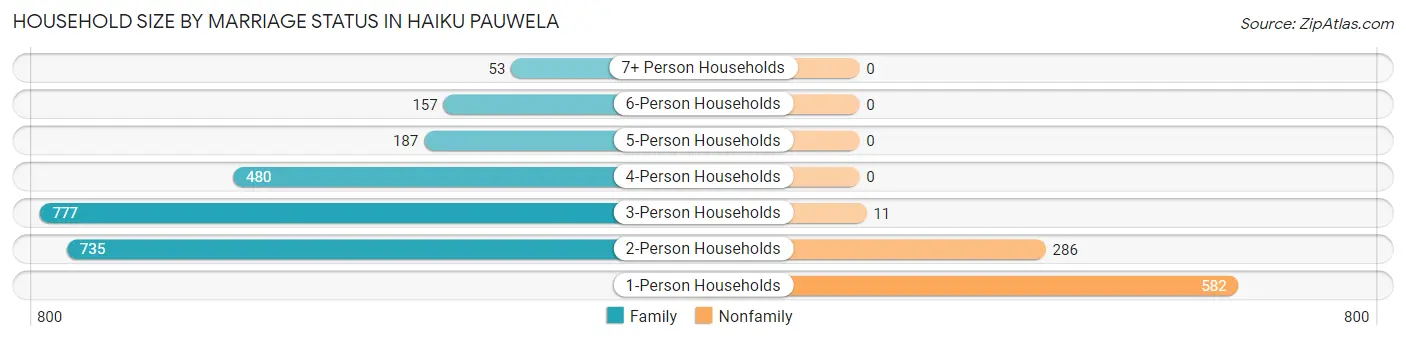
| Household Size | Family Households | Nonfamily Households |
| 1-Person Households | - | 582 (17.8%) |
| 2-Person Households | 735 (22.5%) | 286 (8.7%) |
| 3-Person Households | 777 (23.8%) | 11 (0.3%) |
| 4-Person Households | 480 (14.7%) | 0 (0.0%) |
| 5-Person Households | 187 (5.7%) | 0 (0.0%) |
| 6-Person Households | 157 (4.8%) | 0 (0.0%) |
| 7+ Person Households | 53 (1.6%) | 0 (0.0%) |
| Total | 2,389 (73.1%) | 879 (26.9%) |
Female Fertility in Haiku Pauwela
Fertility by Age in Haiku Pauwela
Average fertility rate in Haiku Pauwela is 118.0 births per 1,000 women. Women in the age bracket of 20 to 34 years have the highest fertility rate with 132.0 births per 1,000 women. Women in the age bracket of 35 to 50 years acount for 53.5% of all women with births.
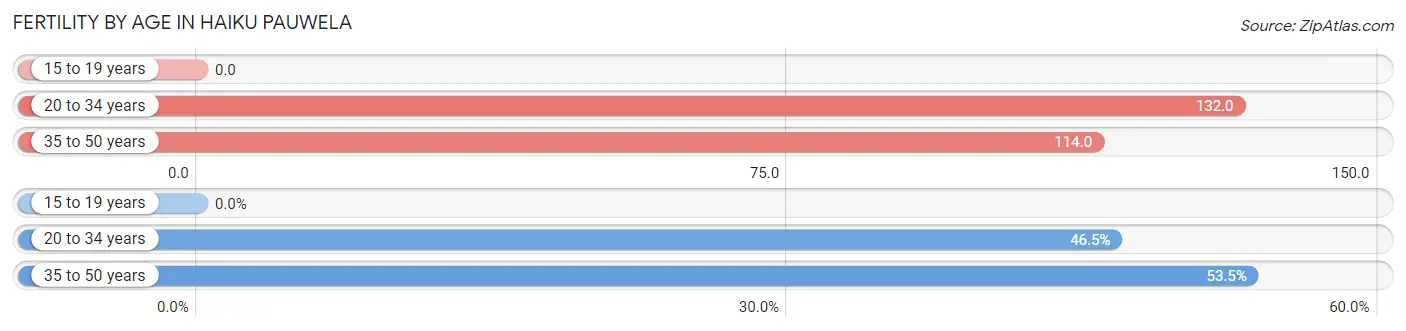
| Age Bracket | Women with Births | Births / 1,000 Women |
| 15 to 19 years | 0 (0.0%) | 0.0 |
| 20 to 34 years | 114 (46.5%) | 132.0 |
| 35 to 50 years | 131 (53.5%) | 114.0 |
| Total | 245 (100.0%) | 118.0 |
Fertility by Age by Marriage Status in Haiku Pauwela
71.4% of women with births (245) in Haiku Pauwela are married. The highest percentage of unmarried women with births falls into 20 to 34 years age bracket with 53.5% of them unmarried at the time of birth, while the lowest percentage of unmarried women with births belong to 35 to 50 years age bracket with 6.9% of them unmarried.

| Age Bracket | Married | Unmarried |
| 15 to 19 years | 0 (0.0%) | 0 (0.0%) |
| 20 to 34 years | 53 (46.5%) | 61 (53.5%) |
| 35 to 50 years | 122 (93.1%) | 9 (6.9%) |
| Total | 175 (71.4%) | 70 (28.6%) |
Fertility by Education in Haiku Pauwela
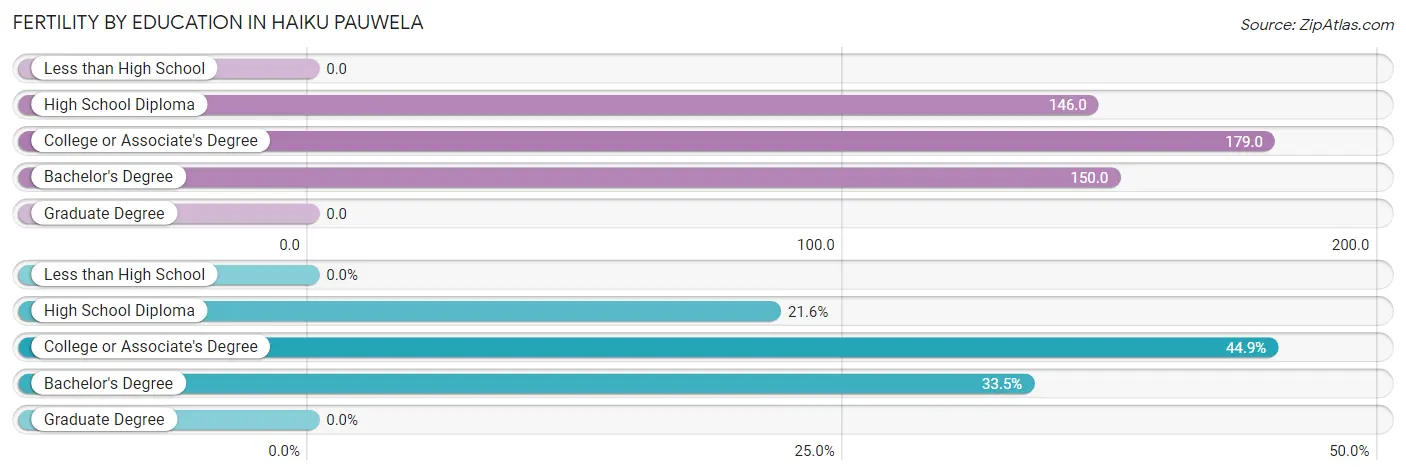
| Educational Attainment | Women with Births | Births / 1,000 Women |
| Less than High School | 0 (0.0%) | 0.0 |
| High School Diploma | 53 (21.6%) | 146.0 |
| College or Associate's Degree | 110 (44.9%) | 179.0 |
| Bachelor's Degree | 82 (33.5%) | 150.0 |
| Graduate Degree | 0 (0.0%) | 0.0 |
| Total | 245 (100.0%) | 118.0 |
Fertility by Education by Marriage Status in Haiku Pauwela
28.6% of women with births in Haiku Pauwela are unmarried. Women with the educational attainment of college or associate's degree are most likely to be married with 92.7% of them married at childbirth, while women with the educational attainment of high school diploma are least likely to be married with 100.0% of them unmarried at childbirth.
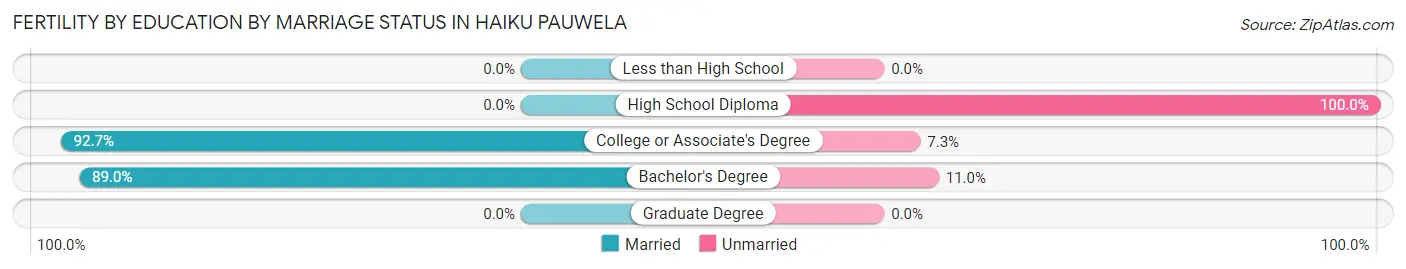
| Educational Attainment | Married | Unmarried |
| Less than High School | 0 (0.0%) | 0 (0.0%) |
| High School Diploma | 0 (0.0%) | 53 (100.0%) |
| College or Associate's Degree | 102 (92.7%) | 8 (7.3%) |
| Bachelor's Degree | 73 (89.0%) | 9 (11.0%) |
| Graduate Degree | 0 (0.0%) | 0 (0.0%) |
| Total | 175 (71.4%) | 70 (28.6%) |
Employment Characteristics in Haiku Pauwela
Employment by Class of Employer in Haiku Pauwela
Among the 4,256 employed individuals in Haiku Pauwela, private company employees (2,626 | 61.7%), not-for-profit organizations (408 | 9.6%), and self-employed (incorporated) (382 | 9.0%) make up the most common classes of employment.
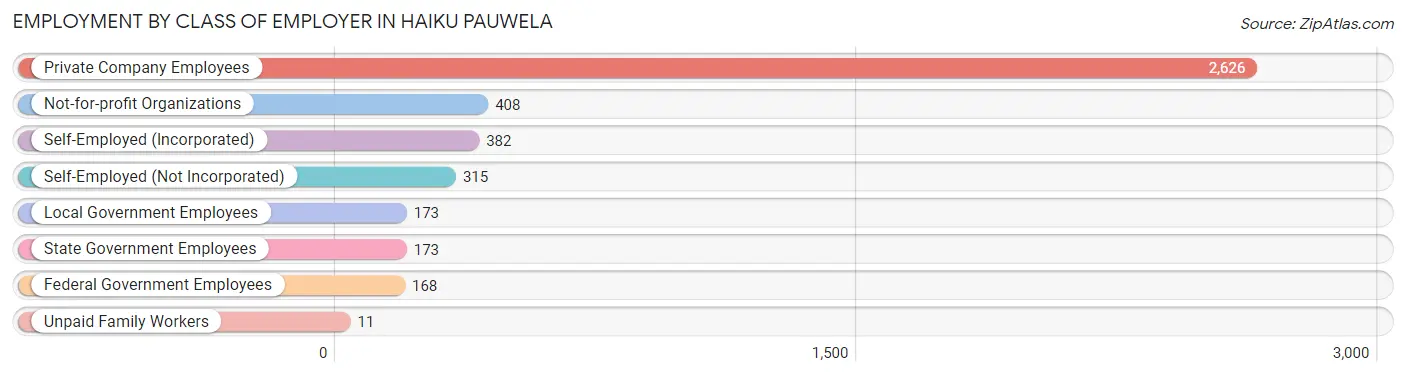
| Employer Class | # Employees | % Employees |
| Private Company Employees | 2,626 | 61.7% |
| Self-Employed (Incorporated) | 382 | 9.0% |
| Self-Employed (Not Incorporated) | 315 | 7.4% |
| Not-for-profit Organizations | 408 | 9.6% |
| Local Government Employees | 173 | 4.1% |
| State Government Employees | 173 | 4.1% |
| Federal Government Employees | 168 | 4.0% |
| Unpaid Family Workers | 11 | 0.3% |
| Total | 4,256 | 100.0% |
Employment Status by Age in Haiku Pauwela
According to the labor force statistics for Haiku Pauwela, out of the total population over 16 years of age (7,116), 68.1% or 4,846 individuals are in the labor force, with 6.6% or 320 of them unemployed. The age group with the highest labor force participation rate is 25 to 29 years, with 98.4% or 478 individuals in the labor force. Within the labor force, the 75 years and over age range has the highest percentage of unemployed individuals, with 23.5% or 12 of them being unemployed.
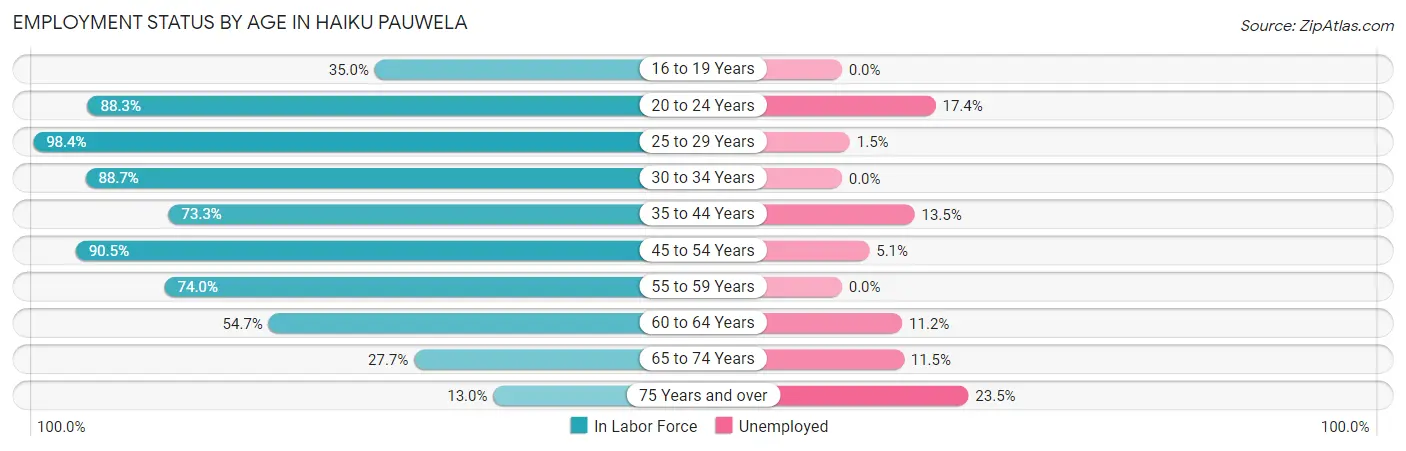
| Age Bracket | In Labor Force | Unemployed |
| 16 to 19 Years | 91 (35.0%) | 0 (0.0%) |
| 20 to 24 Years | 241 (88.3%) | 42 (17.4%) |
| 25 to 29 Years | 478 (98.4%) | 7 (1.5%) |
| 30 to 34 Years | 882 (88.7%) | 0 (0.0%) |
| 35 to 44 Years | 1,086 (73.3%) | 147 (13.5%) |
| 45 to 54 Years | 948 (90.5%) | 48 (5.1%) |
| 55 to 59 Years | 514 (74.0%) | 0 (0.0%) |
| 60 to 64 Years | 295 (54.7%) | 33 (11.2%) |
| 65 to 74 Years | 262 (27.7%) | 30 (11.5%) |
| 75 Years and over | 51 (13.0%) | 12 (23.5%) |
| Total | 4,846 (68.1%) | 320 (6.6%) |
Employment Status by Educational Attainment in Haiku Pauwela
According to labor force statistics for Haiku Pauwela, 80.2% of individuals (4,205) out of the total population between 25 and 64 years of age (5,243) are in the labor force, with 5.6% or 235 of them being unemployed. The group with the highest labor force participation rate are those with the educational attainment of less than high school, with 89.8% or 655 individuals in the labor force. Within the labor force, individuals with high school diploma education have the highest percentage of unemployment, with 9.1% or 80 of them being unemployed.
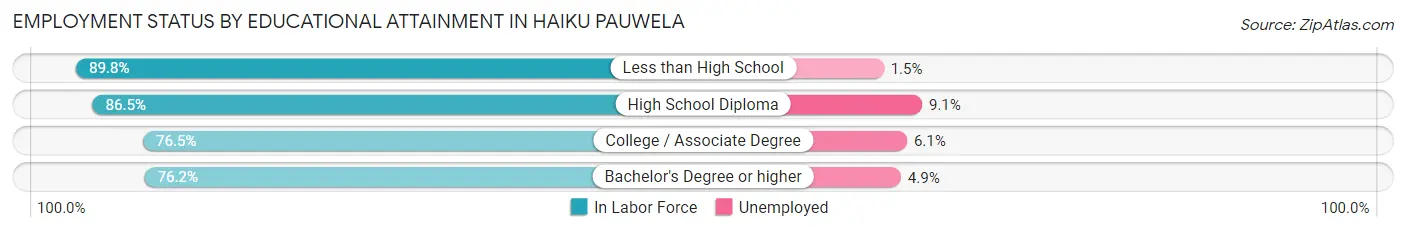
| Educational Attainment | In Labor Force | Unemployed |
| Less than High School | 655 (89.8%) | 11 (1.5%) |
| High School Diploma | 883 (86.5%) | 93 (9.1%) |
| College / Associate Degree | 1,265 (76.5%) | 101 (6.1%) |
| Bachelor's Degree or higher | 1,402 (76.2%) | 90 (4.9%) |
| Total | 4,205 (80.2%) | 294 (5.6%) |
Employment Occupations by Sex in Haiku Pauwela
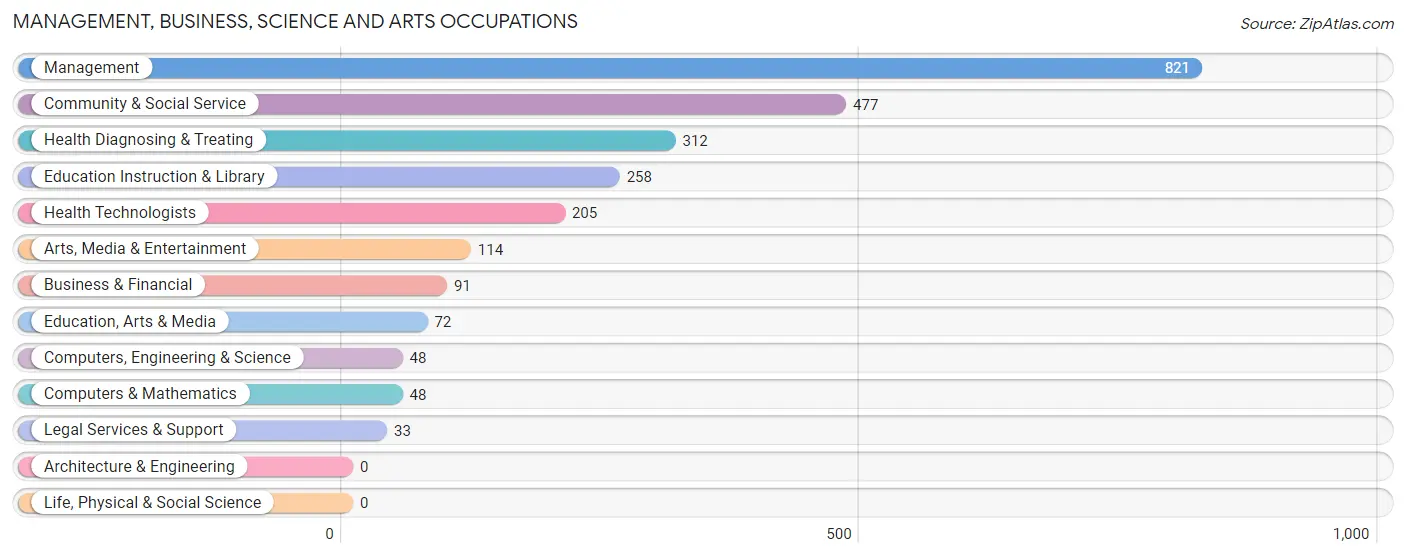
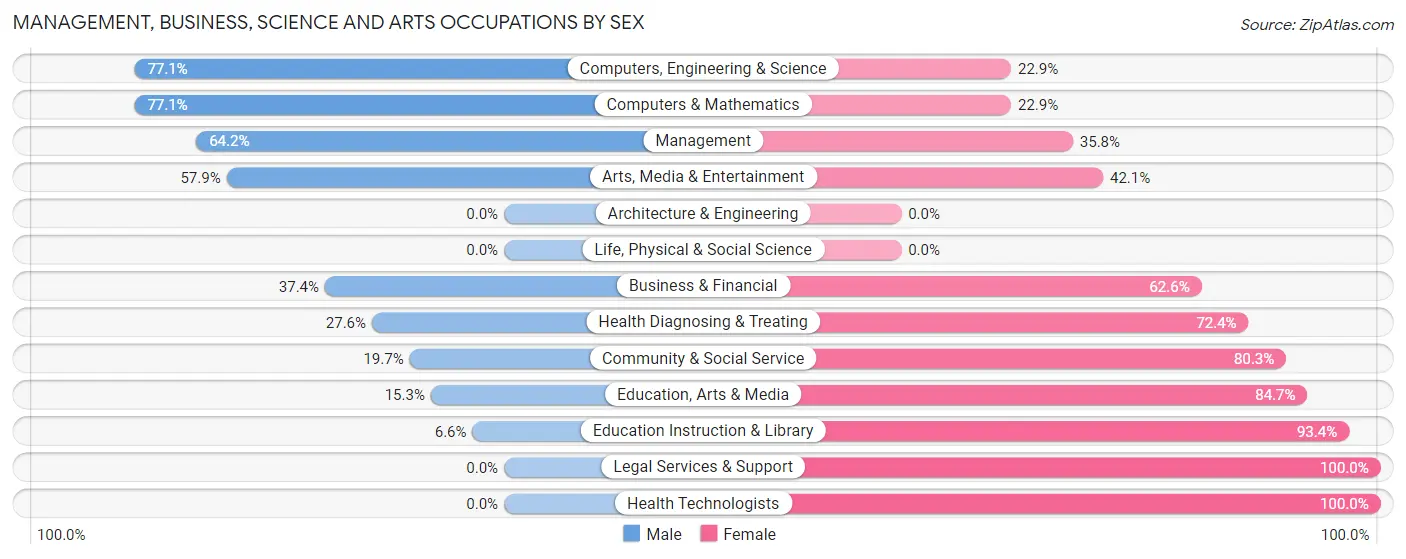
Management, Business, Science and Arts Occupations
The most common Management, Business, Science and Arts occupations in Haiku Pauwela are Management (821 | 18.1%), Community & Social Service (477 | 10.5%), Health Diagnosing & Treating (312 | 6.9%), Education Instruction & Library (258 | 5.7%), and Health Technologists (205 | 4.5%).
Management, Business, Science and Arts Occupations by Sex
Within the Management, Business, Science and Arts occupations in Haiku Pauwela, the most male-oriented occupations are Computers, Engineering & Science (77.1%), Computers & Mathematics (77.1%), and Management (64.2%), while the most female-oriented occupations are Legal Services & Support (100.0%), Health Technologists (100.0%), and Education Instruction & Library (93.4%).
| Occupation | Male | Female |
| Management | 527 (64.2%) | 294 (35.8%) |
| Business & Financial | 34 (37.4%) | 57 (62.6%) |
| Computers, Engineering & Science | 37 (77.1%) | 11 (22.9%) |
| Computers & Mathematics | 37 (77.1%) | 11 (22.9%) |
| Architecture & Engineering | 0 (0.0%) | 0 (0.0%) |
| Life, Physical & Social Science | 0 (0.0%) | 0 (0.0%) |
| Community & Social Service | 94 (19.7%) | 383 (80.3%) |
| Education, Arts & Media | 11 (15.3%) | 61 (84.7%) |
| Legal Services & Support | 0 (0.0%) | 33 (100.0%) |
| Education Instruction & Library | 17 (6.6%) | 241 (93.4%) |
| Arts, Media & Entertainment | 66 (57.9%) | 48 (42.1%) |
| Health Diagnosing & Treating | 86 (27.6%) | 226 (72.4%) |
| Health Technologists | 0 (0.0%) | 205 (100.0%) |
| Total (Category) | 778 (44.5%) | 971 (55.5%) |
| Total (Overall) | 2,402 (53.0%) | 2,128 (47.0%) |
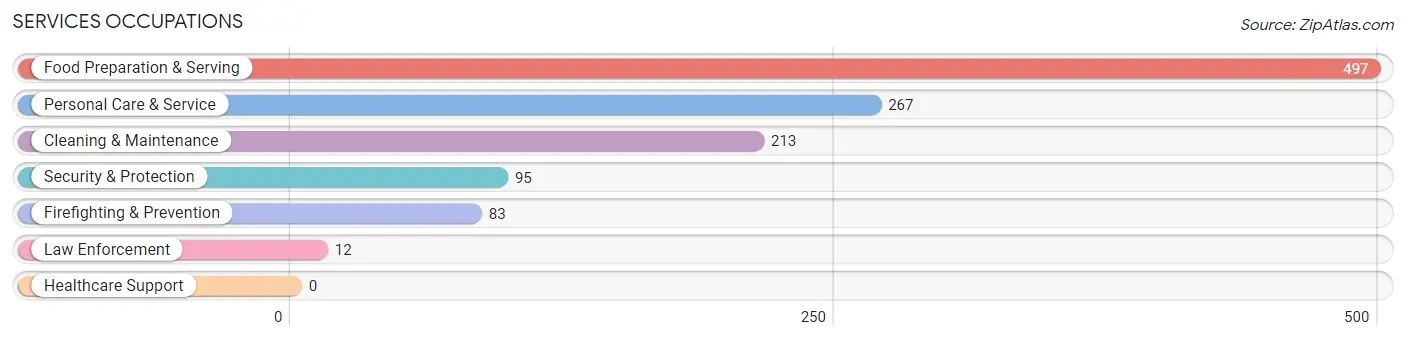
Services Occupations
The most common Services occupations in Haiku Pauwela are Food Preparation & Serving (497 | 11.0%), Personal Care & Service (267 | 5.9%), Cleaning & Maintenance (213 | 4.7%), Security & Protection (95 | 2.1%), and Firefighting & Prevention (83 | 1.8%).
Services Occupations by Sex
Within the Services occupations in Haiku Pauwela, the most male-oriented occupations are Security & Protection (100.0%), Firefighting & Prevention (100.0%), and Law Enforcement (100.0%), while the most female-oriented occupations are Personal Care & Service (60.7%), Food Preparation & Serving (49.5%), and Cleaning & Maintenance (8.9%).
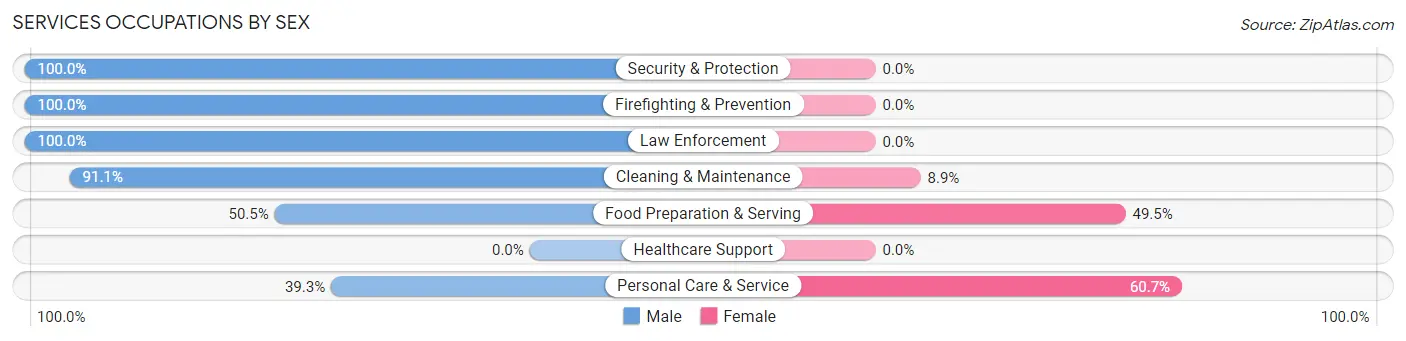
| Occupation | Male | Female |
| Healthcare Support | 0 (0.0%) | 0 (0.0%) |
| Security & Protection | 95 (100.0%) | 0 (0.0%) |
| Firefighting & Prevention | 83 (100.0%) | 0 (0.0%) |
| Law Enforcement | 12 (100.0%) | 0 (0.0%) |
| Food Preparation & Serving | 251 (50.5%) | 246 (49.5%) |
| Cleaning & Maintenance | 194 (91.1%) | 19 (8.9%) |
| Personal Care & Service | 105 (39.3%) | 162 (60.7%) |
| Total (Category) | 645 (60.2%) | 427 (39.8%) |
| Total (Overall) | 2,402 (53.0%) | 2,128 (47.0%) |
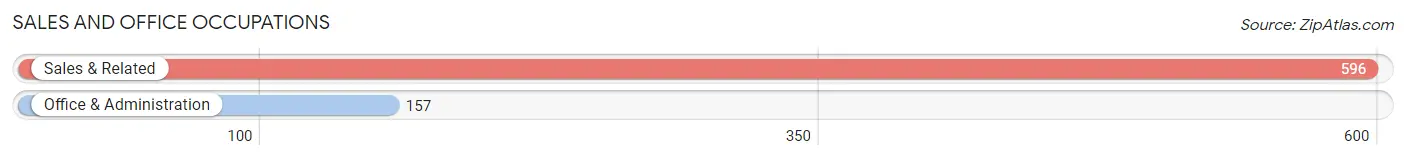
Sales and Office Occupations
The most common Sales and Office occupations in Haiku Pauwela are Sales & Related (596 | 13.2%), and Office & Administration (157 | 3.5%).
Sales and Office Occupations by Sex
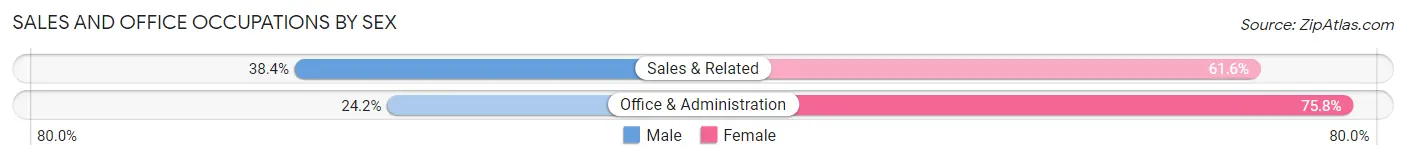
| Occupation | Male | Female |
| Sales & Related | 229 (38.4%) | 367 (61.6%) |
| Office & Administration | 38 (24.2%) | 119 (75.8%) |
| Total (Category) | 267 (35.5%) | 486 (64.5%) |
| Total (Overall) | 2,402 (53.0%) | 2,128 (47.0%) |
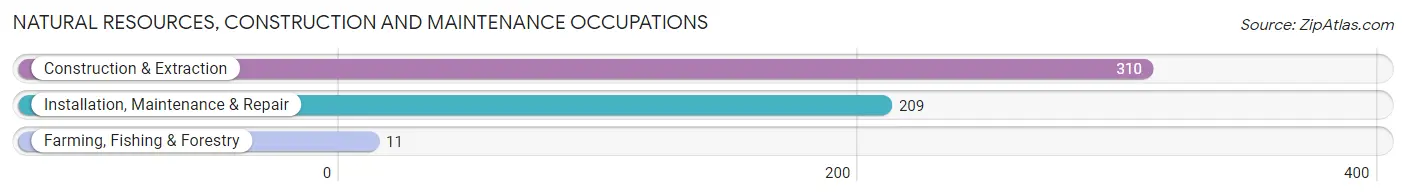
Natural Resources, Construction and Maintenance Occupations
The most common Natural Resources, Construction and Maintenance occupations in Haiku Pauwela are Construction & Extraction (310 | 6.8%), Installation, Maintenance & Repair (209 | 4.6%), and Farming, Fishing & Forestry (11 | 0.2%).
Natural Resources, Construction and Maintenance Occupations by Sex
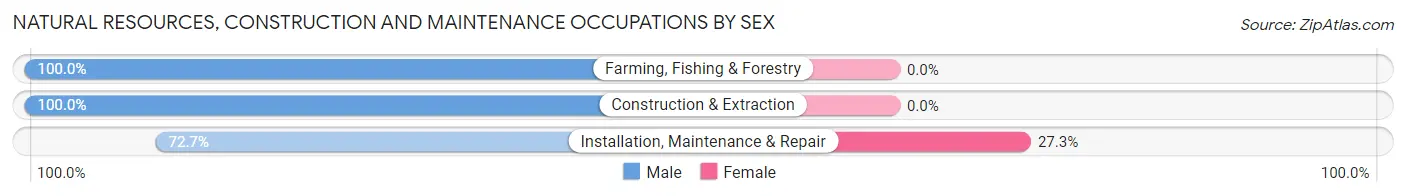
| Occupation | Male | Female |
| Farming, Fishing & Forestry | 11 (100.0%) | 0 (0.0%) |
| Construction & Extraction | 310 (100.0%) | 0 (0.0%) |
| Installation, Maintenance & Repair | 152 (72.7%) | 57 (27.3%) |
| Total (Category) | 473 (89.2%) | 57 (10.7%) |
| Total (Overall) | 2,402 (53.0%) | 2,128 (47.0%) |
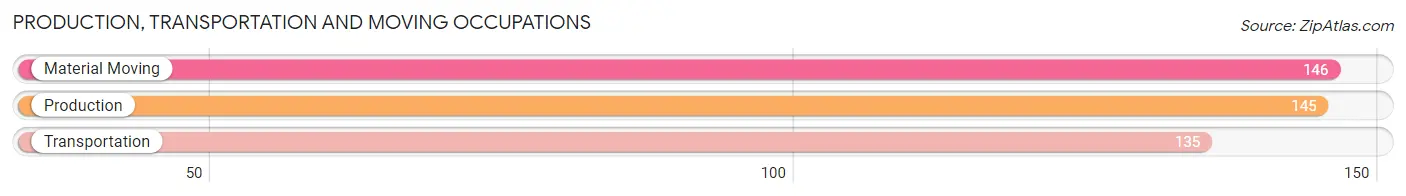
Production, Transportation and Moving Occupations
The most common Production, Transportation and Moving occupations in Haiku Pauwela are Material Moving (146 | 3.2%), Production (145 | 3.2%), and Transportation (135 | 3.0%).
Production, Transportation and Moving Occupations by Sex
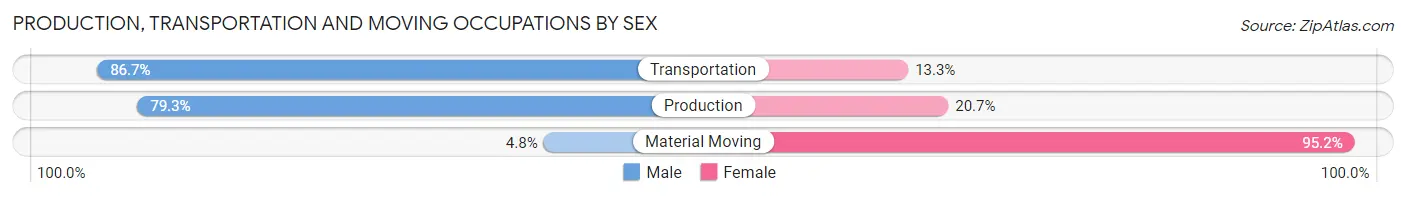
| Occupation | Male | Female |
| Production | 115 (79.3%) | 30 (20.7%) |
| Transportation | 117 (86.7%) | 18 (13.3%) |
| Material Moving | 7 (4.8%) | 139 (95.2%) |
| Total (Category) | 239 (56.1%) | 187 (43.9%) |
| Total (Overall) | 2,402 (53.0%) | 2,128 (47.0%) |
Employment Industries by Sex in Haiku Pauwela
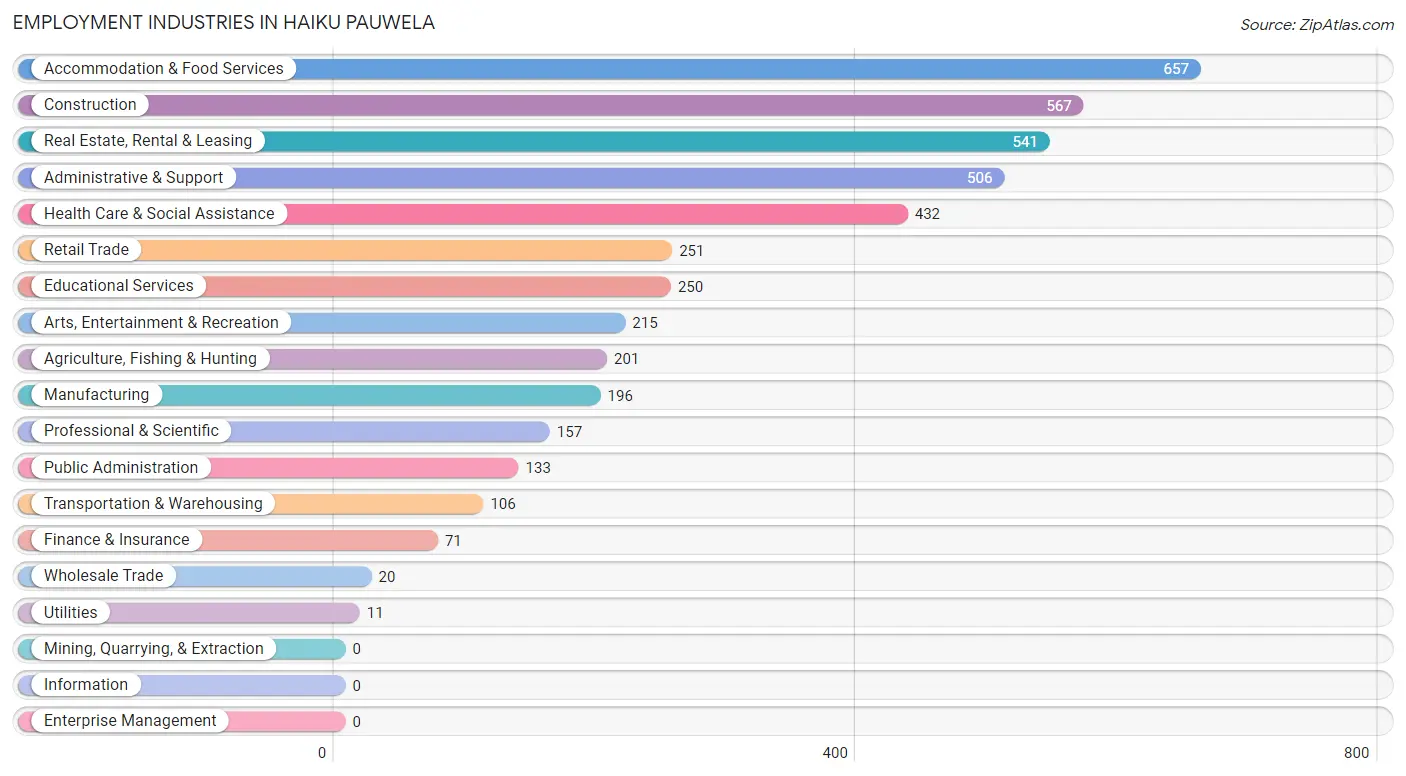
Employment Industries in Haiku Pauwela
The major employment industries in Haiku Pauwela include Accommodation & Food Services (657 | 14.5%), Construction (567 | 12.5%), Real Estate, Rental & Leasing (541 | 11.9%), Administrative & Support (506 | 11.2%), and Health Care & Social Assistance (432 | 9.5%).
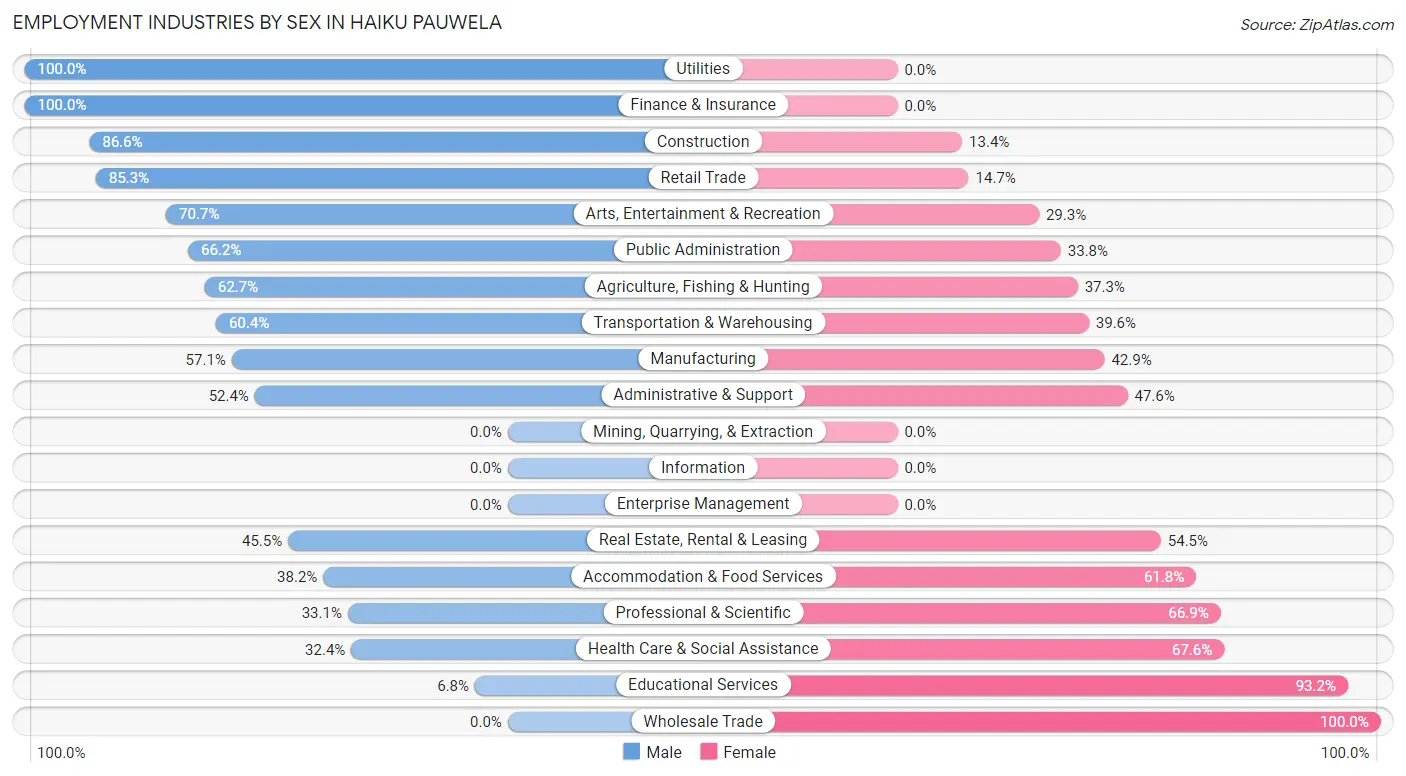
Employment Industries by Sex in Haiku Pauwela
The Haiku Pauwela industries that see more men than women are Utilities (100.0%), Finance & Insurance (100.0%), and Construction (86.6%), whereas the industries that tend to have a higher number of women are Wholesale Trade (100.0%), Educational Services (93.2%), and Health Care & Social Assistance (67.6%).
| Industry | Male | Female |
| Agriculture, Fishing & Hunting | 126 (62.7%) | 75 (37.3%) |
| Mining, Quarrying, & Extraction | 0 (0.0%) | 0 (0.0%) |
| Construction | 491 (86.6%) | 76 (13.4%) |
| Manufacturing | 112 (57.1%) | 84 (42.9%) |
| Wholesale Trade | 0 (0.0%) | 20 (100.0%) |
| Retail Trade | 214 (85.3%) | 37 (14.7%) |
| Transportation & Warehousing | 64 (60.4%) | 42 (39.6%) |
| Utilities | 11 (100.0%) | 0 (0.0%) |
| Information | 0 (0.0%) | 0 (0.0%) |
| Finance & Insurance | 71 (100.0%) | 0 (0.0%) |
| Real Estate, Rental & Leasing | 246 (45.5%) | 295 (54.5%) |
| Professional & Scientific | 52 (33.1%) | 105 (66.9%) |
| Enterprise Management | 0 (0.0%) | 0 (0.0%) |
| Administrative & Support | 265 (52.4%) | 241 (47.6%) |
| Educational Services | 17 (6.8%) | 233 (93.2%) |
| Health Care & Social Assistance | 140 (32.4%) | 292 (67.6%) |
| Arts, Entertainment & Recreation | 152 (70.7%) | 63 (29.3%) |
| Accommodation & Food Services | 251 (38.2%) | 406 (61.8%) |
| Public Administration | 88 (66.2%) | 45 (33.8%) |
| Total | 2,402 (53.0%) | 2,128 (47.0%) |
Education in Haiku Pauwela
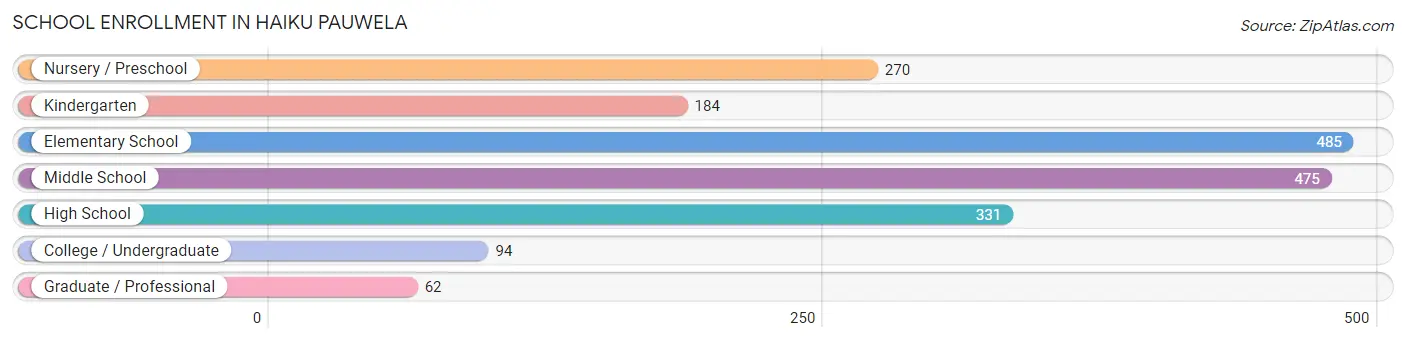
School Enrollment in Haiku Pauwela
The most common levels of schooling among the 1,901 students in Haiku Pauwela are elementary school (485 | 25.5%), middle school (475 | 25.0%), and high school (331 | 17.4%).
| School Level | # Students | % Students |
| Nursery / Preschool | 270 | 14.2% |
| Kindergarten | 184 | 9.7% |
| Elementary School | 485 | 25.5% |
| Middle School | 475 | 25.0% |
| High School | 331 | 17.4% |
| College / Undergraduate | 94 | 4.9% |
| Graduate / Professional | 62 | 3.3% |
| Total | 1,901 | 100.0% |
School Enrollment by Age by Funding Source in Haiku Pauwela
Out of a total of 1,901 students who are enrolled in schools in Haiku Pauwela, 578 (30.4%) attend a private institution, while the remaining 1,323 (69.6%) are enrolled in public schools. The age group of 20 to 24 year olds has the highest likelihood of being enrolled in private schools, with 64 (100.0% in the age bracket) enrolled. Conversely, the age group of 18 to 19 year olds has the lowest likelihood of being enrolled in a private school, with 55 (100.0% in the age bracket) attending a public institution.
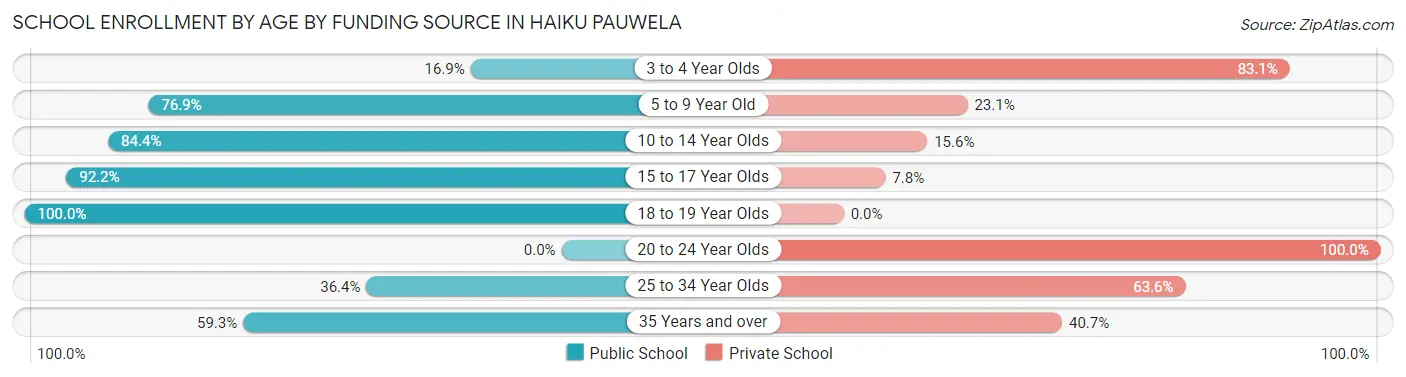
| Age Bracket | Public School | Private School |
| 3 to 4 Year Olds | 43 (16.9%) | 211 (83.1%) |
| 5 to 9 Year Old | 477 (76.9%) | 143 (23.1%) |
| 10 to 14 Year Olds | 548 (84.4%) | 101 (15.6%) |
| 15 to 17 Year Olds | 154 (92.2%) | 13 (7.8%) |
| 18 to 19 Year Olds | 55 (100.0%) | 0 (0.0%) |
| 20 to 24 Year Olds | 0 (0.0%) | 64 (100.0%) |
| 25 to 34 Year Olds | 12 (36.4%) | 21 (63.6%) |
| 35 Years and over | 35 (59.3%) | 24 (40.7%) |
| Total | 1,323 (69.6%) | 578 (30.4%) |
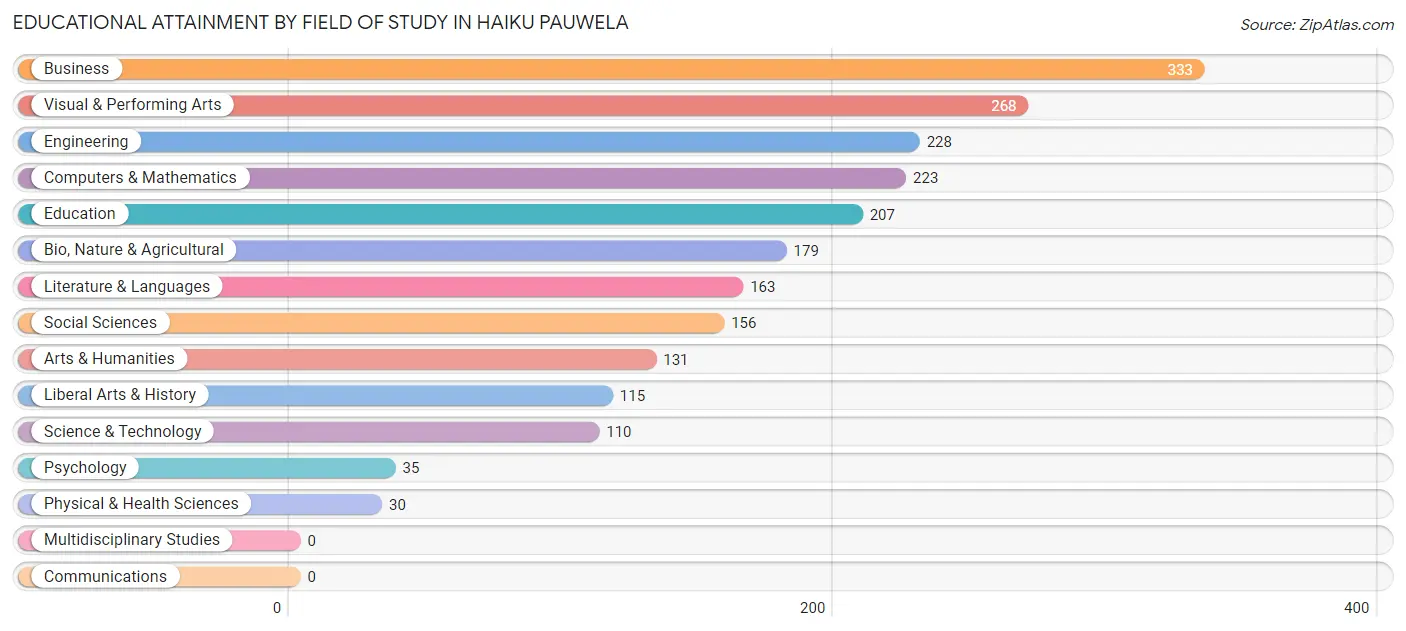
Educational Attainment by Field of Study in Haiku Pauwela
Business (333 | 15.3%), visual & performing arts (268 | 12.3%), engineering (228 | 10.5%), computers & mathematics (223 | 10.2%), and education (207 | 9.5%) are the most common fields of study among 2,178 individuals in Haiku Pauwela who have obtained a bachelor's degree or higher.
| Field of Study | # Graduates | % Graduates |
| Computers & Mathematics | 223 | 10.2% |
| Bio, Nature & Agricultural | 179 | 8.2% |
| Physical & Health Sciences | 30 | 1.4% |
| Psychology | 35 | 1.6% |
| Social Sciences | 156 | 7.2% |
| Engineering | 228 | 10.5% |
| Multidisciplinary Studies | 0 | 0.0% |
| Science & Technology | 110 | 5.1% |
| Business | 333 | 15.3% |
| Education | 207 | 9.5% |
| Literature & Languages | 163 | 7.5% |
| Liberal Arts & History | 115 | 5.3% |
| Visual & Performing Arts | 268 | 12.3% |
| Communications | 0 | 0.0% |
| Arts & Humanities | 131 | 6.0% |
| Total | 2,178 | 100.0% |
Transportation & Commute in Haiku Pauwela
Vehicle Availability by Sex in Haiku Pauwela
The most prevalent vehicle ownership categories in Haiku Pauwela are males with 2 vehicles (1,220, accounting for 53.4%) and females with 2 vehicles (798, making up 61.9%).
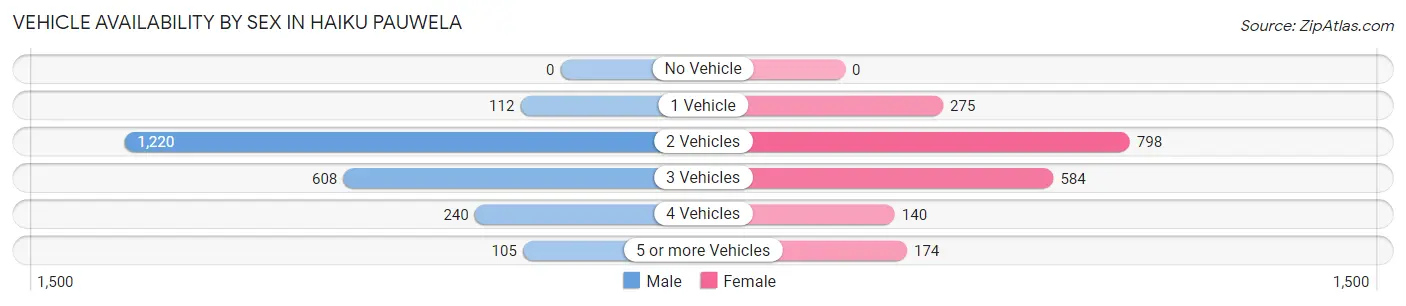
| Vehicles Available | Male | Female |
| No Vehicle | 0 (0.0%) | 0 (0.0%) |
| 1 Vehicle | 112 (4.9%) | 275 (14.0%) |
| 2 Vehicles | 1,220 (53.4%) | 798 (40.5%) |
| 3 Vehicles | 608 (26.6%) | 584 (29.6%) |
| 4 Vehicles | 240 (10.5%) | 140 (7.1%) |
| 5 or more Vehicles | 105 (4.6%) | 174 (8.8%) |
| Total | 2,285 (100.0%) | 1,971 (100.0%) |
Commute Time in Haiku Pauwela
The most frequently occuring commute durations in Haiku Pauwela are 45 to 59 minutes (982 commuters, 25.1%), 30 to 34 minutes (645 commuters, 16.5%), and 25 to 29 minutes (396 commuters, 10.1%).
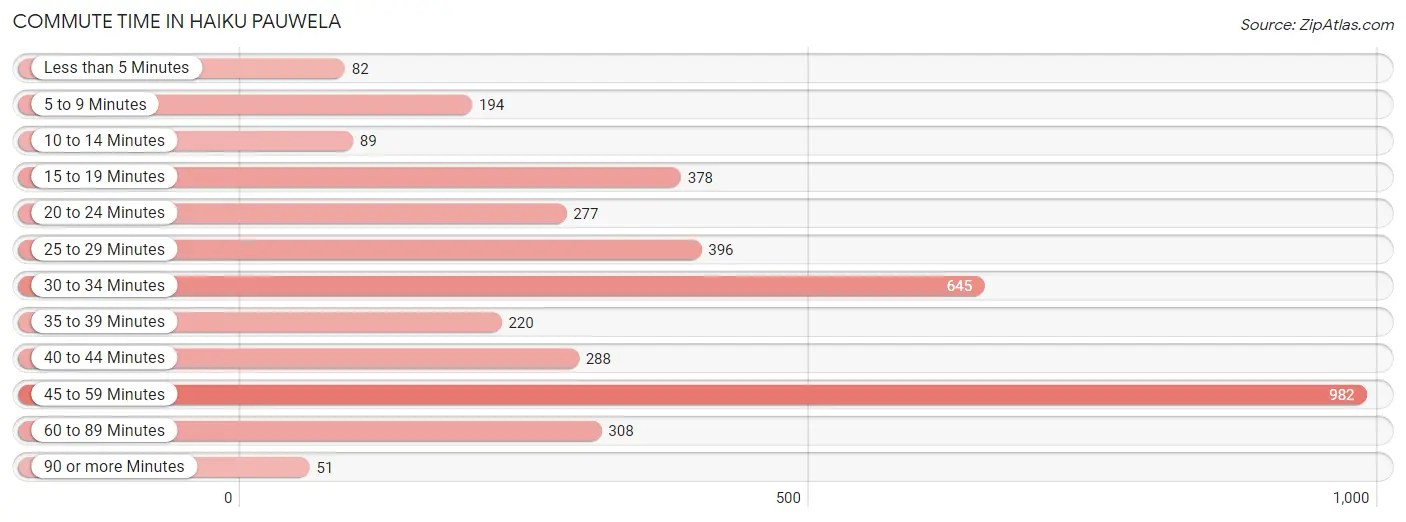
| Commute Time | # Commuters | % Commuters |
| Less than 5 Minutes | 82 | 2.1% |
| 5 to 9 Minutes | 194 | 5.0% |
| 10 to 14 Minutes | 89 | 2.3% |
| 15 to 19 Minutes | 378 | 9.7% |
| 20 to 24 Minutes | 277 | 7.1% |
| 25 to 29 Minutes | 396 | 10.1% |
| 30 to 34 Minutes | 645 | 16.5% |
| 35 to 39 Minutes | 220 | 5.6% |
| 40 to 44 Minutes | 288 | 7.4% |
| 45 to 59 Minutes | 982 | 25.1% |
| 60 to 89 Minutes | 308 | 7.9% |
| 90 or more Minutes | 51 | 1.3% |
Commute Time by Sex in Haiku Pauwela
The most common commute times in Haiku Pauwela are 45 to 59 minutes (489 commuters, 23.0%) for males and 45 to 59 minutes (493 commuters, 27.6%) for females.
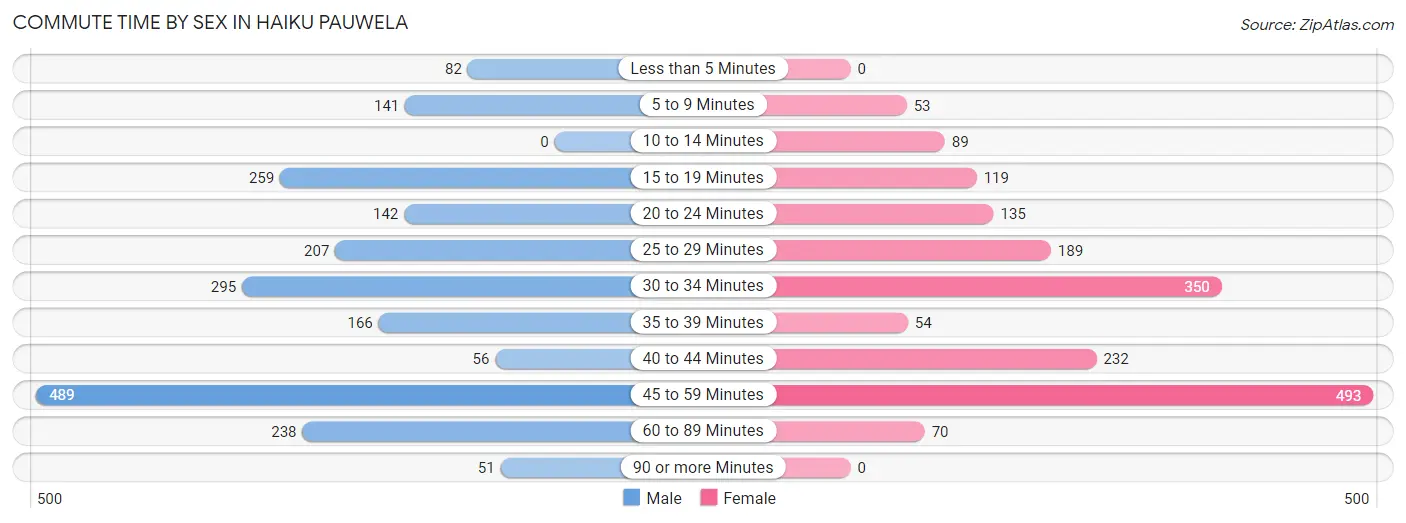
| Commute Time | Male | Female |
| Less than 5 Minutes | 82 (3.9%) | 0 (0.0%) |
| 5 to 9 Minutes | 141 (6.6%) | 53 (3.0%) |
| 10 to 14 Minutes | 0 (0.0%) | 89 (5.0%) |
| 15 to 19 Minutes | 259 (12.2%) | 119 (6.7%) |
| 20 to 24 Minutes | 142 (6.7%) | 135 (7.6%) |
| 25 to 29 Minutes | 207 (9.7%) | 189 (10.6%) |
| 30 to 34 Minutes | 295 (13.9%) | 350 (19.6%) |
| 35 to 39 Minutes | 166 (7.8%) | 54 (3.0%) |
| 40 to 44 Minutes | 56 (2.6%) | 232 (13.0%) |
| 45 to 59 Minutes | 489 (23.0%) | 493 (27.6%) |
| 60 to 89 Minutes | 238 (11.2%) | 70 (3.9%) |
| 90 or more Minutes | 51 (2.4%) | 0 (0.0%) |
Time of Departure to Work by Sex in Haiku Pauwela
The most frequent times of departure to work in Haiku Pauwela are 6:00 AM to 6:29 AM (349, 16.4%) for males and 7:00 AM to 7:29 AM (303, 17.0%) for females.
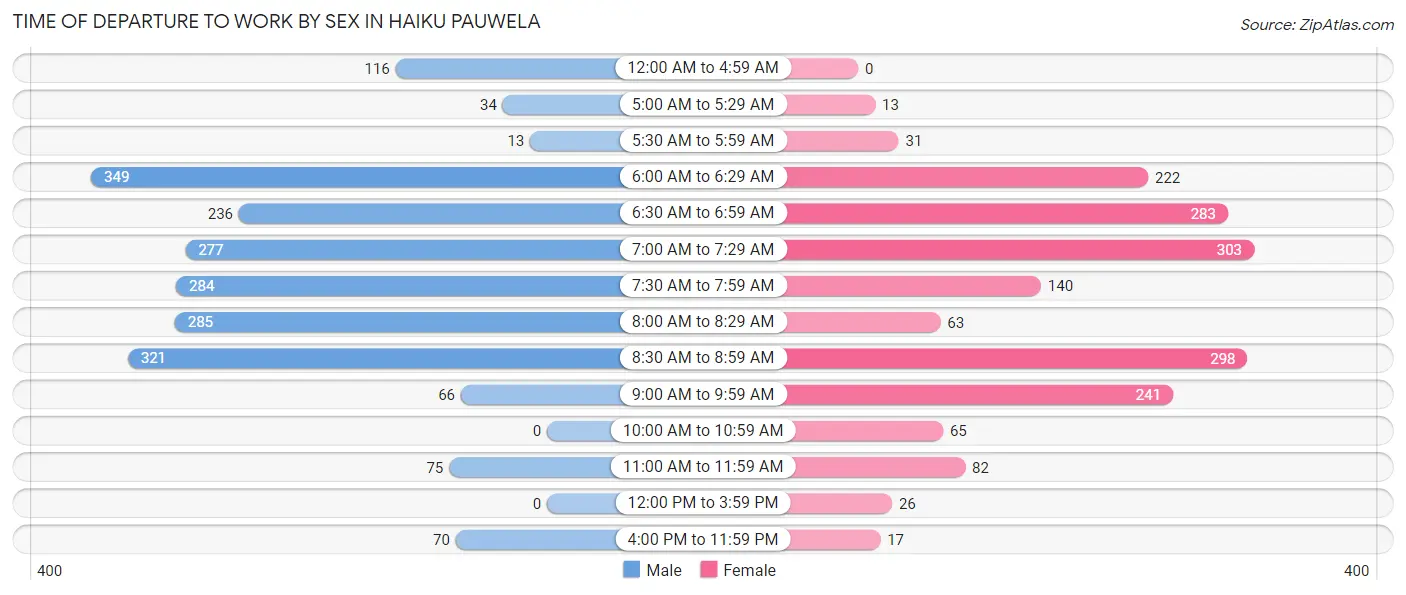
| Time of Departure | Male | Female |
| 12:00 AM to 4:59 AM | 116 (5.5%) | 0 (0.0%) |
| 5:00 AM to 5:29 AM | 34 (1.6%) | 13 (0.7%) |
| 5:30 AM to 5:59 AM | 13 (0.6%) | 31 (1.7%) |
| 6:00 AM to 6:29 AM | 349 (16.4%) | 222 (12.4%) |
| 6:30 AM to 6:59 AM | 236 (11.1%) | 283 (15.9%) |
| 7:00 AM to 7:29 AM | 277 (13.0%) | 303 (17.0%) |
| 7:30 AM to 7:59 AM | 284 (13.4%) | 140 (7.9%) |
| 8:00 AM to 8:29 AM | 285 (13.4%) | 63 (3.5%) |
| 8:30 AM to 8:59 AM | 321 (15.1%) | 298 (16.7%) |
| 9:00 AM to 9:59 AM | 66 (3.1%) | 241 (13.5%) |
| 10:00 AM to 10:59 AM | 0 (0.0%) | 65 (3.6%) |
| 11:00 AM to 11:59 AM | 75 (3.5%) | 82 (4.6%) |
| 12:00 PM to 3:59 PM | 0 (0.0%) | 26 (1.5%) |
| 4:00 PM to 11:59 PM | 70 (3.3%) | 17 (0.9%) |
| Total | 2,126 (100.0%) | 1,784 (100.0%) |
Housing Occupancy in Haiku Pauwela
Occupancy by Ownership in Haiku Pauwela
Of the total 3,268 dwellings in Haiku Pauwela, owner-occupied units account for 2,100 (64.3%), while renter-occupied units make up 1,168 (35.7%).
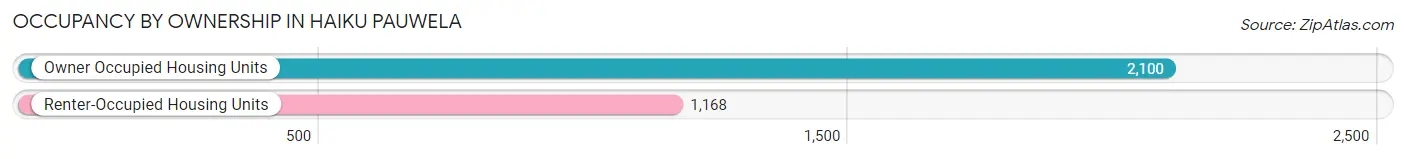
| Occupancy | # Housing Units | % Housing Units |
| Owner Occupied Housing Units | 2,100 | 64.3% |
| Renter-Occupied Housing Units | 1,168 | 35.7% |
| Total Occupied Housing Units | 3,268 | 100.0% |
Occupancy by Household Size in Haiku Pauwela
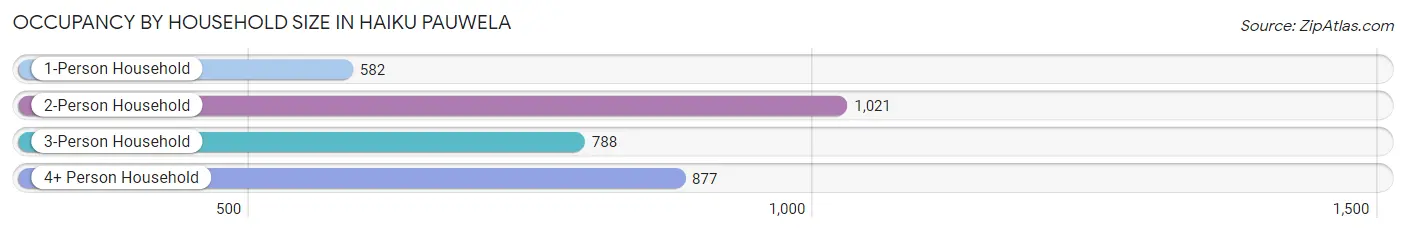
| Household Size | # Housing Units | % Housing Units |
| 1-Person Household | 582 | 17.8% |
| 2-Person Household | 1,021 | 31.2% |
| 3-Person Household | 788 | 24.1% |
| 4+ Person Household | 877 | 26.8% |
| Total Housing Units | 3,268 | 100.0% |
Occupancy by Ownership by Household Size in Haiku Pauwela
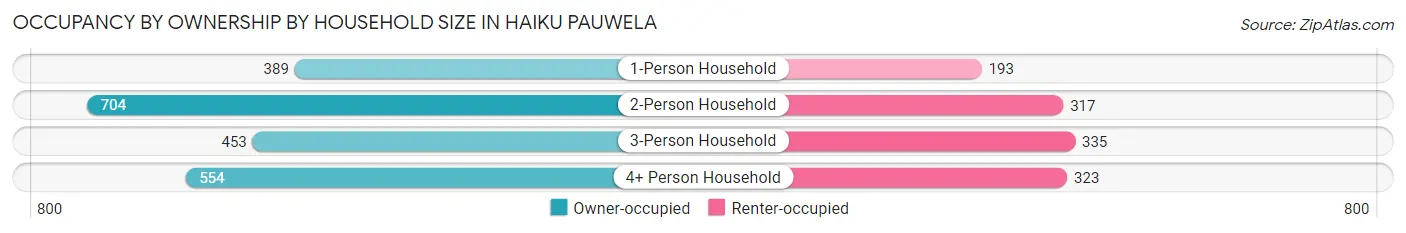
| Household Size | Owner-occupied | Renter-occupied |
| 1-Person Household | 389 (66.8%) | 193 (33.2%) |
| 2-Person Household | 704 (69.0%) | 317 (31.0%) |
| 3-Person Household | 453 (57.5%) | 335 (42.5%) |
| 4+ Person Household | 554 (63.2%) | 323 (36.8%) |
| Total Housing Units | 2,100 (64.3%) | 1,168 (35.7%) |
Occupancy by Educational Attainment in Haiku Pauwela
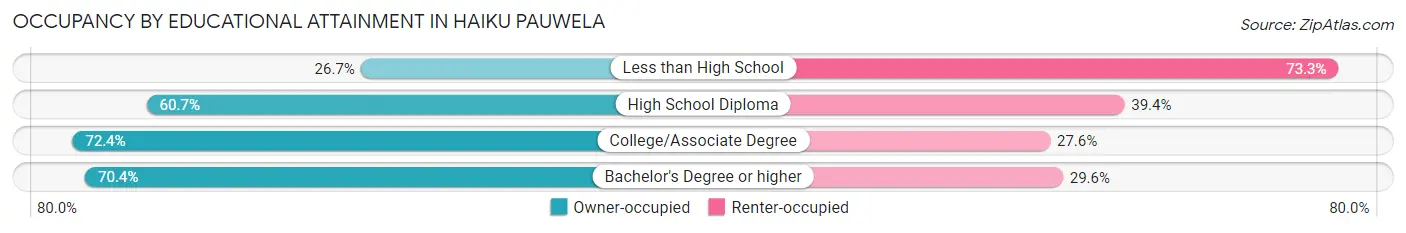
| Household Size | Owner-occupied | Renter-occupied |
| Less than High School | 94 (26.7%) | 258 (73.3%) |
| High School Diploma | 413 (60.7%) | 268 (39.4%) |
| College/Associate Degree | 701 (72.4%) | 267 (27.6%) |
| Bachelor's Degree or higher | 892 (70.4%) | 375 (29.6%) |
Occupancy by Age of Householder in Haiku Pauwela
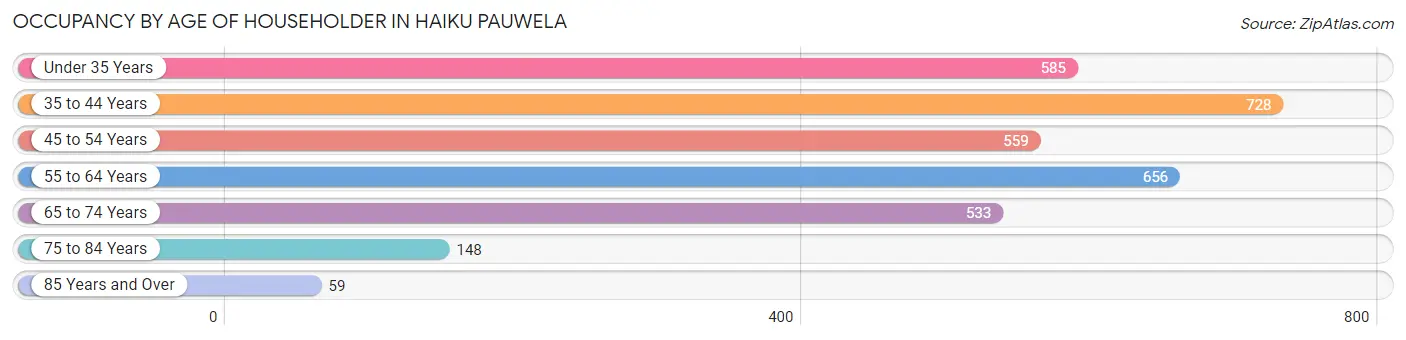
| Age Bracket | # Households | % Households |
| Under 35 Years | 585 | 17.9% |
| 35 to 44 Years | 728 | 22.3% |
| 45 to 54 Years | 559 | 17.1% |
| 55 to 64 Years | 656 | 20.1% |
| 65 to 74 Years | 533 | 16.3% |
| 75 to 84 Years | 148 | 4.5% |
| 85 Years and Over | 59 | 1.8% |
| Total | 3,268 | 100.0% |
Housing Finances in Haiku Pauwela
Median Income by Occupancy in Haiku Pauwela
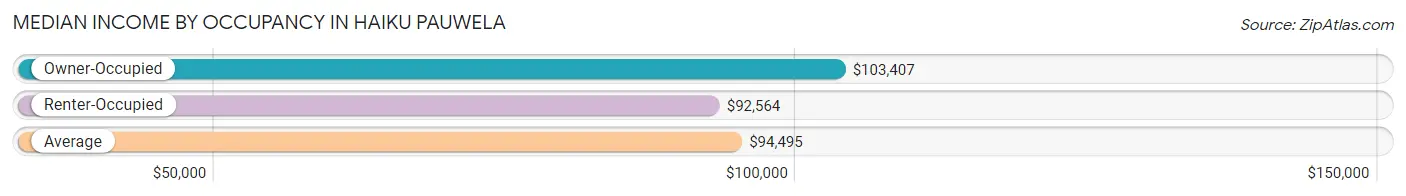
| Occupancy Type | # Households | Median Income |
| Owner-Occupied | 2,100 (64.3%) | $103,407 |
| Renter-Occupied | 1,168 (35.7%) | $92,564 |
| Average | 3,268 (100.0%) | $94,495 |
Occupancy by Householder Income Bracket in Haiku Pauwela
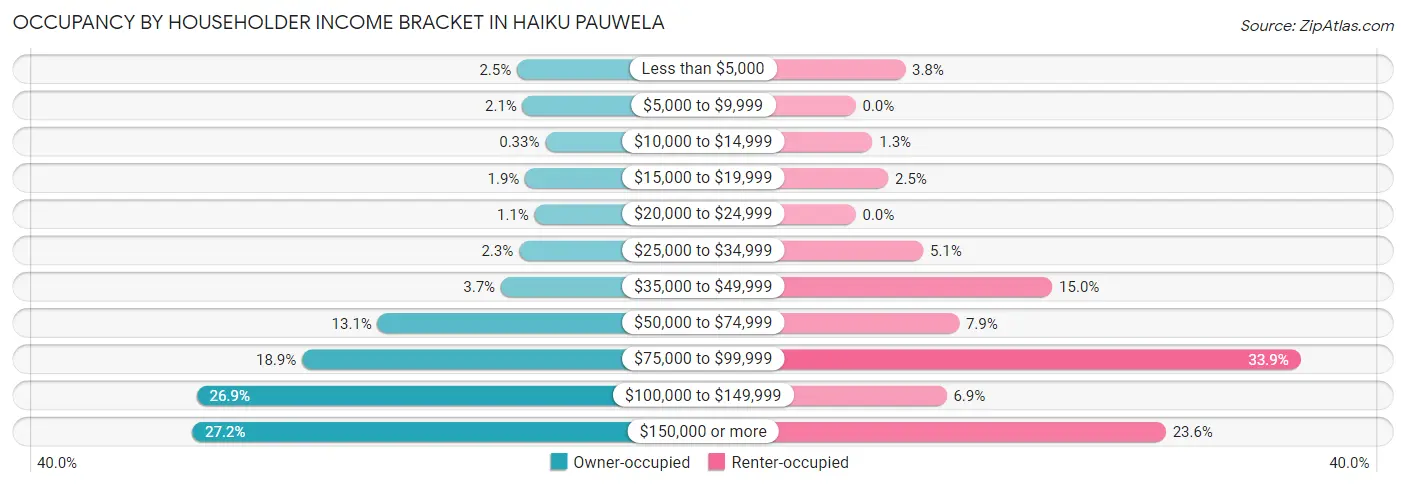
| Income Bracket | Owner-occupied | Renter-occupied |
| Less than $5,000 | 52 (2.5%) | 44 (3.8%) |
| $5,000 to $9,999 | 43 (2.1%) | 0 (0.0%) |
| $10,000 to $14,999 | 7 (0.3%) | 15 (1.3%) |
| $15,000 to $19,999 | 39 (1.9%) | 29 (2.5%) |
| $20,000 to $24,999 | 24 (1.1%) | 0 (0.0%) |
| $25,000 to $34,999 | 49 (2.3%) | 60 (5.1%) |
| $35,000 to $49,999 | 78 (3.7%) | 175 (15.0%) |
| $50,000 to $74,999 | 275 (13.1%) | 92 (7.9%) |
| $75,000 to $99,999 | 396 (18.9%) | 396 (33.9%) |
| $100,000 to $149,999 | 565 (26.9%) | 81 (6.9%) |
| $150,000 or more | 572 (27.2%) | 276 (23.6%) |
| Total | 2,100 (100.0%) | 1,168 (100.0%) |
Monthly Housing Cost Tiers in Haiku Pauwela
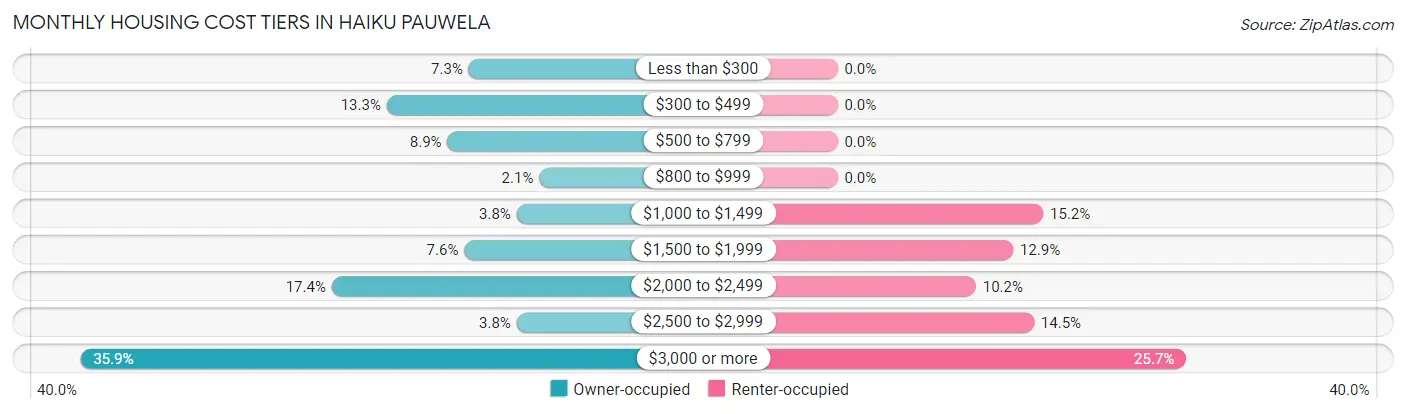
| Monthly Cost | Owner-occupied | Renter-occupied |
| Less than $300 | 153 (7.3%) | 0 (0.0%) |
| $300 to $499 | 280 (13.3%) | 0 (0.0%) |
| $500 to $799 | 186 (8.9%) | 0 (0.0%) |
| $800 to $999 | 44 (2.1%) | 0 (0.0%) |
| $1,000 to $1,499 | 79 (3.8%) | 177 (15.1%) |
| $1,500 to $1,999 | 160 (7.6%) | 151 (12.9%) |
| $2,000 to $2,499 | 365 (17.4%) | 119 (10.2%) |
| $2,500 to $2,999 | 79 (3.8%) | 169 (14.5%) |
| $3,000 or more | 754 (35.9%) | 300 (25.7%) |
| Total | 2,100 (100.0%) | 1,168 (100.0%) |
Physical Housing Characteristics in Haiku Pauwela
Housing Structures in Haiku Pauwela
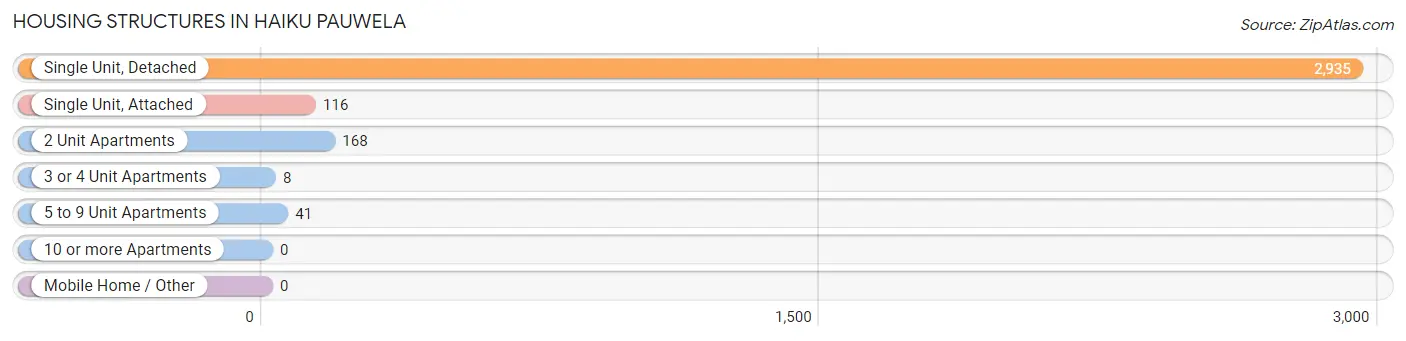
| Structure Type | # Housing Units | % Housing Units |
| Single Unit, Detached | 2,935 | 89.8% |
| Single Unit, Attached | 116 | 3.5% |
| 2 Unit Apartments | 168 | 5.1% |
| 3 or 4 Unit Apartments | 8 | 0.2% |
| 5 to 9 Unit Apartments | 41 | 1.3% |
| 10 or more Apartments | 0 | 0.0% |
| Mobile Home / Other | 0 | 0.0% |
| Total | 3,268 | 100.0% |
Housing Structures by Occupancy in Haiku Pauwela
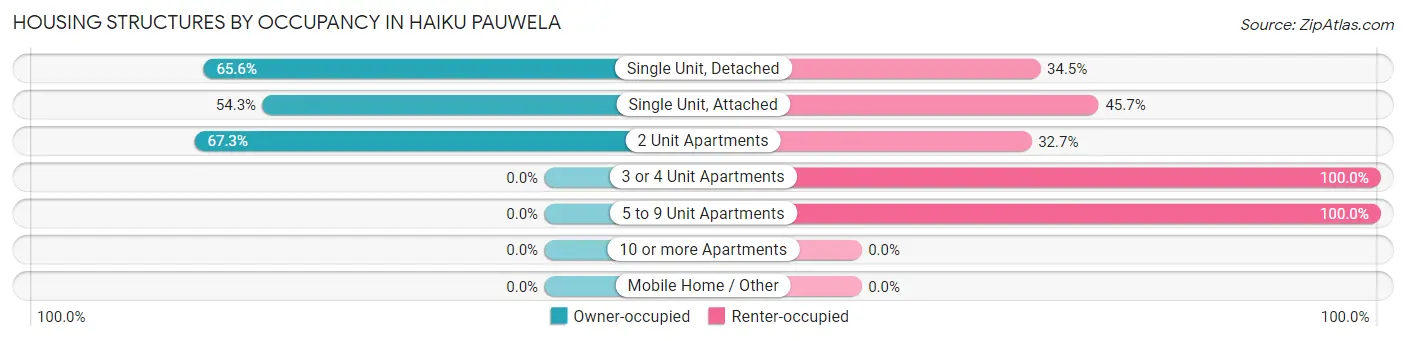
| Structure Type | Owner-occupied | Renter-occupied |
| Single Unit, Detached | 1,924 (65.5%) | 1,011 (34.4%) |
| Single Unit, Attached | 63 (54.3%) | 53 (45.7%) |
| 2 Unit Apartments | 113 (67.3%) | 55 (32.7%) |
| 3 or 4 Unit Apartments | 0 (0.0%) | 8 (100.0%) |
| 5 to 9 Unit Apartments | 0 (0.0%) | 41 (100.0%) |
| 10 or more Apartments | 0 (0.0%) | 0 (0.0%) |
| Mobile Home / Other | 0 (0.0%) | 0 (0.0%) |
| Total | 2,100 (64.3%) | 1,168 (35.7%) |
Housing Structures by Number of Rooms in Haiku Pauwela
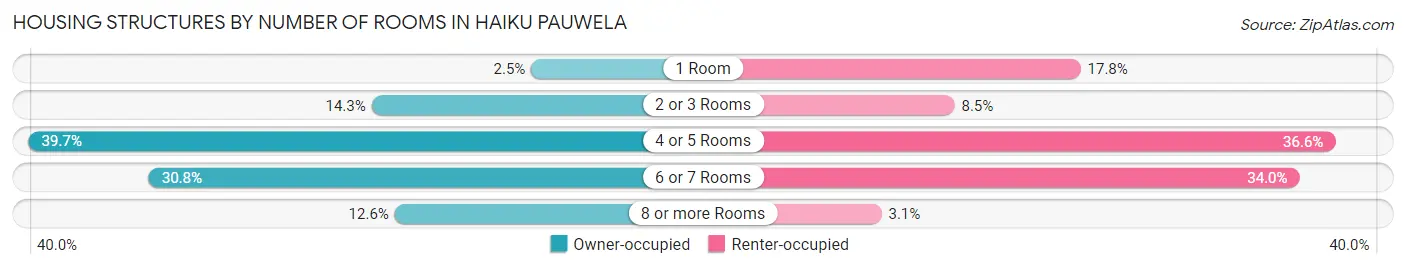
| Number of Rooms | Owner-occupied | Renter-occupied |
| 1 Room | 53 (2.5%) | 208 (17.8%) |
| 2 or 3 Rooms | 301 (14.3%) | 99 (8.5%) |
| 4 or 5 Rooms | 834 (39.7%) | 428 (36.6%) |
| 6 or 7 Rooms | 647 (30.8%) | 397 (34.0%) |
| 8 or more Rooms | 265 (12.6%) | 36 (3.1%) |
| Total | 2,100 (100.0%) | 1,168 (100.0%) |
Housing Structure by Heating Type in Haiku Pauwela
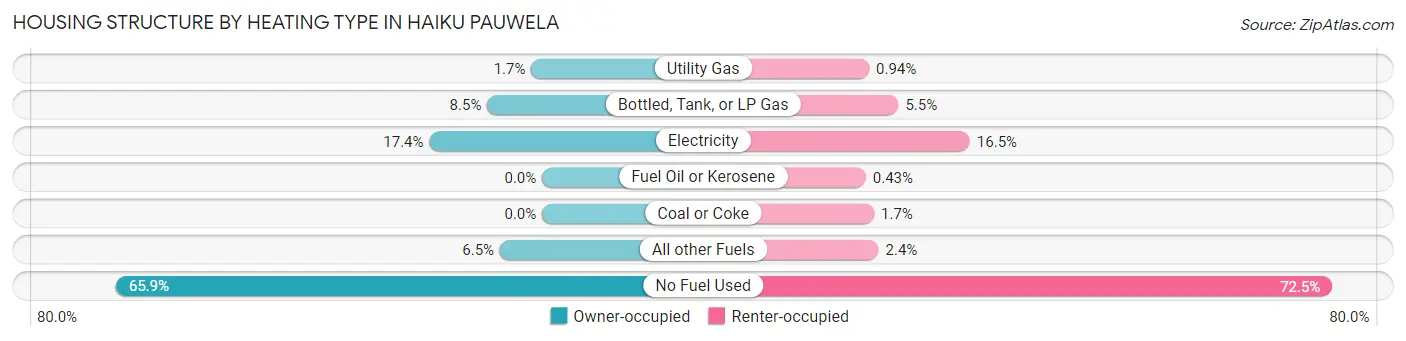
| Heating Type | Owner-occupied | Renter-occupied |
| Utility Gas | 35 (1.7%) | 11 (0.9%) |
| Bottled, Tank, or LP Gas | 178 (8.5%) | 64 (5.5%) |
| Electricity | 366 (17.4%) | 193 (16.5%) |
| Fuel Oil or Kerosene | 0 (0.0%) | 5 (0.4%) |
| Coal or Coke | 0 (0.0%) | 20 (1.7%) |
| All other Fuels | 137 (6.5%) | 28 (2.4%) |
| No Fuel Used | 1,384 (65.9%) | 847 (72.5%) |
| Total | 2,100 (100.0%) | 1,168 (100.0%) |
Household Vehicle Usage in Haiku Pauwela
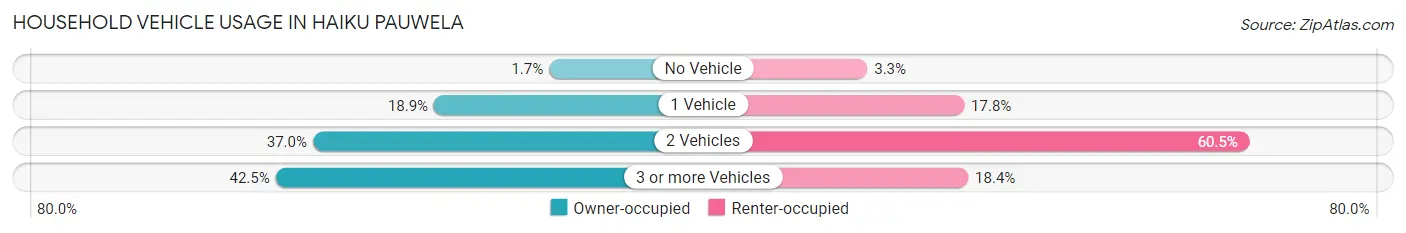
| Vehicles per Household | Owner-occupied | Renter-occupied |
| No Vehicle | 35 (1.7%) | 39 (3.3%) |
| 1 Vehicle | 396 (18.9%) | 208 (17.8%) |
| 2 Vehicles | 776 (36.9%) | 706 (60.5%) |
| 3 or more Vehicles | 893 (42.5%) | 215 (18.4%) |
| Total | 2,100 (100.0%) | 1,168 (100.0%) |
Real Estate & Mortgages in Haiku Pauwela
Real Estate and Mortgage Overview in Haiku Pauwela
| Characteristic | Without Mortgage | With Mortgage |
| Housing Units | 685 | 1,415 |
| Median Property Value | $862,300 | $949,600 |
| Median Household Income | $78,359 | $481 |
| Monthly Housing Costs | $458 | $754 |
| Real Estate Taxes | $1,560 | $21 |
Property Value by Mortgage Status in Haiku Pauwela
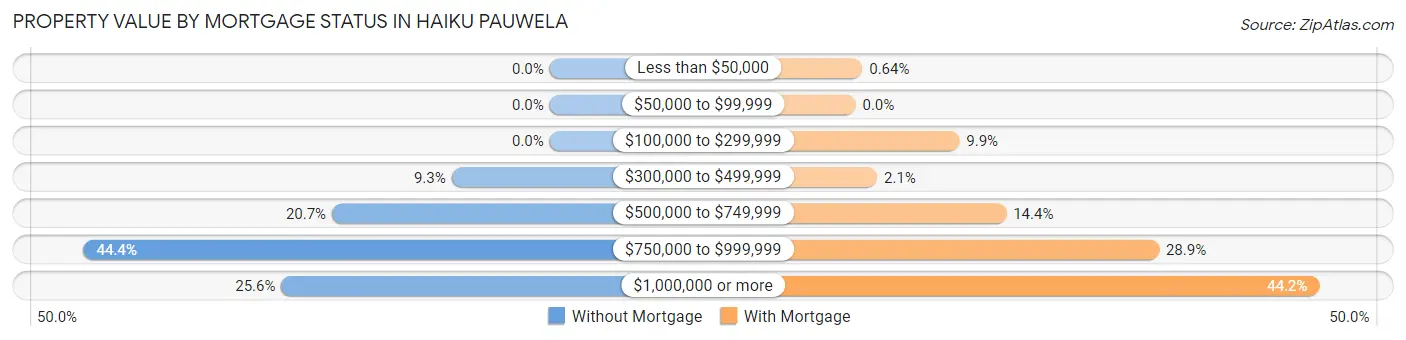
| Property Value | Without Mortgage | With Mortgage |
| Less than $50,000 | 0 (0.0%) | 9 (0.6%) |
| $50,000 to $99,999 | 0 (0.0%) | 0 (0.0%) |
| $100,000 to $299,999 | 0 (0.0%) | 140 (9.9%) |
| $300,000 to $499,999 | 64 (9.3%) | 29 (2.1%) |
| $500,000 to $749,999 | 142 (20.7%) | 203 (14.3%) |
| $750,000 to $999,999 | 304 (44.4%) | 409 (28.9%) |
| $1,000,000 or more | 175 (25.6%) | 625 (44.2%) |
| Total | 685 (100.0%) | 1,415 (100.0%) |
Household Income by Mortgage Status in Haiku Pauwela
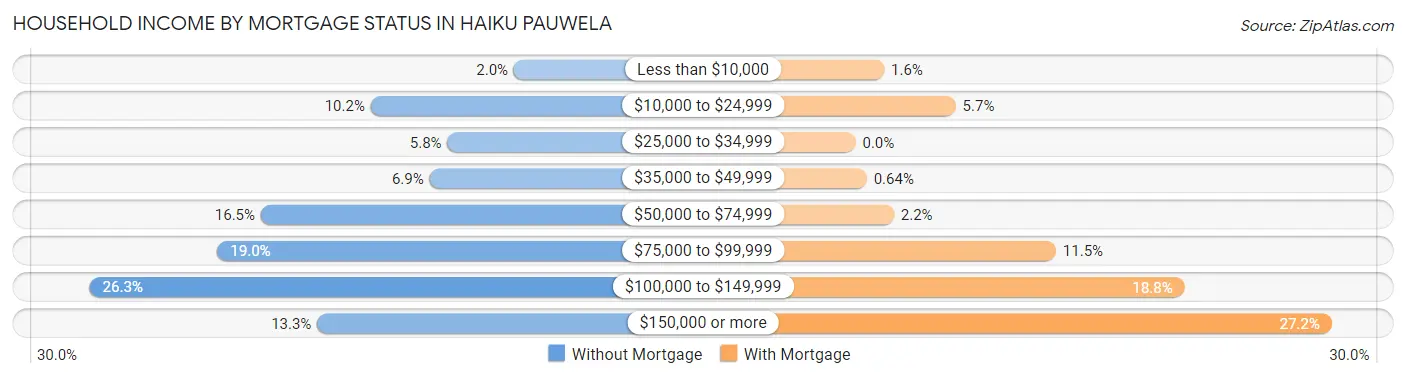
| Household Income | Without Mortgage | With Mortgage |
| Less than $10,000 | 14 (2.0%) | 23 (1.6%) |
| $10,000 to $24,999 | 70 (10.2%) | 81 (5.7%) |
| $25,000 to $34,999 | 40 (5.8%) | 0 (0.0%) |
| $35,000 to $49,999 | 47 (6.9%) | 9 (0.6%) |
| $50,000 to $74,999 | 113 (16.5%) | 31 (2.2%) |
| $75,000 to $99,999 | 130 (19.0%) | 162 (11.5%) |
| $100,000 to $149,999 | 180 (26.3%) | 266 (18.8%) |
| $150,000 or more | 91 (13.3%) | 385 (27.2%) |
| Total | 685 (100.0%) | 1,415 (100.0%) |
Property Value to Household Income Ratio in Haiku Pauwela
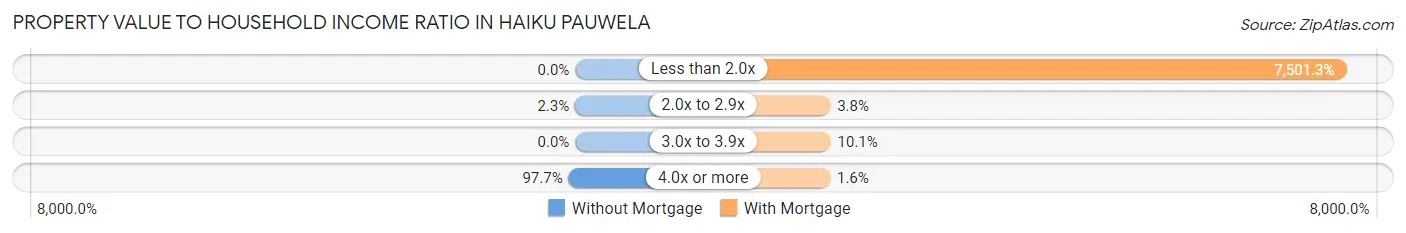
| Value-to-Income Ratio | Without Mortgage | With Mortgage |
| Less than 2.0x | 0 (0.0%) | 106,144 (7,501.3%) |
| 2.0x to 2.9x | 16 (2.3%) | 54 (3.8%) |
| 3.0x to 3.9x | 0 (0.0%) | 143 (10.1%) |
| 4.0x or more | 669 (97.7%) | 23 (1.6%) |
| Total | 685 (100.0%) | 1,415 (100.0%) |
Real Estate Taxes by Mortgage Status in Haiku Pauwela
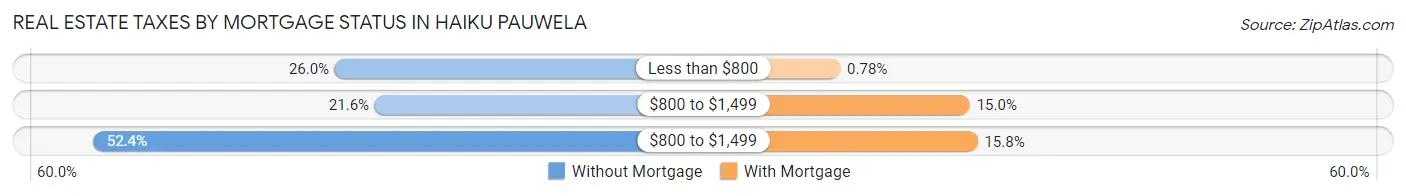
| Property Taxes | Without Mortgage | With Mortgage |
| Less than $800 | 178 (26.0%) | 11 (0.8%) |
| $800 to $1,499 | 148 (21.6%) | 212 (15.0%) |
| $800 to $1,499 | 359 (52.4%) | 224 (15.8%) |
| Total | 685 (100.0%) | 1,415 (100.0%) |
Health & Disability in Haiku Pauwela
Health Insurance Coverage by Age in Haiku Pauwela
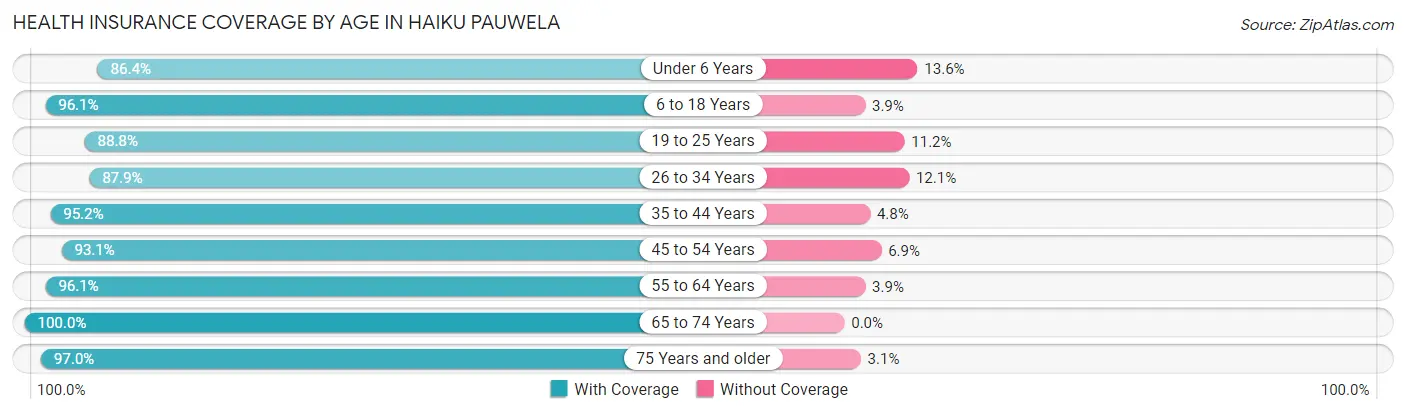
| Age Bracket | With Coverage | Without Coverage |
| Under 6 Years | 767 (86.4%) | 121 (13.6%) |
| 6 to 18 Years | 1,365 (96.1%) | 55 (3.9%) |
| 19 to 25 Years | 539 (88.8%) | 68 (11.2%) |
| 26 to 34 Years | 1,079 (87.9%) | 148 (12.1%) |
| 35 to 44 Years | 1,411 (95.2%) | 71 (4.8%) |
| 45 to 54 Years | 975 (93.1%) | 72 (6.9%) |
| 55 to 64 Years | 1,186 (96.1%) | 48 (3.9%) |
| 65 to 74 Years | 947 (100.0%) | 0 (0.0%) |
| 75 Years and older | 381 (97.0%) | 12 (3.0%) |
| Total | 8,650 (93.6%) | 595 (6.4%) |
Health Insurance Coverage by Citizenship Status in Haiku Pauwela
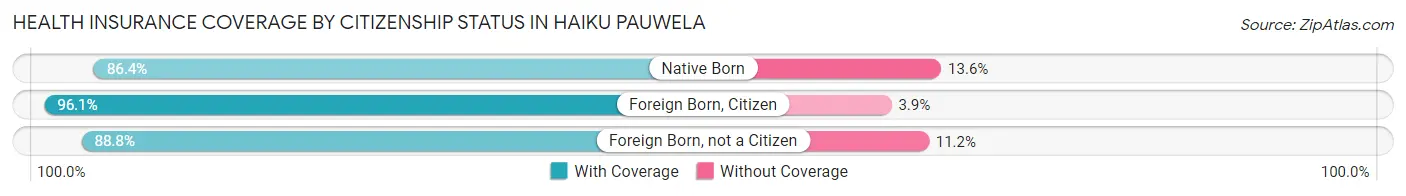
| Citizenship Status | With Coverage | Without Coverage |
| Native Born | 767 (86.4%) | 121 (13.6%) |
| Foreign Born, Citizen | 1,365 (96.1%) | 55 (3.9%) |
| Foreign Born, not a Citizen | 539 (88.8%) | 68 (11.2%) |
Health Insurance Coverage by Household Income in Haiku Pauwela
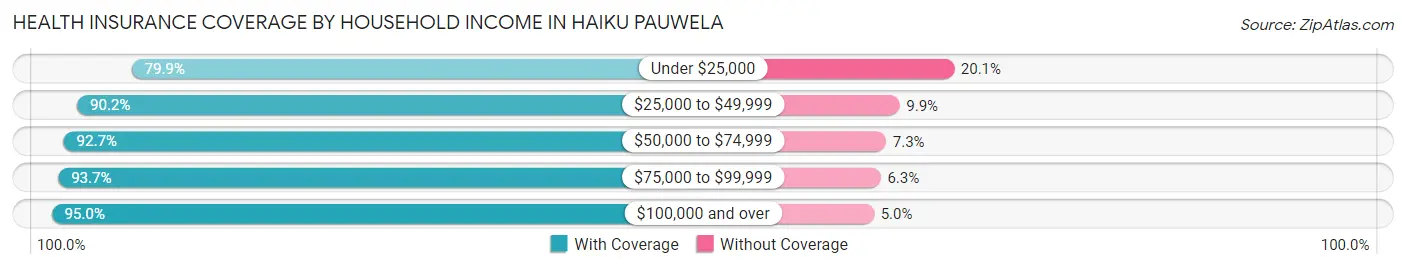
| Household Income | With Coverage | Without Coverage |
| Under $25,000 | 271 (79.9%) | 68 (20.1%) |
| $25,000 to $49,999 | 558 (90.1%) | 61 (9.9%) |
| $50,000 to $74,999 | 950 (92.7%) | 75 (7.3%) |
| $75,000 to $99,999 | 1,856 (93.7%) | 125 (6.3%) |
| $100,000 and over | 5,015 (95.0%) | 266 (5.0%) |
Public vs Private Health Insurance Coverage by Age in Haiku Pauwela
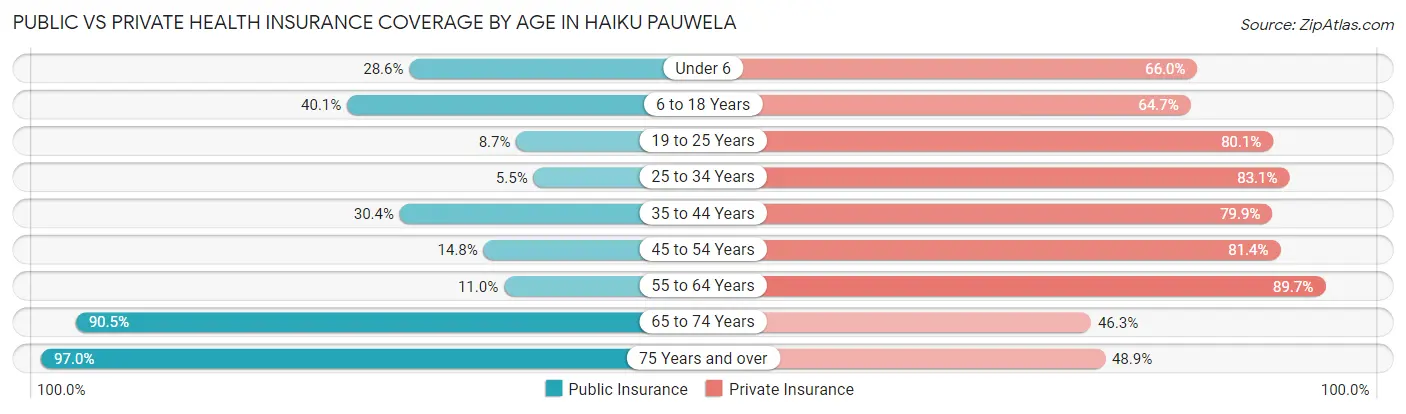
| Age Bracket | Public Insurance | Private Insurance |
| Under 6 | 254 (28.6%) | 586 (66.0%) |
| 6 to 18 Years | 570 (40.1%) | 919 (64.7%) |
| 19 to 25 Years | 53 (8.7%) | 486 (80.1%) |
| 25 to 34 Years | 68 (5.5%) | 1,019 (83.1%) |
| 35 to 44 Years | 450 (30.4%) | 1,184 (79.9%) |
| 45 to 54 Years | 155 (14.8%) | 852 (81.4%) |
| 55 to 64 Years | 136 (11.0%) | 1,107 (89.7%) |
| 65 to 74 Years | 857 (90.5%) | 438 (46.3%) |
| 75 Years and over | 381 (97.0%) | 192 (48.8%) |
| Total | 2,924 (31.6%) | 6,783 (73.4%) |
Disability Status by Sex by Age in Haiku Pauwela
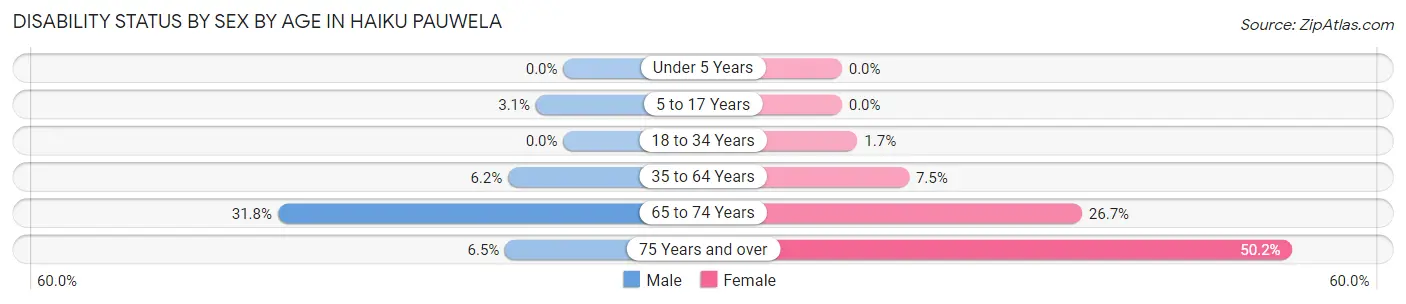
| Age Bracket | Male | Female |
| Under 5 Years | 0 (0.0%) | 0 (0.0%) |
| 5 to 17 Years | 27 (3.1%) | 0 (0.0%) |
| 18 to 34 Years | 0 (0.0%) | 15 (1.7%) |
| 35 to 64 Years | 109 (6.2%) | 149 (7.5%) |
| 65 to 74 Years | 187 (31.8%) | 96 (26.7%) |
| 75 Years and over | 7 (6.5%) | 143 (50.2%) |
Disability Class by Sex by Age in Haiku Pauwela
Disability Class: Hearing Difficulty
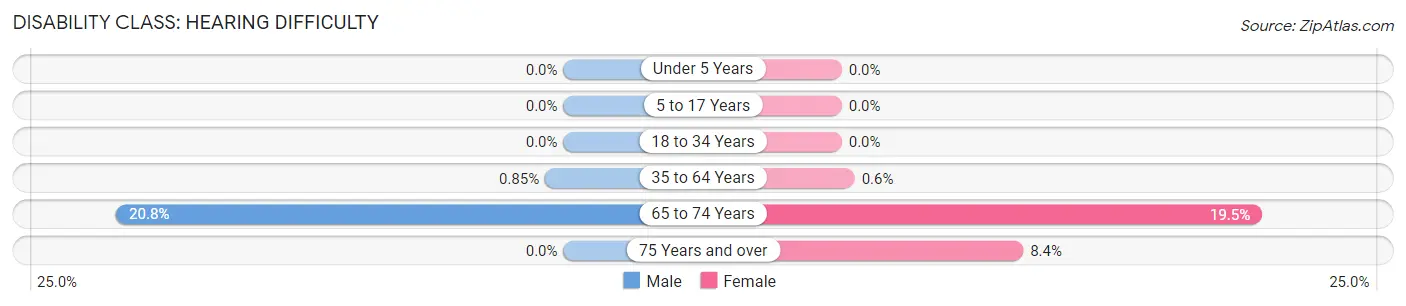
| Age Bracket | Male | Female |
| Under 5 Years | 0 (0.0%) | 0 (0.0%) |
| 5 to 17 Years | 0 (0.0%) | 0 (0.0%) |
| 18 to 34 Years | 0 (0.0%) | 0 (0.0%) |
| 35 to 64 Years | 15 (0.9%) | 12 (0.6%) |
| 65 to 74 Years | 122 (20.7%) | 70 (19.5%) |
| 75 Years and over | 0 (0.0%) | 24 (8.4%) |
Disability Class: Vision Difficulty
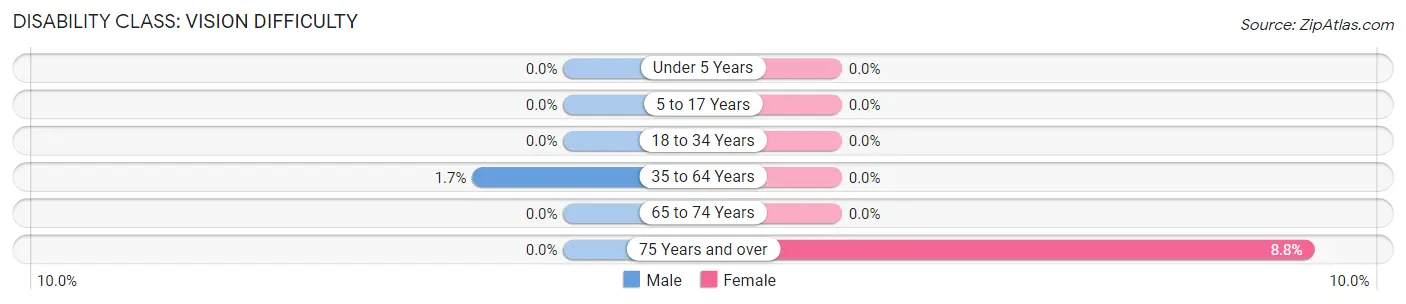
| Age Bracket | Male | Female |
| Under 5 Years | 0 (0.0%) | 0 (0.0%) |
| 5 to 17 Years | 0 (0.0%) | 0 (0.0%) |
| 18 to 34 Years | 0 (0.0%) | 0 (0.0%) |
| 35 to 64 Years | 30 (1.7%) | 0 (0.0%) |
| 65 to 74 Years | 0 (0.0%) | 0 (0.0%) |
| 75 Years and over | 0 (0.0%) | 25 (8.8%) |
Disability Class: Cognitive Difficulty
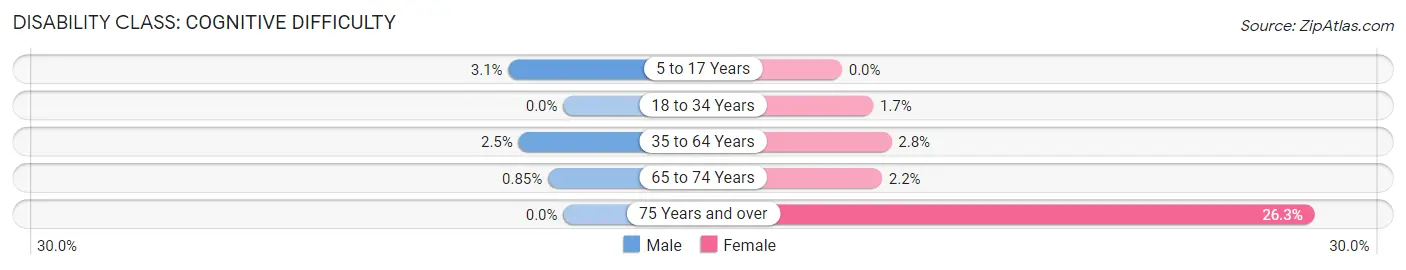
| Age Bracket | Male | Female |
| 5 to 17 Years | 27 (3.1%) | 0 (0.0%) |
| 18 to 34 Years | 0 (0.0%) | 15 (1.7%) |
| 35 to 64 Years | 44 (2.5%) | 55 (2.8%) |
| 65 to 74 Years | 5 (0.9%) | 8 (2.2%) |
| 75 Years and over | 0 (0.0%) | 75 (26.3%) |
Disability Class: Ambulatory Difficulty
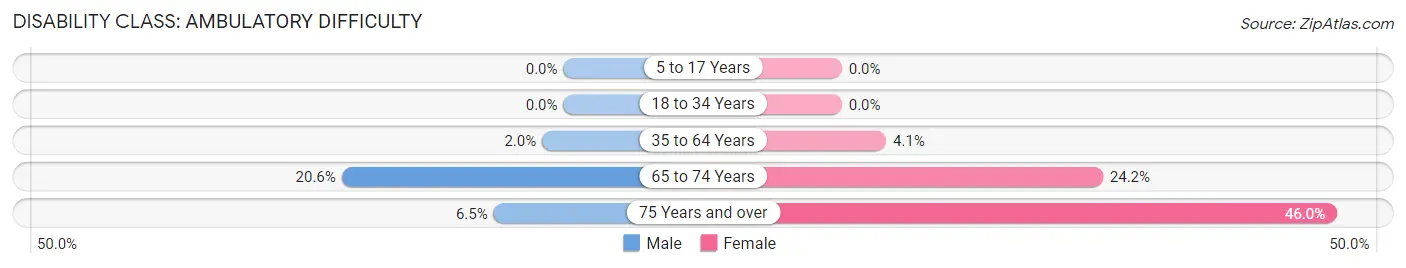
| Age Bracket | Male | Female |
| 5 to 17 Years | 0 (0.0%) | 0 (0.0%) |
| 18 to 34 Years | 0 (0.0%) | 0 (0.0%) |
| 35 to 64 Years | 35 (2.0%) | 82 (4.1%) |
| 65 to 74 Years | 121 (20.6%) | 87 (24.2%) |
| 75 Years and over | 7 (6.5%) | 131 (46.0%) |
Disability Class: Self-Care Difficulty
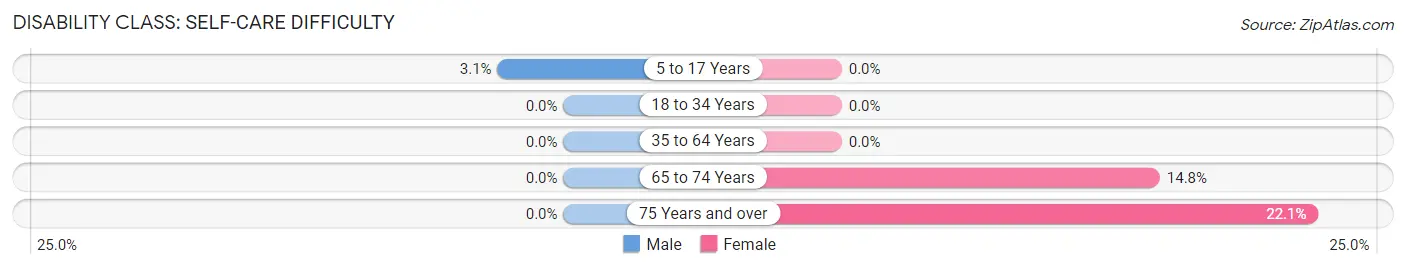
| Age Bracket | Male | Female |
| 5 to 17 Years | 27 (3.1%) | 0 (0.0%) |
| 18 to 34 Years | 0 (0.0%) | 0 (0.0%) |
| 35 to 64 Years | 0 (0.0%) | 0 (0.0%) |
| 65 to 74 Years | 0 (0.0%) | 53 (14.8%) |
| 75 Years and over | 0 (0.0%) | 63 (22.1%) |
Technology Access in Haiku Pauwela
Computing Device Access in Haiku Pauwela
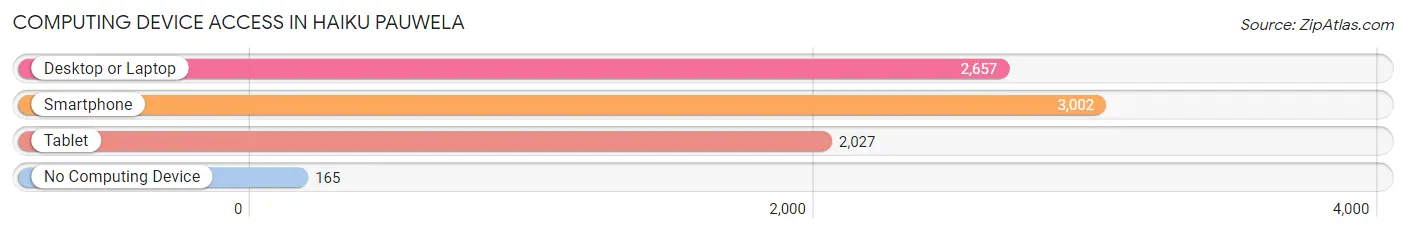
| Device Type | # Households | % Households |
| Desktop or Laptop | 2,657 | 81.3% |
| Smartphone | 3,002 | 91.9% |
| Tablet | 2,027 | 62.0% |
| No Computing Device | 165 | 5.1% |
| Total | 3,268 | 100.0% |
Internet Access in Haiku Pauwela
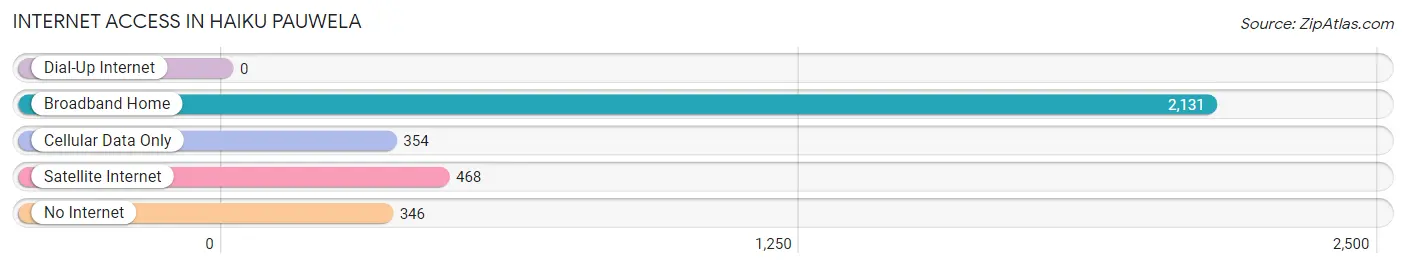
| Internet Type | # Households | % Households |
| Dial-Up Internet | 0 | 0.0% |
| Broadband Home | 2,131 | 65.2% |
| Cellular Data Only | 354 | 10.8% |
| Satellite Internet | 468 | 14.3% |
| No Internet | 346 | 10.6% |
| Total | 3,268 | 100.0% |
Haiku Pauwela Summary
Haiku Pauwela is a small unincorporated community located in Maui County, Hawaii. It is situated on the north shore of Maui, between the towns of Paia and Makawao. The population of Haiku Pauwela is estimated to be around 2,000 people.
History
Haiku Pauwela was originally a small fishing village, established in the late 1800s. The area was first settled by Japanese immigrants who were looking for a place to farm and fish. The name “Haiku Pauwela” is derived from the Hawaiian words “ha’iku” meaning “breath” and “pauwela” meaning “red”. The name was chosen to reflect the red-tinted soil of the area.
In the early 1900s, the area was home to a large sugar plantation. The plantation was owned by the Pauwela Sugar Company, which was founded in 1906. The company was responsible for the construction of the Pauwela Mill, which was the largest sugar mill in the Hawaiian Islands. The mill operated until the late 1950s, when it was closed due to the decline of the sugar industry in Hawaii.
Geography
Haiku Pauwela is located on the north shore of Maui, between the towns of Paia and Makawao. The area is characterized by rolling hills and lush vegetation. The climate is tropical, with temperatures ranging from the mid-70s to the mid-80s throughout the year.
The area is home to several beaches, including Pauwela Beach, which is a popular spot for swimming and surfing. The area is also home to several hiking trails, including the popular Haiku Stairs, which is a steep trail that leads to the top of Puu Kukui, the highest peak on Maui.
Economy
The economy of Haiku Pauwela is largely based on tourism. The area is home to several resorts and hotels, as well as restaurants and shops. The area is also home to several art galleries and studios, which attract visitors from all over the world.
The area is also home to several agricultural operations, including the Pauwela Farm, which grows a variety of fruits and vegetables. The farm also produces honey and other products.
Demographics
As of the 2010 census, the population of Haiku Pauwela was estimated to be around 2,000 people. The population is largely composed of Native Hawaiians, with a small percentage of other ethnicities. The median age of the population is around 40 years old. The median household income is around $50,000.
Haiku Pauwela is a small but vibrant community that is home to a diverse population. The area is known for its beautiful scenery and laid-back atmosphere. It is a popular destination for tourists and locals alike, and is a great place to experience the unique culture of Hawaii.
Common Questions
What is Per Capita Income in Haiku Pauwela?
Per Capita income in Haiku Pauwela is $41,010.
What is the Median Family Income in Haiku Pauwela?
Median Family Income in Haiku Pauwela is $94,193.
What is the Median Household income in Haiku Pauwela?
Median Household Income in Haiku Pauwela is $94,495.
What is Income or Wage Gap in Haiku Pauwela?
Income or Wage Gap in Haiku Pauwela is 3.5%.
Women in Haiku Pauwela earn 96.5 cents for every dollar earned by a man.
What is Inequality or Gini Index in Haiku Pauwela?
Inequality or Gini Index in Haiku Pauwela is 0.37.
What is the Total Population of Haiku Pauwela?
Total Population of Haiku Pauwela is 9,245.
What is the Total Male Population of Haiku Pauwela?
Total Male Population of Haiku Pauwela is 4,674.
What is the Total Female Population of Haiku Pauwela?
Total Female Population of Haiku Pauwela is 4,571.
What is the Ratio of Males per 100 Females in Haiku Pauwela?
There are 102.25 Males per 100 Females in Haiku Pauwela.
What is the Ratio of Females per 100 Males in Haiku Pauwela?
There are 97.80 Females per 100 Males in Haiku Pauwela.
What is the Median Population Age in Haiku Pauwela?
Median Population Age in Haiku Pauwela is 37.9 Years.
What is the Average Family Size in Haiku Pauwela
Average Family Size in Haiku Pauwela is 3.2 People.
What is the Average Household Size in Haiku Pauwela
Average Household Size in Haiku Pauwela is 2.8 People.
How Large is the Labor Force in Haiku Pauwela?
There are 4,846 People in the Labor Forcein in Haiku Pauwela.
What is the Percentage of People in the Labor Force in Haiku Pauwela?
68.1% of People are in the Labor Force in Haiku Pauwela.
What is the Unemployment Rate in Haiku Pauwela?
Unemployment Rate in Haiku Pauwela is 6.6%.