Hanamaulu, HI Map & Demographics
Hanamaulu Map
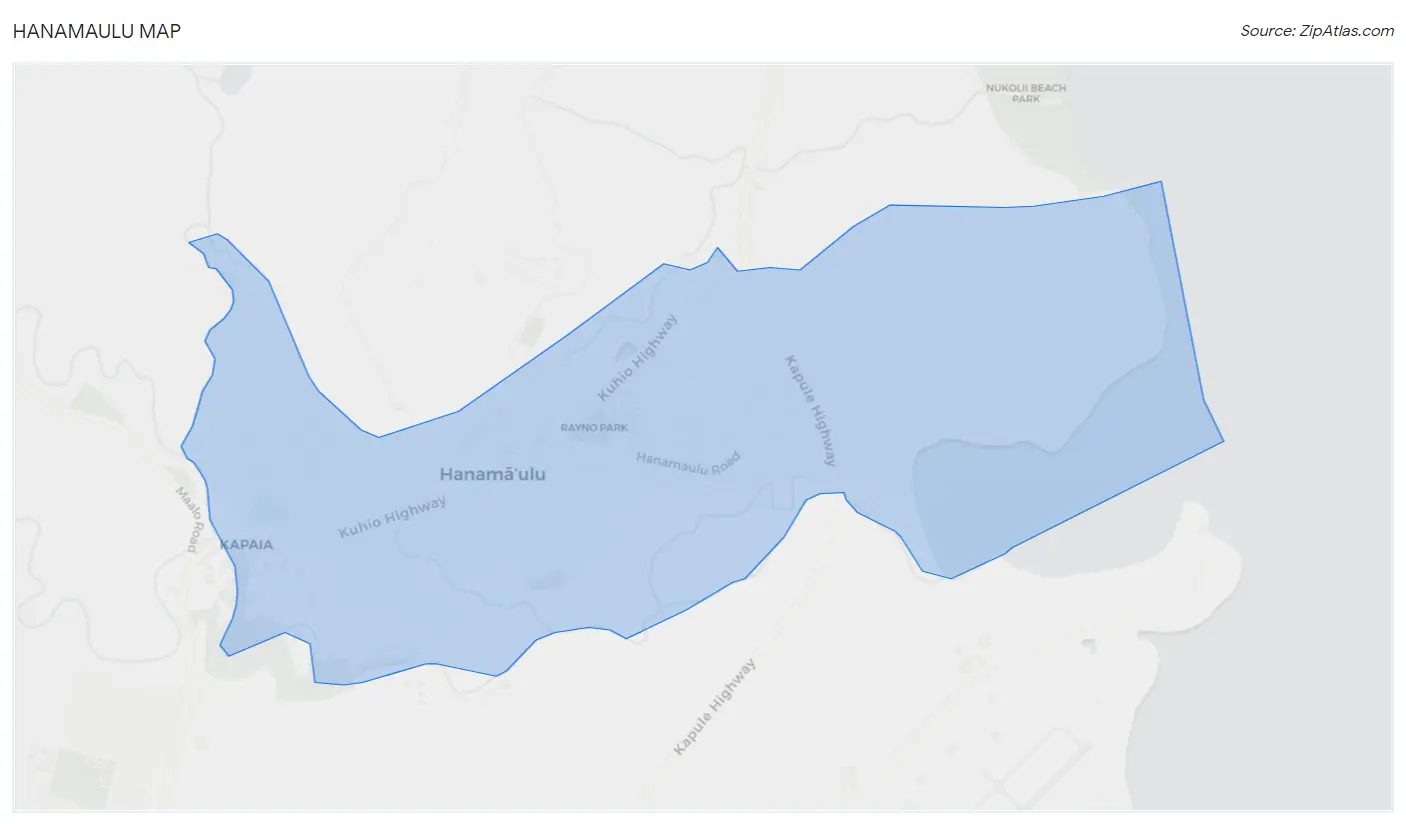
Hanamaulu Overview
$25,825
PER CAPITA INCOME
$74,348
AVG FAMILY INCOME
$74,511
AVG HOUSEHOLD INCOME
27.4%
WAGE / INCOME GAP [ % ]
72.6¢/ $1
WAGE / INCOME GAP [ $ ]
0.40
INEQUALITY / GINI INDEX
4,628
TOTAL POPULATION
2,305
MALE POPULATION
2,323
FEMALE POPULATION
99.23
MALES / 100 FEMALES
100.78
FEMALES / 100 MALES
35.3
MEDIAN AGE
4.3
AVG FAMILY SIZE
4.3
AVG HOUSEHOLD SIZE
2,506
LABOR FORCE [ PEOPLE ]
67.3%
PERCENT IN LABOR FORCE
6.6%
UNEMPLOYMENT RATE
Hanamaulu Area Codes
Income in Hanamaulu
Income Overview in Hanamaulu
Per Capita Income in Hanamaulu is $25,825, while median incomes of families and households are $74,348 and $74,511 respectively.
| Characteristic | Number | Measure |
| Per Capita Income | 4,628 | $25,825 |
| Median Family Income | 946 | $74,348 |
| Mean Family Income | 946 | $89,988 |
| Median Household Income | 1,074 | $74,511 |
| Mean Household Income | 1,074 | $93,156 |
| Income Deficit | 946 | $0 |
| Wage / Income Gap (%) | 4,628 | 27.42% |
| Wage / Income Gap ($) | 4,628 | 72.58¢ per $1 |
| Gini / Inequality Index | 4,628 | 0.40 |
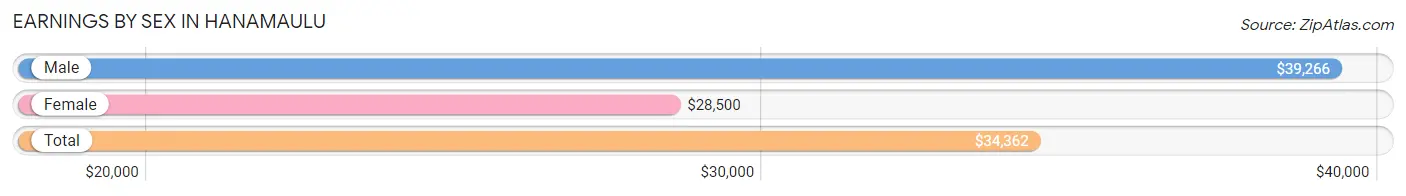
Earnings by Sex in Hanamaulu
Average Earnings in Hanamaulu are $34,362, $39,266 for men and $28,500 for women, a difference of 27.4%.
| Sex | Number | Average Earnings |
| Male | 1,227 (50.4%) | $39,266 |
| Female | 1,208 (49.6%) | $28,500 |
| Total | 2,435 (100.0%) | $34,362 |
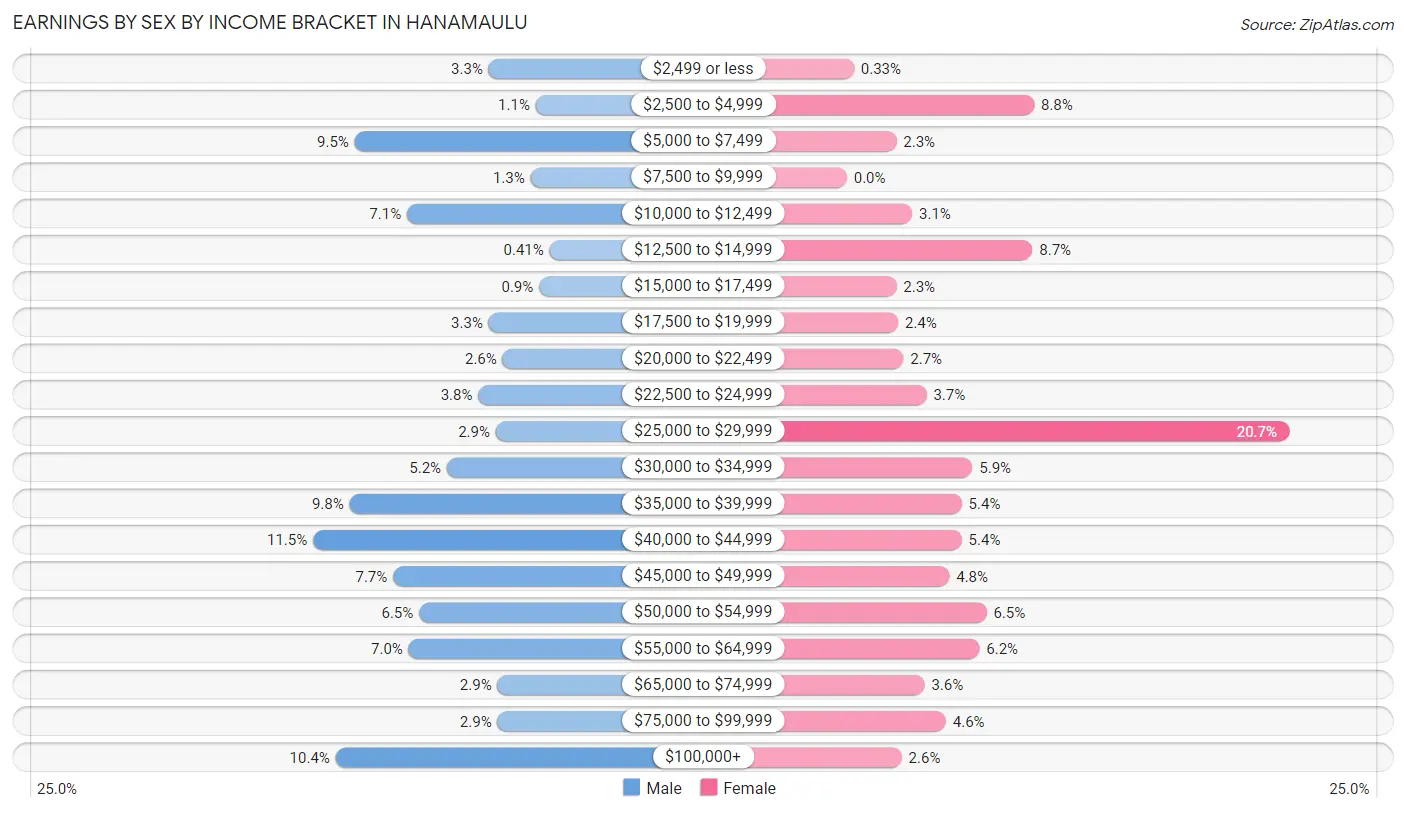
Earnings by Sex by Income Bracket in Hanamaulu
The most common earnings brackets in Hanamaulu are $40,000 to $44,999 for men (141 | 11.5%) and $25,000 to $29,999 for women (250 | 20.7%).
| Income | Male | Female |
| $2,499 or less | 40 (3.3%) | 4 (0.3%) |
| $2,500 to $4,999 | 13 (1.1%) | 106 (8.8%) |
| $5,000 to $7,499 | 117 (9.5%) | 28 (2.3%) |
| $7,500 to $9,999 | 16 (1.3%) | 0 (0.0%) |
| $10,000 to $12,499 | 87 (7.1%) | 37 (3.1%) |
| $12,500 to $14,999 | 5 (0.4%) | 105 (8.7%) |
| $15,000 to $17,499 | 11 (0.9%) | 28 (2.3%) |
| $17,500 to $19,999 | 40 (3.3%) | 29 (2.4%) |
| $20,000 to $22,499 | 32 (2.6%) | 32 (2.6%) |
| $22,500 to $24,999 | 46 (3.7%) | 45 (3.7%) |
| $25,000 to $29,999 | 36 (2.9%) | 250 (20.7%) |
| $30,000 to $34,999 | 64 (5.2%) | 71 (5.9%) |
| $35,000 to $39,999 | 120 (9.8%) | 65 (5.4%) |
| $40,000 to $44,999 | 141 (11.5%) | 65 (5.4%) |
| $45,000 to $49,999 | 95 (7.7%) | 58 (4.8%) |
| $50,000 to $54,999 | 80 (6.5%) | 79 (6.5%) |
| $55,000 to $64,999 | 86 (7.0%) | 75 (6.2%) |
| $65,000 to $74,999 | 35 (2.9%) | 44 (3.6%) |
| $75,000 to $99,999 | 35 (2.9%) | 56 (4.6%) |
| $100,000+ | 128 (10.4%) | 31 (2.6%) |
| Total | 1,227 (100.0%) | 1,208 (100.0%) |
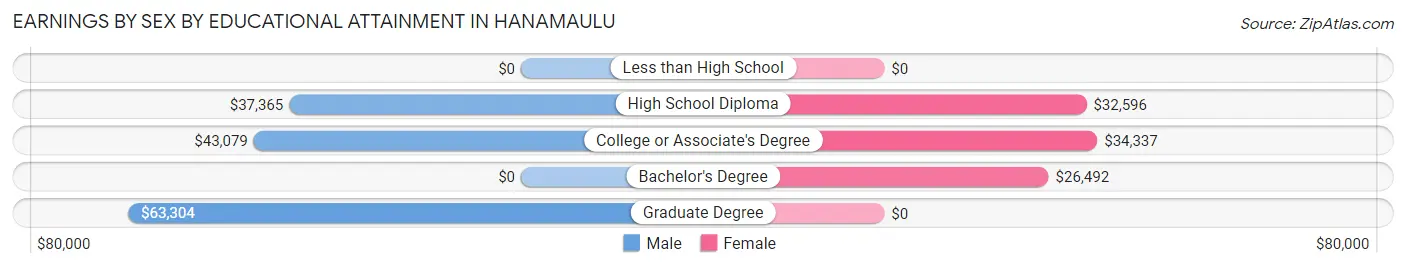
Earnings by Sex by Educational Attainment in Hanamaulu
Average earnings in Hanamaulu are $41,458 for men and $33,433 for women, a difference of 19.4%. Men with an educational attainment of graduate degree enjoy the highest average annual earnings of $63,304, while those with high school diploma education earn the least with $37,365. Women with an educational attainment of college or associate's degree earn the most with the average annual earnings of $34,337, while those with bachelor's degree education have the smallest earnings of $26,492.
| Educational Attainment | Male Income | Female Income |
| Less than High School | - | - |
| High School Diploma | $37,365 | $32,596 |
| College or Associate's Degree | $43,079 | $34,337 |
| Bachelor's Degree | - | - |
| Graduate Degree | $63,304 | $0 |
| Total | $41,458 | $33,433 |
Family Income in Hanamaulu
Family Income Brackets in Hanamaulu
According to the Hanamaulu family income data, there are 239 families falling into the $50,000 to $74,999 income range, which is the most common income bracket and makes up 25.3% of all families.
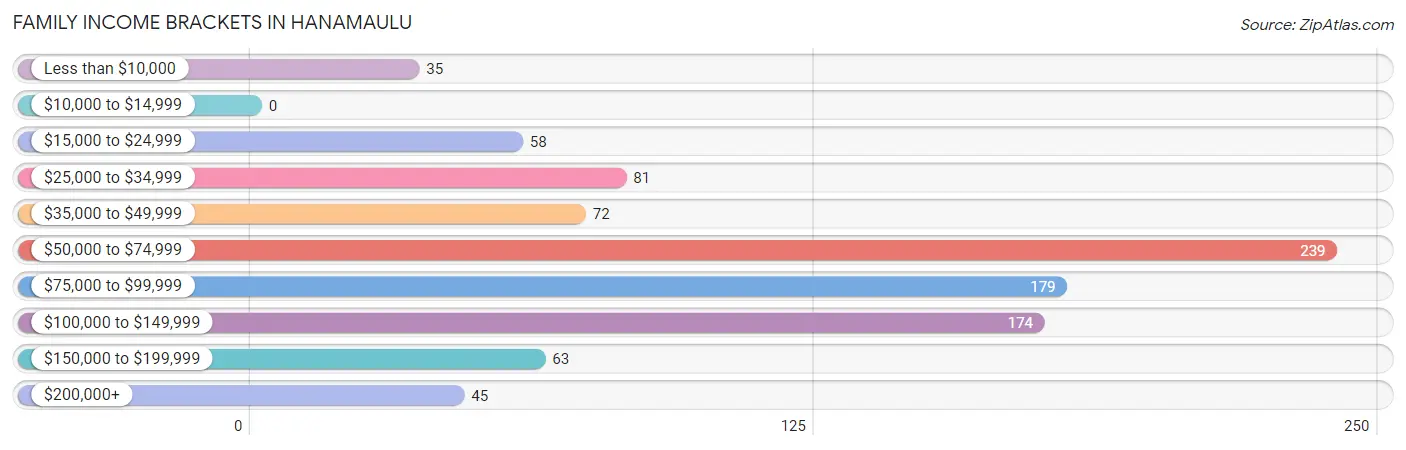
| Income Bracket | # Families | % Families |
| Less than $10,000 | 35 | 3.7% |
| $10,000 to $14,999 | 0 | 0.0% |
| $15,000 to $24,999 | 58 | 6.1% |
| $25,000 to $34,999 | 81 | 8.6% |
| $35,000 to $49,999 | 72 | 7.6% |
| $50,000 to $74,999 | 239 | 25.3% |
| $75,000 to $99,999 | 179 | 18.9% |
| $100,000 to $149,999 | 174 | 18.4% |
| $150,000 to $199,999 | 63 | 6.7% |
| $200,000+ | 45 | 4.8% |
Family Income by Famaliy Size in Hanamaulu
7+ person families (70 | 7.4%) account for the highest median family income in Hanamaulu with $175,833 per family, while 3-person families (182 | 19.2%) have the highest median income of $31,125 per family member.
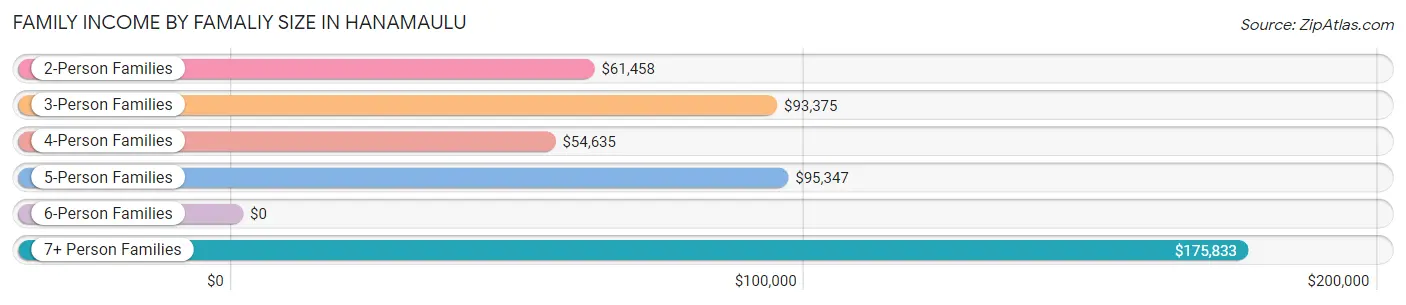
| Income Bracket | # Families | Median Income |
| 2-Person Families | 366 (38.7%) | $61,458 |
| 3-Person Families | 182 (19.2%) | $93,375 |
| 4-Person Families | 127 (13.4%) | $54,635 |
| 5-Person Families | 189 (20.0%) | $95,347 |
| 6-Person Families | 12 (1.3%) | $0 |
| 7+ Person Families | 70 (7.4%) | $175,833 |
| Total | 946 (100.0%) | $74,348 |
Family Income by Number of Earners in Hanamaulu
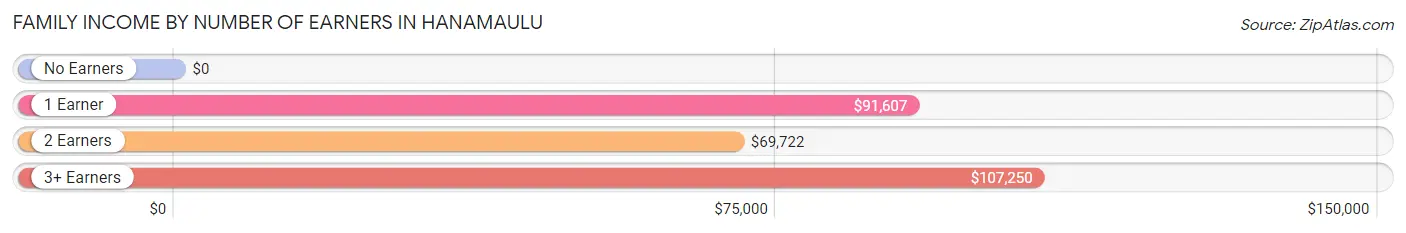
| Number of Earners | # Families | Median Income |
| No Earners | 132 (14.0%) | $0 |
| 1 Earner | 201 (21.2%) | $91,607 |
| 2 Earners | 438 (46.3%) | $69,722 |
| 3+ Earners | 175 (18.5%) | $107,250 |
| Total | 946 (100.0%) | $74,348 |
Household Income in Hanamaulu
Household Income Brackets in Hanamaulu
With 232 households falling in the category, the $50,000 to $74,999 income range is the most frequent in Hanamaulu, accounting for 21.6% of all households.
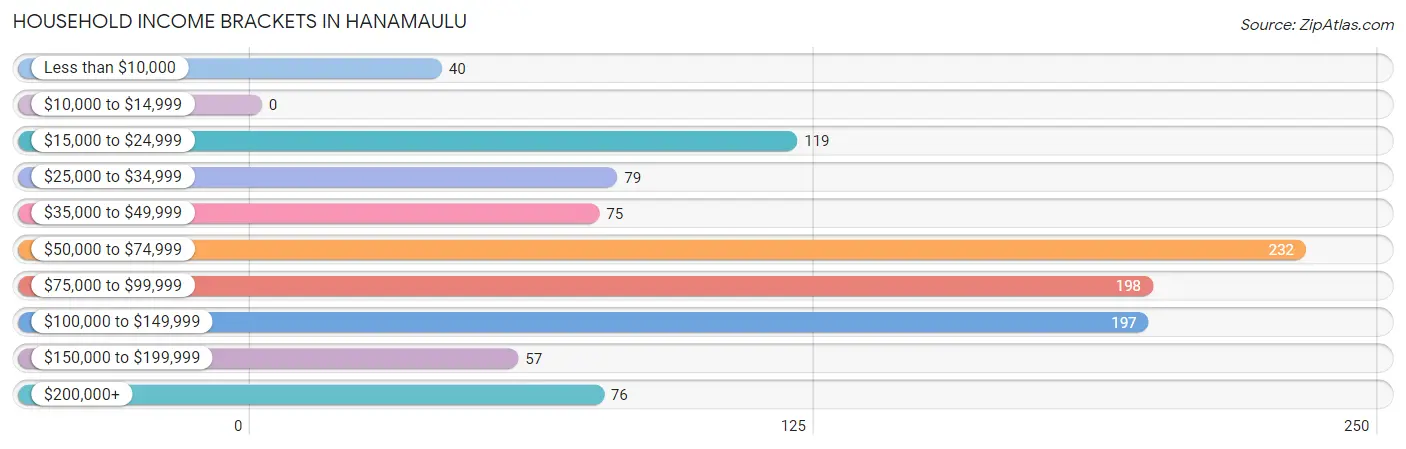
| Income Bracket | # Households | % Households |
| Less than $10,000 | 40 | 3.7% |
| $10,000 to $14,999 | 0 | 0.0% |
| $15,000 to $24,999 | 119 | 11.1% |
| $25,000 to $34,999 | 79 | 7.4% |
| $35,000 to $49,999 | 75 | 7.0% |
| $50,000 to $74,999 | 232 | 21.6% |
| $75,000 to $99,999 | 198 | 18.4% |
| $100,000 to $149,999 | 197 | 18.3% |
| $150,000 to $199,999 | 57 | 5.3% |
| $200,000+ | 76 | 7.1% |
Household Income by Householder Age in Hanamaulu
The median household income in Hanamaulu is $74,511, with the highest median household income of $97,917 found in the 25 to 44 years age bracket for the primary householder. A total of 294 households (27.4%) fall into this category. Meanwhile, the 15 to 24 years age bracket for the primary householder has the lowest median household income of $0, with 9 households (0.8%) in this group.
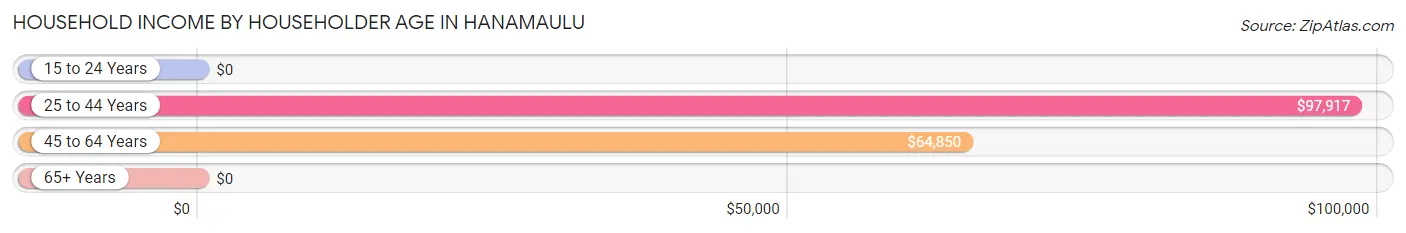
| Income Bracket | # Households | Median Income |
| 15 to 24 Years | 9 (0.8%) | $0 |
| 25 to 44 Years | 294 (27.4%) | $97,917 |
| 45 to 64 Years | 442 (41.1%) | $64,850 |
| 65+ Years | 329 (30.6%) | $0 |
| Total | 1,074 (100.0%) | $74,511 |
Poverty in Hanamaulu
Income Below Poverty by Sex and Age in Hanamaulu
With 6.6% poverty level for males and 12.1% for females among the residents of Hanamaulu, 15 year old males and under 5 year old females are the most vulnerable to poverty, with 9 males (32.1%) and 28 females (68.3%) in their respective age groups living below the poverty level.
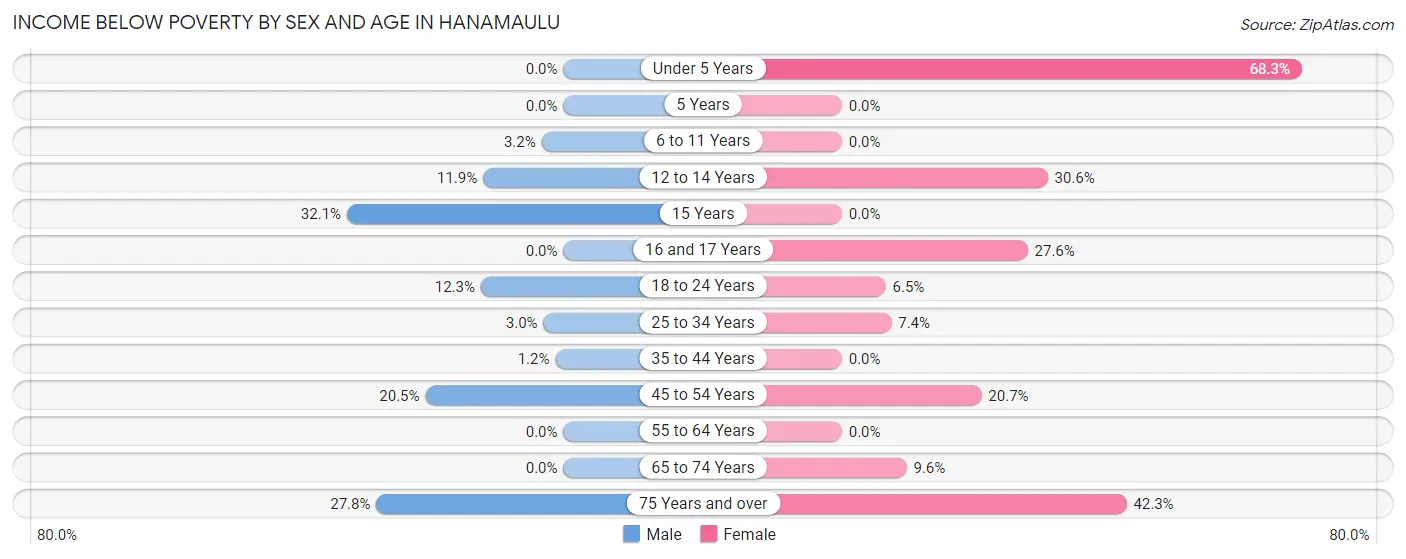
| Age Bracket | Male | Female |
| Under 5 Years | 0 (0.0%) | 28 (68.3%) |
| 5 Years | 0 (0.0%) | 0 (0.0%) |
| 6 to 11 Years | 7 (3.2%) | 0 (0.0%) |
| 12 to 14 Years | 13 (11.9%) | 44 (30.6%) |
| 15 Years | 9 (32.1%) | 0 (0.0%) |
| 16 and 17 Years | 0 (0.0%) | 16 (27.6%) |
| 18 to 24 Years | 26 (12.3%) | 25 (6.5%) |
| 25 to 34 Years | 11 (3.0%) | 23 (7.3%) |
| 35 to 44 Years | 5 (1.2%) | 0 (0.0%) |
| 45 to 54 Years | 59 (20.5%) | 51 (20.7%) |
| 55 to 64 Years | 0 (0.0%) | 0 (0.0%) |
| 65 to 74 Years | 0 (0.0%) | 12 (9.6%) |
| 75 Years and over | 20 (27.8%) | 82 (42.3%) |
| Total | 150 (6.6%) | 281 (12.1%) |
Income Above Poverty by Sex and Age in Hanamaulu
According to the poverty statistics in Hanamaulu, males aged under 5 years and females aged 5 years are the age groups that are most secure financially, with 100.0% of males and 100.0% of females in these age groups living above the poverty line.
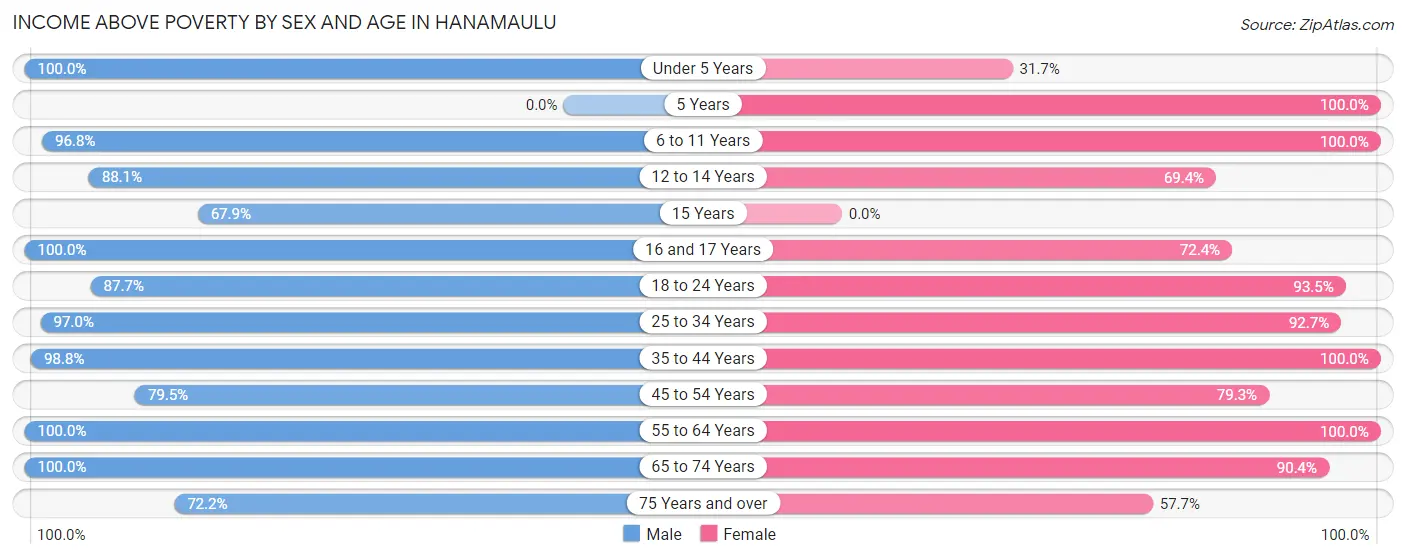
| Age Bracket | Male | Female |
| Under 5 Years | 152 (100.0%) | 13 (31.7%) |
| 5 Years | 0 (0.0%) | 4 (100.0%) |
| 6 to 11 Years | 209 (96.8%) | 184 (100.0%) |
| 12 to 14 Years | 96 (88.1%) | 100 (69.4%) |
| 15 Years | 19 (67.9%) | 0 (0.0%) |
| 16 and 17 Years | 44 (100.0%) | 42 (72.4%) |
| 18 to 24 Years | 186 (87.7%) | 359 (93.5%) |
| 25 to 34 Years | 360 (97.0%) | 290 (92.6%) |
| 35 to 44 Years | 415 (98.8%) | 364 (100.0%) |
| 45 to 54 Years | 229 (79.5%) | 195 (79.3%) |
| 55 to 64 Years | 146 (100.0%) | 261 (100.0%) |
| 65 to 74 Years | 225 (100.0%) | 113 (90.4%) |
| 75 Years and over | 52 (72.2%) | 112 (57.7%) |
| Total | 2,133 (93.4%) | 2,037 (87.9%) |
Income Below Poverty Among Married-Couple Families in Hanamaulu
The poverty statistics for married-couple families in Hanamaulu show that 10.0% or 66 of the total 663 families live below the poverty line. Families with 1 or 2 children have the highest poverty rate of 13.1%, comprising of 31 families. On the other hand, families with 3 or 4 children have the lowest poverty rate of 0.0%, which includes 0 families.
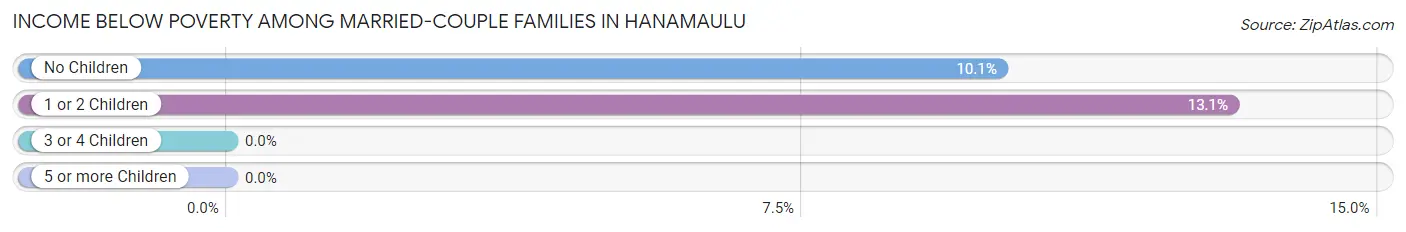
| Children | Above Poverty | Below Poverty |
| No Children | 313 (89.9%) | 35 (10.1%) |
| 1 or 2 Children | 206 (86.9%) | 31 (13.1%) |
| 3 or 4 Children | 78 (100.0%) | 0 (0.0%) |
| 5 or more Children | 0 (0.0%) | 0 (0.0%) |
| Total | 597 (90.0%) | 66 (10.0%) |
Income Below Poverty Among Single-Parent Households in Hanamaulu
According to the poverty data in Hanamaulu, 28.0% or 14 single-father households and 12.0% or 28 single-mother households are living below the poverty line. Among single-father households, those with 5 or more children have the highest poverty rate, with 5 households (100.0%) experiencing poverty. Likewise, among single-mother households, those with 1 or 2 children have the highest poverty rate, with 28 households (29.8%) falling below the poverty line.
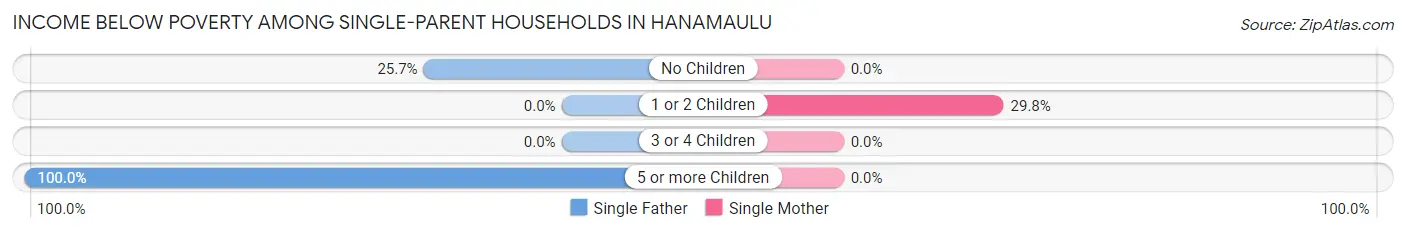
| Children | Single Father | Single Mother |
| No Children | 9 (25.7%) | 0 (0.0%) |
| 1 or 2 Children | 0 (0.0%) | 28 (29.8%) |
| 3 or 4 Children | 0 (0.0%) | 0 (0.0%) |
| 5 or more Children | 5 (100.0%) | 0 (0.0%) |
| Total | 14 (28.0%) | 28 (12.0%) |
Income Below Poverty Among Married-Couple vs Single-Parent Households in Hanamaulu
The poverty data for Hanamaulu shows that 66 of the married-couple family households (10.0%) and 42 of the single-parent households (14.8%) are living below the poverty level. Within the married-couple family households, those with 1 or 2 children have the highest poverty rate, with 31 households (13.1%) falling below the poverty line. Among the single-parent households, those with 5 or more children have the highest poverty rate, with 5 household (100.0%) living below poverty.
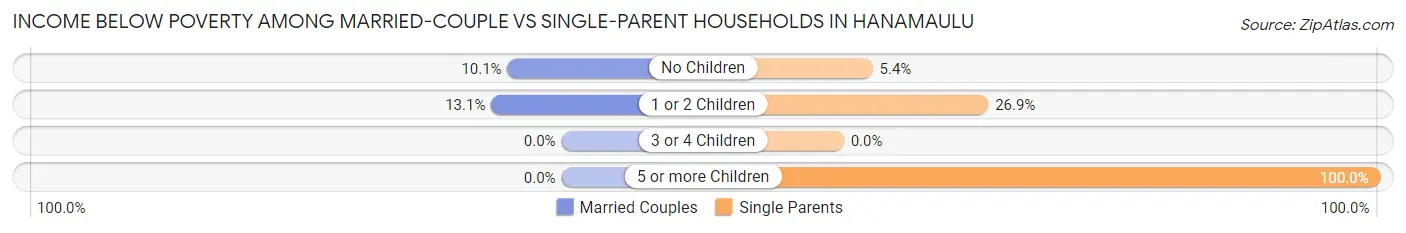
| Children | Married-Couple Families | Single-Parent Households |
| No Children | 35 (10.1%) | 9 (5.4%) |
| 1 or 2 Children | 31 (13.1%) | 28 (26.9%) |
| 3 or 4 Children | 0 (0.0%) | 0 (0.0%) |
| 5 or more Children | 0 (0.0%) | 5 (100.0%) |
| Total | 66 (10.0%) | 42 (14.8%) |
Race in Hanamaulu
The most populous races in Hanamaulu are Asian (1,944 | 42.0%), Two or more Races (1,607 | 34.7%), and Hispanic or Latino (707 | 15.3%).
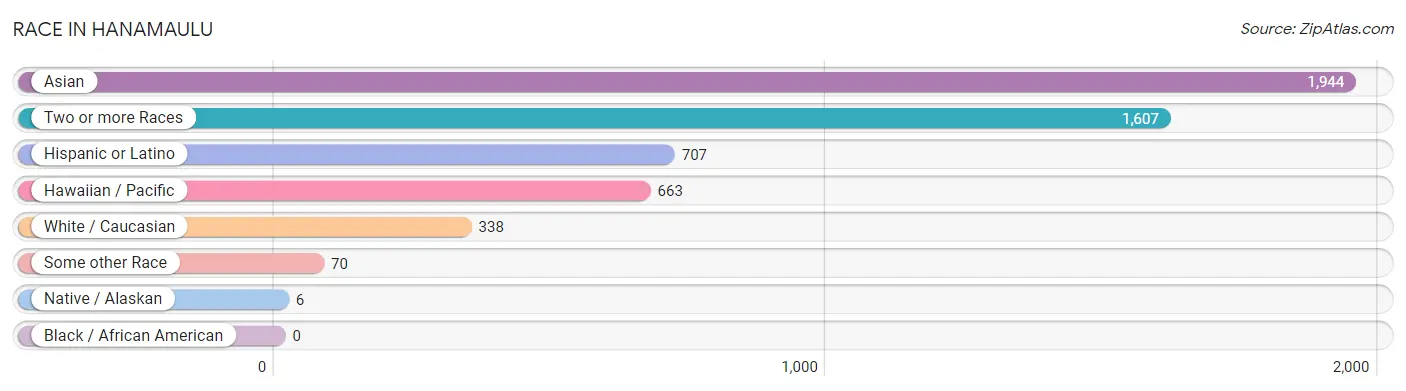
| Race | # Population | % Population |
| Asian | 1,944 | 42.0% |
| Black / African American | 0 | 0.0% |
| Hawaiian / Pacific | 663 | 14.3% |
| Hispanic or Latino | 707 | 15.3% |
| Native / Alaskan | 6 | 0.1% |
| White / Caucasian | 338 | 7.3% |
| Two or more Races | 1,607 | 34.7% |
| Some other Race | 70 | 1.5% |
| Total | 4,628 | 100.0% |
Ancestry in Hanamaulu
The most populous ancestries reported in Hanamaulu are Korean (2,865 | 61.9%), Native Hawaiian (1,455 | 31.4%), Indian (Asian) (703 | 15.2%), Bhutanese (473 | 10.2%), and Fijian (435 | 9.4%), together accounting for 128.2% of all Hanamaulu residents.
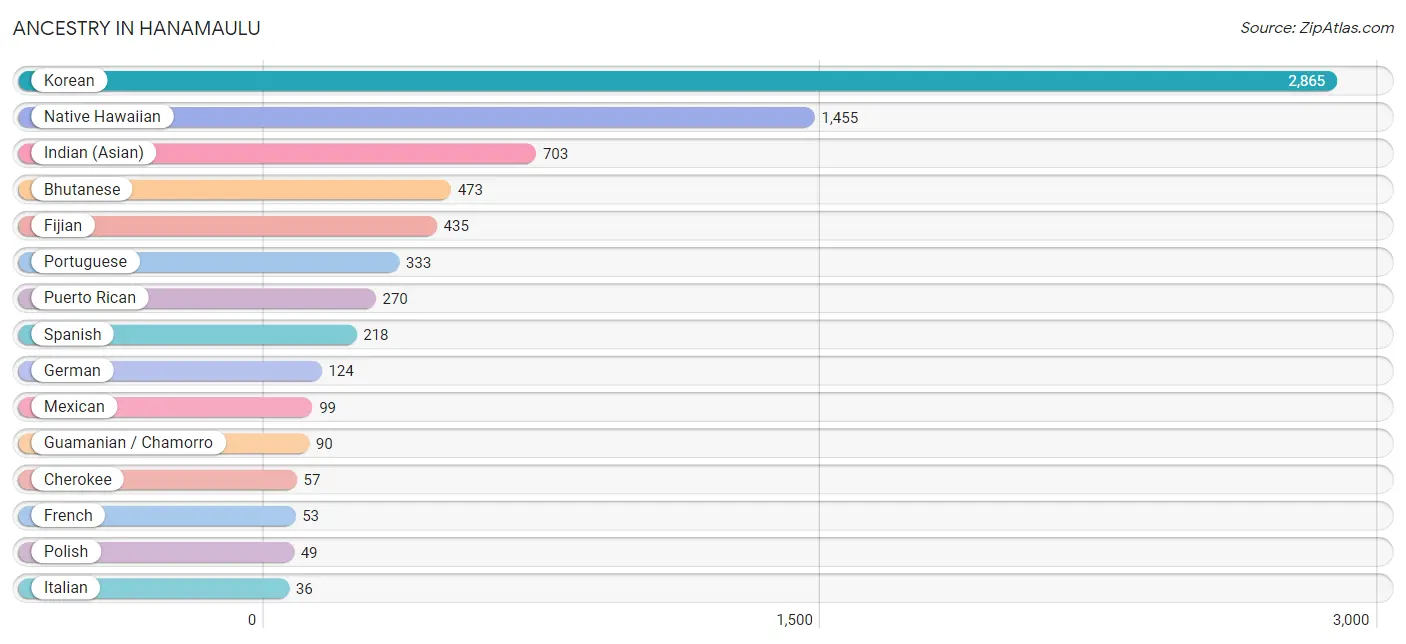
| Ancestry | # Population | % Population |
| American | 31 | 0.7% |
| Arab | 16 | 0.4% |
| Bhutanese | 473 | 10.2% |
| Burmese | 8 | 0.2% |
| Cherokee | 57 | 1.2% |
| Chippewa | 24 | 0.5% |
| Danish | 20 | 0.4% |
| English | 20 | 0.4% |
| Fijian | 435 | 9.4% |
| French | 53 | 1.1% |
| German | 124 | 2.7% |
| Guamanian / Chamorro | 90 | 1.9% |
| Indian (Asian) | 703 | 15.2% |
| Irish | 16 | 0.4% |
| Italian | 36 | 0.8% |
| Korean | 2,865 | 61.9% |
| Lebanese | 16 | 0.4% |
| Mexican | 99 | 2.1% |
| Native Hawaiian | 1,455 | 31.4% |
| Polish | 49 | 1.1% |
| Portuguese | 333 | 7.2% |
| Puerto Rican | 270 | 5.8% |
| Scotch-Irish | 14 | 0.3% |
| Spanish | 218 | 4.7% |
| Swedish | 5 | 0.1% |
| Thai | 2 | 0.0% |
| Ukrainian | 15 | 0.3% |
| Welsh | 16 | 0.4% | View All 28 Rows |
Immigrants in Hanamaulu
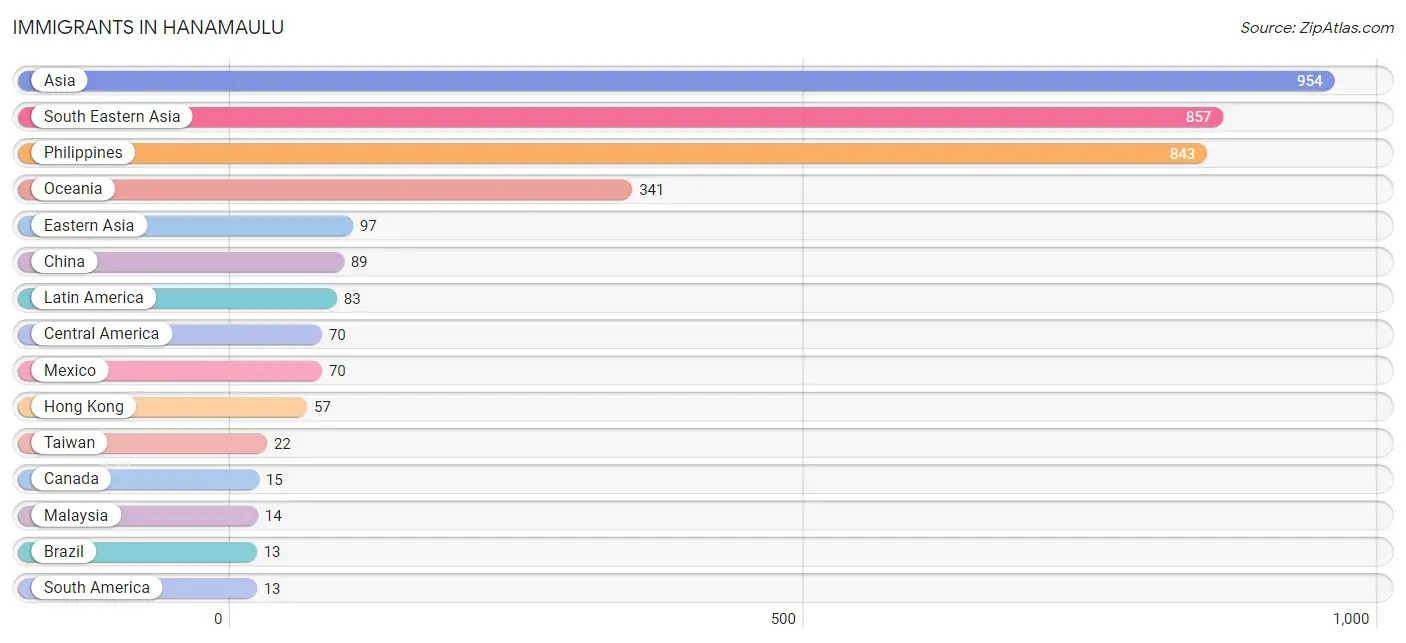
The most numerous immigrant groups reported in Hanamaulu came from Asia (954 | 20.6%), South Eastern Asia (857 | 18.5%), Philippines (843 | 18.2%), Oceania (341 | 7.4%), and Eastern Asia (97 | 2.1%), together accounting for 66.8% of all Hanamaulu residents.
| Immigration Origin | # Population | % Population |
| Asia | 954 | 20.6% |
| Brazil | 13 | 0.3% |
| Canada | 15 | 0.3% |
| Central America | 70 | 1.5% |
| China | 89 | 1.9% |
| Eastern Asia | 97 | 2.1% |
| Hong Kong | 57 | 1.2% |
| Korea | 8 | 0.2% |
| Latin America | 83 | 1.8% |
| Malaysia | 14 | 0.3% |
| Mexico | 70 | 1.5% |
| Oceania | 341 | 7.4% |
| Philippines | 843 | 18.2% |
| South America | 13 | 0.3% |
| South Eastern Asia | 857 | 18.5% |
| Taiwan | 22 | 0.5% | View All 16 Rows |
Sex and Age in Hanamaulu
Sex and Age in Hanamaulu
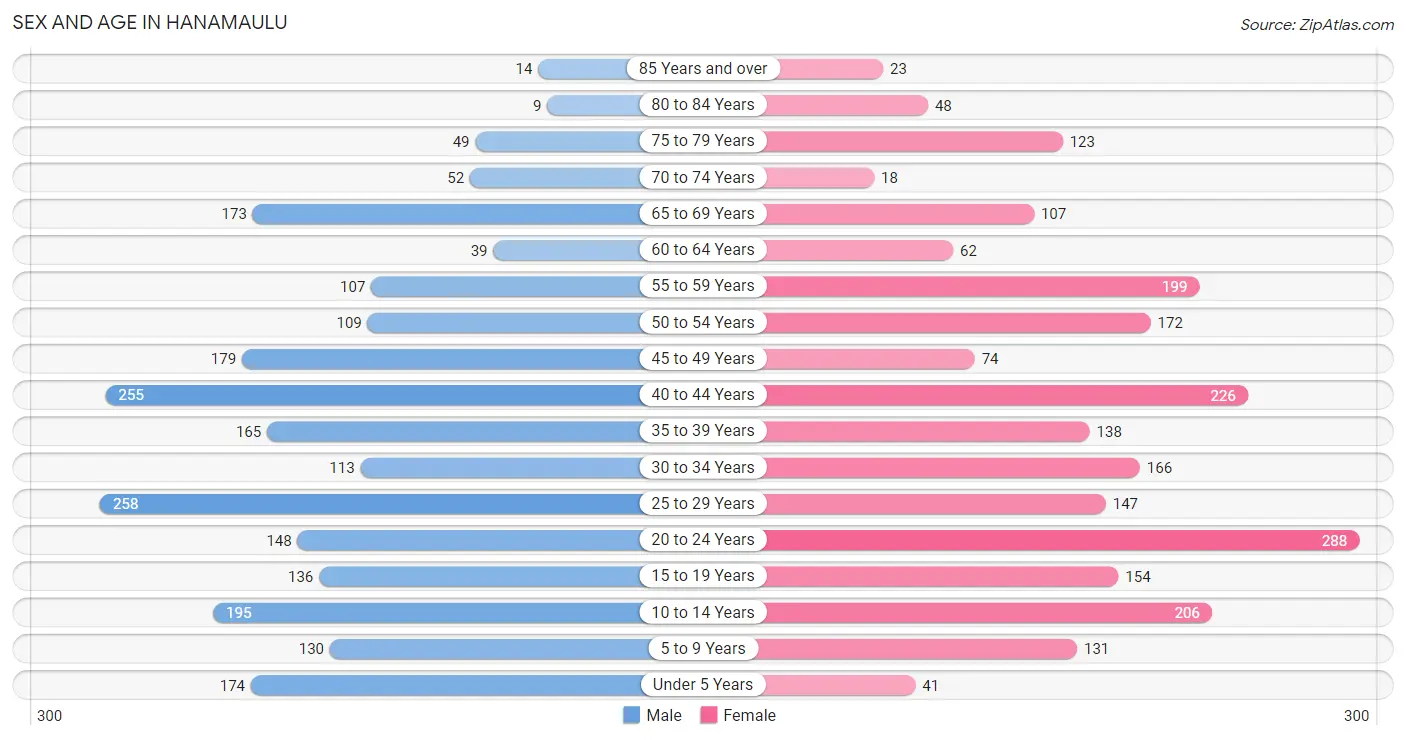
The most populous age groups in Hanamaulu are 25 to 29 Years (258 | 11.2%) for men and 20 to 24 Years (288 | 12.4%) for women.
| Age Bracket | Male | Female |
| Under 5 Years | 174 (7.5%) | 41 (1.8%) |
| 5 to 9 Years | 130 (5.6%) | 131 (5.6%) |
| 10 to 14 Years | 195 (8.5%) | 206 (8.9%) |
| 15 to 19 Years | 136 (5.9%) | 154 (6.6%) |
| 20 to 24 Years | 148 (6.4%) | 288 (12.4%) |
| 25 to 29 Years | 258 (11.2%) | 147 (6.3%) |
| 30 to 34 Years | 113 (4.9%) | 166 (7.1%) |
| 35 to 39 Years | 165 (7.2%) | 138 (5.9%) |
| 40 to 44 Years | 255 (11.1%) | 226 (9.7%) |
| 45 to 49 Years | 179 (7.8%) | 74 (3.2%) |
| 50 to 54 Years | 109 (4.7%) | 172 (7.4%) |
| 55 to 59 Years | 107 (4.6%) | 199 (8.6%) |
| 60 to 64 Years | 39 (1.7%) | 62 (2.7%) |
| 65 to 69 Years | 173 (7.5%) | 107 (4.6%) |
| 70 to 74 Years | 52 (2.3%) | 18 (0.8%) |
| 75 to 79 Years | 49 (2.1%) | 123 (5.3%) |
| 80 to 84 Years | 9 (0.4%) | 48 (2.1%) |
| 85 Years and over | 14 (0.6%) | 23 (1.0%) |
| Total | 2,305 (100.0%) | 2,323 (100.0%) |
Families and Households in Hanamaulu
Median Family Size in Hanamaulu
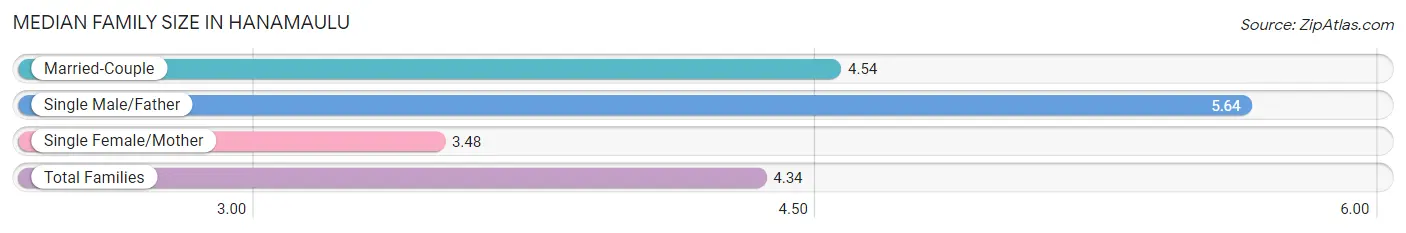
The median family size in Hanamaulu is 4.34 persons per family, with single male/father families (50 | 5.3%) accounting for the largest median family size of 5.64 persons per family. On the other hand, single female/mother families (233 | 24.6%) represent the smallest median family size with 3.48 persons per family.
| Family Type | # Families | Family Size |
| Married-Couple | 663 (70.1%) | 4.54 |
| Single Male/Father | 50 (5.3%) | 5.64 |
| Single Female/Mother | 233 (24.6%) | 3.48 |
| Total Families | 946 (100.0%) | 4.34 |
Median Household Size in Hanamaulu
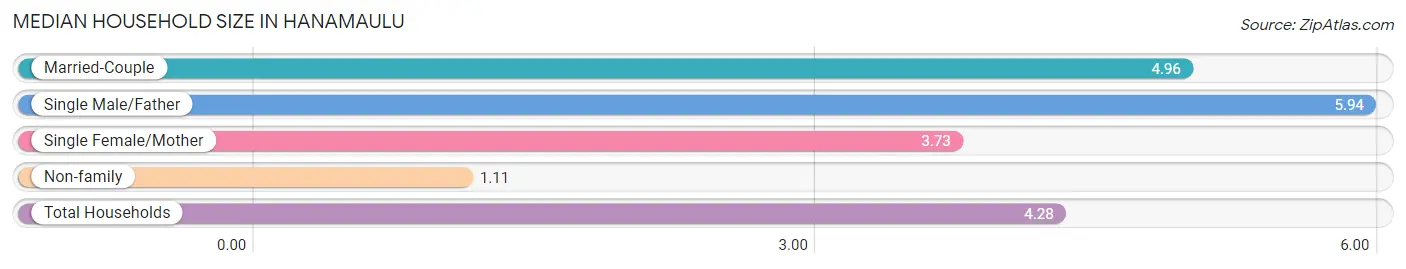
The median household size in Hanamaulu is 4.28 persons per household, with single male/father households (50 | 4.7%) accounting for the largest median household size of 5.94 persons per household. non-family households (128 | 11.9%) represent the smallest median household size with 1.11 persons per household.
| Household Type | # Households | Household Size |
| Married-Couple | 663 (61.7%) | 4.96 |
| Single Male/Father | 50 (4.7%) | 5.94 |
| Single Female/Mother | 233 (21.7%) | 3.73 |
| Non-family | 128 (11.9%) | 1.11 |
| Total Households | 1,074 (100.0%) | 4.28 |
Household Size by Marriage Status in Hanamaulu
Out of a total of 1,074 households in Hanamaulu, 946 (88.1%) are family households, while 128 (11.9%) are nonfamily households. The most numerous type of family households are 2-person households, comprising 282, and the most common type of nonfamily households are 1-person households, comprising 113.
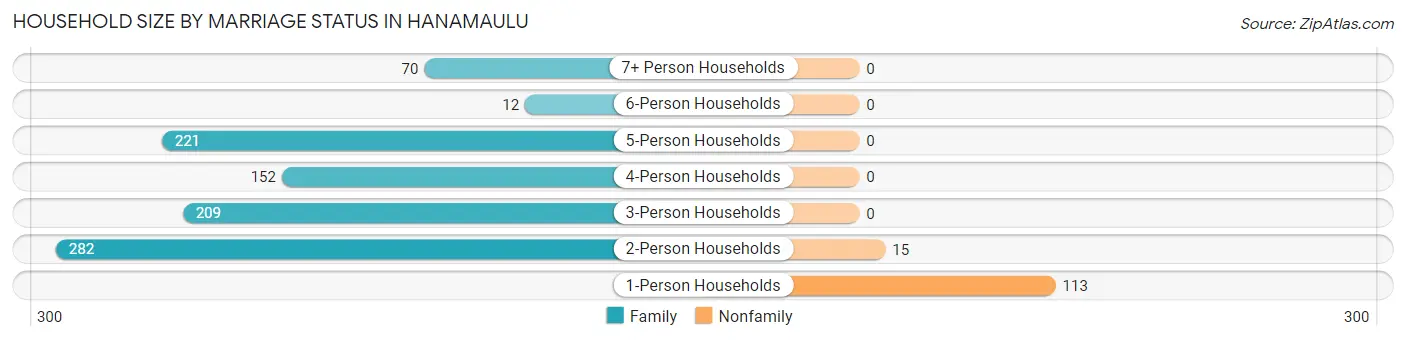
| Household Size | Family Households | Nonfamily Households |
| 1-Person Households | - | 113 (10.5%) |
| 2-Person Households | 282 (26.3%) | 15 (1.4%) |
| 3-Person Households | 209 (19.5%) | 0 (0.0%) |
| 4-Person Households | 152 (14.1%) | 0 (0.0%) |
| 5-Person Households | 221 (20.6%) | 0 (0.0%) |
| 6-Person Households | 12 (1.1%) | 0 (0.0%) |
| 7+ Person Households | 70 (6.5%) | 0 (0.0%) |
| Total | 946 (88.1%) | 128 (11.9%) |
Female Fertility in Hanamaulu
Fertility by Age in Hanamaulu
Average fertility rate in Hanamaulu is 30.0 births per 1,000 women. Women in the age bracket of 35 to 50 years have the highest fertility rate with 78.0 births per 1,000 women. Women in the age bracket of 35 to 50 years acount for 100.0% of all women with births.
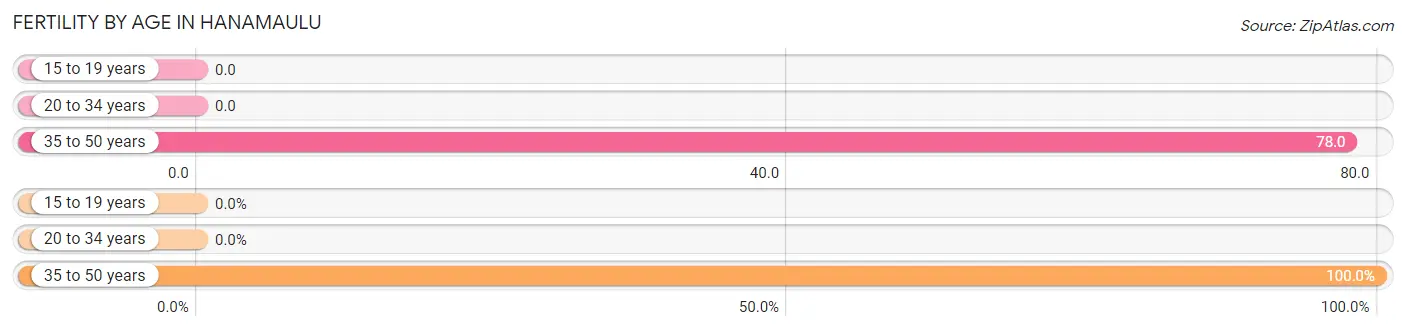
| Age Bracket | Women with Births | Births / 1,000 Women |
| 15 to 19 years | 0 (0.0%) | 0.0 |
| 20 to 34 years | 0 (0.0%) | 0.0 |
| 35 to 50 years | 36 (100.0%) | 78.0 |
| Total | 36 (100.0%) | 30.0 |
Fertility by Age by Marriage Status in Hanamaulu
83.3% of women with births (36) in Hanamaulu are married. The highest percentage of unmarried women with births falls into 35 to 50 years age bracket with 16.7% of them unmarried at the time of birth, while the lowest percentage of unmarried women with births belong to 35 to 50 years age bracket with 16.7% of them unmarried.
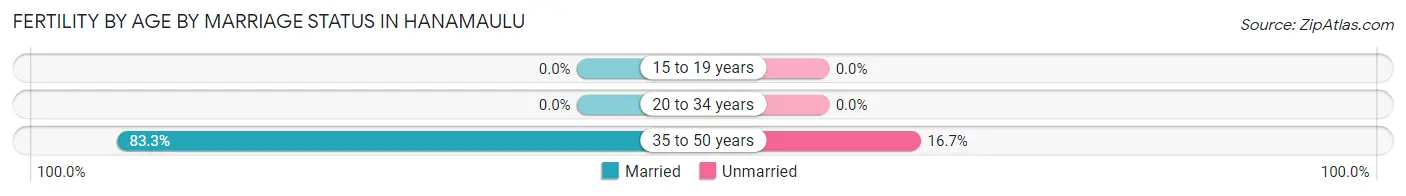
| Age Bracket | Married | Unmarried |
| 15 to 19 years | 0 (0.0%) | 0 (0.0%) |
| 20 to 34 years | 0 (0.0%) | 0 (0.0%) |
| 35 to 50 years | 30 (83.3%) | 6 (16.7%) |
| Total | 30 (83.3%) | 6 (16.7%) |
Fertility by Education in Hanamaulu
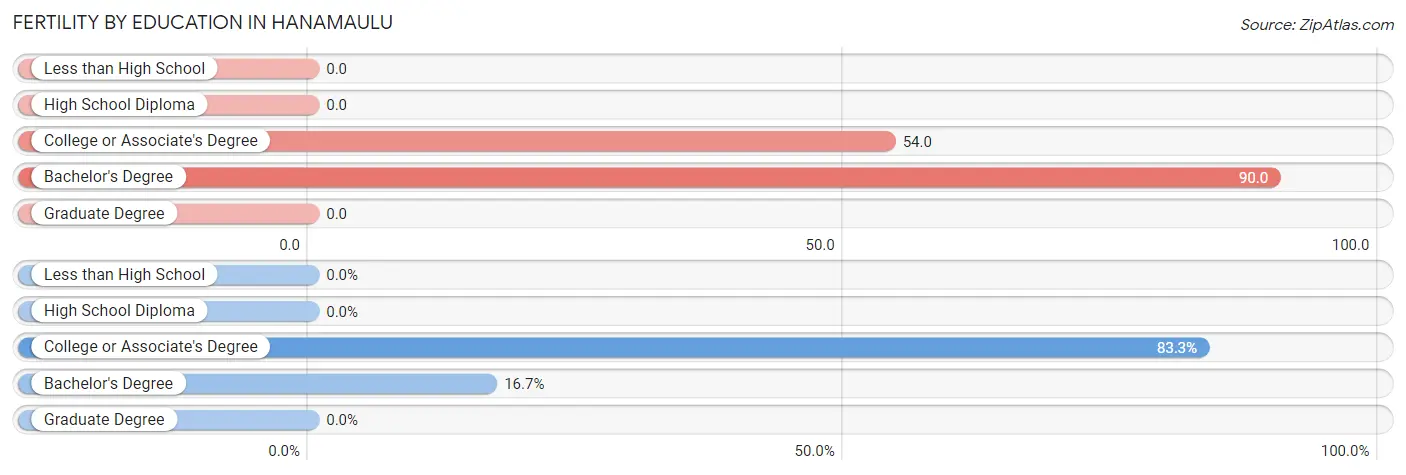
| Educational Attainment | Women with Births | Births / 1,000 Women |
| Less than High School | 0 (0.0%) | 0.0 |
| High School Diploma | 0 (0.0%) | 0.0 |
| College or Associate's Degree | 30 (83.3%) | 54.0 |
| Bachelor's Degree | 6 (16.7%) | 90.0 |
| Graduate Degree | 0 (0.0%) | 0.0 |
| Total | 36 (100.0%) | 30.0 |
Fertility by Education by Marriage Status in Hanamaulu
16.7% of women with births in Hanamaulu are unmarried. Women with the educational attainment of college or associate's degree are most likely to be married with 100.0% of them married at childbirth, while women with the educational attainment of bachelor's degree are least likely to be married with 100.0% of them unmarried at childbirth.
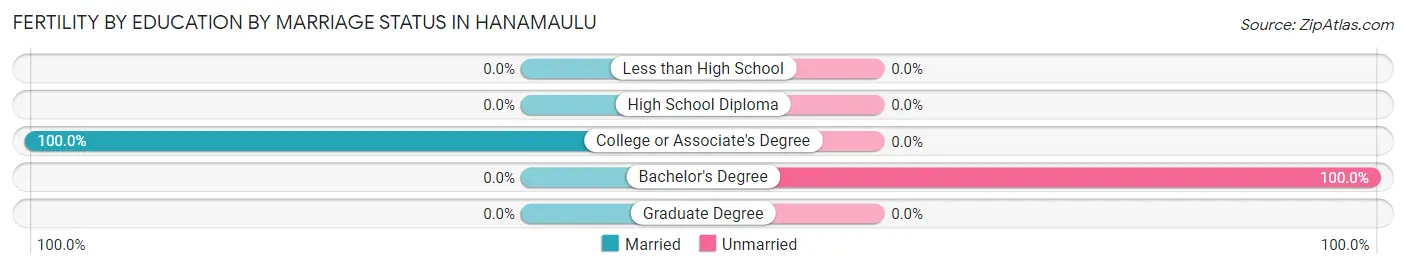
| Educational Attainment | Married | Unmarried |
| Less than High School | 0 (0.0%) | 0 (0.0%) |
| High School Diploma | 0 (0.0%) | 0 (0.0%) |
| College or Associate's Degree | 30 (100.0%) | 0 (0.0%) |
| Bachelor's Degree | 0 (0.0%) | 6 (100.0%) |
| Graduate Degree | 0 (0.0%) | 0 (0.0%) |
| Total | 30 (83.3%) | 6 (16.7%) |
Employment Characteristics in Hanamaulu
Employment by Class of Employer in Hanamaulu
Among the 2,193 employed individuals in Hanamaulu, private company employees (1,433 | 65.3%), local government employees (228 | 10.4%), and federal government employees (167 | 7.6%) make up the most common classes of employment.
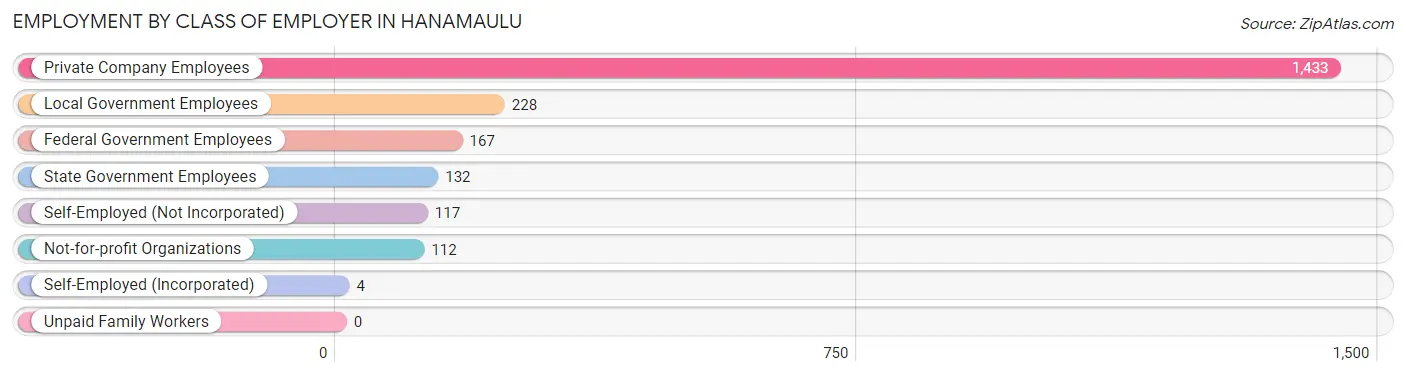
| Employer Class | # Employees | % Employees |
| Private Company Employees | 1,433 | 65.3% |
| Self-Employed (Incorporated) | 4 | 0.2% |
| Self-Employed (Not Incorporated) | 117 | 5.3% |
| Not-for-profit Organizations | 112 | 5.1% |
| Local Government Employees | 228 | 10.4% |
| State Government Employees | 132 | 6.0% |
| Federal Government Employees | 167 | 7.6% |
| Unpaid Family Workers | 0 | 0.0% |
| Total | 2,193 | 100.0% |
Employment Status by Age in Hanamaulu
According to the labor force statistics for Hanamaulu, out of the total population over 16 years of age (3,723), 67.3% or 2,506 individuals are in the labor force, with 6.6% or 165 of them unemployed. The age group with the highest labor force participation rate is 55 to 59 years, with 100.0% or 306 individuals in the labor force. Within the labor force, the 16 to 19 years age range has the highest percentage of unemployed individuals, with 17.1% or 6 of them being unemployed.
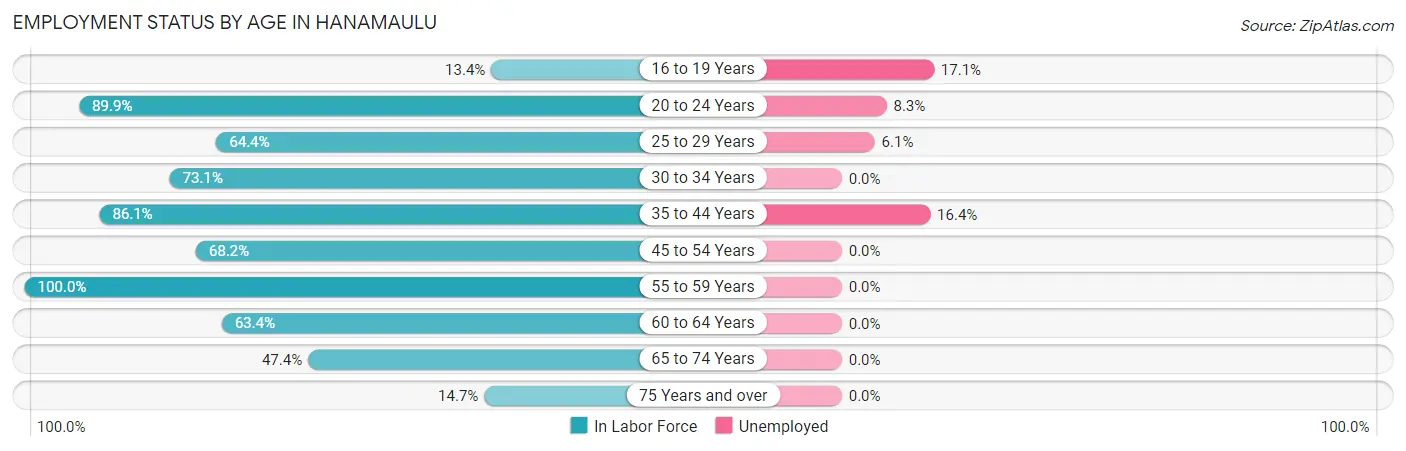
| Age Bracket | In Labor Force | Unemployed |
| 16 to 19 Years | 35 (13.4%) | 6 (17.1%) |
| 20 to 24 Years | 392 (89.9%) | 33 (8.3%) |
| 25 to 29 Years | 261 (64.4%) | 16 (6.1%) |
| 30 to 34 Years | 204 (73.1%) | 0 (0.0%) |
| 35 to 44 Years | 675 (86.1%) | 111 (16.4%) |
| 45 to 54 Years | 364 (68.2%) | 0 (0.0%) |
| 55 to 59 Years | 306 (100.0%) | 0 (0.0%) |
| 60 to 64 Years | 64 (63.4%) | 0 (0.0%) |
| 65 to 74 Years | 166 (47.4%) | 0 (0.0%) |
| 75 Years and over | 39 (14.7%) | 0 (0.0%) |
| Total | 2,506 (67.3%) | 165 (6.6%) |
Employment Status by Educational Attainment in Hanamaulu
According to labor force statistics for Hanamaulu, 77.8% of individuals (1,874) out of the total population between 25 and 64 years of age (2,409) are in the labor force, with 6.8% or 127 of them being unemployed. The group with the highest labor force participation rate are those with the educational attainment of bachelor's degree or higher, with 91.4% or 246 individuals in the labor force. Within the labor force, individuals with high school diploma education have the highest percentage of unemployment, with 12.3% or 85 of them being unemployed.
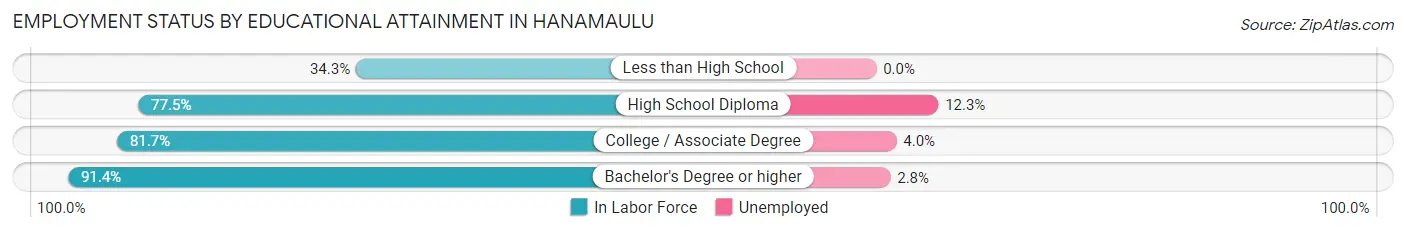
| Educational Attainment | In Labor Force | Unemployed |
| Less than High School | 60 (34.3%) | 0 (0.0%) |
| High School Diploma | 692 (77.5%) | 110 (12.3%) |
| College / Associate Degree | 876 (81.7%) | 43 (4.0%) |
| Bachelor's Degree or higher | 246 (91.4%) | 8 (2.8%) |
| Total | 1,874 (77.8%) | 164 (6.8%) |
Employment Occupations by Sex in Hanamaulu
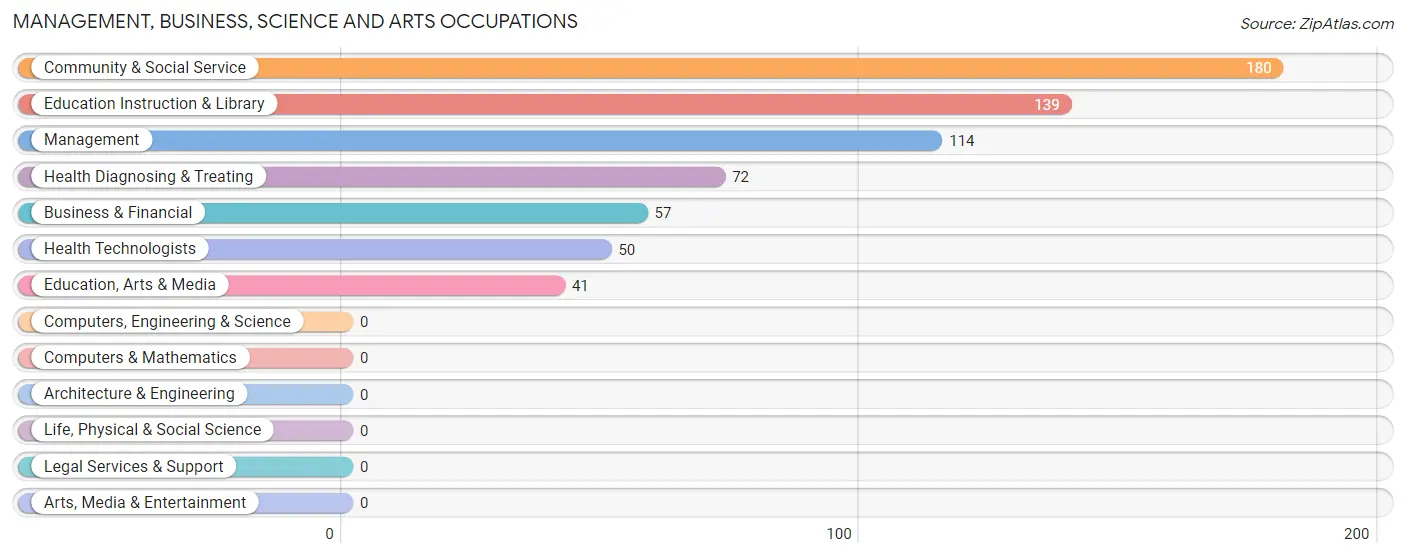
Management, Business, Science and Arts Occupations
The most common Management, Business, Science and Arts occupations in Hanamaulu are Community & Social Service (180 | 7.9%), Education Instruction & Library (139 | 6.1%), Management (114 | 5.0%), Health Diagnosing & Treating (72 | 3.2%), and Business & Financial (57 | 2.5%).
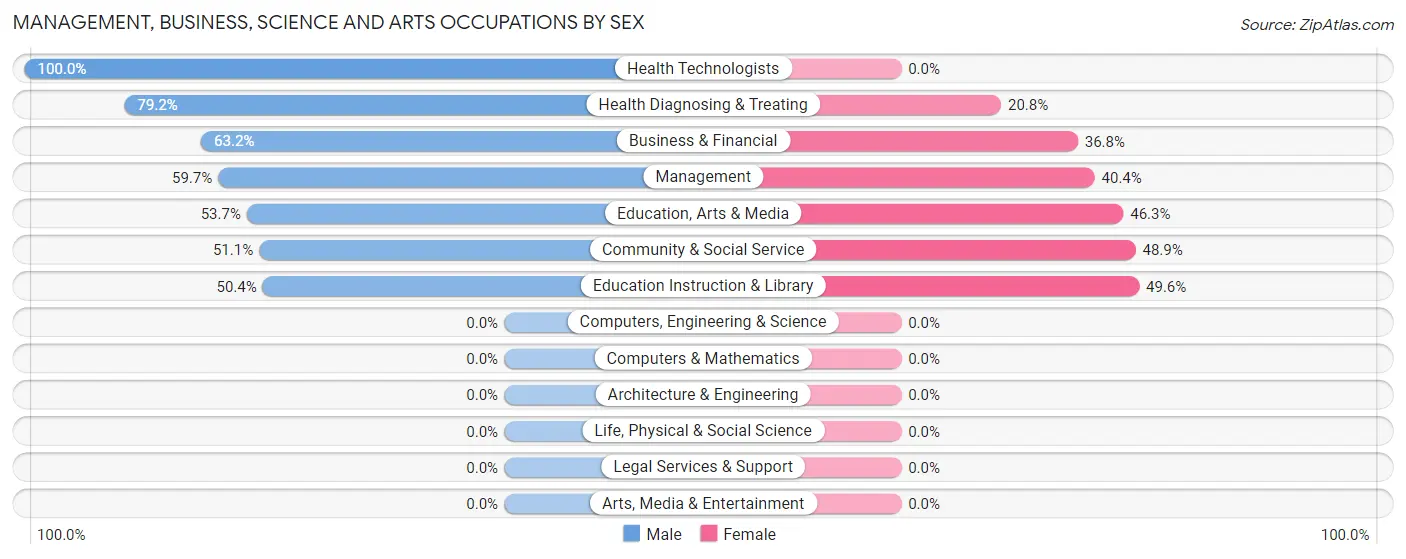
Management, Business, Science and Arts Occupations by Sex
Within the Management, Business, Science and Arts occupations in Hanamaulu, the most male-oriented occupations are Health Technologists (100.0%), Health Diagnosing & Treating (79.2%), and Business & Financial (63.2%), while the most female-oriented occupations are Education Instruction & Library (49.6%), Community & Social Service (48.9%), and Education, Arts & Media (46.3%).
| Occupation | Male | Female |
| Management | 68 (59.7%) | 46 (40.4%) |
| Business & Financial | 36 (63.2%) | 21 (36.8%) |
| Computers, Engineering & Science | 0 (0.0%) | 0 (0.0%) |
| Computers & Mathematics | 0 (0.0%) | 0 (0.0%) |
| Architecture & Engineering | 0 (0.0%) | 0 (0.0%) |
| Life, Physical & Social Science | 0 (0.0%) | 0 (0.0%) |
| Community & Social Service | 92 (51.1%) | 88 (48.9%) |
| Education, Arts & Media | 22 (53.7%) | 19 (46.3%) |
| Legal Services & Support | 0 (0.0%) | 0 (0.0%) |
| Education Instruction & Library | 70 (50.4%) | 69 (49.6%) |
| Arts, Media & Entertainment | 0 (0.0%) | 0 (0.0%) |
| Health Diagnosing & Treating | 57 (79.2%) | 15 (20.8%) |
| Health Technologists | 50 (100.0%) | 0 (0.0%) |
| Total (Category) | 253 (59.8%) | 170 (40.2%) |
| Total (Overall) | 1,196 (52.2%) | 1,093 (47.7%) |
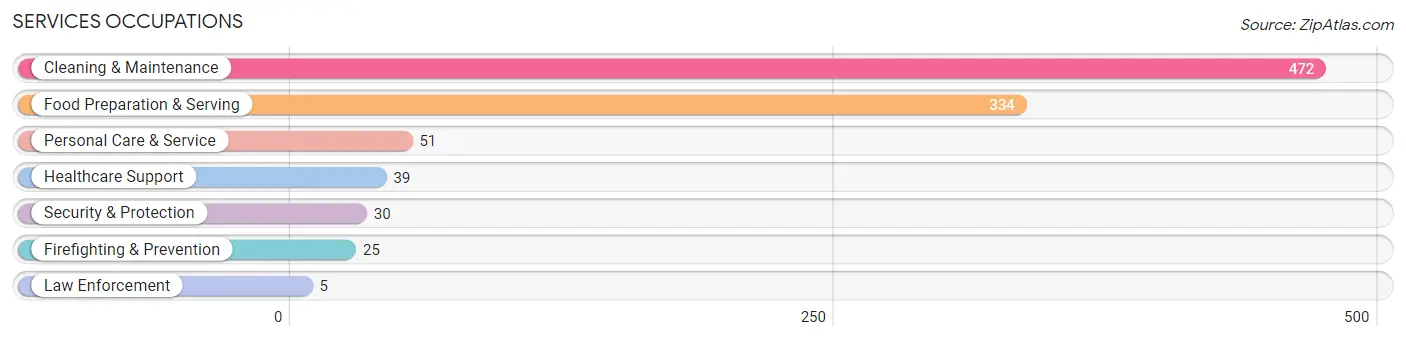
Services Occupations
The most common Services occupations in Hanamaulu are Cleaning & Maintenance (472 | 20.6%), Food Preparation & Serving (334 | 14.6%), Personal Care & Service (51 | 2.2%), Healthcare Support (39 | 1.7%), and Security & Protection (30 | 1.3%).
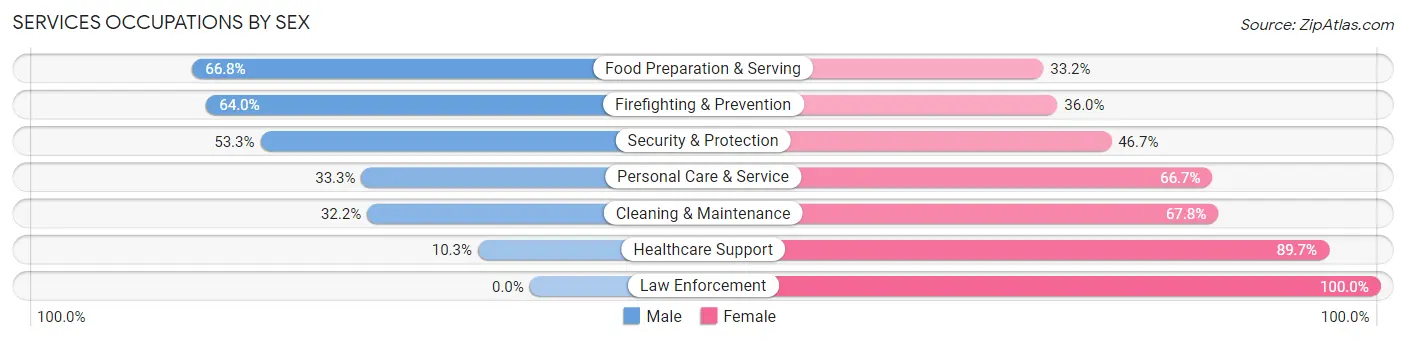
Services Occupations by Sex
Within the Services occupations in Hanamaulu, the most male-oriented occupations are Food Preparation & Serving (66.8%), Firefighting & Prevention (64.0%), and Security & Protection (53.3%), while the most female-oriented occupations are Law Enforcement (100.0%), Healthcare Support (89.7%), and Cleaning & Maintenance (67.8%).
| Occupation | Male | Female |
| Healthcare Support | 4 (10.3%) | 35 (89.7%) |
| Security & Protection | 16 (53.3%) | 14 (46.7%) |
| Firefighting & Prevention | 16 (64.0%) | 9 (36.0%) |
| Law Enforcement | 0 (0.0%) | 5 (100.0%) |
| Food Preparation & Serving | 223 (66.8%) | 111 (33.2%) |
| Cleaning & Maintenance | 152 (32.2%) | 320 (67.8%) |
| Personal Care & Service | 17 (33.3%) | 34 (66.7%) |
| Total (Category) | 412 (44.5%) | 514 (55.5%) |
| Total (Overall) | 1,196 (52.2%) | 1,093 (47.7%) |
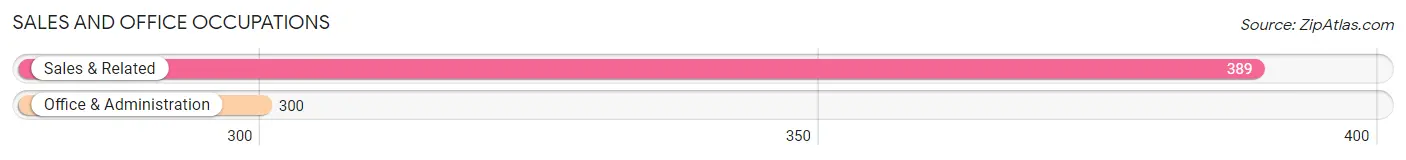
Sales and Office Occupations
The most common Sales and Office occupations in Hanamaulu are Sales & Related (389 | 17.0%), and Office & Administration (300 | 13.1%).
Sales and Office Occupations by Sex
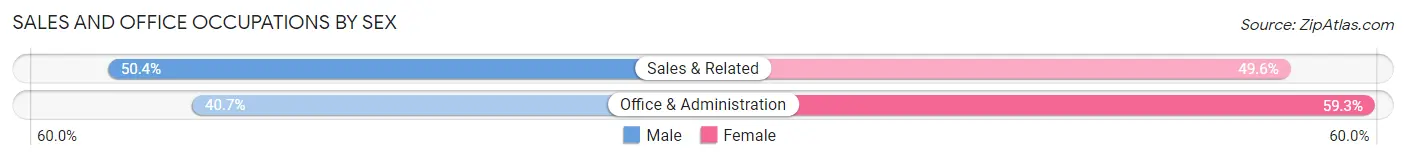
| Occupation | Male | Female |
| Sales & Related | 196 (50.4%) | 193 (49.6%) |
| Office & Administration | 122 (40.7%) | 178 (59.3%) |
| Total (Category) | 318 (46.2%) | 371 (53.8%) |
| Total (Overall) | 1,196 (52.2%) | 1,093 (47.7%) |
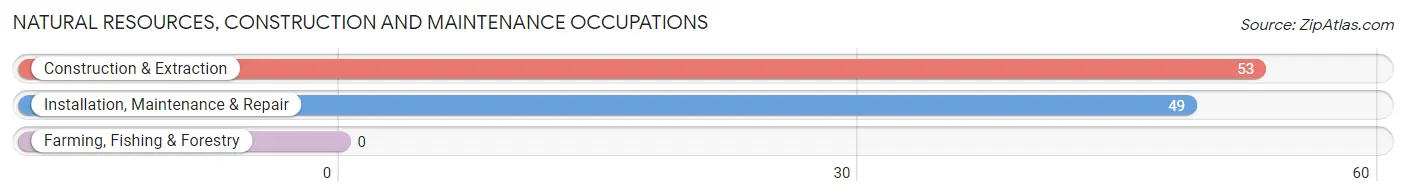
Natural Resources, Construction and Maintenance Occupations
The most common Natural Resources, Construction and Maintenance occupations in Hanamaulu are Construction & Extraction (53 | 2.3%), and Installation, Maintenance & Repair (49 | 2.1%).
Natural Resources, Construction and Maintenance Occupations by Sex
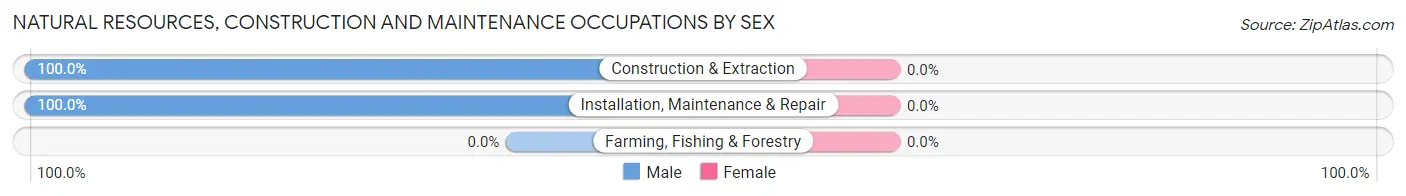
| Occupation | Male | Female |
| Farming, Fishing & Forestry | 0 (0.0%) | 0 (0.0%) |
| Construction & Extraction | 53 (100.0%) | 0 (0.0%) |
| Installation, Maintenance & Repair | 49 (100.0%) | 0 (0.0%) |
| Total (Category) | 102 (100.0%) | 0 (0.0%) |
| Total (Overall) | 1,196 (52.2%) | 1,093 (47.7%) |
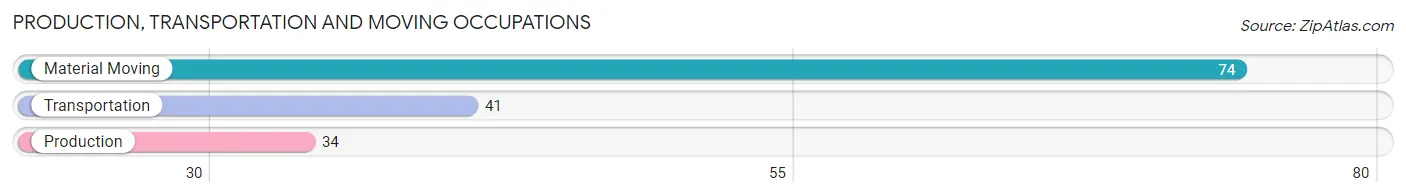
Production, Transportation and Moving Occupations
The most common Production, Transportation and Moving occupations in Hanamaulu are Material Moving (74 | 3.2%), Transportation (41 | 1.8%), and Production (34 | 1.5%).
Production, Transportation and Moving Occupations by Sex
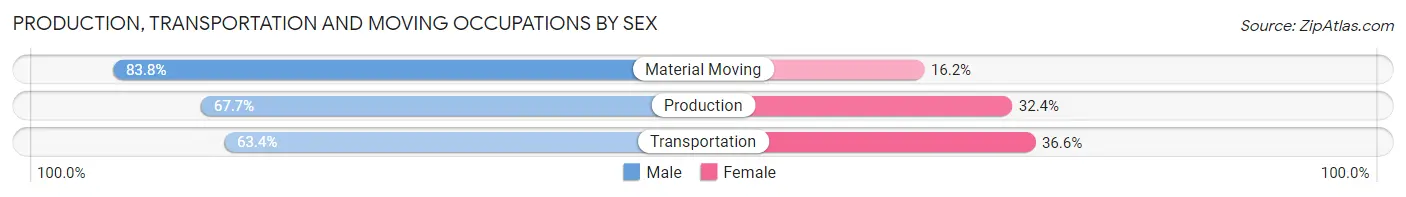
| Occupation | Male | Female |
| Production | 23 (67.6%) | 11 (32.4%) |
| Transportation | 26 (63.4%) | 15 (36.6%) |
| Material Moving | 62 (83.8%) | 12 (16.2%) |
| Total (Category) | 111 (74.5%) | 38 (25.5%) |
| Total (Overall) | 1,196 (52.2%) | 1,093 (47.7%) |
Employment Industries by Sex in Hanamaulu
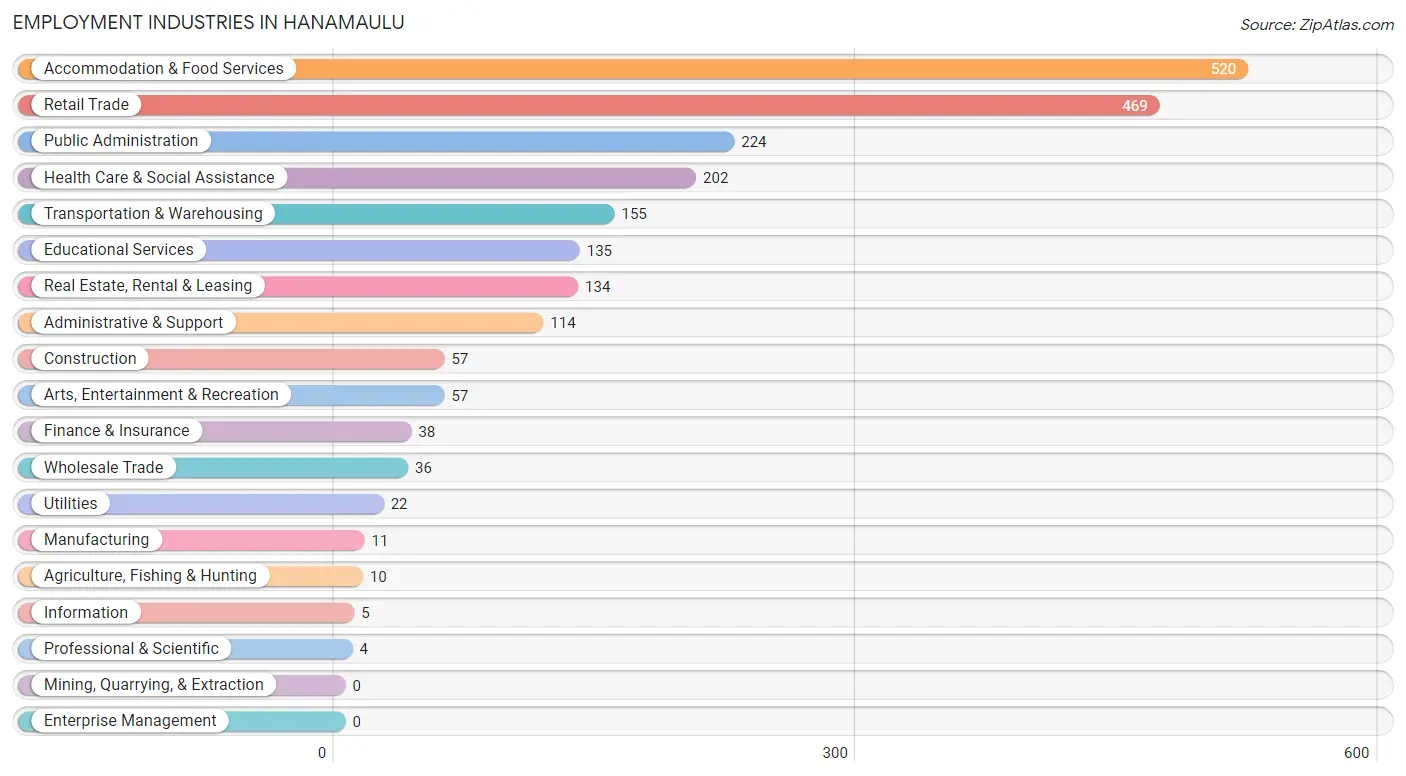
Employment Industries in Hanamaulu
The major employment industries in Hanamaulu include Accommodation & Food Services (520 | 22.7%), Retail Trade (469 | 20.5%), Public Administration (224 | 9.8%), Health Care & Social Assistance (202 | 8.8%), and Transportation & Warehousing (155 | 6.8%).
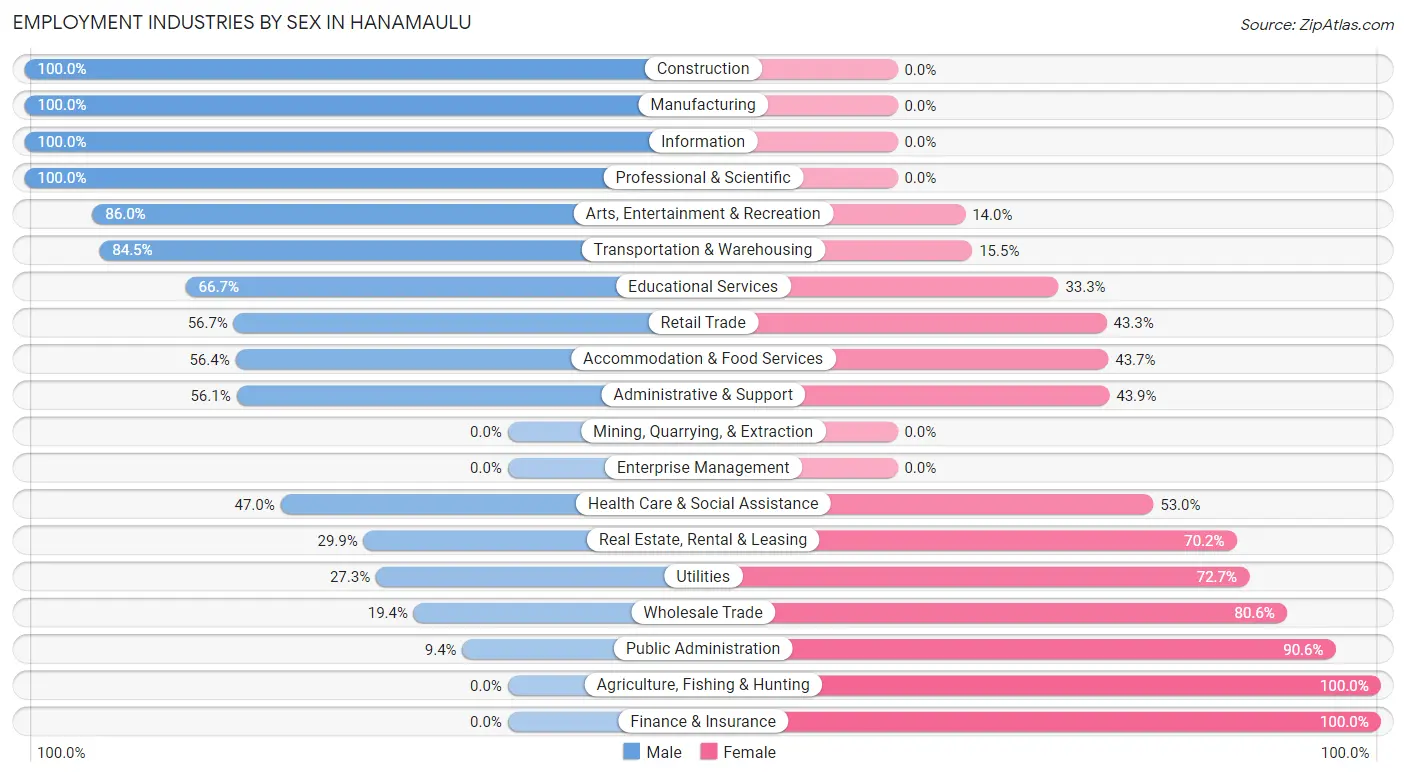
Employment Industries by Sex in Hanamaulu
The Hanamaulu industries that see more men than women are Construction (100.0%), Manufacturing (100.0%), and Information (100.0%), whereas the industries that tend to have a higher number of women are Agriculture, Fishing & Hunting (100.0%), Finance & Insurance (100.0%), and Public Administration (90.6%).
| Industry | Male | Female |
| Agriculture, Fishing & Hunting | 0 (0.0%) | 10 (100.0%) |
| Mining, Quarrying, & Extraction | 0 (0.0%) | 0 (0.0%) |
| Construction | 57 (100.0%) | 0 (0.0%) |
| Manufacturing | 11 (100.0%) | 0 (0.0%) |
| Wholesale Trade | 7 (19.4%) | 29 (80.6%) |
| Retail Trade | 266 (56.7%) | 203 (43.3%) |
| Transportation & Warehousing | 131 (84.5%) | 24 (15.5%) |
| Utilities | 6 (27.3%) | 16 (72.7%) |
| Information | 5 (100.0%) | 0 (0.0%) |
| Finance & Insurance | 0 (0.0%) | 38 (100.0%) |
| Real Estate, Rental & Leasing | 40 (29.8%) | 94 (70.2%) |
| Professional & Scientific | 4 (100.0%) | 0 (0.0%) |
| Enterprise Management | 0 (0.0%) | 0 (0.0%) |
| Administrative & Support | 64 (56.1%) | 50 (43.9%) |
| Educational Services | 90 (66.7%) | 45 (33.3%) |
| Health Care & Social Assistance | 95 (47.0%) | 107 (53.0%) |
| Arts, Entertainment & Recreation | 49 (86.0%) | 8 (14.0%) |
| Accommodation & Food Services | 293 (56.4%) | 227 (43.6%) |
| Public Administration | 21 (9.4%) | 203 (90.6%) |
| Total | 1,196 (52.2%) | 1,093 (47.7%) |
Education in Hanamaulu
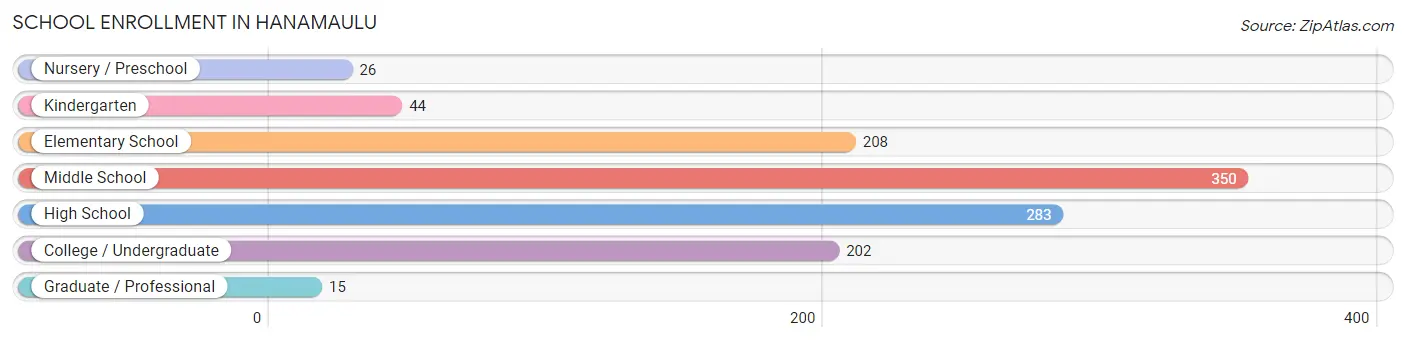
School Enrollment in Hanamaulu
The most common levels of schooling among the 1,128 students in Hanamaulu are middle school (350 | 31.0%), high school (283 | 25.1%), and elementary school (208 | 18.4%).
| School Level | # Students | % Students |
| Nursery / Preschool | 26 | 2.3% |
| Kindergarten | 44 | 3.9% |
| Elementary School | 208 | 18.4% |
| Middle School | 350 | 31.0% |
| High School | 283 | 25.1% |
| College / Undergraduate | 202 | 17.9% |
| Graduate / Professional | 15 | 1.3% |
| Total | 1,128 | 100.0% |
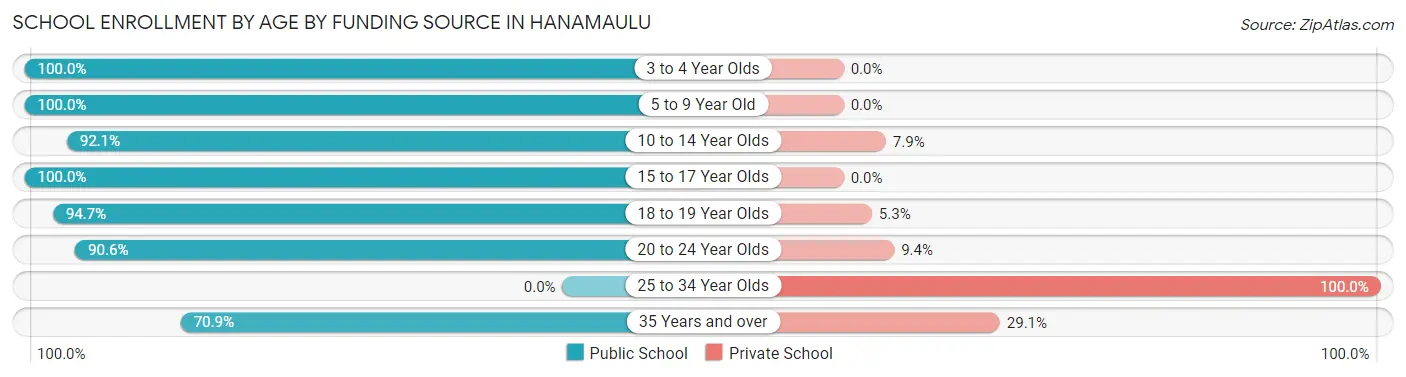
School Enrollment by Age by Funding Source in Hanamaulu
Out of a total of 1,128 students who are enrolled in schools in Hanamaulu, 97 (8.6%) attend a private institution, while the remaining 1,031 (91.4%) are enrolled in public schools. The age group of 25 to 34 year olds has the highest likelihood of being enrolled in private schools, with 32 (100.0% in the age bracket) enrolled. Conversely, the age group of 3 to 4 year olds has the lowest likelihood of being enrolled in a private school, with 26 (100.0% in the age bracket) attending a public institution.
| Age Bracket | Public School | Private School |
| 3 to 4 Year Olds | 26 (100.0%) | 0 (0.0%) |
| 5 to 9 Year Old | 252 (100.0%) | 0 (0.0%) |
| 10 to 14 Year Olds | 351 (92.1%) | 30 (7.9%) |
| 15 to 17 Year Olds | 130 (100.0%) | 0 (0.0%) |
| 18 to 19 Year Olds | 108 (94.7%) | 6 (5.3%) |
| 20 to 24 Year Olds | 125 (90.6%) | 13 (9.4%) |
| 25 to 34 Year Olds | 0 (0.0%) | 32 (100.0%) |
| 35 Years and over | 39 (70.9%) | 16 (29.1%) |
| Total | 1,031 (91.4%) | 97 (8.6%) |
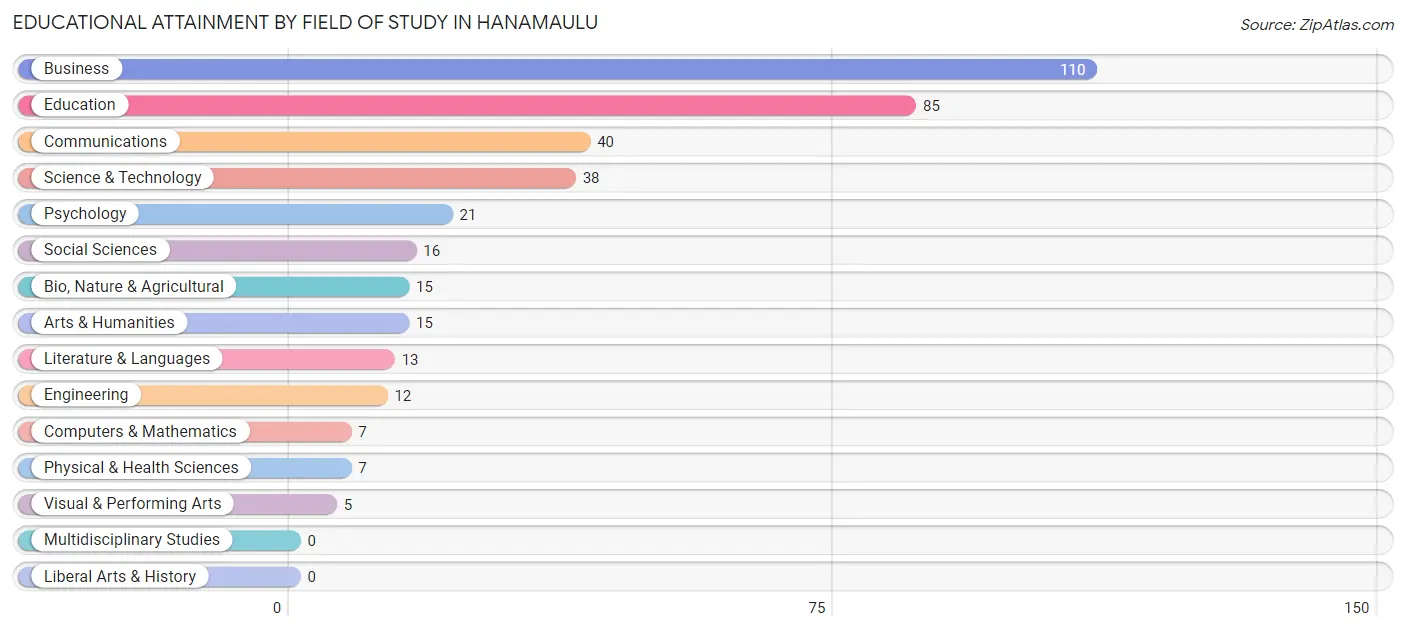
Educational Attainment by Field of Study in Hanamaulu
Business (110 | 28.6%), education (85 | 22.1%), communications (40 | 10.4%), science & technology (38 | 9.9%), and psychology (21 | 5.5%) are the most common fields of study among 384 individuals in Hanamaulu who have obtained a bachelor's degree or higher.
| Field of Study | # Graduates | % Graduates |
| Computers & Mathematics | 7 | 1.8% |
| Bio, Nature & Agricultural | 15 | 3.9% |
| Physical & Health Sciences | 7 | 1.8% |
| Psychology | 21 | 5.5% |
| Social Sciences | 16 | 4.2% |
| Engineering | 12 | 3.1% |
| Multidisciplinary Studies | 0 | 0.0% |
| Science & Technology | 38 | 9.9% |
| Business | 110 | 28.6% |
| Education | 85 | 22.1% |
| Literature & Languages | 13 | 3.4% |
| Liberal Arts & History | 0 | 0.0% |
| Visual & Performing Arts | 5 | 1.3% |
| Communications | 40 | 10.4% |
| Arts & Humanities | 15 | 3.9% |
| Total | 384 | 100.0% |
Transportation & Commute in Hanamaulu
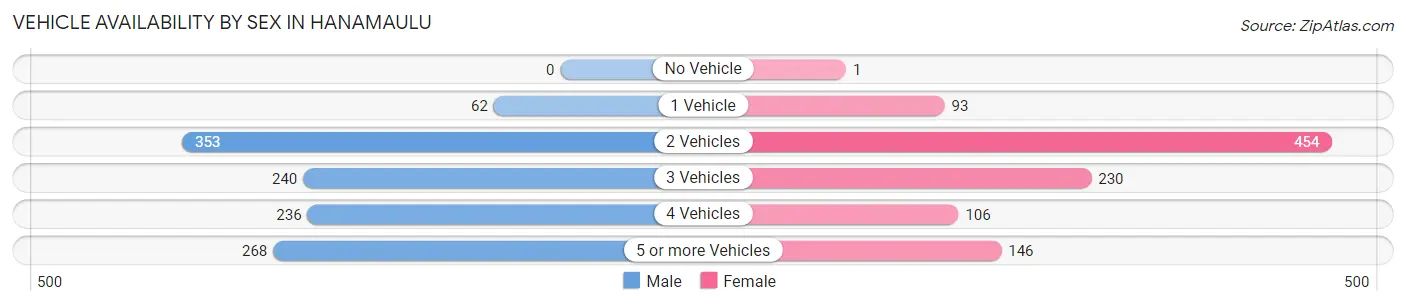
Vehicle Availability by Sex in Hanamaulu
The most prevalent vehicle ownership categories in Hanamaulu are males with 2 vehicles (353, accounting for 30.5%) and females with 2 vehicles (454, making up 34.3%).
| Vehicles Available | Male | Female |
| No Vehicle | 0 (0.0%) | 1 (0.1%) |
| 1 Vehicle | 62 (5.3%) | 93 (9.0%) |
| 2 Vehicles | 353 (30.5%) | 454 (44.1%) |
| 3 Vehicles | 240 (20.7%) | 230 (22.3%) |
| 4 Vehicles | 236 (20.4%) | 106 (10.3%) |
| 5 or more Vehicles | 268 (23.1%) | 146 (14.2%) |
| Total | 1,159 (100.0%) | 1,030 (100.0%) |
Commute Time in Hanamaulu
The most frequently occuring commute durations in Hanamaulu are 10 to 14 minutes (430 commuters, 19.7%), 15 to 19 minutes (429 commuters, 19.6%), and 20 to 24 minutes (397 commuters, 18.1%).
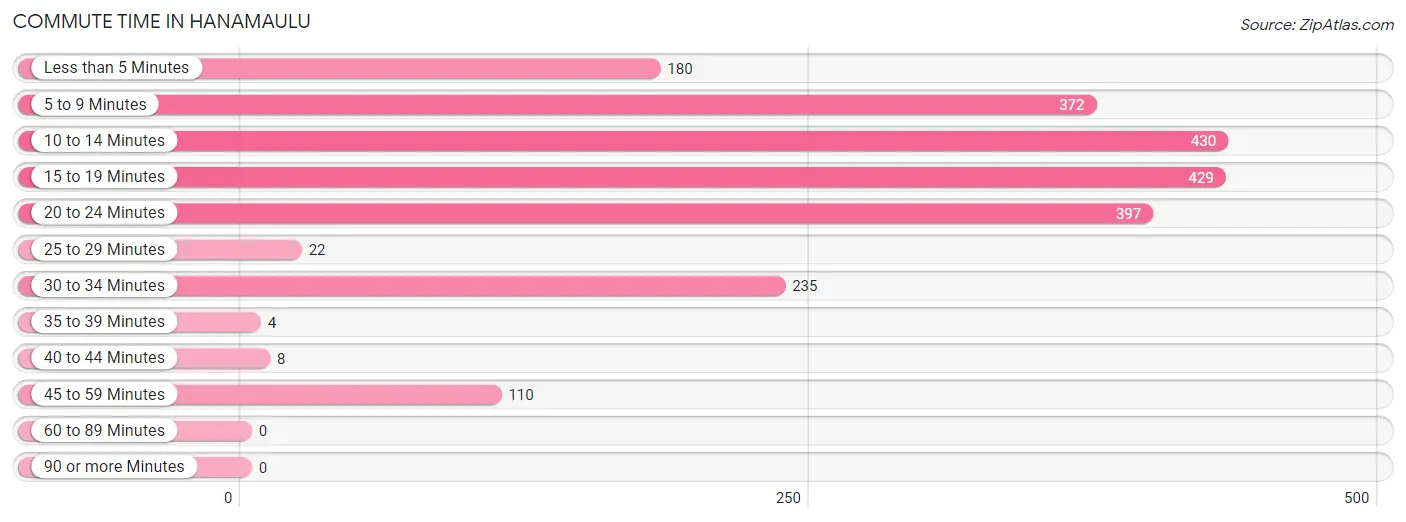
| Commute Time | # Commuters | % Commuters |
| Less than 5 Minutes | 180 | 8.2% |
| 5 to 9 Minutes | 372 | 17.0% |
| 10 to 14 Minutes | 430 | 19.7% |
| 15 to 19 Minutes | 429 | 19.6% |
| 20 to 24 Minutes | 397 | 18.1% |
| 25 to 29 Minutes | 22 | 1.0% |
| 30 to 34 Minutes | 235 | 10.7% |
| 35 to 39 Minutes | 4 | 0.2% |
| 40 to 44 Minutes | 8 | 0.4% |
| 45 to 59 Minutes | 110 | 5.0% |
| 60 to 89 Minutes | 0 | 0.0% |
| 90 or more Minutes | 0 | 0.0% |
Commute Time by Sex in Hanamaulu
The most common commute times in Hanamaulu are 20 to 24 minutes (307 commuters, 26.5%) for males and 15 to 19 minutes (295 commuters, 28.7%) for females.
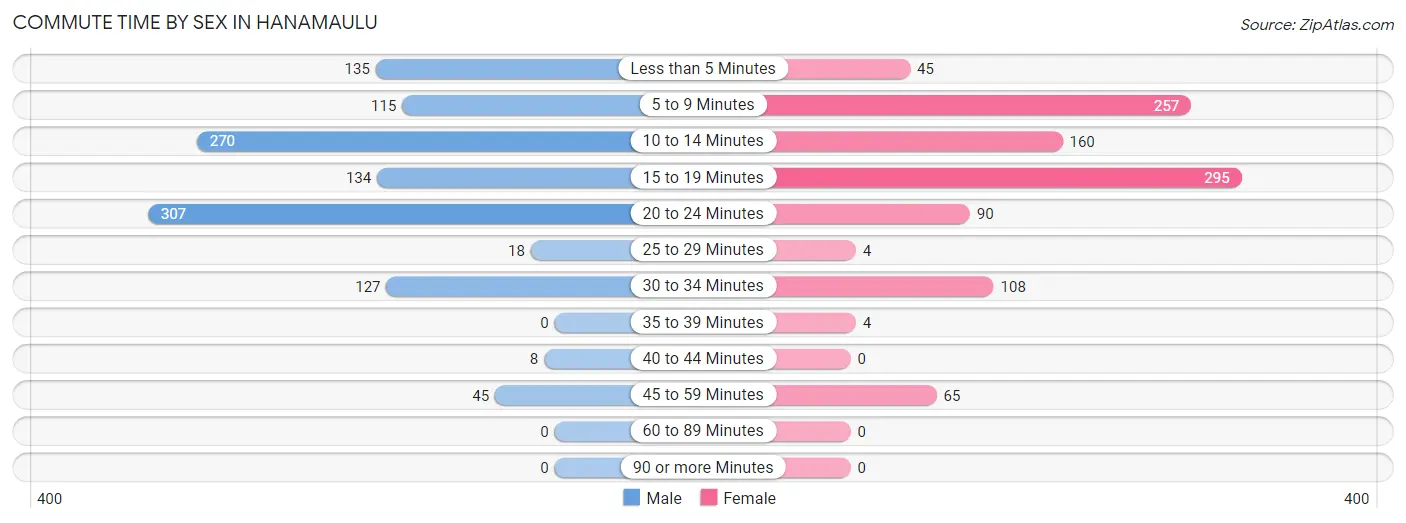
| Commute Time | Male | Female |
| Less than 5 Minutes | 135 (11.7%) | 45 (4.4%) |
| 5 to 9 Minutes | 115 (9.9%) | 257 (25.0%) |
| 10 to 14 Minutes | 270 (23.3%) | 160 (15.6%) |
| 15 to 19 Minutes | 134 (11.6%) | 295 (28.7%) |
| 20 to 24 Minutes | 307 (26.5%) | 90 (8.7%) |
| 25 to 29 Minutes | 18 (1.5%) | 4 (0.4%) |
| 30 to 34 Minutes | 127 (11.0%) | 108 (10.5%) |
| 35 to 39 Minutes | 0 (0.0%) | 4 (0.4%) |
| 40 to 44 Minutes | 8 (0.7%) | 0 (0.0%) |
| 45 to 59 Minutes | 45 (3.9%) | 65 (6.3%) |
| 60 to 89 Minutes | 0 (0.0%) | 0 (0.0%) |
| 90 or more Minutes | 0 (0.0%) | 0 (0.0%) |
Time of Departure to Work by Sex in Hanamaulu
The most frequent times of departure to work in Hanamaulu are 7:30 AM to 7:59 AM (216, 18.6%) for males and 7:00 AM to 7:29 AM (236, 23.0%) for females.
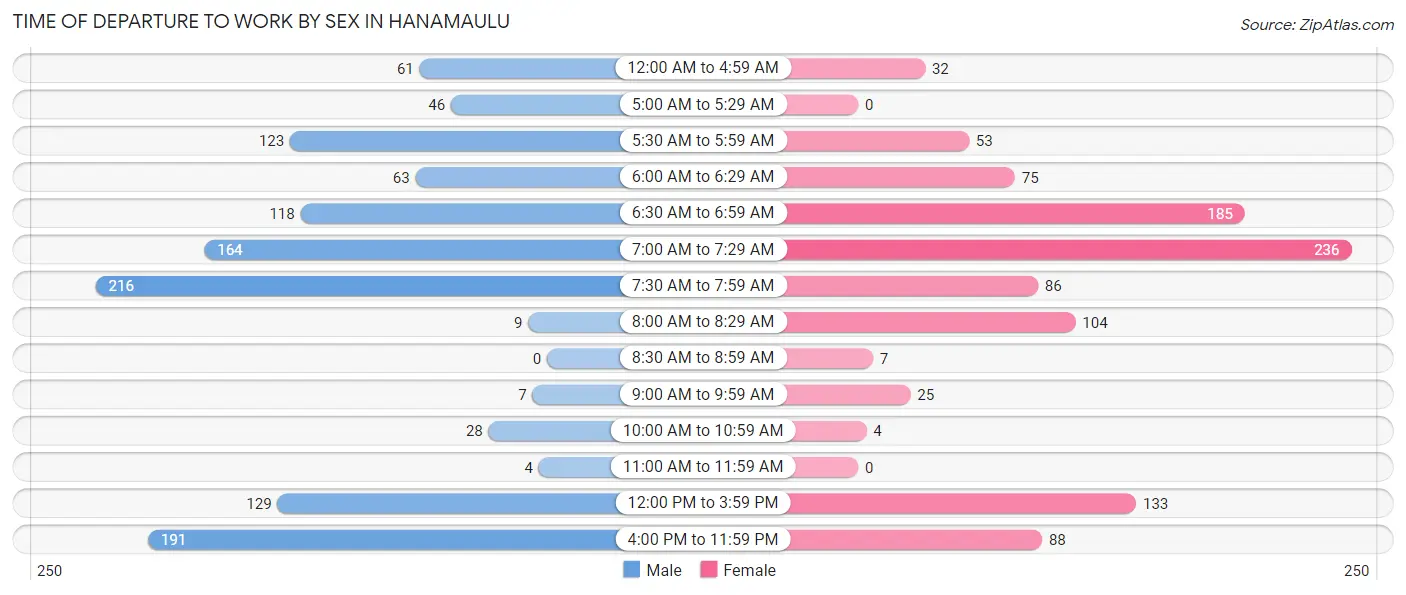
| Time of Departure | Male | Female |
| 12:00 AM to 4:59 AM | 61 (5.3%) | 32 (3.1%) |
| 5:00 AM to 5:29 AM | 46 (4.0%) | 0 (0.0%) |
| 5:30 AM to 5:59 AM | 123 (10.6%) | 53 (5.2%) |
| 6:00 AM to 6:29 AM | 63 (5.4%) | 75 (7.3%) |
| 6:30 AM to 6:59 AM | 118 (10.2%) | 185 (18.0%) |
| 7:00 AM to 7:29 AM | 164 (14.1%) | 236 (23.0%) |
| 7:30 AM to 7:59 AM | 216 (18.6%) | 86 (8.4%) |
| 8:00 AM to 8:29 AM | 9 (0.8%) | 104 (10.1%) |
| 8:30 AM to 8:59 AM | 0 (0.0%) | 7 (0.7%) |
| 9:00 AM to 9:59 AM | 7 (0.6%) | 25 (2.4%) |
| 10:00 AM to 10:59 AM | 28 (2.4%) | 4 (0.4%) |
| 11:00 AM to 11:59 AM | 4 (0.4%) | 0 (0.0%) |
| 12:00 PM to 3:59 PM | 129 (11.1%) | 133 (12.9%) |
| 4:00 PM to 11:59 PM | 191 (16.5%) | 88 (8.6%) |
| Total | 1,159 (100.0%) | 1,028 (100.0%) |
Housing Occupancy in Hanamaulu
Occupancy by Ownership in Hanamaulu
Of the total 1,074 dwellings in Hanamaulu, owner-occupied units account for 567 (52.8%), while renter-occupied units make up 507 (47.2%).
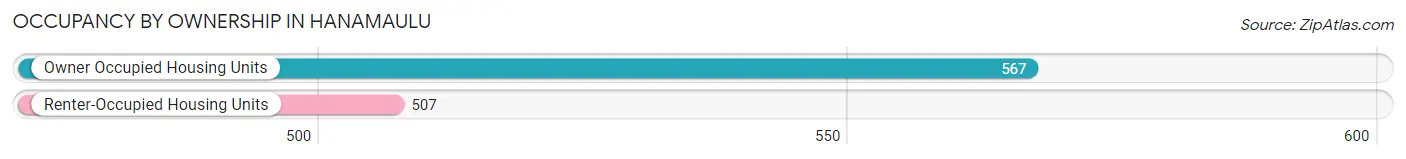
| Occupancy | # Housing Units | % Housing Units |
| Owner Occupied Housing Units | 567 | 52.8% |
| Renter-Occupied Housing Units | 507 | 47.2% |
| Total Occupied Housing Units | 1,074 | 100.0% |
Occupancy by Household Size in Hanamaulu
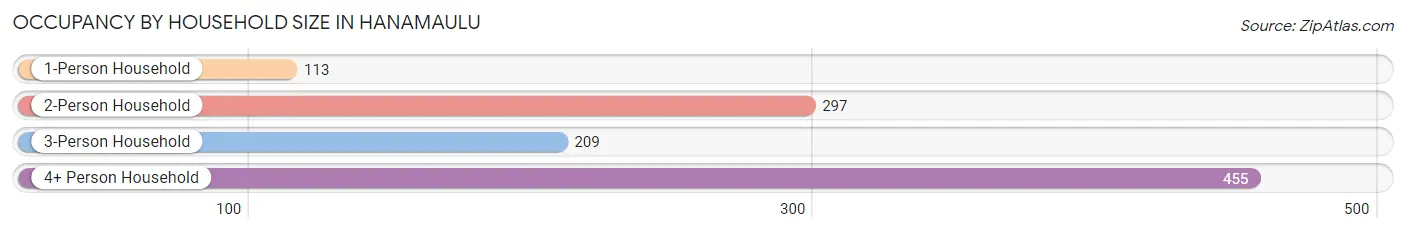
| Household Size | # Housing Units | % Housing Units |
| 1-Person Household | 113 | 10.5% |
| 2-Person Household | 297 | 27.7% |
| 3-Person Household | 209 | 19.5% |
| 4+ Person Household | 455 | 42.4% |
| Total Housing Units | 1,074 | 100.0% |
Occupancy by Ownership by Household Size in Hanamaulu
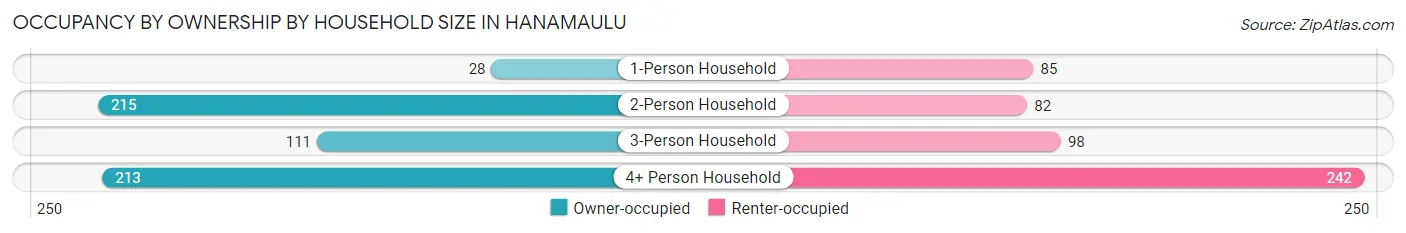
| Household Size | Owner-occupied | Renter-occupied |
| 1-Person Household | 28 (24.8%) | 85 (75.2%) |
| 2-Person Household | 215 (72.4%) | 82 (27.6%) |
| 3-Person Household | 111 (53.1%) | 98 (46.9%) |
| 4+ Person Household | 213 (46.8%) | 242 (53.2%) |
| Total Housing Units | 567 (52.8%) | 507 (47.2%) |
Occupancy by Educational Attainment in Hanamaulu
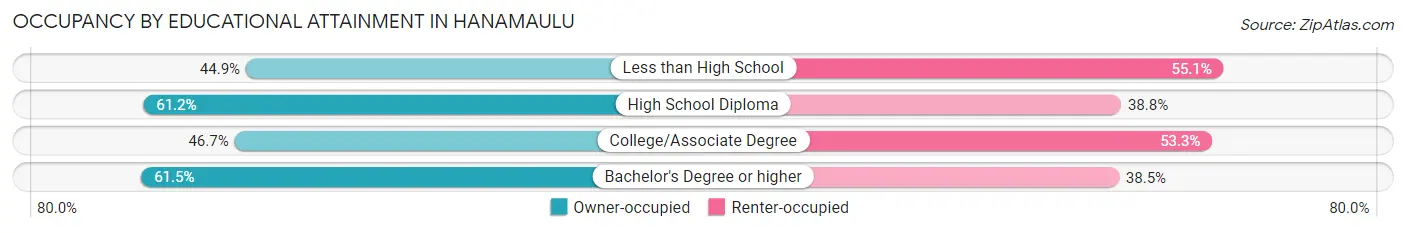
| Household Size | Owner-occupied | Renter-occupied |
| Less than High School | 44 (44.9%) | 54 (55.1%) |
| High School Diploma | 167 (61.2%) | 106 (38.8%) |
| College/Associate Degree | 241 (46.7%) | 275 (53.3%) |
| Bachelor's Degree or higher | 115 (61.5%) | 72 (38.5%) |
Occupancy by Age of Householder in Hanamaulu
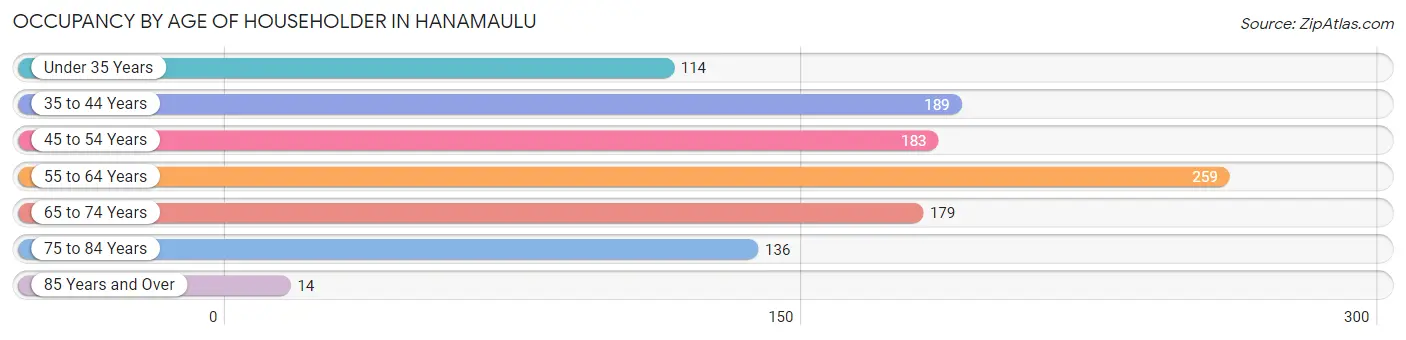
| Age Bracket | # Households | % Households |
| Under 35 Years | 114 | 10.6% |
| 35 to 44 Years | 189 | 17.6% |
| 45 to 54 Years | 183 | 17.0% |
| 55 to 64 Years | 259 | 24.1% |
| 65 to 74 Years | 179 | 16.7% |
| 75 to 84 Years | 136 | 12.7% |
| 85 Years and Over | 14 | 1.3% |
| Total | 1,074 | 100.0% |
Housing Finances in Hanamaulu
Median Income by Occupancy in Hanamaulu
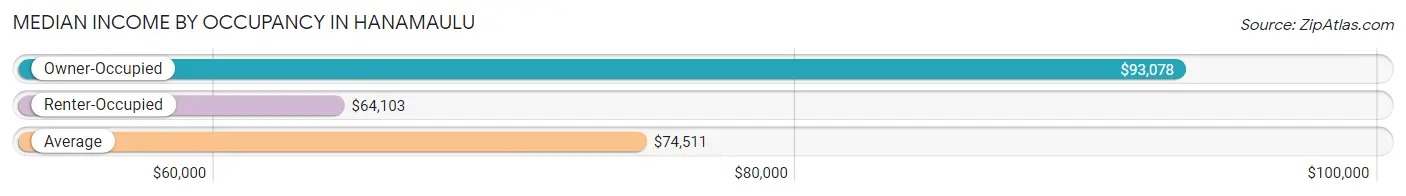
| Occupancy Type | # Households | Median Income |
| Owner-Occupied | 567 (52.8%) | $93,078 |
| Renter-Occupied | 507 (47.2%) | $64,103 |
| Average | 1,074 (100.0%) | $74,511 |
Occupancy by Householder Income Bracket in Hanamaulu
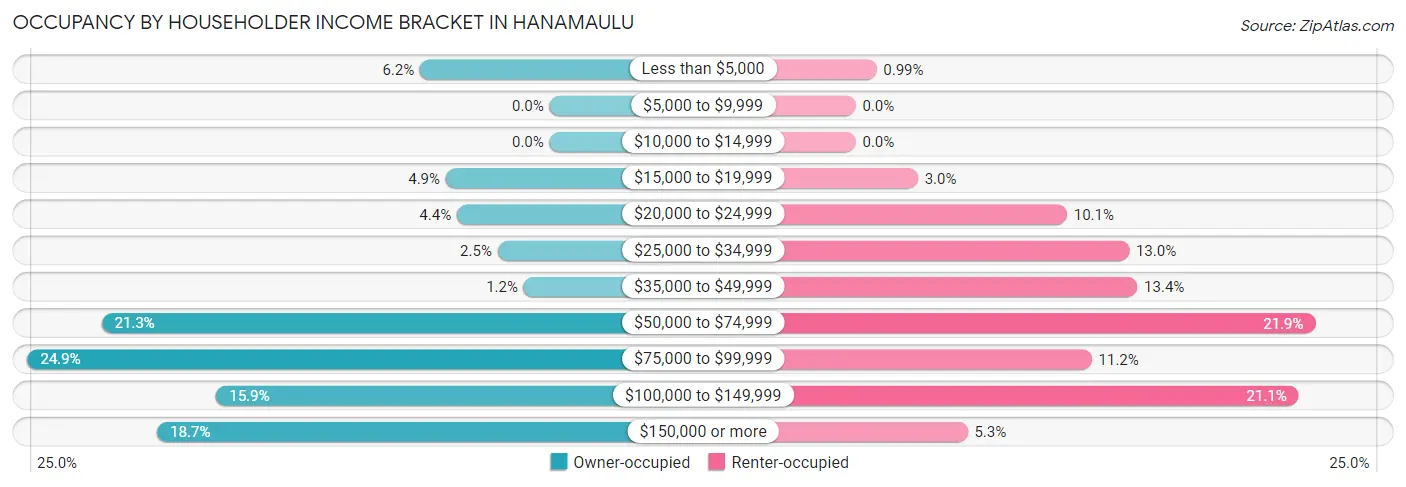
| Income Bracket | Owner-occupied | Renter-occupied |
| Less than $5,000 | 35 (6.2%) | 5 (1.0%) |
| $5,000 to $9,999 | 0 (0.0%) | 0 (0.0%) |
| $10,000 to $14,999 | 0 (0.0%) | 0 (0.0%) |
| $15,000 to $19,999 | 28 (4.9%) | 15 (3.0%) |
| $20,000 to $24,999 | 25 (4.4%) | 51 (10.1%) |
| $25,000 to $34,999 | 14 (2.5%) | 66 (13.0%) |
| $35,000 to $49,999 | 7 (1.2%) | 68 (13.4%) |
| $50,000 to $74,999 | 121 (21.3%) | 111 (21.9%) |
| $75,000 to $99,999 | 141 (24.9%) | 57 (11.2%) |
| $100,000 to $149,999 | 90 (15.9%) | 107 (21.1%) |
| $150,000 or more | 106 (18.7%) | 27 (5.3%) |
| Total | 567 (100.0%) | 507 (100.0%) |
Monthly Housing Cost Tiers in Hanamaulu
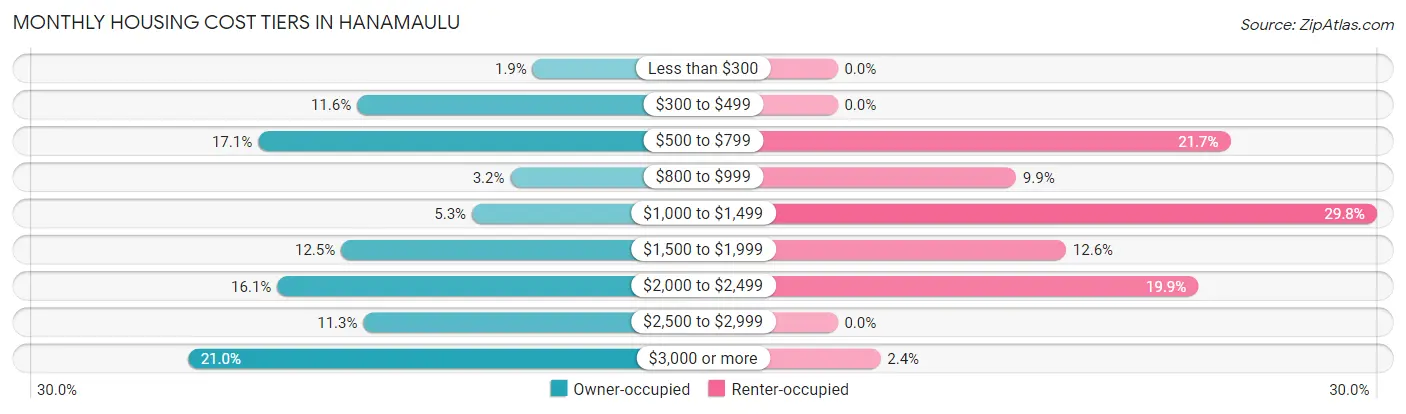
| Monthly Cost | Owner-occupied | Renter-occupied |
| Less than $300 | 11 (1.9%) | 0 (0.0%) |
| $300 to $499 | 66 (11.6%) | 0 (0.0%) |
| $500 to $799 | 97 (17.1%) | 110 (21.7%) |
| $800 to $999 | 18 (3.2%) | 50 (9.9%) |
| $1,000 to $1,499 | 30 (5.3%) | 151 (29.8%) |
| $1,500 to $1,999 | 71 (12.5%) | 64 (12.6%) |
| $2,000 to $2,499 | 91 (16.1%) | 101 (19.9%) |
| $2,500 to $2,999 | 64 (11.3%) | 0 (0.0%) |
| $3,000 or more | 119 (21.0%) | 12 (2.4%) |
| Total | 567 (100.0%) | 507 (100.0%) |
Physical Housing Characteristics in Hanamaulu
Housing Structures in Hanamaulu
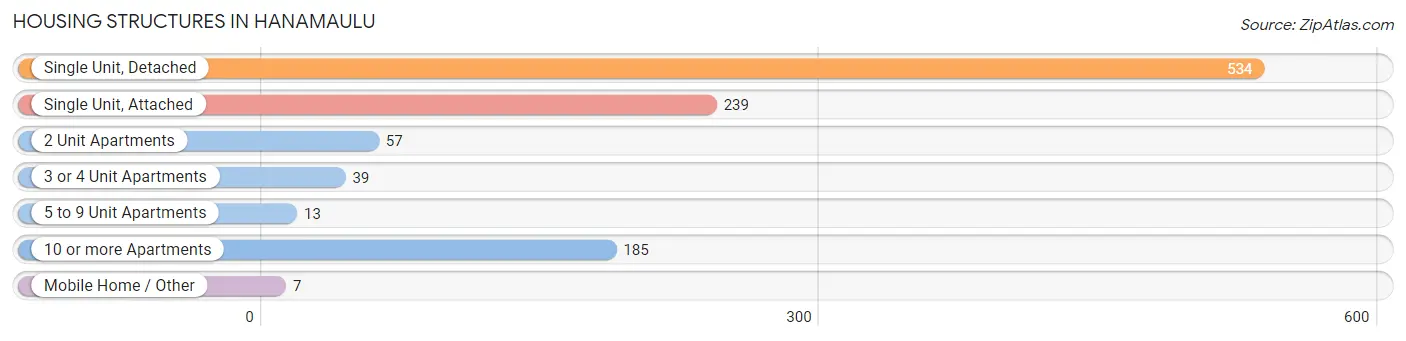
| Structure Type | # Housing Units | % Housing Units |
| Single Unit, Detached | 534 | 49.7% |
| Single Unit, Attached | 239 | 22.3% |
| 2 Unit Apartments | 57 | 5.3% |
| 3 or 4 Unit Apartments | 39 | 3.6% |
| 5 to 9 Unit Apartments | 13 | 1.2% |
| 10 or more Apartments | 185 | 17.2% |
| Mobile Home / Other | 7 | 0.6% |
| Total | 1,074 | 100.0% |
Housing Structures by Occupancy in Hanamaulu
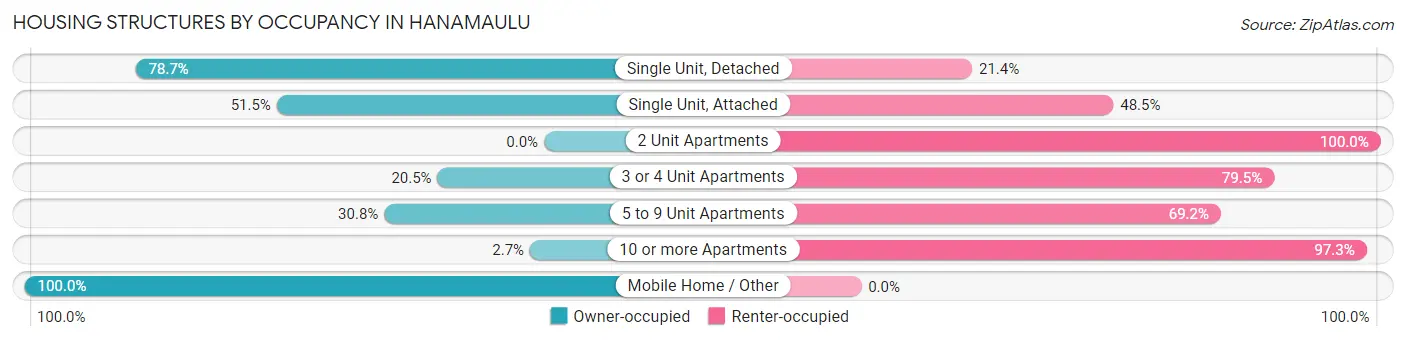
| Structure Type | Owner-occupied | Renter-occupied |
| Single Unit, Detached | 420 (78.6%) | 114 (21.3%) |
| Single Unit, Attached | 123 (51.5%) | 116 (48.5%) |
| 2 Unit Apartments | 0 (0.0%) | 57 (100.0%) |
| 3 or 4 Unit Apartments | 8 (20.5%) | 31 (79.5%) |
| 5 to 9 Unit Apartments | 4 (30.8%) | 9 (69.2%) |
| 10 or more Apartments | 5 (2.7%) | 180 (97.3%) |
| Mobile Home / Other | 7 (100.0%) | 0 (0.0%) |
| Total | 567 (52.8%) | 507 (47.2%) |
Housing Structures by Number of Rooms in Hanamaulu
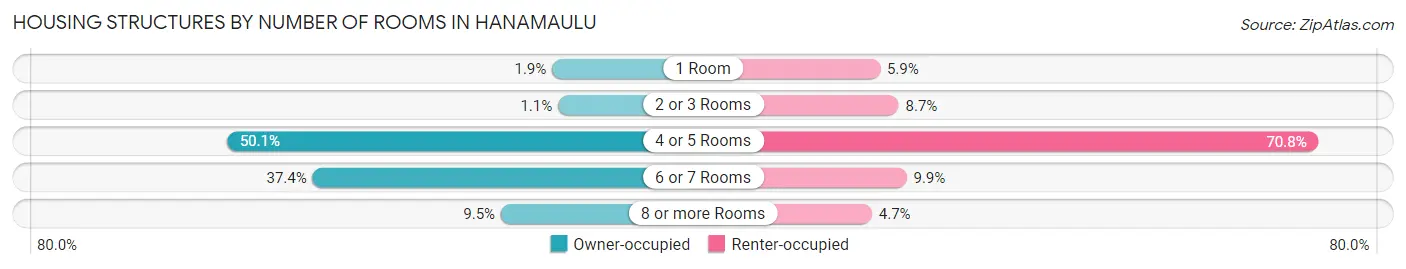
| Number of Rooms | Owner-occupied | Renter-occupied |
| 1 Room | 11 (1.9%) | 30 (5.9%) |
| 2 or 3 Rooms | 6 (1.1%) | 44 (8.7%) |
| 4 or 5 Rooms | 284 (50.1%) | 359 (70.8%) |
| 6 or 7 Rooms | 212 (37.4%) | 50 (9.9%) |
| 8 or more Rooms | 54 (9.5%) | 24 (4.7%) |
| Total | 567 (100.0%) | 507 (100.0%) |
Housing Structure by Heating Type in Hanamaulu
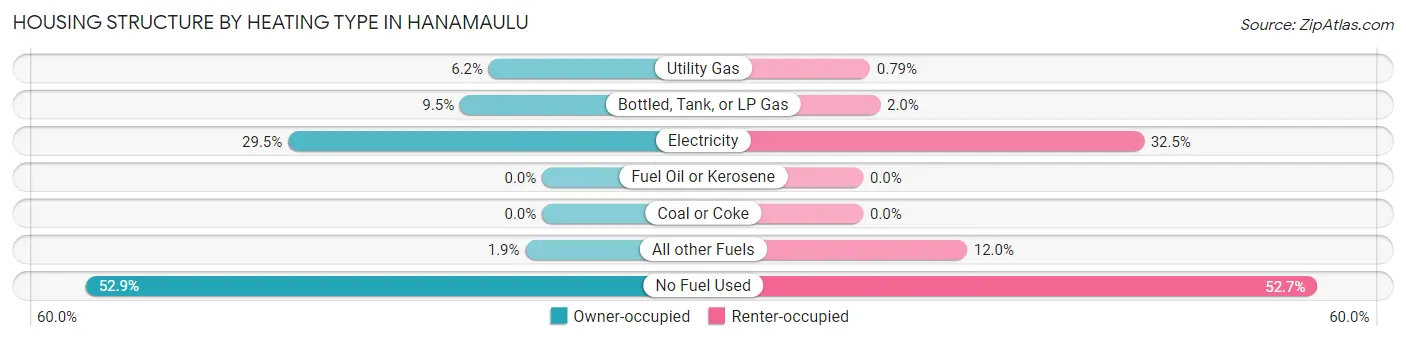
| Heating Type | Owner-occupied | Renter-occupied |
| Utility Gas | 35 (6.2%) | 4 (0.8%) |
| Bottled, Tank, or LP Gas | 54 (9.5%) | 10 (2.0%) |
| Electricity | 167 (29.4%) | 165 (32.5%) |
| Fuel Oil or Kerosene | 0 (0.0%) | 0 (0.0%) |
| Coal or Coke | 0 (0.0%) | 0 (0.0%) |
| All other Fuels | 11 (1.9%) | 61 (12.0%) |
| No Fuel Used | 300 (52.9%) | 267 (52.7%) |
| Total | 567 (100.0%) | 507 (100.0%) |
Household Vehicle Usage in Hanamaulu
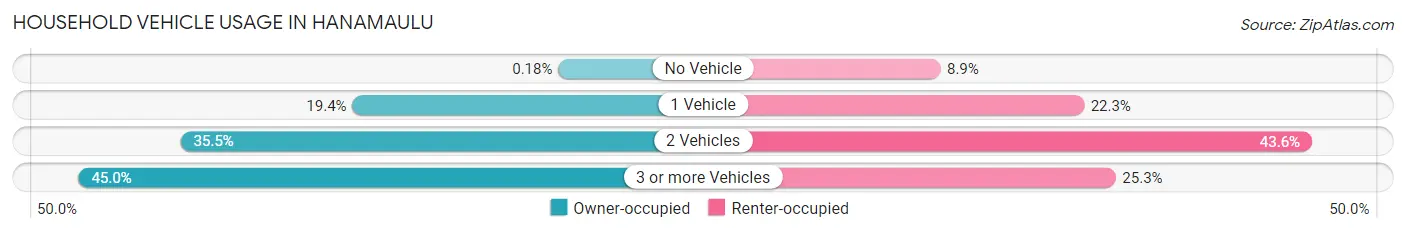
| Vehicles per Household | Owner-occupied | Renter-occupied |
| No Vehicle | 1 (0.2%) | 45 (8.9%) |
| 1 Vehicle | 110 (19.4%) | 113 (22.3%) |
| 2 Vehicles | 201 (35.4%) | 221 (43.6%) |
| 3 or more Vehicles | 255 (45.0%) | 128 (25.3%) |
| Total | 567 (100.0%) | 507 (100.0%) |
Real Estate & Mortgages in Hanamaulu
Real Estate and Mortgage Overview in Hanamaulu
| Characteristic | Without Mortgage | With Mortgage |
| Housing Units | 199 | 368 |
| Median Property Value | $622,900 | $610,400 |
| Median Household Income | $72,277 | $95 |
| Monthly Housing Costs | $541 | $119 |
| Real Estate Taxes | $1,175 | $0 |
Property Value by Mortgage Status in Hanamaulu
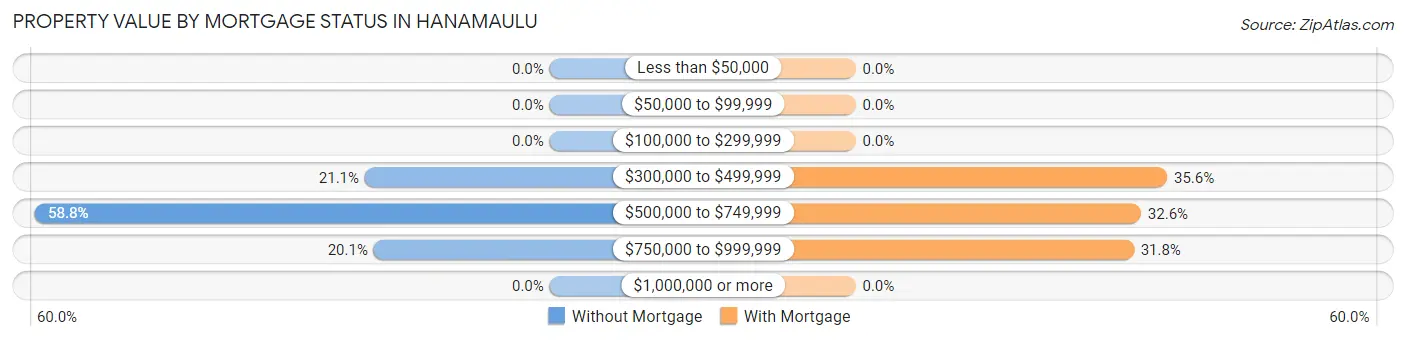
| Property Value | Without Mortgage | With Mortgage |
| Less than $50,000 | 0 (0.0%) | 0 (0.0%) |
| $50,000 to $99,999 | 0 (0.0%) | 0 (0.0%) |
| $100,000 to $299,999 | 0 (0.0%) | 0 (0.0%) |
| $300,000 to $499,999 | 42 (21.1%) | 131 (35.6%) |
| $500,000 to $749,999 | 117 (58.8%) | 120 (32.6%) |
| $750,000 to $999,999 | 40 (20.1%) | 117 (31.8%) |
| $1,000,000 or more | 0 (0.0%) | 0 (0.0%) |
| Total | 199 (100.0%) | 368 (100.0%) |
Household Income by Mortgage Status in Hanamaulu
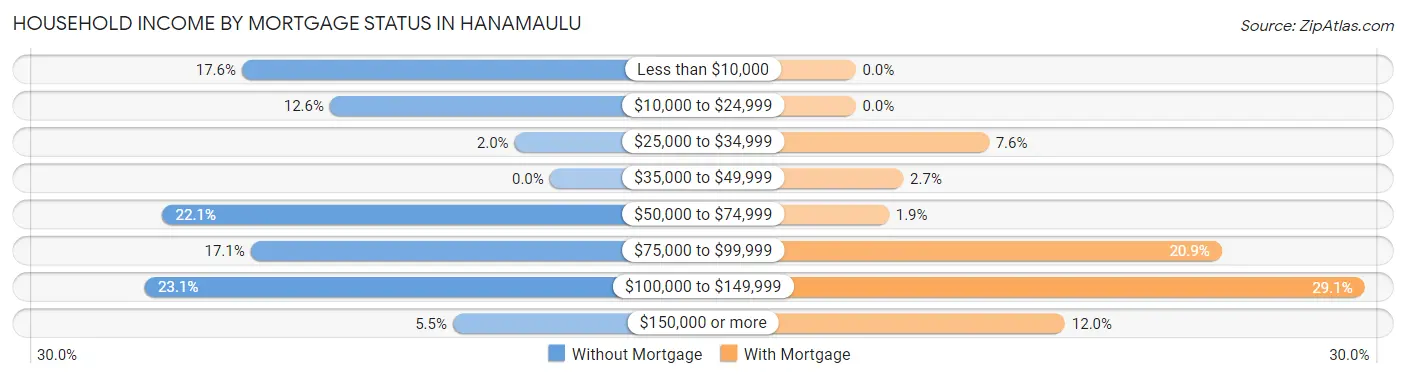
| Household Income | Without Mortgage | With Mortgage |
| Less than $10,000 | 35 (17.6%) | 0 (0.0%) |
| $10,000 to $24,999 | 25 (12.6%) | 0 (0.0%) |
| $25,000 to $34,999 | 4 (2.0%) | 28 (7.6%) |
| $35,000 to $49,999 | 0 (0.0%) | 10 (2.7%) |
| $50,000 to $74,999 | 44 (22.1%) | 7 (1.9%) |
| $75,000 to $99,999 | 34 (17.1%) | 77 (20.9%) |
| $100,000 to $149,999 | 46 (23.1%) | 107 (29.1%) |
| $150,000 or more | 11 (5.5%) | 44 (12.0%) |
| Total | 199 (100.0%) | 368 (100.0%) |
Property Value to Household Income Ratio in Hanamaulu
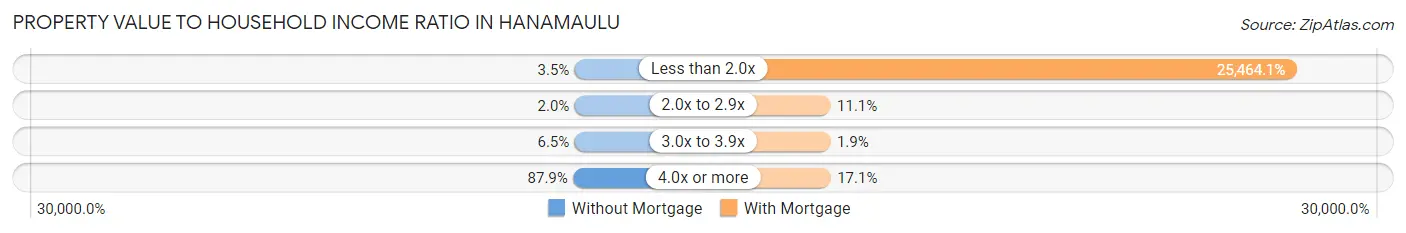
| Value-to-Income Ratio | Without Mortgage | With Mortgage |
| Less than 2.0x | 7 (3.5%) | 93,708 (25,464.1%) |
| 2.0x to 2.9x | 4 (2.0%) | 41 (11.1%) |
| 3.0x to 3.9x | 13 (6.5%) | 7 (1.9%) |
| 4.0x or more | 175 (87.9%) | 63 (17.1%) |
| Total | 199 (100.0%) | 368 (100.0%) |
Real Estate Taxes by Mortgage Status in Hanamaulu
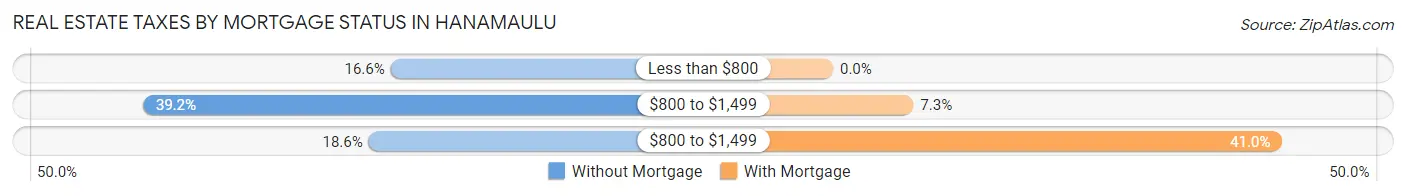
| Property Taxes | Without Mortgage | With Mortgage |
| Less than $800 | 33 (16.6%) | 0 (0.0%) |
| $800 to $1,499 | 78 (39.2%) | 27 (7.3%) |
| $800 to $1,499 | 37 (18.6%) | 151 (41.0%) |
| Total | 199 (100.0%) | 368 (100.0%) |
Health & Disability in Hanamaulu
Health Insurance Coverage by Age in Hanamaulu
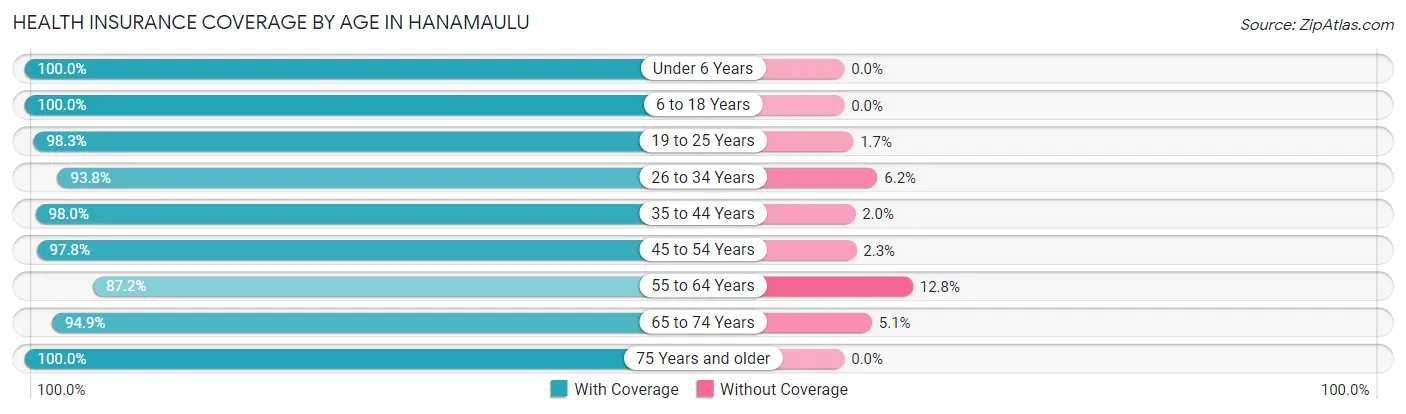
| Age Bracket | With Coverage | Without Coverage |
| Under 6 Years | 224 (100.0%) | 0 (0.0%) |
| 6 to 18 Years | 896 (100.0%) | 0 (0.0%) |
| 19 to 25 Years | 534 (98.3%) | 9 (1.7%) |
| 26 to 34 Years | 533 (93.8%) | 35 (6.2%) |
| 35 to 44 Years | 768 (98.0%) | 16 (2.0%) |
| 45 to 54 Years | 522 (97.8%) | 12 (2.2%) |
| 55 to 64 Years | 355 (87.2%) | 52 (12.8%) |
| 65 to 74 Years | 332 (94.9%) | 18 (5.1%) |
| 75 Years and older | 266 (100.0%) | 0 (0.0%) |
| Total | 4,430 (96.9%) | 142 (3.1%) |
Health Insurance Coverage by Citizenship Status in Hanamaulu
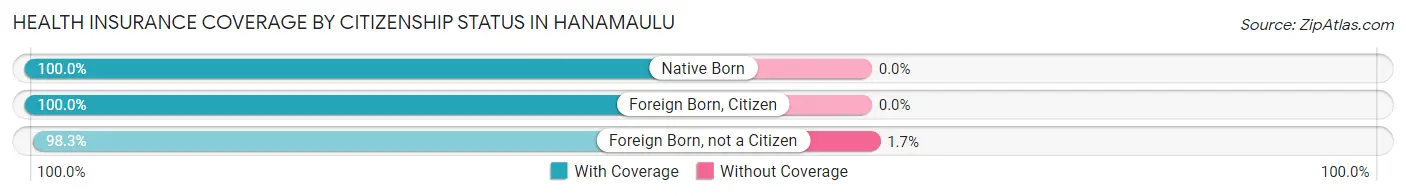
| Citizenship Status | With Coverage | Without Coverage |
| Native Born | 224 (100.0%) | 0 (0.0%) |
| Foreign Born, Citizen | 896 (100.0%) | 0 (0.0%) |
| Foreign Born, not a Citizen | 534 (98.3%) | 9 (1.7%) |
Health Insurance Coverage by Household Income in Hanamaulu
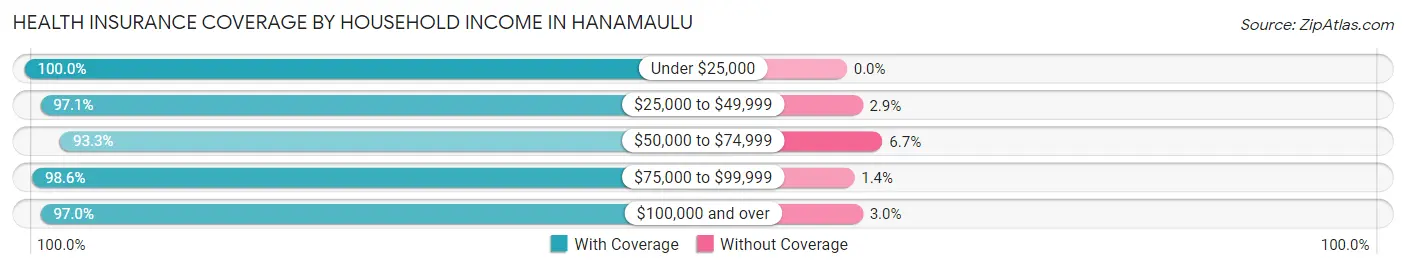
| Household Income | With Coverage | Without Coverage |
| Under $25,000 | 274 (100.0%) | 0 (0.0%) |
| $25,000 to $49,999 | 531 (97.1%) | 16 (2.9%) |
| $50,000 to $74,999 | 728 (93.3%) | 52 (6.7%) |
| $75,000 to $99,999 | 848 (98.6%) | 12 (1.4%) |
| $100,000 and over | 2,019 (97.0%) | 62 (3.0%) |
Public vs Private Health Insurance Coverage by Age in Hanamaulu
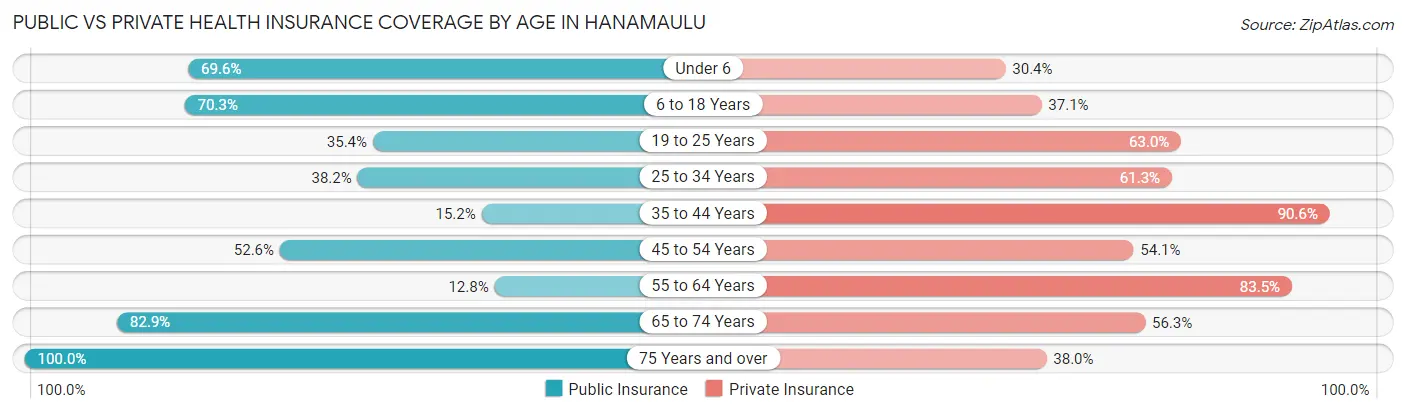
| Age Bracket | Public Insurance | Private Insurance |
| Under 6 | 156 (69.6%) | 68 (30.4%) |
| 6 to 18 Years | 630 (70.3%) | 332 (37.0%) |
| 19 to 25 Years | 192 (35.4%) | 342 (63.0%) |
| 25 to 34 Years | 217 (38.2%) | 348 (61.3%) |
| 35 to 44 Years | 119 (15.2%) | 710 (90.6%) |
| 45 to 54 Years | 281 (52.6%) | 289 (54.1%) |
| 55 to 64 Years | 52 (12.8%) | 340 (83.5%) |
| 65 to 74 Years | 290 (82.9%) | 197 (56.3%) |
| 75 Years and over | 266 (100.0%) | 101 (38.0%) |
| Total | 2,203 (48.2%) | 2,727 (59.7%) |
Disability Status by Sex by Age in Hanamaulu
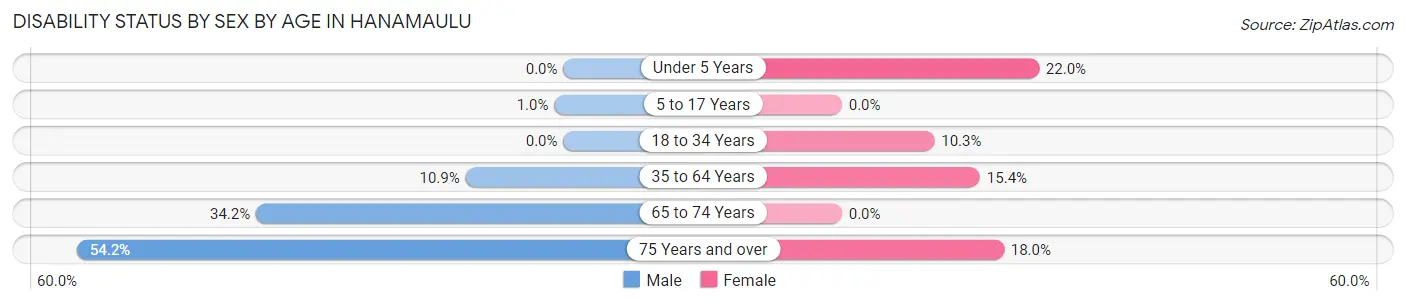
| Age Bracket | Male | Female |
| Under 5 Years | 0 (0.0%) | 9 (22.0%) |
| 5 to 17 Years | 4 (1.0%) | 0 (0.0%) |
| 18 to 34 Years | 0 (0.0%) | 66 (10.3%) |
| 35 to 64 Years | 93 (10.9%) | 134 (15.4%) |
| 65 to 74 Years | 77 (34.2%) | 0 (0.0%) |
| 75 Years and over | 39 (54.2%) | 35 (18.0%) |
Disability Class by Sex by Age in Hanamaulu
Disability Class: Hearing Difficulty
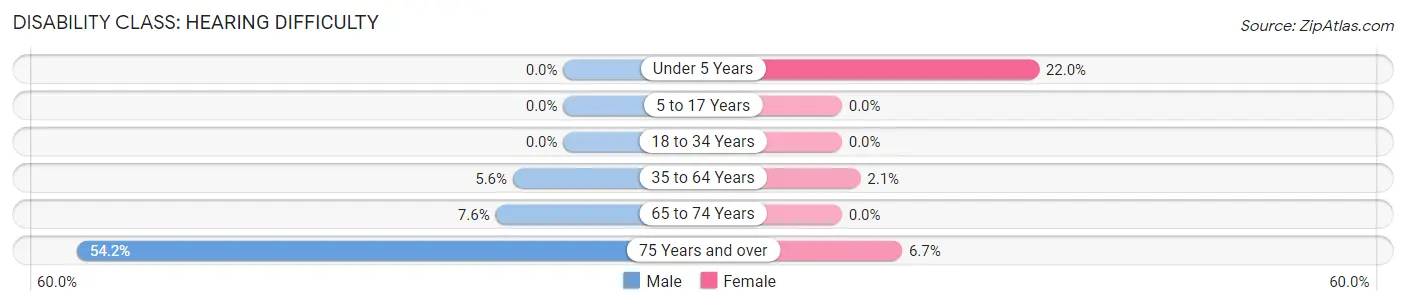
| Age Bracket | Male | Female |
| Under 5 Years | 0 (0.0%) | 9 (22.0%) |
| 5 to 17 Years | 0 (0.0%) | 0 (0.0%) |
| 18 to 34 Years | 0 (0.0%) | 0 (0.0%) |
| 35 to 64 Years | 48 (5.6%) | 18 (2.1%) |
| 65 to 74 Years | 17 (7.6%) | 0 (0.0%) |
| 75 Years and over | 39 (54.2%) | 13 (6.7%) |
Disability Class: Vision Difficulty
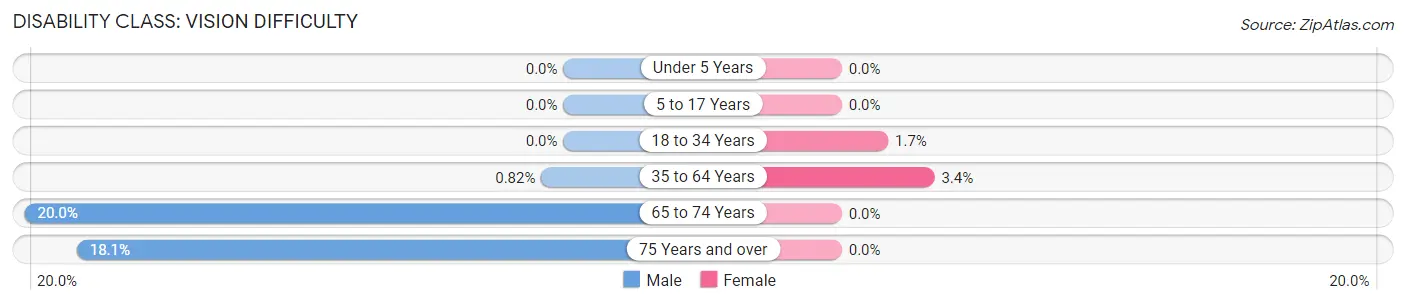
| Age Bracket | Male | Female |
| Under 5 Years | 0 (0.0%) | 0 (0.0%) |
| 5 to 17 Years | 0 (0.0%) | 0 (0.0%) |
| 18 to 34 Years | 0 (0.0%) | 11 (1.7%) |
| 35 to 64 Years | 7 (0.8%) | 30 (3.4%) |
| 65 to 74 Years | 45 (20.0%) | 0 (0.0%) |
| 75 Years and over | 13 (18.1%) | 0 (0.0%) |
Disability Class: Cognitive Difficulty
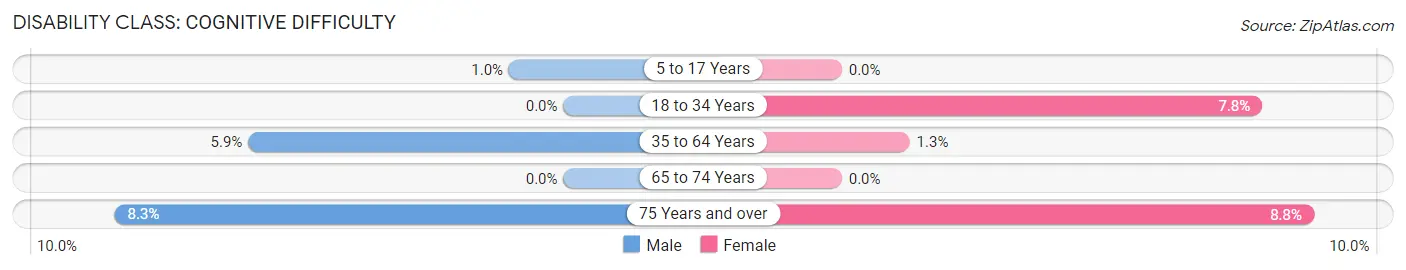
| Age Bracket | Male | Female |
| 5 to 17 Years | 4 (1.0%) | 0 (0.0%) |
| 18 to 34 Years | 0 (0.0%) | 50 (7.8%) |
| 35 to 64 Years | 50 (5.9%) | 11 (1.3%) |
| 65 to 74 Years | 0 (0.0%) | 0 (0.0%) |
| 75 Years and over | 6 (8.3%) | 17 (8.8%) |
Disability Class: Ambulatory Difficulty
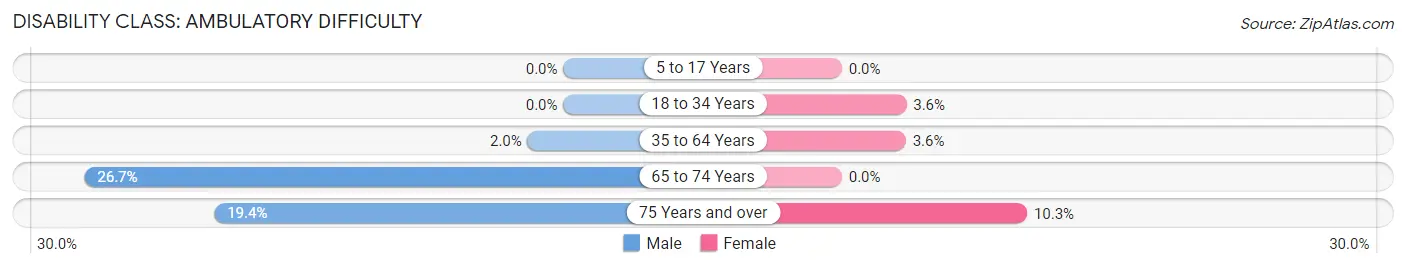
| Age Bracket | Male | Female |
| 5 to 17 Years | 0 (0.0%) | 0 (0.0%) |
| 18 to 34 Years | 0 (0.0%) | 23 (3.6%) |
| 35 to 64 Years | 17 (2.0%) | 31 (3.6%) |
| 65 to 74 Years | 60 (26.7%) | 0 (0.0%) |
| 75 Years and over | 14 (19.4%) | 20 (10.3%) |
Disability Class: Self-Care Difficulty
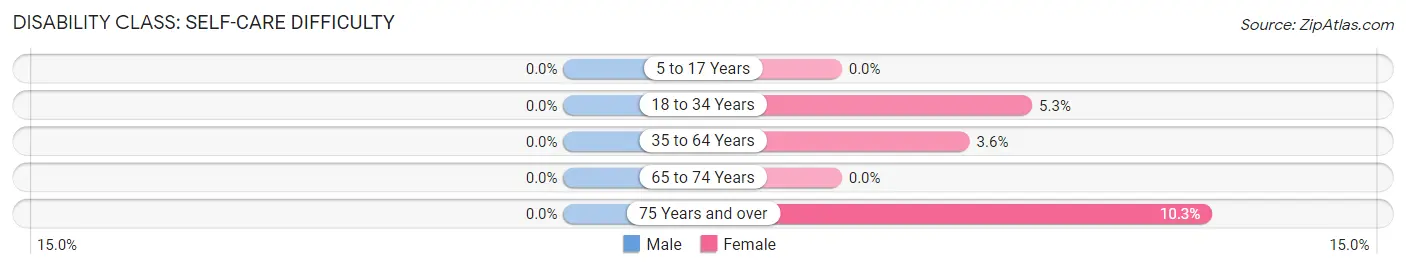
| Age Bracket | Male | Female |
| 5 to 17 Years | 0 (0.0%) | 0 (0.0%) |
| 18 to 34 Years | 0 (0.0%) | 34 (5.3%) |
| 35 to 64 Years | 0 (0.0%) | 31 (3.6%) |
| 65 to 74 Years | 0 (0.0%) | 0 (0.0%) |
| 75 Years and over | 0 (0.0%) | 20 (10.3%) |
Technology Access in Hanamaulu
Computing Device Access in Hanamaulu
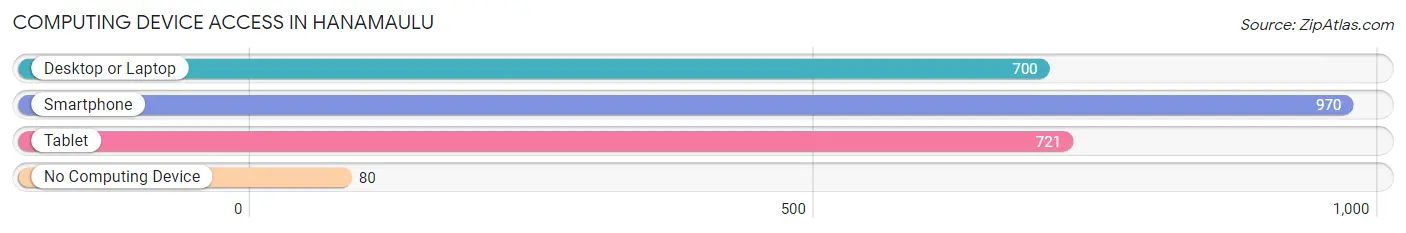
| Device Type | # Households | % Households |
| Desktop or Laptop | 700 | 65.2% |
| Smartphone | 970 | 90.3% |
| Tablet | 721 | 67.1% |
| No Computing Device | 80 | 7.4% |
| Total | 1,074 | 100.0% |
Internet Access in Hanamaulu
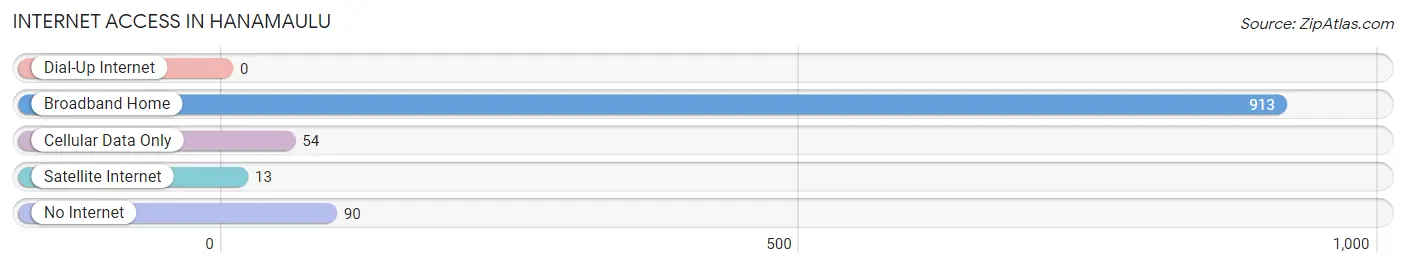
| Internet Type | # Households | % Households |
| Dial-Up Internet | 0 | 0.0% |
| Broadband Home | 913 | 85.0% |
| Cellular Data Only | 54 | 5.0% |
| Satellite Internet | 13 | 1.2% |
| No Internet | 90 | 8.4% |
| Total | 1,074 | 100.0% |
Hanamaulu Summary
Hanamaulu is a small unincorporated community located on the island of Kauai in the state of Hawaii. It is located in the Hanamaulu CDP (Census Designated Place) and is part of the Kauai County. The population of Hanamaulu was 1,845 as of the 2010 census.
History
Hanamaulu has a long and rich history that dates back to the early 1800s. The area was originally inhabited by Native Hawaiians and was known as “Kanamalu” which means “the place of the red dirt”. The area was later settled by Chinese immigrants in the late 1800s and early 1900s. The Chinese immigrants were mainly involved in the sugarcane industry and worked in the nearby sugar plantations.
In the early 1900s, the area was known as “Hanamaulu Town” and was a bustling community with a post office, stores, churches, and a school. The town was also home to a large Chinese population and was known for its Chinese New Year celebrations.
In the 1950s, the sugar industry began to decline and many of the Chinese immigrants left the area. The town of Hanamaulu was eventually annexed by the City of Lihue in 1959.
Geography
Hanamaulu is located on the eastern side of the island of Kauai in the state of Hawaii. It is situated in the Hanamaulu CDP (Census Designated Place) and is part of the Kauai County. The area is bordered by the Wailua River to the north, the Hanamaulu Stream to the east, and the Hanamaulu Bay to the south.
The terrain of the area is mostly flat with some rolling hills. The climate is tropical and humid with temperatures ranging from 70 to 90 degrees Fahrenheit.
Economy
The economy of Hanamaulu is mainly based on tourism and agriculture. The area is home to several resorts and hotels, as well as a number of small businesses. Agriculture is also an important part of the economy with the main crops being sugarcane, taro, and bananas.
Demographics
As of the 2010 census, the population of Hanamaulu was 1,845. The racial makeup of the area was 57.3% Asian, 28.2% White, 8.2% Native Hawaiian and Other Pacific Islander, and 6.3% from two or more races. The median household income was $50,938 and the median age was 44.7 years.
Conclusion
Hanamaulu is a small unincorporated community located on the island of Kauai in the state of Hawaii. It has a long and rich history that dates back to the early 1800s and was originally inhabited by Native Hawaiians. The economy of the area is mainly based on tourism and agriculture and the population of Hanamaulu was 1,845 as of the 2010 census.
Common Questions
What is Per Capita Income in Hanamaulu?
Per Capita income in Hanamaulu is $25,825.
What is the Median Family Income in Hanamaulu?
Median Family Income in Hanamaulu is $74,348.
What is the Median Household income in Hanamaulu?
Median Household Income in Hanamaulu is $74,511.
What is Income or Wage Gap in Hanamaulu?
Income or Wage Gap in Hanamaulu is 27.4%.
Women in Hanamaulu earn 72.6 cents for every dollar earned by a man.
What is Inequality or Gini Index in Hanamaulu?
Inequality or Gini Index in Hanamaulu is 0.40.
What is the Total Population of Hanamaulu?
Total Population of Hanamaulu is 4,628.
What is the Total Male Population of Hanamaulu?
Total Male Population of Hanamaulu is 2,305.
What is the Total Female Population of Hanamaulu?
Total Female Population of Hanamaulu is 2,323.
What is the Ratio of Males per 100 Females in Hanamaulu?
There are 99.23 Males per 100 Females in Hanamaulu.
What is the Ratio of Females per 100 Males in Hanamaulu?
There are 100.78 Females per 100 Males in Hanamaulu.
What is the Median Population Age in Hanamaulu?
Median Population Age in Hanamaulu is 35.3 Years.
What is the Average Family Size in Hanamaulu
Average Family Size in Hanamaulu is 4.3 People.
What is the Average Household Size in Hanamaulu
Average Household Size in Hanamaulu is 4.3 People.
How Large is the Labor Force in Hanamaulu?
There are 2,506 People in the Labor Forcein in Hanamaulu.
What is the Percentage of People in the Labor Force in Hanamaulu?
67.3% of People are in the Labor Force in Hanamaulu.
What is the Unemployment Rate in Hanamaulu?
Unemployment Rate in Hanamaulu is 6.6%.