Haliimaile, HI Map & Demographics
Haliimaile Map
Haliimaile Overview
$26,978
PER CAPITA INCOME
$82,900
AVG FAMILY INCOME
$64,440
AVG HOUSEHOLD INCOME
25.8%
WAGE / INCOME GAP [ % ]
74.2¢/ $1
WAGE / INCOME GAP [ $ ]
0.45
INEQUALITY / GINI INDEX
1,077
TOTAL POPULATION
499
MALE POPULATION
578
FEMALE POPULATION
86.33
MALES / 100 FEMALES
115.83
FEMALES / 100 MALES
34.3
MEDIAN AGE
3.7
AVG FAMILY SIZE
3.4
AVG HOUSEHOLD SIZE
468
LABOR FORCE [ PEOPLE ]
55.4%
PERCENT IN LABOR FORCE
9.3%
UNEMPLOYMENT RATE
Income in Haliimaile
Income Overview in Haliimaile
Per Capita Income in Haliimaile is $26,978, while median incomes of families and households are $82,900 and $64,440 respectively.
| Characteristic | Number | Measure |
| Per Capita Income | 1,077 | $26,978 |
| Median Family Income | 246 | $82,900 |
| Mean Family Income | 246 | $95,381 |
| Median Household Income | 321 | $64,440 |
| Mean Household Income | 321 | $86,280 |
| Income Deficit | 246 | $0 |
| Wage / Income Gap (%) | 1,077 | 25.79% |
| Wage / Income Gap ($) | 1,077 | 74.21¢ per $1 |
| Gini / Inequality Index | 1,077 | 0.45 |
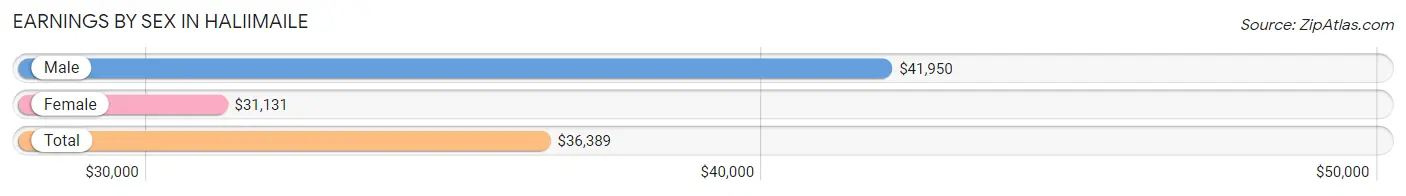
Earnings by Sex in Haliimaile
Average Earnings in Haliimaile are $36,389, $41,950 for men and $31,131 for women, a difference of 25.8%.
| Sex | Number | Average Earnings |
| Male | 289 (58.0%) | $41,950 |
| Female | 209 (42.0%) | $31,131 |
| Total | 498 (100.0%) | $36,389 |
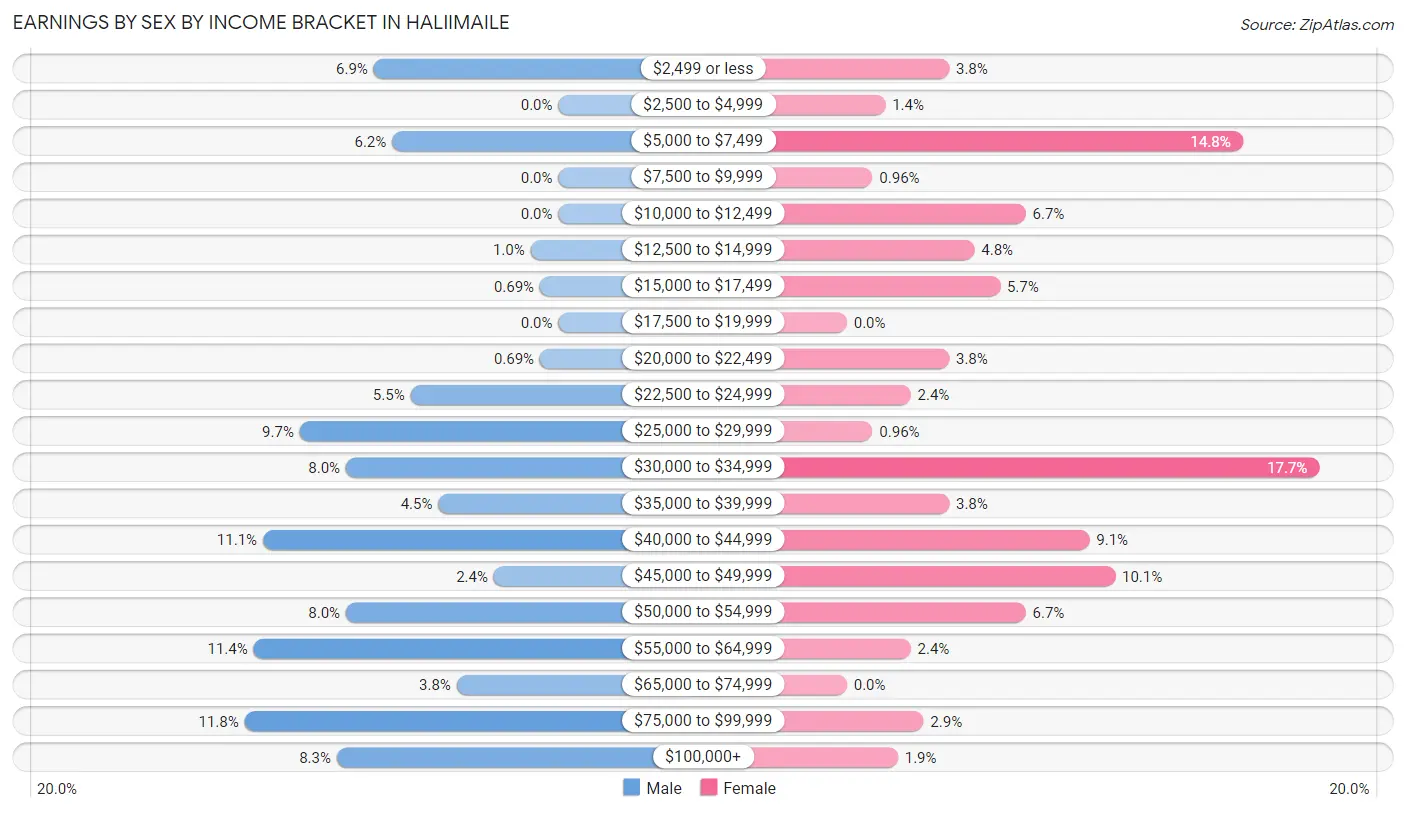
Earnings by Sex by Income Bracket in Haliimaile
The most common earnings brackets in Haliimaile are $75,000 to $99,999 for men (34 | 11.8%) and $30,000 to $34,999 for women (37 | 17.7%).
| Income | Male | Female |
| $2,499 or less | 20 (6.9%) | 8 (3.8%) |
| $2,500 to $4,999 | 0 (0.0%) | 3 (1.4%) |
| $5,000 to $7,499 | 18 (6.2%) | 31 (14.8%) |
| $7,500 to $9,999 | 0 (0.0%) | 2 (1.0%) |
| $10,000 to $12,499 | 0 (0.0%) | 14 (6.7%) |
| $12,500 to $14,999 | 3 (1.0%) | 10 (4.8%) |
| $15,000 to $17,499 | 2 (0.7%) | 12 (5.7%) |
| $17,500 to $19,999 | 0 (0.0%) | 0 (0.0%) |
| $20,000 to $22,499 | 2 (0.7%) | 8 (3.8%) |
| $22,500 to $24,999 | 16 (5.5%) | 5 (2.4%) |
| $25,000 to $29,999 | 28 (9.7%) | 2 (1.0%) |
| $30,000 to $34,999 | 23 (8.0%) | 37 (17.7%) |
| $35,000 to $39,999 | 13 (4.5%) | 8 (3.8%) |
| $40,000 to $44,999 | 32 (11.1%) | 19 (9.1%) |
| $45,000 to $49,999 | 7 (2.4%) | 21 (10.1%) |
| $50,000 to $54,999 | 23 (8.0%) | 14 (6.7%) |
| $55,000 to $64,999 | 33 (11.4%) | 5 (2.4%) |
| $65,000 to $74,999 | 11 (3.8%) | 0 (0.0%) |
| $75,000 to $99,999 | 34 (11.8%) | 6 (2.9%) |
| $100,000+ | 24 (8.3%) | 4 (1.9%) |
| Total | 289 (100.0%) | 209 (100.0%) |
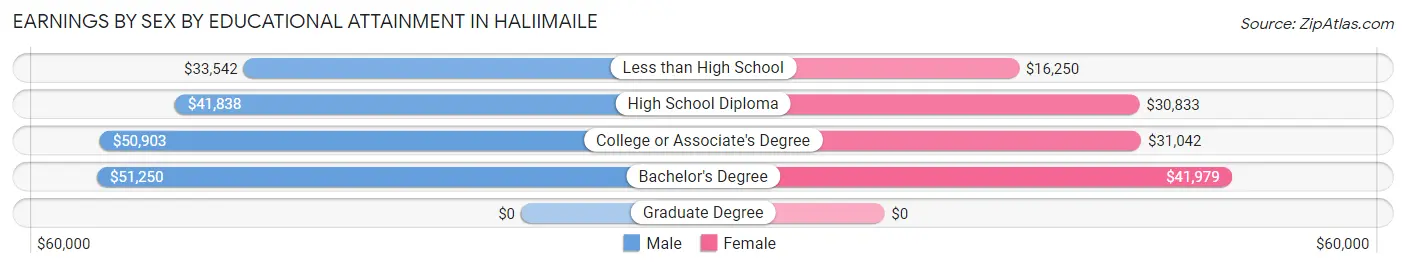
Earnings by Sex by Educational Attainment in Haliimaile
Average earnings in Haliimaile are $43,750 for men and $31,429 for women, a difference of 28.2%. Men with an educational attainment of bachelor's degree enjoy the highest average annual earnings of $51,250, while those with less than high school education earn the least with $33,542. Women with an educational attainment of bachelor's degree earn the most with the average annual earnings of $41,979, while those with less than high school education have the smallest earnings of $16,250.
| Educational Attainment | Male Income | Female Income |
| Less than High School | $33,542 | $16,250 |
| High School Diploma | $41,838 | $30,833 |
| College or Associate's Degree | $50,903 | $31,042 |
| Bachelor's Degree | $51,250 | $41,979 |
| Graduate Degree | - | - |
| Total | $43,750 | $31,429 |
Family Income in Haliimaile
Family Income Brackets in Haliimaile
According to the Haliimaile family income data, there are 55 families falling into the $50,000 to $74,999 income range, which is the most common income bracket and makes up 22.4% of all families. Conversely, the $15,000 to $24,999 income bracket is the least frequent group with only 2 families (0.8%) belonging to this category.
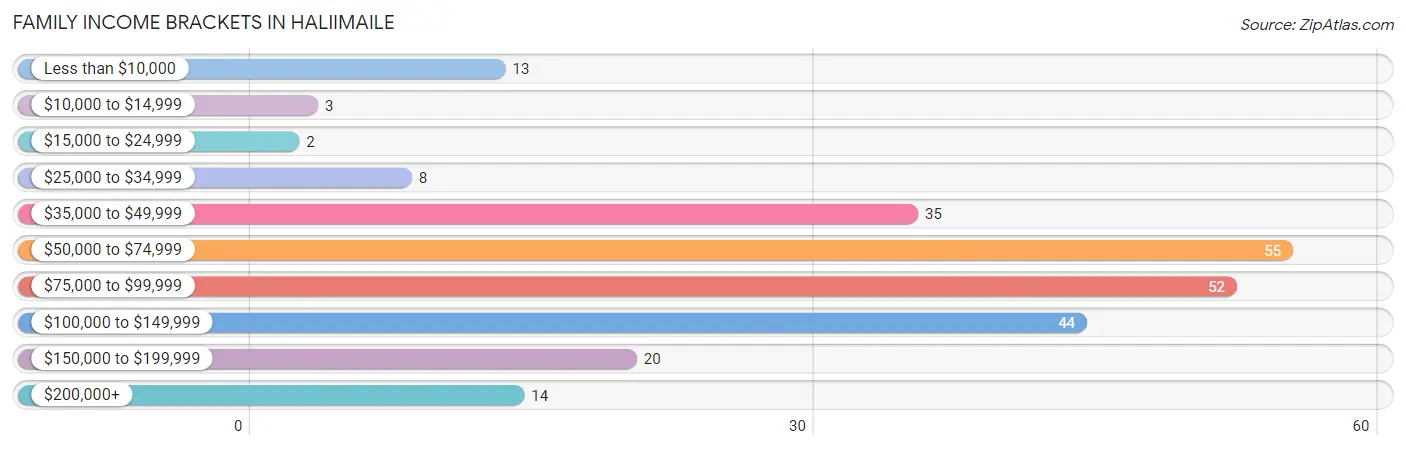
| Income Bracket | # Families | % Families |
| Less than $10,000 | 13 | 5.3% |
| $10,000 to $14,999 | 3 | 1.2% |
| $15,000 to $24,999 | 2 | 0.8% |
| $25,000 to $34,999 | 8 | 3.3% |
| $35,000 to $49,999 | 35 | 14.2% |
| $50,000 to $74,999 | 55 | 22.4% |
| $75,000 to $99,999 | 52 | 21.1% |
| $100,000 to $149,999 | 44 | 17.9% |
| $150,000 to $199,999 | 20 | 8.1% |
| $200,000+ | 14 | 5.7% |
Family Income by Famaliy Size in Haliimaile
7+ person families (21 | 8.5%) account for the highest median family income in Haliimaile with $84,250 per family, while 2-person families (89 | 36.2%) have the highest median income of $41,625 per family member.
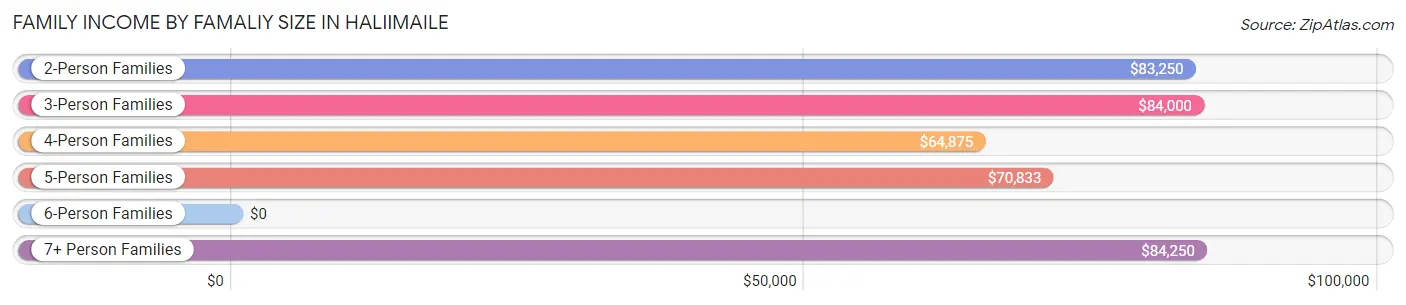
| Income Bracket | # Families | Median Income |
| 2-Person Families | 89 (36.2%) | $83,250 |
| 3-Person Families | 82 (33.3%) | $84,000 |
| 4-Person Families | 27 (11.0%) | $64,875 |
| 5-Person Families | 20 (8.1%) | $70,833 |
| 6-Person Families | 7 (2.9%) | $0 |
| 7+ Person Families | 21 (8.5%) | $84,250 |
| Total | 246 (100.0%) | $82,900 |
Family Income by Number of Earners in Haliimaile
The median family income in Haliimaile is $82,900, with families comprising 2 earners (67) having the highest median family income of $102,750, while families with no earners (46) have the lowest median family income of $38,333, accounting for 27.2% and 18.7% of families, respectively.
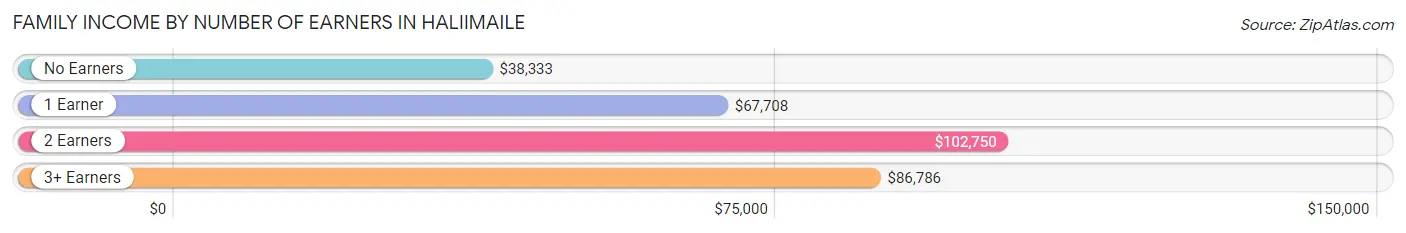
| Number of Earners | # Families | Median Income |
| No Earners | 46 (18.7%) | $38,333 |
| 1 Earner | 79 (32.1%) | $67,708 |
| 2 Earners | 67 (27.2%) | $102,750 |
| 3+ Earners | 54 (22.0%) | $86,786 |
| Total | 246 (100.0%) | $82,900 |
Household Income in Haliimaile
Household Income Brackets in Haliimaile
With 53 households falling in the category, the $100,000 to $149,999 income range is the most frequent in Haliimaile, accounting for 16.5% of all households. In contrast, only 11 households (3.4%) fall into the less than $10,000 income bracket, making it the least populous group.
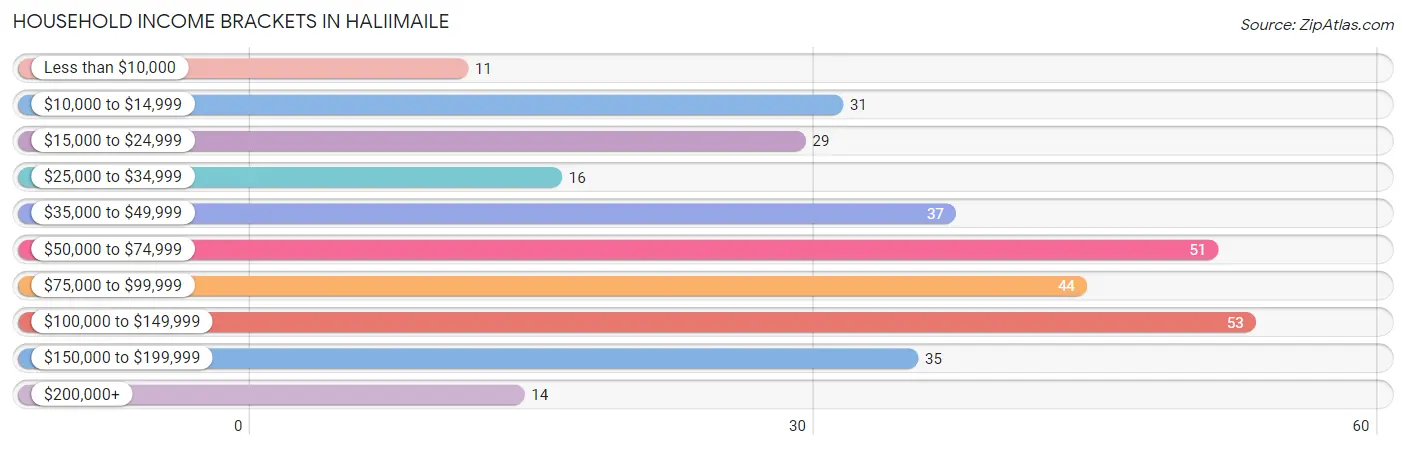
| Income Bracket | # Households | % Households |
| Less than $10,000 | 11 | 3.4% |
| $10,000 to $14,999 | 31 | 9.7% |
| $15,000 to $24,999 | 29 | 9.0% |
| $25,000 to $34,999 | 16 | 5.0% |
| $35,000 to $49,999 | 37 | 11.5% |
| $50,000 to $74,999 | 51 | 15.9% |
| $75,000 to $99,999 | 44 | 13.7% |
| $100,000 to $149,999 | 53 | 16.5% |
| $150,000 to $199,999 | 35 | 10.9% |
| $200,000+ | 14 | 4.4% |
Household Income by Householder Age in Haliimaile
The median household income in Haliimaile is $64,440, with the highest median household income of $118,750 found in the 45 to 64 years age bracket for the primary householder. A total of 117 households (36.4%) fall into this category. Meanwhile, the 15 to 24 years age bracket for the primary householder has the lowest median household income of $0, with 14 households (4.4%) in this group.
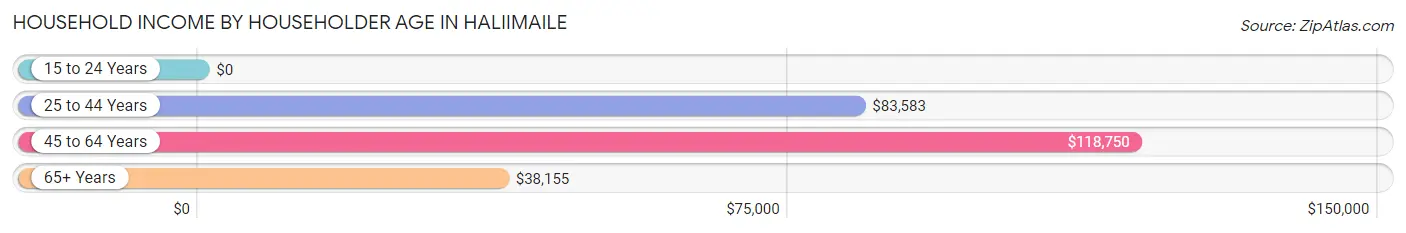
| Income Bracket | # Households | Median Income |
| 15 to 24 Years | 14 (4.4%) | $0 |
| 25 to 44 Years | 91 (28.3%) | $83,583 |
| 45 to 64 Years | 117 (36.4%) | $118,750 |
| 65+ Years | 99 (30.8%) | $38,155 |
| Total | 321 (100.0%) | $64,440 |
Poverty in Haliimaile
Income Below Poverty by Sex and Age in Haliimaile
With 6.8% poverty level for males and 9.9% for females among the residents of Haliimaile, 25 to 34 year old males and under 5 year old females are the most vulnerable to poverty, with 24 males (19.8%) and 25 females (71.4%) in their respective age groups living below the poverty level.
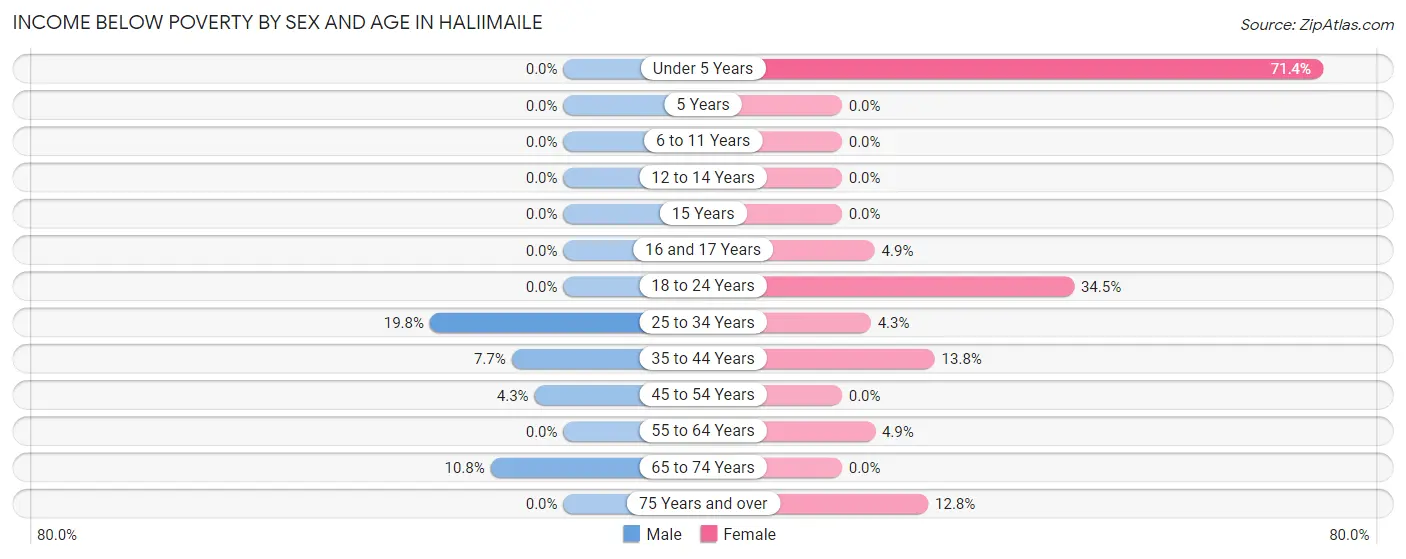
| Age Bracket | Male | Female |
| Under 5 Years | 0 (0.0%) | 25 (71.4%) |
| 5 Years | 0 (0.0%) | 0 (0.0%) |
| 6 to 11 Years | 0 (0.0%) | 0 (0.0%) |
| 12 to 14 Years | 0 (0.0%) | 0 (0.0%) |
| 15 Years | 0 (0.0%) | 0 (0.0%) |
| 16 and 17 Years | 0 (0.0%) | 2 (4.9%) |
| 18 to 24 Years | 0 (0.0%) | 10 (34.5%) |
| 25 to 34 Years | 24 (19.8%) | 4 (4.3%) |
| 35 to 44 Years | 3 (7.7%) | 8 (13.8%) |
| 45 to 54 Years | 3 (4.3%) | 0 (0.0%) |
| 55 to 64 Years | 0 (0.0%) | 3 (4.9%) |
| 65 to 74 Years | 4 (10.8%) | 0 (0.0%) |
| 75 Years and over | 0 (0.0%) | 5 (12.8%) |
| Total | 34 (6.8%) | 57 (9.9%) |
Income Above Poverty by Sex and Age in Haliimaile
According to the poverty statistics in Haliimaile, males aged under 5 years and females aged 5 years are the age groups that are most secure financially, with 100.0% of males and 100.0% of females in these age groups living above the poverty line.
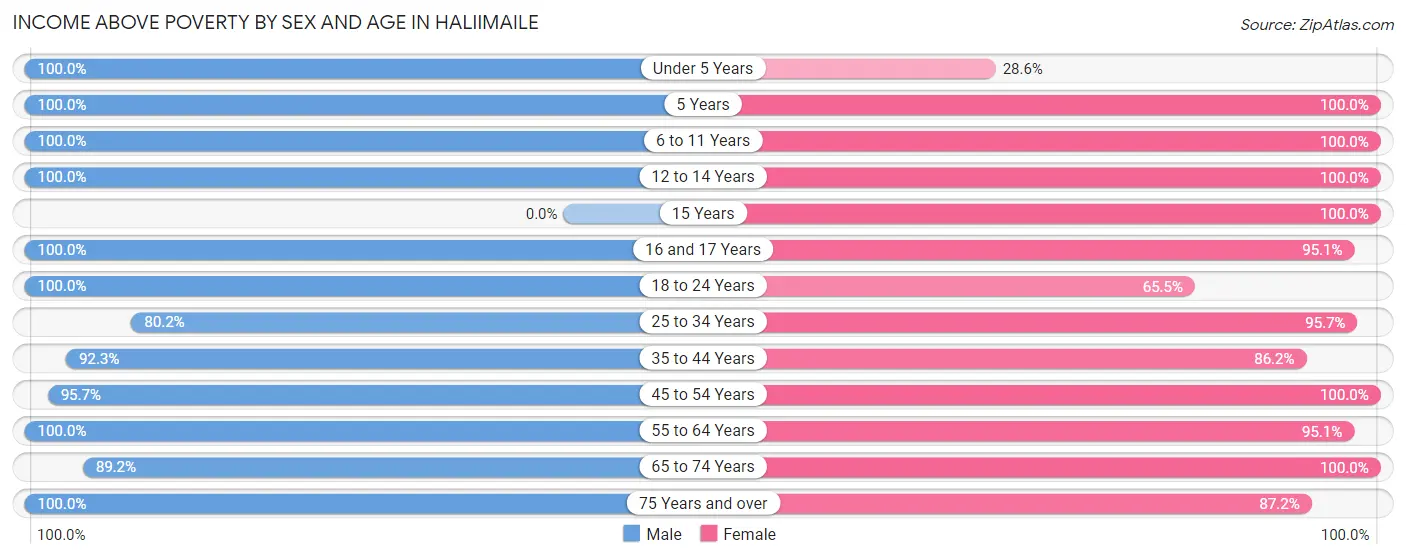
| Age Bracket | Male | Female |
| Under 5 Years | 38 (100.0%) | 10 (28.6%) |
| 5 Years | 3 (100.0%) | 14 (100.0%) |
| 6 to 11 Years | 67 (100.0%) | 48 (100.0%) |
| 12 to 14 Years | 5 (100.0%) | 17 (100.0%) |
| 15 Years | 0 (0.0%) | 3 (100.0%) |
| 16 and 17 Years | 6 (100.0%) | 39 (95.1%) |
| 18 to 24 Years | 36 (100.0%) | 19 (65.5%) |
| 25 to 34 Years | 97 (80.2%) | 89 (95.7%) |
| 35 to 44 Years | 36 (92.3%) | 50 (86.2%) |
| 45 to 54 Years | 67 (95.7%) | 82 (100.0%) |
| 55 to 64 Years | 58 (100.0%) | 58 (95.1%) |
| 65 to 74 Years | 33 (89.2%) | 58 (100.0%) |
| 75 Years and over | 17 (100.0%) | 34 (87.2%) |
| Total | 463 (93.2%) | 521 (90.1%) |
Income Below Poverty Among Married-Couple Families in Haliimaile
The poverty statistics for married-couple families in Haliimaile show that 2.1% or 3 of the total 145 families live below the poverty line. Families with no children have the highest poverty rate of 4.7%, comprising of 3 families. On the other hand, families with 1 or 2 children have the lowest poverty rate of 0.0%, which includes 0 families.
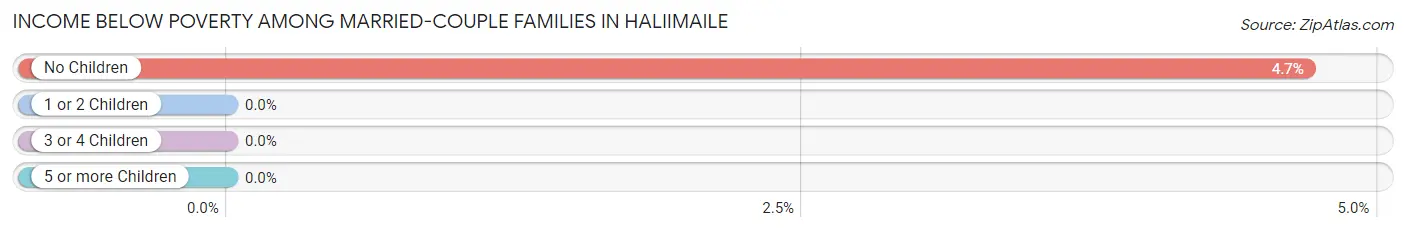
| Children | Above Poverty | Below Poverty |
| No Children | 61 (95.3%) | 3 (4.7%) |
| 1 or 2 Children | 60 (100.0%) | 0 (0.0%) |
| 3 or 4 Children | 6 (100.0%) | 0 (0.0%) |
| 5 or more Children | 15 (100.0%) | 0 (0.0%) |
| Total | 142 (97.9%) | 3 (2.1%) |
Income Below Poverty Among Single-Parent Households in Haliimaile
According to the poverty data in Haliimaile, 9.7% or 3 single-father households and 14.3% or 10 single-mother households are living below the poverty line. Among single-father households, those with 1 or 2 children have the highest poverty rate, with 3 households (100.0%) experiencing poverty. Likewise, among single-mother households, those with 1 or 2 children have the highest poverty rate, with 10 households (17.5%) falling below the poverty line.
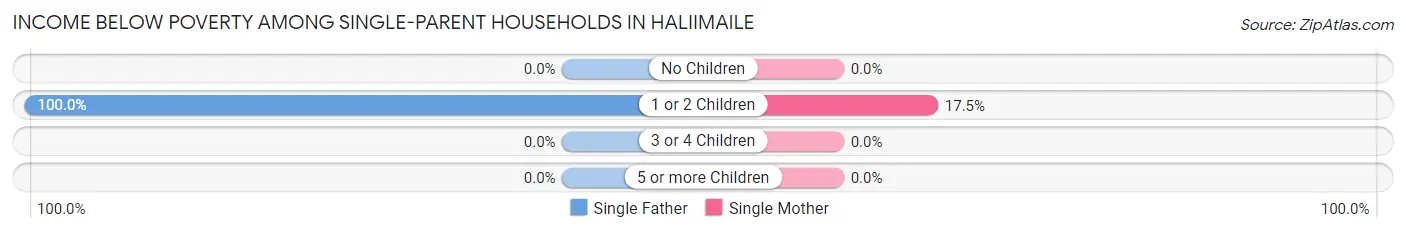
| Children | Single Father | Single Mother |
| No Children | 0 (0.0%) | 0 (0.0%) |
| 1 or 2 Children | 3 (100.0%) | 10 (17.5%) |
| 3 or 4 Children | 0 (0.0%) | 0 (0.0%) |
| 5 or more Children | 0 (0.0%) | 0 (0.0%) |
| Total | 3 (9.7%) | 10 (14.3%) |
Income Below Poverty Among Married-Couple vs Single-Parent Households in Haliimaile
The poverty data for Haliimaile shows that 3 of the married-couple family households (2.1%) and 13 of the single-parent households (12.9%) are living below the poverty level. Within the married-couple family households, those with no children have the highest poverty rate, with 3 households (4.7%) falling below the poverty line. Among the single-parent households, those with 1 or 2 children have the highest poverty rate, with 13 household (21.7%) living below poverty.
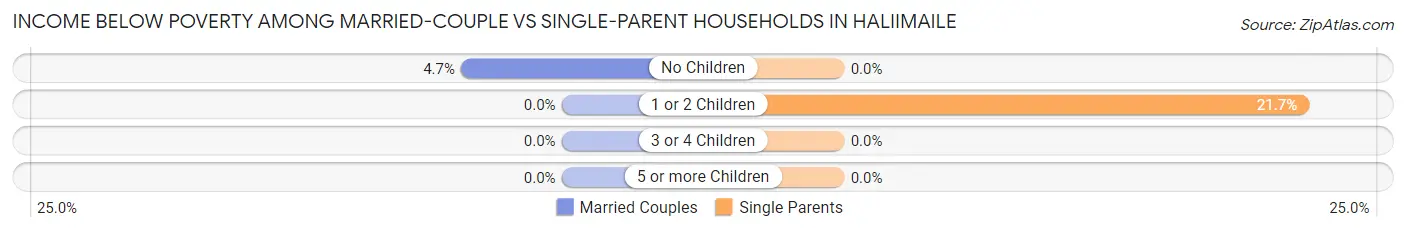
| Children | Married-Couple Families | Single-Parent Households |
| No Children | 3 (4.7%) | 0 (0.0%) |
| 1 or 2 Children | 0 (0.0%) | 13 (21.7%) |
| 3 or 4 Children | 0 (0.0%) | 0 (0.0%) |
| 5 or more Children | 0 (0.0%) | 0 (0.0%) |
| Total | 3 (2.1%) | 13 (12.9%) |
Race in Haliimaile
The most populous races in Haliimaile are Asian (297 | 27.6%), Two or more Races (258 | 24.0%), and Hawaiian / Pacific (241 | 22.4%).
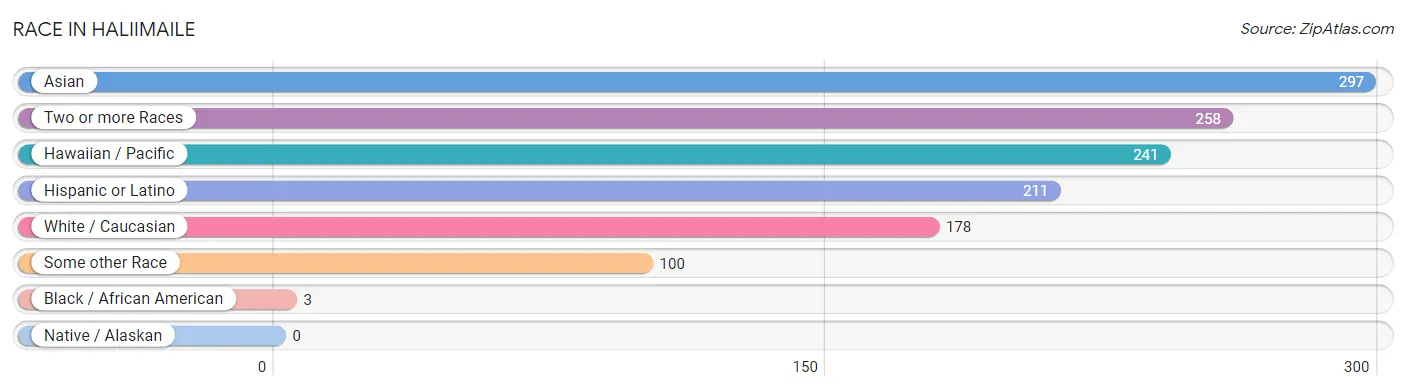
| Race | # Population | % Population |
| Asian | 297 | 27.6% |
| Black / African American | 3 | 0.3% |
| Hawaiian / Pacific | 241 | 22.4% |
| Hispanic or Latino | 211 | 19.6% |
| Native / Alaskan | 0 | 0.0% |
| White / Caucasian | 178 | 16.5% |
| Two or more Races | 258 | 24.0% |
| Some other Race | 100 | 9.3% |
| Total | 1,077 | 100.0% |
Ancestry in Haliimaile
The most populous ancestries reported in Haliimaile are Korean (325 | 30.2%), Native Hawaiian (295 | 27.4%), Bhutanese (187 | 17.4%), Mexican (130 | 12.1%), and Indian (Asian) (83 | 7.7%), together accounting for 94.7% of all Haliimaile residents.
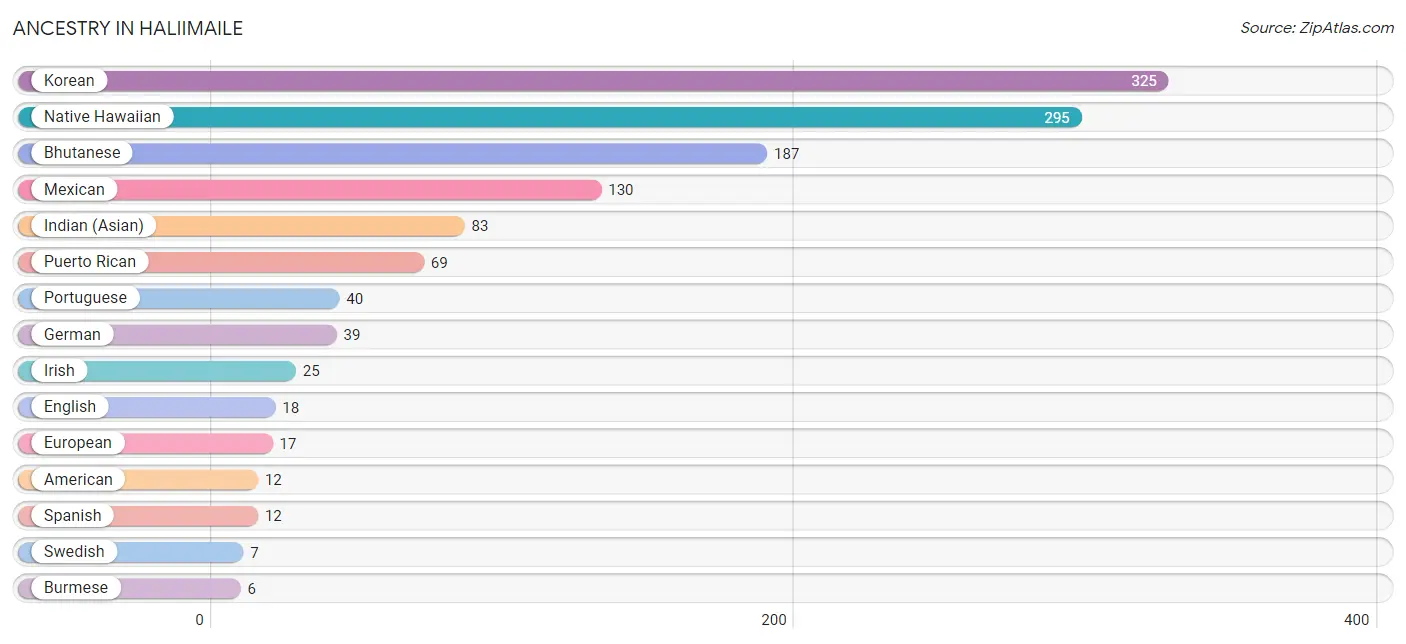
| Ancestry | # Population | % Population |
| American | 12 | 1.1% |
| Bhutanese | 187 | 17.4% |
| Burmese | 6 | 0.6% |
| Danish | 3 | 0.3% |
| English | 18 | 1.7% |
| Ethiopian | 3 | 0.3% |
| European | 17 | 1.6% |
| French | 6 | 0.6% |
| German | 39 | 3.6% |
| Greek | 1 | 0.1% |
| Indian (Asian) | 83 | 7.7% |
| Irish | 25 | 2.3% |
| Italian | 2 | 0.2% |
| Korean | 325 | 30.2% |
| Mexican | 130 | 12.1% |
| Native Hawaiian | 295 | 27.4% |
| Norwegian | 5 | 0.5% |
| Polish | 3 | 0.3% |
| Portuguese | 40 | 3.7% |
| Puerto Rican | 69 | 6.4% |
| Russian | 4 | 0.4% |
| Samoan | 4 | 0.4% |
| Scotch-Irish | 6 | 0.6% |
| Scottish | 2 | 0.2% |
| Spanish | 12 | 1.1% |
| Subsaharan African | 3 | 0.3% |
| Swedish | 7 | 0.6% |
| Swiss | 5 | 0.5% |
| Welsh | 3 | 0.3% | View All 29 Rows |
Immigrants in Haliimaile
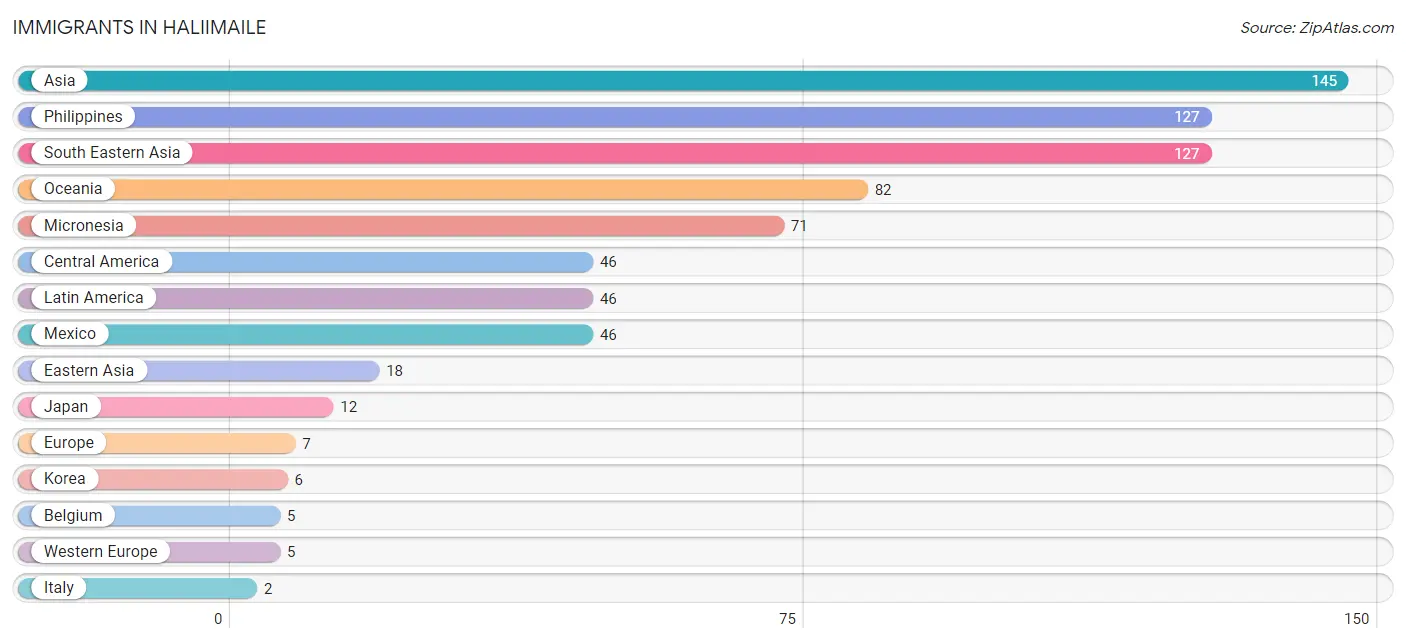
The most numerous immigrant groups reported in Haliimaile came from Asia (145 | 13.5%), Philippines (127 | 11.8%), South Eastern Asia (127 | 11.8%), Oceania (82 | 7.6%), and Micronesia (71 | 6.6%), together accounting for 51.2% of all Haliimaile residents.
| Immigration Origin | # Population | % Population |
| Asia | 145 | 13.5% |
| Belgium | 5 | 0.5% |
| Central America | 46 | 4.3% |
| Eastern Asia | 18 | 1.7% |
| Europe | 7 | 0.6% |
| Italy | 2 | 0.2% |
| Japan | 12 | 1.1% |
| Korea | 6 | 0.6% |
| Latin America | 46 | 4.3% |
| Mexico | 46 | 4.3% |
| Micronesia | 71 | 6.6% |
| Oceania | 82 | 7.6% |
| Philippines | 127 | 11.8% |
| South Eastern Asia | 127 | 11.8% |
| Southern Europe | 2 | 0.2% |
| Western Europe | 5 | 0.5% | View All 16 Rows |
Sex and Age in Haliimaile
Sex and Age in Haliimaile
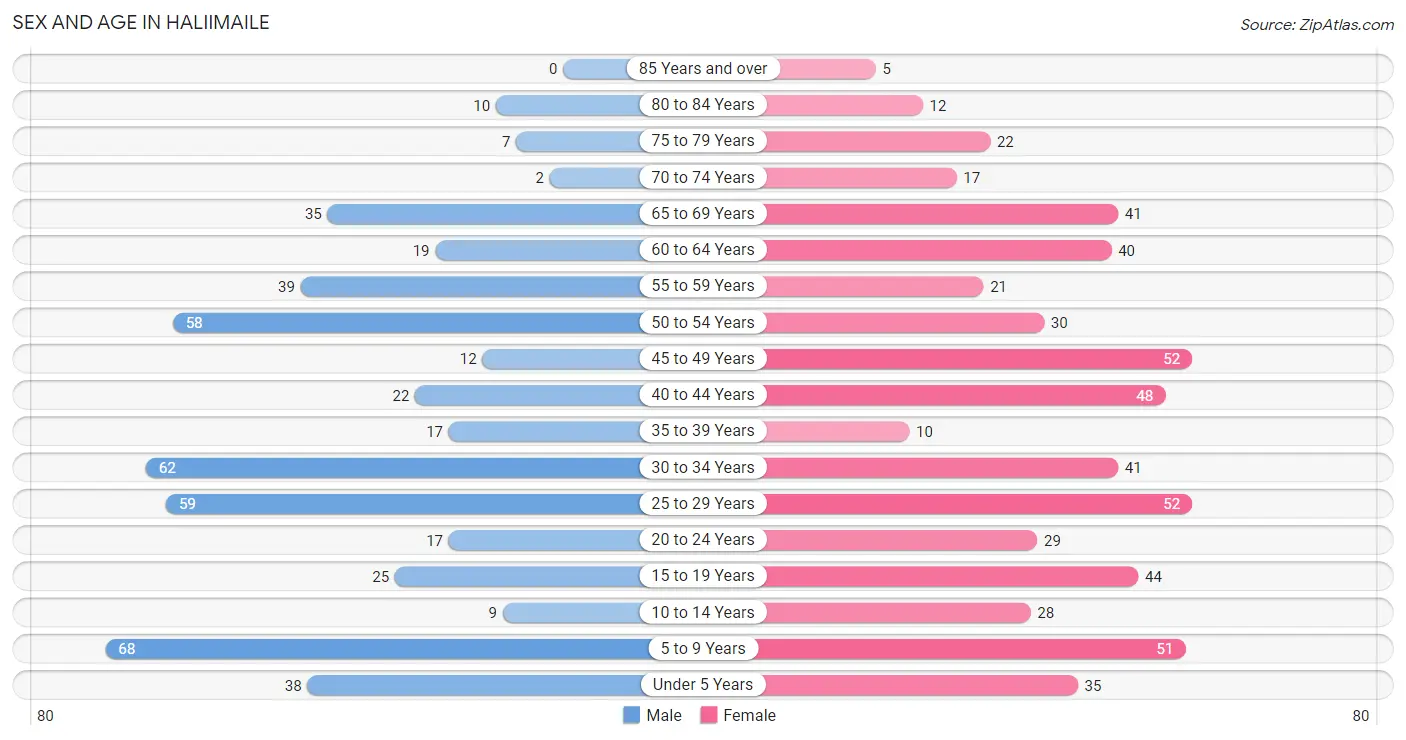
The most populous age groups in Haliimaile are 5 to 9 Years (68 | 13.6%) for men and 25 to 29 Years (52 | 9.0%) for women.
| Age Bracket | Male | Female |
| Under 5 Years | 38 (7.6%) | 35 (6.1%) |
| 5 to 9 Years | 68 (13.6%) | 51 (8.8%) |
| 10 to 14 Years | 9 (1.8%) | 28 (4.8%) |
| 15 to 19 Years | 25 (5.0%) | 44 (7.6%) |
| 20 to 24 Years | 17 (3.4%) | 29 (5.0%) |
| 25 to 29 Years | 59 (11.8%) | 52 (9.0%) |
| 30 to 34 Years | 62 (12.4%) | 41 (7.1%) |
| 35 to 39 Years | 17 (3.4%) | 10 (1.7%) |
| 40 to 44 Years | 22 (4.4%) | 48 (8.3%) |
| 45 to 49 Years | 12 (2.4%) | 52 (9.0%) |
| 50 to 54 Years | 58 (11.6%) | 30 (5.2%) |
| 55 to 59 Years | 39 (7.8%) | 21 (3.6%) |
| 60 to 64 Years | 19 (3.8%) | 40 (6.9%) |
| 65 to 69 Years | 35 (7.0%) | 41 (7.1%) |
| 70 to 74 Years | 2 (0.4%) | 17 (2.9%) |
| 75 to 79 Years | 7 (1.4%) | 22 (3.8%) |
| 80 to 84 Years | 10 (2.0%) | 12 (2.1%) |
| 85 Years and over | 0 (0.0%) | 5 (0.9%) |
| Total | 499 (100.0%) | 578 (100.0%) |
Families and Households in Haliimaile
Median Family Size in Haliimaile
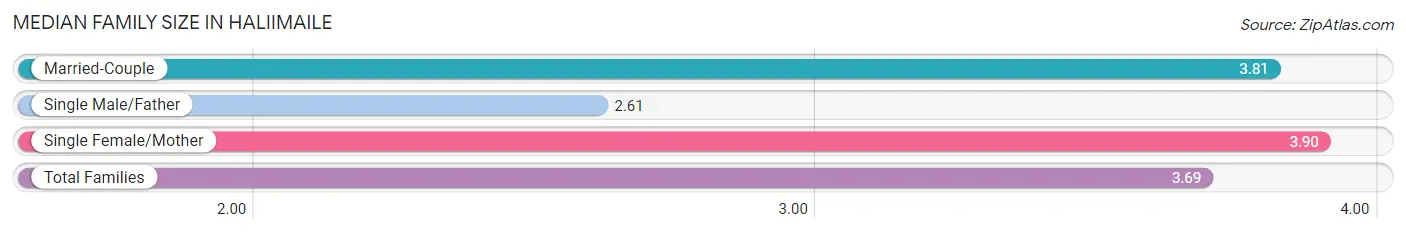
The median family size in Haliimaile is 3.69 persons per family, with single female/mother families (70 | 28.5%) accounting for the largest median family size of 3.9 persons per family. On the other hand, single male/father families (31 | 12.6%) represent the smallest median family size with 2.61 persons per family.
| Family Type | # Families | Family Size |
| Married-Couple | 145 (58.9%) | 3.81 |
| Single Male/Father | 31 (12.6%) | 2.61 |
| Single Female/Mother | 70 (28.5%) | 3.90 |
| Total Families | 246 (100.0%) | 3.69 |
Median Household Size in Haliimaile
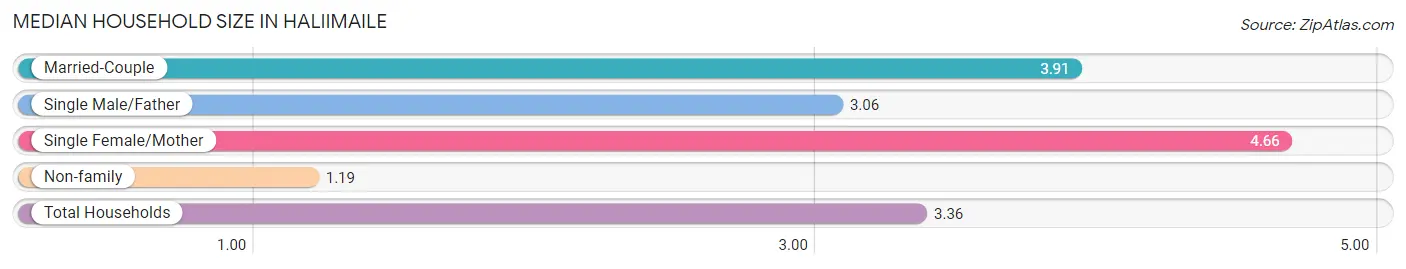
The median household size in Haliimaile is 3.36 persons per household, with single female/mother households (70 | 21.8%) accounting for the largest median household size of 4.66 persons per household. non-family households (75 | 23.4%) represent the smallest median household size with 1.19 persons per household.
| Household Type | # Households | Household Size |
| Married-Couple | 145 (45.2%) | 3.91 |
| Single Male/Father | 31 (9.7%) | 3.06 |
| Single Female/Mother | 70 (21.8%) | 4.66 |
| Non-family | 75 (23.4%) | 1.19 |
| Total Households | 321 (100.0%) | 3.36 |
Household Size by Marriage Status in Haliimaile
Out of a total of 321 households in Haliimaile, 246 (76.6%) are family households, while 75 (23.4%) are nonfamily households. The most numerous type of family households are 2-person households, comprising 80, and the most common type of nonfamily households are 1-person households, comprising 64.
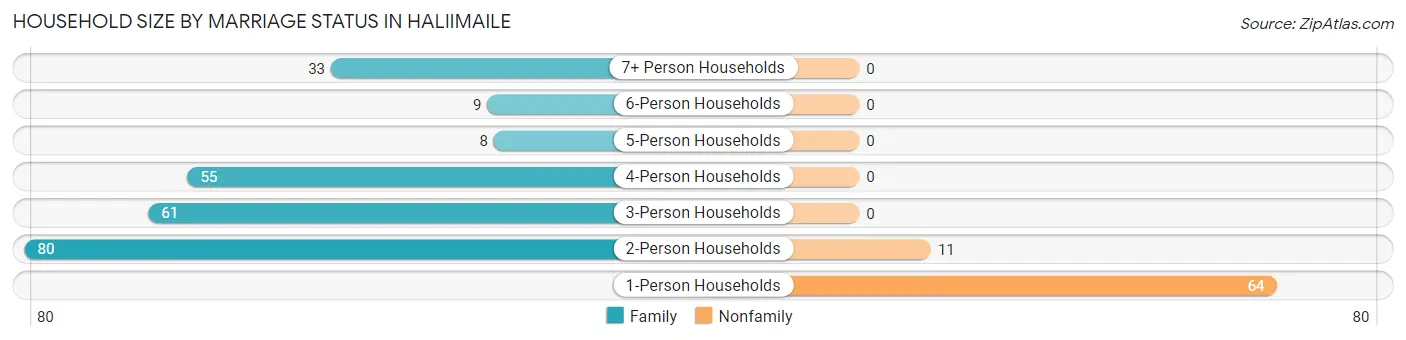
| Household Size | Family Households | Nonfamily Households |
| 1-Person Households | - | 64 (19.9%) |
| 2-Person Households | 80 (24.9%) | 11 (3.4%) |
| 3-Person Households | 61 (19.0%) | 0 (0.0%) |
| 4-Person Households | 55 (17.1%) | 0 (0.0%) |
| 5-Person Households | 8 (2.5%) | 0 (0.0%) |
| 6-Person Households | 9 (2.8%) | 0 (0.0%) |
| 7+ Person Households | 33 (10.3%) | 0 (0.0%) |
| Total | 246 (76.6%) | 75 (23.4%) |
Female Fertility in Haliimaile
Fertility by Age in Haliimaile
Average fertility rate in Haliimaile is 133.0 births per 1,000 women. Women in the age bracket of 35 to 50 years have the highest fertility rate with 177.0 births per 1,000 women. Women in the age bracket of 35 to 50 years acount for 54.0% of all women with births.
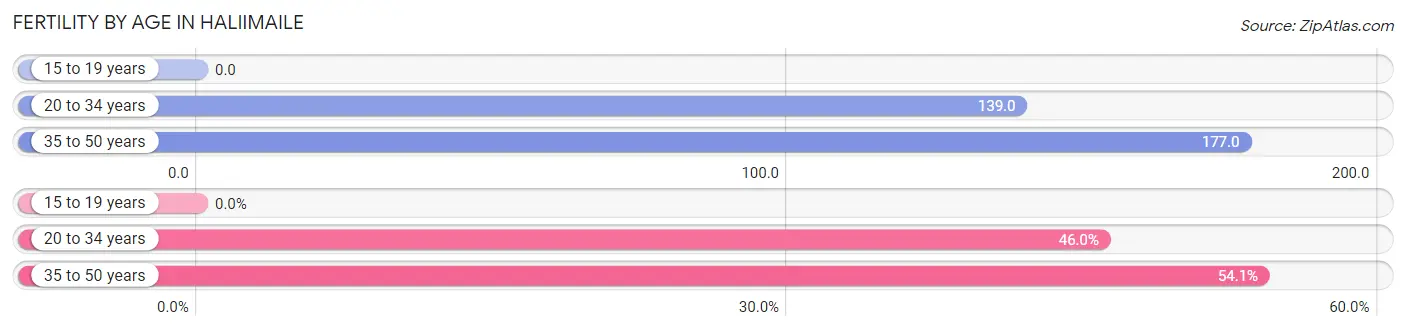
| Age Bracket | Women with Births | Births / 1,000 Women |
| 15 to 19 years | 0 (0.0%) | 0.0 |
| 20 to 34 years | 17 (46.0%) | 139.0 |
| 35 to 50 years | 20 (54.0%) | 177.0 |
| Total | 37 (100.0%) | 133.0 |
Fertility by Age by Marriage Status in Haliimaile
62.2% of women with births (37) in Haliimaile are married. The highest percentage of unmarried women with births falls into 20 to 34 years age bracket with 82.4% of them unmarried at the time of birth, while the lowest percentage of unmarried women with births belong to 35 to 50 years age bracket with 0.0% of them unmarried.
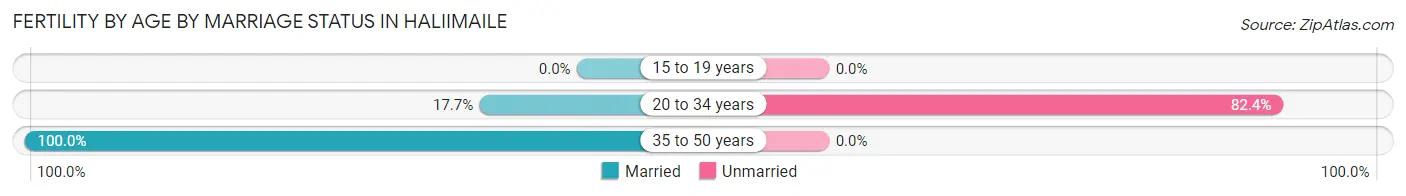
| Age Bracket | Married | Unmarried |
| 15 to 19 years | 0 (0.0%) | 0 (0.0%) |
| 20 to 34 years | 3 (17.6%) | 14 (82.4%) |
| 35 to 50 years | 20 (100.0%) | 0 (0.0%) |
| Total | 23 (62.2%) | 14 (37.8%) |
Fertility by Education in Haliimaile
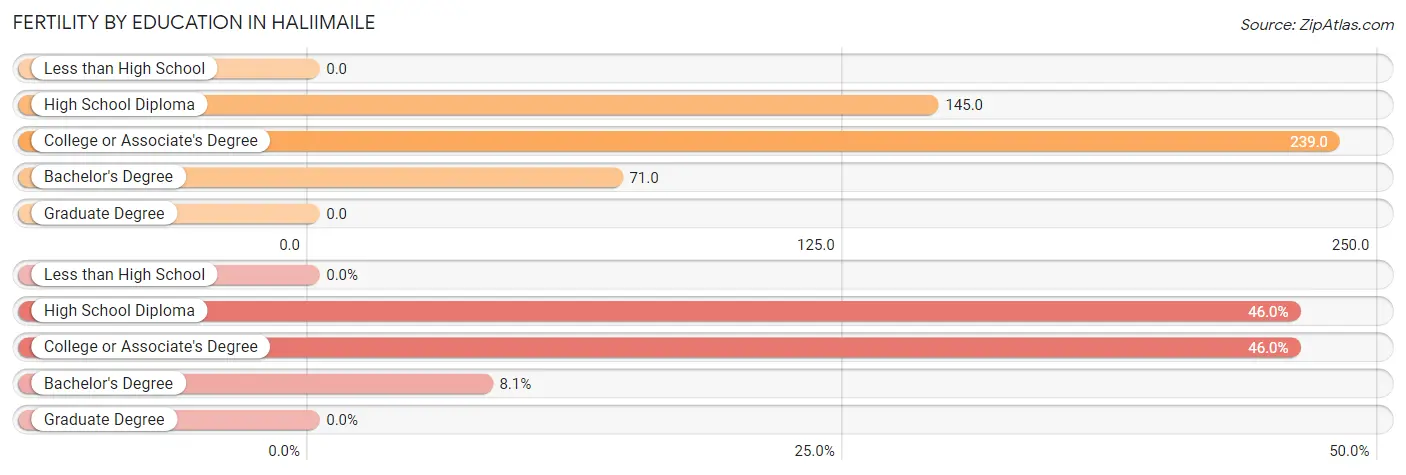
| Educational Attainment | Women with Births | Births / 1,000 Women |
| Less than High School | 0 (0.0%) | 0.0 |
| High School Diploma | 17 (46.0%) | 145.0 |
| College or Associate's Degree | 17 (46.0%) | 239.0 |
| Bachelor's Degree | 3 (8.1%) | 71.0 |
| Graduate Degree | 0 (0.0%) | 0.0 |
| Total | 37 (100.0%) | 133.0 |
Fertility by Education by Marriage Status in Haliimaile
37.8% of women with births in Haliimaile are unmarried. Women with the educational attainment of high school diploma are most likely to be married with 100.0% of them married at childbirth, while women with the educational attainment of college or associate's degree are least likely to be married with 82.4% of them unmarried at childbirth.
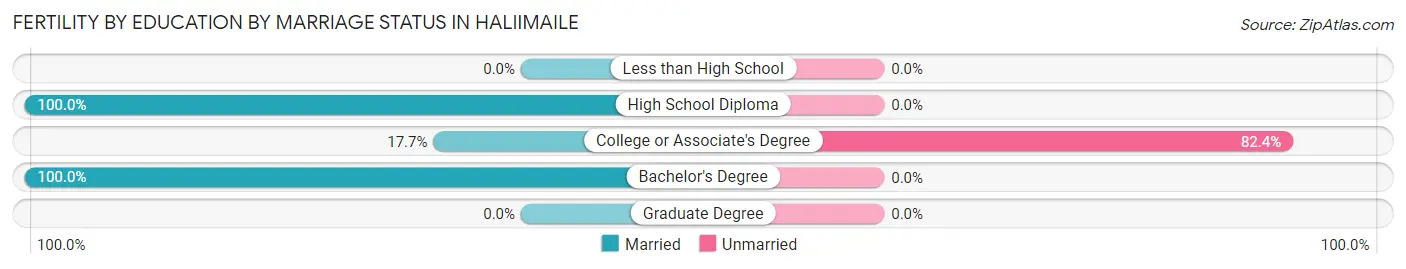
| Educational Attainment | Married | Unmarried |
| Less than High School | 0 (0.0%) | 0 (0.0%) |
| High School Diploma | 17 (100.0%) | 0 (0.0%) |
| College or Associate's Degree | 3 (17.6%) | 14 (82.4%) |
| Bachelor's Degree | 3 (100.0%) | 0 (0.0%) |
| Graduate Degree | 0 (0.0%) | 0 (0.0%) |
| Total | 23 (62.2%) | 14 (37.8%) |
Employment Characteristics in Haliimaile
Employment by Class of Employer in Haliimaile
Among the 399 employed individuals in Haliimaile, private company employees (283 | 70.9%), self-employed (not incorporated) (30 | 7.5%), and local government employees (28 | 7.0%) make up the most common classes of employment.
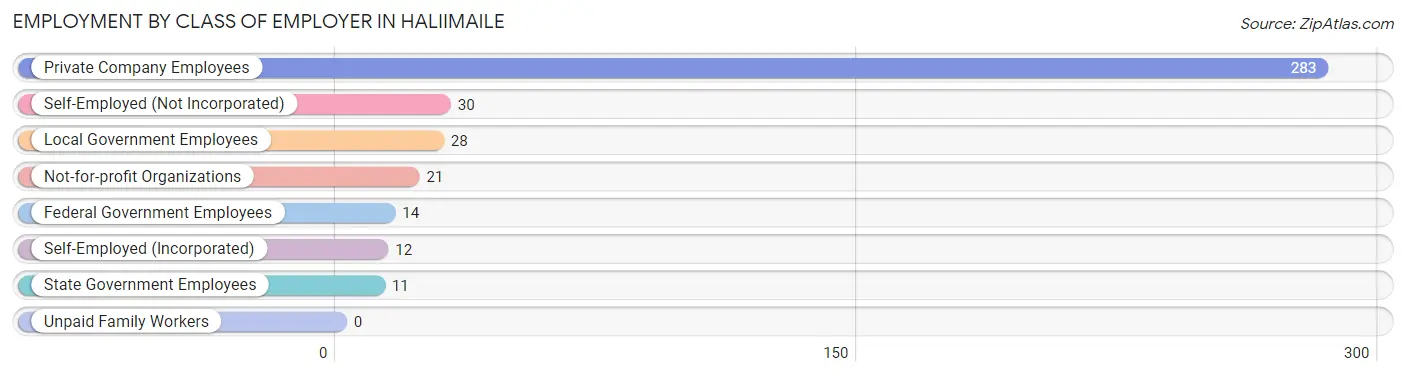
| Employer Class | # Employees | % Employees |
| Private Company Employees | 283 | 70.9% |
| Self-Employed (Incorporated) | 12 | 3.0% |
| Self-Employed (Not Incorporated) | 30 | 7.5% |
| Not-for-profit Organizations | 21 | 5.3% |
| Local Government Employees | 28 | 7.0% |
| State Government Employees | 11 | 2.8% |
| Federal Government Employees | 14 | 3.5% |
| Unpaid Family Workers | 0 | 0.0% |
| Total | 399 | 100.0% |
Employment Status by Age in Haliimaile
According to the labor force statistics for Haliimaile, out of the total population over 16 years of age (845), 55.4% or 468 individuals are in the labor force, with 9.3% or 44 of them unemployed. The age group with the highest labor force participation rate is 55 to 59 years, with 100.0% or 60 individuals in the labor force. Within the labor force, the 25 to 29 years age range has the highest percentage of unemployed individuals, with 29.7% or 22 of them being unemployed.
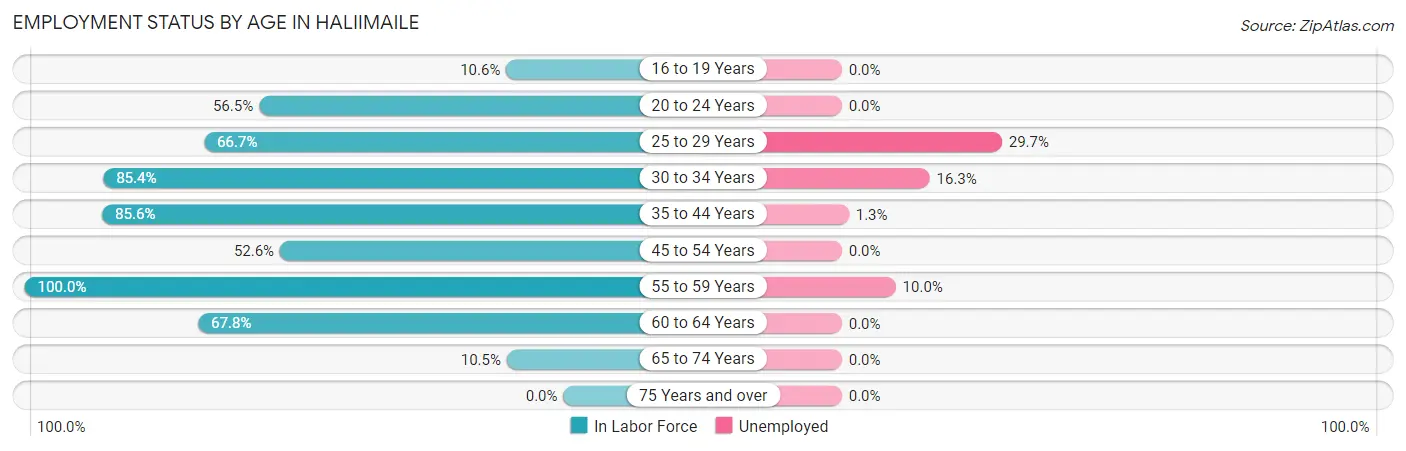
| Age Bracket | In Labor Force | Unemployed |
| 16 to 19 Years | 7 (10.6%) | 0 (0.0%) |
| 20 to 24 Years | 26 (56.5%) | 0 (0.0%) |
| 25 to 29 Years | 74 (66.7%) | 22 (29.7%) |
| 30 to 34 Years | 88 (85.4%) | 14 (16.3%) |
| 35 to 44 Years | 83 (85.6%) | 1 (1.3%) |
| 45 to 54 Years | 80 (52.6%) | 0 (0.0%) |
| 55 to 59 Years | 60 (100.0%) | 6 (10.0%) |
| 60 to 64 Years | 40 (67.8%) | 0 (0.0%) |
| 65 to 74 Years | 10 (10.5%) | 0 (0.0%) |
| 75 Years and over | 0 (0.0%) | 0 (0.0%) |
| Total | 468 (55.4%) | 44 (9.3%) |
Employment Status by Educational Attainment in Haliimaile
According to labor force statistics for Haliimaile, 73.0% of individuals (425) out of the total population between 25 and 64 years of age (582) are in the labor force, with 10.3% or 44 of them being unemployed. The group with the highest labor force participation rate are those with the educational attainment of less than high school, with 94.3% or 50 individuals in the labor force. Within the labor force, individuals with high school diploma education have the highest percentage of unemployment, with 17.5% or 34 of them being unemployed.
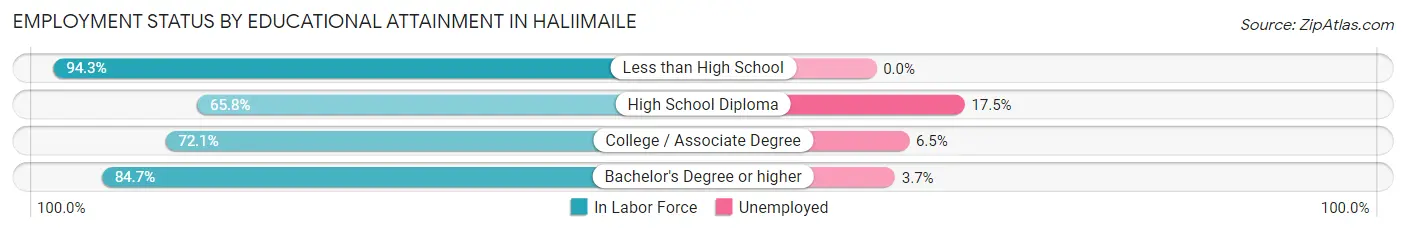
| Educational Attainment | In Labor Force | Unemployed |
| Less than High School | 50 (94.3%) | 0 (0.0%) |
| High School Diploma | 194 (65.8%) | 52 (17.5%) |
| College / Associate Degree | 98 (72.1%) | 9 (6.5%) |
| Bachelor's Degree or higher | 83 (84.7%) | 4 (3.7%) |
| Total | 425 (73.0%) | 60 (10.3%) |
Employment Occupations by Sex in Haliimaile
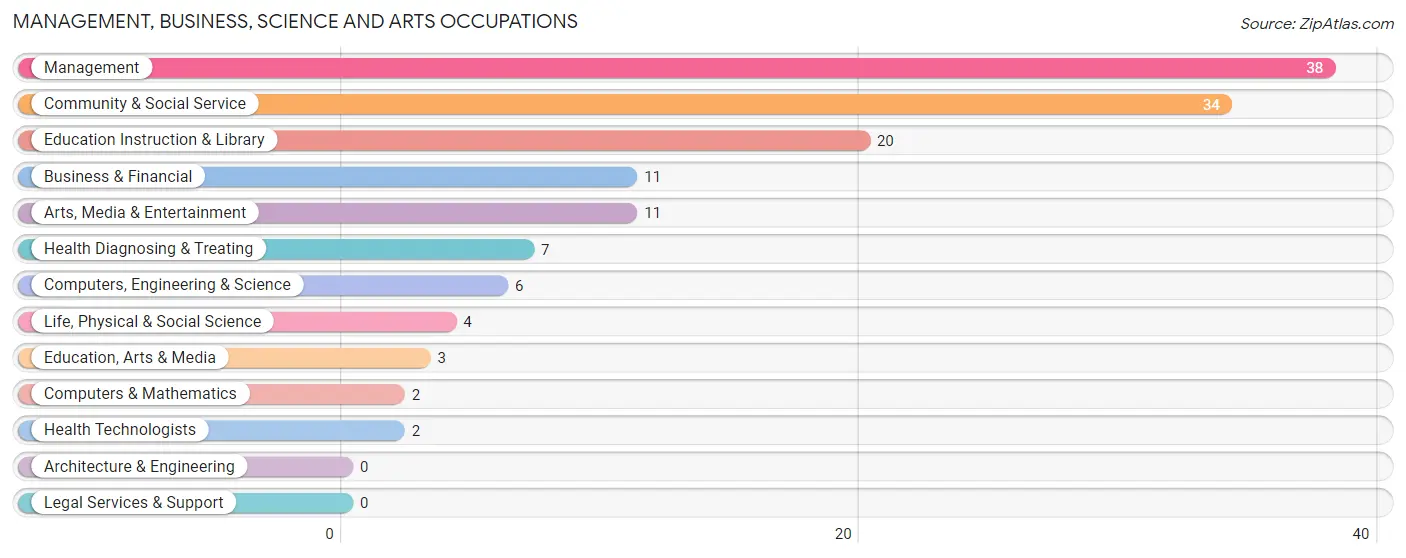
Management, Business, Science and Arts Occupations
The most common Management, Business, Science and Arts occupations in Haliimaile are Management (38 | 9.1%), Community & Social Service (34 | 8.1%), Education Instruction & Library (20 | 4.8%), Business & Financial (11 | 2.6%), and Arts, Media & Entertainment (11 | 2.6%).
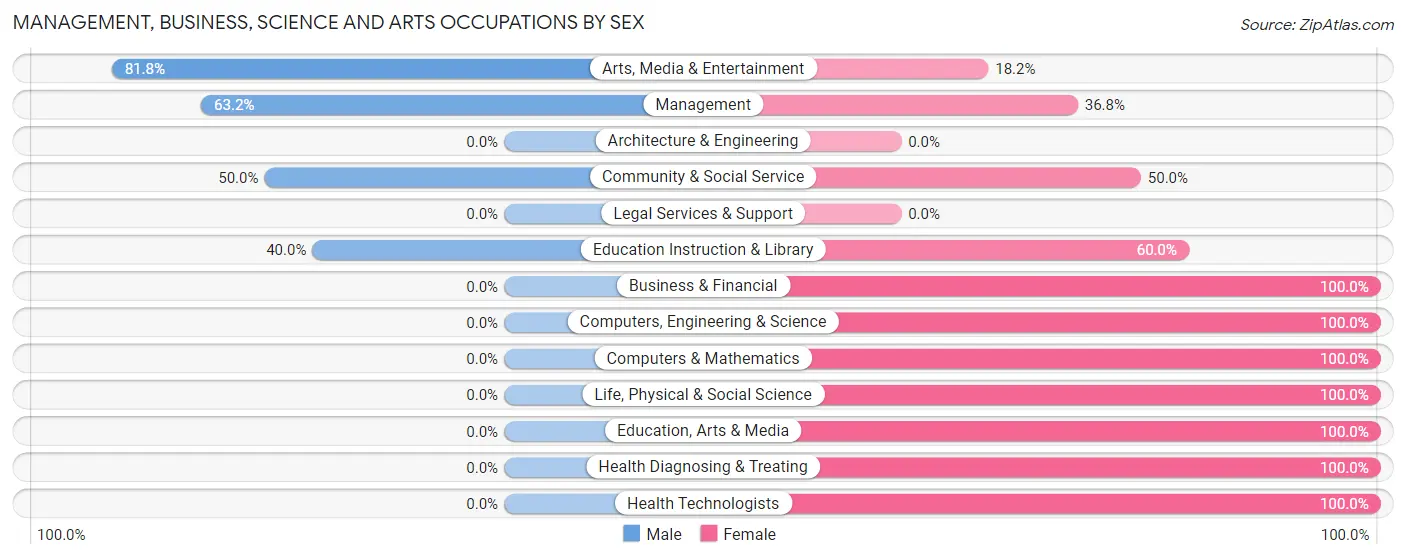
Management, Business, Science and Arts Occupations by Sex
Within the Management, Business, Science and Arts occupations in Haliimaile, the most male-oriented occupations are Arts, Media & Entertainment (81.8%), Management (63.2%), and Community & Social Service (50.0%), while the most female-oriented occupations are Business & Financial (100.0%), Computers, Engineering & Science (100.0%), and Computers & Mathematics (100.0%).
| Occupation | Male | Female |
| Management | 24 (63.2%) | 14 (36.8%) |
| Business & Financial | 0 (0.0%) | 11 (100.0%) |
| Computers, Engineering & Science | 0 (0.0%) | 6 (100.0%) |
| Computers & Mathematics | 0 (0.0%) | 2 (100.0%) |
| Architecture & Engineering | 0 (0.0%) | 0 (0.0%) |
| Life, Physical & Social Science | 0 (0.0%) | 4 (100.0%) |
| Community & Social Service | 17 (50.0%) | 17 (50.0%) |
| Education, Arts & Media | 0 (0.0%) | 3 (100.0%) |
| Legal Services & Support | 0 (0.0%) | 0 (0.0%) |
| Education Instruction & Library | 8 (40.0%) | 12 (60.0%) |
| Arts, Media & Entertainment | 9 (81.8%) | 2 (18.2%) |
| Health Diagnosing & Treating | 0 (0.0%) | 7 (100.0%) |
| Health Technologists | 0 (0.0%) | 2 (100.0%) |
| Total (Category) | 41 (42.7%) | 55 (57.3%) |
| Total (Overall) | 254 (60.8%) | 164 (39.2%) |
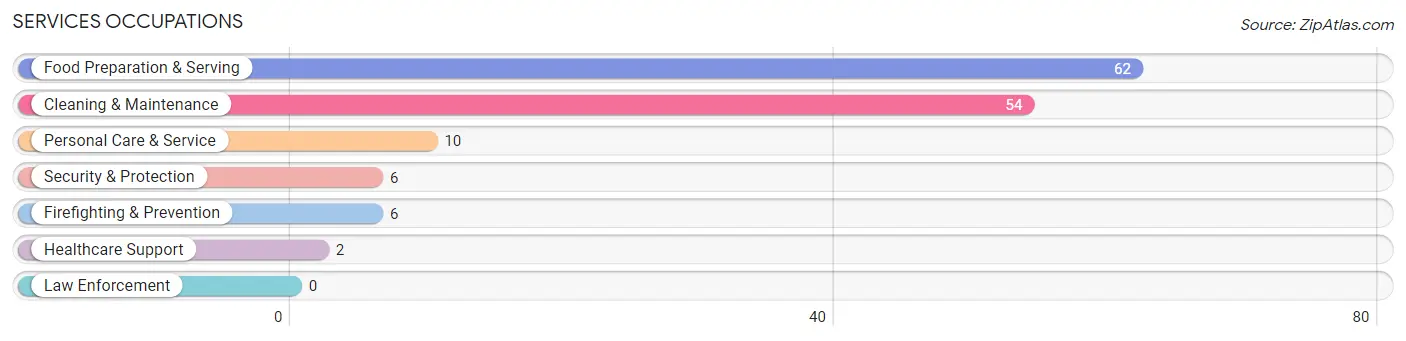
Services Occupations
The most common Services occupations in Haliimaile are Food Preparation & Serving (62 | 14.8%), Cleaning & Maintenance (54 | 12.9%), Personal Care & Service (10 | 2.4%), Security & Protection (6 | 1.4%), and Firefighting & Prevention (6 | 1.4%).
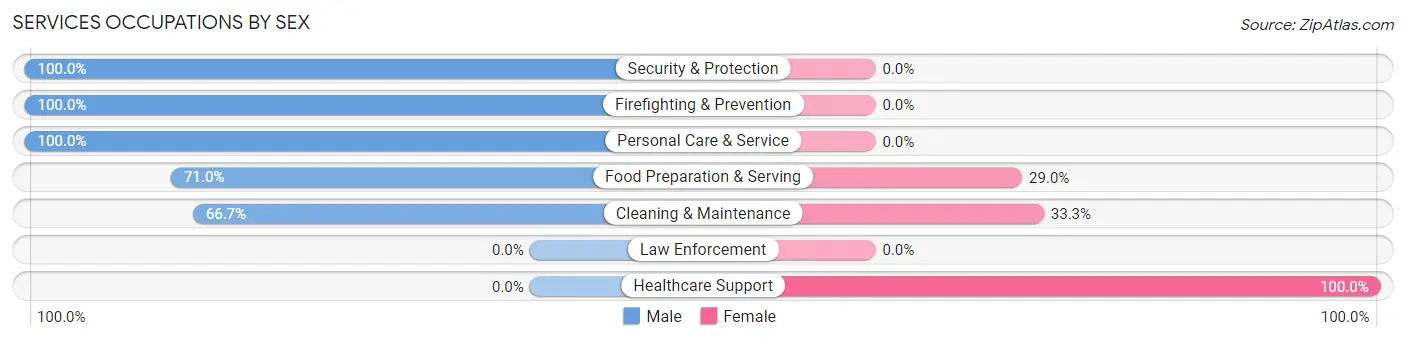
Services Occupations by Sex
Within the Services occupations in Haliimaile, the most male-oriented occupations are Security & Protection (100.0%), Firefighting & Prevention (100.0%), and Personal Care & Service (100.0%), while the most female-oriented occupations are Healthcare Support (100.0%), Cleaning & Maintenance (33.3%), and Food Preparation & Serving (29.0%).
| Occupation | Male | Female |
| Healthcare Support | 0 (0.0%) | 2 (100.0%) |
| Security & Protection | 6 (100.0%) | 0 (0.0%) |
| Firefighting & Prevention | 6 (100.0%) | 0 (0.0%) |
| Law Enforcement | 0 (0.0%) | 0 (0.0%) |
| Food Preparation & Serving | 44 (71.0%) | 18 (29.0%) |
| Cleaning & Maintenance | 36 (66.7%) | 18 (33.3%) |
| Personal Care & Service | 10 (100.0%) | 0 (0.0%) |
| Total (Category) | 96 (71.6%) | 38 (28.4%) |
| Total (Overall) | 254 (60.8%) | 164 (39.2%) |
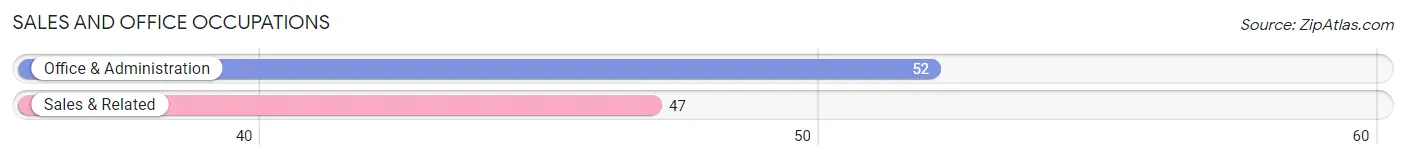
Sales and Office Occupations
The most common Sales and Office occupations in Haliimaile are Office & Administration (52 | 12.4%), and Sales & Related (47 | 11.2%).
Sales and Office Occupations by Sex
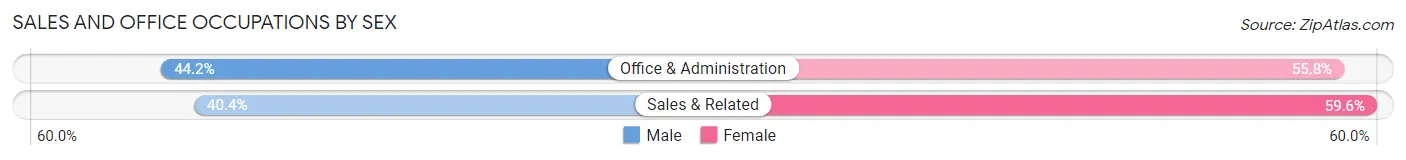
| Occupation | Male | Female |
| Sales & Related | 19 (40.4%) | 28 (59.6%) |
| Office & Administration | 23 (44.2%) | 29 (55.8%) |
| Total (Category) | 42 (42.4%) | 57 (57.6%) |
| Total (Overall) | 254 (60.8%) | 164 (39.2%) |
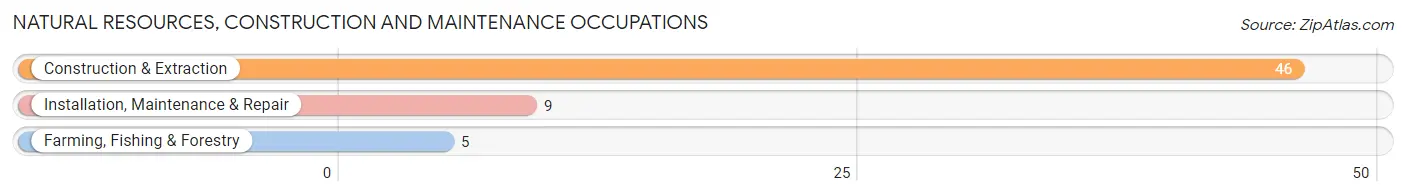
Natural Resources, Construction and Maintenance Occupations
The most common Natural Resources, Construction and Maintenance occupations in Haliimaile are Construction & Extraction (46 | 11.0%), Installation, Maintenance & Repair (9 | 2.1%), and Farming, Fishing & Forestry (5 | 1.2%).
Natural Resources, Construction and Maintenance Occupations by Sex
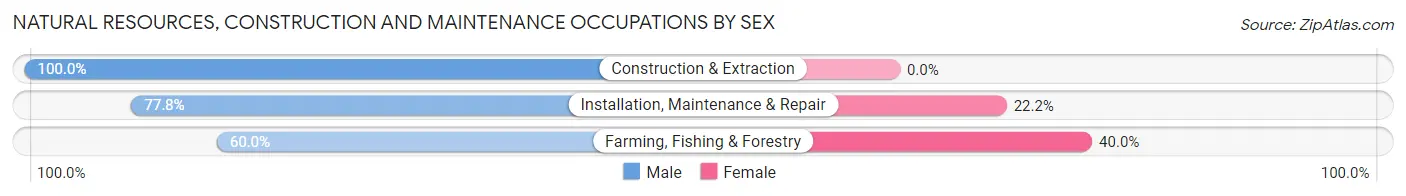
| Occupation | Male | Female |
| Farming, Fishing & Forestry | 3 (60.0%) | 2 (40.0%) |
| Construction & Extraction | 46 (100.0%) | 0 (0.0%) |
| Installation, Maintenance & Repair | 7 (77.8%) | 2 (22.2%) |
| Total (Category) | 56 (93.3%) | 4 (6.7%) |
| Total (Overall) | 254 (60.8%) | 164 (39.2%) |
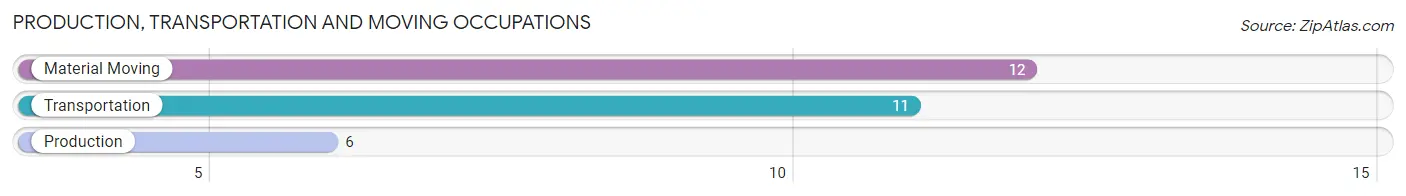
Production, Transportation and Moving Occupations
The most common Production, Transportation and Moving occupations in Haliimaile are Material Moving (12 | 2.9%), Transportation (11 | 2.6%), and Production (6 | 1.4%).
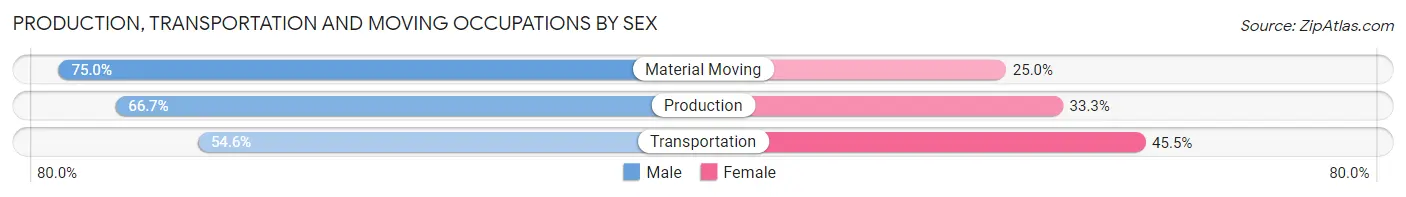
Production, Transportation and Moving Occupations by Sex
| Occupation | Male | Female |
| Production | 4 (66.7%) | 2 (33.3%) |
| Transportation | 6 (54.5%) | 5 (45.5%) |
| Material Moving | 9 (75.0%) | 3 (25.0%) |
| Total (Category) | 19 (65.5%) | 10 (34.5%) |
| Total (Overall) | 254 (60.8%) | 164 (39.2%) |
Employment Industries by Sex in Haliimaile
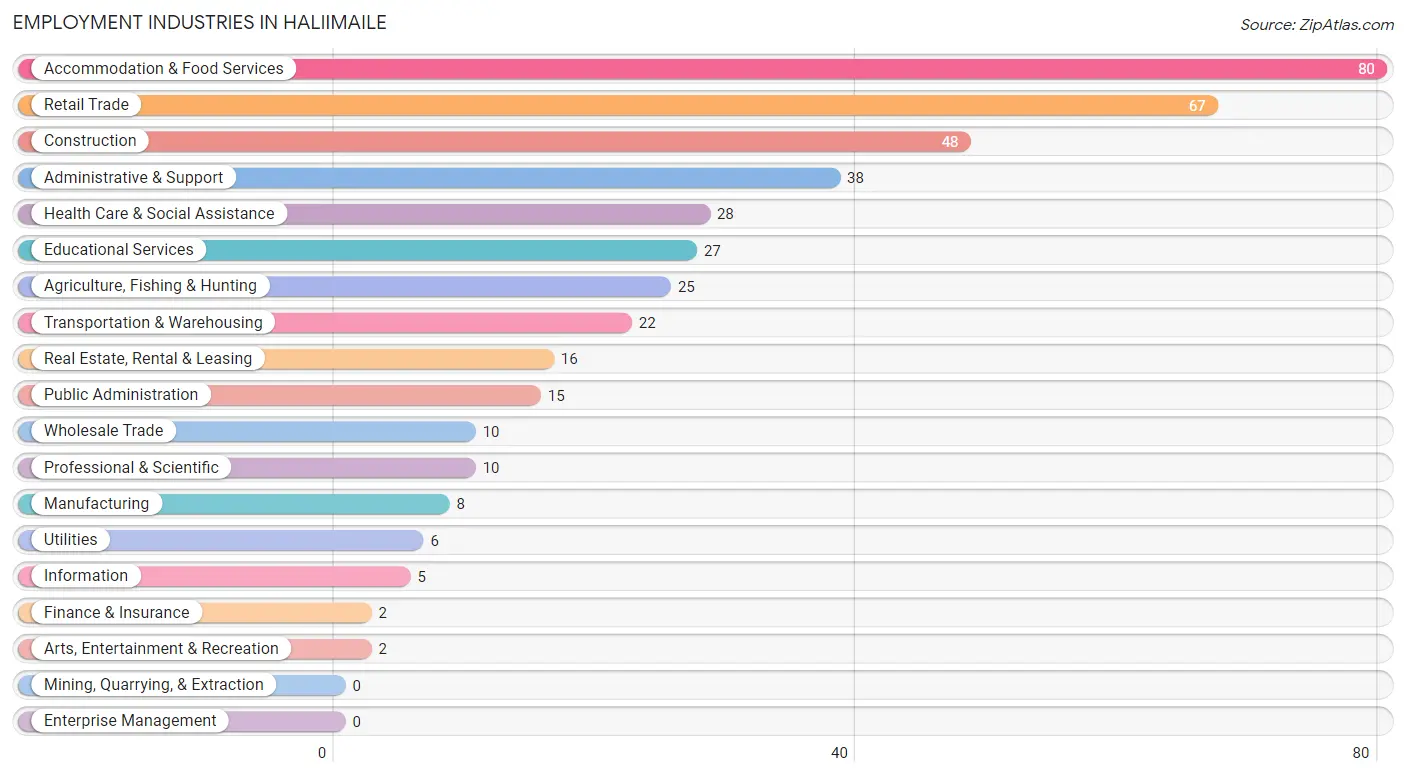
Employment Industries in Haliimaile
The major employment industries in Haliimaile include Accommodation & Food Services (80 | 19.1%), Retail Trade (67 | 16.0%), Construction (48 | 11.5%), Administrative & Support (38 | 9.1%), and Health Care & Social Assistance (28 | 6.7%).
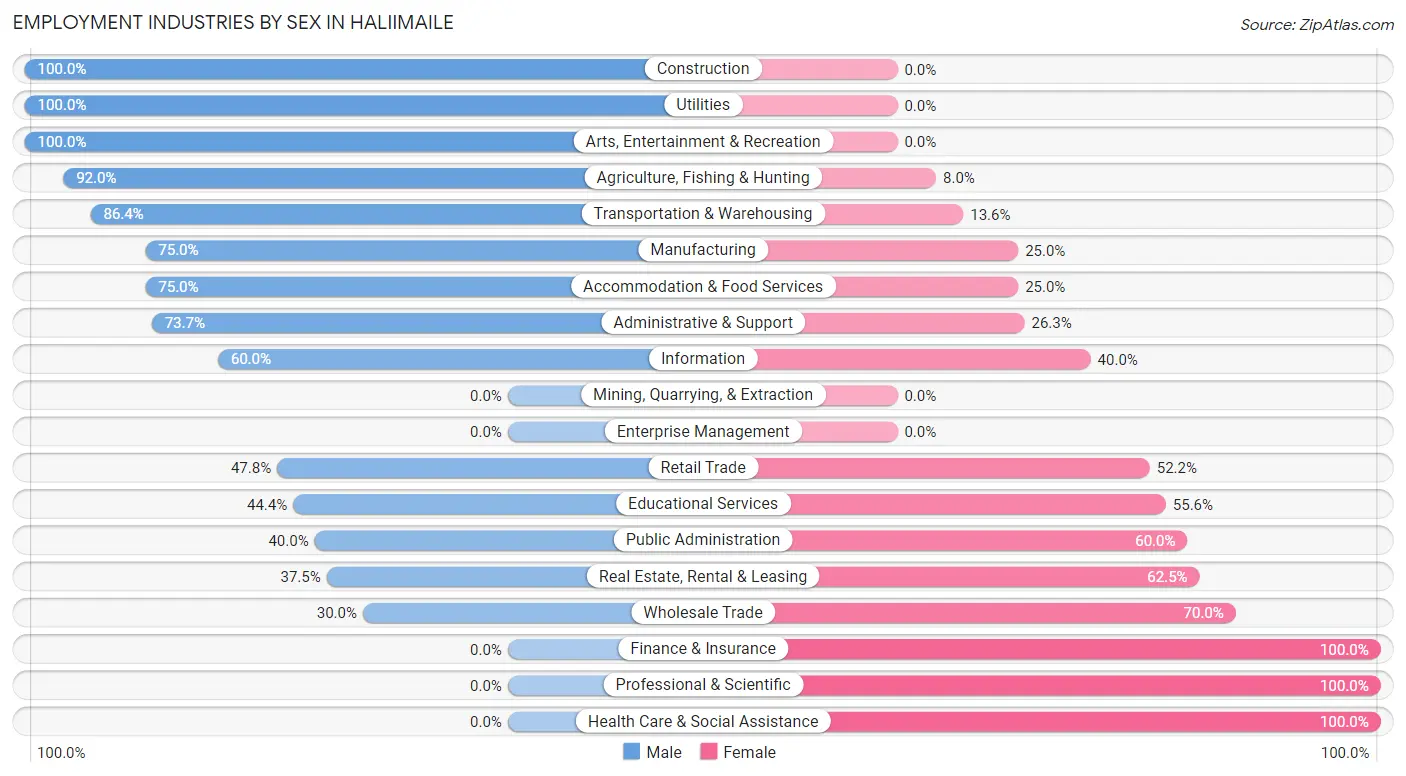
Employment Industries by Sex in Haliimaile
The Haliimaile industries that see more men than women are Construction (100.0%), Utilities (100.0%), and Arts, Entertainment & Recreation (100.0%), whereas the industries that tend to have a higher number of women are Finance & Insurance (100.0%), Professional & Scientific (100.0%), and Health Care & Social Assistance (100.0%).
| Industry | Male | Female |
| Agriculture, Fishing & Hunting | 23 (92.0%) | 2 (8.0%) |
| Mining, Quarrying, & Extraction | 0 (0.0%) | 0 (0.0%) |
| Construction | 48 (100.0%) | 0 (0.0%) |
| Manufacturing | 6 (75.0%) | 2 (25.0%) |
| Wholesale Trade | 3 (30.0%) | 7 (70.0%) |
| Retail Trade | 32 (47.8%) | 35 (52.2%) |
| Transportation & Warehousing | 19 (86.4%) | 3 (13.6%) |
| Utilities | 6 (100.0%) | 0 (0.0%) |
| Information | 3 (60.0%) | 2 (40.0%) |
| Finance & Insurance | 0 (0.0%) | 2 (100.0%) |
| Real Estate, Rental & Leasing | 6 (37.5%) | 10 (62.5%) |
| Professional & Scientific | 0 (0.0%) | 10 (100.0%) |
| Enterprise Management | 0 (0.0%) | 0 (0.0%) |
| Administrative & Support | 28 (73.7%) | 10 (26.3%) |
| Educational Services | 12 (44.4%) | 15 (55.6%) |
| Health Care & Social Assistance | 0 (0.0%) | 28 (100.0%) |
| Arts, Entertainment & Recreation | 2 (100.0%) | 0 (0.0%) |
| Accommodation & Food Services | 60 (75.0%) | 20 (25.0%) |
| Public Administration | 6 (40.0%) | 9 (60.0%) |
| Total | 254 (60.8%) | 164 (39.2%) |
Education in Haliimaile
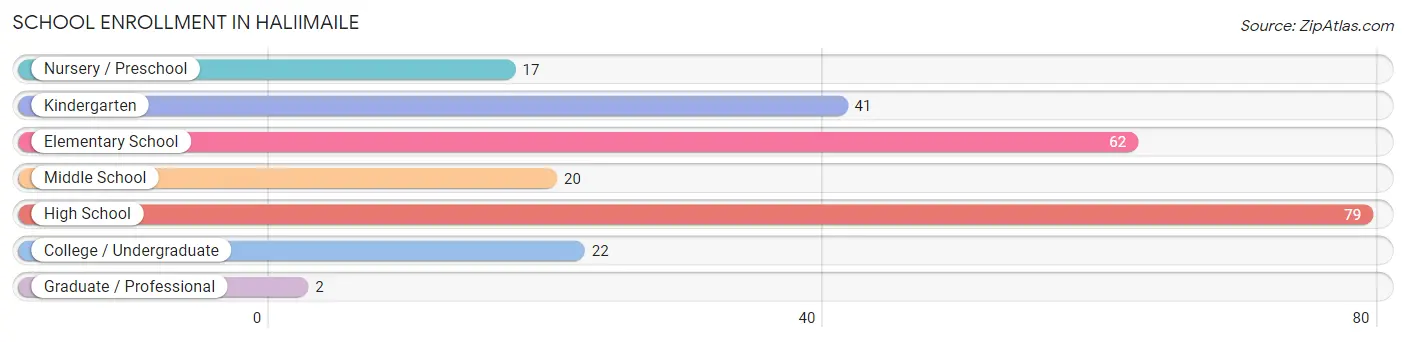
School Enrollment in Haliimaile
The most common levels of schooling among the 243 students in Haliimaile are high school (79 | 32.5%), elementary school (62 | 25.5%), and kindergarten (41 | 16.9%).
| School Level | # Students | % Students |
| Nursery / Preschool | 17 | 7.0% |
| Kindergarten | 41 | 16.9% |
| Elementary School | 62 | 25.5% |
| Middle School | 20 | 8.2% |
| High School | 79 | 32.5% |
| College / Undergraduate | 22 | 9.0% |
| Graduate / Professional | 2 | 0.8% |
| Total | 243 | 100.0% |
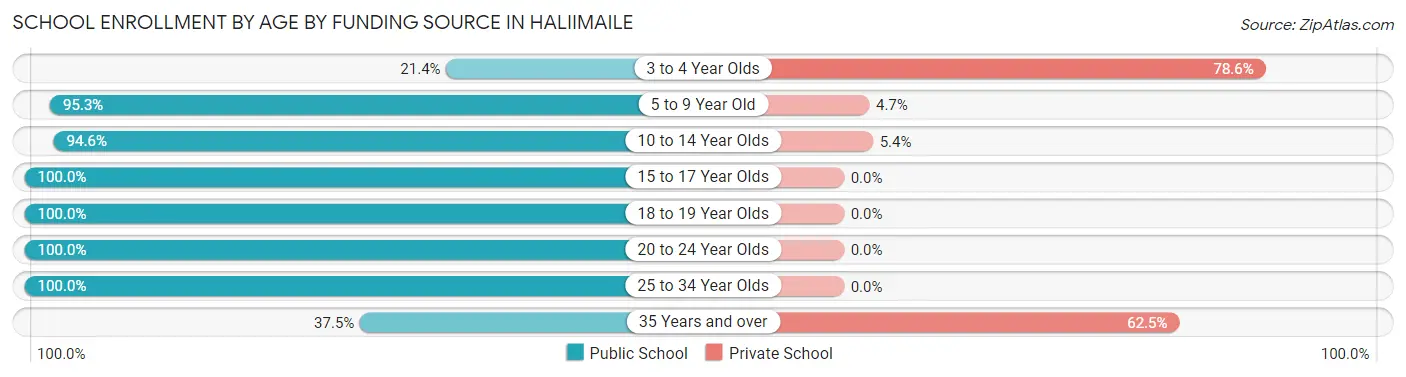
School Enrollment by Age by Funding Source in Haliimaile
Out of a total of 243 students who are enrolled in schools in Haliimaile, 23 (9.5%) attend a private institution, while the remaining 220 (90.5%) are enrolled in public schools. The age group of 3 to 4 year olds has the highest likelihood of being enrolled in private schools, with 11 (78.6% in the age bracket) enrolled. Conversely, the age group of 15 to 17 year olds has the lowest likelihood of being enrolled in a private school, with 50 (100.0% in the age bracket) attending a public institution.
| Age Bracket | Public School | Private School |
| 3 to 4 Year Olds | 3 (21.4%) | 11 (78.6%) |
| 5 to 9 Year Old | 101 (95.3%) | 5 (4.7%) |
| 10 to 14 Year Olds | 35 (94.6%) | 2 (5.4%) |
| 15 to 17 Year Olds | 50 (100.0%) | 0 (0.0%) |
| 18 to 19 Year Olds | 15 (100.0%) | 0 (0.0%) |
| 20 to 24 Year Olds | 10 (100.0%) | 0 (0.0%) |
| 25 to 34 Year Olds | 3 (100.0%) | 0 (0.0%) |
| 35 Years and over | 3 (37.5%) | 5 (62.5%) |
| Total | 220 (90.5%) | 23 (9.5%) |
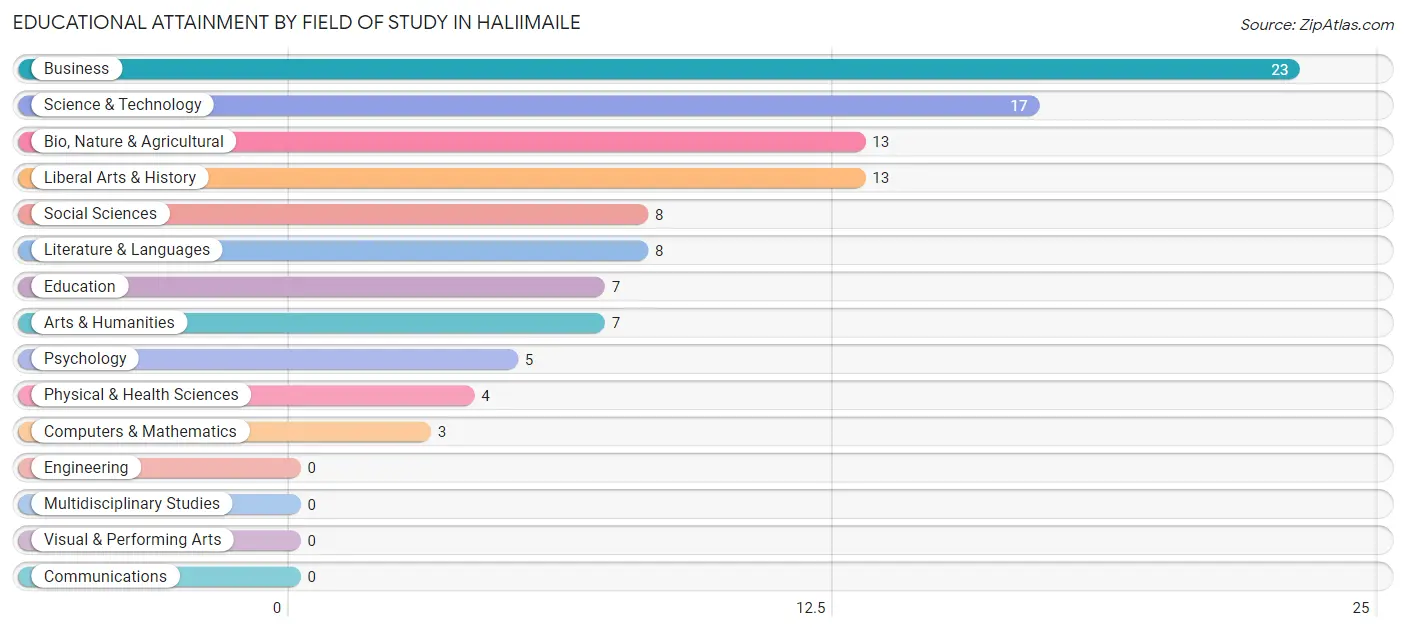
Educational Attainment by Field of Study in Haliimaile
Business (23 | 21.3%), science & technology (17 | 15.7%), bio, nature & agricultural (13 | 12.0%), liberal arts & history (13 | 12.0%), and social sciences (8 | 7.4%) are the most common fields of study among 108 individuals in Haliimaile who have obtained a bachelor's degree or higher.
| Field of Study | # Graduates | % Graduates |
| Computers & Mathematics | 3 | 2.8% |
| Bio, Nature & Agricultural | 13 | 12.0% |
| Physical & Health Sciences | 4 | 3.7% |
| Psychology | 5 | 4.6% |
| Social Sciences | 8 | 7.4% |
| Engineering | 0 | 0.0% |
| Multidisciplinary Studies | 0 | 0.0% |
| Science & Technology | 17 | 15.7% |
| Business | 23 | 21.3% |
| Education | 7 | 6.5% |
| Literature & Languages | 8 | 7.4% |
| Liberal Arts & History | 13 | 12.0% |
| Visual & Performing Arts | 0 | 0.0% |
| Communications | 0 | 0.0% |
| Arts & Humanities | 7 | 6.5% |
| Total | 108 | 100.0% |
Transportation & Commute in Haliimaile
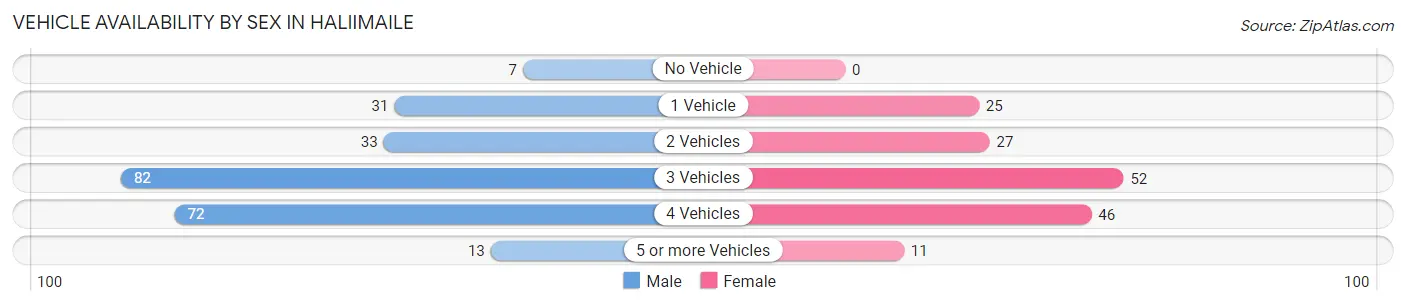
Vehicle Availability by Sex in Haliimaile
The most prevalent vehicle ownership categories in Haliimaile are males with 3 vehicles (82, accounting for 34.4%) and females with 3 vehicles (52, making up 50.9%).
| Vehicles Available | Male | Female |
| No Vehicle | 7 (2.9%) | 0 (0.0%) |
| 1 Vehicle | 31 (13.0%) | 25 (15.5%) |
| 2 Vehicles | 33 (13.9%) | 27 (16.8%) |
| 3 Vehicles | 82 (34.4%) | 52 (32.3%) |
| 4 Vehicles | 72 (30.2%) | 46 (28.6%) |
| 5 or more Vehicles | 13 (5.5%) | 11 (6.8%) |
| Total | 238 (100.0%) | 161 (100.0%) |
Commute Time in Haliimaile
The most frequently occuring commute durations in Haliimaile are 30 to 34 minutes (76 commuters, 20.1%), 20 to 24 minutes (66 commuters, 17.5%), and 15 to 19 minutes (50 commuters, 13.2%).
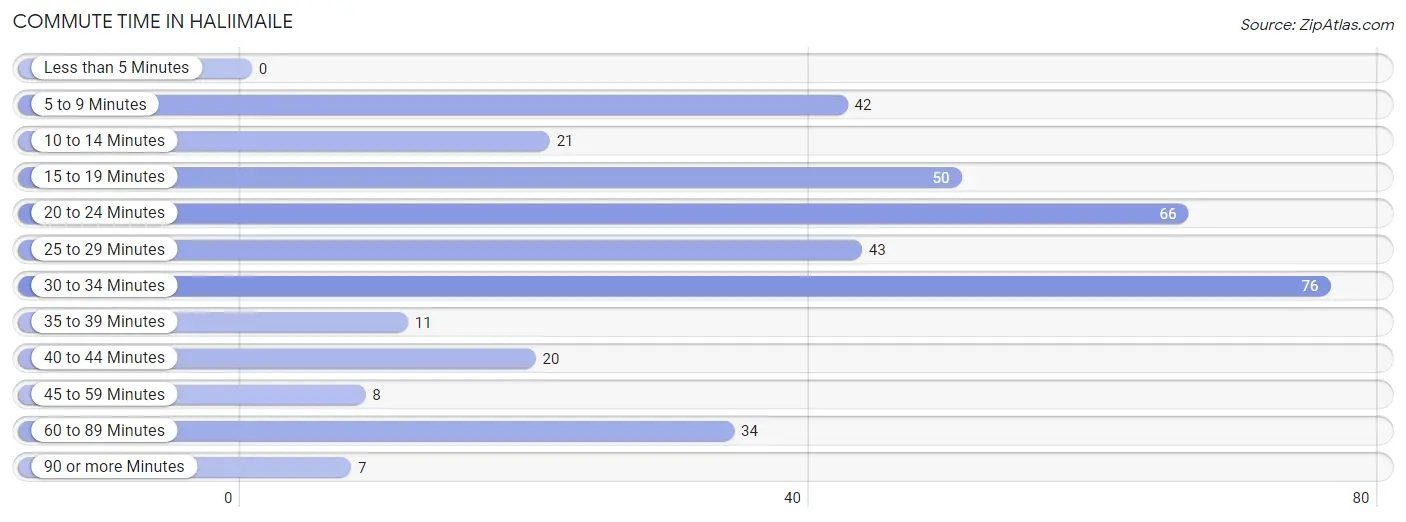
| Commute Time | # Commuters | % Commuters |
| Less than 5 Minutes | 0 | 0.0% |
| 5 to 9 Minutes | 42 | 11.1% |
| 10 to 14 Minutes | 21 | 5.6% |
| 15 to 19 Minutes | 50 | 13.2% |
| 20 to 24 Minutes | 66 | 17.5% |
| 25 to 29 Minutes | 43 | 11.4% |
| 30 to 34 Minutes | 76 | 20.1% |
| 35 to 39 Minutes | 11 | 2.9% |
| 40 to 44 Minutes | 20 | 5.3% |
| 45 to 59 Minutes | 8 | 2.1% |
| 60 to 89 Minutes | 34 | 9.0% |
| 90 or more Minutes | 7 | 1.8% |
Commute Time by Sex in Haliimaile
The most common commute times in Haliimaile are 30 to 34 minutes (60 commuters, 26.9%) for males and 20 to 24 minutes (32 commuters, 20.6%) for females.
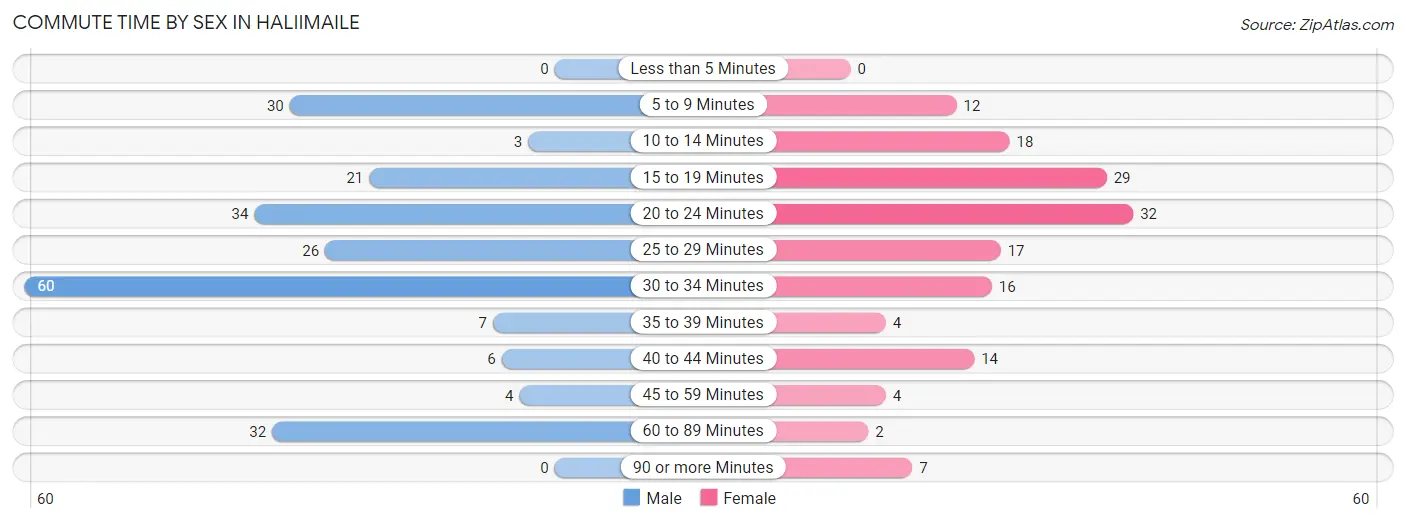
| Commute Time | Male | Female |
| Less than 5 Minutes | 0 (0.0%) | 0 (0.0%) |
| 5 to 9 Minutes | 30 (13.5%) | 12 (7.7%) |
| 10 to 14 Minutes | 3 (1.3%) | 18 (11.6%) |
| 15 to 19 Minutes | 21 (9.4%) | 29 (18.7%) |
| 20 to 24 Minutes | 34 (15.2%) | 32 (20.6%) |
| 25 to 29 Minutes | 26 (11.7%) | 17 (11.0%) |
| 30 to 34 Minutes | 60 (26.9%) | 16 (10.3%) |
| 35 to 39 Minutes | 7 (3.1%) | 4 (2.6%) |
| 40 to 44 Minutes | 6 (2.7%) | 14 (9.0%) |
| 45 to 59 Minutes | 4 (1.8%) | 4 (2.6%) |
| 60 to 89 Minutes | 32 (14.3%) | 2 (1.3%) |
| 90 or more Minutes | 0 (0.0%) | 7 (4.5%) |
Time of Departure to Work by Sex in Haliimaile
The most frequent times of departure to work in Haliimaile are 6:00 AM to 6:29 AM (62, 27.8%) for males and 6:30 AM to 6:59 AM (24, 15.5%) for females.
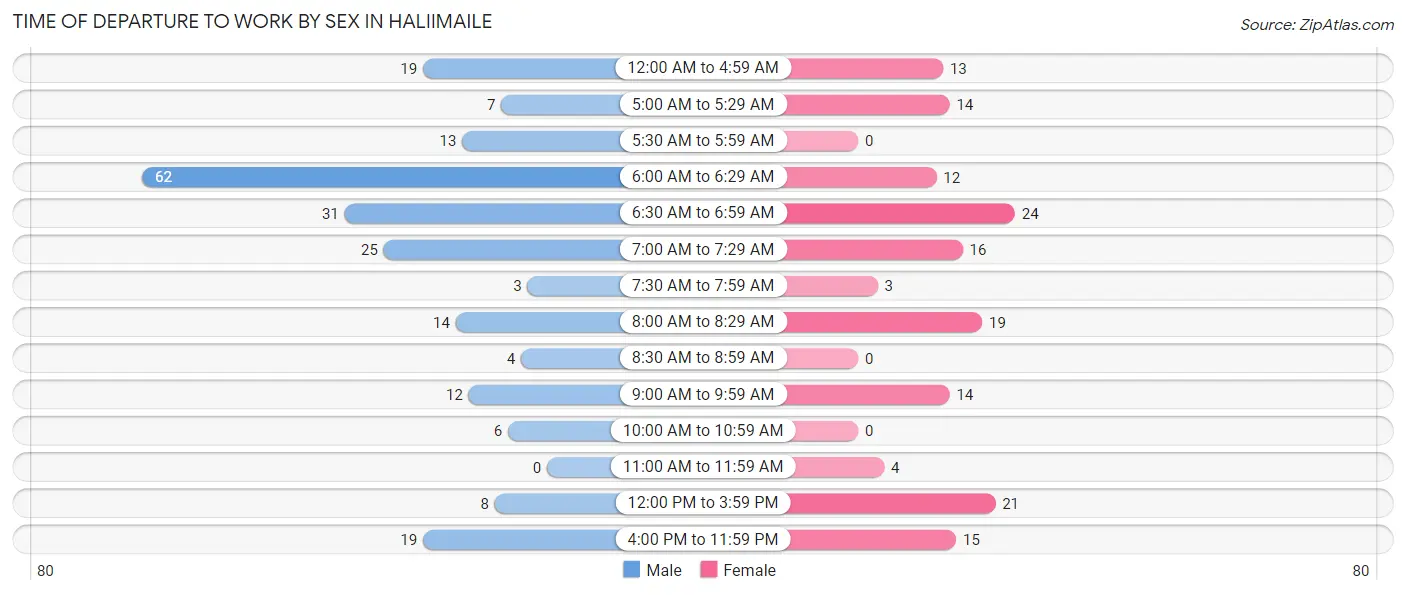
| Time of Departure | Male | Female |
| 12:00 AM to 4:59 AM | 19 (8.5%) | 13 (8.4%) |
| 5:00 AM to 5:29 AM | 7 (3.1%) | 14 (9.0%) |
| 5:30 AM to 5:59 AM | 13 (5.8%) | 0 (0.0%) |
| 6:00 AM to 6:29 AM | 62 (27.8%) | 12 (7.7%) |
| 6:30 AM to 6:59 AM | 31 (13.9%) | 24 (15.5%) |
| 7:00 AM to 7:29 AM | 25 (11.2%) | 16 (10.3%) |
| 7:30 AM to 7:59 AM | 3 (1.3%) | 3 (1.9%) |
| 8:00 AM to 8:29 AM | 14 (6.3%) | 19 (12.3%) |
| 8:30 AM to 8:59 AM | 4 (1.8%) | 0 (0.0%) |
| 9:00 AM to 9:59 AM | 12 (5.4%) | 14 (9.0%) |
| 10:00 AM to 10:59 AM | 6 (2.7%) | 0 (0.0%) |
| 11:00 AM to 11:59 AM | 0 (0.0%) | 4 (2.6%) |
| 12:00 PM to 3:59 PM | 8 (3.6%) | 21 (13.6%) |
| 4:00 PM to 11:59 PM | 19 (8.5%) | 15 (9.7%) |
| Total | 223 (100.0%) | 155 (100.0%) |
Housing Occupancy in Haliimaile
Occupancy by Ownership in Haliimaile
Of the total 321 dwellings in Haliimaile, owner-occupied units account for 192 (59.8%), while renter-occupied units make up 129 (40.2%).
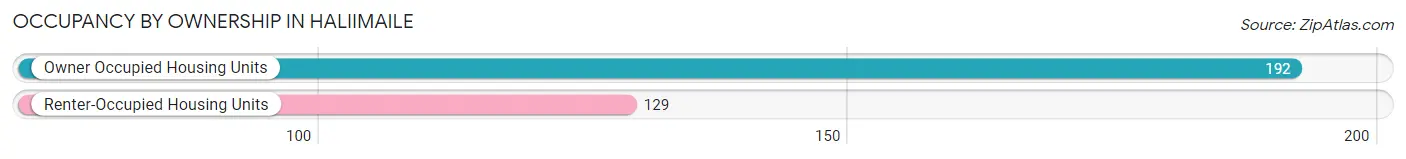
| Occupancy | # Housing Units | % Housing Units |
| Owner Occupied Housing Units | 192 | 59.8% |
| Renter-Occupied Housing Units | 129 | 40.2% |
| Total Occupied Housing Units | 321 | 100.0% |
Occupancy by Household Size in Haliimaile
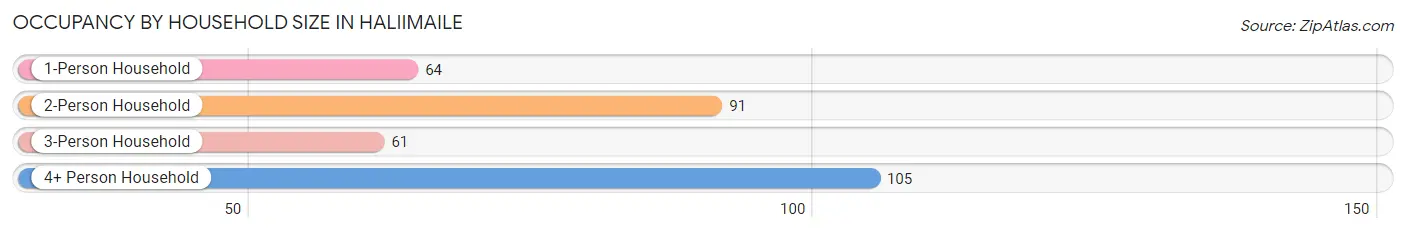
| Household Size | # Housing Units | % Housing Units |
| 1-Person Household | 64 | 19.9% |
| 2-Person Household | 91 | 28.3% |
| 3-Person Household | 61 | 19.0% |
| 4+ Person Household | 105 | 32.7% |
| Total Housing Units | 321 | 100.0% |
Occupancy by Ownership by Household Size in Haliimaile
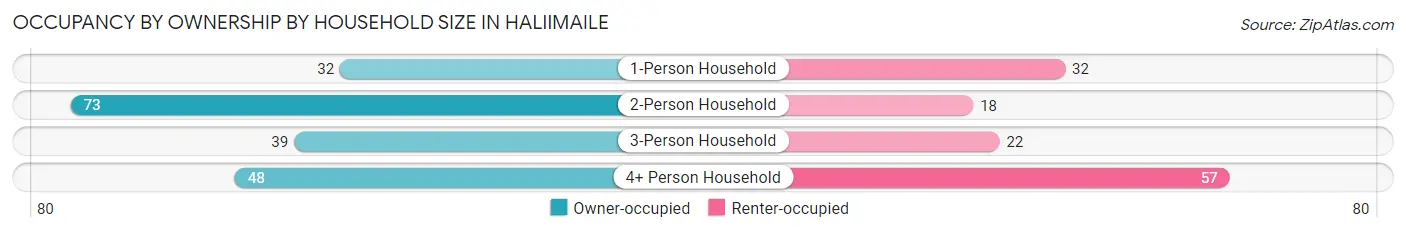
| Household Size | Owner-occupied | Renter-occupied |
| 1-Person Household | 32 (50.0%) | 32 (50.0%) |
| 2-Person Household | 73 (80.2%) | 18 (19.8%) |
| 3-Person Household | 39 (63.9%) | 22 (36.1%) |
| 4+ Person Household | 48 (45.7%) | 57 (54.3%) |
| Total Housing Units | 192 (59.8%) | 129 (40.2%) |
Occupancy by Educational Attainment in Haliimaile
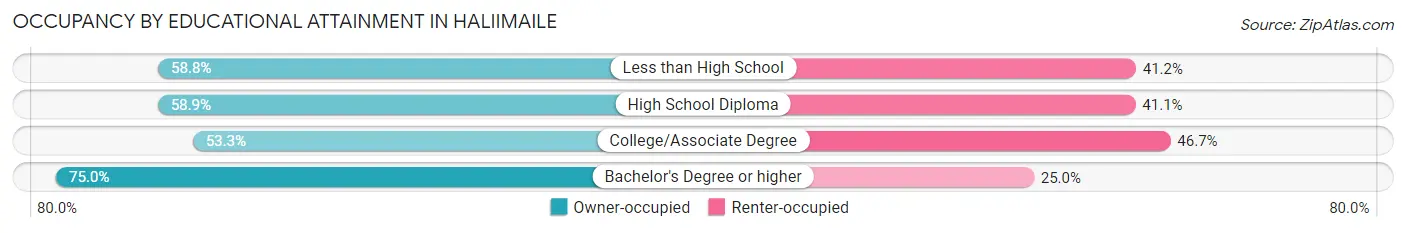
| Household Size | Owner-occupied | Renter-occupied |
| Less than High School | 20 (58.8%) | 14 (41.2%) |
| High School Diploma | 63 (58.9%) | 44 (41.1%) |
| College/Associate Degree | 64 (53.3%) | 56 (46.7%) |
| Bachelor's Degree or higher | 45 (75.0%) | 15 (25.0%) |
Occupancy by Age of Householder in Haliimaile
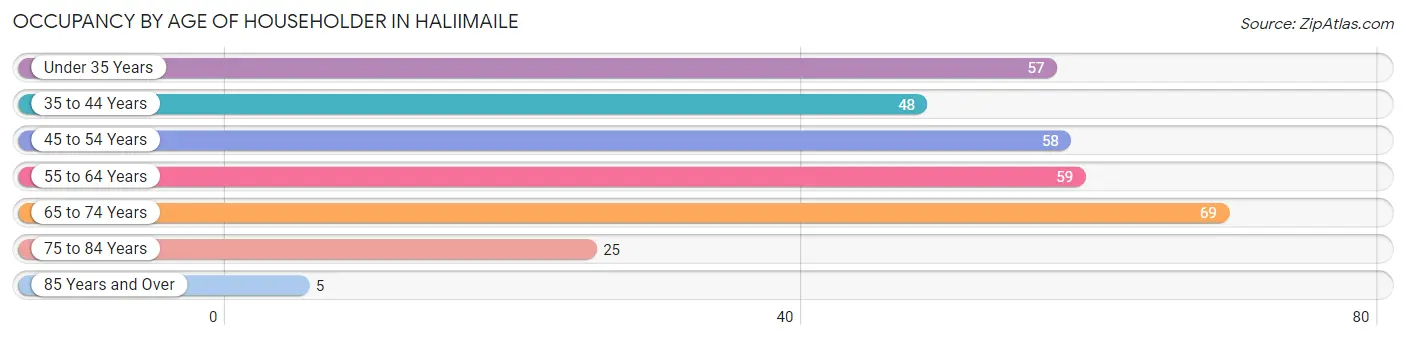
| Age Bracket | # Households | % Households |
| Under 35 Years | 57 | 17.8% |
| 35 to 44 Years | 48 | 14.9% |
| 45 to 54 Years | 58 | 18.1% |
| 55 to 64 Years | 59 | 18.4% |
| 65 to 74 Years | 69 | 21.5% |
| 75 to 84 Years | 25 | 7.8% |
| 85 Years and Over | 5 | 1.6% |
| Total | 321 | 100.0% |
Housing Finances in Haliimaile
Median Income by Occupancy in Haliimaile
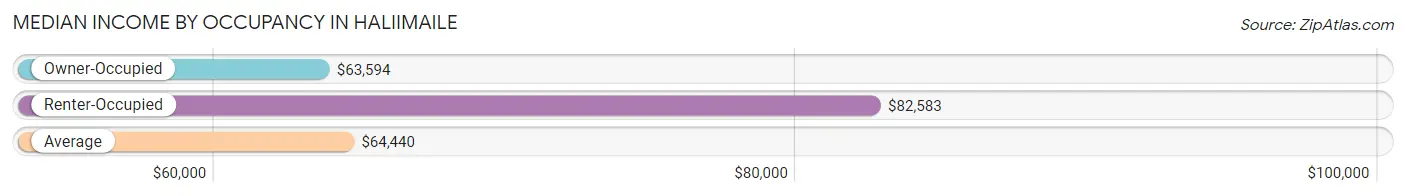
| Occupancy Type | # Households | Median Income |
| Owner-Occupied | 192 (59.8%) | $63,594 |
| Renter-Occupied | 129 (40.2%) | $82,583 |
| Average | 321 (100.0%) | $64,440 |
Occupancy by Householder Income Bracket in Haliimaile
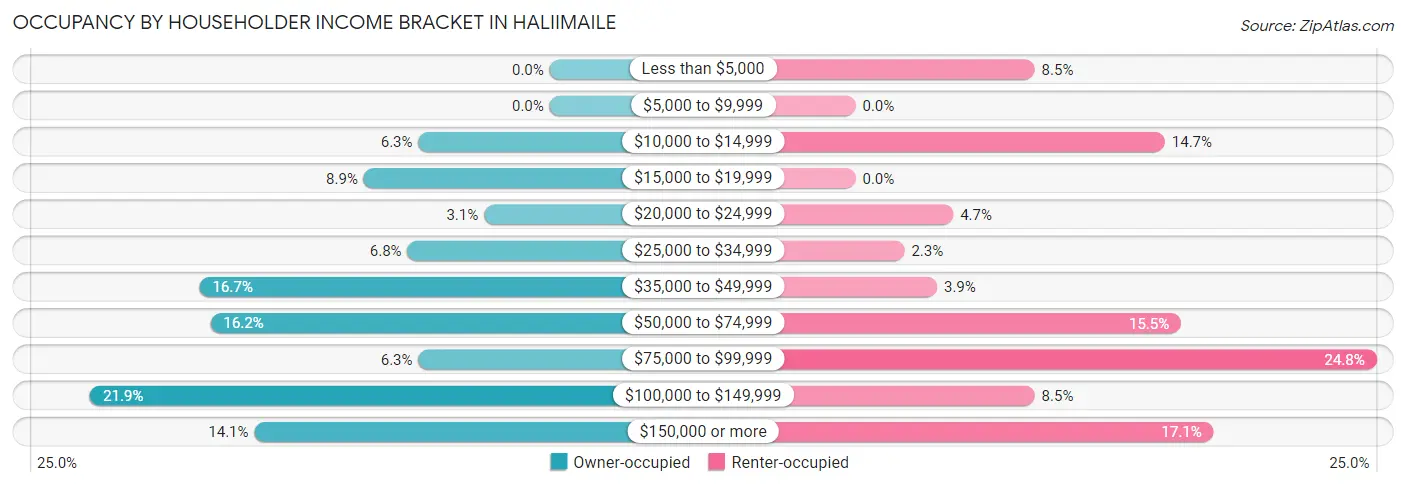
| Income Bracket | Owner-occupied | Renter-occupied |
| Less than $5,000 | 0 (0.0%) | 11 (8.5%) |
| $5,000 to $9,999 | 0 (0.0%) | 0 (0.0%) |
| $10,000 to $14,999 | 12 (6.2%) | 19 (14.7%) |
| $15,000 to $19,999 | 17 (8.8%) | 0 (0.0%) |
| $20,000 to $24,999 | 6 (3.1%) | 6 (4.6%) |
| $25,000 to $34,999 | 13 (6.8%) | 3 (2.3%) |
| $35,000 to $49,999 | 32 (16.7%) | 5 (3.9%) |
| $50,000 to $74,999 | 31 (16.2%) | 20 (15.5%) |
| $75,000 to $99,999 | 12 (6.2%) | 32 (24.8%) |
| $100,000 to $149,999 | 42 (21.9%) | 11 (8.5%) |
| $150,000 or more | 27 (14.1%) | 22 (17.1%) |
| Total | 192 (100.0%) | 129 (100.0%) |
Monthly Housing Cost Tiers in Haliimaile
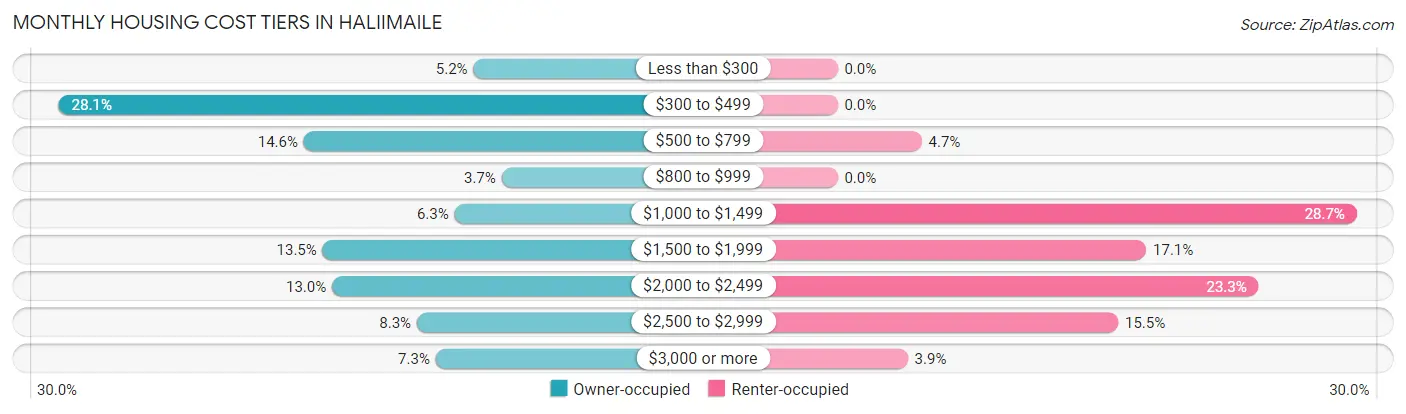
| Monthly Cost | Owner-occupied | Renter-occupied |
| Less than $300 | 10 (5.2%) | 0 (0.0%) |
| $300 to $499 | 54 (28.1%) | 0 (0.0%) |
| $500 to $799 | 28 (14.6%) | 6 (4.6%) |
| $800 to $999 | 7 (3.6%) | 0 (0.0%) |
| $1,000 to $1,499 | 12 (6.2%) | 37 (28.7%) |
| $1,500 to $1,999 | 26 (13.5%) | 22 (17.1%) |
| $2,000 to $2,499 | 25 (13.0%) | 30 (23.3%) |
| $2,500 to $2,999 | 16 (8.3%) | 20 (15.5%) |
| $3,000 or more | 14 (7.3%) | 5 (3.9%) |
| Total | 192 (100.0%) | 129 (100.0%) |
Physical Housing Characteristics in Haliimaile
Housing Structures in Haliimaile
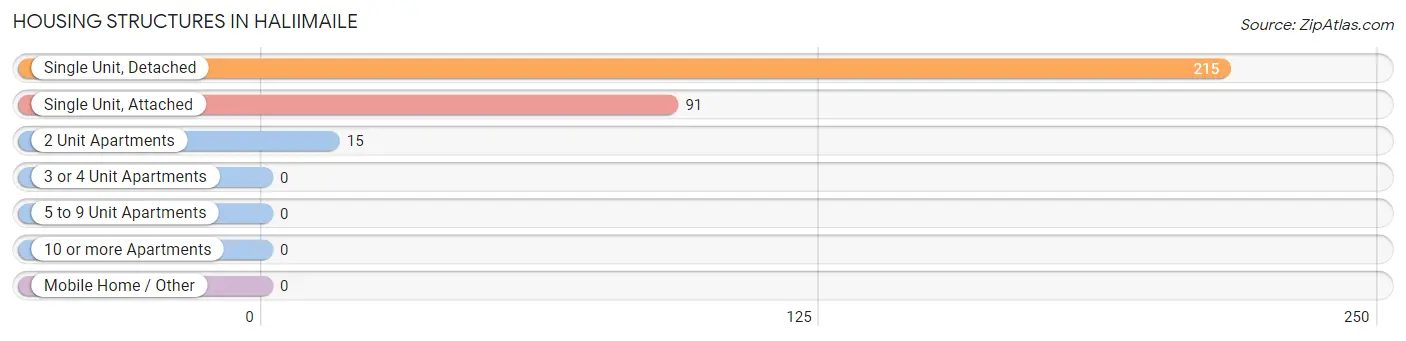
| Structure Type | # Housing Units | % Housing Units |
| Single Unit, Detached | 215 | 67.0% |
| Single Unit, Attached | 91 | 28.3% |
| 2 Unit Apartments | 15 | 4.7% |
| 3 or 4 Unit Apartments | 0 | 0.0% |
| 5 to 9 Unit Apartments | 0 | 0.0% |
| 10 or more Apartments | 0 | 0.0% |
| Mobile Home / Other | 0 | 0.0% |
| Total | 321 | 100.0% |
Housing Structures by Occupancy in Haliimaile
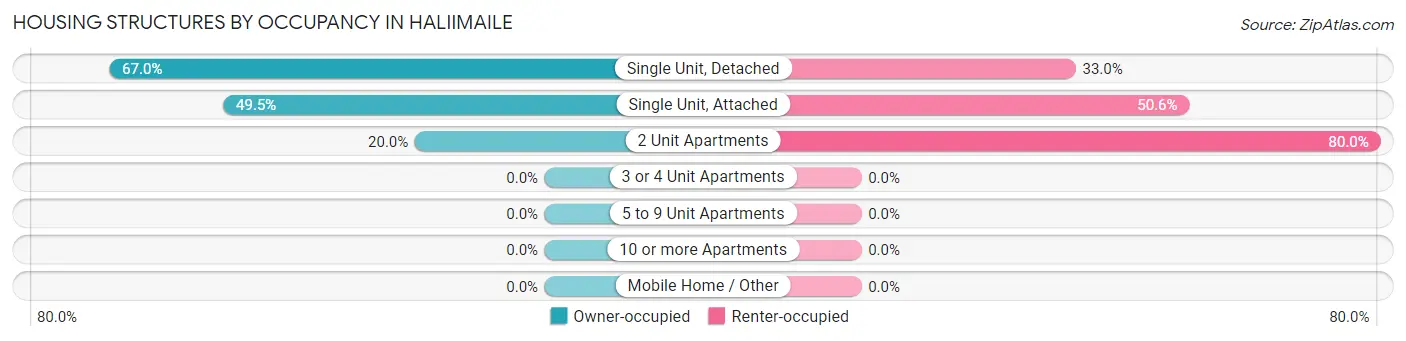
| Structure Type | Owner-occupied | Renter-occupied |
| Single Unit, Detached | 144 (67.0%) | 71 (33.0%) |
| Single Unit, Attached | 45 (49.4%) | 46 (50.5%) |
| 2 Unit Apartments | 3 (20.0%) | 12 (80.0%) |
| 3 or 4 Unit Apartments | 0 (0.0%) | 0 (0.0%) |
| 5 to 9 Unit Apartments | 0 (0.0%) | 0 (0.0%) |
| 10 or more Apartments | 0 (0.0%) | 0 (0.0%) |
| Mobile Home / Other | 0 (0.0%) | 0 (0.0%) |
| Total | 192 (59.8%) | 129 (40.2%) |
Housing Structures by Number of Rooms in Haliimaile
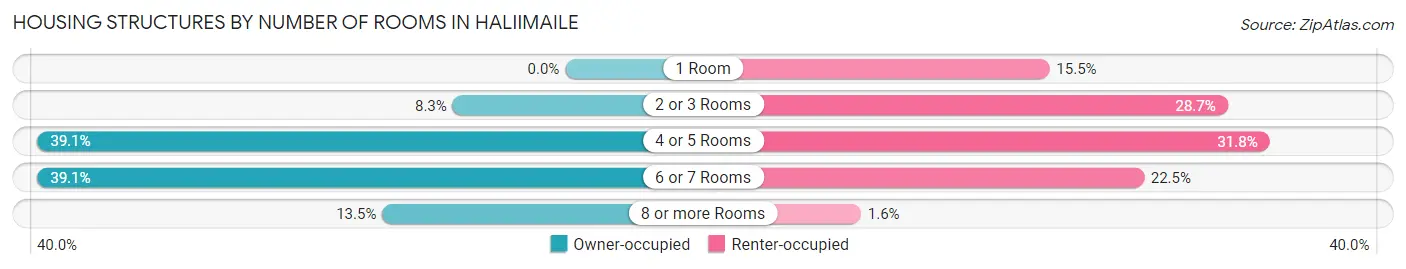
| Number of Rooms | Owner-occupied | Renter-occupied |
| 1 Room | 0 (0.0%) | 20 (15.5%) |
| 2 or 3 Rooms | 16 (8.3%) | 37 (28.7%) |
| 4 or 5 Rooms | 75 (39.1%) | 41 (31.8%) |
| 6 or 7 Rooms | 75 (39.1%) | 29 (22.5%) |
| 8 or more Rooms | 26 (13.5%) | 2 (1.5%) |
| Total | 192 (100.0%) | 129 (100.0%) |
Housing Structure by Heating Type in Haliimaile
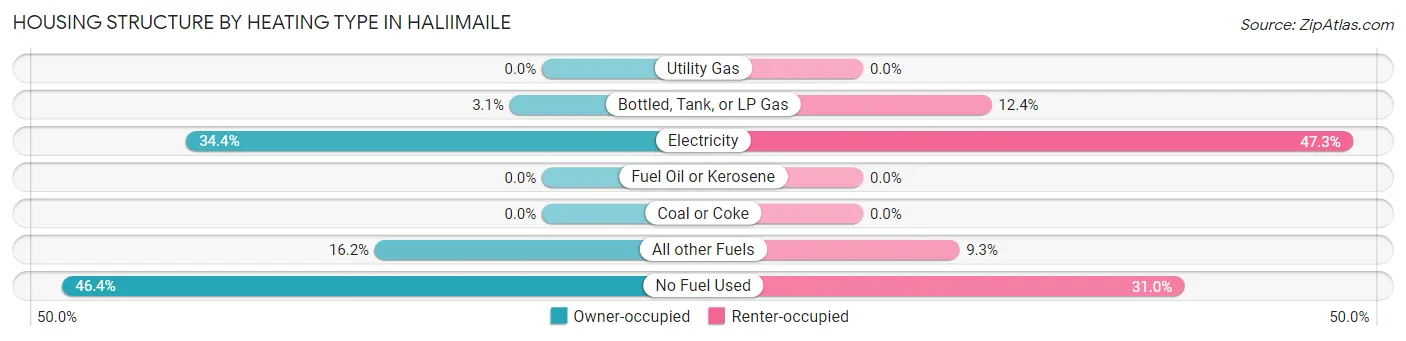
| Heating Type | Owner-occupied | Renter-occupied |
| Utility Gas | 0 (0.0%) | 0 (0.0%) |
| Bottled, Tank, or LP Gas | 6 (3.1%) | 16 (12.4%) |
| Electricity | 66 (34.4%) | 61 (47.3%) |
| Fuel Oil or Kerosene | 0 (0.0%) | 0 (0.0%) |
| Coal or Coke | 0 (0.0%) | 0 (0.0%) |
| All other Fuels | 31 (16.2%) | 12 (9.3%) |
| No Fuel Used | 89 (46.4%) | 40 (31.0%) |
| Total | 192 (100.0%) | 129 (100.0%) |
Household Vehicle Usage in Haliimaile
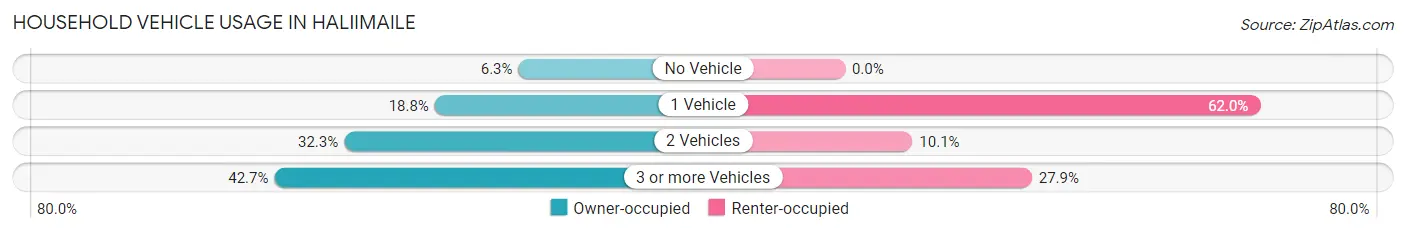
| Vehicles per Household | Owner-occupied | Renter-occupied |
| No Vehicle | 12 (6.2%) | 0 (0.0%) |
| 1 Vehicle | 36 (18.8%) | 80 (62.0%) |
| 2 Vehicles | 62 (32.3%) | 13 (10.1%) |
| 3 or more Vehicles | 82 (42.7%) | 36 (27.9%) |
| Total | 192 (100.0%) | 129 (100.0%) |
Real Estate & Mortgages in Haliimaile
Real Estate and Mortgage Overview in Haliimaile
| Characteristic | Without Mortgage | With Mortgage |
| Housing Units | 97 | 95 |
| Median Property Value | $810,400 | $771,600 |
| Median Household Income | $62,596 | $13 |
| Monthly Housing Costs | $464 | $14 |
| Real Estate Taxes | $1,024 | $6 |
Property Value by Mortgage Status in Haliimaile
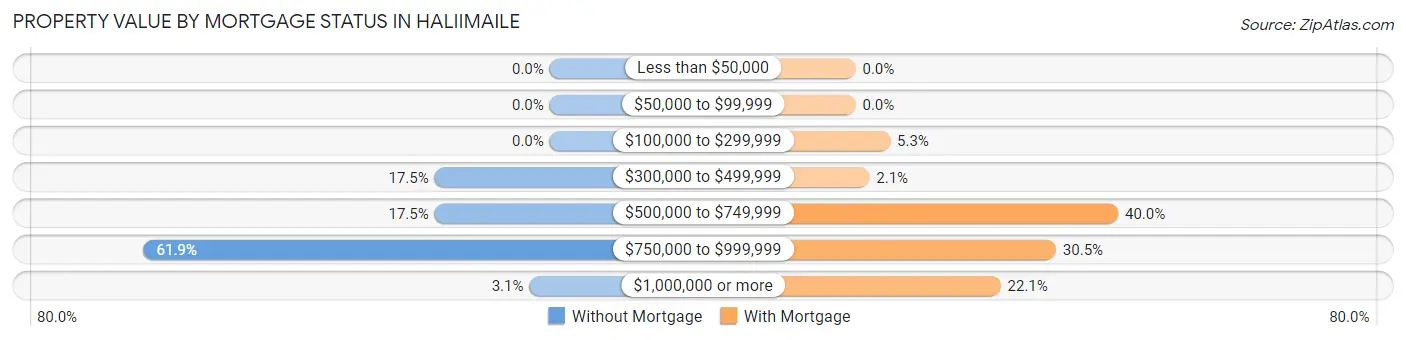
| Property Value | Without Mortgage | With Mortgage |
| Less than $50,000 | 0 (0.0%) | 0 (0.0%) |
| $50,000 to $99,999 | 0 (0.0%) | 0 (0.0%) |
| $100,000 to $299,999 | 0 (0.0%) | 5 (5.3%) |
| $300,000 to $499,999 | 17 (17.5%) | 2 (2.1%) |
| $500,000 to $749,999 | 17 (17.5%) | 38 (40.0%) |
| $750,000 to $999,999 | 60 (61.9%) | 29 (30.5%) |
| $1,000,000 or more | 3 (3.1%) | 21 (22.1%) |
| Total | 97 (100.0%) | 95 (100.0%) |
Household Income by Mortgage Status in Haliimaile
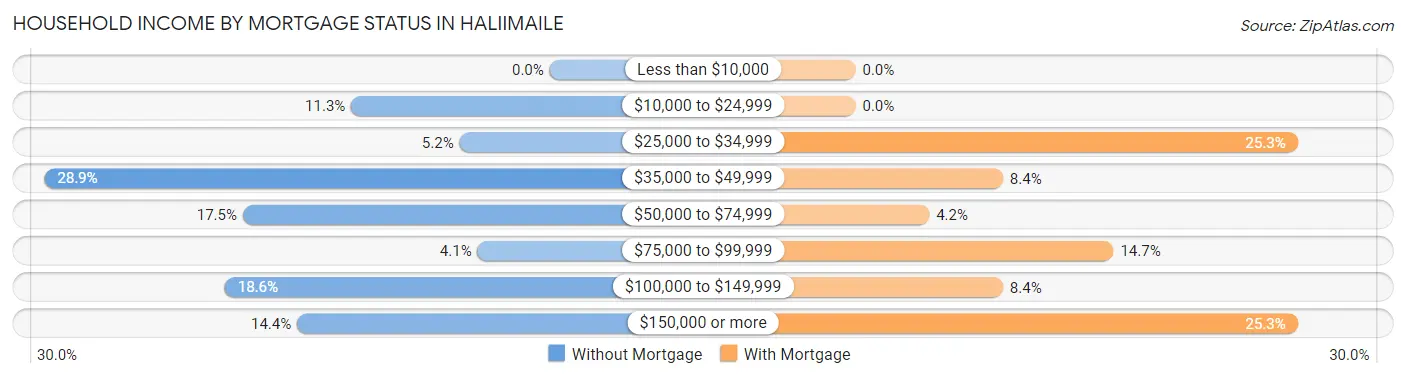
| Household Income | Without Mortgage | With Mortgage |
| Less than $10,000 | 0 (0.0%) | 0 (0.0%) |
| $10,000 to $24,999 | 11 (11.3%) | 0 (0.0%) |
| $25,000 to $34,999 | 5 (5.1%) | 24 (25.3%) |
| $35,000 to $49,999 | 28 (28.9%) | 8 (8.4%) |
| $50,000 to $74,999 | 17 (17.5%) | 4 (4.2%) |
| $75,000 to $99,999 | 4 (4.1%) | 14 (14.7%) |
| $100,000 to $149,999 | 18 (18.6%) | 8 (8.4%) |
| $150,000 or more | 14 (14.4%) | 24 (25.3%) |
| Total | 97 (100.0%) | 95 (100.0%) |
Property Value to Household Income Ratio in Haliimaile
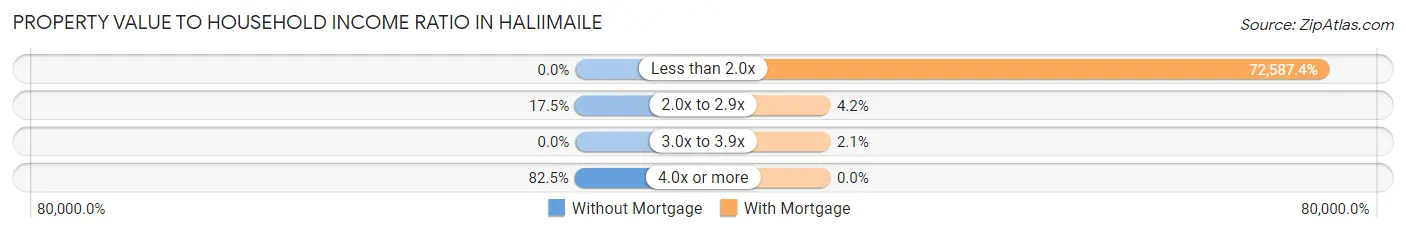
| Value-to-Income Ratio | Without Mortgage | With Mortgage |
| Less than 2.0x | 0 (0.0%) | 68,958 (72,587.4%) |
| 2.0x to 2.9x | 17 (17.5%) | 4 (4.2%) |
| 3.0x to 3.9x | 0 (0.0%) | 2 (2.1%) |
| 4.0x or more | 80 (82.5%) | 0 (0.0%) |
| Total | 97 (100.0%) | 95 (100.0%) |
Real Estate Taxes by Mortgage Status in Haliimaile
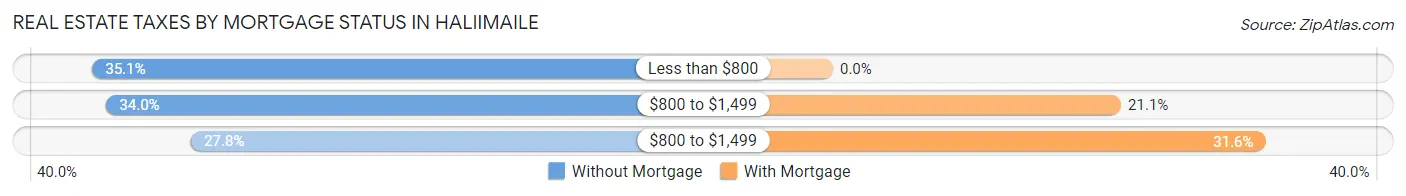
| Property Taxes | Without Mortgage | With Mortgage |
| Less than $800 | 34 (35.0%) | 0 (0.0%) |
| $800 to $1,499 | 33 (34.0%) | 20 (21.0%) |
| $800 to $1,499 | 27 (27.8%) | 30 (31.6%) |
| Total | 97 (100.0%) | 95 (100.0%) |
Health & Disability in Haliimaile
Health Insurance Coverage by Age in Haliimaile
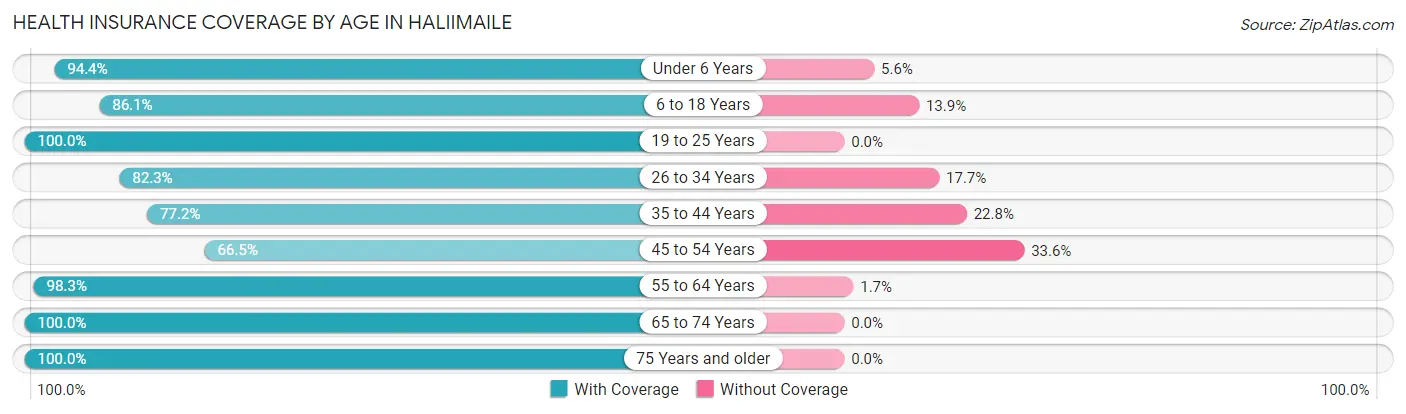
| Age Bracket | With Coverage | Without Coverage |
| Under 6 Years | 85 (94.4%) | 5 (5.6%) |
| 6 to 18 Years | 173 (86.1%) | 28 (13.9%) |
| 19 to 25 Years | 67 (100.0%) | 0 (0.0%) |
| 26 to 34 Years | 163 (82.3%) | 35 (17.7%) |
| 35 to 44 Years | 71 (77.2%) | 21 (22.8%) |
| 45 to 54 Years | 101 (66.4%) | 51 (33.6%) |
| 55 to 64 Years | 117 (98.3%) | 2 (1.7%) |
| 65 to 74 Years | 95 (100.0%) | 0 (0.0%) |
| 75 Years and older | 56 (100.0%) | 0 (0.0%) |
| Total | 928 (86.7%) | 142 (13.3%) |
Health Insurance Coverage by Citizenship Status in Haliimaile
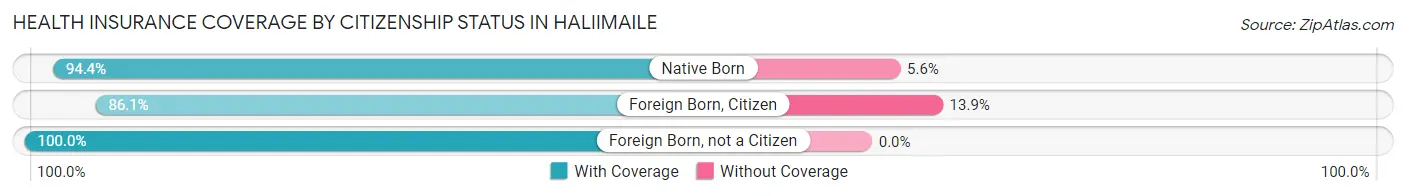
| Citizenship Status | With Coverage | Without Coverage |
| Native Born | 85 (94.4%) | 5 (5.6%) |
| Foreign Born, Citizen | 173 (86.1%) | 28 (13.9%) |
| Foreign Born, not a Citizen | 67 (100.0%) | 0 (0.0%) |
Health Insurance Coverage by Household Income in Haliimaile
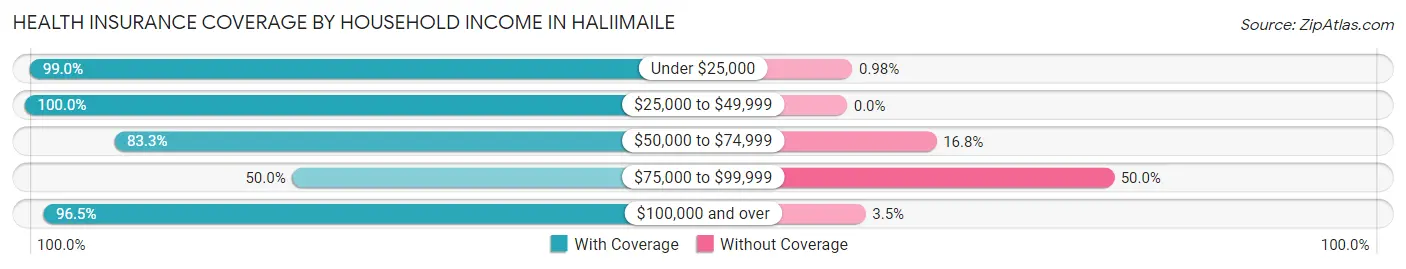
| Household Income | With Coverage | Without Coverage |
| Under $25,000 | 101 (99.0%) | 1 (1.0%) |
| $25,000 to $49,999 | 153 (100.0%) | 0 (0.0%) |
| $50,000 to $74,999 | 164 (83.3%) | 33 (16.8%) |
| $75,000 to $99,999 | 93 (50.0%) | 93 (50.0%) |
| $100,000 and over | 417 (96.5%) | 15 (3.5%) |
Public vs Private Health Insurance Coverage by Age in Haliimaile
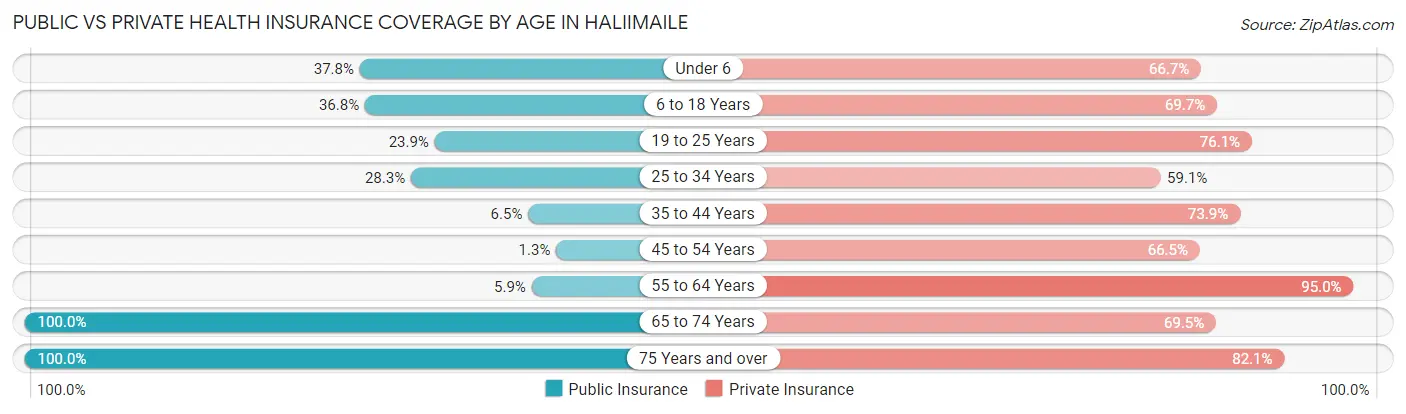
| Age Bracket | Public Insurance | Private Insurance |
| Under 6 | 34 (37.8%) | 60 (66.7%) |
| 6 to 18 Years | 74 (36.8%) | 140 (69.7%) |
| 19 to 25 Years | 16 (23.9%) | 51 (76.1%) |
| 25 to 34 Years | 56 (28.3%) | 117 (59.1%) |
| 35 to 44 Years | 6 (6.5%) | 68 (73.9%) |
| 45 to 54 Years | 2 (1.3%) | 101 (66.4%) |
| 55 to 64 Years | 7 (5.9%) | 113 (95.0%) |
| 65 to 74 Years | 95 (100.0%) | 66 (69.5%) |
| 75 Years and over | 56 (100.0%) | 46 (82.1%) |
| Total | 346 (32.3%) | 762 (71.2%) |
Disability Status by Sex by Age in Haliimaile
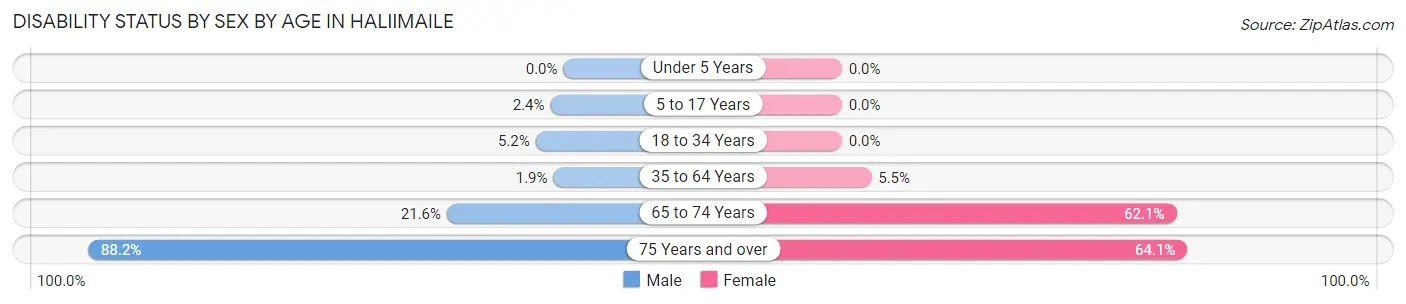
| Age Bracket | Male | Female |
| Under 5 Years | 0 (0.0%) | 0 (0.0%) |
| 5 to 17 Years | 2 (2.4%) | 0 (0.0%) |
| 18 to 34 Years | 8 (5.2%) | 0 (0.0%) |
| 35 to 64 Years | 3 (1.8%) | 11 (5.5%) |
| 65 to 74 Years | 8 (21.6%) | 36 (62.1%) |
| 75 Years and over | 15 (88.2%) | 25 (64.1%) |
Disability Class by Sex by Age in Haliimaile
Disability Class: Hearing Difficulty
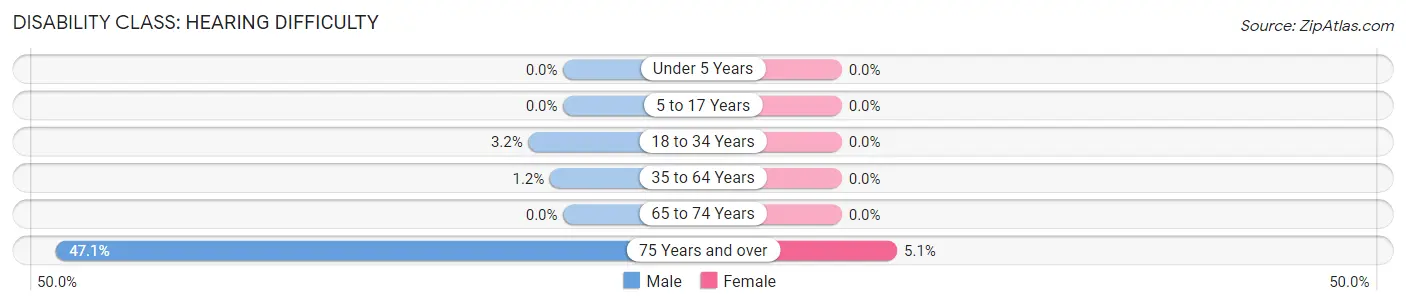
| Age Bracket | Male | Female |
| Under 5 Years | 0 (0.0%) | 0 (0.0%) |
| 5 to 17 Years | 0 (0.0%) | 0 (0.0%) |
| 18 to 34 Years | 5 (3.2%) | 0 (0.0%) |
| 35 to 64 Years | 2 (1.2%) | 0 (0.0%) |
| 65 to 74 Years | 0 (0.0%) | 0 (0.0%) |
| 75 Years and over | 8 (47.1%) | 2 (5.1%) |
Disability Class: Vision Difficulty
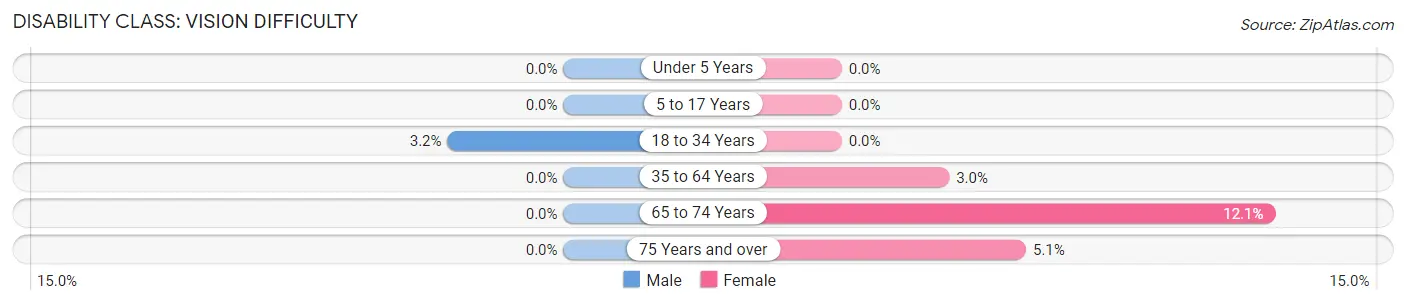
| Age Bracket | Male | Female |
| Under 5 Years | 0 (0.0%) | 0 (0.0%) |
| 5 to 17 Years | 0 (0.0%) | 0 (0.0%) |
| 18 to 34 Years | 5 (3.2%) | 0 (0.0%) |
| 35 to 64 Years | 0 (0.0%) | 6 (3.0%) |
| 65 to 74 Years | 0 (0.0%) | 7 (12.1%) |
| 75 Years and over | 0 (0.0%) | 2 (5.1%) |
Disability Class: Cognitive Difficulty
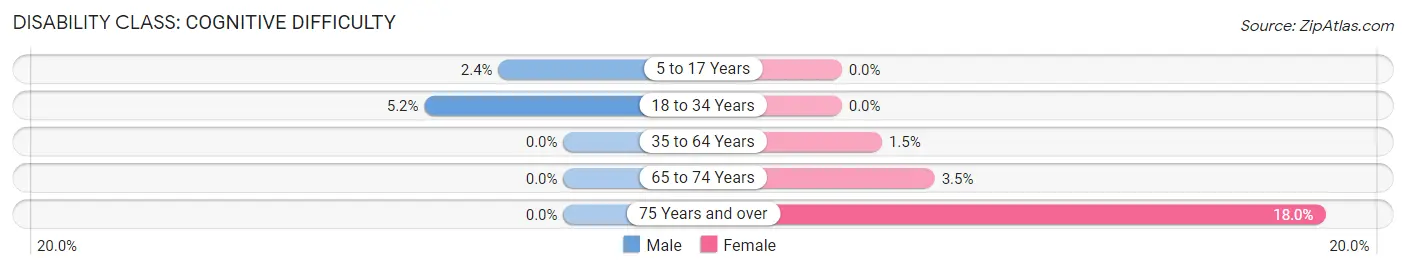
| Age Bracket | Male | Female |
| 5 to 17 Years | 2 (2.4%) | 0 (0.0%) |
| 18 to 34 Years | 8 (5.2%) | 0 (0.0%) |
| 35 to 64 Years | 0 (0.0%) | 3 (1.5%) |
| 65 to 74 Years | 0 (0.0%) | 2 (3.5%) |
| 75 Years and over | 0 (0.0%) | 7 (17.9%) |
Disability Class: Ambulatory Difficulty
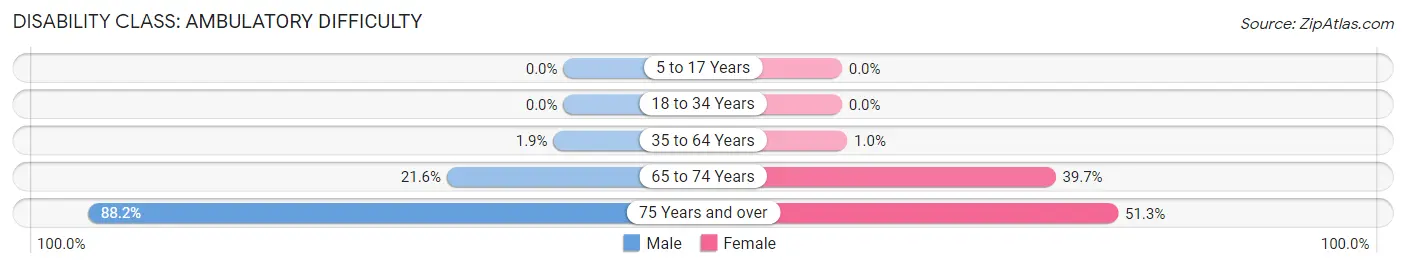
| Age Bracket | Male | Female |
| 5 to 17 Years | 0 (0.0%) | 0 (0.0%) |
| 18 to 34 Years | 0 (0.0%) | 0 (0.0%) |
| 35 to 64 Years | 3 (1.8%) | 2 (1.0%) |
| 65 to 74 Years | 8 (21.6%) | 23 (39.7%) |
| 75 Years and over | 15 (88.2%) | 20 (51.3%) |
Disability Class: Self-Care Difficulty
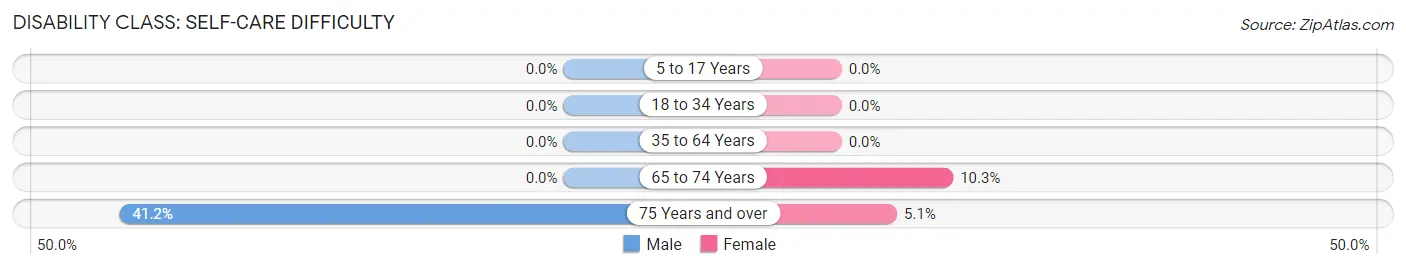
| Age Bracket | Male | Female |
| 5 to 17 Years | 0 (0.0%) | 0 (0.0%) |
| 18 to 34 Years | 0 (0.0%) | 0 (0.0%) |
| 35 to 64 Years | 0 (0.0%) | 0 (0.0%) |
| 65 to 74 Years | 0 (0.0%) | 6 (10.3%) |
| 75 Years and over | 7 (41.2%) | 2 (5.1%) |
Technology Access in Haliimaile
Computing Device Access in Haliimaile
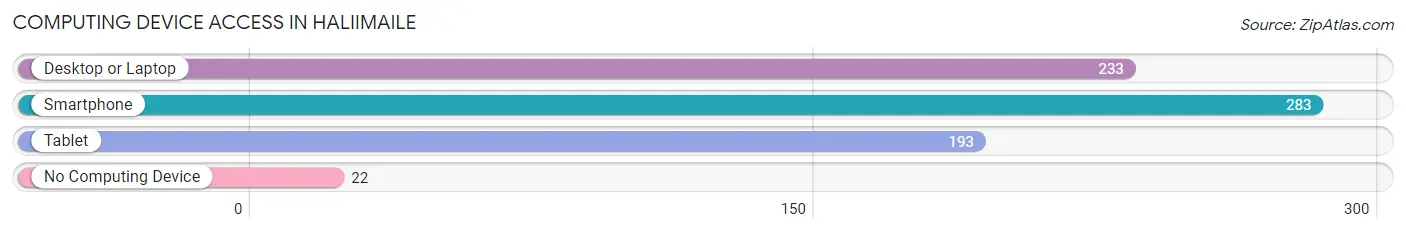
| Device Type | # Households | % Households |
| Desktop or Laptop | 233 | 72.6% |
| Smartphone | 283 | 88.2% |
| Tablet | 193 | 60.1% |
| No Computing Device | 22 | 6.9% |
| Total | 321 | 100.0% |
Internet Access in Haliimaile
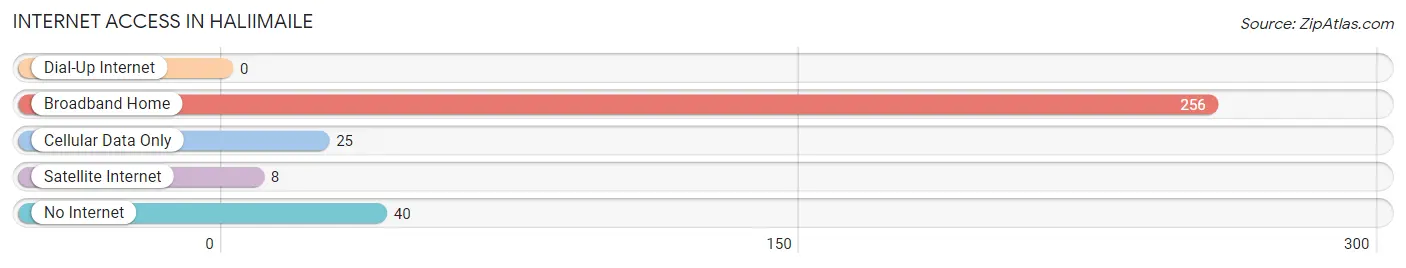
| Internet Type | # Households | % Households |
| Dial-Up Internet | 0 | 0.0% |
| Broadband Home | 256 | 79.7% |
| Cellular Data Only | 25 | 7.8% |
| Satellite Internet | 8 | 2.5% |
| No Internet | 40 | 12.5% |
| Total | 321 | 100.0% |
Haliimaile Summary
Haliimaile is a small unincorporated community located in the central part of Maui, Hawaii. It is located in the district of Makawao, and is part of the larger area known as Upcountry Maui. The population of Haliimaile was 1,845 as of the 2010 census.
History
Haliimaile was originally a sugar plantation town, established in the late 1800s. The plantation was owned by the Baldwin family, who had a large presence in the area. The plantation was eventually sold to the Hawaiian Commercial & Sugar Company, which operated the plantation until it closed in 2016.
The town of Haliimaile was founded in the early 1900s, and was named after the Hawaiian word for “house of the sun”. The town was a popular destination for tourists, and was known for its beautiful scenery and lush vegetation.
Geography
Haliimaile is located in the central part of Maui, in the district of Makawao. It is situated at an elevation of 1,000 feet, and is surrounded by lush vegetation and rolling hills. The town is located near the slopes of Haleakala, the largest volcano on Maui.
The climate in Haliimaile is tropical, with temperatures ranging from the mid-70s to the mid-80s. The area receives an average of about 20 inches of rain per year.
Economy
Haliimaile’s economy is largely based on agriculture and tourism. The town is home to several farms, which produce a variety of fruits and vegetables. Tourism is also a major industry in the area, with many visitors coming to enjoy the town’s natural beauty and its proximity to Haleakala.
Demographics
As of the 2010 census, the population of Haliimaile was 1,845. The racial makeup of the town was 57.3% White, 0.7% African American, 0.3% Native American, 0.7% Asian, 0.1% Pacific Islander, and 40.2% from other races. The median household income was $50,000, and the median age was 44.
Haliimaile is a small, rural community with a rich history and a vibrant culture. The town is known for its beautiful scenery and its friendly people, and is a popular destination for tourists and locals alike.
Common Questions
What is Per Capita Income in Haliimaile?
Per Capita income in Haliimaile is $26,978.
What is the Median Family Income in Haliimaile?
Median Family Income in Haliimaile is $82,900.
What is the Median Household income in Haliimaile?
Median Household Income in Haliimaile is $64,440.
What is Income or Wage Gap in Haliimaile?
Income or Wage Gap in Haliimaile is 25.8%.
Women in Haliimaile earn 74.2 cents for every dollar earned by a man.
What is Inequality or Gini Index in Haliimaile?
Inequality or Gini Index in Haliimaile is 0.45.
What is the Total Population of Haliimaile?
Total Population of Haliimaile is 1,077.
What is the Total Male Population of Haliimaile?
Total Male Population of Haliimaile is 499.
What is the Total Female Population of Haliimaile?
Total Female Population of Haliimaile is 578.
What is the Ratio of Males per 100 Females in Haliimaile?
There are 86.33 Males per 100 Females in Haliimaile.
What is the Ratio of Females per 100 Males in Haliimaile?
There are 115.83 Females per 100 Males in Haliimaile.
What is the Median Population Age in Haliimaile?
Median Population Age in Haliimaile is 34.3 Years.
What is the Average Family Size in Haliimaile
Average Family Size in Haliimaile is 3.7 People.
What is the Average Household Size in Haliimaile
Average Household Size in Haliimaile is 3.4 People.
How Large is the Labor Force in Haliimaile?
There are 468 People in the Labor Forcein in Haliimaile.
What is the Percentage of People in the Labor Force in Haliimaile?
55.4% of People are in the Labor Force in Haliimaile.
What is the Unemployment Rate in Haliimaile?
Unemployment Rate in Haliimaile is 9.3%.