Pakala Village, HI Map & Demographics
Pakala Village Map
Pakala Village Overview
$17,187
PER CAPITA INCOME
0.51
INEQUALITY / GINI INDEX
309
TOTAL POPULATION
139
MALE POPULATION
170
FEMALE POPULATION
81.76
MALES / 100 FEMALES
122.30
FEMALES / 100 MALES
27.9
MEDIAN AGE
5.1
AVG FAMILY SIZE
3.9
AVG HOUSEHOLD SIZE
71
LABOR FORCE [ PEOPLE ]
38.6%
PERCENT IN LABOR FORCE
8.5%
UNEMPLOYMENT RATE
Income in Pakala Village
Income Overview in Pakala Village
| Characteristic | Number | Measure |
| Per Capita Income | 309 | $17,187 |
| Median Family Income | 56 | $0 |
| Mean Family Income | 56 | $83,241 |
| Median Household Income | 80 | $0 |
| Mean Household Income | 80 | $62,220 |
| Income Deficit | 56 | $0 |
| Wage / Income Gap (%) | 309 | 0.00% |
| Wage / Income Gap ($) | 309 | 100.00¢ per $1 |
| Gini / Inequality Index | 309 | 0.51 |
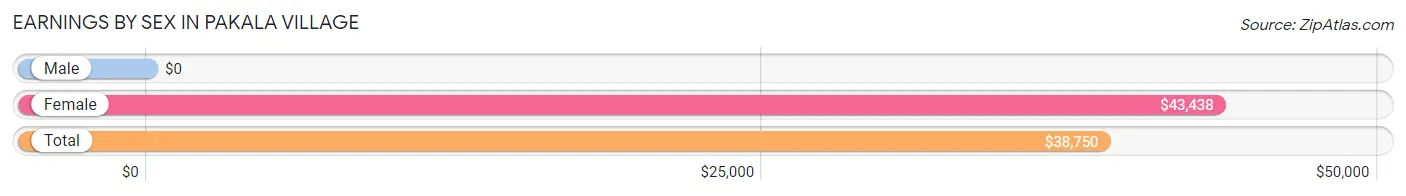
Earnings by Sex in Pakala Village
| Sex | Number | Average Earnings |
| Male | 33 (48.5%) | $0 |
| Female | 35 (51.5%) | $43,438 |
| Total | 68 (100.0%) | $38,750 |
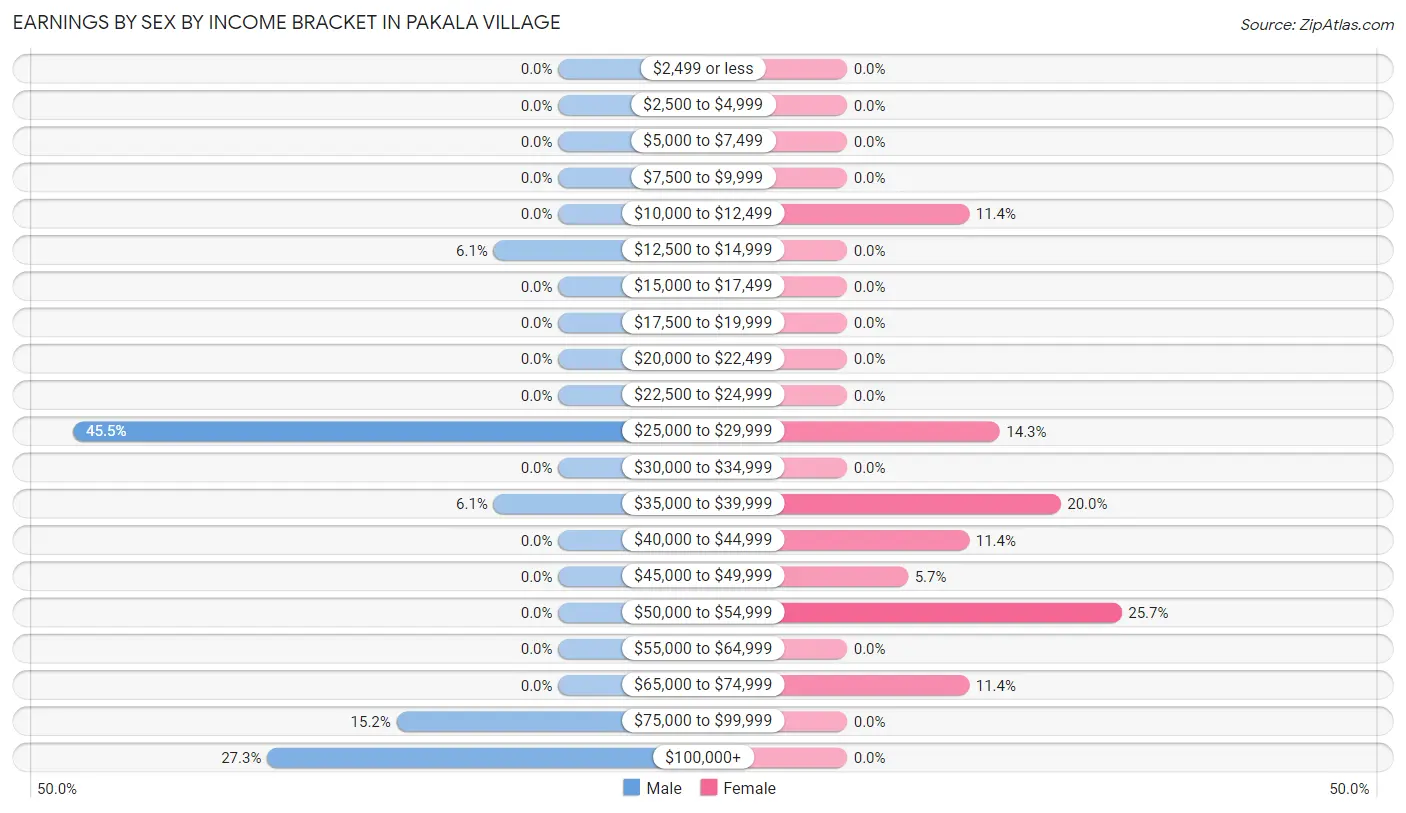
Earnings by Sex by Income Bracket in Pakala Village
The most common earnings brackets in Pakala Village are $25,000 to $29,999 for men (15 | 45.5%) and $50,000 to $54,999 for women (9 | 25.7%).
| Income | Male | Female |
| $2,499 or less | 0 (0.0%) | 0 (0.0%) |
| $2,500 to $4,999 | 0 (0.0%) | 0 (0.0%) |
| $5,000 to $7,499 | 0 (0.0%) | 0 (0.0%) |
| $7,500 to $9,999 | 0 (0.0%) | 0 (0.0%) |
| $10,000 to $12,499 | 0 (0.0%) | 4 (11.4%) |
| $12,500 to $14,999 | 2 (6.1%) | 0 (0.0%) |
| $15,000 to $17,499 | 0 (0.0%) | 0 (0.0%) |
| $17,500 to $19,999 | 0 (0.0%) | 0 (0.0%) |
| $20,000 to $22,499 | 0 (0.0%) | 0 (0.0%) |
| $22,500 to $24,999 | 0 (0.0%) | 0 (0.0%) |
| $25,000 to $29,999 | 15 (45.5%) | 5 (14.3%) |
| $30,000 to $34,999 | 0 (0.0%) | 0 (0.0%) |
| $35,000 to $39,999 | 2 (6.1%) | 7 (20.0%) |
| $40,000 to $44,999 | 0 (0.0%) | 4 (11.4%) |
| $45,000 to $49,999 | 0 (0.0%) | 2 (5.7%) |
| $50,000 to $54,999 | 0 (0.0%) | 9 (25.7%) |
| $55,000 to $64,999 | 0 (0.0%) | 0 (0.0%) |
| $65,000 to $74,999 | 0 (0.0%) | 4 (11.4%) |
| $75,000 to $99,999 | 5 (15.1%) | 0 (0.0%) |
| $100,000+ | 9 (27.3%) | 0 (0.0%) |
| Total | 33 (100.0%) | 35 (100.0%) |
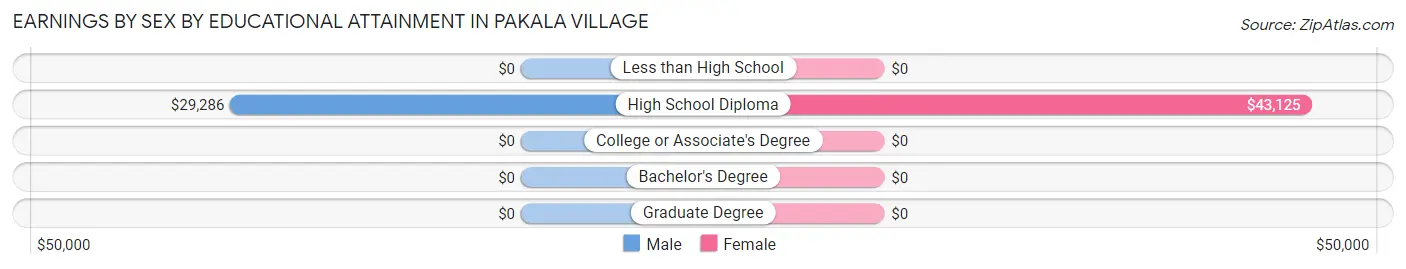
Earnings by Sex by Educational Attainment in Pakala Village
| Educational Attainment | Male Income | Female Income |
| Less than High School | - | - |
| High School Diploma | $29,286 | $43,125 |
| College or Associate's Degree | - | - |
| Bachelor's Degree | - | - |
| Graduate Degree | - | - |
| Total | - | - |
Family Income in Pakala Village
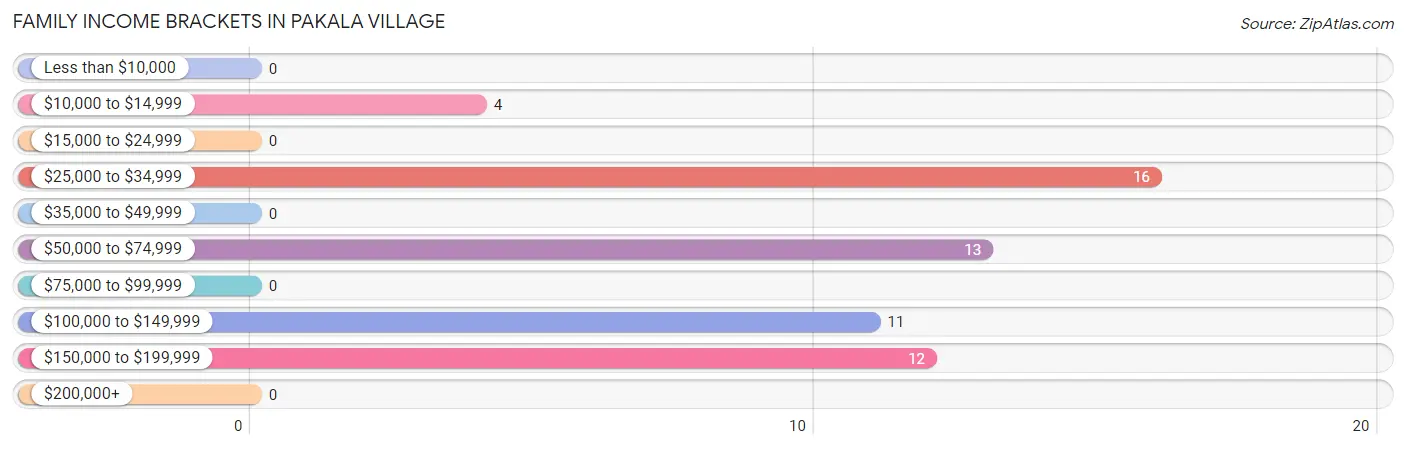
Family Income Brackets in Pakala Village
According to the Pakala Village family income data, there are 16 families falling into the $25,000 to $34,999 income range, which is the most common income bracket and makes up 28.6% of all families.
| Income Bracket | # Families | % Families |
| Less than $10,000 | 0 | 0.0% |
| $10,000 to $14,999 | 4 | 7.1% |
| $15,000 to $24,999 | 0 | 0.0% |
| $25,000 to $34,999 | 16 | 28.6% |
| $35,000 to $49,999 | 0 | 0.0% |
| $50,000 to $74,999 | 13 | 23.2% |
| $75,000 to $99,999 | 0 | 0.0% |
| $100,000 to $149,999 | 11 | 19.6% |
| $150,000 to $199,999 | 12 | 21.4% |
| $200,000+ | 0 | 0.0% |
Family Income by Famaliy Size in Pakala Village
| Income Bracket | # Families | Median Income |
| 2-Person Families | 5 (8.9%) | $0 |
| 3-Person Families | 22 (39.3%) | $0 |
| 4-Person Families | 15 (26.8%) | $0 |
| 5-Person Families | 0 (0.0%) | $0 |
| 6-Person Families | 9 (16.1%) | $0 |
| 7+ Person Families | 5 (8.9%) | $0 |
| Total | 56 (100.0%) | $0 |
Family Income by Number of Earners in Pakala Village
| Number of Earners | # Families | Median Income |
| No Earners | 18 (32.1%) | $0 |
| 1 Earner | 24 (42.9%) | $0 |
| 2 Earners | 8 (14.3%) | $0 |
| 3+ Earners | 6 (10.7%) | $0 |
| Total | 56 (100.0%) | $0 |
Household Income in Pakala Village
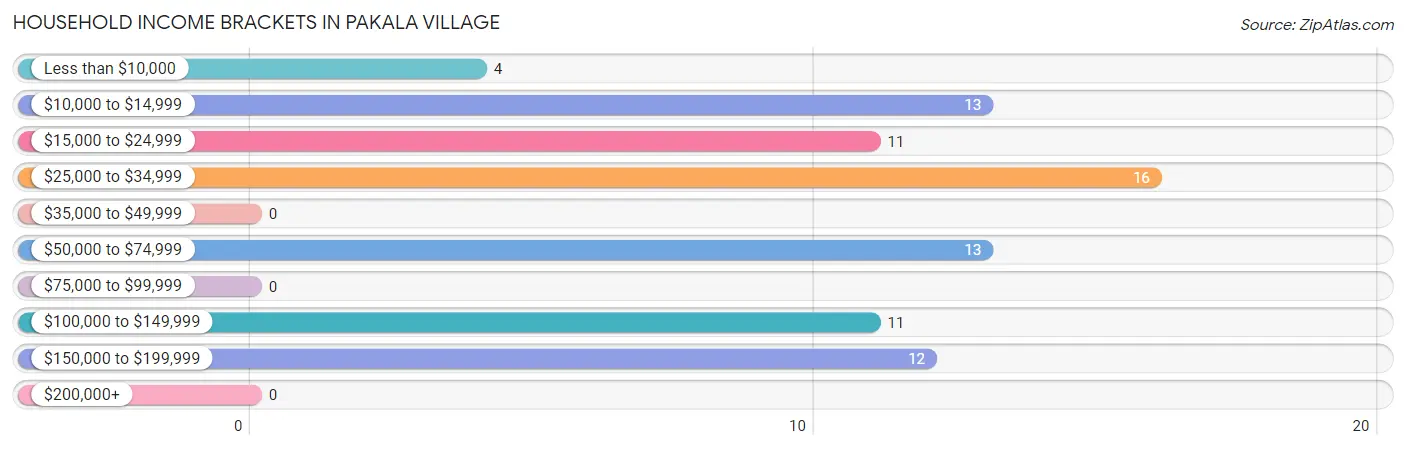
Household Income Brackets in Pakala Village
With 16 households falling in the category, the $25,000 to $34,999 income range is the most frequent in Pakala Village, accounting for 20.0% of all households.
| Income Bracket | # Households | % Households |
| Less than $10,000 | 4 | 5.0% |
| $10,000 to $14,999 | 13 | 16.3% |
| $15,000 to $24,999 | 11 | 13.8% |
| $25,000 to $34,999 | 16 | 20.0% |
| $35,000 to $49,999 | 0 | 0.0% |
| $50,000 to $74,999 | 13 | 16.3% |
| $75,000 to $99,999 | 0 | 0.0% |
| $100,000 to $149,999 | 11 | 13.8% |
| $150,000 to $199,999 | 12 | 15.0% |
| $200,000+ | 0 | 0.0% |
Household Income by Householder Age in Pakala Village
| Income Bracket | # Households | Median Income |
| 15 to 24 Years | 0 (0.0%) | $0 |
| 25 to 44 Years | 18 (22.5%) | $0 |
| 45 to 64 Years | 12 (15.0%) | $0 |
| 65+ Years | 50 (62.5%) | $0 |
| Total | 80 (100.0%) | $0 |
Poverty in Pakala Village
Income Below Poverty by Sex and Age in Pakala Village
With 16.6% poverty level for males and 8.8% for females among the residents of Pakala Village, 25 to 34 year old males and 65 to 74 year old females are the most vulnerable to poverty, with 6 males (40.0%) and 5 females (45.5%) in their respective age groups living below the poverty level.
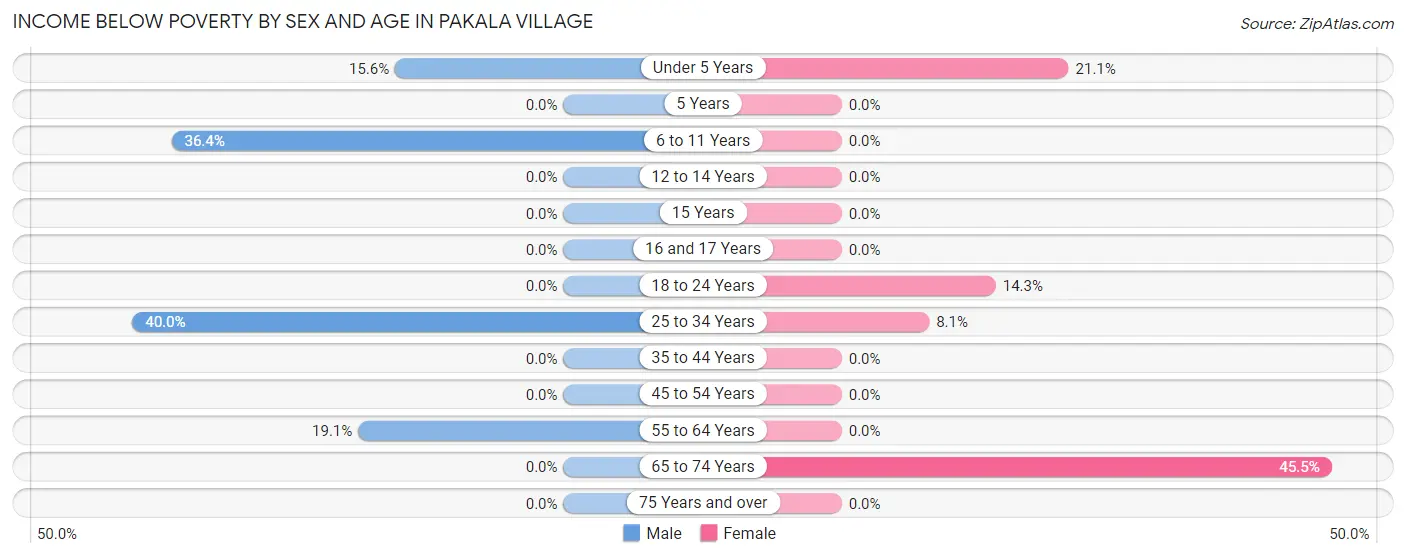
| Age Bracket | Male | Female |
| Under 5 Years | 5 (15.6%) | 4 (21.0%) |
| 5 Years | 0 (0.0%) | 0 (0.0%) |
| 6 to 11 Years | 8 (36.4%) | 0 (0.0%) |
| 12 to 14 Years | 0 (0.0%) | 0 (0.0%) |
| 15 Years | 0 (0.0%) | 0 (0.0%) |
| 16 and 17 Years | 0 (0.0%) | 0 (0.0%) |
| 18 to 24 Years | 0 (0.0%) | 3 (14.3%) |
| 25 to 34 Years | 6 (40.0%) | 3 (8.1%) |
| 35 to 44 Years | 0 (0.0%) | 0 (0.0%) |
| 45 to 54 Years | 0 (0.0%) | 0 (0.0%) |
| 55 to 64 Years | 4 (19.1%) | 0 (0.0%) |
| 65 to 74 Years | 0 (0.0%) | 5 (45.5%) |
| 75 Years and over | 0 (0.0%) | 0 (0.0%) |
| Total | 23 (16.6%) | 15 (8.8%) |
Income Above Poverty by Sex and Age in Pakala Village
According to the poverty statistics in Pakala Village, males aged 5 years and females aged 6 to 11 years are the age groups that are most secure financially, with 100.0% of males and 100.0% of females in these age groups living above the poverty line.
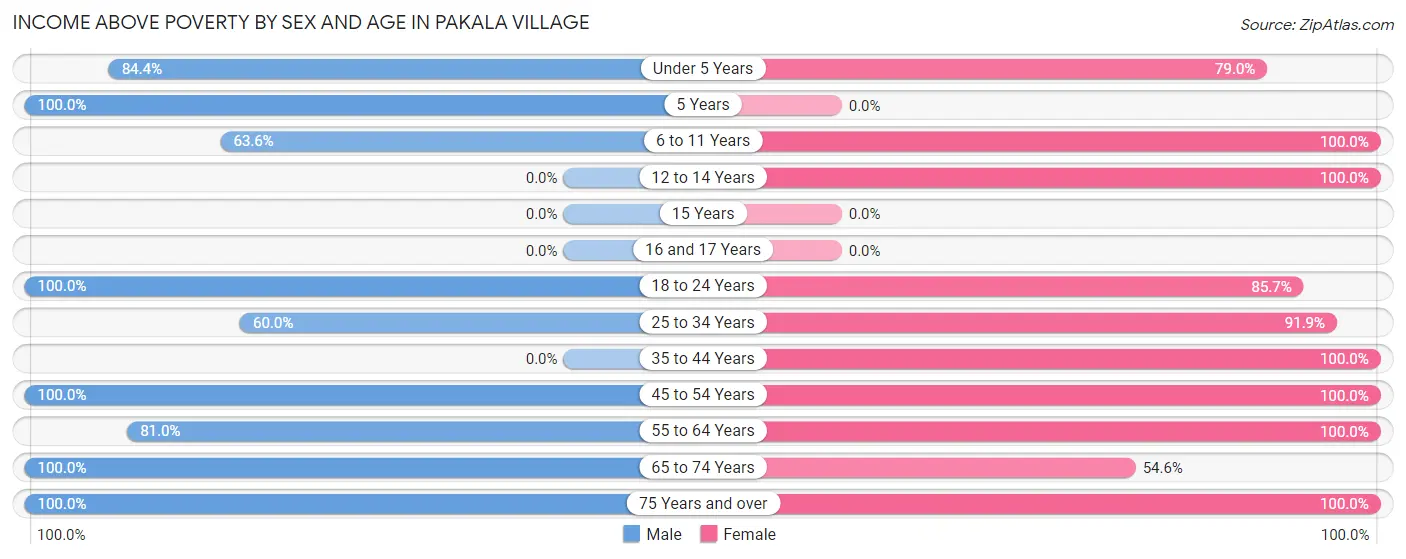
| Age Bracket | Male | Female |
| Under 5 Years | 27 (84.4%) | 15 (78.9%) |
| 5 Years | 24 (100.0%) | 0 (0.0%) |
| 6 to 11 Years | 14 (63.6%) | 24 (100.0%) |
| 12 to 14 Years | 0 (0.0%) | 4 (100.0%) |
| 15 Years | 0 (0.0%) | 0 (0.0%) |
| 16 and 17 Years | 0 (0.0%) | 0 (0.0%) |
| 18 to 24 Years | 2 (100.0%) | 18 (85.7%) |
| 25 to 34 Years | 9 (60.0%) | 34 (91.9%) |
| 35 to 44 Years | 0 (0.0%) | 4 (100.0%) |
| 45 to 54 Years | 12 (100.0%) | 8 (100.0%) |
| 55 to 64 Years | 17 (80.9%) | 3 (100.0%) |
| 65 to 74 Years | 2 (100.0%) | 6 (54.5%) |
| 75 Years and over | 9 (100.0%) | 39 (100.0%) |
| Total | 116 (83.5%) | 155 (91.2%) |
Income Below Poverty Among Married-Couple Families in Pakala Village
The poverty statistics for married-couple families in Pakala Village show that 18.2% or 6 of the total 33 families live below the poverty line. Families with 1 or 2 children have the highest poverty rate of 60.0%, comprising of 6 families. On the other hand, families with no children have the lowest poverty rate of 0.0%, which includes 0 families.
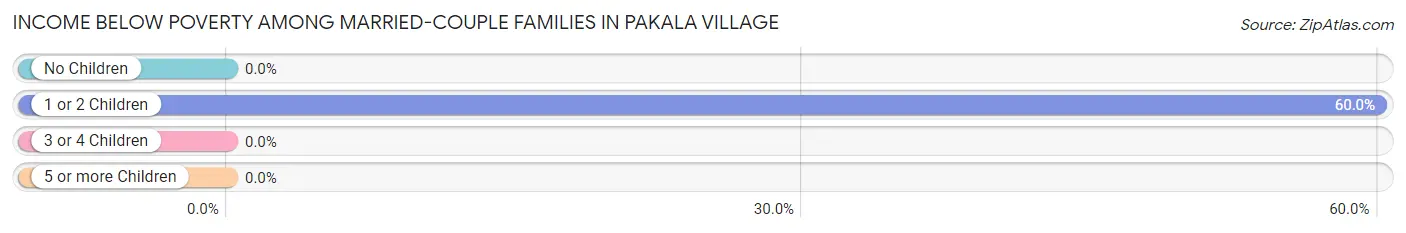
| Children | Above Poverty | Below Poverty |
| No Children | 11 (100.0%) | 0 (0.0%) |
| 1 or 2 Children | 4 (40.0%) | 6 (60.0%) |
| 3 or 4 Children | 12 (100.0%) | 0 (0.0%) |
| 5 or more Children | 0 (0.0%) | 0 (0.0%) |
| Total | 27 (81.8%) | 6 (18.2%) |
Income Below Poverty Among Single-Parent Households in Pakala Village
| Children | Single Father | Single Mother |
| No Children | 0 (0.0%) | 0 (0.0%) |
| 1 or 2 Children | 0 (0.0%) | 0 (0.0%) |
| 3 or 4 Children | 0 (0.0%) | 0 (0.0%) |
| 5 or more Children | 0 (0.0%) | 0 (0.0%) |
| Total | 0 (0.0%) | 0 (0.0%) |
Income Below Poverty Among Married-Couple vs Single-Parent Households in Pakala Village
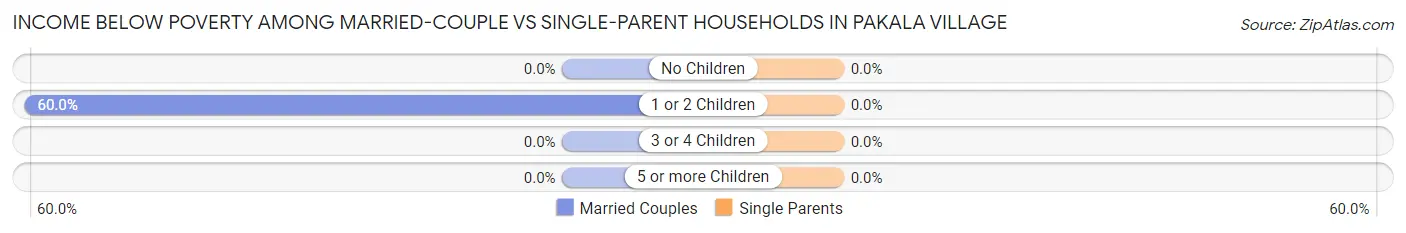
| Children | Married-Couple Families | Single-Parent Households |
| No Children | 0 (0.0%) | 0 (0.0%) |
| 1 or 2 Children | 6 (60.0%) | 0 (0.0%) |
| 3 or 4 Children | 0 (0.0%) | 0 (0.0%) |
| 5 or more Children | 0 (0.0%) | 0 (0.0%) |
| Total | 6 (18.2%) | 0 (0.0%) |
Race in Pakala Village
The most populous races in Pakala Village are Two or more Races (126 | 40.8%), Asian (121 | 39.2%), and Hispanic or Latino (109 | 35.3%).
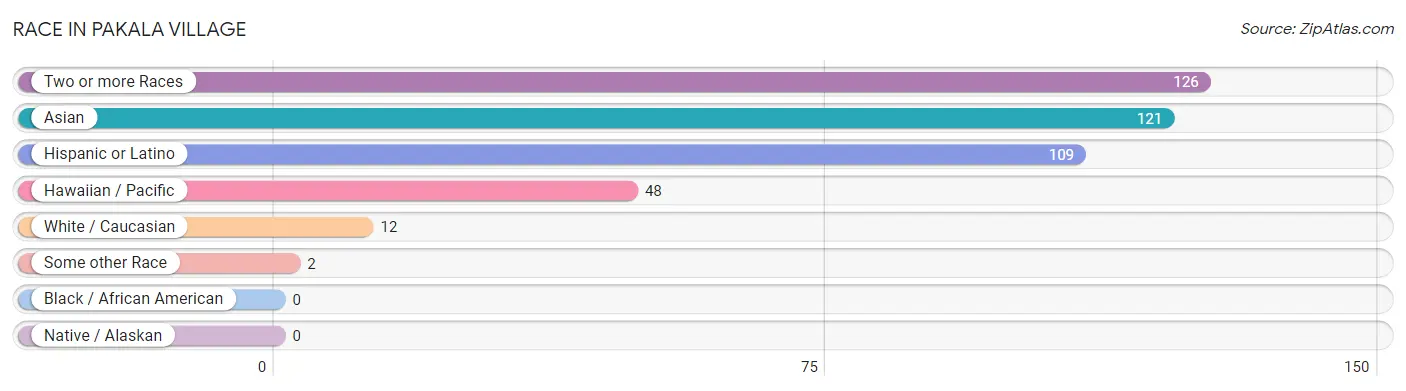
| Race | # Population | % Population |
| Asian | 121 | 39.2% |
| Black / African American | 0 | 0.0% |
| Hawaiian / Pacific | 48 | 15.5% |
| Hispanic or Latino | 109 | 35.3% |
| Native / Alaskan | 0 | 0.0% |
| White / Caucasian | 12 | 3.9% |
| Two or more Races | 126 | 40.8% |
| Some other Race | 2 | 0.6% |
| Total | 309 | 100.0% |
Ancestry in Pakala Village
The most populous ancestries reported in Pakala Village are Korean (179 | 57.9%), Spanish (103 | 33.3%), Native Hawaiian (86 | 27.8%), Portuguese (69 | 22.3%), and Apache (57 | 18.4%), together accounting for 159.9% of all Pakala Village residents.
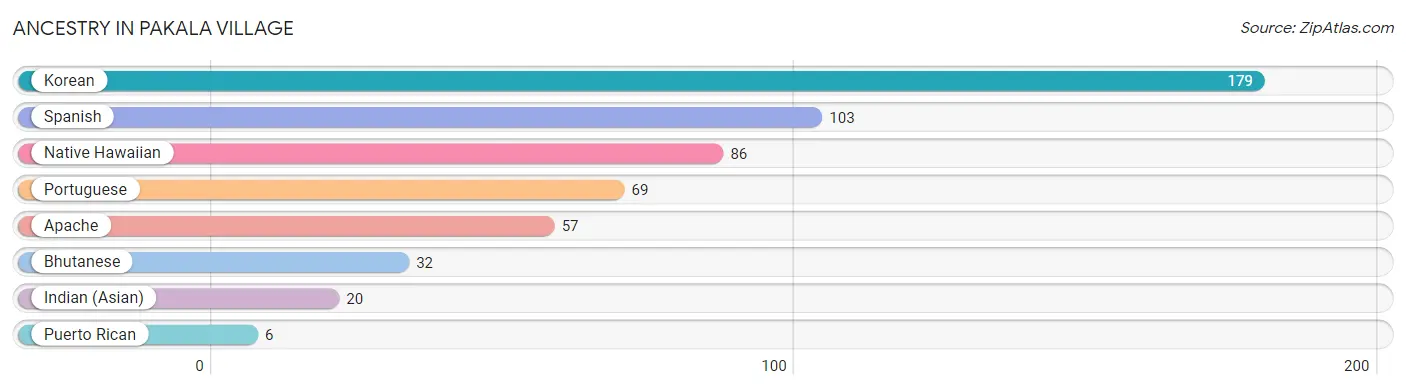
| Ancestry | # Population | % Population |
| Apache | 57 | 18.4% |
| Bhutanese | 32 | 10.4% |
| Indian (Asian) | 20 | 6.5% |
| Korean | 179 | 57.9% |
| Native Hawaiian | 86 | 27.8% |
| Portuguese | 69 | 22.3% |
| Puerto Rican | 6 | 1.9% |
| Spanish | 103 | 33.3% | View All 8 Rows |
Immigrants in Pakala Village
The most numerous immigrant groups reported in Pakala Village came from Asia (17 | 5.5%), Philippines (17 | 5.5%), and South Eastern Asia (17 | 5.5%), together accounting for 16.5% of all Pakala Village residents.
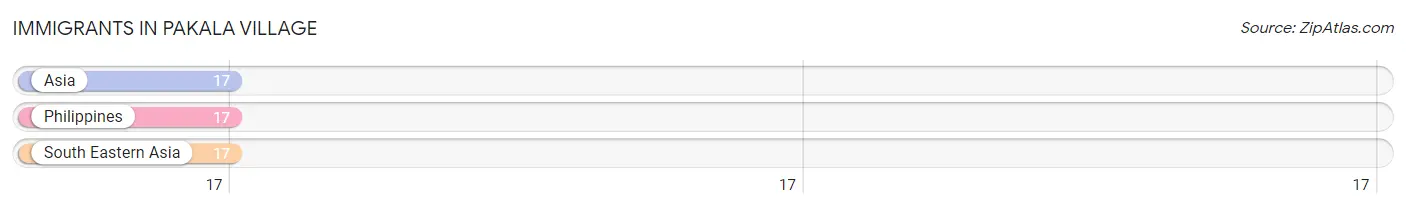
| Immigration Origin | # Population | % Population |
| Asia | 17 | 5.5% |
| Philippines | 17 | 5.5% |
| South Eastern Asia | 17 | 5.5% | View All 3 Rows |
Sex and Age in Pakala Village
Sex and Age in Pakala Village
The most populous age groups in Pakala Village are 5 to 9 Years (35 | 25.2%) for men and 25 to 29 Years (37 | 21.8%) for women.
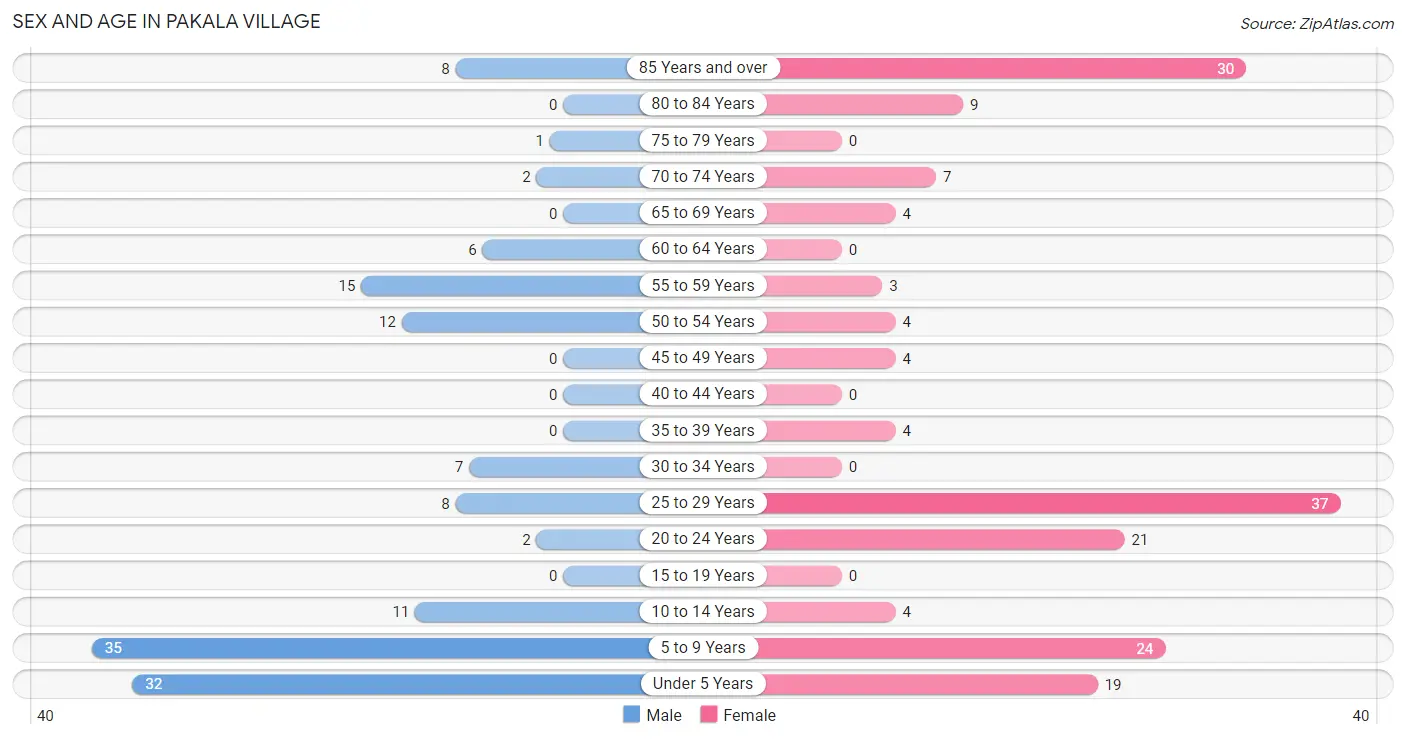
| Age Bracket | Male | Female |
| Under 5 Years | 32 (23.0%) | 19 (11.2%) |
| 5 to 9 Years | 35 (25.2%) | 24 (14.1%) |
| 10 to 14 Years | 11 (7.9%) | 4 (2.4%) |
| 15 to 19 Years | 0 (0.0%) | 0 (0.0%) |
| 20 to 24 Years | 2 (1.4%) | 21 (12.3%) |
| 25 to 29 Years | 8 (5.8%) | 37 (21.8%) |
| 30 to 34 Years | 7 (5.0%) | 0 (0.0%) |
| 35 to 39 Years | 0 (0.0%) | 4 (2.4%) |
| 40 to 44 Years | 0 (0.0%) | 0 (0.0%) |
| 45 to 49 Years | 0 (0.0%) | 4 (2.4%) |
| 50 to 54 Years | 12 (8.6%) | 4 (2.4%) |
| 55 to 59 Years | 15 (10.8%) | 3 (1.8%) |
| 60 to 64 Years | 6 (4.3%) | 0 (0.0%) |
| 65 to 69 Years | 0 (0.0%) | 4 (2.4%) |
| 70 to 74 Years | 2 (1.4%) | 7 (4.1%) |
| 75 to 79 Years | 1 (0.7%) | 0 (0.0%) |
| 80 to 84 Years | 0 (0.0%) | 9 (5.3%) |
| 85 Years and over | 8 (5.8%) | 30 (17.6%) |
| Total | 139 (100.0%) | 170 (100.0%) |
Families and Households in Pakala Village
Median Family Size in Pakala Village
The median family size in Pakala Village is 5.09 persons per family, with married-couple families (33 | 58.9%) accounting for the largest median family size of 6.33 persons per family. On the other hand, single female/mother families (20 | 35.7%) represent the smallest median family size with 3.15 persons per family.
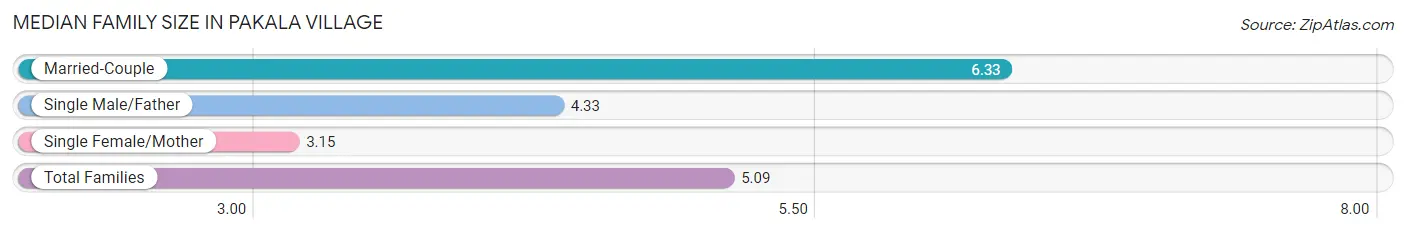
| Family Type | # Families | Family Size |
| Married-Couple | 33 (58.9%) | 6.33 |
| Single Male/Father | 3 (5.4%) | 4.33 |
| Single Female/Mother | 20 (35.7%) | 3.15 |
| Total Families | 56 (100.0%) | 5.09 |
Median Household Size in Pakala Village
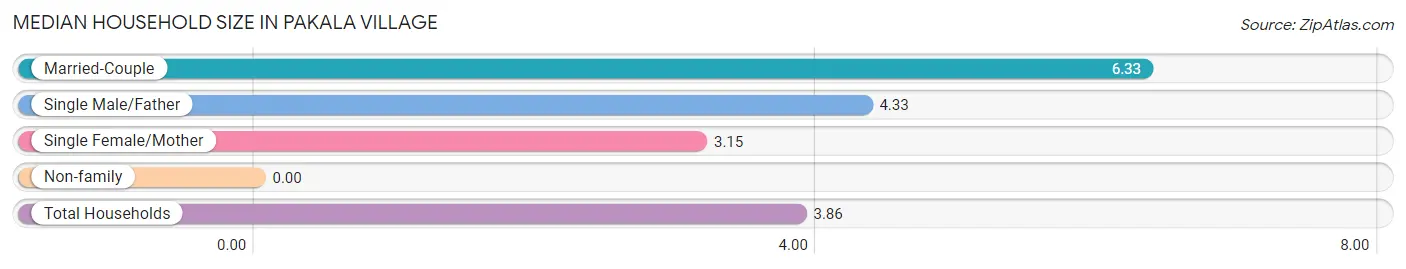
| Household Type | # Households | Household Size |
| Married-Couple | 33 (41.2%) | 6.33 |
| Single Male/Father | 3 (3.7%) | 4.33 |
| Single Female/Mother | 20 (25.0%) | 3.15 |
| Non-family | 24 (30.0%) | - |
| Total Households | 80 (100.0%) | 3.86 |
Household Size by Marriage Status in Pakala Village
Out of a total of 80 households in Pakala Village, 56 (70.0%) are family households, while 24 (30.0%) are nonfamily households. The most numerous type of family households are 3-person households, comprising 22, and the most common type of nonfamily households are 1-person households, comprising 24.
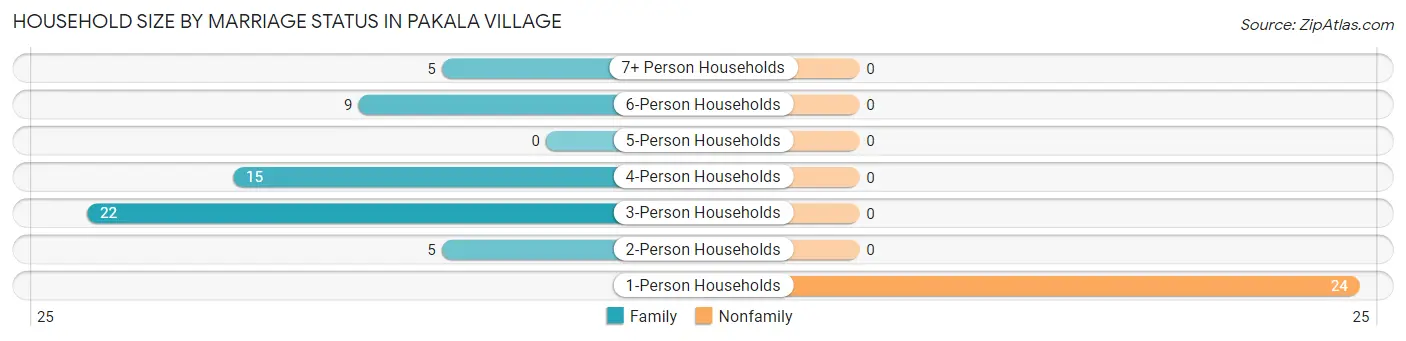
| Household Size | Family Households | Nonfamily Households |
| 1-Person Households | - | 24 (30.0%) |
| 2-Person Households | 5 (6.2%) | 0 (0.0%) |
| 3-Person Households | 22 (27.5%) | 0 (0.0%) |
| 4-Person Households | 15 (18.8%) | 0 (0.0%) |
| 5-Person Households | 0 (0.0%) | 0 (0.0%) |
| 6-Person Households | 9 (11.3%) | 0 (0.0%) |
| 7+ Person Households | 5 (6.2%) | 0 (0.0%) |
| Total | 56 (70.0%) | 24 (30.0%) |
Female Fertility in Pakala Village
Fertility by Age in Pakala Village
Average fertility rate in Pakala Village is 409.0 births per 1,000 women. Women in the age bracket of 20 to 34 years have the highest fertility rate with 466.0 births per 1,000 women. Women in the age bracket of 20 to 34 years acount for 100.0% of all women with births.
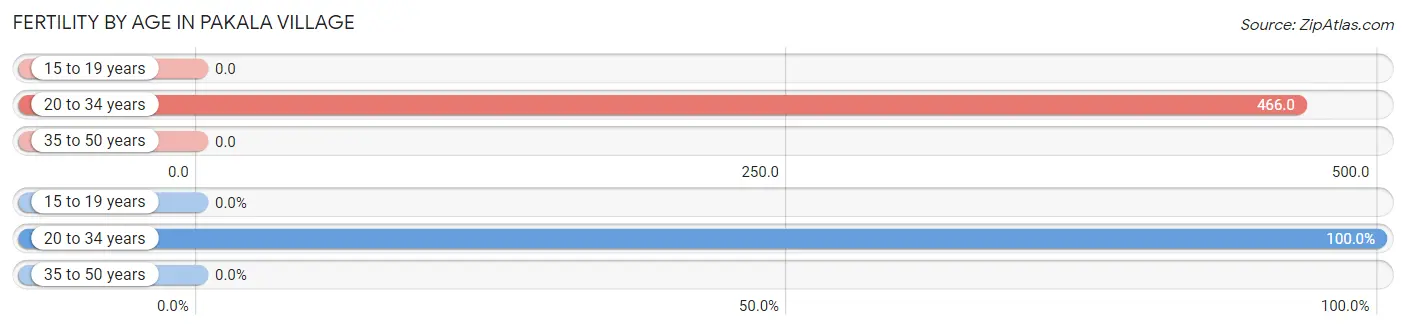
| Age Bracket | Women with Births | Births / 1,000 Women |
| 15 to 19 years | 0 (0.0%) | 0.0 |
| 20 to 34 years | 27 (100.0%) | 466.0 |
| 35 to 50 years | 0 (0.0%) | 0.0 |
| Total | 27 (100.0%) | 409.0 |
Fertility by Age by Marriage Status in Pakala Village
14.8% of women with births (27) in Pakala Village are married. The highest percentage of unmarried women with births falls into 20 to 34 years age bracket with 85.2% of them unmarried at the time of birth, while the lowest percentage of unmarried women with births belong to 20 to 34 years age bracket with 85.2% of them unmarried.
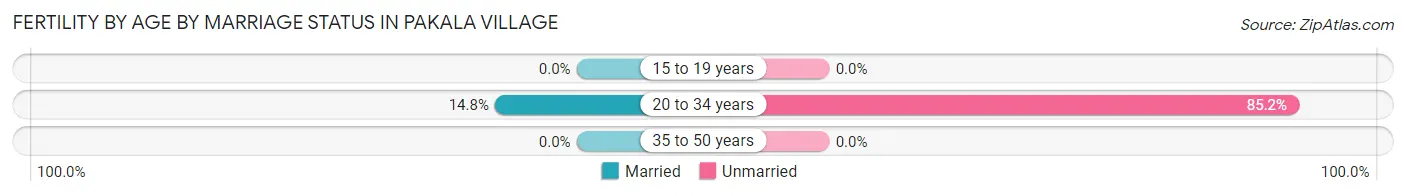
| Age Bracket | Married | Unmarried |
| 15 to 19 years | 0 (0.0%) | 0 (0.0%) |
| 20 to 34 years | 4 (14.8%) | 23 (85.2%) |
| 35 to 50 years | 0 (0.0%) | 0 (0.0%) |
| Total | 4 (14.8%) | 23 (85.2%) |
Fertility by Education in Pakala Village
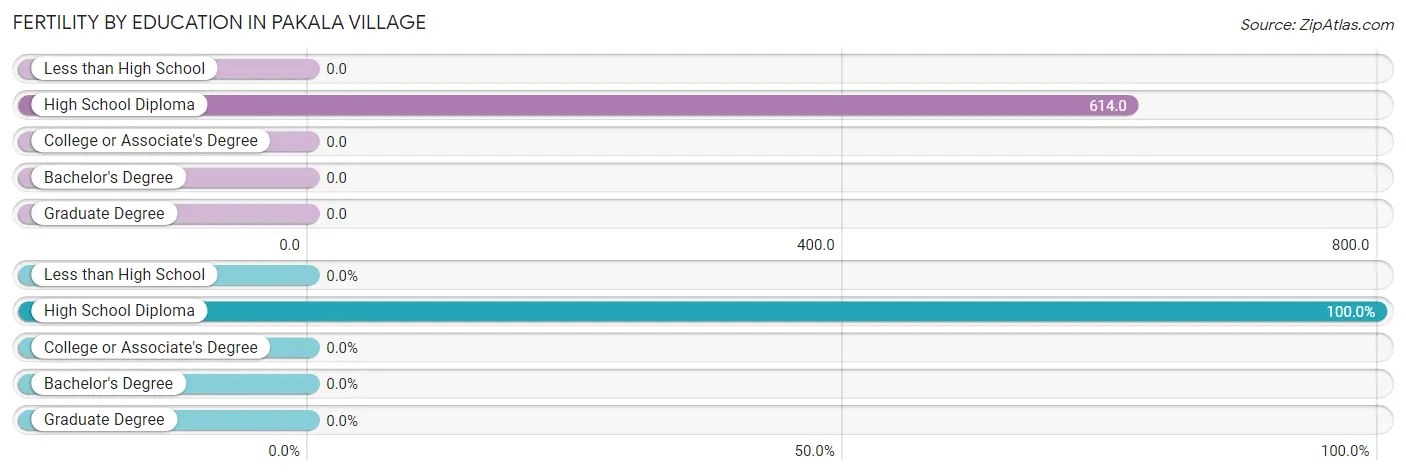
| Educational Attainment | Women with Births | Births / 1,000 Women |
| Less than High School | 0 (0.0%) | 0.0 |
| High School Diploma | 27 (100.0%) | 614.0 |
| College or Associate's Degree | 0 (0.0%) | 0.0 |
| Bachelor's Degree | 0 (0.0%) | 0.0 |
| Graduate Degree | 0 (0.0%) | 0.0 |
| Total | 27 (100.0%) | 409.0 |
Fertility by Education by Marriage Status in Pakala Village
85.2% of women with births in Pakala Village are unmarried. Women with the educational attainment of high school diploma are most likely to be married with 14.8% of them married at childbirth, while women with the educational attainment of high school diploma are least likely to be married with 85.2% of them unmarried at childbirth.
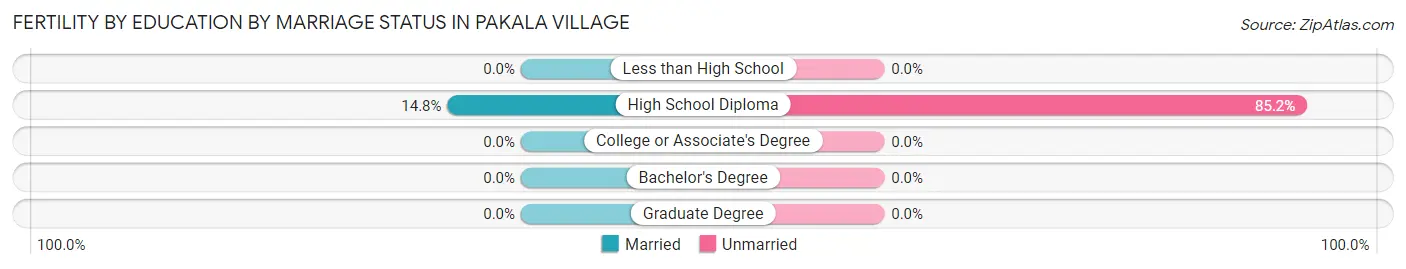
| Educational Attainment | Married | Unmarried |
| Less than High School | 0 (0.0%) | 0 (0.0%) |
| High School Diploma | 4 (14.8%) | 23 (85.2%) |
| College or Associate's Degree | 0 (0.0%) | 0 (0.0%) |
| Bachelor's Degree | 0 (0.0%) | 0 (0.0%) |
| Graduate Degree | 0 (0.0%) | 0 (0.0%) |
| Total | 4 (14.8%) | 23 (85.2%) |
Employment Characteristics in Pakala Village
Employment by Class of Employer in Pakala Village
Among the 63 employed individuals in Pakala Village, private company employees (40 | 63.5%), state government employees (14 | 22.2%), and not-for-profit organizations (9 | 14.3%) make up the most common classes of employment.
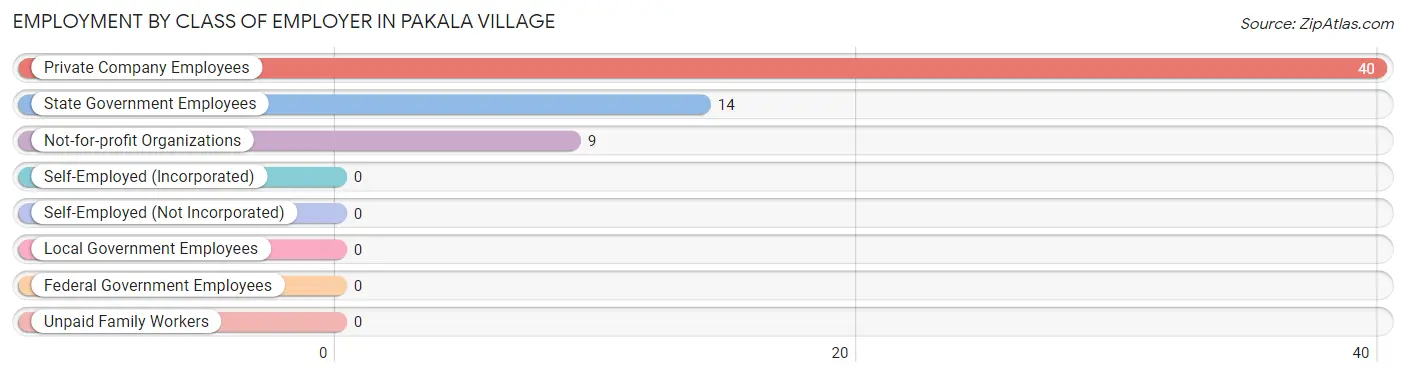
| Employer Class | # Employees | % Employees |
| Private Company Employees | 40 | 63.5% |
| Self-Employed (Incorporated) | 0 | 0.0% |
| Self-Employed (Not Incorporated) | 0 | 0.0% |
| Not-for-profit Organizations | 9 | 14.3% |
| Local Government Employees | 0 | 0.0% |
| State Government Employees | 14 | 22.2% |
| Federal Government Employees | 0 | 0.0% |
| Unpaid Family Workers | 0 | 0.0% |
| Total | 63 | 100.0% |
Employment Status by Age in Pakala Village
According to the labor force statistics for Pakala Village, out of the total population over 16 years of age (184), 38.6% or 71 individuals are in the labor force, with 8.5% or 6 of them unemployed. The age group with the highest labor force participation rate is 35 to 44 years, with 100.0% or 4 individuals in the labor force. Within the labor force, the 25 to 29 years age range has the highest percentage of unemployed individuals, with 31.6% or 6 of them being unemployed.
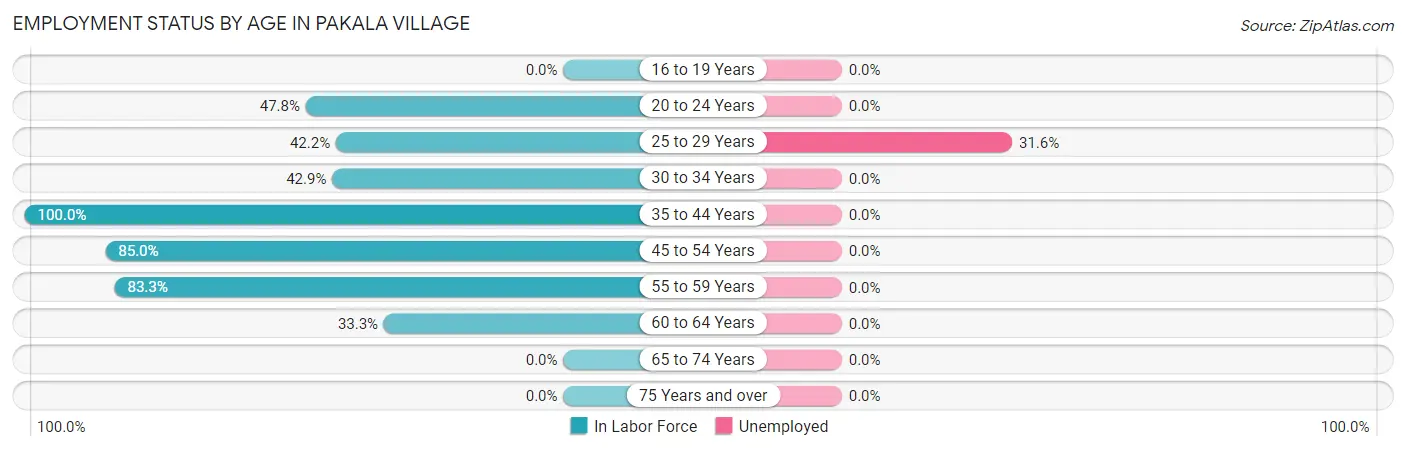
| Age Bracket | In Labor Force | Unemployed |
| 16 to 19 Years | 0 (0.0%) | 0 (0.0%) |
| 20 to 24 Years | 11 (47.8%) | 0 (0.0%) |
| 25 to 29 Years | 19 (42.2%) | 6 (31.6%) |
| 30 to 34 Years | 3 (42.9%) | 0 (0.0%) |
| 35 to 44 Years | 4 (100.0%) | 0 (0.0%) |
| 45 to 54 Years | 17 (85.0%) | 0 (0.0%) |
| 55 to 59 Years | 15 (83.3%) | 0 (0.0%) |
| 60 to 64 Years | 2 (33.3%) | 0 (0.0%) |
| 65 to 74 Years | 0 (0.0%) | 0 (0.0%) |
| 75 Years and over | 0 (0.0%) | 0 (0.0%) |
| Total | 71 (38.6%) | 6 (8.5%) |
Employment Status by Educational Attainment in Pakala Village
According to labor force statistics for Pakala Village, 60.0% of individuals (60) out of the total population between 25 and 64 years of age (100) are in the labor force, with 10.0% or 6 of them being unemployed. The group with the highest labor force participation rate are those with the educational attainment of less than high school, with 100.0% or 9 individuals in the labor force. Within the labor force, individuals with high school diploma education have the highest percentage of unemployment, with 22.2% or 6 of them being unemployed.
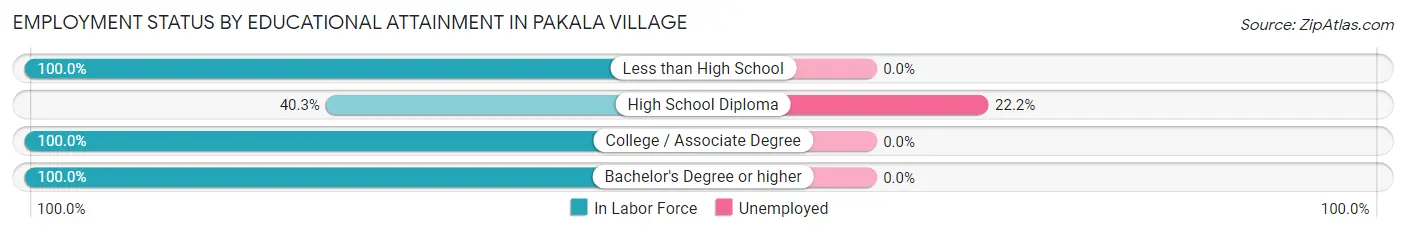
| Educational Attainment | In Labor Force | Unemployed |
| Less than High School | 9 (100.0%) | 0 (0.0%) |
| High School Diploma | 27 (40.3%) | 15 (22.2%) |
| College / Associate Degree | 20 (100.0%) | 0 (0.0%) |
| Bachelor's Degree or higher | 4 (100.0%) | 0 (0.0%) |
| Total | 60 (60.0%) | 10 (10.0%) |
Employment Occupations by Sex in Pakala Village
Management, Business, Science and Arts Occupations
The most common Management, Business, Science and Arts occupations in Pakala Village are Business & Financial (9 | 13.9%), Management (4 | 6.1%), Computers, Engineering & Science (4 | 6.1%), and Life, Physical & Social Science (4 | 6.1%).
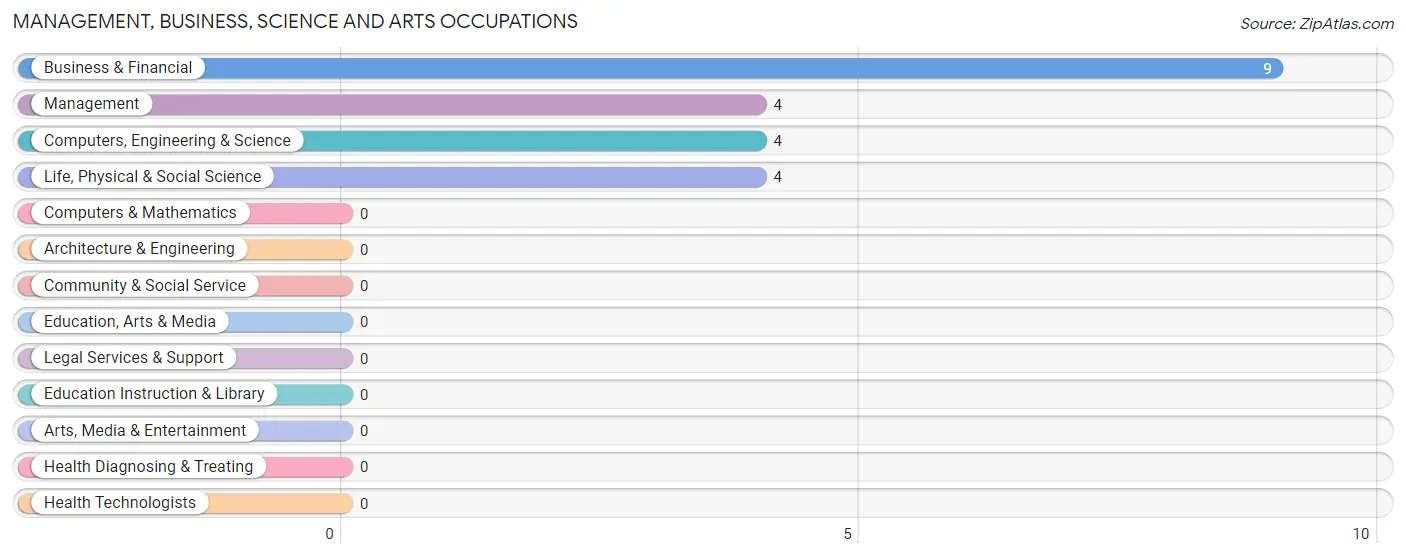
Management, Business, Science and Arts Occupations by Sex
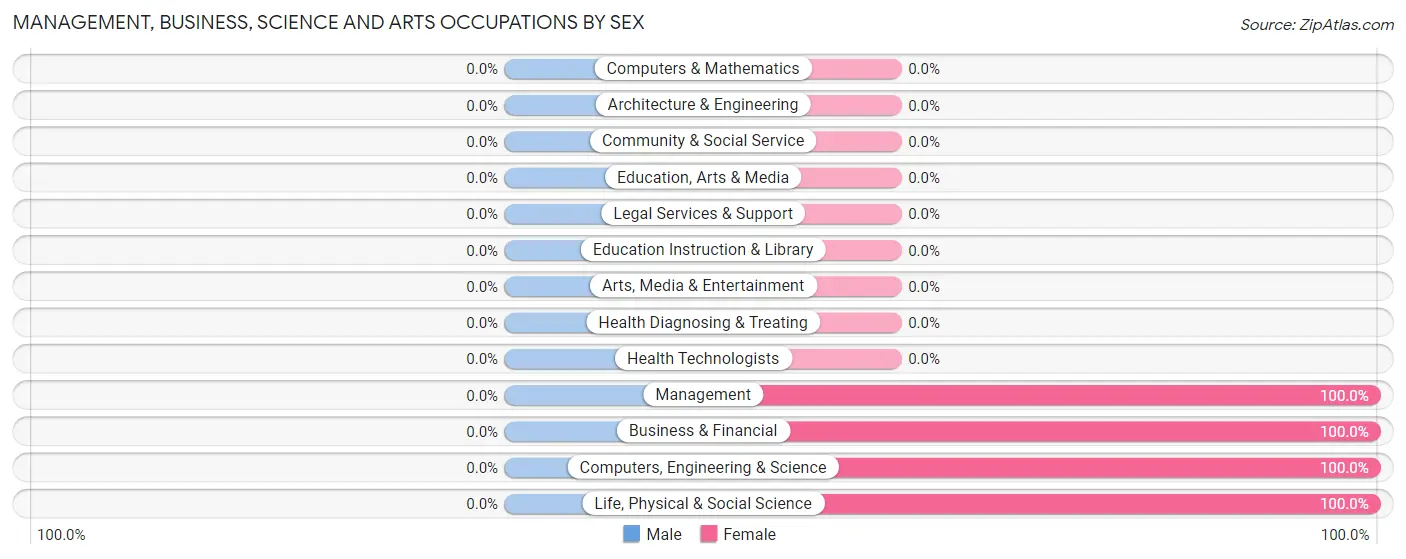
| Occupation | Male | Female |
| Management | 0 (0.0%) | 4 (100.0%) |
| Business & Financial | 0 (0.0%) | 9 (100.0%) |
| Computers, Engineering & Science | 0 (0.0%) | 4 (100.0%) |
| Computers & Mathematics | 0 (0.0%) | 0 (0.0%) |
| Architecture & Engineering | 0 (0.0%) | 0 (0.0%) |
| Life, Physical & Social Science | 0 (0.0%) | 4 (100.0%) |
| Community & Social Service | 0 (0.0%) | 0 (0.0%) |
| Education, Arts & Media | 0 (0.0%) | 0 (0.0%) |
| Legal Services & Support | 0 (0.0%) | 0 (0.0%) |
| Education Instruction & Library | 0 (0.0%) | 0 (0.0%) |
| Arts, Media & Entertainment | 0 (0.0%) | 0 (0.0%) |
| Health Diagnosing & Treating | 0 (0.0%) | 0 (0.0%) |
| Health Technologists | 0 (0.0%) | 0 (0.0%) |
| Total (Category) | 0 (0.0%) | 17 (100.0%) |
| Total (Overall) | 30 (46.2%) | 35 (53.8%) |
Services Occupations
The most common Services occupations in Pakala Village are Cleaning & Maintenance (10 | 15.4%), and Food Preparation & Serving (2 | 3.1%).
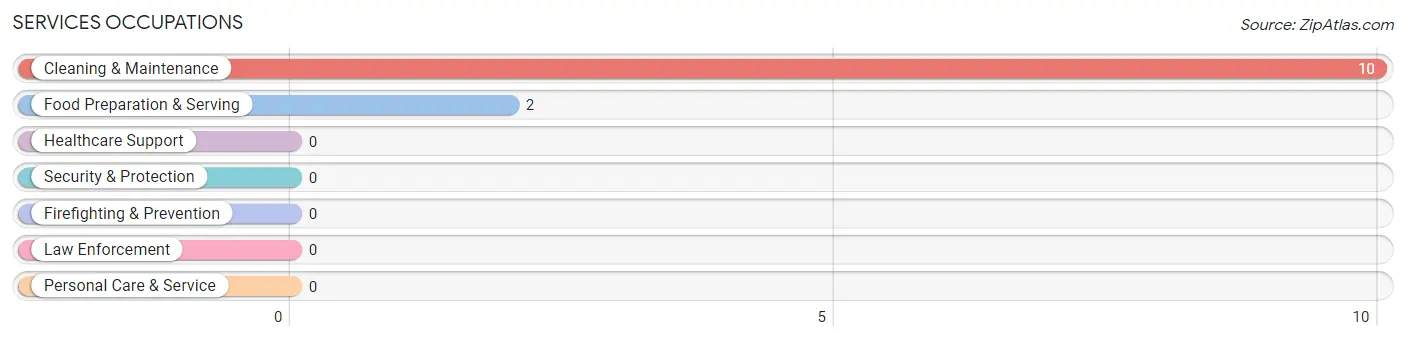
Services Occupations by Sex
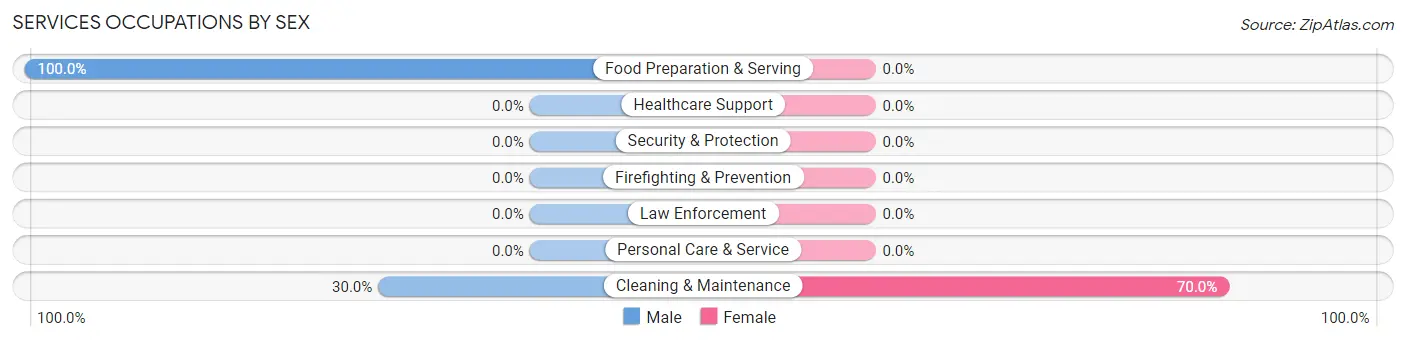
| Occupation | Male | Female |
| Healthcare Support | 0 (0.0%) | 0 (0.0%) |
| Security & Protection | 0 (0.0%) | 0 (0.0%) |
| Firefighting & Prevention | 0 (0.0%) | 0 (0.0%) |
| Law Enforcement | 0 (0.0%) | 0 (0.0%) |
| Food Preparation & Serving | 2 (100.0%) | 0 (0.0%) |
| Cleaning & Maintenance | 3 (30.0%) | 7 (70.0%) |
| Personal Care & Service | 0 (0.0%) | 0 (0.0%) |
| Total (Category) | 5 (41.7%) | 7 (58.3%) |
| Total (Overall) | 30 (46.2%) | 35 (53.8%) |
Sales and Office Occupations
The most common Sales and Office occupations in Pakala Village are Office & Administration (5 | 7.7%), and Sales & Related (2 | 3.1%).
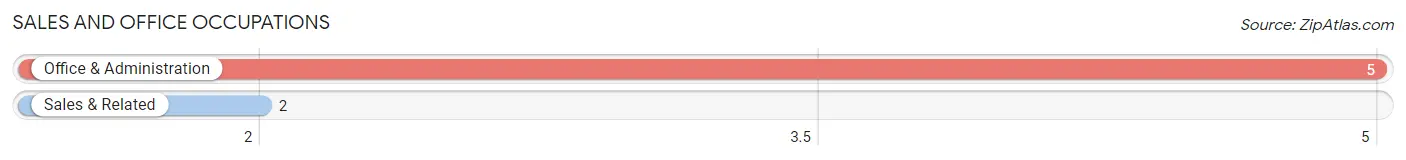
Sales and Office Occupations by Sex
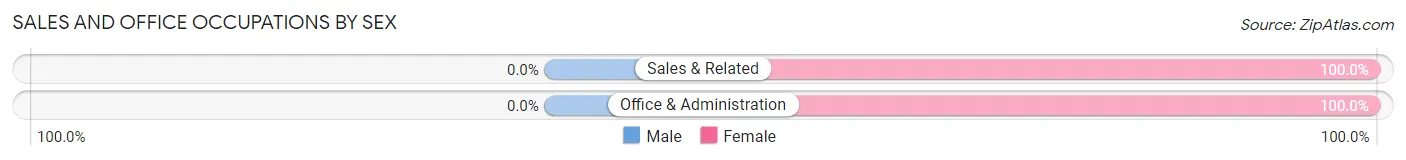
| Occupation | Male | Female |
| Sales & Related | 0 (0.0%) | 2 (100.0%) |
| Office & Administration | 0 (0.0%) | 5 (100.0%) |
| Total (Category) | 0 (0.0%) | 7 (100.0%) |
| Total (Overall) | 30 (46.2%) | 35 (53.8%) |
Natural Resources, Construction and Maintenance Occupations
The most common Natural Resources, Construction and Maintenance occupations in Pakala Village are Construction & Extraction (12 | 18.5%), Farming, Fishing & Forestry (2 | 3.1%), and Installation, Maintenance & Repair (2 | 3.1%).
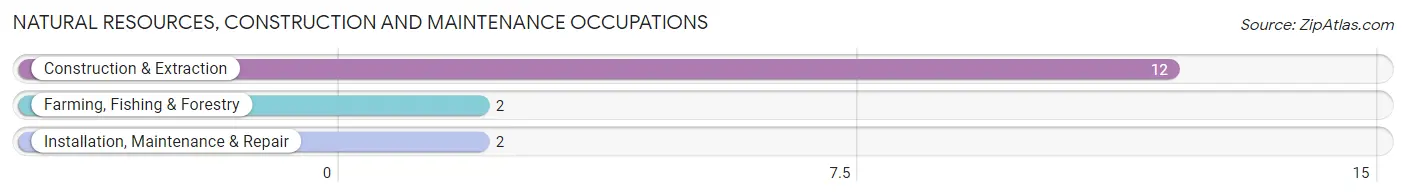
Natural Resources, Construction and Maintenance Occupations by Sex
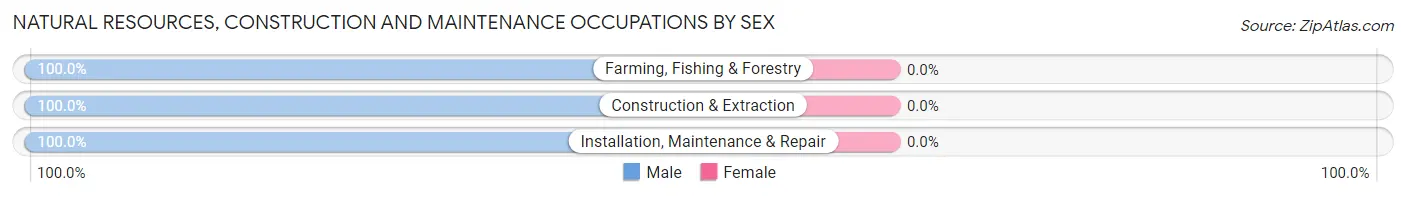
| Occupation | Male | Female |
| Farming, Fishing & Forestry | 2 (100.0%) | 0 (0.0%) |
| Construction & Extraction | 12 (100.0%) | 0 (0.0%) |
| Installation, Maintenance & Repair | 2 (100.0%) | 0 (0.0%) |
| Total (Category) | 16 (100.0%) | 0 (0.0%) |
| Total (Overall) | 30 (46.2%) | 35 (53.8%) |
Production, Transportation and Moving Occupations
The most common Production, Transportation and Moving occupations in Pakala Village are Production (6 | 9.2%), Material Moving (4 | 6.1%), and Transportation (3 | 4.6%).
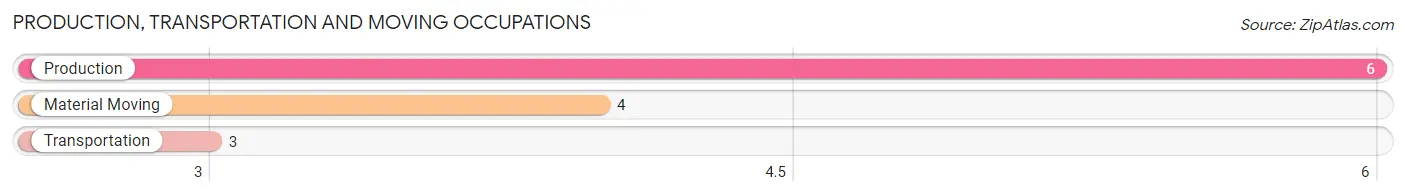
Production, Transportation and Moving Occupations by Sex
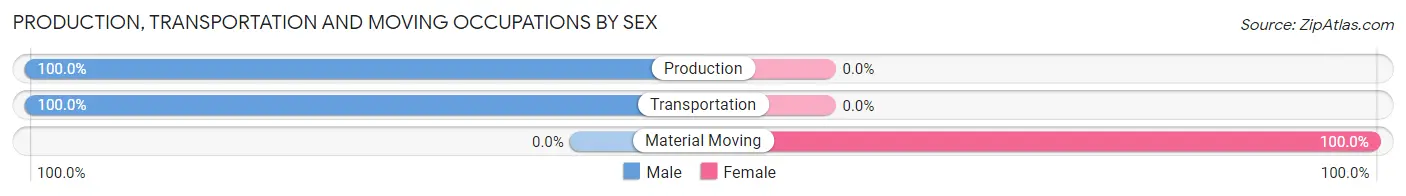
| Occupation | Male | Female |
| Production | 6 (100.0%) | 0 (0.0%) |
| Transportation | 3 (100.0%) | 0 (0.0%) |
| Material Moving | 0 (0.0%) | 4 (100.0%) |
| Total (Category) | 9 (69.2%) | 4 (30.8%) |
| Total (Overall) | 30 (46.2%) | 35 (53.8%) |
Employment Industries by Sex in Pakala Village
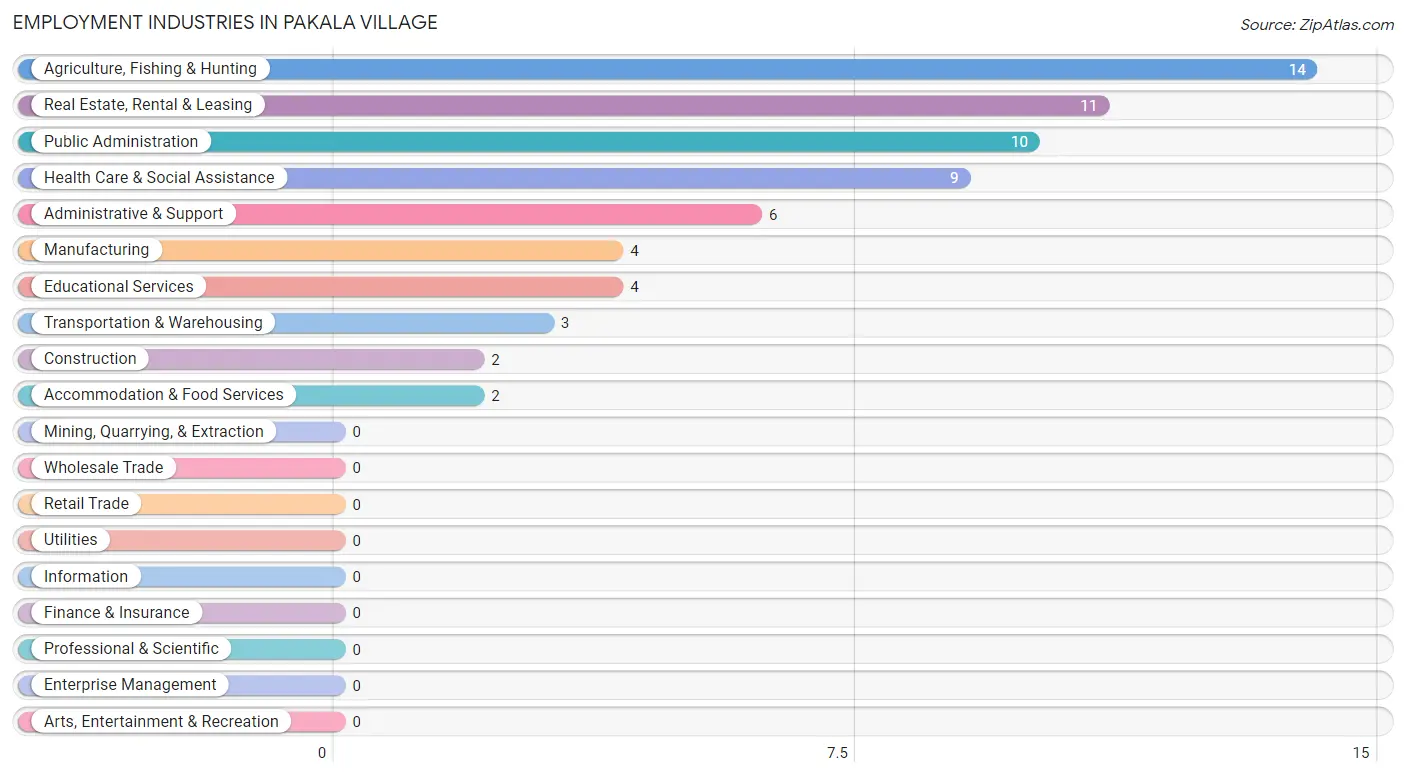
Employment Industries in Pakala Village
The major employment industries in Pakala Village include Agriculture, Fishing & Hunting (14 | 21.5%), Real Estate, Rental & Leasing (11 | 16.9%), Public Administration (10 | 15.4%), Health Care & Social Assistance (9 | 13.9%), and Administrative & Support (6 | 9.2%).
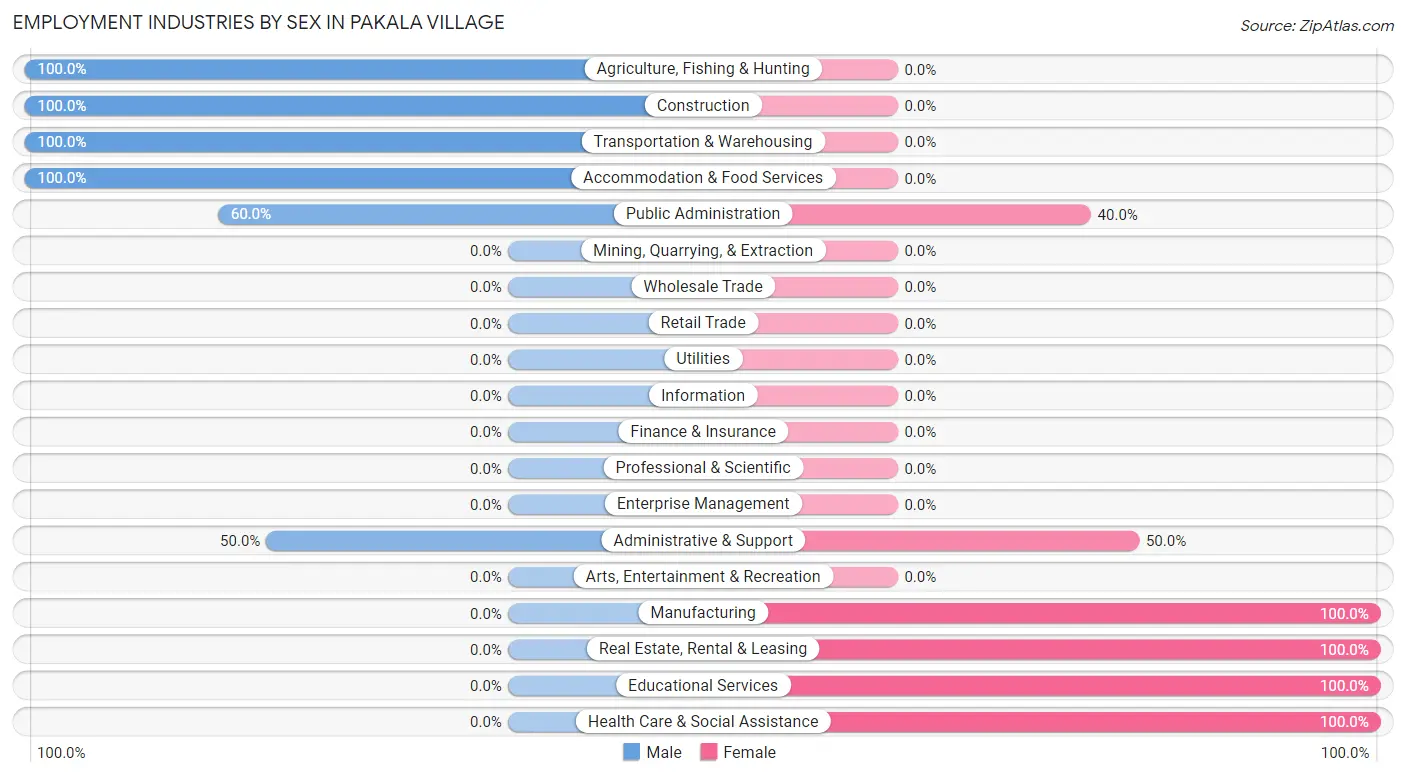
Employment Industries by Sex in Pakala Village
The Pakala Village industries that see more men than women are Agriculture, Fishing & Hunting (100.0%), Construction (100.0%), and Transportation & Warehousing (100.0%), whereas the industries that tend to have a higher number of women are Manufacturing (100.0%), Real Estate, Rental & Leasing (100.0%), and Educational Services (100.0%).
| Industry | Male | Female |
| Agriculture, Fishing & Hunting | 14 (100.0%) | 0 (0.0%) |
| Mining, Quarrying, & Extraction | 0 (0.0%) | 0 (0.0%) |
| Construction | 2 (100.0%) | 0 (0.0%) |
| Manufacturing | 0 (0.0%) | 4 (100.0%) |
| Wholesale Trade | 0 (0.0%) | 0 (0.0%) |
| Retail Trade | 0 (0.0%) | 0 (0.0%) |
| Transportation & Warehousing | 3 (100.0%) | 0 (0.0%) |
| Utilities | 0 (0.0%) | 0 (0.0%) |
| Information | 0 (0.0%) | 0 (0.0%) |
| Finance & Insurance | 0 (0.0%) | 0 (0.0%) |
| Real Estate, Rental & Leasing | 0 (0.0%) | 11 (100.0%) |
| Professional & Scientific | 0 (0.0%) | 0 (0.0%) |
| Enterprise Management | 0 (0.0%) | 0 (0.0%) |
| Administrative & Support | 3 (50.0%) | 3 (50.0%) |
| Educational Services | 0 (0.0%) | 4 (100.0%) |
| Health Care & Social Assistance | 0 (0.0%) | 9 (100.0%) |
| Arts, Entertainment & Recreation | 0 (0.0%) | 0 (0.0%) |
| Accommodation & Food Services | 2 (100.0%) | 0 (0.0%) |
| Public Administration | 6 (60.0%) | 4 (40.0%) |
| Total | 30 (46.2%) | 35 (53.8%) |
Education in Pakala Village
School Enrollment in Pakala Village
The most common levels of schooling among the 101 students in Pakala Village are elementary school (39 | 38.6%), nursery / preschool (27 | 26.7%), and kindergarten (24 | 23.8%).
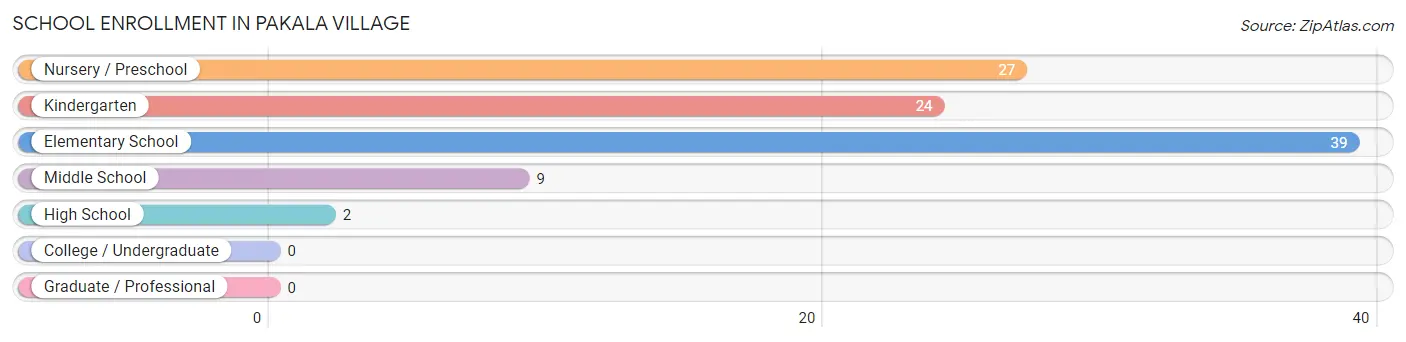
| School Level | # Students | % Students |
| Nursery / Preschool | 27 | 26.7% |
| Kindergarten | 24 | 23.8% |
| Elementary School | 39 | 38.6% |
| Middle School | 9 | 8.9% |
| High School | 2 | 2.0% |
| College / Undergraduate | 0 | 0.0% |
| Graduate / Professional | 0 | 0.0% |
| Total | 101 | 100.0% |
School Enrollment by Age by Funding Source in Pakala Village
Out of a total of 101 students who are enrolled in schools in Pakala Village, 43 (42.6%) attend a private institution, while the remaining 58 (57.4%) are enrolled in public schools. The age group of 3 to 4 year olds has the highest likelihood of being enrolled in private schools, with 27 (100.0% in the age bracket) enrolled. Conversely, the age group of 10 to 14 year olds has the lowest likelihood of being enrolled in a private school, with 12 (80.0% in the age bracket) attending a public institution.
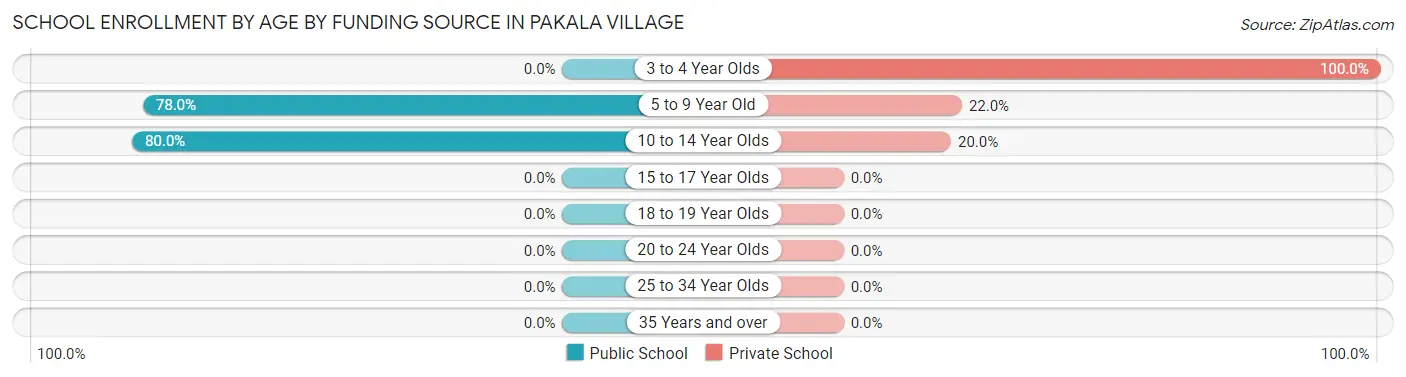
| Age Bracket | Public School | Private School |
| 3 to 4 Year Olds | 0 (0.0%) | 27 (100.0%) |
| 5 to 9 Year Old | 46 (78.0%) | 13 (22.0%) |
| 10 to 14 Year Olds | 12 (80.0%) | 3 (20.0%) |
| 15 to 17 Year Olds | 0 (0.0%) | 0 (0.0%) |
| 18 to 19 Year Olds | 0 (0.0%) | 0 (0.0%) |
| 20 to 24 Year Olds | 0 (0.0%) | 0 (0.0%) |
| 25 to 34 Year Olds | 0 (0.0%) | 0 (0.0%) |
| 35 Years and over | 0 (0.0%) | 0 (0.0%) |
| Total | 58 (57.4%) | 43 (42.6%) |
Educational Attainment by Field of Study in Pakala Village
, and social sciences (4 | 100.0%) are the most common fields of study among 4 individuals in Pakala Village who have obtained a bachelor's degree or higher.
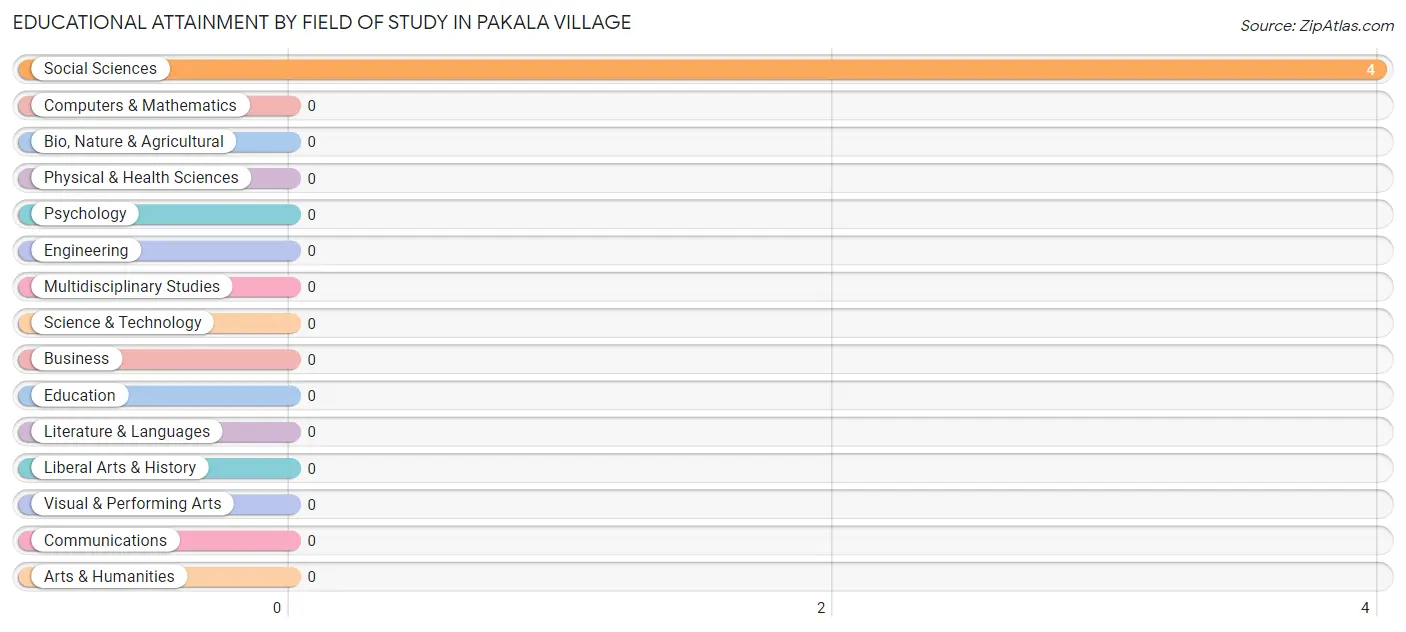
| Field of Study | # Graduates | % Graduates |
| Computers & Mathematics | 0 | 0.0% |
| Bio, Nature & Agricultural | 0 | 0.0% |
| Physical & Health Sciences | 0 | 0.0% |
| Psychology | 0 | 0.0% |
| Social Sciences | 4 | 100.0% |
| Engineering | 0 | 0.0% |
| Multidisciplinary Studies | 0 | 0.0% |
| Science & Technology | 0 | 0.0% |
| Business | 0 | 0.0% |
| Education | 0 | 0.0% |
| Literature & Languages | 0 | 0.0% |
| Liberal Arts & History | 0 | 0.0% |
| Visual & Performing Arts | 0 | 0.0% |
| Communications | 0 | 0.0% |
| Arts & Humanities | 0 | 0.0% |
| Total | 4 | 100.0% |
Transportation & Commute in Pakala Village
Vehicle Availability by Sex in Pakala Village
The most prevalent vehicle ownership categories in Pakala Village are males with 3 vehicles (14, accounting for 50.0%) and females with 3 vehicles (30, making up 40.0%).
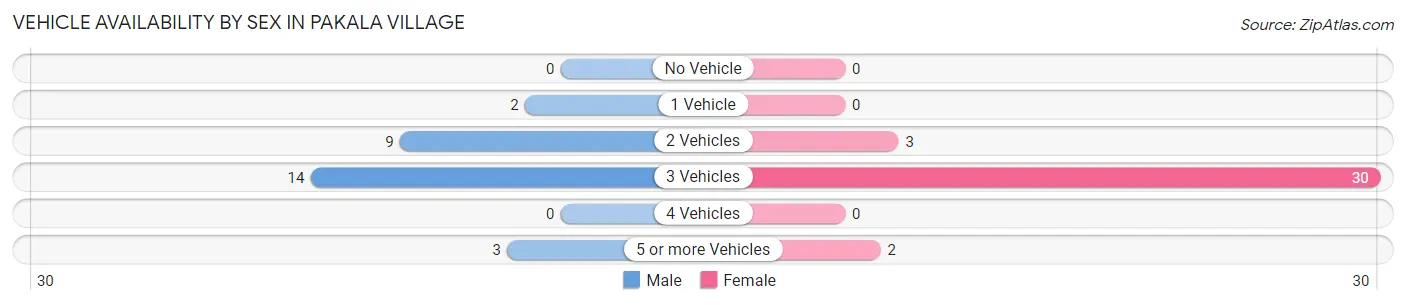
| Vehicles Available | Male | Female |
| No Vehicle | 0 (0.0%) | 0 (0.0%) |
| 1 Vehicle | 2 (7.1%) | 0 (0.0%) |
| 2 Vehicles | 9 (32.1%) | 3 (8.6%) |
| 3 Vehicles | 14 (50.0%) | 30 (85.7%) |
| 4 Vehicles | 0 (0.0%) | 0 (0.0%) |
| 5 or more Vehicles | 3 (10.7%) | 2 (5.7%) |
| Total | 28 (100.0%) | 35 (100.0%) |
Commute Time in Pakala Village
The most frequently occuring commute durations in Pakala Village are 45 to 59 minutes (15 commuters, 23.8%), 60 to 89 minutes (14 commuters, 22.2%), and 15 to 19 minutes (10 commuters, 15.9%).
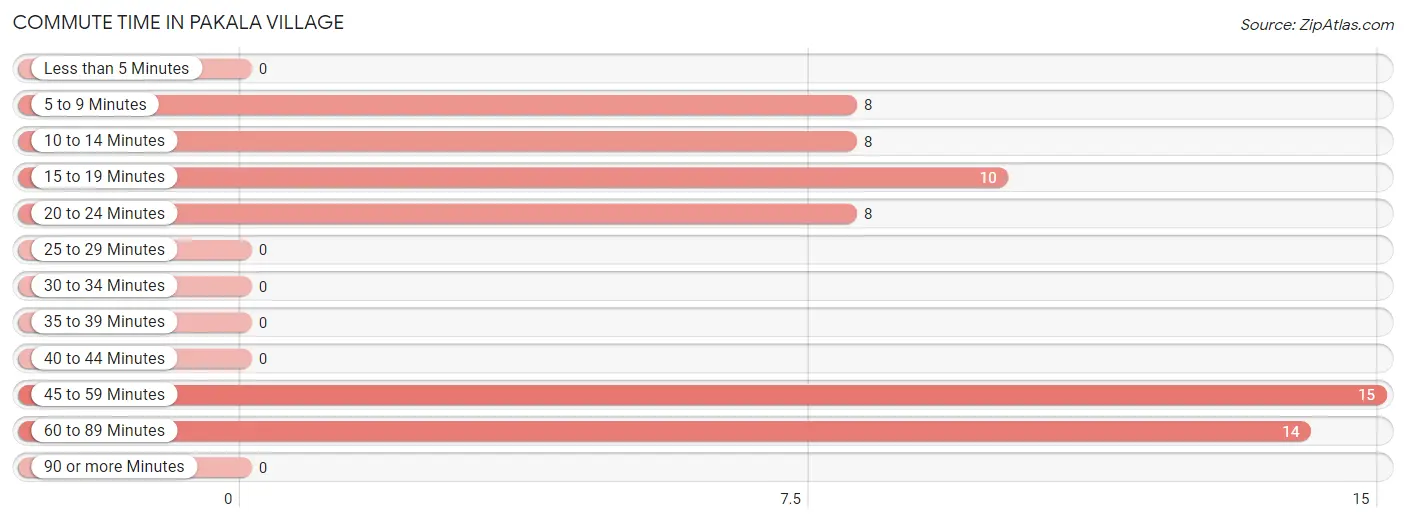
| Commute Time | # Commuters | % Commuters |
| Less than 5 Minutes | 0 | 0.0% |
| 5 to 9 Minutes | 8 | 12.7% |
| 10 to 14 Minutes | 8 | 12.7% |
| 15 to 19 Minutes | 10 | 15.9% |
| 20 to 24 Minutes | 8 | 12.7% |
| 25 to 29 Minutes | 0 | 0.0% |
| 30 to 34 Minutes | 0 | 0.0% |
| 35 to 39 Minutes | 0 | 0.0% |
| 40 to 44 Minutes | 0 | 0.0% |
| 45 to 59 Minutes | 15 | 23.8% |
| 60 to 89 Minutes | 14 | 22.2% |
| 90 or more Minutes | 0 | 0.0% |
Commute Time by Sex in Pakala Village
The most common commute times in Pakala Village are 20 to 24 minutes (8 commuters, 28.6%) for males and 60 to 89 minutes (11 commuters, 31.4%) for females.
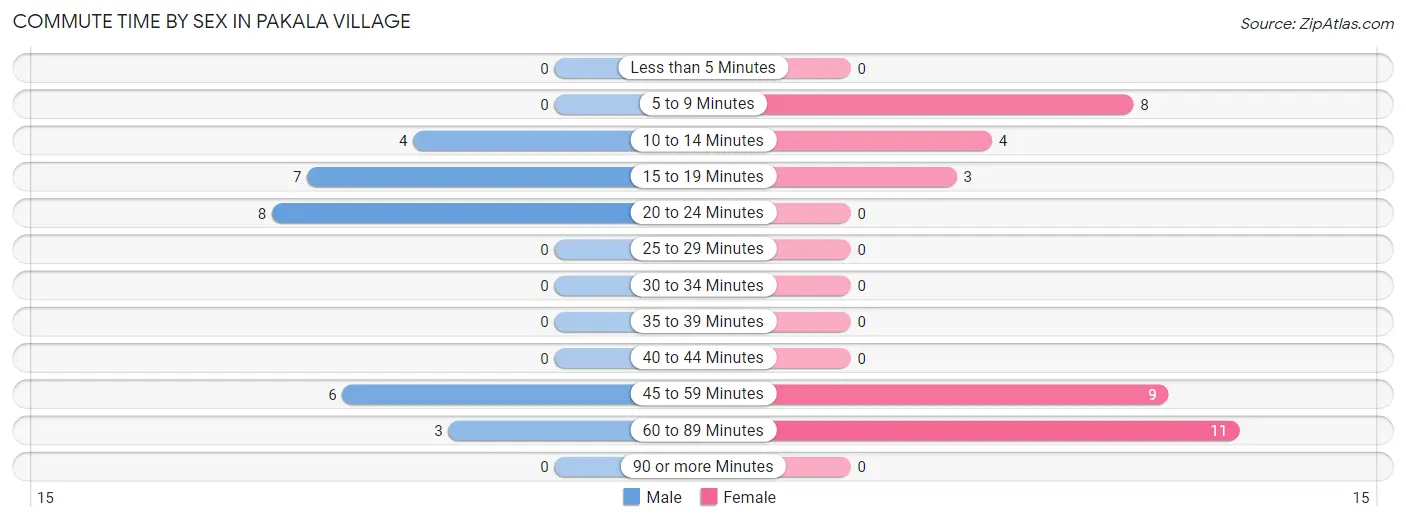
| Commute Time | Male | Female |
| Less than 5 Minutes | 0 (0.0%) | 0 (0.0%) |
| 5 to 9 Minutes | 0 (0.0%) | 8 (22.9%) |
| 10 to 14 Minutes | 4 (14.3%) | 4 (11.4%) |
| 15 to 19 Minutes | 7 (25.0%) | 3 (8.6%) |
| 20 to 24 Minutes | 8 (28.6%) | 0 (0.0%) |
| 25 to 29 Minutes | 0 (0.0%) | 0 (0.0%) |
| 30 to 34 Minutes | 0 (0.0%) | 0 (0.0%) |
| 35 to 39 Minutes | 0 (0.0%) | 0 (0.0%) |
| 40 to 44 Minutes | 0 (0.0%) | 0 (0.0%) |
| 45 to 59 Minutes | 6 (21.4%) | 9 (25.7%) |
| 60 to 89 Minutes | 3 (10.7%) | 11 (31.4%) |
| 90 or more Minutes | 0 (0.0%) | 0 (0.0%) |
Time of Departure to Work by Sex in Pakala Village
The most frequent times of departure to work in Pakala Village are 6:00 AM to 6:29 AM (10, 35.7%) for males and 6:30 AM to 6:59 AM (13, 37.1%) for females.
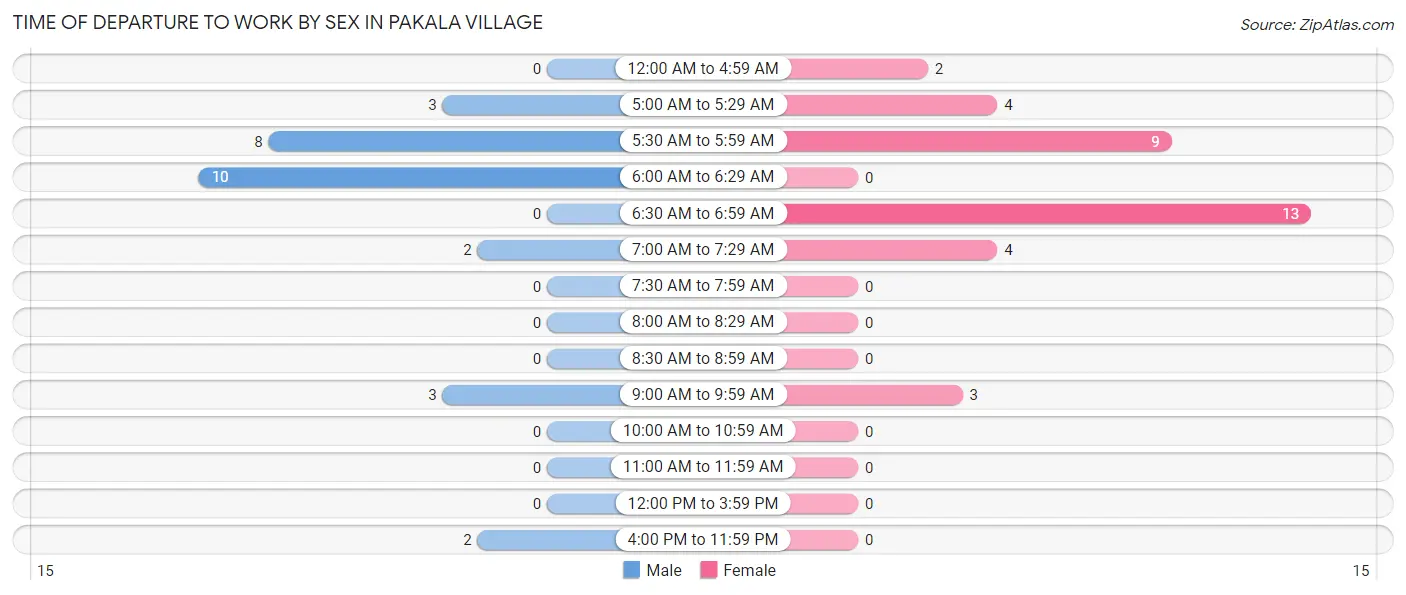
| Time of Departure | Male | Female |
| 12:00 AM to 4:59 AM | 0 (0.0%) | 2 (5.7%) |
| 5:00 AM to 5:29 AM | 3 (10.7%) | 4 (11.4%) |
| 5:30 AM to 5:59 AM | 8 (28.6%) | 9 (25.7%) |
| 6:00 AM to 6:29 AM | 10 (35.7%) | 0 (0.0%) |
| 6:30 AM to 6:59 AM | 0 (0.0%) | 13 (37.1%) |
| 7:00 AM to 7:29 AM | 2 (7.1%) | 4 (11.4%) |
| 7:30 AM to 7:59 AM | 0 (0.0%) | 0 (0.0%) |
| 8:00 AM to 8:29 AM | 0 (0.0%) | 0 (0.0%) |
| 8:30 AM to 8:59 AM | 0 (0.0%) | 0 (0.0%) |
| 9:00 AM to 9:59 AM | 3 (10.7%) | 3 (8.6%) |
| 10:00 AM to 10:59 AM | 0 (0.0%) | 0 (0.0%) |
| 11:00 AM to 11:59 AM | 0 (0.0%) | 0 (0.0%) |
| 12:00 PM to 3:59 PM | 0 (0.0%) | 0 (0.0%) |
| 4:00 PM to 11:59 PM | 2 (7.1%) | 0 (0.0%) |
| Total | 28 (100.0%) | 35 (100.0%) |
Housing Occupancy in Pakala Village
Occupancy by Ownership in Pakala Village
Of the total 80 dwellings in Pakala Village, owner-occupied units account for 0 (0.0%), while renter-occupied units make up 80 (100.0%).
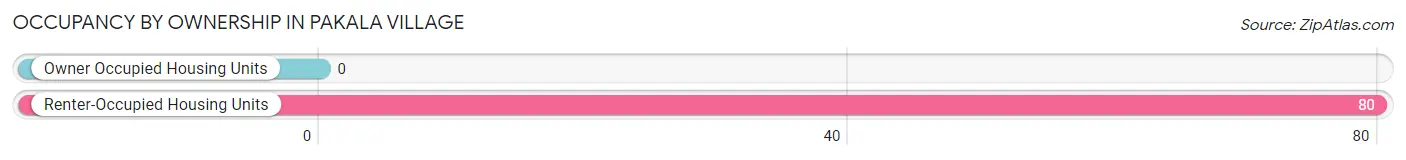
| Occupancy | # Housing Units | % Housing Units |
| Owner Occupied Housing Units | 0 | 0.0% |
| Renter-Occupied Housing Units | 80 | 100.0% |
| Total Occupied Housing Units | 80 | 100.0% |
Occupancy by Household Size in Pakala Village
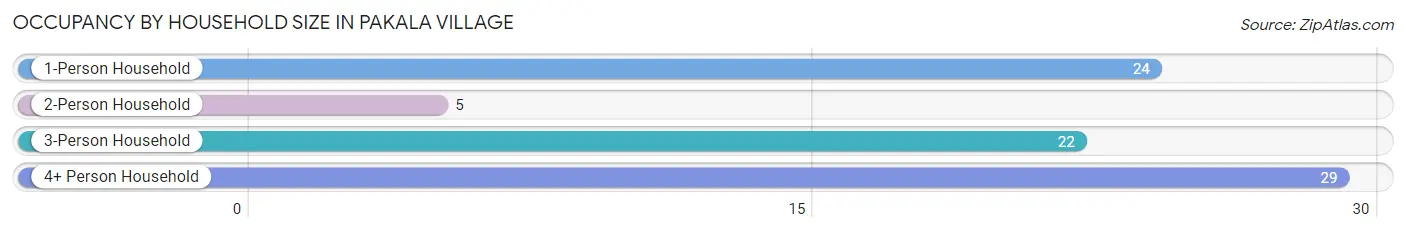
| Household Size | # Housing Units | % Housing Units |
| 1-Person Household | 24 | 30.0% |
| 2-Person Household | 5 | 6.2% |
| 3-Person Household | 22 | 27.5% |
| 4+ Person Household | 29 | 36.2% |
| Total Housing Units | 80 | 100.0% |
Occupancy by Ownership by Household Size in Pakala Village
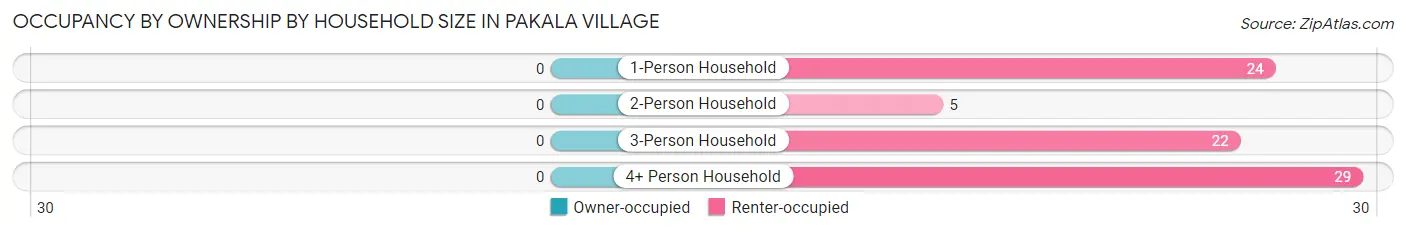
| Household Size | Owner-occupied | Renter-occupied |
| 1-Person Household | 0 (0.0%) | 24 (100.0%) |
| 2-Person Household | 0 (0.0%) | 5 (100.0%) |
| 3-Person Household | 0 (0.0%) | 22 (100.0%) |
| 4+ Person Household | 0 (0.0%) | 29 (100.0%) |
| Total Housing Units | 0 (0.0%) | 80 (100.0%) |
Occupancy by Educational Attainment in Pakala Village
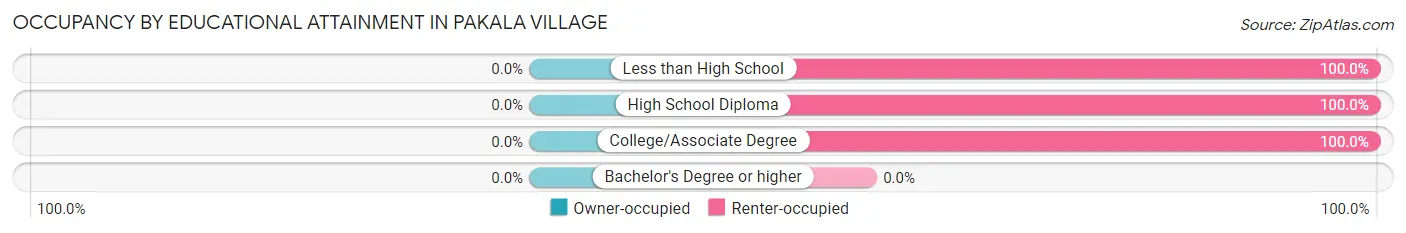
| Household Size | Owner-occupied | Renter-occupied |
| Less than High School | 0 (0.0%) | 28 (100.0%) |
| High School Diploma | 0 (0.0%) | 42 (100.0%) |
| College/Associate Degree | 0 (0.0%) | 10 (100.0%) |
| Bachelor's Degree or higher | 0 (0.0%) | 0 (0.0%) |
Occupancy by Age of Householder in Pakala Village
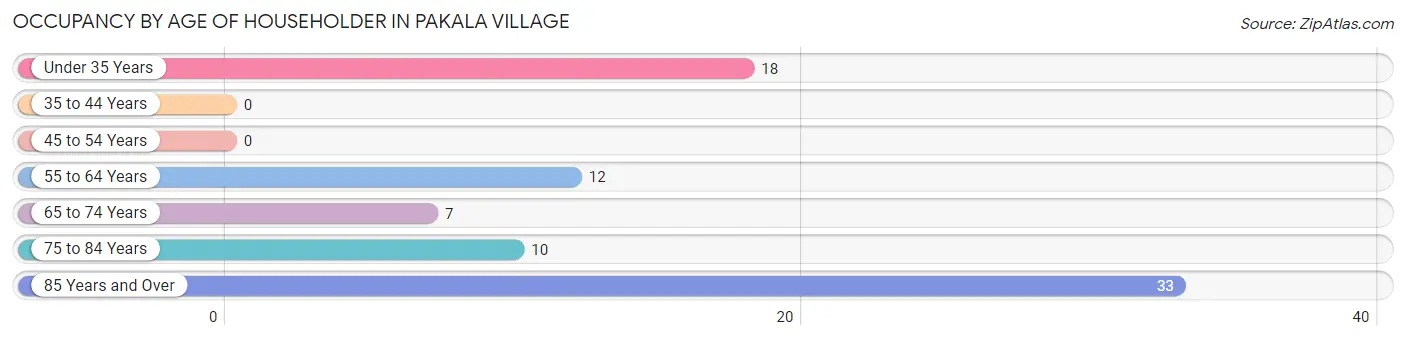
| Age Bracket | # Households | % Households |
| Under 35 Years | 18 | 22.5% |
| 35 to 44 Years | 0 | 0.0% |
| 45 to 54 Years | 0 | 0.0% |
| 55 to 64 Years | 12 | 15.0% |
| 65 to 74 Years | 7 | 8.7% |
| 75 to 84 Years | 10 | 12.5% |
| 85 Years and Over | 33 | 41.2% |
| Total | 80 | 100.0% |
Housing Finances in Pakala Village
Median Income by Occupancy in Pakala Village
| Occupancy Type | # Households | Median Income |
| Owner-Occupied | 0 (0.0%) | $0 |
| Renter-Occupied | 80 (100.0%) | $0 |
| Average | 80 (100.0%) | $0 |
Occupancy by Householder Income Bracket in Pakala Village
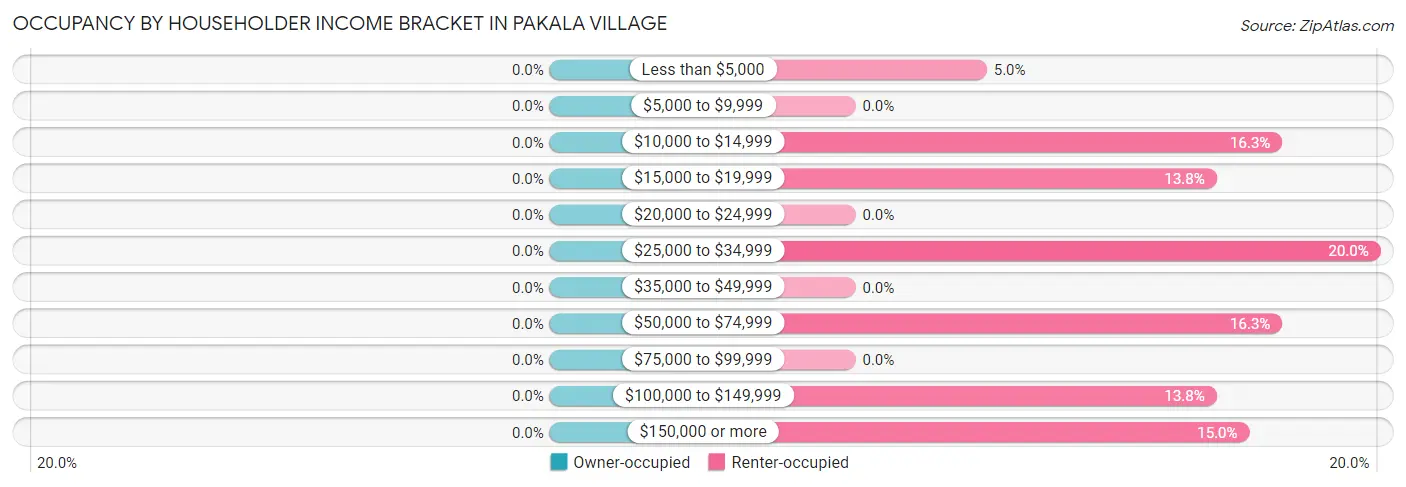
| Income Bracket | Owner-occupied | Renter-occupied |
| Less than $5,000 | 0 (0.0%) | 4 (5.0%) |
| $5,000 to $9,999 | 0 (0.0%) | 0 (0.0%) |
| $10,000 to $14,999 | 0 (0.0%) | 13 (16.3%) |
| $15,000 to $19,999 | 0 (0.0%) | 11 (13.8%) |
| $20,000 to $24,999 | 0 (0.0%) | 0 (0.0%) |
| $25,000 to $34,999 | 0 (0.0%) | 16 (20.0%) |
| $35,000 to $49,999 | 0 (0.0%) | 0 (0.0%) |
| $50,000 to $74,999 | 0 (0.0%) | 13 (16.3%) |
| $75,000 to $99,999 | 0 (0.0%) | 0 (0.0%) |
| $100,000 to $149,999 | 0 (0.0%) | 11 (13.8%) |
| $150,000 or more | 0 (0.0%) | 12 (15.0%) |
| Total | 0 (0.0%) | 80 (100.0%) |
Monthly Housing Cost Tiers in Pakala Village
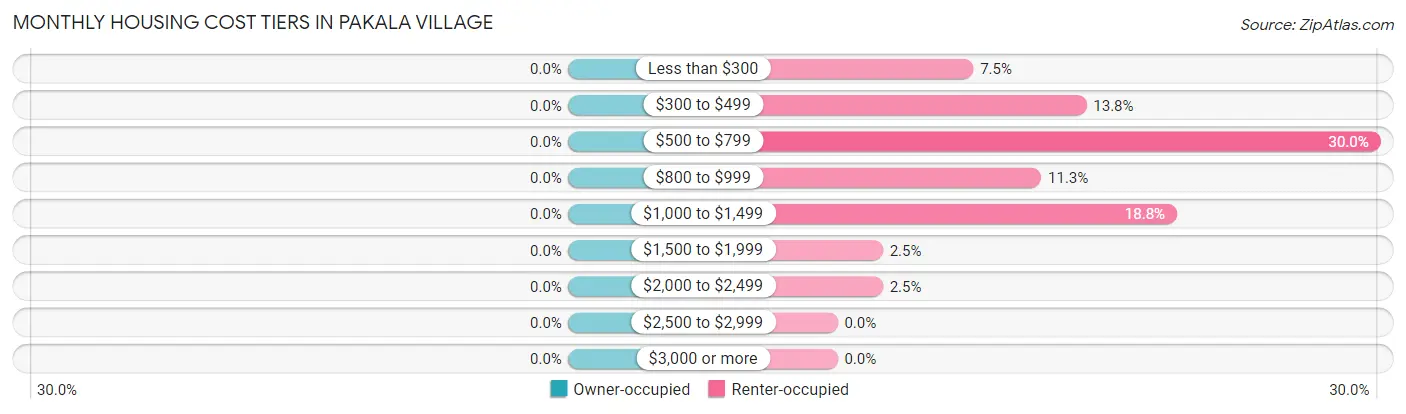
| Monthly Cost | Owner-occupied | Renter-occupied |
| Less than $300 | 0 (0.0%) | 6 (7.5%) |
| $300 to $499 | 0 (0.0%) | 11 (13.8%) |
| $500 to $799 | 0 (0.0%) | 24 (30.0%) |
| $800 to $999 | 0 (0.0%) | 9 (11.3%) |
| $1,000 to $1,499 | 0 (0.0%) | 15 (18.8%) |
| $1,500 to $1,999 | 0 (0.0%) | 2 (2.5%) |
| $2,000 to $2,499 | 0 (0.0%) | 2 (2.5%) |
| $2,500 to $2,999 | 0 (0.0%) | 0 (0.0%) |
| $3,000 or more | 0 (0.0%) | 0 (0.0%) |
| Total | 0 (0.0%) | 80 (100.0%) |
Physical Housing Characteristics in Pakala Village
Housing Structures in Pakala Village
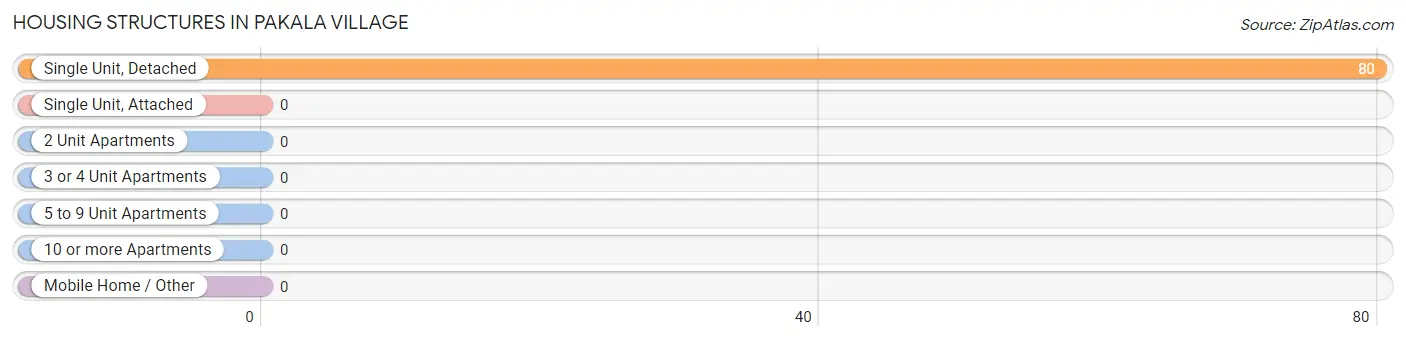
| Structure Type | # Housing Units | % Housing Units |
| Single Unit, Detached | 80 | 100.0% |
| Single Unit, Attached | 0 | 0.0% |
| 2 Unit Apartments | 0 | 0.0% |
| 3 or 4 Unit Apartments | 0 | 0.0% |
| 5 to 9 Unit Apartments | 0 | 0.0% |
| 10 or more Apartments | 0 | 0.0% |
| Mobile Home / Other | 0 | 0.0% |
| Total | 80 | 100.0% |
Housing Structures by Occupancy in Pakala Village
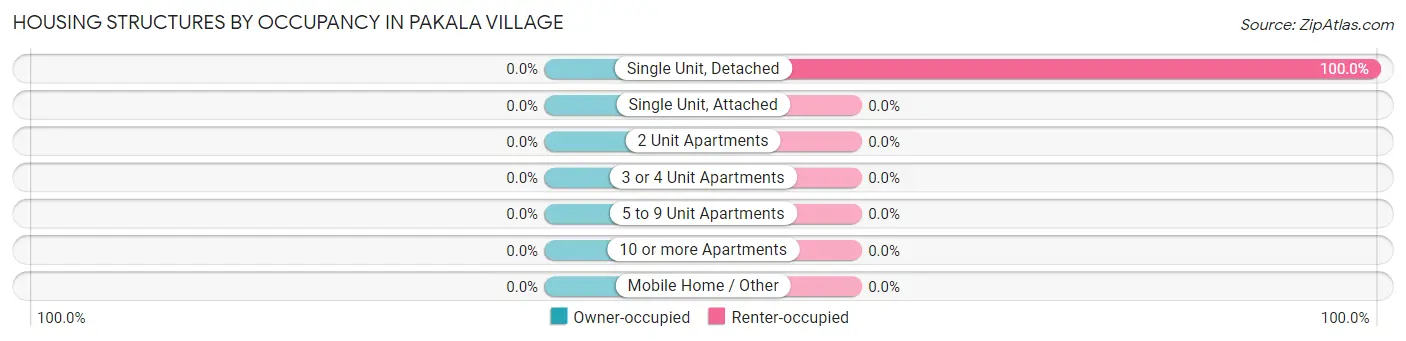
| Structure Type | Owner-occupied | Renter-occupied |
| Single Unit, Detached | 0 (0.0%) | 80 (100.0%) |
| Single Unit, Attached | 0 (0.0%) | 0 (0.0%) |
| 2 Unit Apartments | 0 (0.0%) | 0 (0.0%) |
| 3 or 4 Unit Apartments | 0 (0.0%) | 0 (0.0%) |
| 5 to 9 Unit Apartments | 0 (0.0%) | 0 (0.0%) |
| 10 or more Apartments | 0 (0.0%) | 0 (0.0%) |
| Mobile Home / Other | 0 (0.0%) | 0 (0.0%) |
| Total | 0 (0.0%) | 80 (100.0%) |
Housing Structures by Number of Rooms in Pakala Village
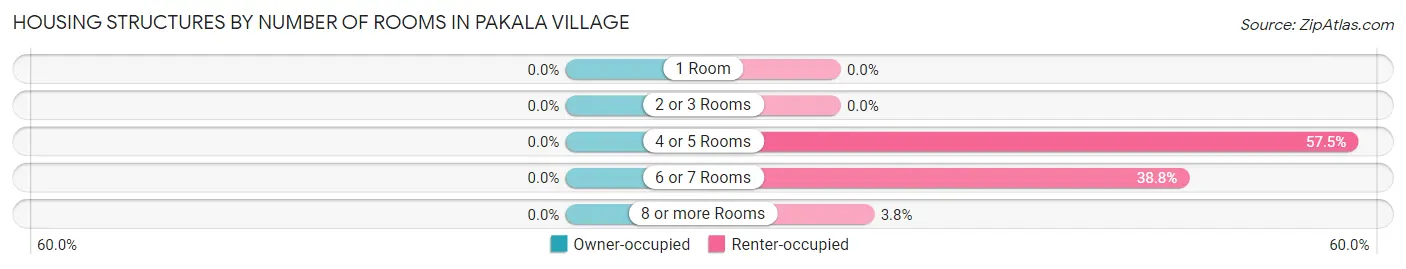
| Number of Rooms | Owner-occupied | Renter-occupied |
| 1 Room | 0 (0.0%) | 0 (0.0%) |
| 2 or 3 Rooms | 0 (0.0%) | 0 (0.0%) |
| 4 or 5 Rooms | 0 (0.0%) | 46 (57.5%) |
| 6 or 7 Rooms | 0 (0.0%) | 31 (38.8%) |
| 8 or more Rooms | 0 (0.0%) | 3 (3.7%) |
| Total | 0 (0.0%) | 80 (100.0%) |
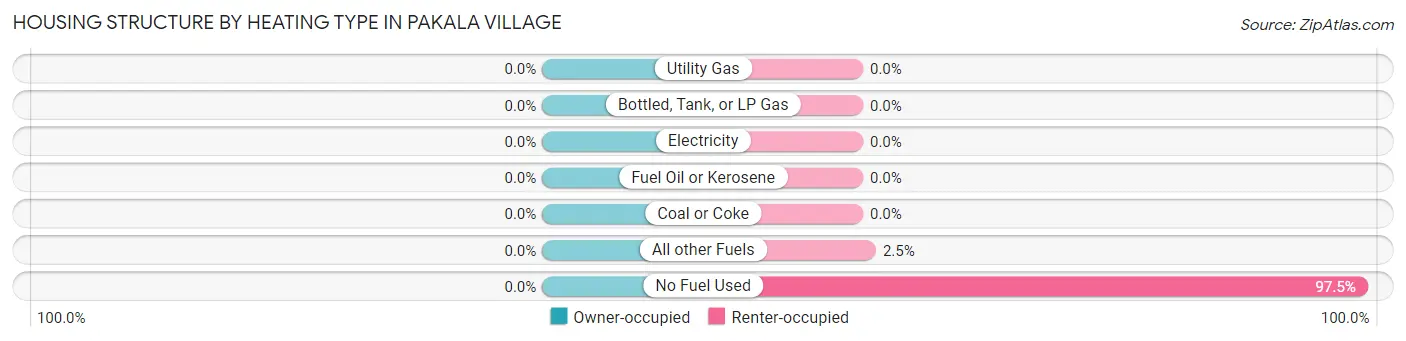
Housing Structure by Heating Type in Pakala Village
| Heating Type | Owner-occupied | Renter-occupied |
| Utility Gas | 0 (0.0%) | 0 (0.0%) |
| Bottled, Tank, or LP Gas | 0 (0.0%) | 0 (0.0%) |
| Electricity | 0 (0.0%) | 0 (0.0%) |
| Fuel Oil or Kerosene | 0 (0.0%) | 0 (0.0%) |
| Coal or Coke | 0 (0.0%) | 0 (0.0%) |
| All other Fuels | 0 (0.0%) | 2 (2.5%) |
| No Fuel Used | 0 (0.0%) | 78 (97.5%) |
| Total | 0 (0.0%) | 80 (100.0%) |
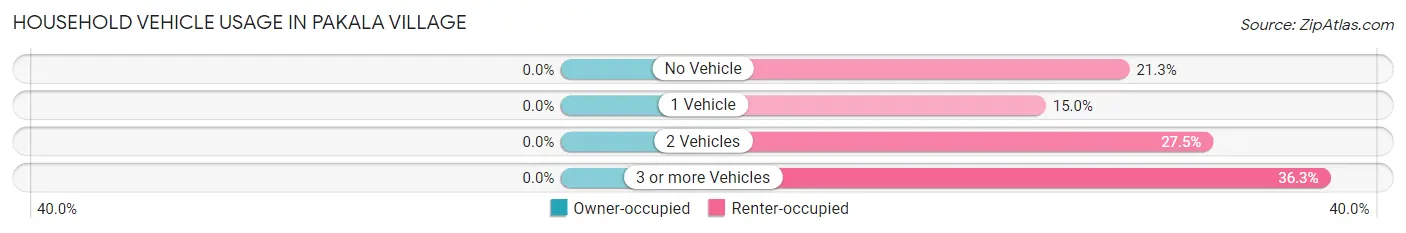
Household Vehicle Usage in Pakala Village
| Vehicles per Household | Owner-occupied | Renter-occupied |
| No Vehicle | 0 (0.0%) | 17 (21.2%) |
| 1 Vehicle | 0 (0.0%) | 12 (15.0%) |
| 2 Vehicles | 0 (0.0%) | 22 (27.5%) |
| 3 or more Vehicles | 0 (0.0%) | 29 (36.2%) |
| Total | 0 (0.0%) | 80 (100.0%) |
Real Estate & Mortgages in Pakala Village
Real Estate and Mortgage Overview in Pakala Village
| Characteristic | Without Mortgage | With Mortgage |
| Housing Units | 0 | 0 |
| Median Property Value | - | - |
| Median Household Income | - | - |
| Monthly Housing Costs | - | - |
| Real Estate Taxes | - | - |
Property Value by Mortgage Status in Pakala Village
| Property Value | Without Mortgage | With Mortgage |
| Less than $50,000 | 0 (0.0%) | 0 (0.0%) |
| $50,000 to $99,999 | 0 (0.0%) | 0 (0.0%) |
| $100,000 to $299,999 | 0 (0.0%) | 0 (0.0%) |
| $300,000 to $499,999 | 0 (0.0%) | 0 (0.0%) |
| $500,000 to $749,999 | 0 (0.0%) | 0 (0.0%) |
| $750,000 to $999,999 | 0 (0.0%) | 0 (0.0%) |
| $1,000,000 or more | 0 (0.0%) | 0 (0.0%) |
| Total | 0 (0.0%) | 0 (0.0%) |
Household Income by Mortgage Status in Pakala Village
| Household Income | Without Mortgage | With Mortgage |
| Less than $10,000 | 0 (0.0%) | 0 (0.0%) |
| $10,000 to $24,999 | 0 (0.0%) | 0 (0.0%) |
| $25,000 to $34,999 | 0 (0.0%) | 0 (0.0%) |
| $35,000 to $49,999 | 0 (0.0%) | 0 (0.0%) |
| $50,000 to $74,999 | 0 (0.0%) | 0 (0.0%) |
| $75,000 to $99,999 | 0 (0.0%) | 0 (0.0%) |
| $100,000 to $149,999 | 0 (0.0%) | 0 (0.0%) |
| $150,000 or more | 0 (0.0%) | 0 (0.0%) |
| Total | 0 (0.0%) | 0 (0.0%) |
Property Value to Household Income Ratio in Pakala Village
| Value-to-Income Ratio | Without Mortgage | With Mortgage |
| Less than 2.0x | 0 (0.0%) | 0 (0.0%) |
| 2.0x to 2.9x | 0 (0.0%) | 0 (0.0%) |
| 3.0x to 3.9x | 0 (0.0%) | 0 (0.0%) |
| 4.0x or more | 0 (0.0%) | 0 (0.0%) |
| Total | 0 (0.0%) | 0 (0.0%) |
Real Estate Taxes by Mortgage Status in Pakala Village
| Property Taxes | Without Mortgage | With Mortgage |
| Less than $800 | 0 (0.0%) | 0 (0.0%) |
| $800 to $1,499 | 0 (0.0%) | 0 (0.0%) |
| $800 to $1,499 | 0 (0.0%) | 0 (0.0%) |
| Total | 0 (0.0%) | 0 (0.0%) |
Health & Disability in Pakala Village
Health Insurance Coverage by Age in Pakala Village
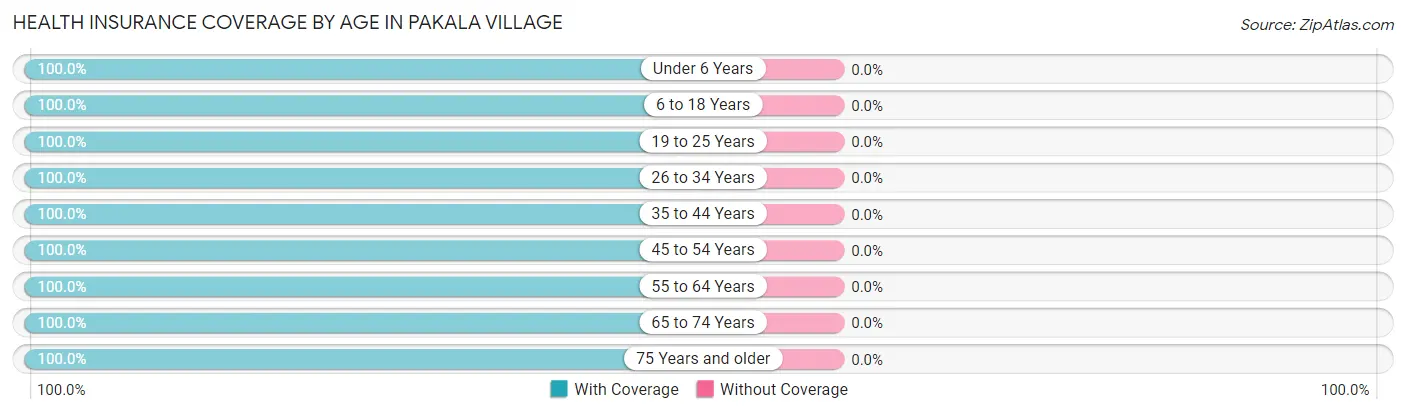
| Age Bracket | With Coverage | Without Coverage |
| Under 6 Years | 75 (100.0%) | 0 (0.0%) |
| 6 to 18 Years | 50 (100.0%) | 0 (0.0%) |
| 19 to 25 Years | 23 (100.0%) | 0 (0.0%) |
| 26 to 34 Years | 52 (100.0%) | 0 (0.0%) |
| 35 to 44 Years | 4 (100.0%) | 0 (0.0%) |
| 45 to 54 Years | 20 (100.0%) | 0 (0.0%) |
| 55 to 64 Years | 24 (100.0%) | 0 (0.0%) |
| 65 to 74 Years | 13 (100.0%) | 0 (0.0%) |
| 75 Years and older | 48 (100.0%) | 0 (0.0%) |
| Total | 309 (100.0%) | 0 (0.0%) |
Health Insurance Coverage by Citizenship Status in Pakala Village
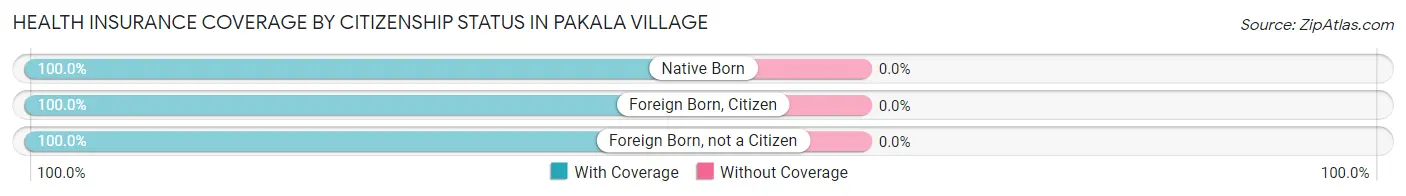
| Citizenship Status | With Coverage | Without Coverage |
| Native Born | 75 (100.0%) | 0 (0.0%) |
| Foreign Born, Citizen | 50 (100.0%) | 0 (0.0%) |
| Foreign Born, not a Citizen | 23 (100.0%) | 0 (0.0%) |
Health Insurance Coverage by Household Income in Pakala Village
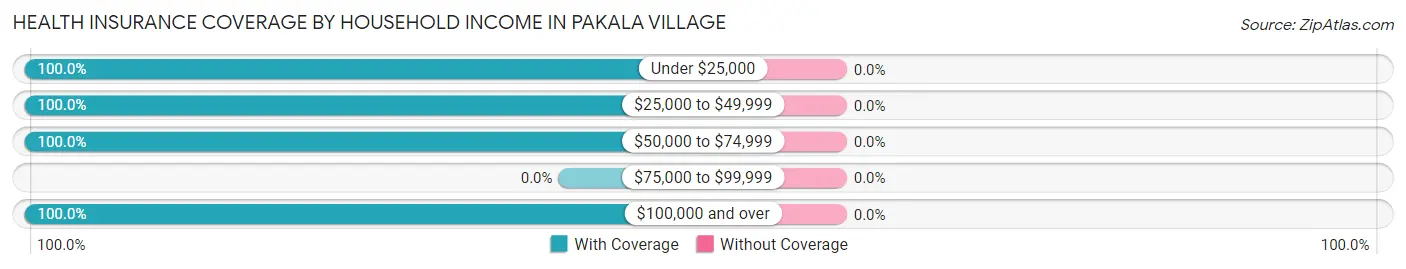
| Household Income | With Coverage | Without Coverage |
| Under $25,000 | 40 (100.0%) | 0 (0.0%) |
| $25,000 to $49,999 | 58 (100.0%) | 0 (0.0%) |
| $50,000 to $74,999 | 110 (100.0%) | 0 (0.0%) |
| $75,000 to $99,999 | 0 (0.0%) | 0 (0.0%) |
| $100,000 and over | 101 (100.0%) | 0 (0.0%) |
Public vs Private Health Insurance Coverage by Age in Pakala Village
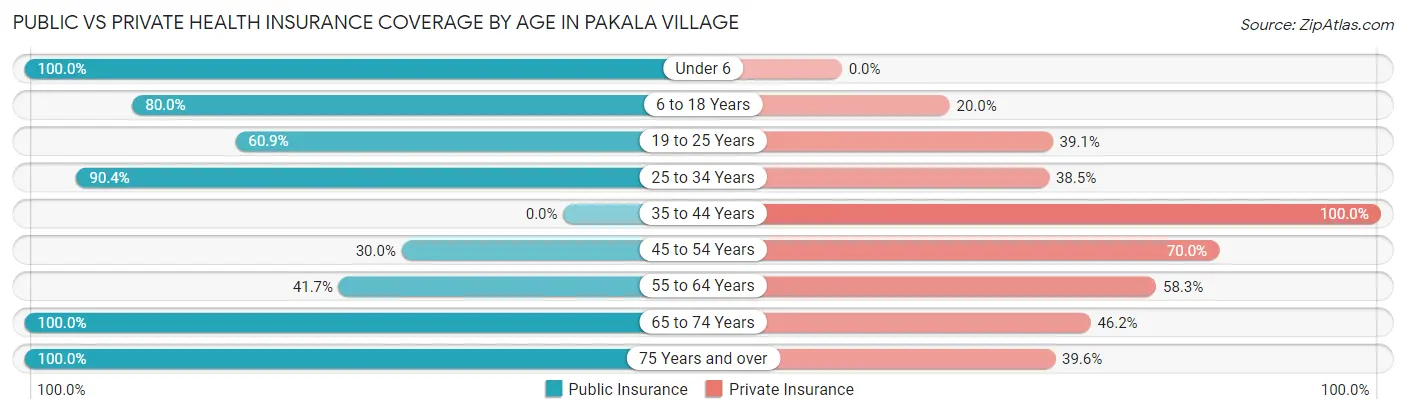
| Age Bracket | Public Insurance | Private Insurance |
| Under 6 | 75 (100.0%) | 0 (0.0%) |
| 6 to 18 Years | 40 (80.0%) | 10 (20.0%) |
| 19 to 25 Years | 14 (60.9%) | 9 (39.1%) |
| 25 to 34 Years | 47 (90.4%) | 20 (38.5%) |
| 35 to 44 Years | 0 (0.0%) | 4 (100.0%) |
| 45 to 54 Years | 6 (30.0%) | 14 (70.0%) |
| 55 to 64 Years | 10 (41.7%) | 14 (58.3%) |
| 65 to 74 Years | 13 (100.0%) | 6 (46.2%) |
| 75 Years and over | 48 (100.0%) | 19 (39.6%) |
| Total | 253 (81.9%) | 96 (31.1%) |
Disability Status by Sex by Age in Pakala Village
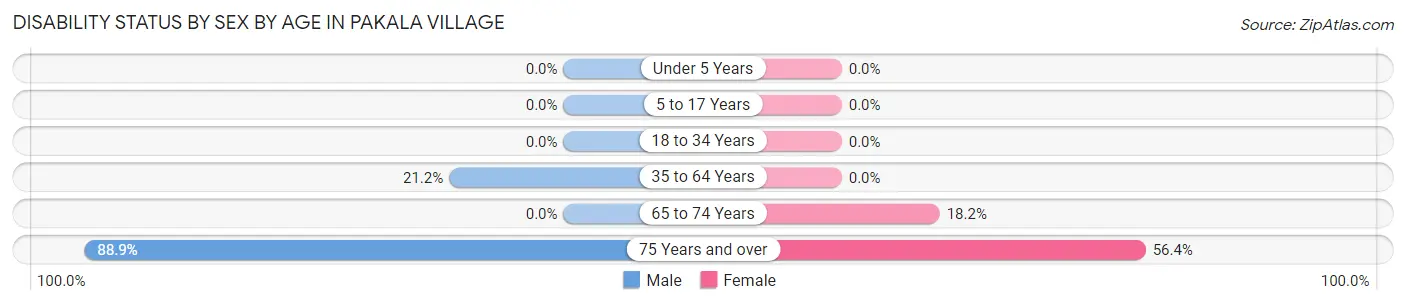
| Age Bracket | Male | Female |
| Under 5 Years | 0 (0.0%) | 0 (0.0%) |
| 5 to 17 Years | 0 (0.0%) | 0 (0.0%) |
| 18 to 34 Years | 0 (0.0%) | 0 (0.0%) |
| 35 to 64 Years | 7 (21.2%) | 0 (0.0%) |
| 65 to 74 Years | 0 (0.0%) | 2 (18.2%) |
| 75 Years and over | 8 (88.9%) | 22 (56.4%) |
Disability Class by Sex by Age in Pakala Village
Disability Class: Hearing Difficulty
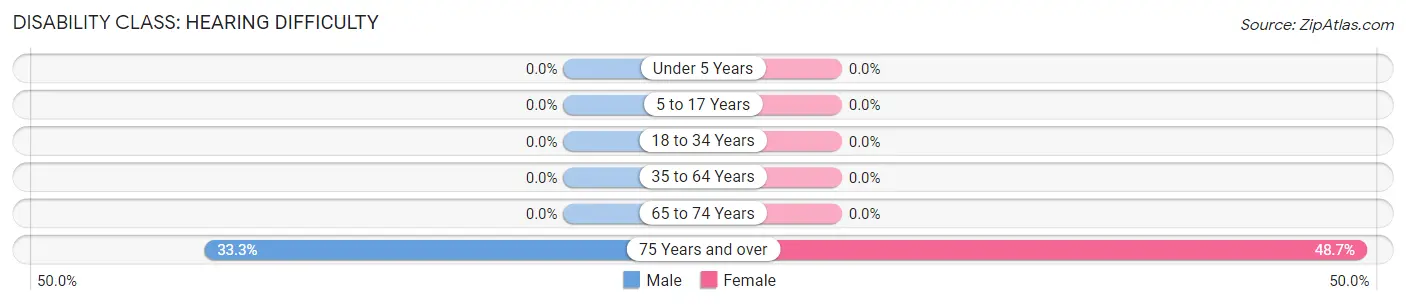
| Age Bracket | Male | Female |
| Under 5 Years | 0 (0.0%) | 0 (0.0%) |
| 5 to 17 Years | 0 (0.0%) | 0 (0.0%) |
| 18 to 34 Years | 0 (0.0%) | 0 (0.0%) |
| 35 to 64 Years | 0 (0.0%) | 0 (0.0%) |
| 65 to 74 Years | 0 (0.0%) | 0 (0.0%) |
| 75 Years and over | 3 (33.3%) | 19 (48.7%) |
Disability Class: Vision Difficulty
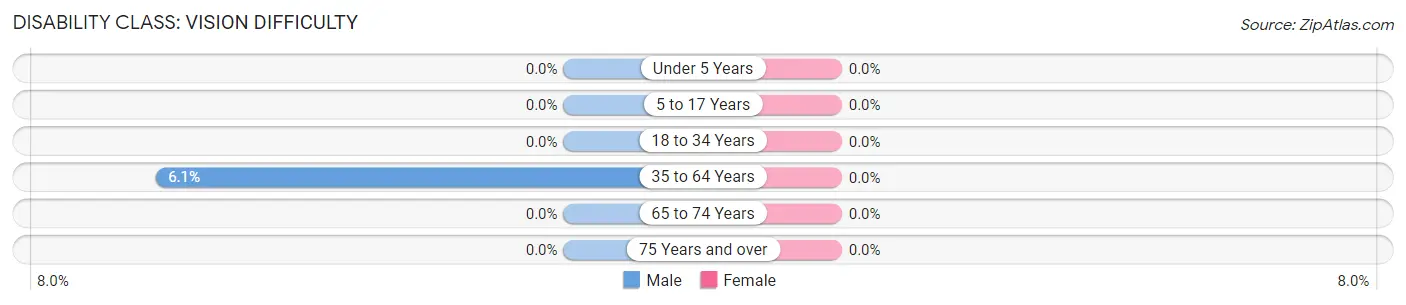
| Age Bracket | Male | Female |
| Under 5 Years | 0 (0.0%) | 0 (0.0%) |
| 5 to 17 Years | 0 (0.0%) | 0 (0.0%) |
| 18 to 34 Years | 0 (0.0%) | 0 (0.0%) |
| 35 to 64 Years | 2 (6.1%) | 0 (0.0%) |
| 65 to 74 Years | 0 (0.0%) | 0 (0.0%) |
| 75 Years and over | 0 (0.0%) | 0 (0.0%) |
Disability Class: Cognitive Difficulty
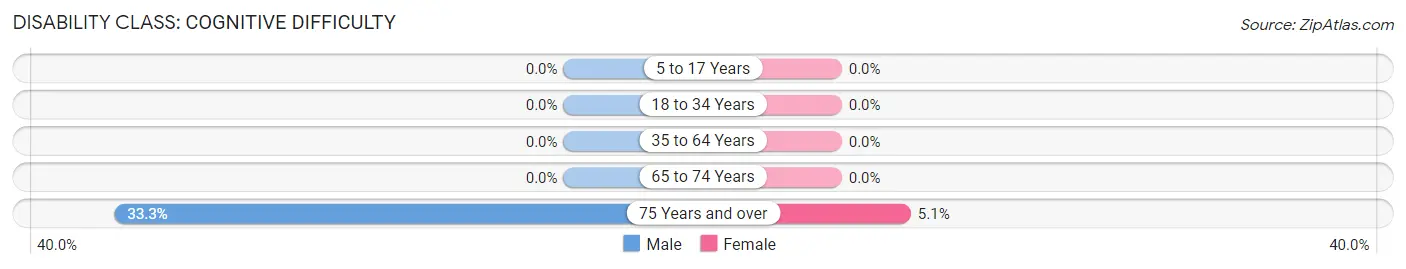
| Age Bracket | Male | Female |
| 5 to 17 Years | 0 (0.0%) | 0 (0.0%) |
| 18 to 34 Years | 0 (0.0%) | 0 (0.0%) |
| 35 to 64 Years | 0 (0.0%) | 0 (0.0%) |
| 65 to 74 Years | 0 (0.0%) | 0 (0.0%) |
| 75 Years and over | 3 (33.3%) | 2 (5.1%) |
Disability Class: Ambulatory Difficulty
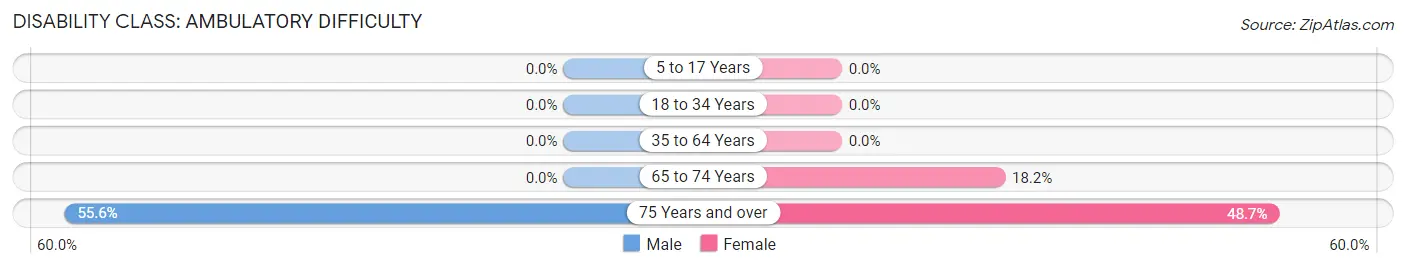
| Age Bracket | Male | Female |
| 5 to 17 Years | 0 (0.0%) | 0 (0.0%) |
| 18 to 34 Years | 0 (0.0%) | 0 (0.0%) |
| 35 to 64 Years | 0 (0.0%) | 0 (0.0%) |
| 65 to 74 Years | 0 (0.0%) | 2 (18.2%) |
| 75 Years and over | 5 (55.6%) | 19 (48.7%) |
Disability Class: Self-Care Difficulty
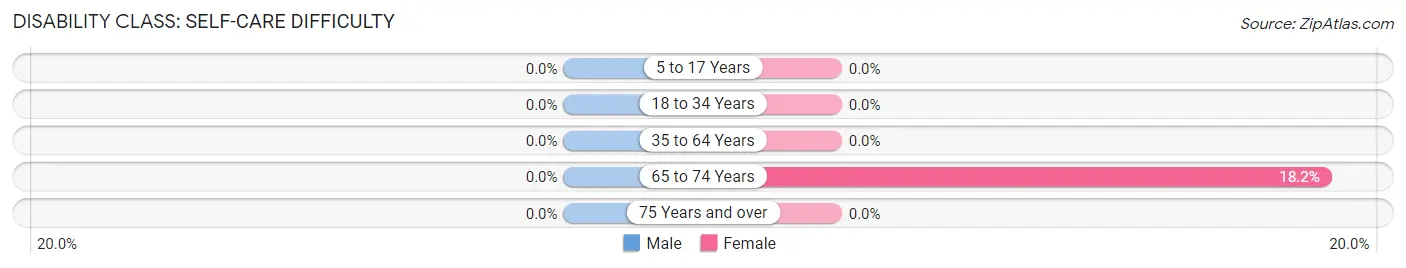
| Age Bracket | Male | Female |
| 5 to 17 Years | 0 (0.0%) | 0 (0.0%) |
| 18 to 34 Years | 0 (0.0%) | 0 (0.0%) |
| 35 to 64 Years | 0 (0.0%) | 0 (0.0%) |
| 65 to 74 Years | 0 (0.0%) | 2 (18.2%) |
| 75 Years and over | 0 (0.0%) | 0 (0.0%) |
Technology Access in Pakala Village
Computing Device Access in Pakala Village
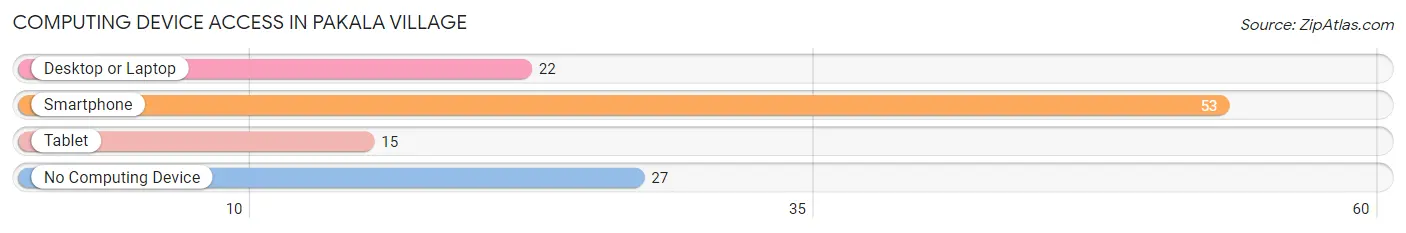
| Device Type | # Households | % Households |
| Desktop or Laptop | 22 | 27.5% |
| Smartphone | 53 | 66.2% |
| Tablet | 15 | 18.8% |
| No Computing Device | 27 | 33.8% |
| Total | 80 | 100.0% |
Internet Access in Pakala Village
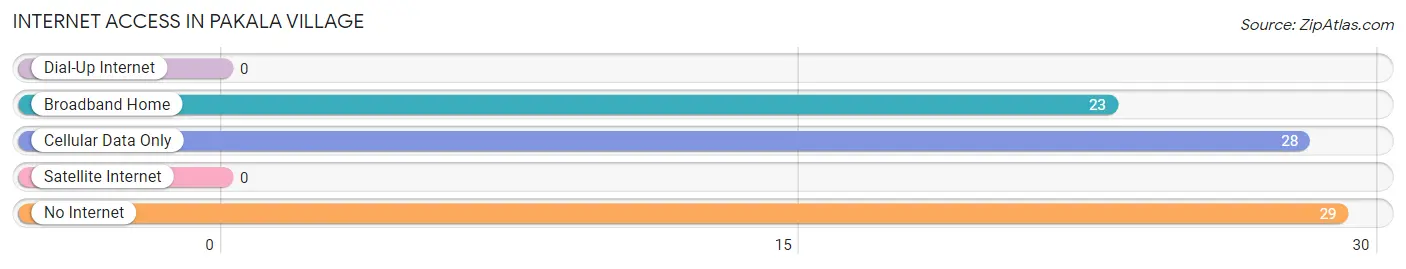
| Internet Type | # Households | % Households |
| Dial-Up Internet | 0 | 0.0% |
| Broadband Home | 23 | 28.7% |
| Cellular Data Only | 28 | 35.0% |
| Satellite Internet | 0 | 0.0% |
| No Internet | 29 | 36.2% |
| Total | 80 | 100.0% |
Pakala Village Summary
Introduction
Pakala Village is a small village located in the state of Hawaii, United States. It is situated on the island of Kauai, and is part of the Kauai County. The village is located on the eastern side of the island, and is bordered by the Pacific Ocean to the east and the Wailua River to the west. The village is home to a population of approximately 1,000 people, and is known for its rich cultural heritage and stunning natural beauty.
History
The history of Pakala Village dates back to the early 1800s, when the first settlers arrived in the area. The village was originally inhabited by Native Hawaiians, who were drawn to the area due to its abundance of natural resources. The village was a thriving fishing and agricultural community, and the residents were able to sustain themselves by fishing and farming.
In the late 1800s, the village began to experience a period of growth and development. The population increased, and the village began to attract more settlers from other parts of the island. The village was also home to a number of businesses, including a general store, a post office, and a school.
In the early 1900s, the village experienced a period of decline. The population decreased, and the businesses began to close. The village was eventually abandoned, and the remaining residents moved away.
In the late 1900s, the village began to experience a period of revitalization. The population began to increase, and the village began to attract new businesses and residents. Today, the village is a thriving community, and is home to a variety of businesses and services.
Geography
Pakala Village is located on the eastern side of the island of Kauai, and is bordered by the Pacific Ocean to the east and the Wailua River to the west. The village is situated in a tropical climate, and is known for its lush vegetation and stunning natural beauty. The village is home to a variety of wildlife, including birds, fish, and other animals.
The village is located near a number of popular tourist attractions, including the Na Pali Coast, Waimea Canyon, and the Kokee State Park. The village is also home to a number of beaches, including the popular Hanalei Bay.
Economy
The economy of Pakala Village is largely based on tourism and agriculture. The village is home to a number of hotels and resorts, which attract visitors from all over the world. The village is also home to a number of farms, which produce a variety of fruits and vegetables.
The village is also home to a number of businesses, including restaurants, shops, and other services. The village is also home to a number of art galleries, which showcase the work of local artists.
Demographics
As of the 2010 census, the population of Pakala Village was 1,000. The population is largely composed of Native Hawaiians, with a small percentage of other ethnicities. The median age of the population is 44, and the median household income is $50,000.
Conclusion
Pakala Village is a small village located in the state of Hawaii, United States. It is situated on the island of Kauai, and is part of the Kauai County. The village is home to a population of approximately 1,000 people, and is known for its rich cultural heritage and stunning natural beauty. The economy of the village is largely based on tourism and agriculture, and the village is home to a number of businesses, including restaurants, shops, and other services. The population of the village is largely composed of Native Hawaiians, with a small percentage of other ethnicities.
Common Questions
What is Per Capita Income in Pakala Village?
Per Capita income in Pakala Village is $17,187.
What is Inequality or Gini Index in Pakala Village?
Inequality or Gini Index in Pakala Village is 0.51.
What is the Total Population of Pakala Village?
Total Population of Pakala Village is 309.
What is the Total Male Population of Pakala Village?
Total Male Population of Pakala Village is 139.
What is the Total Female Population of Pakala Village?
Total Female Population of Pakala Village is 170.
What is the Ratio of Males per 100 Females in Pakala Village?
There are 81.76 Males per 100 Females in Pakala Village.
What is the Ratio of Females per 100 Males in Pakala Village?
There are 122.30 Females per 100 Males in Pakala Village.
What is the Median Population Age in Pakala Village?
Median Population Age in Pakala Village is 27.9 Years.
What is the Average Family Size in Pakala Village
Average Family Size in Pakala Village is 5.1 People.
What is the Average Household Size in Pakala Village
Average Household Size in Pakala Village is 3.9 People.
How Large is the Labor Force in Pakala Village?
There are 71 People in the Labor Forcein in Pakala Village.
What is the Percentage of People in the Labor Force in Pakala Village?
38.6% of People are in the Labor Force in Pakala Village.
What is the Unemployment Rate in Pakala Village?
Unemployment Rate in Pakala Village is 8.5%.