Kaunakakai, HI Map & Demographics
Kaunakakai Map
Kaunakakai Overview
$28,087
PER CAPITA INCOME
$84,699
AVG FAMILY INCOME
$67,083
AVG HOUSEHOLD INCOME
15.1%
WAGE / INCOME GAP [ % ]
84.9¢/ $1
WAGE / INCOME GAP [ $ ]
0.50
INEQUALITY / GINI INDEX
3,553
TOTAL POPULATION
1,923
MALE POPULATION
1,630
FEMALE POPULATION
117.98
MALES / 100 FEMALES
84.76
FEMALES / 100 MALES
33.9
MEDIAN AGE
4.1
AVG FAMILY SIZE
3.3
AVG HOUSEHOLD SIZE
1,412
LABOR FORCE [ PEOPLE ]
53.6%
PERCENT IN LABOR FORCE
6.1%
UNEMPLOYMENT RATE
Kaunakakai Zip Codes
Kaunakakai Area Codes
Income in Kaunakakai
Income Overview in Kaunakakai
Per Capita Income in Kaunakakai is $28,087, while median incomes of families and households are $84,699 and $67,083 respectively.
| Characteristic | Number | Measure |
| Per Capita Income | 3,553 | $28,087 |
| Median Family Income | 747 | $84,699 |
| Mean Family Income | 747 | $99,126 |
| Median Household Income | 1,076 | $67,083 |
| Mean Household Income | 1,076 | $90,798 |
| Income Deficit | 747 | $0 |
| Wage / Income Gap (%) | 3,553 | 15.13% |
| Wage / Income Gap ($) | 3,553 | 84.87¢ per $1 |
| Gini / Inequality Index | 3,553 | 0.50 |
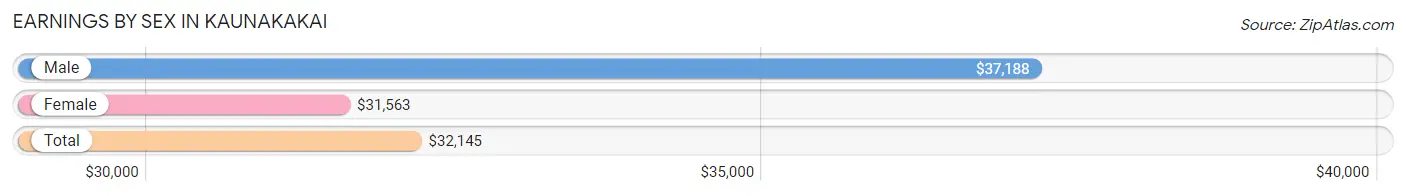
Earnings by Sex in Kaunakakai
Average Earnings in Kaunakakai are $32,145, $37,188 for men and $31,563 for women, a difference of 15.1%.
| Sex | Number | Average Earnings |
| Male | 548 (39.2%) | $37,188 |
| Female | 850 (60.8%) | $31,563 |
| Total | 1,398 (100.0%) | $32,145 |
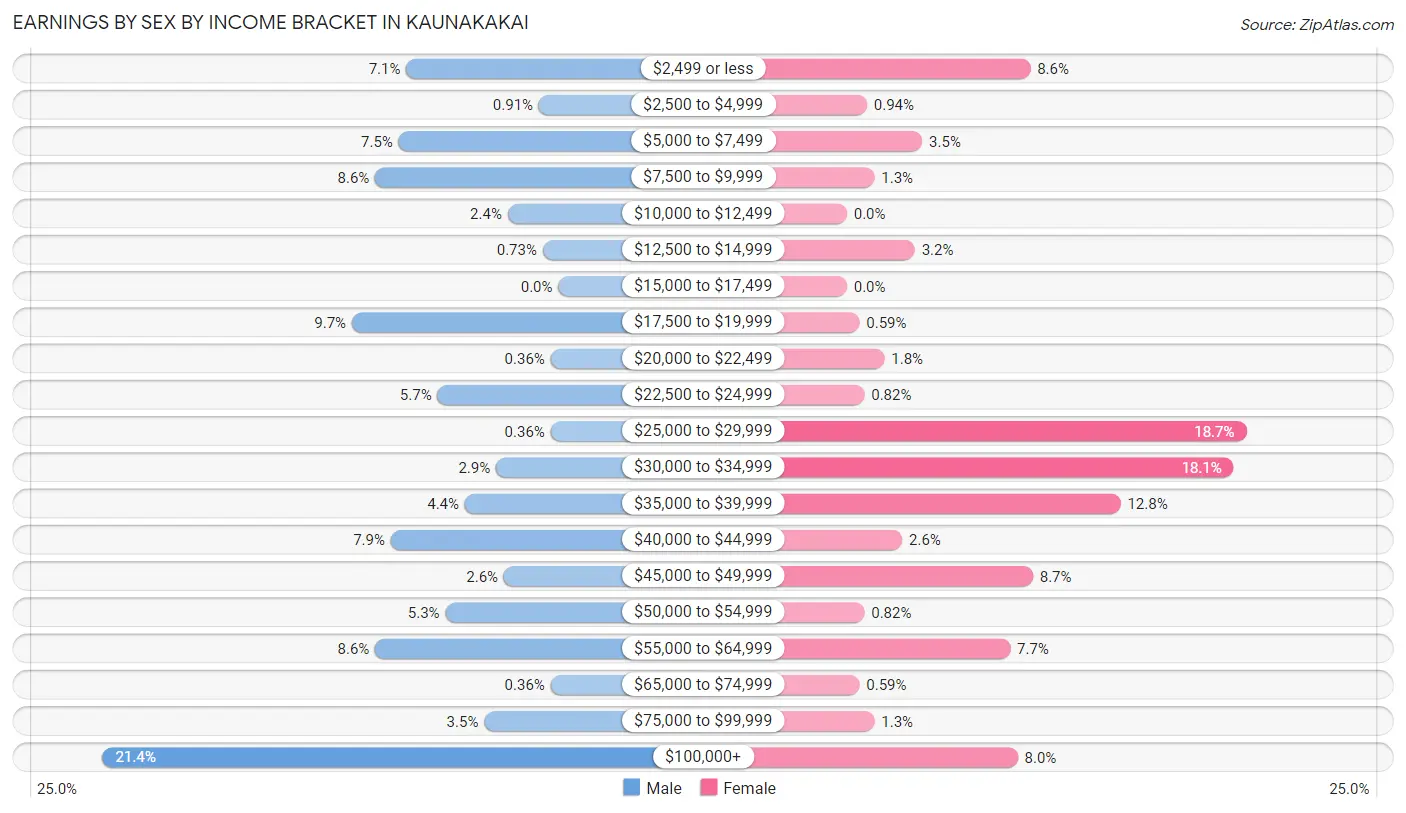
Earnings by Sex by Income Bracket in Kaunakakai
The most common earnings brackets in Kaunakakai are $100,000+ for men (117 | 21.3%) and $25,000 to $29,999 for women (159 | 18.7%).
| Income | Male | Female |
| $2,499 or less | 39 (7.1%) | 73 (8.6%) |
| $2,500 to $4,999 | 5 (0.9%) | 8 (0.9%) |
| $5,000 to $7,499 | 41 (7.5%) | 30 (3.5%) |
| $7,500 to $9,999 | 47 (8.6%) | 11 (1.3%) |
| $10,000 to $12,499 | 13 (2.4%) | 0 (0.0%) |
| $12,500 to $14,999 | 4 (0.7%) | 27 (3.2%) |
| $15,000 to $17,499 | 0 (0.0%) | 0 (0.0%) |
| $17,500 to $19,999 | 53 (9.7%) | 5 (0.6%) |
| $20,000 to $22,499 | 2 (0.4%) | 15 (1.8%) |
| $22,500 to $24,999 | 31 (5.7%) | 7 (0.8%) |
| $25,000 to $29,999 | 2 (0.4%) | 159 (18.7%) |
| $30,000 to $34,999 | 16 (2.9%) | 154 (18.1%) |
| $35,000 to $39,999 | 24 (4.4%) | 109 (12.8%) |
| $40,000 to $44,999 | 43 (7.9%) | 22 (2.6%) |
| $45,000 to $49,999 | 14 (2.5%) | 74 (8.7%) |
| $50,000 to $54,999 | 29 (5.3%) | 7 (0.8%) |
| $55,000 to $64,999 | 47 (8.6%) | 65 (7.6%) |
| $65,000 to $74,999 | 2 (0.4%) | 5 (0.6%) |
| $75,000 to $99,999 | 19 (3.5%) | 11 (1.3%) |
| $100,000+ | 117 (21.3%) | 68 (8.0%) |
| Total | 548 (100.0%) | 850 (100.0%) |
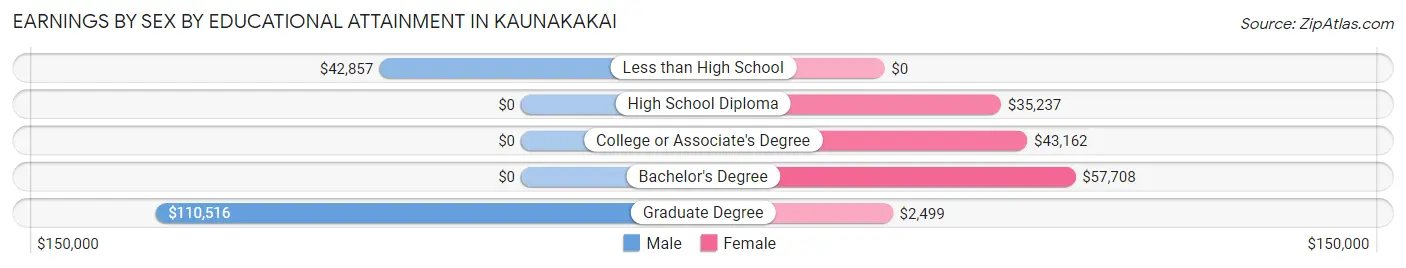
Earnings by Sex by Educational Attainment in Kaunakakai
Average earnings in Kaunakakai are $43,409 for men and $35,603 for women, a difference of 18.0%. Men with an educational attainment of graduate degree enjoy the highest average annual earnings of $110,516, while those with less than high school education earn the least with $42,857. Women with an educational attainment of bachelor's degree earn the most with the average annual earnings of $57,708, while those with graduate degree education have the smallest earnings of $2,499.
| Educational Attainment | Male Income | Female Income |
| Less than High School | $42,857 | $0 |
| High School Diploma | - | - |
| College or Associate's Degree | - | - |
| Bachelor's Degree | - | - |
| Graduate Degree | $110,516 | $2,499 |
| Total | $43,409 | $35,603 |
Family Income in Kaunakakai
Family Income Brackets in Kaunakakai
According to the Kaunakakai family income data, there are 205 families falling into the $100,000 to $149,999 income range, which is the most common income bracket and makes up 27.4% of all families. Conversely, the $10,000 to $14,999 income bracket is the least frequent group with only 26 families (3.5%) belonging to this category.
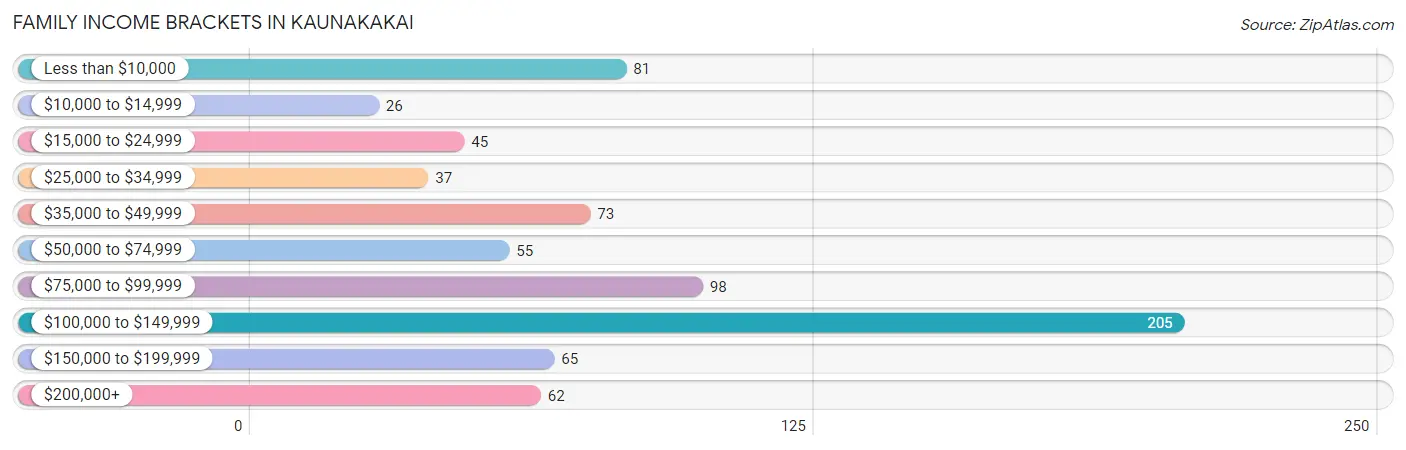
| Income Bracket | # Families | % Families |
| Less than $10,000 | 81 | 10.8% |
| $10,000 to $14,999 | 26 | 3.5% |
| $15,000 to $24,999 | 45 | 6.0% |
| $25,000 to $34,999 | 37 | 5.0% |
| $35,000 to $49,999 | 73 | 9.8% |
| $50,000 to $74,999 | 55 | 7.4% |
| $75,000 to $99,999 | 98 | 13.1% |
| $100,000 to $149,999 | 205 | 27.4% |
| $150,000 to $199,999 | 65 | 8.7% |
| $200,000+ | 62 | 8.3% |
Family Income by Famaliy Size in Kaunakakai
7+ person families (102 | 13.7%) account for the highest median family income in Kaunakakai with $122,830 per family, while 2-person families (295 | 39.5%) have the highest median income of $30,064 per family member.
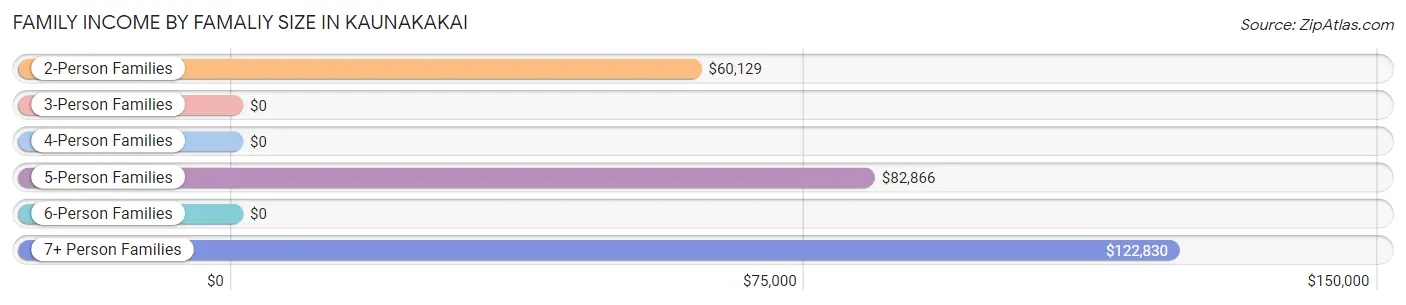
| Income Bracket | # Families | Median Income |
| 2-Person Families | 295 (39.5%) | $60,129 |
| 3-Person Families | 133 (17.8%) | $0 |
| 4-Person Families | 95 (12.7%) | $0 |
| 5-Person Families | 112 (15.0%) | $82,866 |
| 6-Person Families | 10 (1.3%) | $0 |
| 7+ Person Families | 102 (13.7%) | $122,830 |
| Total | 747 (100.0%) | $84,699 |
Family Income by Number of Earners in Kaunakakai
The median family income in Kaunakakai is $84,699, with families comprising 3+ earners (137) having the highest median family income of $176,806, while families with no earners (251) have the lowest median family income of $36,115, accounting for 18.3% and 33.6% of families, respectively.
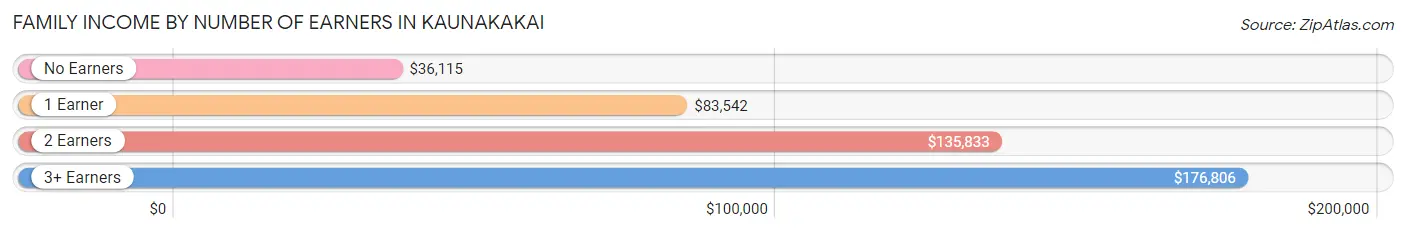
| Number of Earners | # Families | Median Income |
| No Earners | 251 (33.6%) | $36,115 |
| 1 Earner | 229 (30.7%) | $83,542 |
| 2 Earners | 130 (17.4%) | $135,833 |
| 3+ Earners | 137 (18.3%) | $176,806 |
| Total | 747 (100.0%) | $84,699 |
Household Income in Kaunakakai
Household Income Brackets in Kaunakakai
With 186 households falling in the category, the $100,000 to $149,999 income range is the most frequent in Kaunakakai, accounting for 17.3% of all households. In contrast, only 26 households (2.4%) fall into the $10,000 to $14,999 income bracket, making it the least populous group.
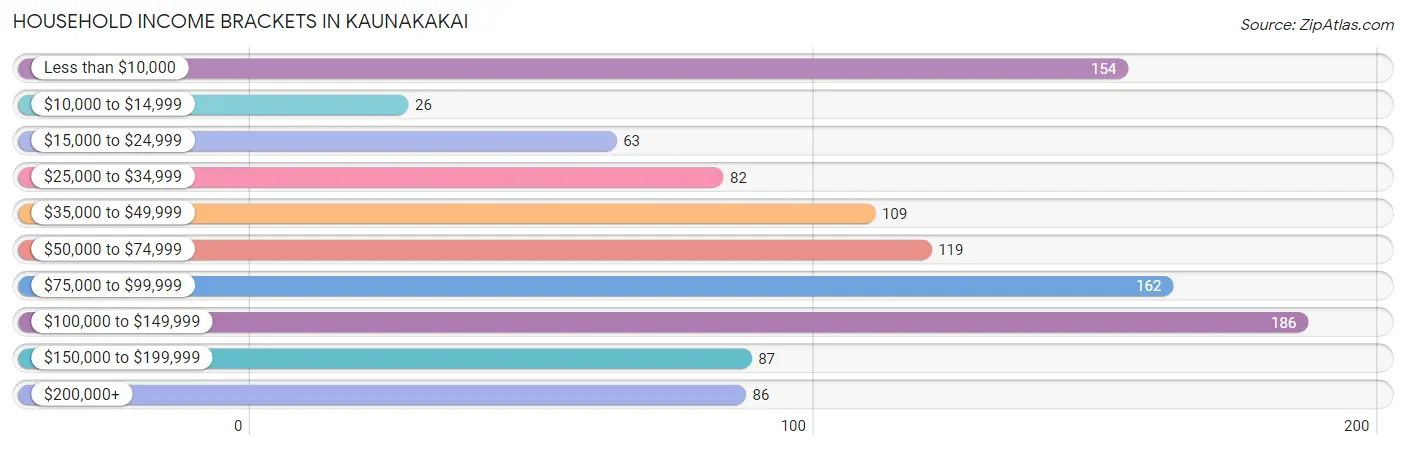
| Income Bracket | # Households | % Households |
| Less than $10,000 | 154 | 14.3% |
| $10,000 to $14,999 | 26 | 2.4% |
| $15,000 to $24,999 | 63 | 5.9% |
| $25,000 to $34,999 | 82 | 7.6% |
| $35,000 to $49,999 | 109 | 10.1% |
| $50,000 to $74,999 | 119 | 11.1% |
| $75,000 to $99,999 | 162 | 15.1% |
| $100,000 to $149,999 | 186 | 17.3% |
| $150,000 to $199,999 | 87 | 8.1% |
| $200,000+ | 86 | 8.0% |
Household Income by Householder Age in Kaunakakai
The median household income in Kaunakakai is $67,083, with the highest median household income of $75,750 found in the 45 to 64 years age bracket for the primary householder. A total of 419 households (38.9%) fall into this category. Meanwhile, the 15 to 24 years age bracket for the primary householder has the lowest median household income of $0, with 1 households (0.1%) in this group.
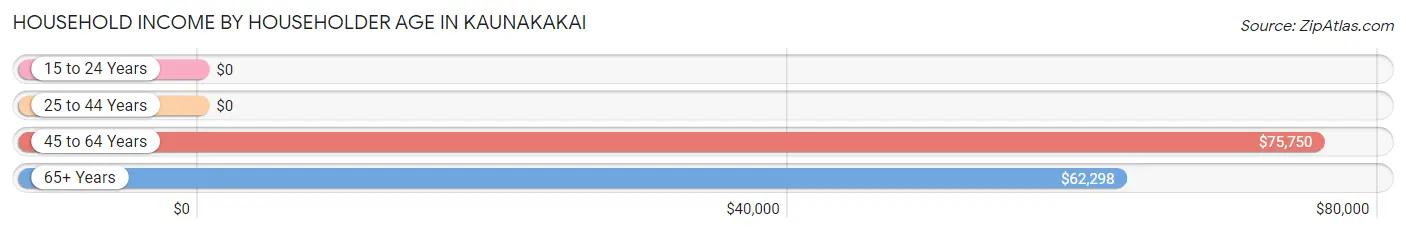
| Income Bracket | # Households | Median Income |
| 15 to 24 Years | 1 (0.1%) | $0 |
| 25 to 44 Years | 209 (19.4%) | $0 |
| 45 to 64 Years | 419 (38.9%) | $75,750 |
| 65+ Years | 447 (41.5%) | $62,298 |
| Total | 1,076 (100.0%) | $67,083 |
Poverty in Kaunakakai
Income Below Poverty by Sex and Age in Kaunakakai
With 19.9% poverty level for males and 18.5% for females among the residents of Kaunakakai, 45 to 54 year old males and 6 to 11 year old females are the most vulnerable to poverty, with 129 males (46.6%) and 112 females (77.2%) in their respective age groups living below the poverty level.
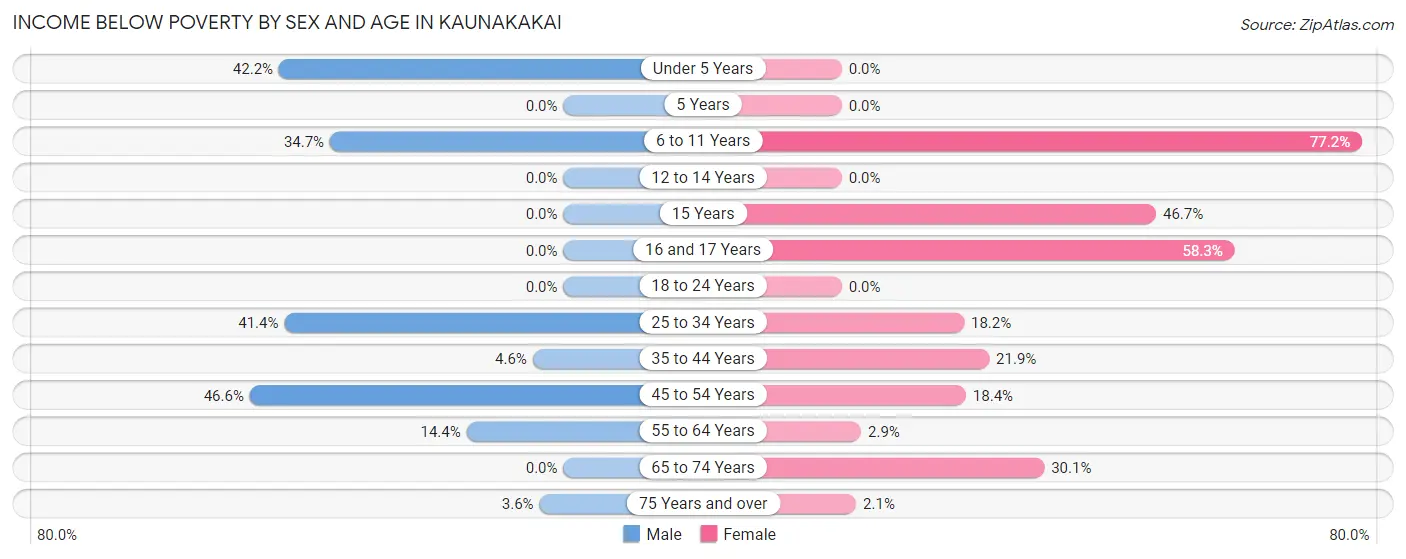
| Age Bracket | Male | Female |
| Under 5 Years | 49 (42.2%) | 0 (0.0%) |
| 5 Years | 0 (0.0%) | 0 (0.0%) |
| 6 to 11 Years | 61 (34.7%) | 112 (77.2%) |
| 12 to 14 Years | 0 (0.0%) | 0 (0.0%) |
| 15 Years | 0 (0.0%) | 7 (46.7%) |
| 16 and 17 Years | 0 (0.0%) | 7 (58.3%) |
| 18 to 24 Years | 0 (0.0%) | 0 (0.0%) |
| 25 to 34 Years | 109 (41.4%) | 49 (18.1%) |
| 35 to 44 Years | 3 (4.5%) | 28 (21.9%) |
| 45 to 54 Years | 129 (46.6%) | 40 (18.4%) |
| 55 to 64 Years | 24 (14.4%) | 5 (2.9%) |
| 65 to 74 Years | 0 (0.0%) | 49 (30.1%) |
| 75 Years and over | 6 (3.5%) | 5 (2.1%) |
| Total | 381 (19.9%) | 302 (18.5%) |
Income Above Poverty by Sex and Age in Kaunakakai
According to the poverty statistics in Kaunakakai, males aged 5 years and females aged under 5 years are the age groups that are most secure financially, with 100.0% of males and 100.0% of females in these age groups living above the poverty line.
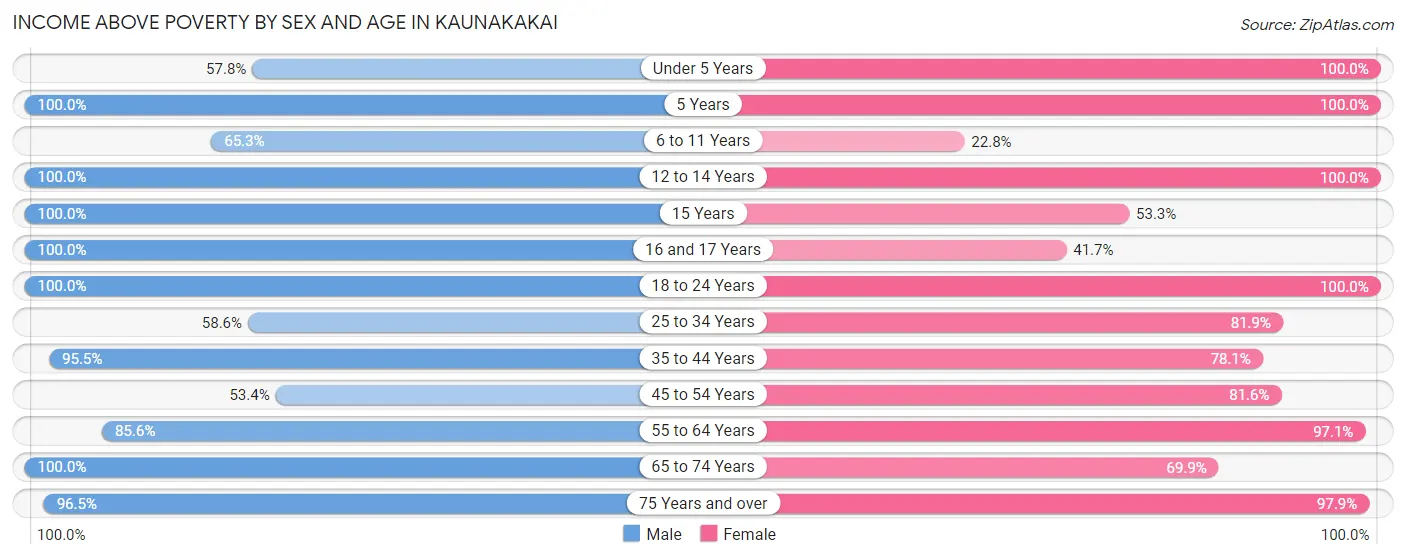
| Age Bracket | Male | Female |
| Under 5 Years | 67 (57.8%) | 46 (100.0%) |
| 5 Years | 43 (100.0%) | 3 (100.0%) |
| 6 to 11 Years | 115 (65.3%) | 33 (22.8%) |
| 12 to 14 Years | 169 (100.0%) | 36 (100.0%) |
| 15 Years | 166 (100.0%) | 8 (53.3%) |
| 16 and 17 Years | 65 (100.0%) | 5 (41.7%) |
| 18 to 24 Years | 127 (100.0%) | 185 (100.0%) |
| 25 to 34 Years | 154 (58.6%) | 221 (81.9%) |
| 35 to 44 Years | 63 (95.5%) | 100 (78.1%) |
| 45 to 54 Years | 148 (53.4%) | 177 (81.6%) |
| 55 to 64 Years | 143 (85.6%) | 170 (97.1%) |
| 65 to 74 Years | 115 (100.0%) | 114 (69.9%) |
| 75 Years and over | 163 (96.5%) | 230 (97.9%) |
| Total | 1,538 (80.1%) | 1,328 (81.5%) |
Income Below Poverty Among Married-Couple Families in Kaunakakai
The poverty statistics for married-couple families in Kaunakakai show that 6.0% or 28 of the total 470 families live below the poverty line. Families with 3 or 4 children have the highest poverty rate of 36.8%, comprising of 28 families. On the other hand, families with no children have the lowest poverty rate of 0.0%, which includes 0 families.
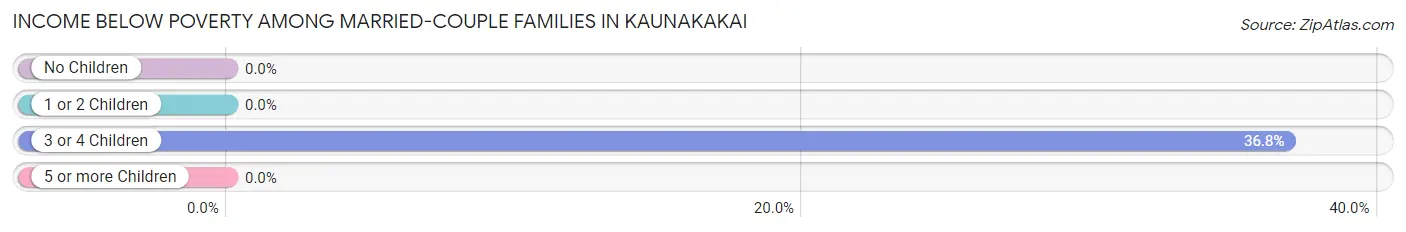
| Children | Above Poverty | Below Poverty |
| No Children | 213 (100.0%) | 0 (0.0%) |
| 1 or 2 Children | 133 (100.0%) | 0 (0.0%) |
| 3 or 4 Children | 48 (63.2%) | 28 (36.8%) |
| 5 or more Children | 48 (100.0%) | 0 (0.0%) |
| Total | 442 (94.0%) | 28 (6.0%) |
Income Below Poverty Among Single-Parent Households in Kaunakakai
According to the poverty data in Kaunakakai, 86.0% or 43 single-father households and 34.8% or 79 single-mother households are living below the poverty line. Among single-father households, those with no children have the highest poverty rate, with 43 households (93.5%) experiencing poverty. Likewise, among single-mother households, those with 1 or 2 children have the highest poverty rate, with 47 households (51.6%) falling below the poverty line.
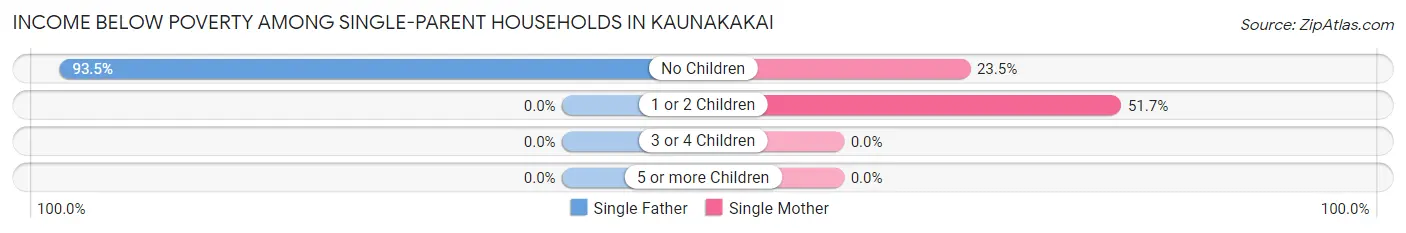
| Children | Single Father | Single Mother |
| No Children | 43 (93.5%) | 32 (23.5%) |
| 1 or 2 Children | 0 (0.0%) | 47 (51.6%) |
| 3 or 4 Children | 0 (0.0%) | 0 (0.0%) |
| 5 or more Children | 0 (0.0%) | 0 (0.0%) |
| Total | 43 (86.0%) | 79 (34.8%) |
Income Below Poverty Among Married-Couple vs Single-Parent Households in Kaunakakai
The poverty data for Kaunakakai shows that 28 of the married-couple family households (6.0%) and 122 of the single-parent households (44.0%) are living below the poverty level. Within the married-couple family households, those with 3 or 4 children have the highest poverty rate, with 28 households (36.8%) falling below the poverty line. Among the single-parent households, those with 1 or 2 children have the highest poverty rate, with 47 household (49.5%) living below poverty.
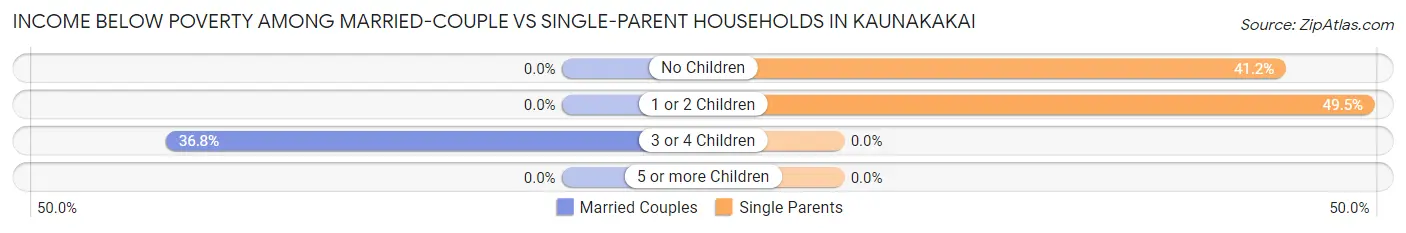
| Children | Married-Couple Families | Single-Parent Households |
| No Children | 0 (0.0%) | 75 (41.2%) |
| 1 or 2 Children | 0 (0.0%) | 47 (49.5%) |
| 3 or 4 Children | 28 (36.8%) | 0 (0.0%) |
| 5 or more Children | 0 (0.0%) | 0 (0.0%) |
| Total | 28 (6.0%) | 122 (44.0%) |
Race in Kaunakakai
The most populous races in Kaunakakai are Two or more Races (1,548 | 43.6%), Hawaiian / Pacific (1,298 | 36.5%), and Hispanic or Latino (397 | 11.2%).
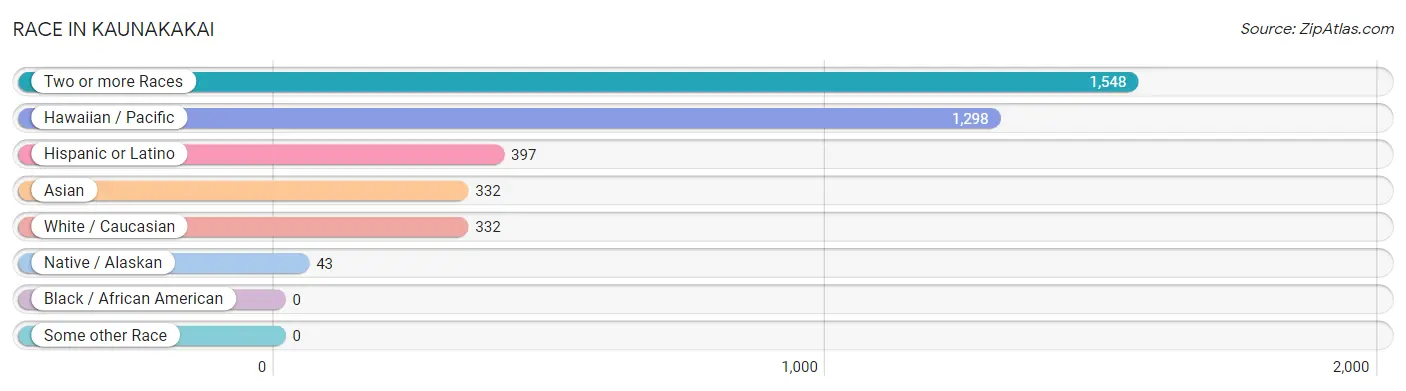
| Race | # Population | % Population |
| Asian | 332 | 9.3% |
| Black / African American | 0 | 0.0% |
| Hawaiian / Pacific | 1,298 | 36.5% |
| Hispanic or Latino | 397 | 11.2% |
| Native / Alaskan | 43 | 1.2% |
| White / Caucasian | 332 | 9.3% |
| Two or more Races | 1,548 | 43.6% |
| Some other Race | 0 | 0.0% |
| Total | 3,553 | 100.0% |
Ancestry in Kaunakakai
The most populous ancestries reported in Kaunakakai are Native Hawaiian (2,344 | 66.0%), Korean (1,075 | 30.3%), Indian (Asian) (880 | 24.8%), Bhutanese (638 | 18.0%), and Marshallese (319 | 9.0%), together accounting for 147.9% of all Kaunakakai residents.
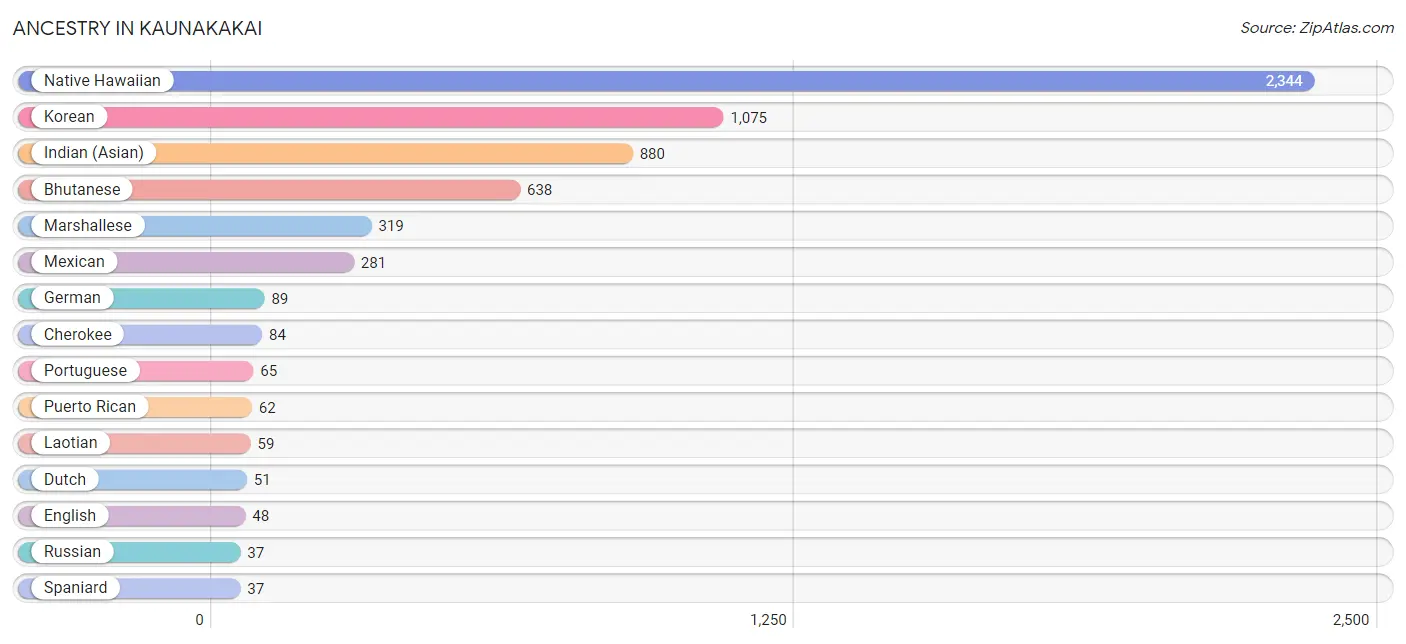
| Ancestry | # Population | % Population |
| Bhutanese | 638 | 18.0% |
| Canadian | 13 | 0.4% |
| Cherokee | 84 | 2.4% |
| Chinese | 11 | 0.3% |
| Dutch | 51 | 1.4% |
| English | 48 | 1.3% |
| Fijian | 1 | 0.0% |
| French | 18 | 0.5% |
| German | 89 | 2.5% |
| Indian (Asian) | 880 | 24.8% |
| Irish | 29 | 0.8% |
| Italian | 2 | 0.1% |
| Korean | 1,075 | 30.3% |
| Laotian | 59 | 1.7% |
| Marshallese | 319 | 9.0% |
| Mexican | 281 | 7.9% |
| Native Hawaiian | 2,344 | 66.0% |
| Norwegian | 23 | 0.6% |
| Polish | 8 | 0.2% |
| Portuguese | 65 | 1.8% |
| Puerto Rican | 62 | 1.8% |
| Russian | 37 | 1.0% |
| Samoan | 13 | 0.4% |
| Spaniard | 37 | 1.0% |
| Spanish | 17 | 0.5% |
| Swedish | 2 | 0.1% |
| Tongan | 8 | 0.2% |
| Welsh | 7 | 0.2% | View All 28 Rows |
Immigrants in Kaunakakai
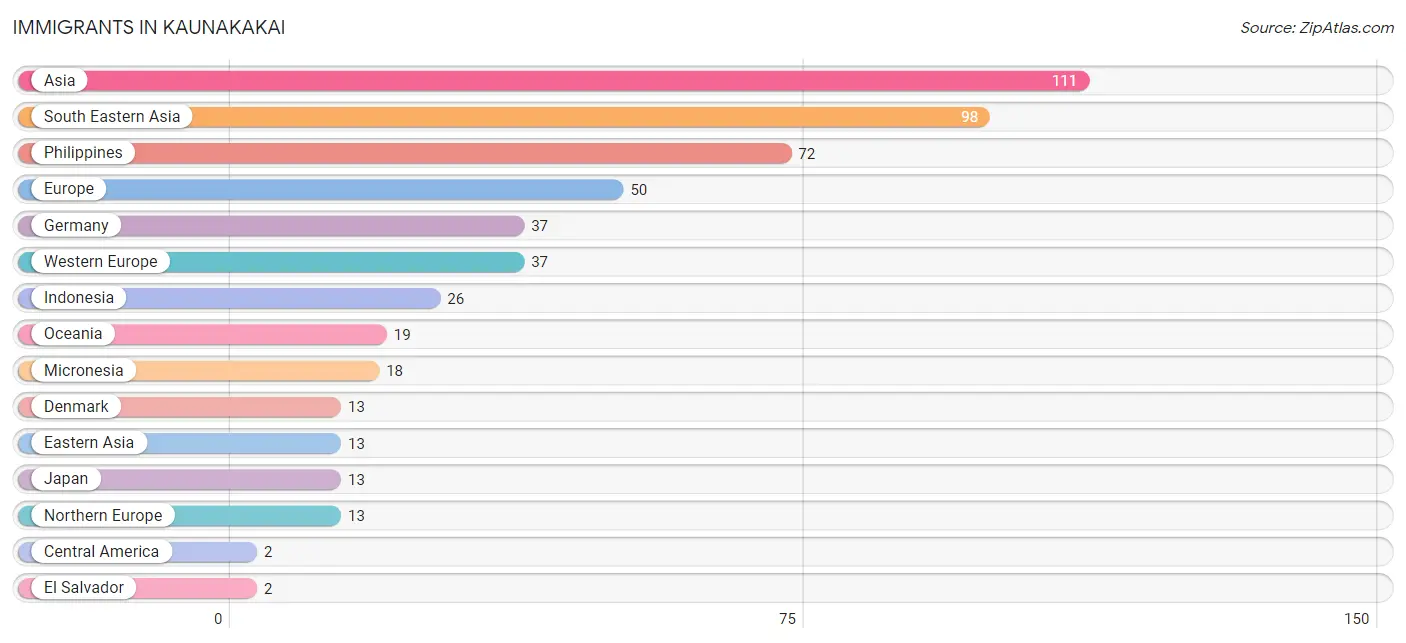
The most numerous immigrant groups reported in Kaunakakai came from Asia (111 | 3.1%), South Eastern Asia (98 | 2.8%), Philippines (72 | 2.0%), Europe (50 | 1.4%), and Germany (37 | 1.0%), together accounting for 10.4% of all Kaunakakai residents.
| Immigration Origin | # Population | % Population |
| Asia | 111 | 3.1% |
| Central America | 2 | 0.1% |
| Denmark | 13 | 0.4% |
| Eastern Asia | 13 | 0.4% |
| El Salvador | 2 | 0.1% |
| Europe | 50 | 1.4% |
| Germany | 37 | 1.0% |
| Indonesia | 26 | 0.7% |
| Japan | 13 | 0.4% |
| Latin America | 2 | 0.1% |
| Micronesia | 18 | 0.5% |
| Northern Europe | 13 | 0.4% |
| Oceania | 19 | 0.5% |
| Philippines | 72 | 2.0% |
| South Eastern Asia | 98 | 2.8% |
| Western Europe | 37 | 1.0% | View All 16 Rows |
Sex and Age in Kaunakakai
Sex and Age in Kaunakakai
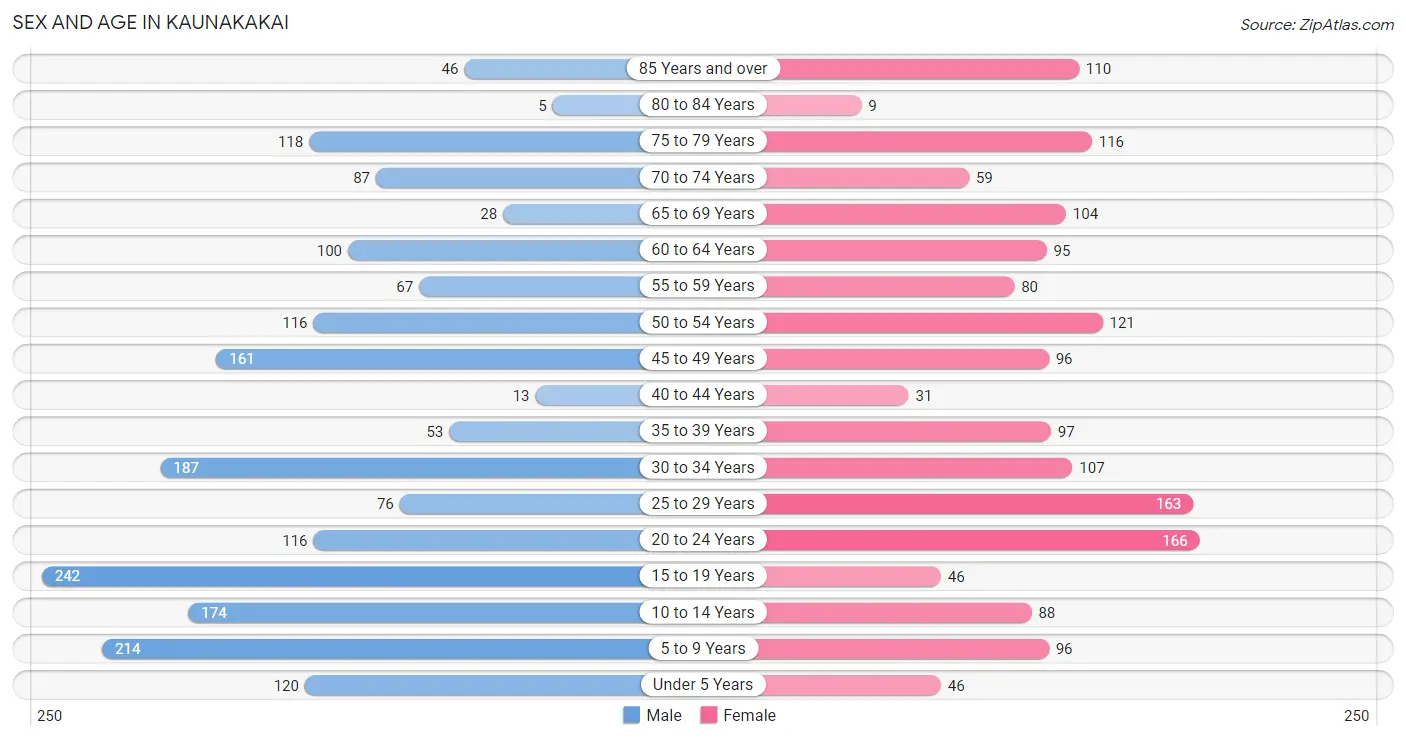
The most populous age groups in Kaunakakai are 15 to 19 Years (242 | 12.6%) for men and 20 to 24 Years (166 | 10.2%) for women.
| Age Bracket | Male | Female |
| Under 5 Years | 120 (6.2%) | 46 (2.8%) |
| 5 to 9 Years | 214 (11.1%) | 96 (5.9%) |
| 10 to 14 Years | 174 (9.0%) | 88 (5.4%) |
| 15 to 19 Years | 242 (12.6%) | 46 (2.8%) |
| 20 to 24 Years | 116 (6.0%) | 166 (10.2%) |
| 25 to 29 Years | 76 (4.0%) | 163 (10.0%) |
| 30 to 34 Years | 187 (9.7%) | 107 (6.6%) |
| 35 to 39 Years | 53 (2.8%) | 97 (5.9%) |
| 40 to 44 Years | 13 (0.7%) | 31 (1.9%) |
| 45 to 49 Years | 161 (8.4%) | 96 (5.9%) |
| 50 to 54 Years | 116 (6.0%) | 121 (7.4%) |
| 55 to 59 Years | 67 (3.5%) | 80 (4.9%) |
| 60 to 64 Years | 100 (5.2%) | 95 (5.8%) |
| 65 to 69 Years | 28 (1.5%) | 104 (6.4%) |
| 70 to 74 Years | 87 (4.5%) | 59 (3.6%) |
| 75 to 79 Years | 118 (6.1%) | 116 (7.1%) |
| 80 to 84 Years | 5 (0.3%) | 9 (0.5%) |
| 85 Years and over | 46 (2.4%) | 110 (6.8%) |
| Total | 1,923 (100.0%) | 1,630 (100.0%) |
Families and Households in Kaunakakai
Median Family Size in Kaunakakai
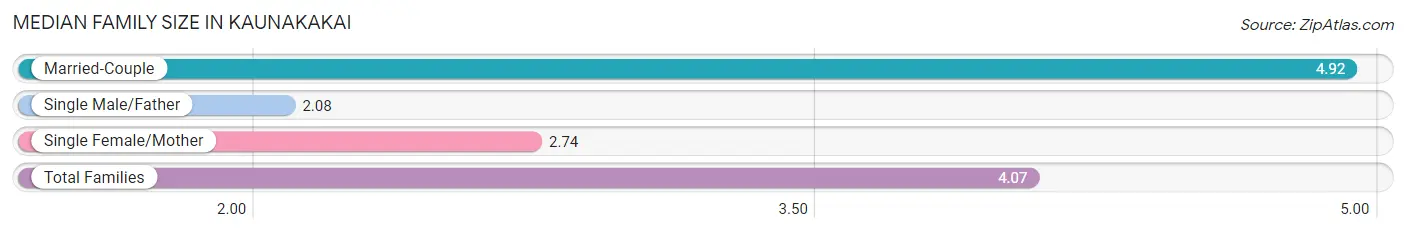
The median family size in Kaunakakai is 4.07 persons per family, with married-couple families (470 | 62.9%) accounting for the largest median family size of 4.92 persons per family. On the other hand, single male/father families (50 | 6.7%) represent the smallest median family size with 2.08 persons per family.
| Family Type | # Families | Family Size |
| Married-Couple | 470 (62.9%) | 4.92 |
| Single Male/Father | 50 (6.7%) | 2.08 |
| Single Female/Mother | 227 (30.4%) | 2.74 |
| Total Families | 747 (100.0%) | 4.07 |
Median Household Size in Kaunakakai
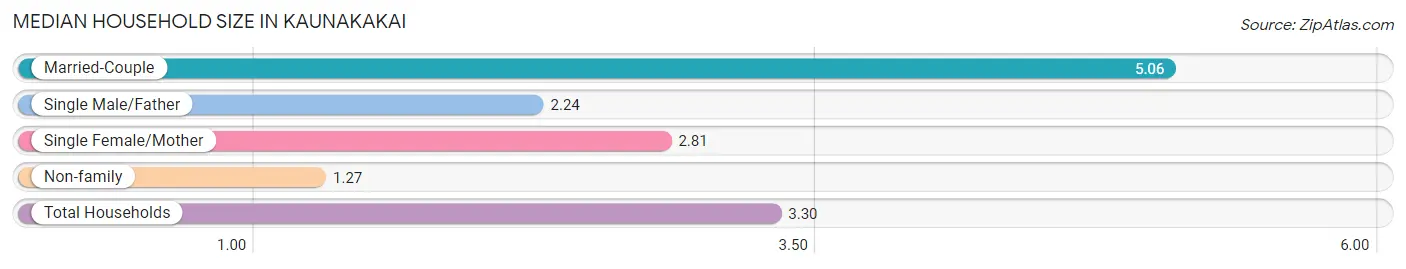
The median household size in Kaunakakai is 3.30 persons per household, with married-couple households (470 | 43.7%) accounting for the largest median household size of 5.06 persons per household. non-family households (329 | 30.6%) represent the smallest median household size with 1.27 persons per household.
| Household Type | # Households | Household Size |
| Married-Couple | 470 (43.7%) | 5.06 |
| Single Male/Father | 50 (4.6%) | 2.24 |
| Single Female/Mother | 227 (21.1%) | 2.81 |
| Non-family | 329 (30.6%) | 1.27 |
| Total Households | 1,076 (100.0%) | 3.30 |
Household Size by Marriage Status in Kaunakakai
Out of a total of 1,076 households in Kaunakakai, 747 (69.4%) are family households, while 329 (30.6%) are nonfamily households. The most numerous type of family households are 2-person households, comprising 270, and the most common type of nonfamily households are 1-person households, comprising 267.
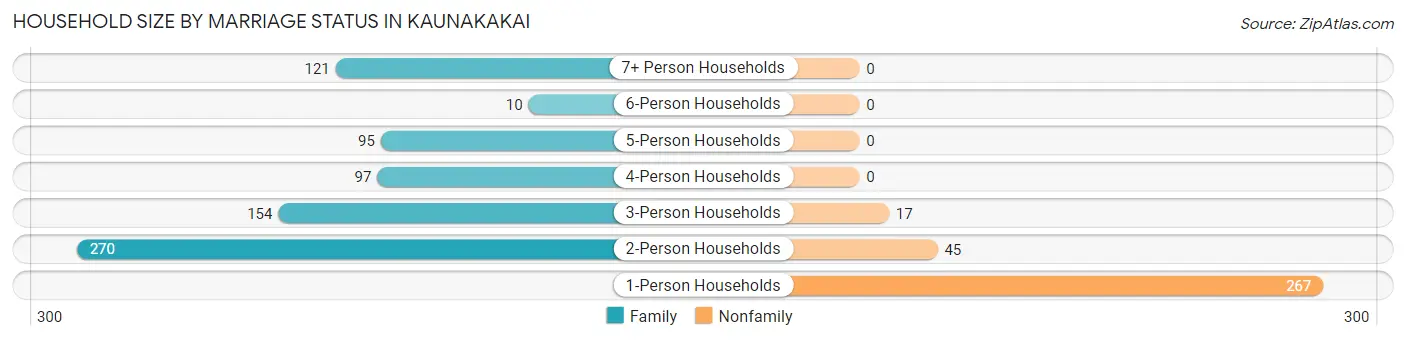
| Household Size | Family Households | Nonfamily Households |
| 1-Person Households | - | 267 (24.8%) |
| 2-Person Households | 270 (25.1%) | 45 (4.2%) |
| 3-Person Households | 154 (14.3%) | 17 (1.6%) |
| 4-Person Households | 97 (9.0%) | 0 (0.0%) |
| 5-Person Households | 95 (8.8%) | 0 (0.0%) |
| 6-Person Households | 10 (0.9%) | 0 (0.0%) |
| 7+ Person Households | 121 (11.3%) | 0 (0.0%) |
| Total | 747 (69.4%) | 329 (30.6%) |
Female Fertility in Kaunakakai
Fertility by Age in Kaunakakai
Average fertility rate in Kaunakakai is 72.0 births per 1,000 women. Women in the age bracket of 20 to 34 years have the highest fertility rate with 128.0 births per 1,000 women. Women in the age bracket of 20 to 34 years acount for 100.0% of all women with births.
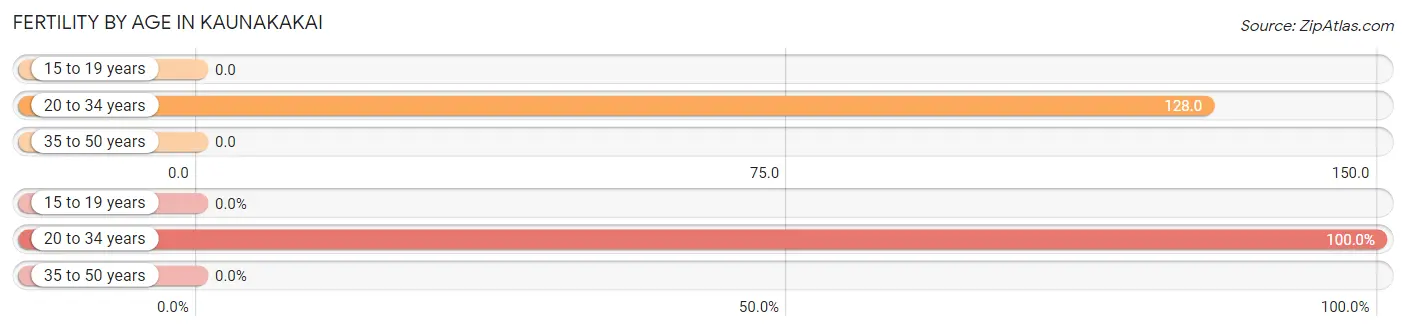
| Age Bracket | Women with Births | Births / 1,000 Women |
| 15 to 19 years | 0 (0.0%) | 0.0 |
| 20 to 34 years | 56 (100.0%) | 128.0 |
| 35 to 50 years | 0 (0.0%) | 0.0 |
| Total | 56 (100.0%) | 72.0 |
Fertility by Age by Marriage Status in Kaunakakai
91.1% of women with births (56) in Kaunakakai are married. The highest percentage of unmarried women with births falls into 20 to 34 years age bracket with 8.9% of them unmarried at the time of birth, while the lowest percentage of unmarried women with births belong to 20 to 34 years age bracket with 8.9% of them unmarried.
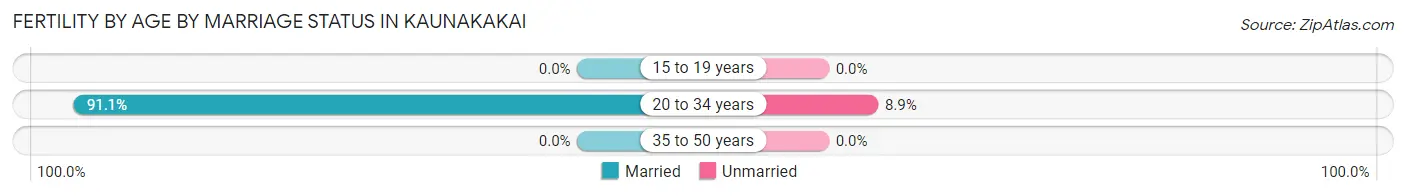
| Age Bracket | Married | Unmarried |
| 15 to 19 years | 0 (0.0%) | 0 (0.0%) |
| 20 to 34 years | 51 (91.1%) | 5 (8.9%) |
| 35 to 50 years | 0 (0.0%) | 0 (0.0%) |
| Total | 51 (91.1%) | 5 (8.9%) |
Fertility by Education in Kaunakakai
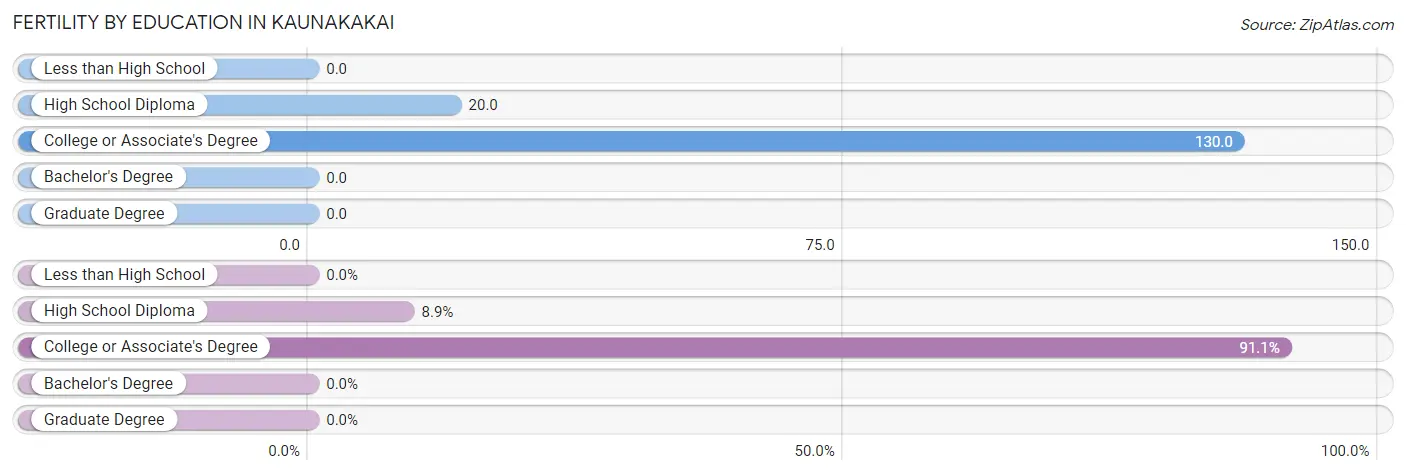
| Educational Attainment | Women with Births | Births / 1,000 Women |
| Less than High School | 0 (0.0%) | 0.0 |
| High School Diploma | 5 (8.9%) | 20.0 |
| College or Associate's Degree | 51 (91.1%) | 130.0 |
| Bachelor's Degree | 0 (0.0%) | 0.0 |
| Graduate Degree | 0 (0.0%) | 0.0 |
| Total | 56 (100.0%) | 72.0 |
Fertility by Education by Marriage Status in Kaunakakai
8.9% of women with births in Kaunakakai are unmarried. Women with the educational attainment of college or associate's degree are most likely to be married with 100.0% of them married at childbirth, while women with the educational attainment of high school diploma are least likely to be married with 100.0% of them unmarried at childbirth.
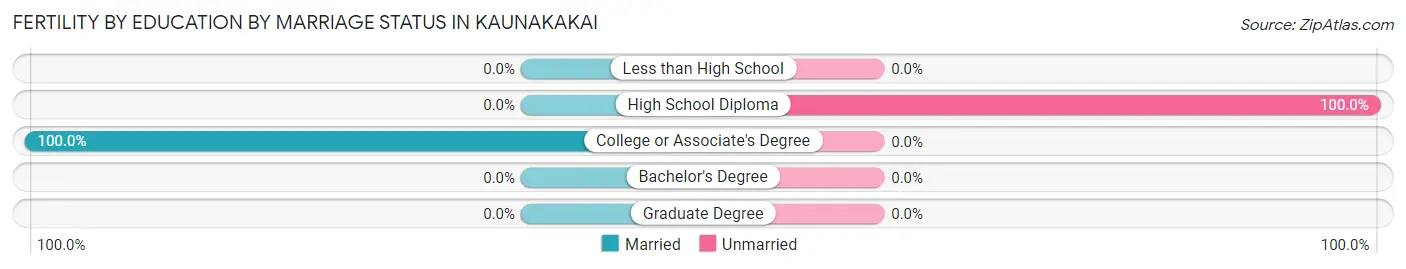
| Educational Attainment | Married | Unmarried |
| Less than High School | 0 (0.0%) | 0 (0.0%) |
| High School Diploma | 0 (0.0%) | 5 (100.0%) |
| College or Associate's Degree | 51 (100.0%) | 0 (0.0%) |
| Bachelor's Degree | 0 (0.0%) | 0 (0.0%) |
| Graduate Degree | 0 (0.0%) | 0 (0.0%) |
| Total | 51 (91.1%) | 5 (8.9%) |
Employment Characteristics in Kaunakakai
Employment by Class of Employer in Kaunakakai
Among the 1,318 employed individuals in Kaunakakai, private company employees (834 | 63.3%), not-for-profit organizations (231 | 17.5%), and state government employees (105 | 8.0%) make up the most common classes of employment.
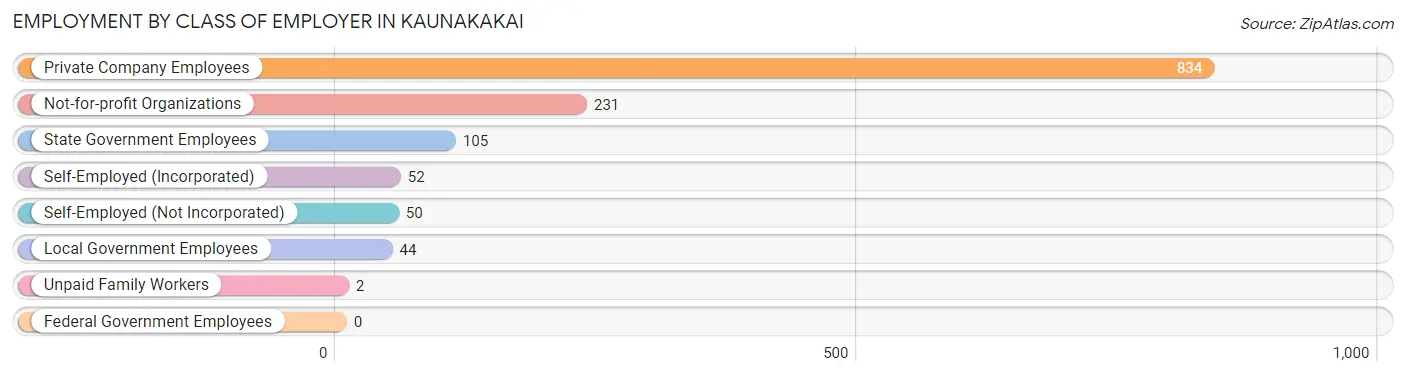
| Employer Class | # Employees | % Employees |
| Private Company Employees | 834 | 63.3% |
| Self-Employed (Incorporated) | 52 | 4.0% |
| Self-Employed (Not Incorporated) | 50 | 3.8% |
| Not-for-profit Organizations | 231 | 17.5% |
| Local Government Employees | 44 | 3.3% |
| State Government Employees | 105 | 8.0% |
| Federal Government Employees | 0 | 0.0% |
| Unpaid Family Workers | 2 | 0.2% |
| Total | 1,318 | 100.0% |
Employment Status by Age in Kaunakakai
According to the labor force statistics for Kaunakakai, out of the total population over 16 years of age (2,634), 53.6% or 1,412 individuals are in the labor force, with 6.1% or 86 of them unemployed. The age group with the highest labor force participation rate is 20 to 24 years, with 98.2% or 277 individuals in the labor force. Within the labor force, the 30 to 34 years age range has the highest percentage of unemployed individuals, with 67.2% or 39 of them being unemployed.
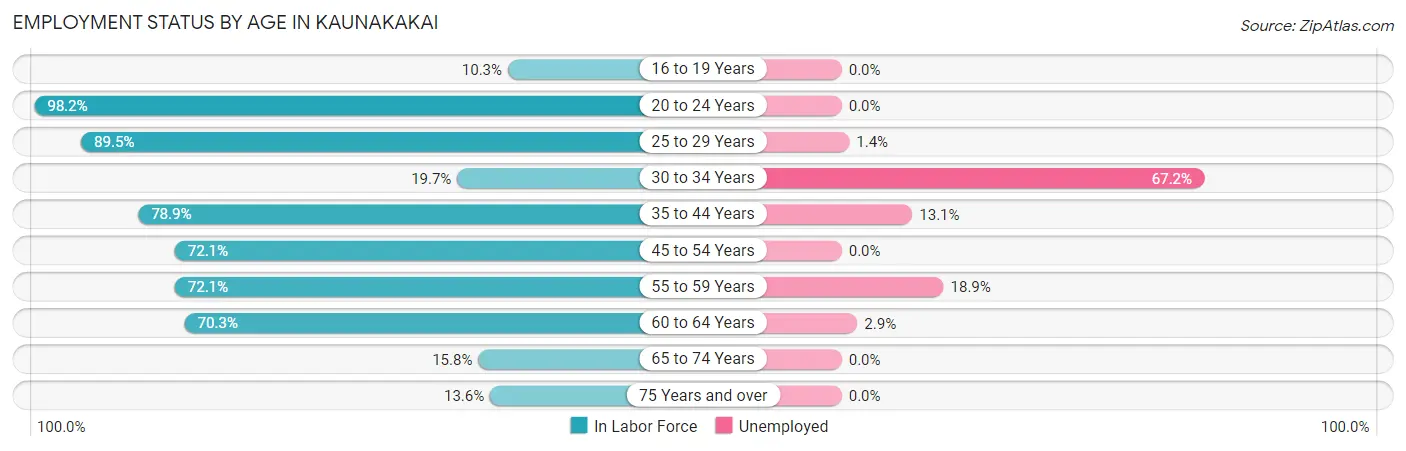
| Age Bracket | In Labor Force | Unemployed |
| 16 to 19 Years | 11 (10.3%) | 0 (0.0%) |
| 20 to 24 Years | 277 (98.2%) | 0 (0.0%) |
| 25 to 29 Years | 214 (89.5%) | 3 (1.4%) |
| 30 to 34 Years | 58 (19.7%) | 39 (67.2%) |
| 35 to 44 Years | 153 (78.9%) | 20 (13.1%) |
| 45 to 54 Years | 356 (72.1%) | 0 (0.0%) |
| 55 to 59 Years | 106 (72.1%) | 20 (18.9%) |
| 60 to 64 Years | 137 (70.3%) | 4 (2.9%) |
| 65 to 74 Years | 44 (15.8%) | 0 (0.0%) |
| 75 Years and over | 55 (13.6%) | 0 (0.0%) |
| Total | 1,412 (53.6%) | 86 (6.1%) |
Employment Status by Educational Attainment in Kaunakakai
According to labor force statistics for Kaunakakai, 65.5% of individuals (1,024) out of the total population between 25 and 64 years of age (1,563) are in the labor force, with 8.4% or 86 of them being unemployed. The group with the highest labor force participation rate are those with the educational attainment of college / associate degree, with 76.3% or 527 individuals in the labor force. Within the labor force, individuals with college / associate degree education have the highest percentage of unemployment, with 10.6% or 56 of them being unemployed.
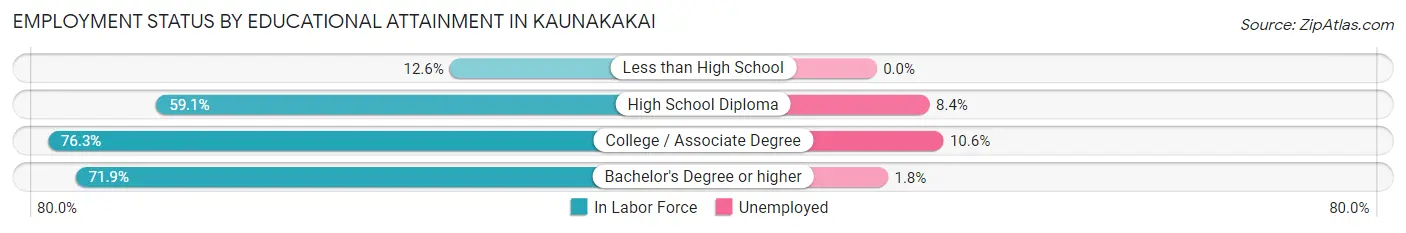
| Educational Attainment | In Labor Force | Unemployed |
| Less than High School | 13 (12.6%) | 0 (0.0%) |
| High School Diploma | 320 (59.1%) | 45 (8.4%) |
| College / Associate Degree | 527 (76.3%) | 73 (10.6%) |
| Bachelor's Degree or higher | 164 (71.9%) | 4 (1.8%) |
| Total | 1,024 (65.5%) | 131 (8.4%) |
Employment Occupations by Sex in Kaunakakai
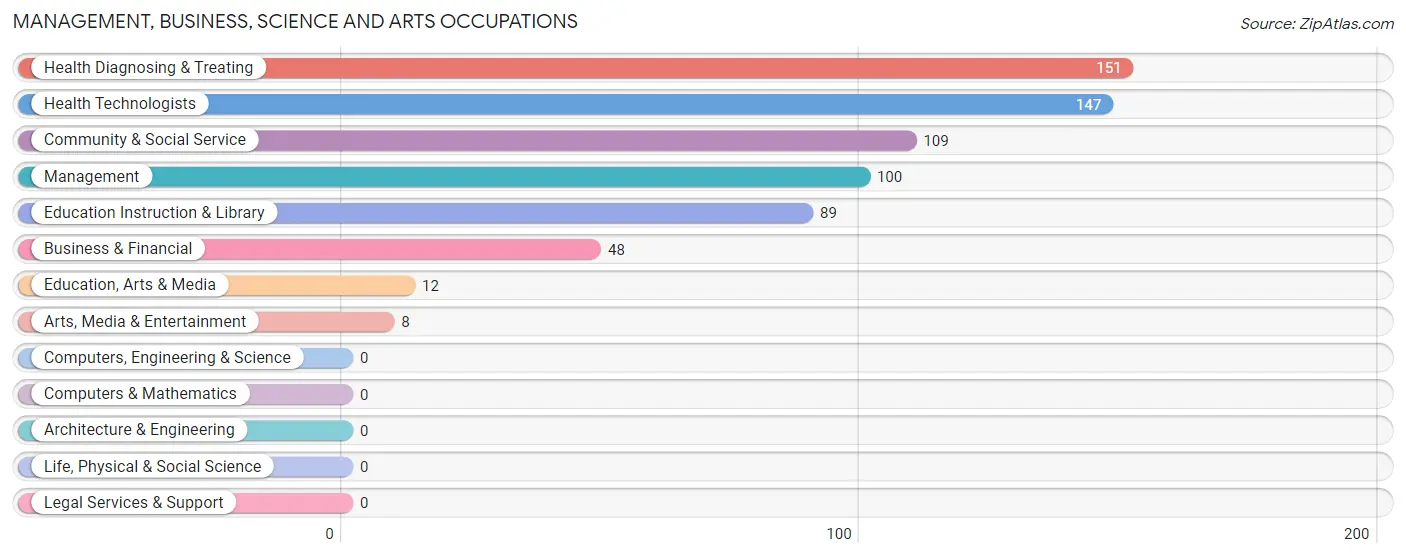
Management, Business, Science and Arts Occupations
The most common Management, Business, Science and Arts occupations in Kaunakakai are Health Diagnosing & Treating (151 | 11.4%), Health Technologists (147 | 11.1%), Community & Social Service (109 | 8.2%), Management (100 | 7.5%), and Education Instruction & Library (89 | 6.7%).
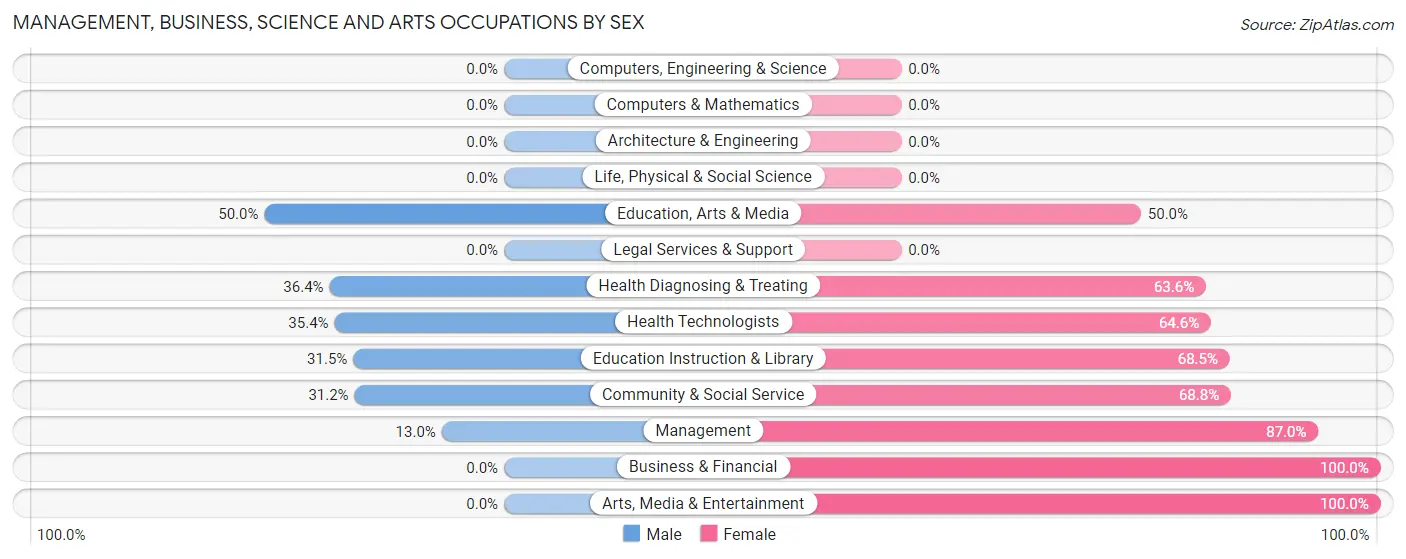
Management, Business, Science and Arts Occupations by Sex
Within the Management, Business, Science and Arts occupations in Kaunakakai, the most male-oriented occupations are Education, Arts & Media (50.0%), Health Diagnosing & Treating (36.4%), and Health Technologists (35.4%), while the most female-oriented occupations are Business & Financial (100.0%), Arts, Media & Entertainment (100.0%), and Management (87.0%).
| Occupation | Male | Female |
| Management | 13 (13.0%) | 87 (87.0%) |
| Business & Financial | 0 (0.0%) | 48 (100.0%) |
| Computers, Engineering & Science | 0 (0.0%) | 0 (0.0%) |
| Computers & Mathematics | 0 (0.0%) | 0 (0.0%) |
| Architecture & Engineering | 0 (0.0%) | 0 (0.0%) |
| Life, Physical & Social Science | 0 (0.0%) | 0 (0.0%) |
| Community & Social Service | 34 (31.2%) | 75 (68.8%) |
| Education, Arts & Media | 6 (50.0%) | 6 (50.0%) |
| Legal Services & Support | 0 (0.0%) | 0 (0.0%) |
| Education Instruction & Library | 28 (31.5%) | 61 (68.5%) |
| Arts, Media & Entertainment | 0 (0.0%) | 8 (100.0%) |
| Health Diagnosing & Treating | 55 (36.4%) | 96 (63.6%) |
| Health Technologists | 52 (35.4%) | 95 (64.6%) |
| Total (Category) | 102 (25.0%) | 306 (75.0%) |
| Total (Overall) | 510 (38.5%) | 815 (61.5%) |
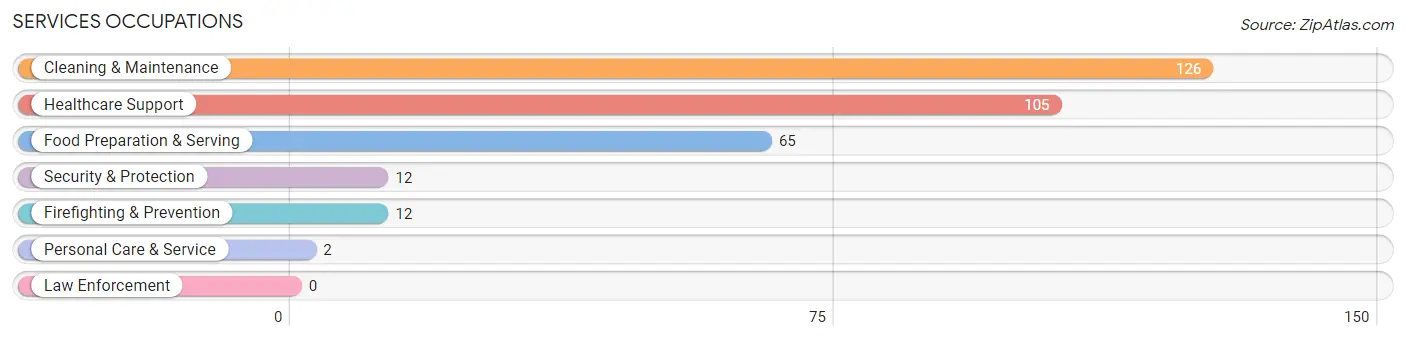
Services Occupations
The most common Services occupations in Kaunakakai are Cleaning & Maintenance (126 | 9.5%), Healthcare Support (105 | 7.9%), Food Preparation & Serving (65 | 4.9%), Security & Protection (12 | 0.9%), and Firefighting & Prevention (12 | 0.9%).
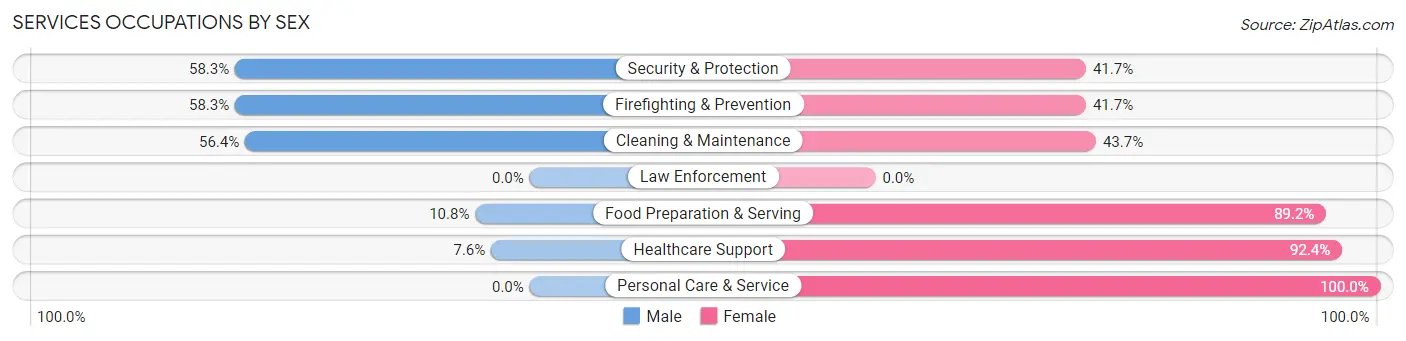
Services Occupations by Sex
Within the Services occupations in Kaunakakai, the most male-oriented occupations are Security & Protection (58.3%), Firefighting & Prevention (58.3%), and Cleaning & Maintenance (56.4%), while the most female-oriented occupations are Personal Care & Service (100.0%), Healthcare Support (92.4%), and Food Preparation & Serving (89.2%).
| Occupation | Male | Female |
| Healthcare Support | 8 (7.6%) | 97 (92.4%) |
| Security & Protection | 7 (58.3%) | 5 (41.7%) |
| Firefighting & Prevention | 7 (58.3%) | 5 (41.7%) |
| Law Enforcement | 0 (0.0%) | 0 (0.0%) |
| Food Preparation & Serving | 7 (10.8%) | 58 (89.2%) |
| Cleaning & Maintenance | 71 (56.4%) | 55 (43.6%) |
| Personal Care & Service | 0 (0.0%) | 2 (100.0%) |
| Total (Category) | 93 (30.0%) | 217 (70.0%) |
| Total (Overall) | 510 (38.5%) | 815 (61.5%) |
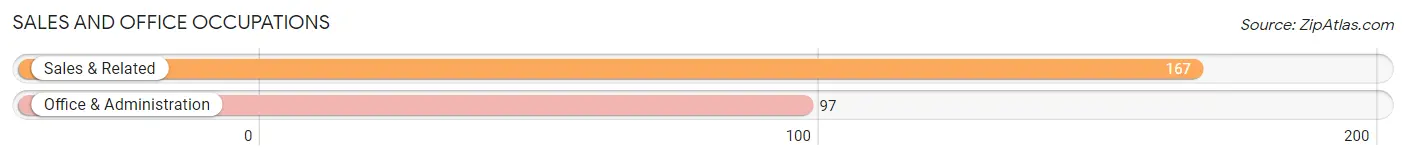
Sales and Office Occupations
The most common Sales and Office occupations in Kaunakakai are Sales & Related (167 | 12.6%), and Office & Administration (97 | 7.3%).
Sales and Office Occupations by Sex
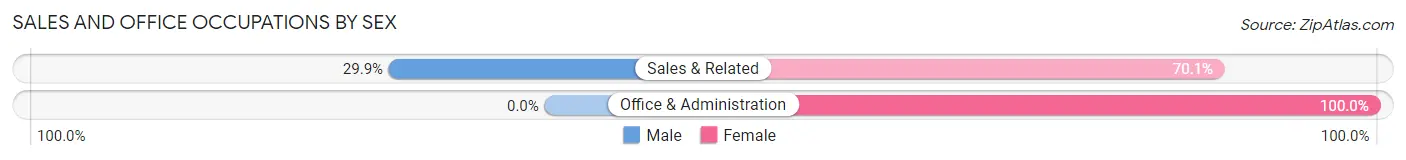
| Occupation | Male | Female |
| Sales & Related | 50 (29.9%) | 117 (70.1%) |
| Office & Administration | 0 (0.0%) | 97 (100.0%) |
| Total (Category) | 50 (18.9%) | 214 (81.1%) |
| Total (Overall) | 510 (38.5%) | 815 (61.5%) |
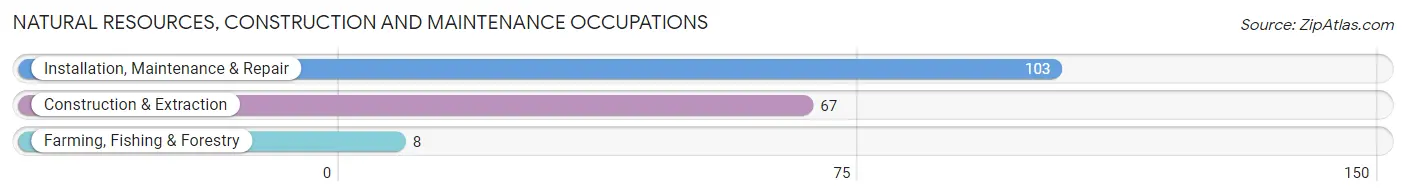
Natural Resources, Construction and Maintenance Occupations
The most common Natural Resources, Construction and Maintenance occupations in Kaunakakai are Installation, Maintenance & Repair (103 | 7.8%), Construction & Extraction (67 | 5.1%), and Farming, Fishing & Forestry (8 | 0.6%).
Natural Resources, Construction and Maintenance Occupations by Sex
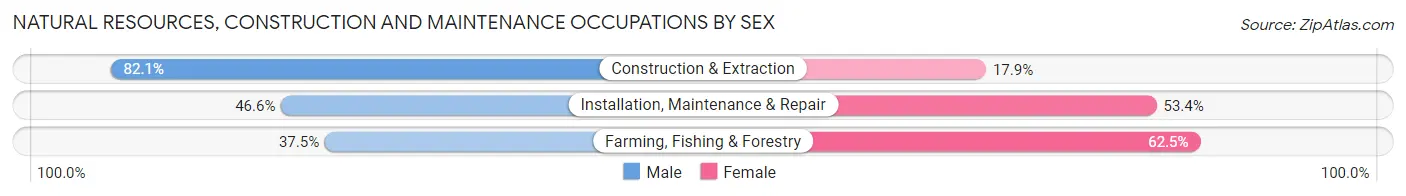
| Occupation | Male | Female |
| Farming, Fishing & Forestry | 3 (37.5%) | 5 (62.5%) |
| Construction & Extraction | 55 (82.1%) | 12 (17.9%) |
| Installation, Maintenance & Repair | 48 (46.6%) | 55 (53.4%) |
| Total (Category) | 106 (59.6%) | 72 (40.5%) |
| Total (Overall) | 510 (38.5%) | 815 (61.5%) |
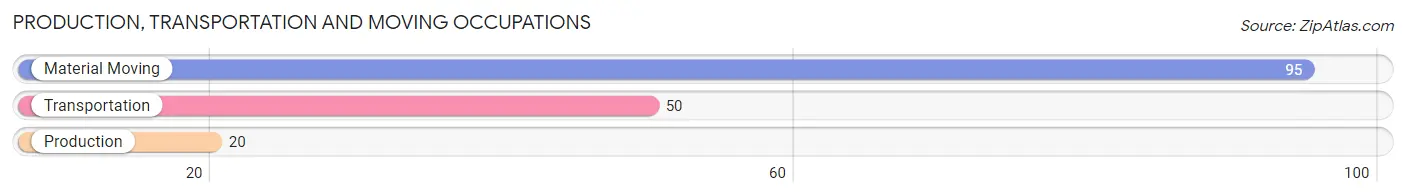
Production, Transportation and Moving Occupations
The most common Production, Transportation and Moving occupations in Kaunakakai are Material Moving (95 | 7.2%), Transportation (50 | 3.8%), and Production (20 | 1.5%).
Production, Transportation and Moving Occupations by Sex
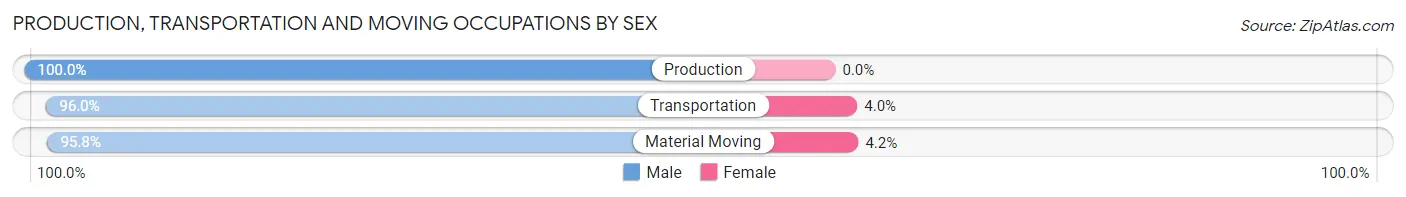
| Occupation | Male | Female |
| Production | 20 (100.0%) | 0 (0.0%) |
| Transportation | 48 (96.0%) | 2 (4.0%) |
| Material Moving | 91 (95.8%) | 4 (4.2%) |
| Total (Category) | 159 (96.4%) | 6 (3.6%) |
| Total (Overall) | 510 (38.5%) | 815 (61.5%) |
Employment Industries by Sex in Kaunakakai
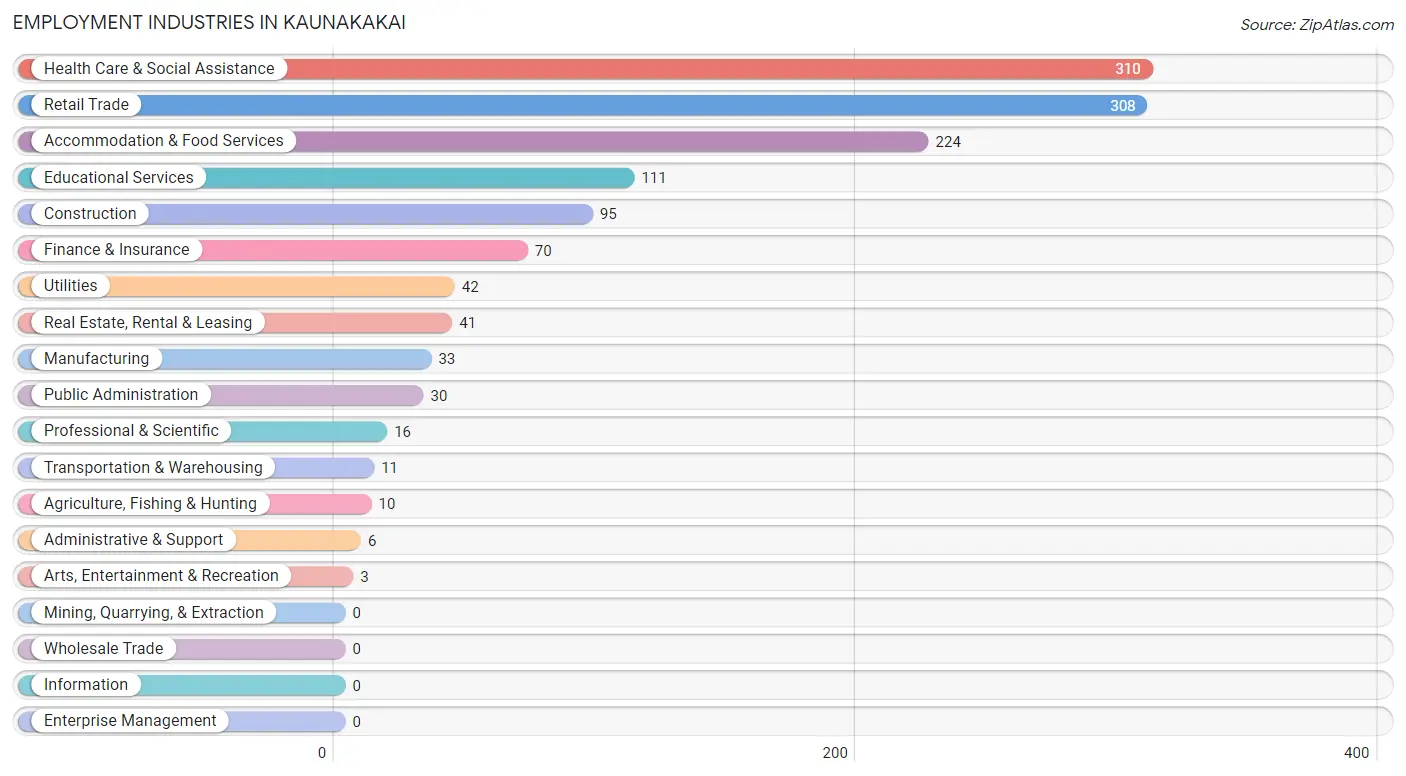
Employment Industries in Kaunakakai
The major employment industries in Kaunakakai include Health Care & Social Assistance (310 | 23.4%), Retail Trade (308 | 23.3%), Accommodation & Food Services (224 | 16.9%), Educational Services (111 | 8.4%), and Construction (95 | 7.2%).
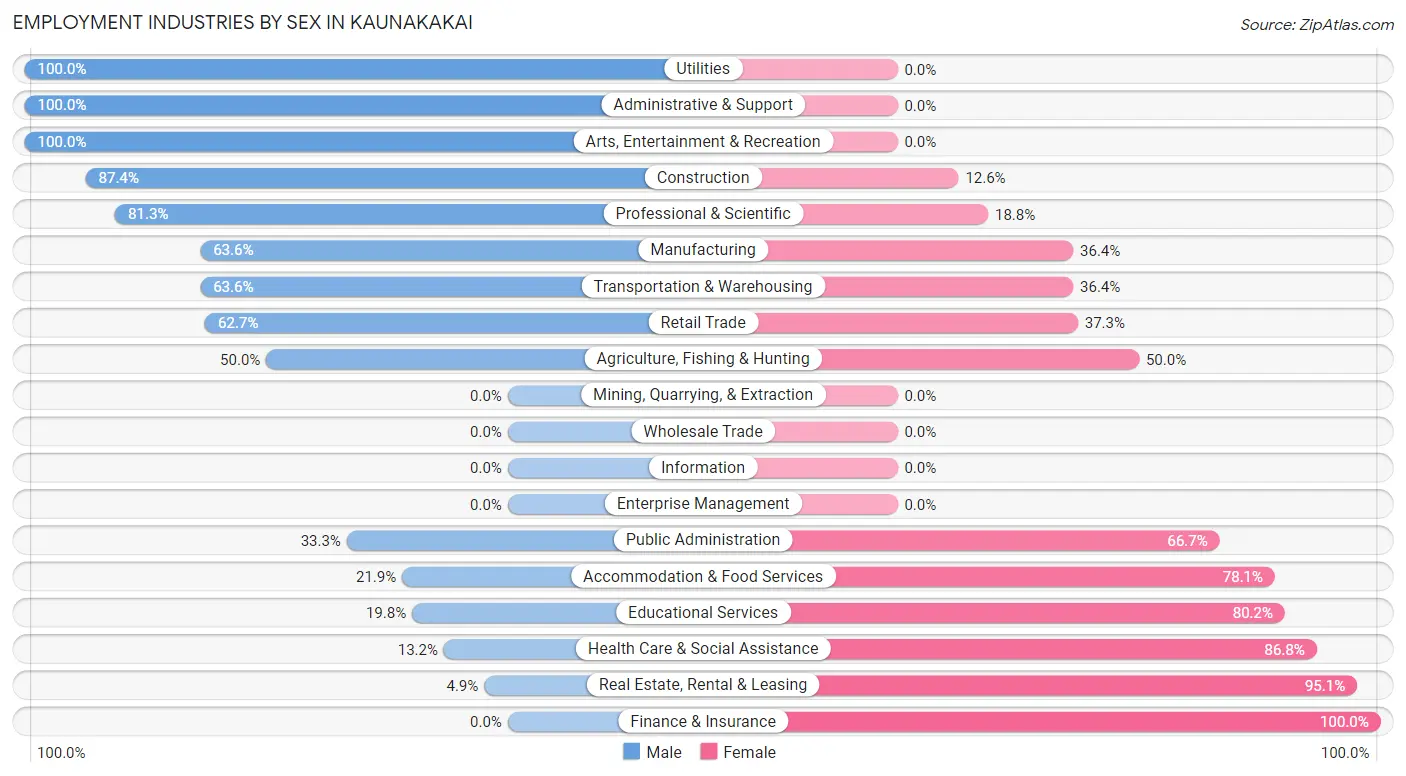
Employment Industries by Sex in Kaunakakai
The Kaunakakai industries that see more men than women are Utilities (100.0%), Administrative & Support (100.0%), and Arts, Entertainment & Recreation (100.0%), whereas the industries that tend to have a higher number of women are Finance & Insurance (100.0%), Real Estate, Rental & Leasing (95.1%), and Health Care & Social Assistance (86.8%).
| Industry | Male | Female |
| Agriculture, Fishing & Hunting | 5 (50.0%) | 5 (50.0%) |
| Mining, Quarrying, & Extraction | 0 (0.0%) | 0 (0.0%) |
| Construction | 83 (87.4%) | 12 (12.6%) |
| Manufacturing | 21 (63.6%) | 12 (36.4%) |
| Wholesale Trade | 0 (0.0%) | 0 (0.0%) |
| Retail Trade | 193 (62.7%) | 115 (37.3%) |
| Transportation & Warehousing | 7 (63.6%) | 4 (36.4%) |
| Utilities | 42 (100.0%) | 0 (0.0%) |
| Information | 0 (0.0%) | 0 (0.0%) |
| Finance & Insurance | 0 (0.0%) | 70 (100.0%) |
| Real Estate, Rental & Leasing | 2 (4.9%) | 39 (95.1%) |
| Professional & Scientific | 13 (81.2%) | 3 (18.8%) |
| Enterprise Management | 0 (0.0%) | 0 (0.0%) |
| Administrative & Support | 6 (100.0%) | 0 (0.0%) |
| Educational Services | 22 (19.8%) | 89 (80.2%) |
| Health Care & Social Assistance | 41 (13.2%) | 269 (86.8%) |
| Arts, Entertainment & Recreation | 3 (100.0%) | 0 (0.0%) |
| Accommodation & Food Services | 49 (21.9%) | 175 (78.1%) |
| Public Administration | 10 (33.3%) | 20 (66.7%) |
| Total | 510 (38.5%) | 815 (61.5%) |
Education in Kaunakakai
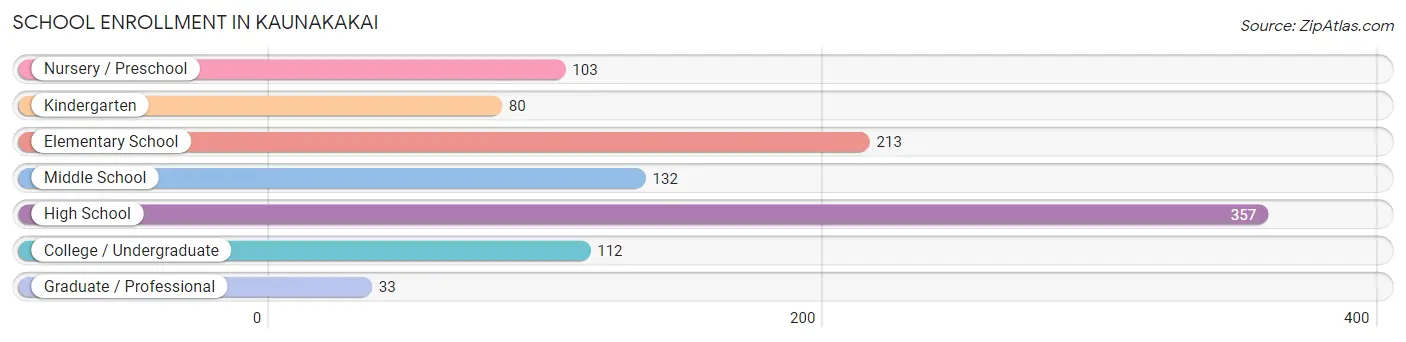
School Enrollment in Kaunakakai
The most common levels of schooling among the 1,030 students in Kaunakakai are high school (357 | 34.7%), elementary school (213 | 20.7%), and middle school (132 | 12.8%).
| School Level | # Students | % Students |
| Nursery / Preschool | 103 | 10.0% |
| Kindergarten | 80 | 7.8% |
| Elementary School | 213 | 20.7% |
| Middle School | 132 | 12.8% |
| High School | 357 | 34.7% |
| College / Undergraduate | 112 | 10.9% |
| Graduate / Professional | 33 | 3.2% |
| Total | 1,030 | 100.0% |
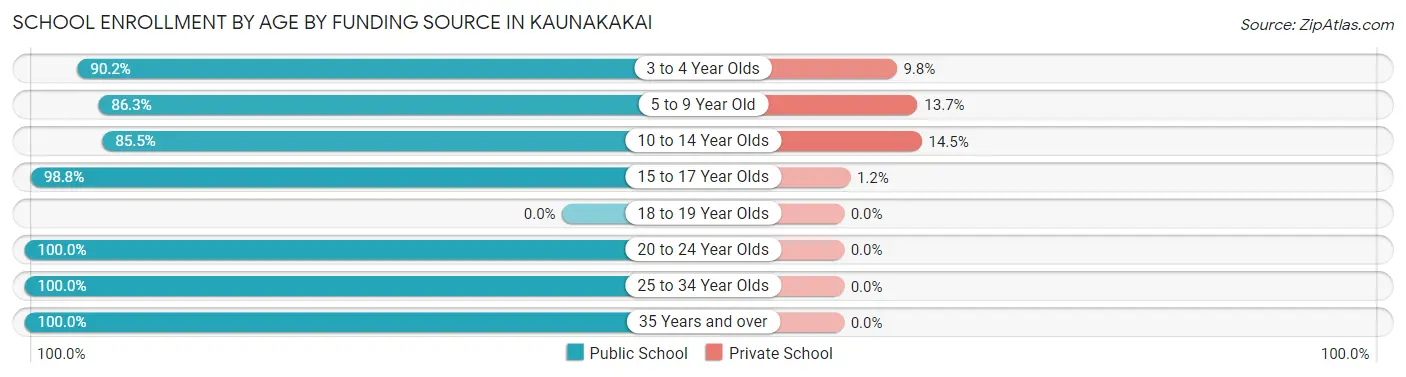
School Enrollment by Age by Funding Source in Kaunakakai
Out of a total of 1,030 students who are enrolled in schools in Kaunakakai, 89 (8.6%) attend a private institution, while the remaining 941 (91.4%) are enrolled in public schools. The age group of 10 to 14 year olds has the highest likelihood of being enrolled in private schools, with 38 (14.5% in the age bracket) enrolled. Conversely, the age group of 20 to 24 year olds has the lowest likelihood of being enrolled in a private school, with 93 (100.0% in the age bracket) attending a public institution.
| Age Bracket | Public School | Private School |
| 3 to 4 Year Olds | 55 (90.2%) | 6 (9.8%) |
| 5 to 9 Year Old | 264 (86.3%) | 42 (13.7%) |
| 10 to 14 Year Olds | 224 (85.5%) | 38 (14.5%) |
| 15 to 17 Year Olds | 253 (98.8%) | 3 (1.2%) |
| 18 to 19 Year Olds | 0 (0.0%) | 0 (0.0%) |
| 20 to 24 Year Olds | 93 (100.0%) | 0 (0.0%) |
| 25 to 34 Year Olds | 34 (100.0%) | 0 (0.0%) |
| 35 Years and over | 18 (100.0%) | 0 (0.0%) |
| Total | 941 (91.4%) | 89 (8.6%) |
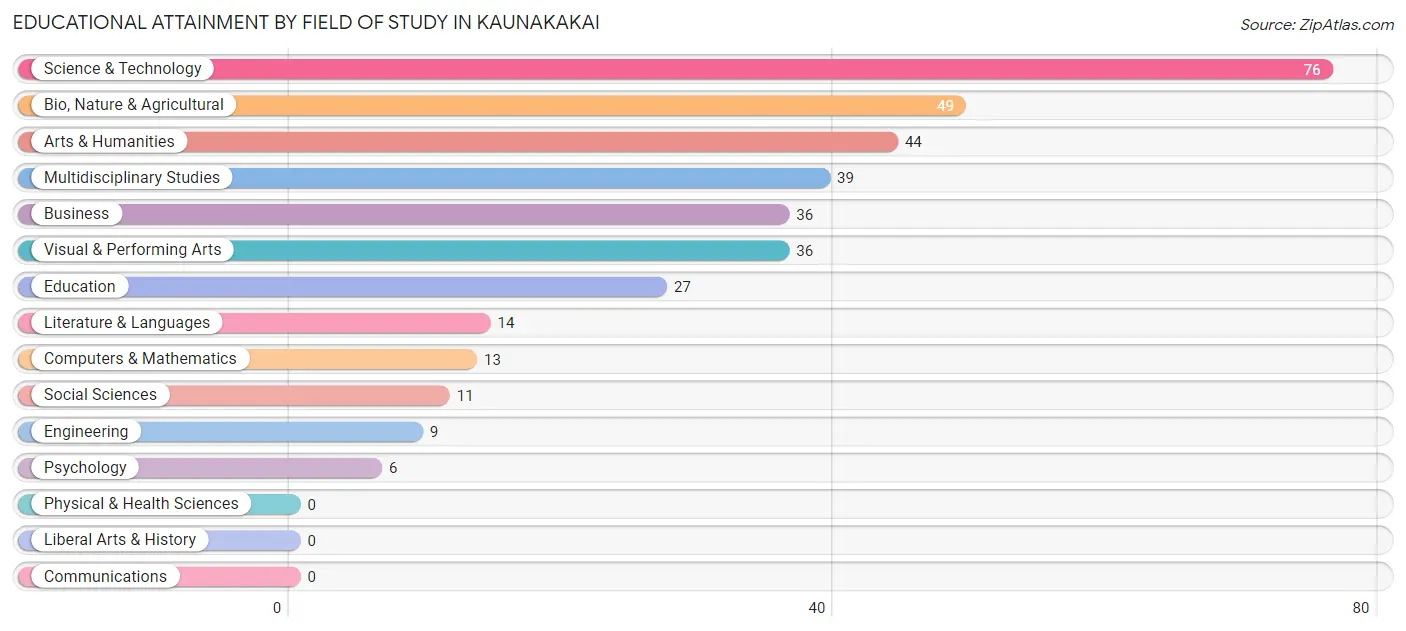
Educational Attainment by Field of Study in Kaunakakai
Science & technology (76 | 21.1%), bio, nature & agricultural (49 | 13.6%), arts & humanities (44 | 12.2%), multidisciplinary studies (39 | 10.8%), and business (36 | 10.0%) are the most common fields of study among 360 individuals in Kaunakakai who have obtained a bachelor's degree or higher.
| Field of Study | # Graduates | % Graduates |
| Computers & Mathematics | 13 | 3.6% |
| Bio, Nature & Agricultural | 49 | 13.6% |
| Physical & Health Sciences | 0 | 0.0% |
| Psychology | 6 | 1.7% |
| Social Sciences | 11 | 3.1% |
| Engineering | 9 | 2.5% |
| Multidisciplinary Studies | 39 | 10.8% |
| Science & Technology | 76 | 21.1% |
| Business | 36 | 10.0% |
| Education | 27 | 7.5% |
| Literature & Languages | 14 | 3.9% |
| Liberal Arts & History | 0 | 0.0% |
| Visual & Performing Arts | 36 | 10.0% |
| Communications | 0 | 0.0% |
| Arts & Humanities | 44 | 12.2% |
| Total | 360 | 100.0% |
Transportation & Commute in Kaunakakai
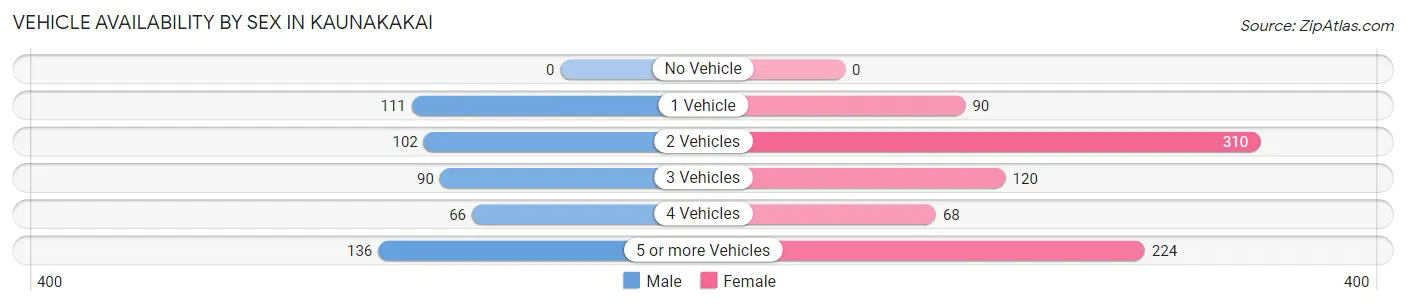
Vehicle Availability by Sex in Kaunakakai
The most prevalent vehicle ownership categories in Kaunakakai are males with 5 or more vehicles (136, accounting for 26.9%) and females with 5 or more vehicles (224, making up 16.8%).
| Vehicles Available | Male | Female |
| No Vehicle | 0 (0.0%) | 0 (0.0%) |
| 1 Vehicle | 111 (22.0%) | 90 (11.1%) |
| 2 Vehicles | 102 (20.2%) | 310 (38.2%) |
| 3 Vehicles | 90 (17.8%) | 120 (14.8%) |
| 4 Vehicles | 66 (13.1%) | 68 (8.4%) |
| 5 or more Vehicles | 136 (26.9%) | 224 (27.6%) |
| Total | 505 (100.0%) | 812 (100.0%) |
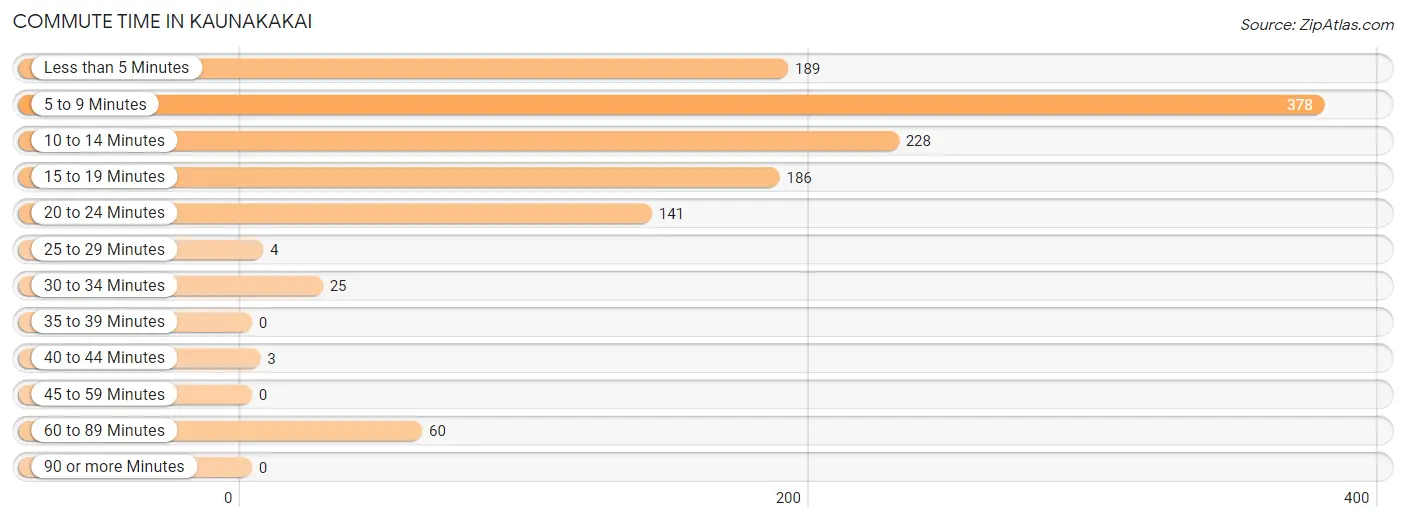
Commute Time in Kaunakakai
The most frequently occuring commute durations in Kaunakakai are 5 to 9 minutes (378 commuters, 31.1%), 10 to 14 minutes (228 commuters, 18.8%), and less than 5 minutes (189 commuters, 15.6%).
| Commute Time | # Commuters | % Commuters |
| Less than 5 Minutes | 189 | 15.6% |
| 5 to 9 Minutes | 378 | 31.1% |
| 10 to 14 Minutes | 228 | 18.8% |
| 15 to 19 Minutes | 186 | 15.3% |
| 20 to 24 Minutes | 141 | 11.6% |
| 25 to 29 Minutes | 4 | 0.3% |
| 30 to 34 Minutes | 25 | 2.1% |
| 35 to 39 Minutes | 0 | 0.0% |
| 40 to 44 Minutes | 3 | 0.3% |
| 45 to 59 Minutes | 0 | 0.0% |
| 60 to 89 Minutes | 60 | 4.9% |
| 90 or more Minutes | 0 | 0.0% |
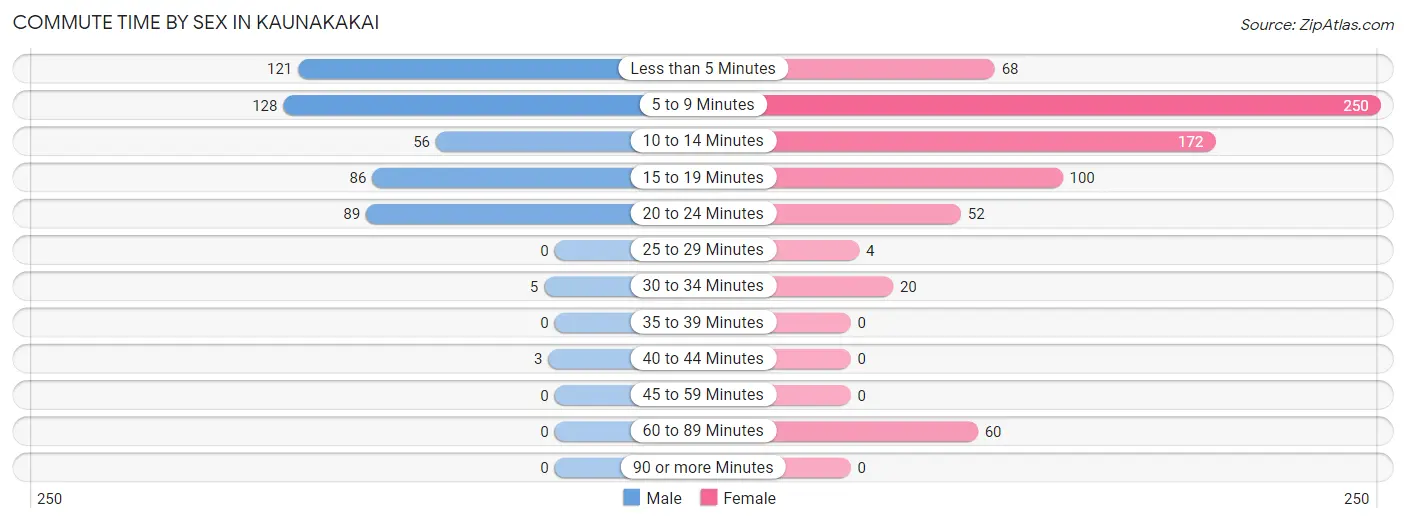
Commute Time by Sex in Kaunakakai
The most common commute times in Kaunakakai are 5 to 9 minutes (128 commuters, 26.2%) for males and 5 to 9 minutes (250 commuters, 34.4%) for females.
| Commute Time | Male | Female |
| Less than 5 Minutes | 121 (24.8%) | 68 (9.4%) |
| 5 to 9 Minutes | 128 (26.2%) | 250 (34.4%) |
| 10 to 14 Minutes | 56 (11.5%) | 172 (23.7%) |
| 15 to 19 Minutes | 86 (17.6%) | 100 (13.8%) |
| 20 to 24 Minutes | 89 (18.2%) | 52 (7.2%) |
| 25 to 29 Minutes | 0 (0.0%) | 4 (0.5%) |
| 30 to 34 Minutes | 5 (1.0%) | 20 (2.8%) |
| 35 to 39 Minutes | 0 (0.0%) | 0 (0.0%) |
| 40 to 44 Minutes | 3 (0.6%) | 0 (0.0%) |
| 45 to 59 Minutes | 0 (0.0%) | 0 (0.0%) |
| 60 to 89 Minutes | 0 (0.0%) | 60 (8.3%) |
| 90 or more Minutes | 0 (0.0%) | 0 (0.0%) |
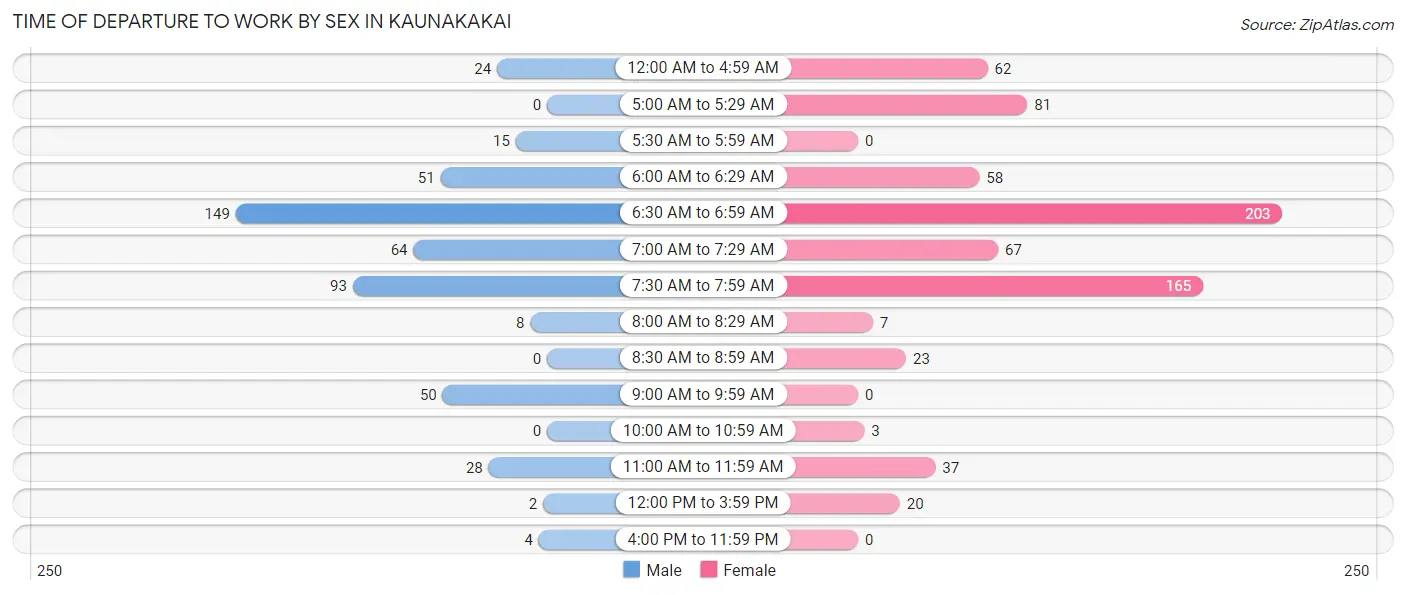
Time of Departure to Work by Sex in Kaunakakai
The most frequent times of departure to work in Kaunakakai are 6:30 AM to 6:59 AM (149, 30.5%) for males and 6:30 AM to 6:59 AM (203, 28.0%) for females.
| Time of Departure | Male | Female |
| 12:00 AM to 4:59 AM | 24 (4.9%) | 62 (8.5%) |
| 5:00 AM to 5:29 AM | 0 (0.0%) | 81 (11.2%) |
| 5:30 AM to 5:59 AM | 15 (3.1%) | 0 (0.0%) |
| 6:00 AM to 6:29 AM | 51 (10.4%) | 58 (8.0%) |
| 6:30 AM to 6:59 AM | 149 (30.5%) | 203 (28.0%) |
| 7:00 AM to 7:29 AM | 64 (13.1%) | 67 (9.2%) |
| 7:30 AM to 7:59 AM | 93 (19.1%) | 165 (22.7%) |
| 8:00 AM to 8:29 AM | 8 (1.6%) | 7 (1.0%) |
| 8:30 AM to 8:59 AM | 0 (0.0%) | 23 (3.2%) |
| 9:00 AM to 9:59 AM | 50 (10.2%) | 0 (0.0%) |
| 10:00 AM to 10:59 AM | 0 (0.0%) | 3 (0.4%) |
| 11:00 AM to 11:59 AM | 28 (5.7%) | 37 (5.1%) |
| 12:00 PM to 3:59 PM | 2 (0.4%) | 20 (2.8%) |
| 4:00 PM to 11:59 PM | 4 (0.8%) | 0 (0.0%) |
| Total | 488 (100.0%) | 726 (100.0%) |
Housing Occupancy in Kaunakakai
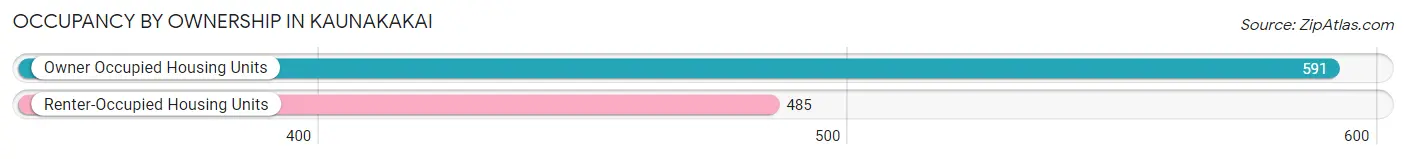
Occupancy by Ownership in Kaunakakai
Of the total 1,076 dwellings in Kaunakakai, owner-occupied units account for 591 (54.9%), while renter-occupied units make up 485 (45.1%).
| Occupancy | # Housing Units | % Housing Units |
| Owner Occupied Housing Units | 591 | 54.9% |
| Renter-Occupied Housing Units | 485 | 45.1% |
| Total Occupied Housing Units | 1,076 | 100.0% |
Occupancy by Household Size in Kaunakakai
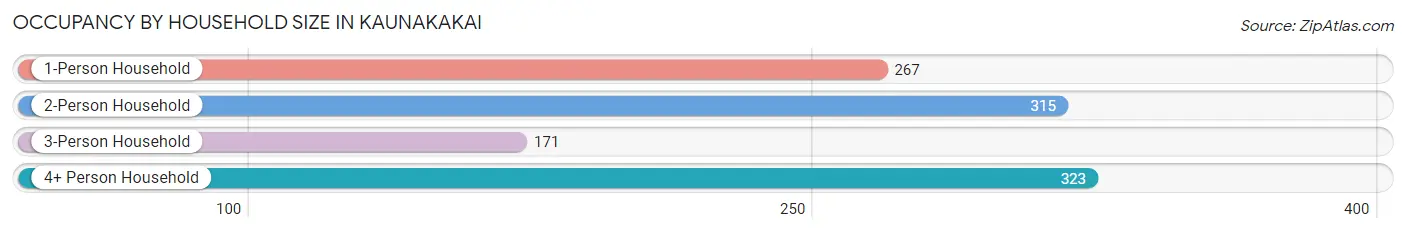
| Household Size | # Housing Units | % Housing Units |
| 1-Person Household | 267 | 24.8% |
| 2-Person Household | 315 | 29.3% |
| 3-Person Household | 171 | 15.9% |
| 4+ Person Household | 323 | 30.0% |
| Total Housing Units | 1,076 | 100.0% |
Occupancy by Ownership by Household Size in Kaunakakai
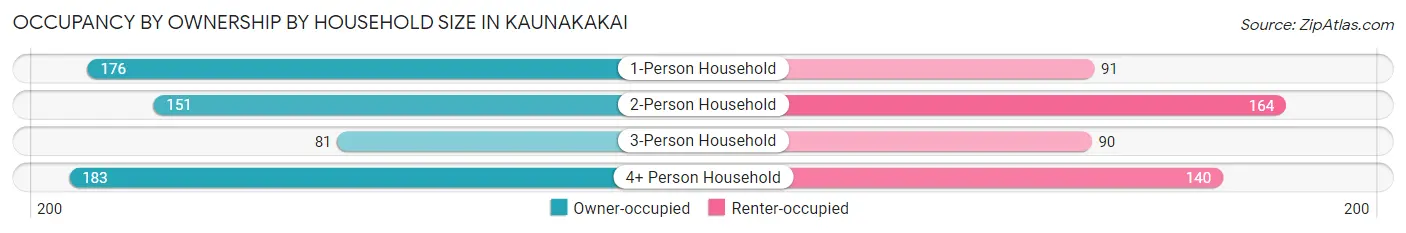
| Household Size | Owner-occupied | Renter-occupied |
| 1-Person Household | 176 (65.9%) | 91 (34.1%) |
| 2-Person Household | 151 (47.9%) | 164 (52.1%) |
| 3-Person Household | 81 (47.4%) | 90 (52.6%) |
| 4+ Person Household | 183 (56.7%) | 140 (43.3%) |
| Total Housing Units | 591 (54.9%) | 485 (45.1%) |
Occupancy by Educational Attainment in Kaunakakai
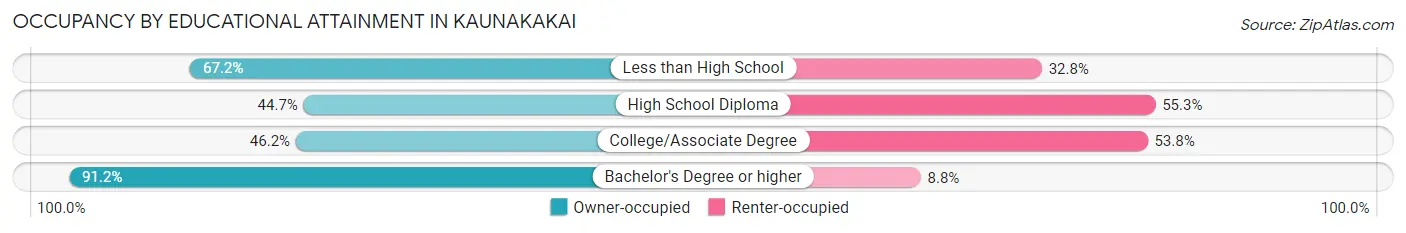
| Household Size | Owner-occupied | Renter-occupied |
| Less than High School | 88 (67.2%) | 43 (32.8%) |
| High School Diploma | 151 (44.7%) | 187 (55.3%) |
| College/Associate Degree | 207 (46.2%) | 241 (53.8%) |
| Bachelor's Degree or higher | 145 (91.2%) | 14 (8.8%) |
Occupancy by Age of Householder in Kaunakakai
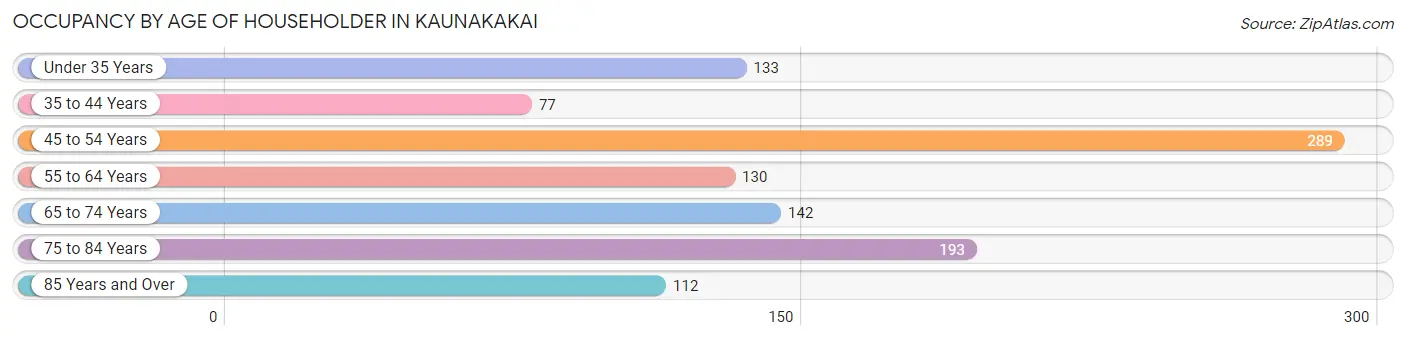
| Age Bracket | # Households | % Households |
| Under 35 Years | 133 | 12.4% |
| 35 to 44 Years | 77 | 7.2% |
| 45 to 54 Years | 289 | 26.9% |
| 55 to 64 Years | 130 | 12.1% |
| 65 to 74 Years | 142 | 13.2% |
| 75 to 84 Years | 193 | 17.9% |
| 85 Years and Over | 112 | 10.4% |
| Total | 1,076 | 100.0% |
Housing Finances in Kaunakakai
Median Income by Occupancy in Kaunakakai
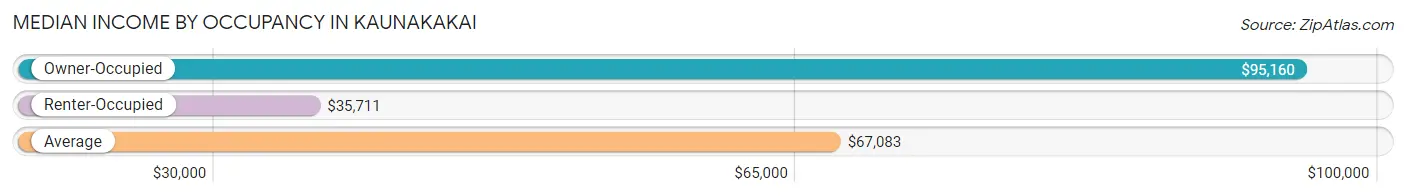
| Occupancy Type | # Households | Median Income |
| Owner-Occupied | 591 (54.9%) | $95,160 |
| Renter-Occupied | 485 (45.1%) | $35,711 |
| Average | 1,076 (100.0%) | $67,083 |
Occupancy by Householder Income Bracket in Kaunakakai
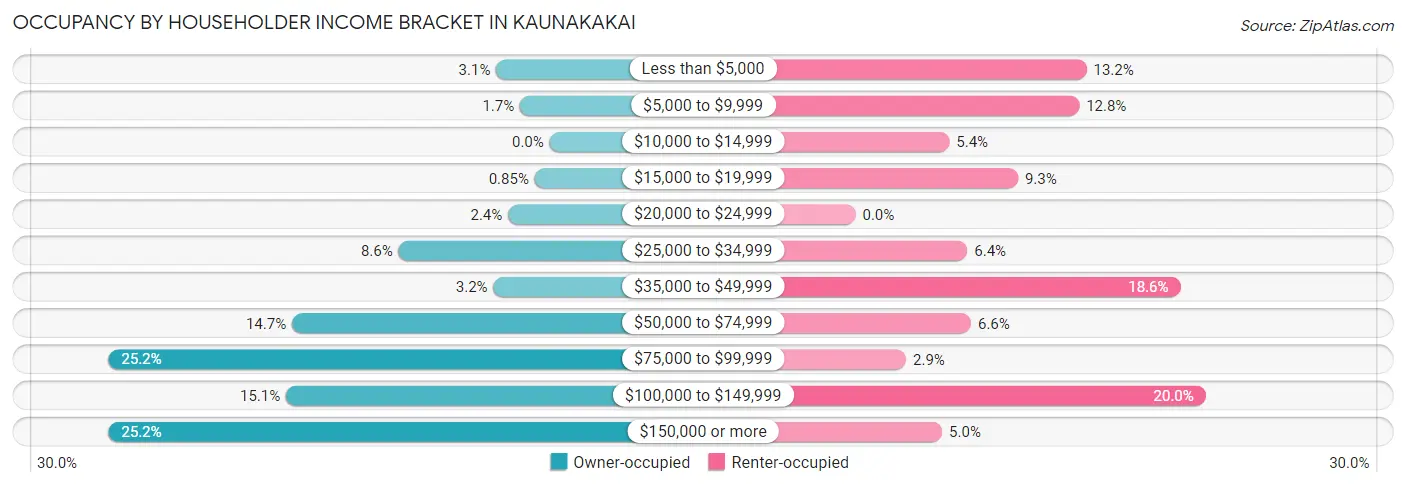
| Income Bracket | Owner-occupied | Renter-occupied |
| Less than $5,000 | 18 (3.0%) | 64 (13.2%) |
| $5,000 to $9,999 | 10 (1.7%) | 62 (12.8%) |
| $10,000 to $14,999 | 0 (0.0%) | 26 (5.4%) |
| $15,000 to $19,999 | 5 (0.9%) | 45 (9.3%) |
| $20,000 to $24,999 | 14 (2.4%) | 0 (0.0%) |
| $25,000 to $34,999 | 51 (8.6%) | 31 (6.4%) |
| $35,000 to $49,999 | 19 (3.2%) | 90 (18.6%) |
| $50,000 to $74,999 | 87 (14.7%) | 32 (6.6%) |
| $75,000 to $99,999 | 149 (25.2%) | 14 (2.9%) |
| $100,000 to $149,999 | 89 (15.1%) | 97 (20.0%) |
| $150,000 or more | 149 (25.2%) | 24 (5.0%) |
| Total | 591 (100.0%) | 485 (100.0%) |
Monthly Housing Cost Tiers in Kaunakakai
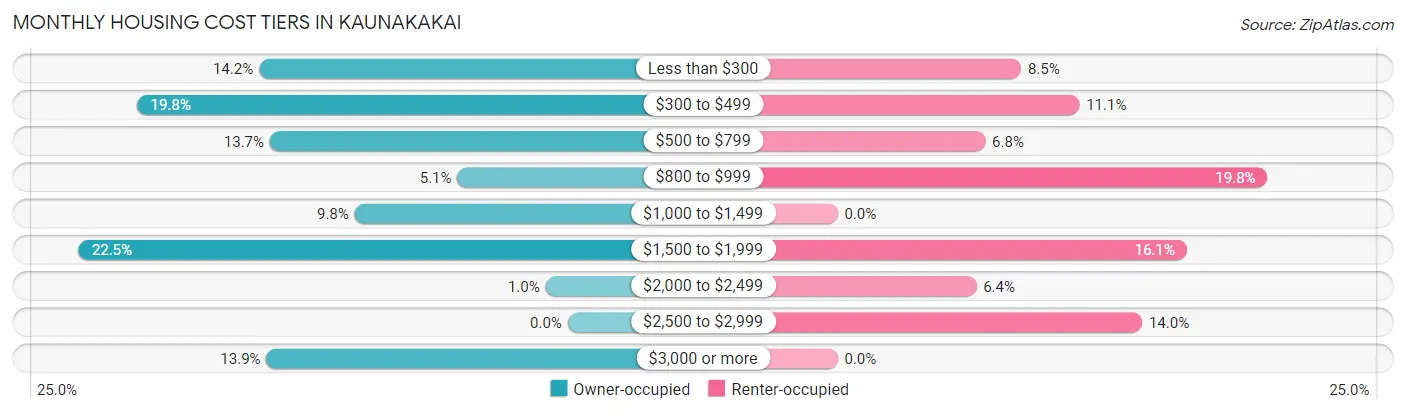
| Monthly Cost | Owner-occupied | Renter-occupied |
| Less than $300 | 84 (14.2%) | 41 (8.5%) |
| $300 to $499 | 117 (19.8%) | 54 (11.1%) |
| $500 to $799 | 81 (13.7%) | 33 (6.8%) |
| $800 to $999 | 30 (5.1%) | 96 (19.8%) |
| $1,000 to $1,499 | 58 (9.8%) | 0 (0.0%) |
| $1,500 to $1,999 | 133 (22.5%) | 78 (16.1%) |
| $2,000 to $2,499 | 6 (1.0%) | 31 (6.4%) |
| $2,500 to $2,999 | 0 (0.0%) | 68 (14.0%) |
| $3,000 or more | 82 (13.9%) | 0 (0.0%) |
| Total | 591 (100.0%) | 485 (100.0%) |
Physical Housing Characteristics in Kaunakakai
Housing Structures in Kaunakakai
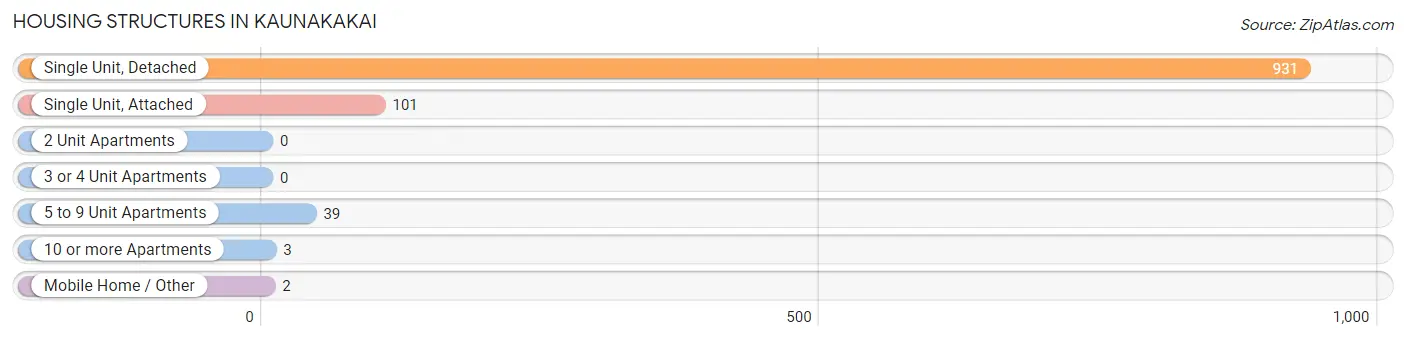
| Structure Type | # Housing Units | % Housing Units |
| Single Unit, Detached | 931 | 86.5% |
| Single Unit, Attached | 101 | 9.4% |
| 2 Unit Apartments | 0 | 0.0% |
| 3 or 4 Unit Apartments | 0 | 0.0% |
| 5 to 9 Unit Apartments | 39 | 3.6% |
| 10 or more Apartments | 3 | 0.3% |
| Mobile Home / Other | 2 | 0.2% |
| Total | 1,076 | 100.0% |
Housing Structures by Occupancy in Kaunakakai
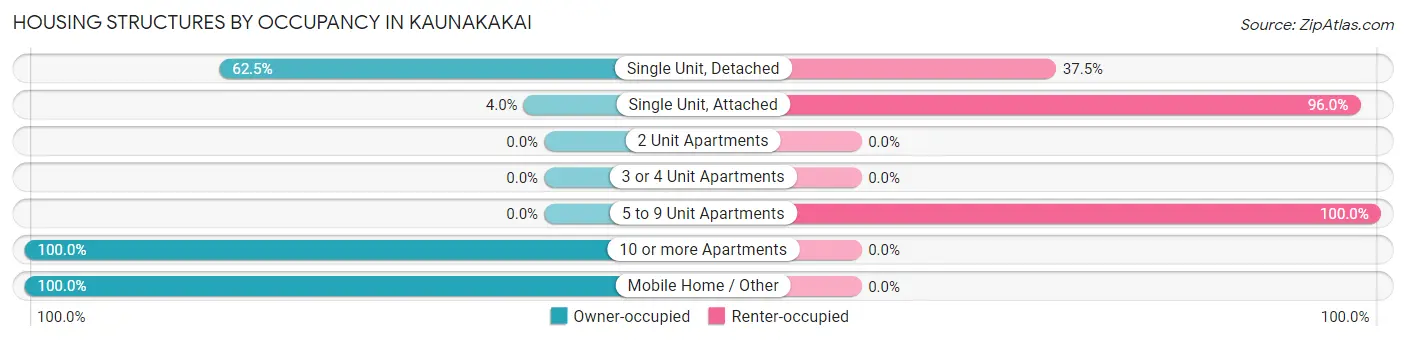
| Structure Type | Owner-occupied | Renter-occupied |
| Single Unit, Detached | 582 (62.5%) | 349 (37.5%) |
| Single Unit, Attached | 4 (4.0%) | 97 (96.0%) |
| 2 Unit Apartments | 0 (0.0%) | 0 (0.0%) |
| 3 or 4 Unit Apartments | 0 (0.0%) | 0 (0.0%) |
| 5 to 9 Unit Apartments | 0 (0.0%) | 39 (100.0%) |
| 10 or more Apartments | 3 (100.0%) | 0 (0.0%) |
| Mobile Home / Other | 2 (100.0%) | 0 (0.0%) |
| Total | 591 (54.9%) | 485 (45.1%) |
Housing Structures by Number of Rooms in Kaunakakai
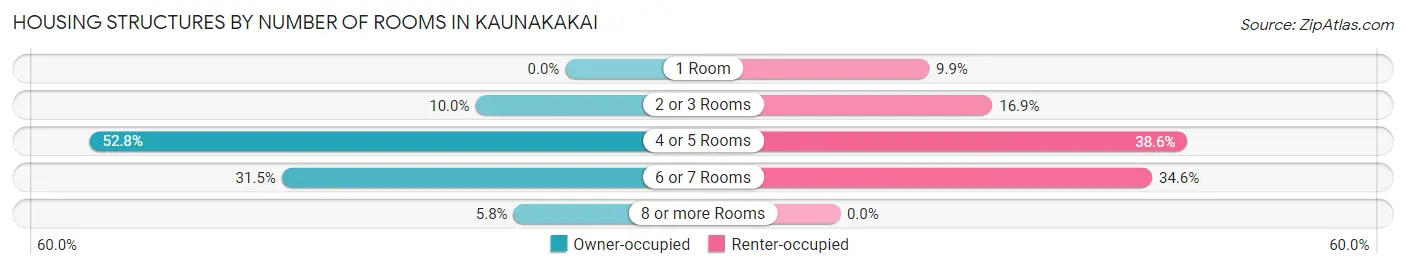
| Number of Rooms | Owner-occupied | Renter-occupied |
| 1 Room | 0 (0.0%) | 48 (9.9%) |
| 2 or 3 Rooms | 59 (10.0%) | 82 (16.9%) |
| 4 or 5 Rooms | 312 (52.8%) | 187 (38.6%) |
| 6 or 7 Rooms | 186 (31.5%) | 168 (34.6%) |
| 8 or more Rooms | 34 (5.8%) | 0 (0.0%) |
| Total | 591 (100.0%) | 485 (100.0%) |
Housing Structure by Heating Type in Kaunakakai
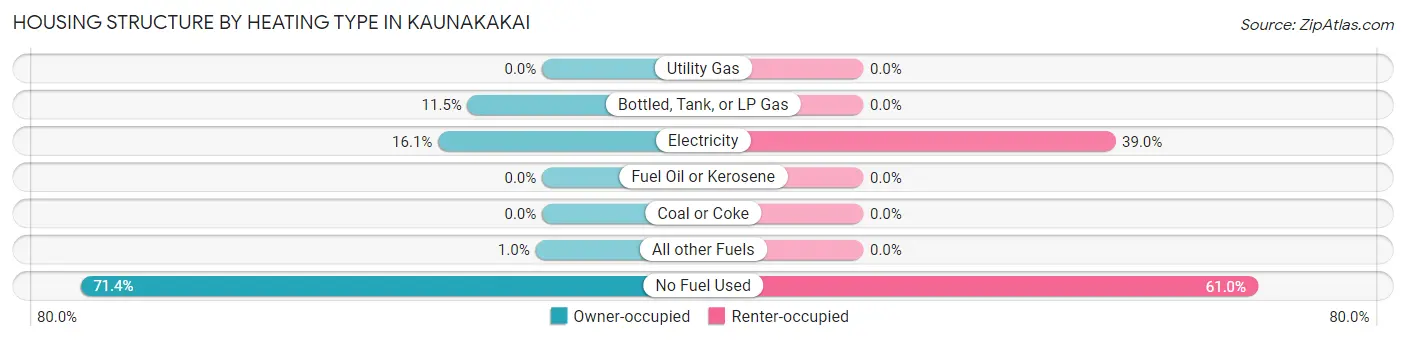
| Heating Type | Owner-occupied | Renter-occupied |
| Utility Gas | 0 (0.0%) | 0 (0.0%) |
| Bottled, Tank, or LP Gas | 68 (11.5%) | 0 (0.0%) |
| Electricity | 95 (16.1%) | 189 (39.0%) |
| Fuel Oil or Kerosene | 0 (0.0%) | 0 (0.0%) |
| Coal or Coke | 0 (0.0%) | 0 (0.0%) |
| All other Fuels | 6 (1.0%) | 0 (0.0%) |
| No Fuel Used | 422 (71.4%) | 296 (61.0%) |
| Total | 591 (100.0%) | 485 (100.0%) |
Household Vehicle Usage in Kaunakakai
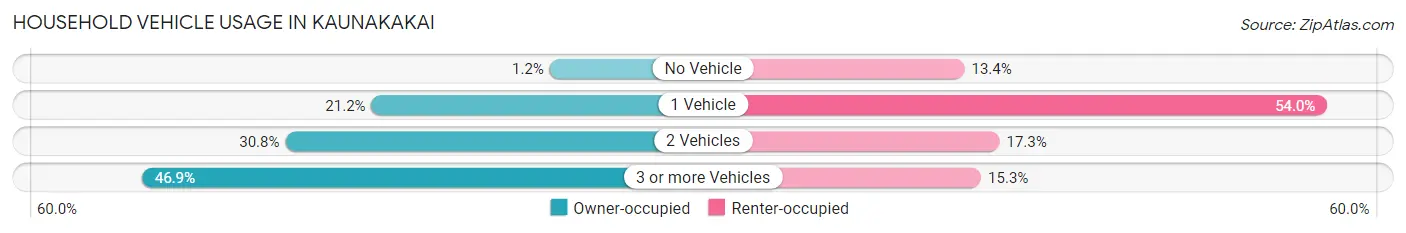
| Vehicles per Household | Owner-occupied | Renter-occupied |
| No Vehicle | 7 (1.2%) | 65 (13.4%) |
| 1 Vehicle | 125 (21.1%) | 262 (54.0%) |
| 2 Vehicles | 182 (30.8%) | 84 (17.3%) |
| 3 or more Vehicles | 277 (46.9%) | 74 (15.3%) |
| Total | 591 (100.0%) | 485 (100.0%) |
Real Estate & Mortgages in Kaunakakai
Real Estate and Mortgage Overview in Kaunakakai
| Characteristic | Without Mortgage | With Mortgage |
| Housing Units | 313 | 278 |
| Median Property Value | $308,000 | $372,000 |
| Median Household Income | $96,655 | $81 |
| Monthly Housing Costs | $374 | $82 |
| Real Estate Taxes | $496 | $6 |
Property Value by Mortgage Status in Kaunakakai
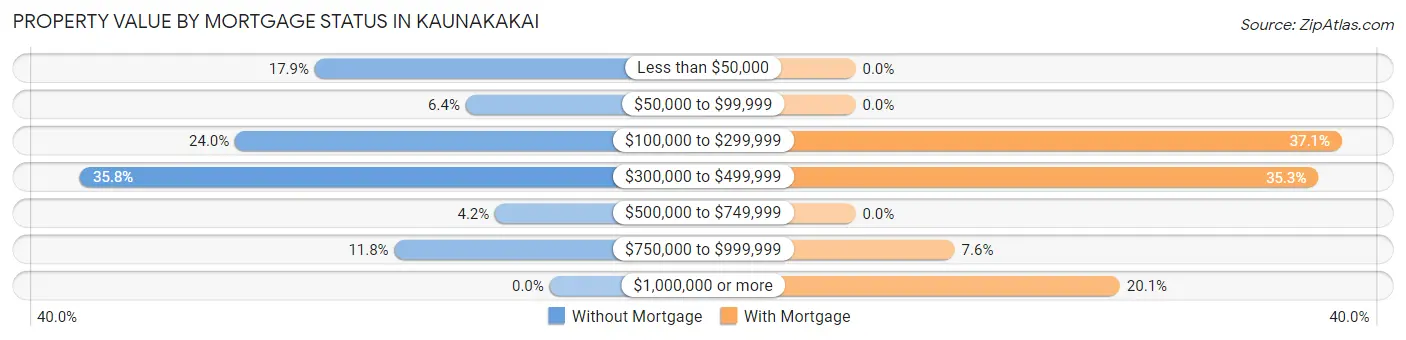
| Property Value | Without Mortgage | With Mortgage |
| Less than $50,000 | 56 (17.9%) | 0 (0.0%) |
| $50,000 to $99,999 | 20 (6.4%) | 0 (0.0%) |
| $100,000 to $299,999 | 75 (24.0%) | 103 (37.0%) |
| $300,000 to $499,999 | 112 (35.8%) | 98 (35.2%) |
| $500,000 to $749,999 | 13 (4.2%) | 0 (0.0%) |
| $750,000 to $999,999 | 37 (11.8%) | 21 (7.5%) |
| $1,000,000 or more | 0 (0.0%) | 56 (20.1%) |
| Total | 313 (100.0%) | 278 (100.0%) |
Household Income by Mortgage Status in Kaunakakai
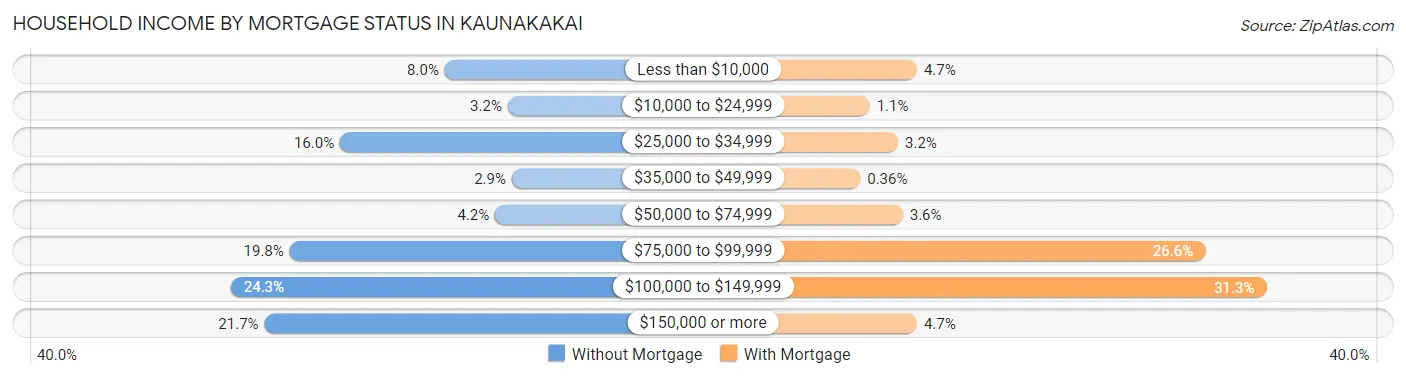
| Household Income | Without Mortgage | With Mortgage |
| Less than $10,000 | 25 (8.0%) | 13 (4.7%) |
| $10,000 to $24,999 | 10 (3.2%) | 3 (1.1%) |
| $25,000 to $34,999 | 50 (16.0%) | 9 (3.2%) |
| $35,000 to $49,999 | 9 (2.9%) | 1 (0.4%) |
| $50,000 to $74,999 | 13 (4.2%) | 10 (3.6%) |
| $75,000 to $99,999 | 62 (19.8%) | 74 (26.6%) |
| $100,000 to $149,999 | 76 (24.3%) | 87 (31.3%) |
| $150,000 or more | 68 (21.7%) | 13 (4.7%) |
| Total | 313 (100.0%) | 278 (100.0%) |
Property Value to Household Income Ratio in Kaunakakai
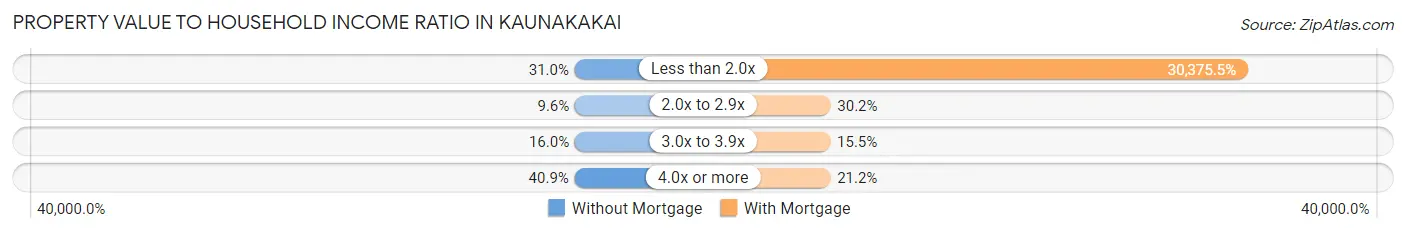
| Value-to-Income Ratio | Without Mortgage | With Mortgage |
| Less than 2.0x | 97 (31.0%) | 84,444 (30,375.5%) |
| 2.0x to 2.9x | 30 (9.6%) | 84 (30.2%) |
| 3.0x to 3.9x | 50 (16.0%) | 43 (15.5%) |
| 4.0x or more | 128 (40.9%) | 59 (21.2%) |
| Total | 313 (100.0%) | 278 (100.0%) |
Real Estate Taxes by Mortgage Status in Kaunakakai
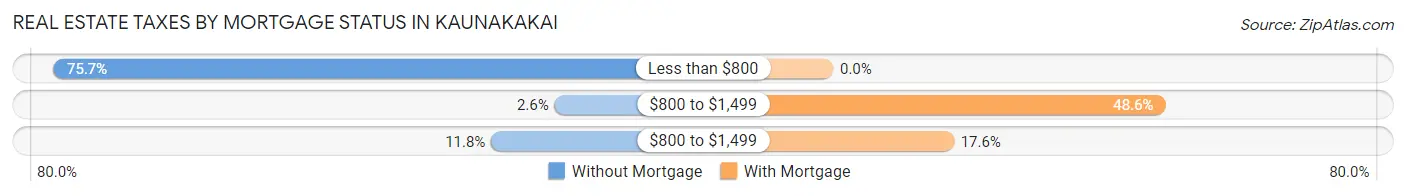
| Property Taxes | Without Mortgage | With Mortgage |
| Less than $800 | 237 (75.7%) | 0 (0.0%) |
| $800 to $1,499 | 8 (2.6%) | 135 (48.6%) |
| $800 to $1,499 | 37 (11.8%) | 49 (17.6%) |
| Total | 313 (100.0%) | 278 (100.0%) |
Health & Disability in Kaunakakai
Health Insurance Coverage by Age in Kaunakakai
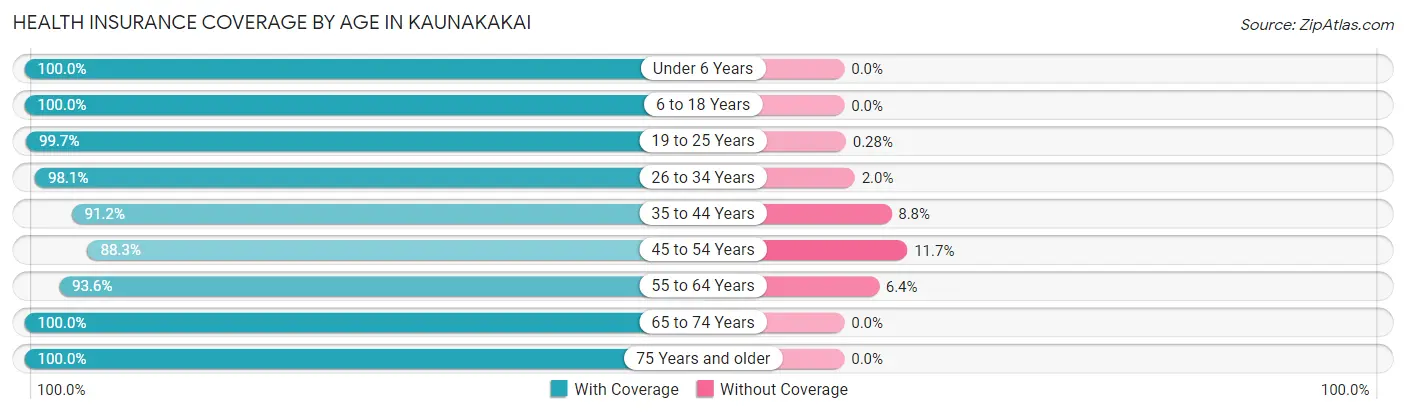
| Age Bracket | With Coverage | Without Coverage |
| Under 6 Years | 212 (100.0%) | 0 (0.0%) |
| 6 to 18 Years | 807 (100.0%) | 0 (0.0%) |
| 19 to 25 Years | 359 (99.7%) | 1 (0.3%) |
| 26 to 34 Years | 453 (98.1%) | 9 (1.9%) |
| 35 to 44 Years | 177 (91.2%) | 17 (8.8%) |
| 45 to 54 Years | 436 (88.3%) | 58 (11.7%) |
| 55 to 64 Years | 320 (93.6%) | 22 (6.4%) |
| 65 to 74 Years | 278 (100.0%) | 0 (0.0%) |
| 75 Years and older | 404 (100.0%) | 0 (0.0%) |
| Total | 3,446 (97.0%) | 107 (3.0%) |
Health Insurance Coverage by Citizenship Status in Kaunakakai
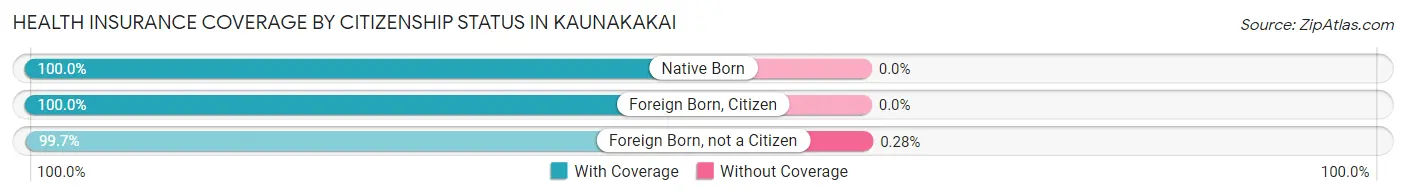
| Citizenship Status | With Coverage | Without Coverage |
| Native Born | 212 (100.0%) | 0 (0.0%) |
| Foreign Born, Citizen | 807 (100.0%) | 0 (0.0%) |
| Foreign Born, not a Citizen | 359 (99.7%) | 1 (0.3%) |
Health Insurance Coverage by Household Income in Kaunakakai
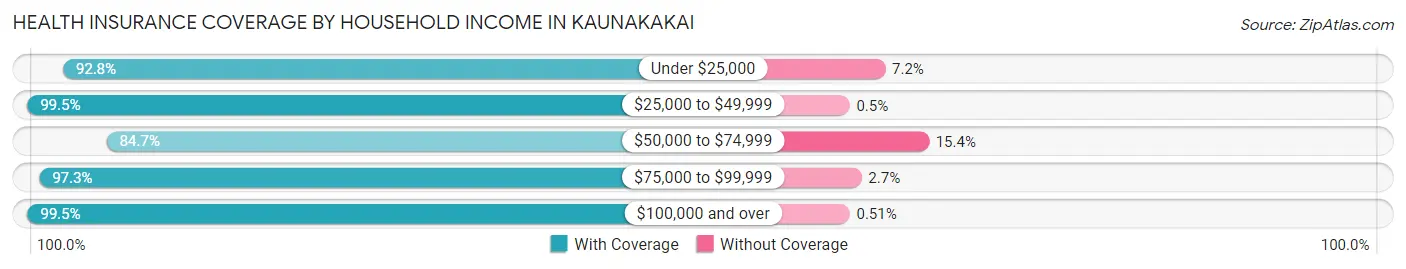
| Household Income | With Coverage | Without Coverage |
| Under $25,000 | 557 (92.8%) | 43 (7.2%) |
| $25,000 to $49,999 | 399 (99.5%) | 2 (0.5%) |
| $50,000 to $74,999 | 215 (84.7%) | 39 (15.3%) |
| $75,000 to $99,999 | 497 (97.3%) | 14 (2.7%) |
| $100,000 and over | 1,771 (99.5%) | 9 (0.5%) |
Public vs Private Health Insurance Coverage by Age in Kaunakakai
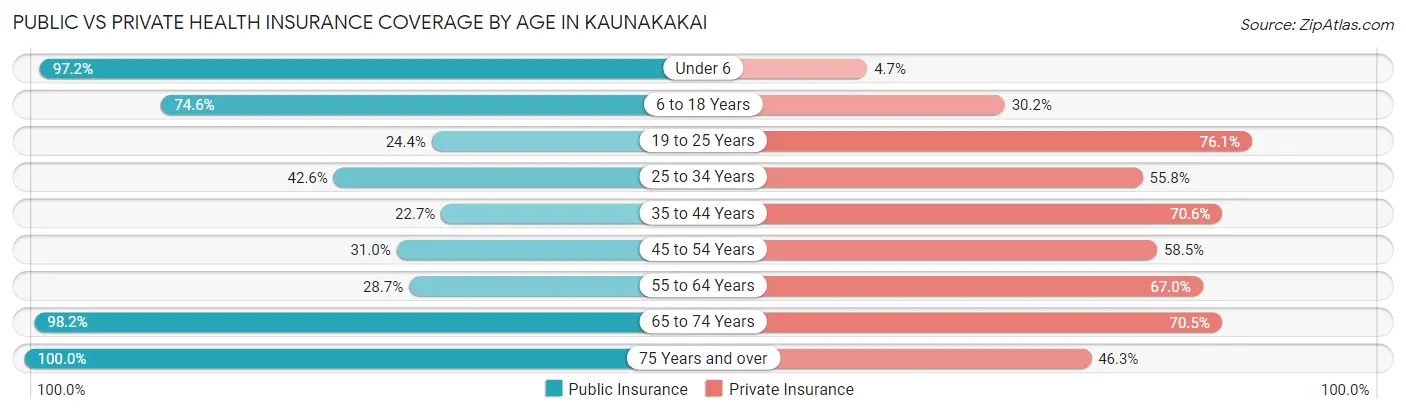
| Age Bracket | Public Insurance | Private Insurance |
| Under 6 | 206 (97.2%) | 10 (4.7%) |
| 6 to 18 Years | 602 (74.6%) | 244 (30.2%) |
| 19 to 25 Years | 88 (24.4%) | 274 (76.1%) |
| 25 to 34 Years | 197 (42.6%) | 258 (55.8%) |
| 35 to 44 Years | 44 (22.7%) | 137 (70.6%) |
| 45 to 54 Years | 153 (31.0%) | 289 (58.5%) |
| 55 to 64 Years | 98 (28.6%) | 229 (67.0%) |
| 65 to 74 Years | 273 (98.2%) | 196 (70.5%) |
| 75 Years and over | 404 (100.0%) | 187 (46.3%) |
| Total | 2,065 (58.1%) | 1,824 (51.3%) |
Disability Status by Sex by Age in Kaunakakai
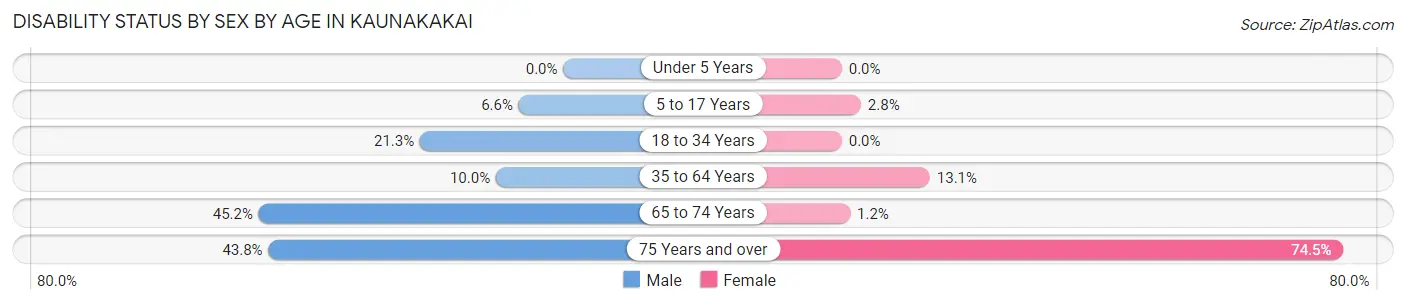
| Age Bracket | Male | Female |
| Under 5 Years | 0 (0.0%) | 0 (0.0%) |
| 5 to 17 Years | 41 (6.6%) | 6 (2.8%) |
| 18 to 34 Years | 83 (21.3%) | 0 (0.0%) |
| 35 to 64 Years | 51 (10.0%) | 68 (13.1%) |
| 65 to 74 Years | 52 (45.2%) | 2 (1.2%) |
| 75 Years and over | 74 (43.8%) | 175 (74.5%) |
Disability Class by Sex by Age in Kaunakakai
Disability Class: Hearing Difficulty
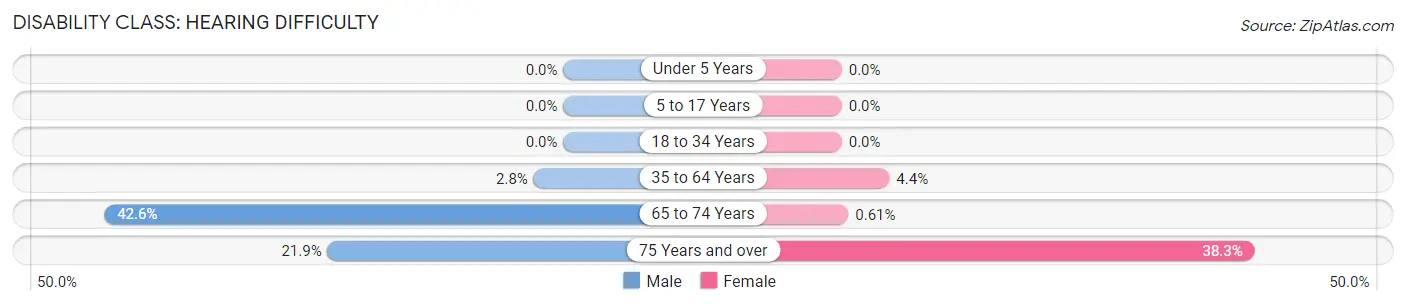
| Age Bracket | Male | Female |
| Under 5 Years | 0 (0.0%) | 0 (0.0%) |
| 5 to 17 Years | 0 (0.0%) | 0 (0.0%) |
| 18 to 34 Years | 0 (0.0%) | 0 (0.0%) |
| 35 to 64 Years | 14 (2.8%) | 23 (4.4%) |
| 65 to 74 Years | 49 (42.6%) | 1 (0.6%) |
| 75 Years and over | 37 (21.9%) | 90 (38.3%) |
Disability Class: Vision Difficulty
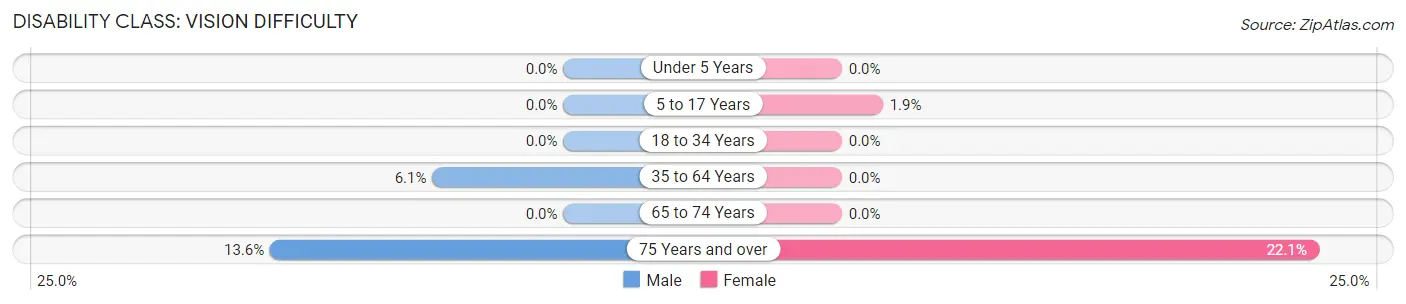
| Age Bracket | Male | Female |
| Under 5 Years | 0 (0.0%) | 0 (0.0%) |
| 5 to 17 Years | 0 (0.0%) | 4 (1.9%) |
| 18 to 34 Years | 0 (0.0%) | 0 (0.0%) |
| 35 to 64 Years | 31 (6.1%) | 0 (0.0%) |
| 65 to 74 Years | 0 (0.0%) | 0 (0.0%) |
| 75 Years and over | 23 (13.6%) | 52 (22.1%) |
Disability Class: Cognitive Difficulty
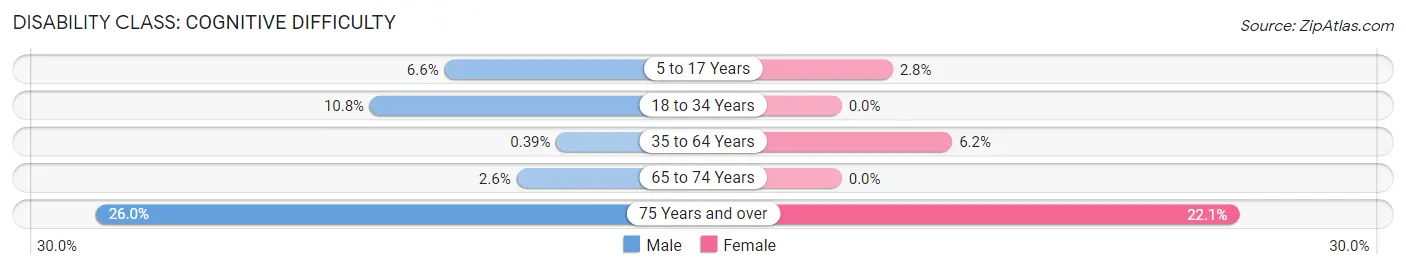
| Age Bracket | Male | Female |
| 5 to 17 Years | 41 (6.6%) | 6 (2.8%) |
| 18 to 34 Years | 42 (10.8%) | 0 (0.0%) |
| 35 to 64 Years | 2 (0.4%) | 32 (6.1%) |
| 65 to 74 Years | 3 (2.6%) | 0 (0.0%) |
| 75 Years and over | 44 (26.0%) | 52 (22.1%) |
Disability Class: Ambulatory Difficulty
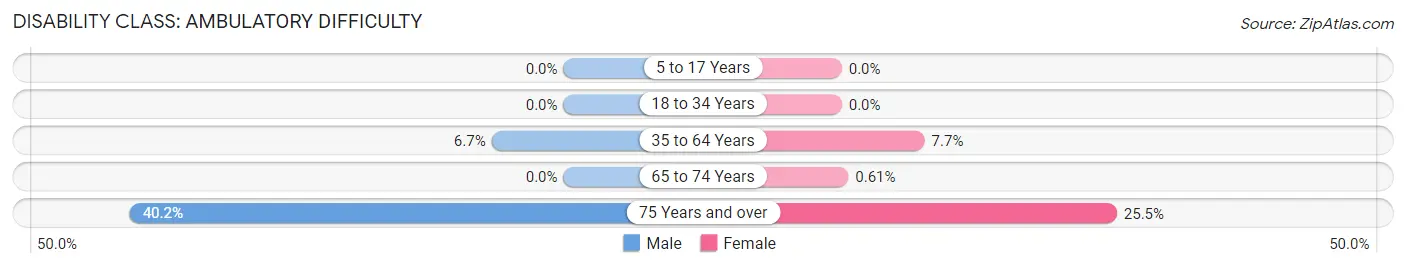
| Age Bracket | Male | Female |
| 5 to 17 Years | 0 (0.0%) | 0 (0.0%) |
| 18 to 34 Years | 0 (0.0%) | 0 (0.0%) |
| 35 to 64 Years | 34 (6.7%) | 40 (7.7%) |
| 65 to 74 Years | 0 (0.0%) | 1 (0.6%) |
| 75 Years and over | 68 (40.2%) | 60 (25.5%) |
Disability Class: Self-Care Difficulty
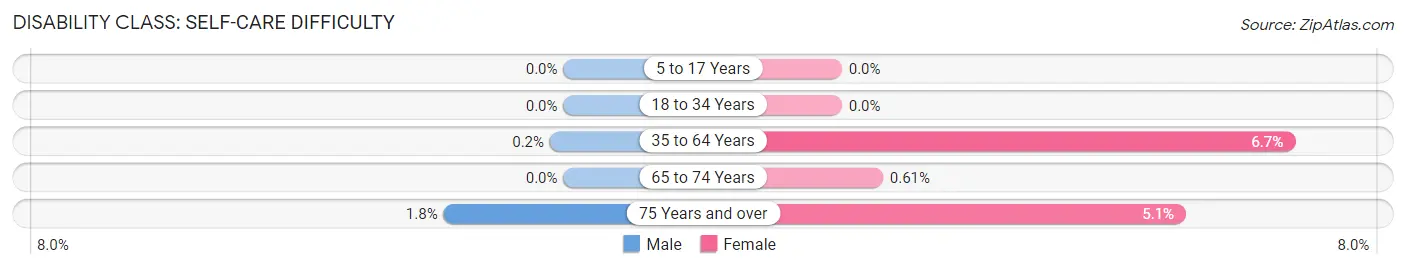
| Age Bracket | Male | Female |
| 5 to 17 Years | 0 (0.0%) | 0 (0.0%) |
| 18 to 34 Years | 0 (0.0%) | 0 (0.0%) |
| 35 to 64 Years | 1 (0.2%) | 35 (6.7%) |
| 65 to 74 Years | 0 (0.0%) | 1 (0.6%) |
| 75 Years and over | 3 (1.8%) | 12 (5.1%) |
Technology Access in Kaunakakai
Computing Device Access in Kaunakakai
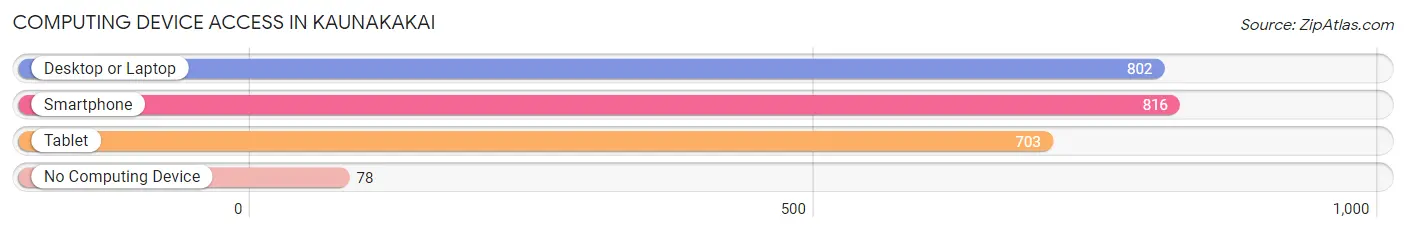
| Device Type | # Households | % Households |
| Desktop or Laptop | 802 | 74.5% |
| Smartphone | 816 | 75.8% |
| Tablet | 703 | 65.3% |
| No Computing Device | 78 | 7.2% |
| Total | 1,076 | 100.0% |
Internet Access in Kaunakakai
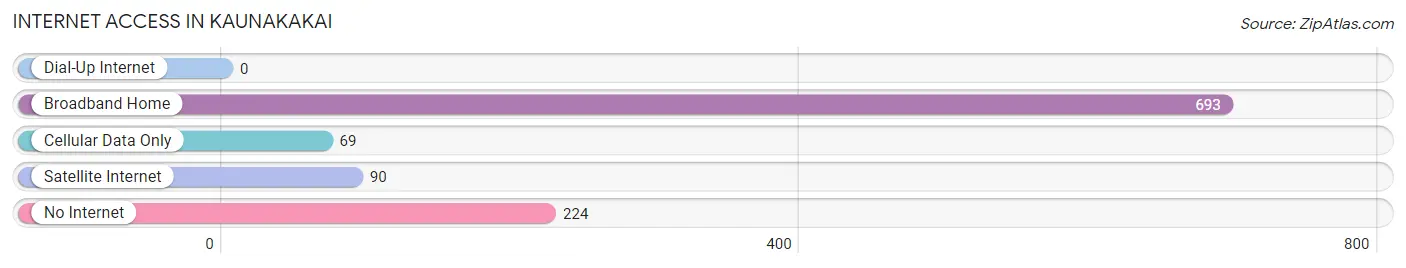
| Internet Type | # Households | % Households |
| Dial-Up Internet | 0 | 0.0% |
| Broadband Home | 693 | 64.4% |
| Cellular Data Only | 69 | 6.4% |
| Satellite Internet | 90 | 8.4% |
| No Internet | 224 | 20.8% |
| Total | 1,076 | 100.0% |
Kaunakakai Summary
Kaunakakai is a small town located on the island of Molokai in the state of Hawaii. It is the largest town on the island and is the county seat of Molokai. The population of Kaunakakai was 2,841 at the 2010 census.
History
Kaunakakai was founded in 1837 by King Kamehameha III. The town was originally called Kaunakakai-o-Kamalii, which means “the gathering place of the chiefs”. The town was a major port of call for whaling ships in the 19th century. In the early 20th century, Kaunakakai was a major center for pineapple production.
Geography
Kaunakakai is located on the south shore of Molokai, at the mouth of the Kaunakakai River. The town is situated on a narrow strip of land between the ocean and the mountains. The town is surrounded by lush tropical vegetation and is home to several beaches, including Kaunakakai Beach and Papohaku Beach.
Economy
Kaunakakai’s economy is largely based on tourism and agriculture. The town is home to several resorts and hotels, as well as a variety of restaurants and shops. Agriculture is also an important part of the local economy, with pineapple, taro, and other crops being grown in the area.
Demographics
As of the 2010 census, the population of Kaunakakai was 2,841. The racial makeup of the town was 57.3% Native Hawaiian, 24.2% White, 8.2% Asian, 6.2% Other, and 4.1% Two or More Races. The median household income was $45,938, and the median age was 44.
Kaunakakai is a small town with a rich history and a vibrant culture. The town is home to a variety of attractions, including beaches, resorts, restaurants, and shops. The town’s economy is largely based on tourism and agriculture, and the population is diverse and welcoming. Kaunakakai is a great place to visit and explore, and it is sure to provide an unforgettable experience.
Common Questions
What is Per Capita Income in Kaunakakai?
Per Capita income in Kaunakakai is $28,087.
What is the Median Family Income in Kaunakakai?
Median Family Income in Kaunakakai is $84,699.
What is the Median Household income in Kaunakakai?
Median Household Income in Kaunakakai is $67,083.
What is Income or Wage Gap in Kaunakakai?
Income or Wage Gap in Kaunakakai is 15.1%.
Women in Kaunakakai earn 84.9 cents for every dollar earned by a man.
What is Inequality or Gini Index in Kaunakakai?
Inequality or Gini Index in Kaunakakai is 0.50.
What is the Total Population of Kaunakakai?
Total Population of Kaunakakai is 3,553.
What is the Total Male Population of Kaunakakai?
Total Male Population of Kaunakakai is 1,923.
What is the Total Female Population of Kaunakakai?
Total Female Population of Kaunakakai is 1,630.
What is the Ratio of Males per 100 Females in Kaunakakai?
There are 117.98 Males per 100 Females in Kaunakakai.
What is the Ratio of Females per 100 Males in Kaunakakai?
There are 84.76 Females per 100 Males in Kaunakakai.
What is the Median Population Age in Kaunakakai?
Median Population Age in Kaunakakai is 33.9 Years.
What is the Average Family Size in Kaunakakai
Average Family Size in Kaunakakai is 4.1 People.
What is the Average Household Size in Kaunakakai
Average Household Size in Kaunakakai is 3.3 People.
How Large is the Labor Force in Kaunakakai?
There are 1,412 People in the Labor Forcein in Kaunakakai.
What is the Percentage of People in the Labor Force in Kaunakakai?
53.6% of People are in the Labor Force in Kaunakakai.
What is the Unemployment Rate in Kaunakakai?
Unemployment Rate in Kaunakakai is 6.1%.