Kalihiwai, HI Map & Demographics
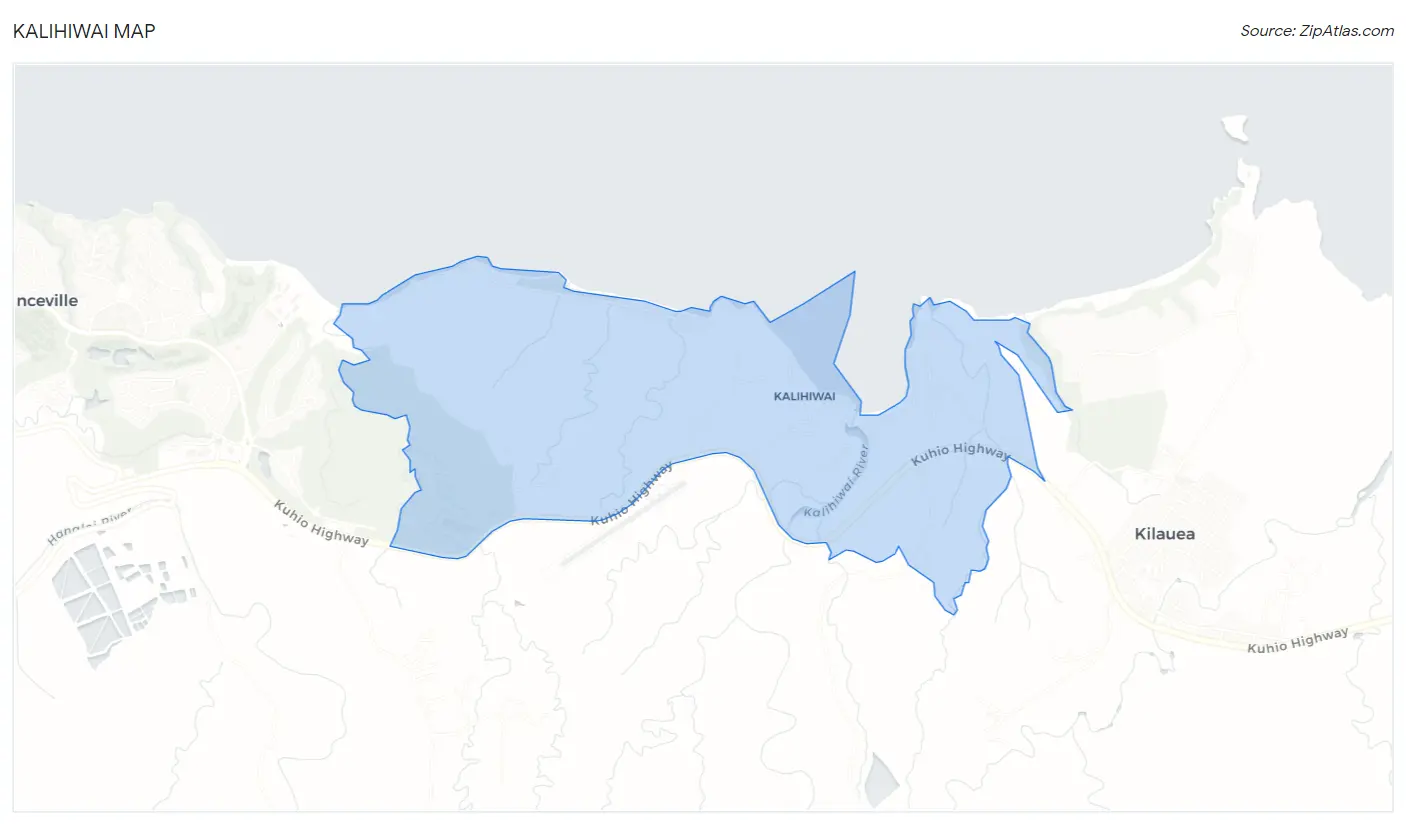
Kalihiwai Map
Kalihiwai Overview
$57,591
PER CAPITA INCOME
$119,167
AVG FAMILY INCOME
$98,333
AVG HOUSEHOLD INCOME
55.5%
WAGE / INCOME GAP [ % ]
44.5¢/ $1
WAGE / INCOME GAP [ $ ]
0.44
INEQUALITY / GINI INDEX
256
TOTAL POPULATION
171
MALE POPULATION
85
FEMALE POPULATION
201.18
MALES / 100 FEMALES
49.71
FEMALES / 100 MALES
51.6
MEDIAN AGE
3.5
AVG FAMILY SIZE
2.5
AVG HOUSEHOLD SIZE
124
LABOR FORCE [ PEOPLE ]
54.1%
PERCENT IN LABOR FORCE
8.1%
UNEMPLOYMENT RATE
Income in Kalihiwai
Income Overview in Kalihiwai
Per Capita Income in Kalihiwai is $57,591, while median incomes of families and households are $119,167 and $98,333 respectively.
| Characteristic | Number | Measure |
| Per Capita Income | 256 | $57,591 |
| Median Family Income | 50 | $119,167 |
| Mean Family Income | 50 | $136,988 |
| Median Household Income | 102 | $98,333 |
| Mean Household Income | 102 | $122,774 |
| Income Deficit | 50 | $0 |
| Wage / Income Gap (%) | 256 | 55.51% |
| Wage / Income Gap ($) | 256 | 44.49¢ per $1 |
| Gini / Inequality Index | 256 | 0.44 |
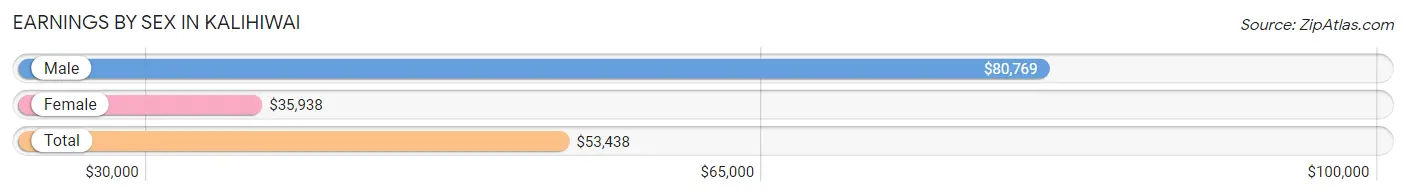
Earnings by Sex in Kalihiwai
Average Earnings in Kalihiwai are $53,438, $80,769 for men and $35,938 for women, a difference of 55.5%.
| Sex | Number | Average Earnings |
| Male | 86 (65.6%) | $80,769 |
| Female | 45 (34.4%) | $35,938 |
| Total | 131 (100.0%) | $53,438 |
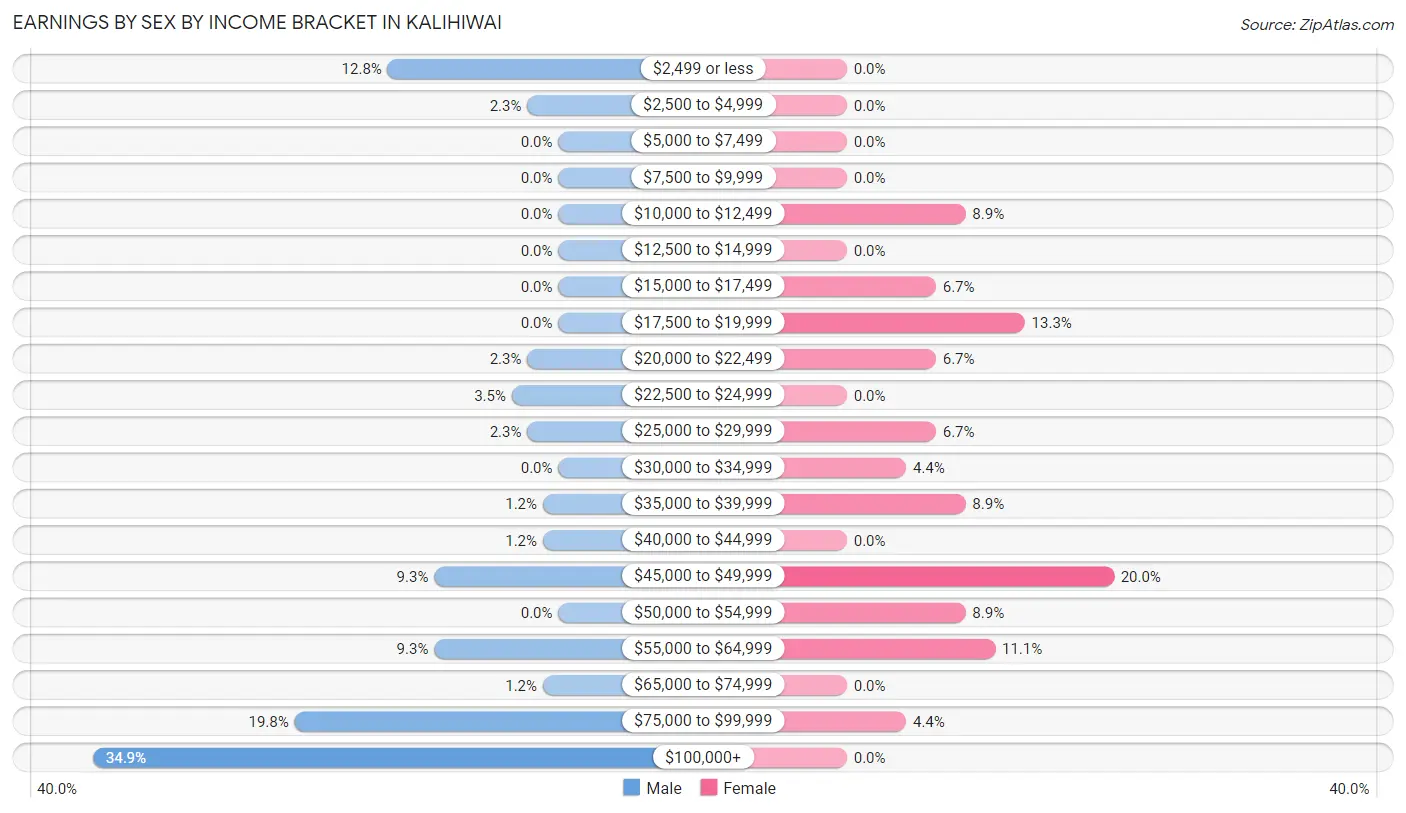
Earnings by Sex by Income Bracket in Kalihiwai
The most common earnings brackets in Kalihiwai are $100,000+ for men (30 | 34.9%) and $45,000 to $49,999 for women (9 | 20.0%).
| Income | Male | Female |
| $2,499 or less | 11 (12.8%) | 0 (0.0%) |
| $2,500 to $4,999 | 2 (2.3%) | 0 (0.0%) |
| $5,000 to $7,499 | 0 (0.0%) | 0 (0.0%) |
| $7,500 to $9,999 | 0 (0.0%) | 0 (0.0%) |
| $10,000 to $12,499 | 0 (0.0%) | 4 (8.9%) |
| $12,500 to $14,999 | 0 (0.0%) | 0 (0.0%) |
| $15,000 to $17,499 | 0 (0.0%) | 3 (6.7%) |
| $17,500 to $19,999 | 0 (0.0%) | 6 (13.3%) |
| $20,000 to $22,499 | 2 (2.3%) | 3 (6.7%) |
| $22,500 to $24,999 | 3 (3.5%) | 0 (0.0%) |
| $25,000 to $29,999 | 2 (2.3%) | 3 (6.7%) |
| $30,000 to $34,999 | 0 (0.0%) | 2 (4.4%) |
| $35,000 to $39,999 | 1 (1.2%) | 4 (8.9%) |
| $40,000 to $44,999 | 1 (1.2%) | 0 (0.0%) |
| $45,000 to $49,999 | 8 (9.3%) | 9 (20.0%) |
| $50,000 to $54,999 | 0 (0.0%) | 4 (8.9%) |
| $55,000 to $64,999 | 8 (9.3%) | 5 (11.1%) |
| $65,000 to $74,999 | 1 (1.2%) | 0 (0.0%) |
| $75,000 to $99,999 | 17 (19.8%) | 2 (4.4%) |
| $100,000+ | 30 (34.9%) | 0 (0.0%) |
| Total | 86 (100.0%) | 45 (100.0%) |
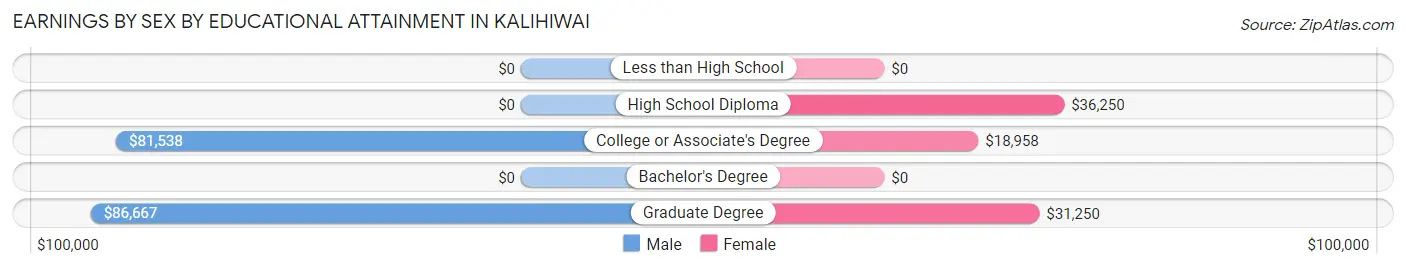
Earnings by Sex by Educational Attainment in Kalihiwai
Average earnings in Kalihiwai are $80,962 for men and $35,938 for women, a difference of 55.6%. Men with an educational attainment of graduate degree enjoy the highest average annual earnings of $86,667, while those with college or associate's degree education earn the least with $81,538. Women with an educational attainment of high school diploma earn the most with the average annual earnings of $36,250, while those with college or associate's degree education have the smallest earnings of $18,958.
| Educational Attainment | Male Income | Female Income |
| Less than High School | - | - |
| High School Diploma | - | - |
| College or Associate's Degree | $81,538 | $18,958 |
| Bachelor's Degree | - | - |
| Graduate Degree | $86,667 | $31,250 |
| Total | $80,962 | $35,938 |
Family Income in Kalihiwai
Family Income Brackets in Kalihiwai
According to the Kalihiwai family income data, there are 14 families falling into the $100,000 to $149,999 income range, which is the most common income bracket and makes up 28.0% of all families.
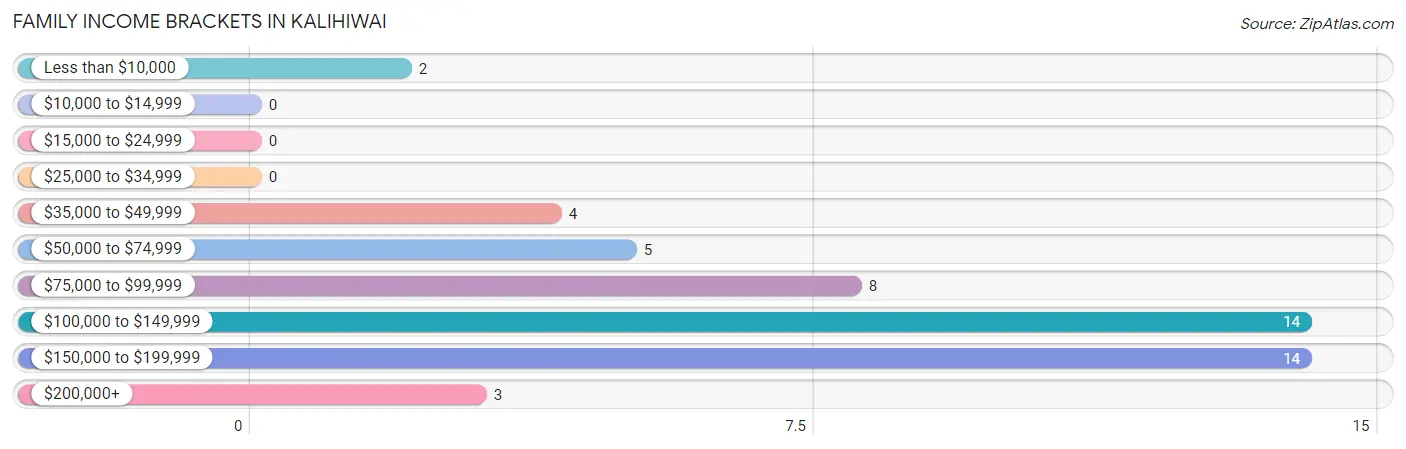
| Income Bracket | # Families | % Families |
| Less than $10,000 | 2 | 4.0% |
| $10,000 to $14,999 | 0 | 0.0% |
| $15,000 to $24,999 | 0 | 0.0% |
| $25,000 to $34,999 | 0 | 0.0% |
| $35,000 to $49,999 | 4 | 8.0% |
| $50,000 to $74,999 | 5 | 10.0% |
| $75,000 to $99,999 | 8 | 16.0% |
| $100,000 to $149,999 | 14 | 28.0% |
| $150,000 to $199,999 | 14 | 28.0% |
| $200,000+ | 3 | 6.0% |
Family Income by Famaliy Size in Kalihiwai
2-person families (32 | 64.0%) account for the highest median family income in Kalihiwai with $108,750 per family, while 2-person families (32 | 64.0%) have the highest median income of $54,375 per family member.
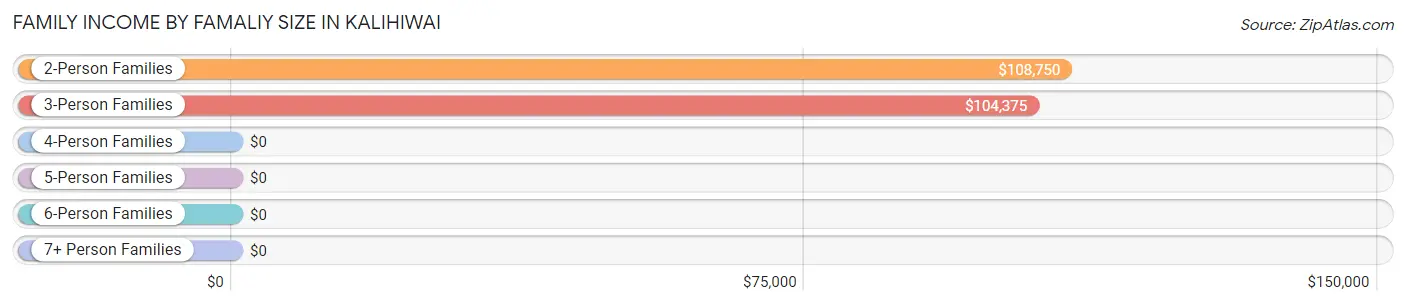
| Income Bracket | # Families | Median Income |
| 2-Person Families | 32 (64.0%) | $108,750 |
| 3-Person Families | 8 (16.0%) | $104,375 |
| 4-Person Families | 0 (0.0%) | $0 |
| 5-Person Families | 8 (16.0%) | $0 |
| 6-Person Families | 2 (4.0%) | $0 |
| 7+ Person Families | 0 (0.0%) | $0 |
| Total | 50 (100.0%) | $119,167 |
Family Income by Number of Earners in Kalihiwai
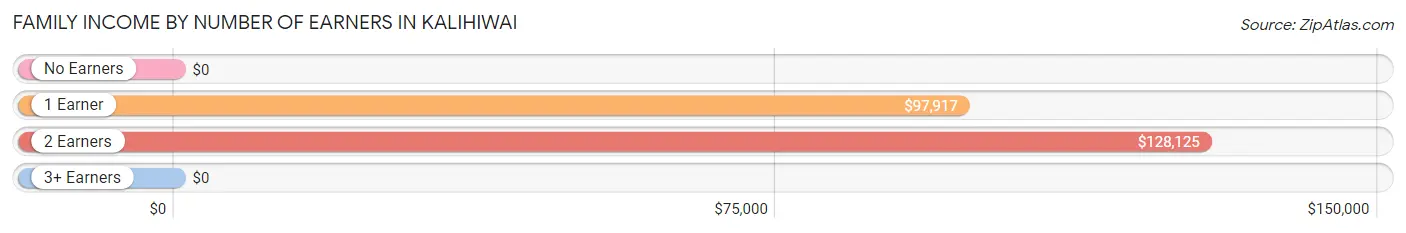
| Number of Earners | # Families | Median Income |
| No Earners | 8 (16.0%) | $0 |
| 1 Earner | 21 (42.0%) | $97,917 |
| 2 Earners | 19 (38.0%) | $128,125 |
| 3+ Earners | 2 (4.0%) | $0 |
| Total | 50 (100.0%) | $119,167 |
Household Income in Kalihiwai
Household Income Brackets in Kalihiwai
With 19 households falling in the category, the $100,000 to $149,999 income range is the most frequent in Kalihiwai, accounting for 18.6% of all households.
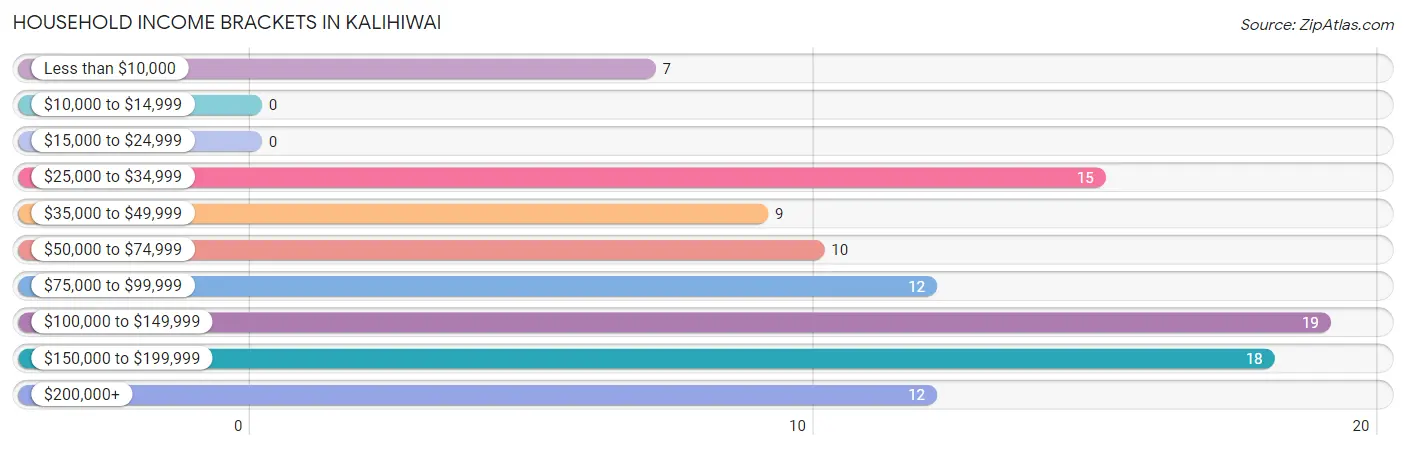
| Income Bracket | # Households | % Households |
| Less than $10,000 | 7 | 6.9% |
| $10,000 to $14,999 | 0 | 0.0% |
| $15,000 to $24,999 | 0 | 0.0% |
| $25,000 to $34,999 | 15 | 14.7% |
| $35,000 to $49,999 | 9 | 8.8% |
| $50,000 to $74,999 | 10 | 9.8% |
| $75,000 to $99,999 | 12 | 11.8% |
| $100,000 to $149,999 | 19 | 18.6% |
| $150,000 to $199,999 | 18 | 17.6% |
| $200,000+ | 12 | 11.8% |
Household Income by Householder Age in Kalihiwai
The median household income in Kalihiwai is $98,333, with the highest median household income of $174,583 found in the 25 to 44 years age bracket for the primary householder. A total of 12 households (11.8%) fall into this category.
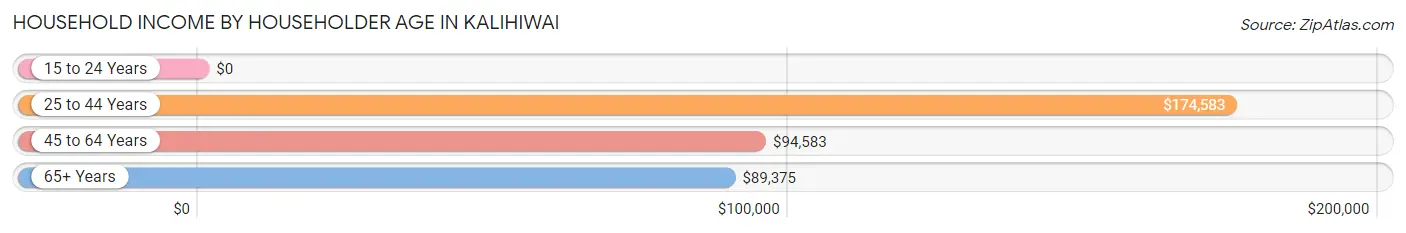
| Income Bracket | # Households | Median Income |
| 15 to 24 Years | 0 (0.0%) | $0 |
| 25 to 44 Years | 12 (11.8%) | $174,583 |
| 45 to 64 Years | 45 (44.1%) | $94,583 |
| 65+ Years | 45 (44.1%) | $89,375 |
| Total | 102 (100.0%) | $98,333 |
Poverty in Kalihiwai
Income Below Poverty by Sex and Age in Kalihiwai
With 4.1% poverty level for males and 2.4% for females among the residents of Kalihiwai, 45 to 54 year old males and 75 year old and over females are the most vulnerable to poverty, with 5 males (17.2%) and 2 females (9.5%) in their respective age groups living below the poverty level.
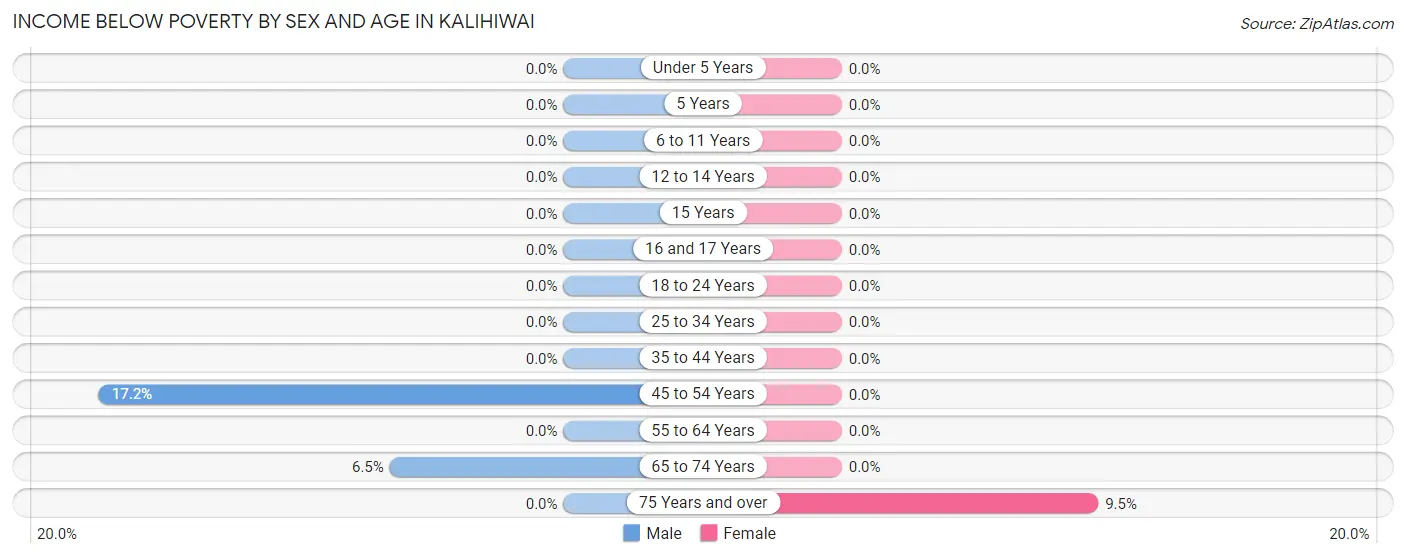
| Age Bracket | Male | Female |
| Under 5 Years | 0 (0.0%) | 0 (0.0%) |
| 5 Years | 0 (0.0%) | 0 (0.0%) |
| 6 to 11 Years | 0 (0.0%) | 0 (0.0%) |
| 12 to 14 Years | 0 (0.0%) | 0 (0.0%) |
| 15 Years | 0 (0.0%) | 0 (0.0%) |
| 16 and 17 Years | 0 (0.0%) | 0 (0.0%) |
| 18 to 24 Years | 0 (0.0%) | 0 (0.0%) |
| 25 to 34 Years | 0 (0.0%) | 0 (0.0%) |
| 35 to 44 Years | 0 (0.0%) | 0 (0.0%) |
| 45 to 54 Years | 5 (17.2%) | 0 (0.0%) |
| 55 to 64 Years | 0 (0.0%) | 0 (0.0%) |
| 65 to 74 Years | 2 (6.5%) | 0 (0.0%) |
| 75 Years and over | 0 (0.0%) | 2 (9.5%) |
| Total | 7 (4.1%) | 2 (2.4%) |
Income Above Poverty by Sex and Age in Kalihiwai
According to the poverty statistics in Kalihiwai, males aged under 5 years and females aged 6 to 11 years are the age groups that are most secure financially, with 100.0% of males and 100.0% of females in these age groups living above the poverty line.
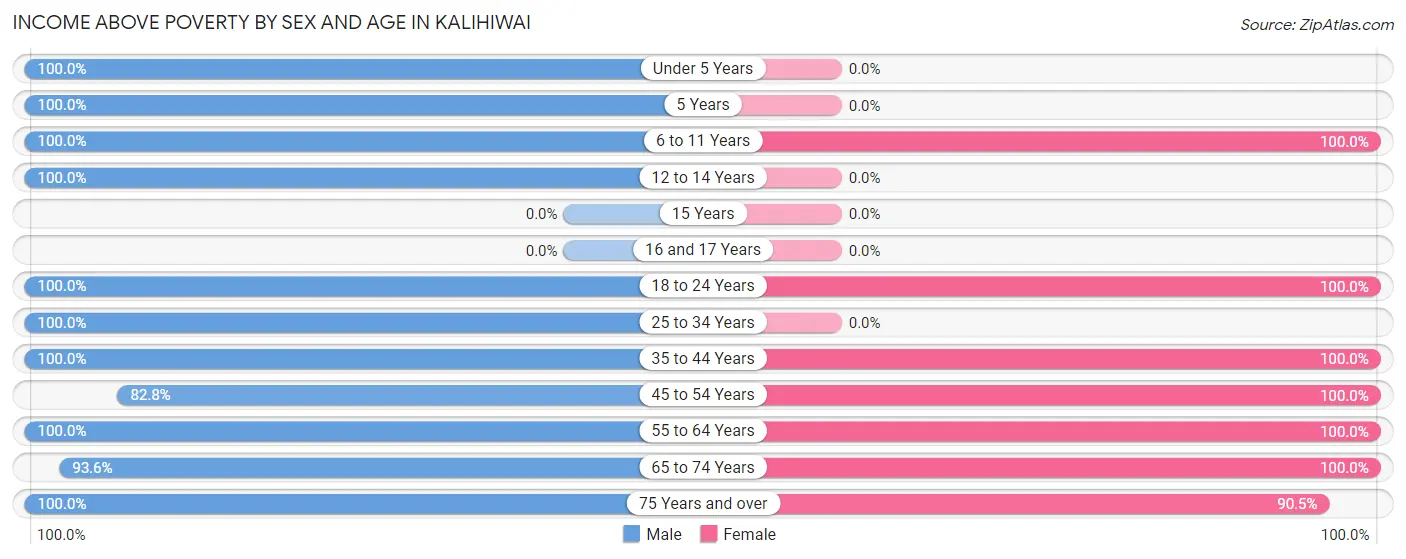
| Age Bracket | Male | Female |
| Under 5 Years | 5 (100.0%) | 0 (0.0%) |
| 5 Years | 9 (100.0%) | 0 (0.0%) |
| 6 to 11 Years | 9 (100.0%) | 2 (100.0%) |
| 12 to 14 Years | 2 (100.0%) | 0 (0.0%) |
| 15 Years | 0 (0.0%) | 0 (0.0%) |
| 16 and 17 Years | 0 (0.0%) | 0 (0.0%) |
| 18 to 24 Years | 15 (100.0%) | 2 (100.0%) |
| 25 to 34 Years | 27 (100.0%) | 0 (0.0%) |
| 35 to 44 Years | 13 (100.0%) | 12 (100.0%) |
| 45 to 54 Years | 24 (82.8%) | 16 (100.0%) |
| 55 to 64 Years | 24 (100.0%) | 14 (100.0%) |
| 65 to 74 Years | 29 (93.5%) | 18 (100.0%) |
| 75 Years and over | 7 (100.0%) | 19 (90.5%) |
| Total | 164 (95.9%) | 83 (97.7%) |
Income Below Poverty Among Married-Couple Families in Kalihiwai
The poverty statistics for married-couple families in Kalihiwai show that 5.7% or 2 of the total 35 families live below the poverty line. Families with no children have the highest poverty rate of 7.4%, comprising of 2 families. On the other hand, families with 3 or 4 children have the lowest poverty rate of 0.0%, which includes 0 families.
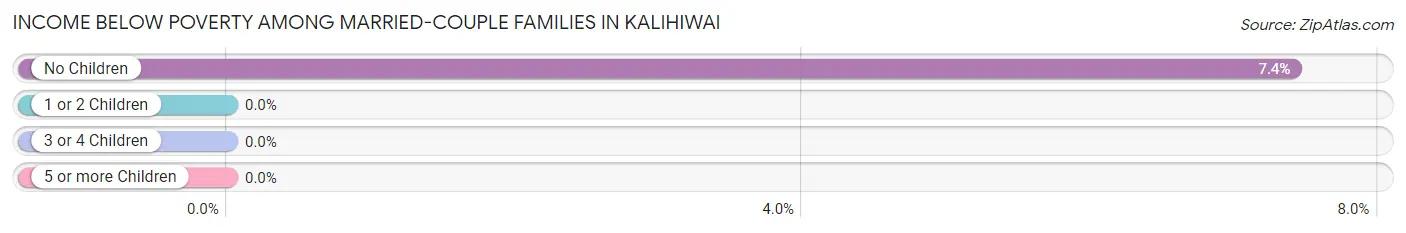
| Children | Above Poverty | Below Poverty |
| No Children | 25 (92.6%) | 2 (7.4%) |
| 1 or 2 Children | 0 (0.0%) | 0 (0.0%) |
| 3 or 4 Children | 8 (100.0%) | 0 (0.0%) |
| 5 or more Children | 0 (0.0%) | 0 (0.0%) |
| Total | 33 (94.3%) | 2 (5.7%) |
Income Below Poverty Among Single-Parent Households in Kalihiwai
| Children | Single Father | Single Mother |
| No Children | 0 (0.0%) | 0 (0.0%) |
| 1 or 2 Children | 0 (0.0%) | 0 (0.0%) |
| 3 or 4 Children | 0 (0.0%) | 0 (0.0%) |
| 5 or more Children | 0 (0.0%) | 0 (0.0%) |
| Total | 0 (0.0%) | 0 (0.0%) |
Income Below Poverty Among Married-Couple vs Single-Parent Households in Kalihiwai
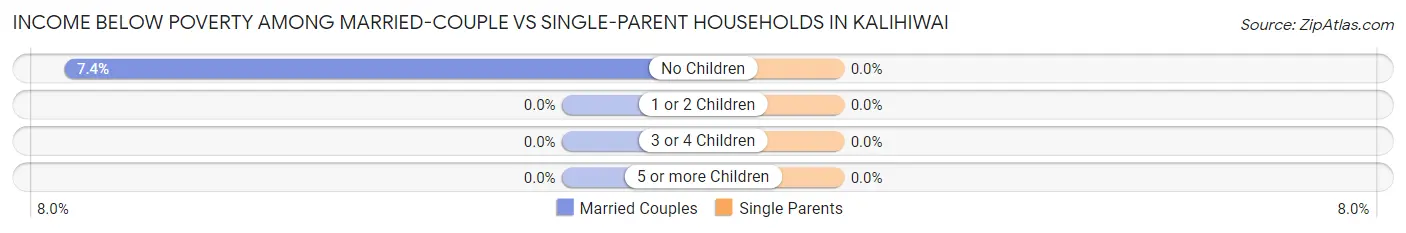
| Children | Married-Couple Families | Single-Parent Households |
| No Children | 2 (7.4%) | 0 (0.0%) |
| 1 or 2 Children | 0 (0.0%) | 0 (0.0%) |
| 3 or 4 Children | 0 (0.0%) | 0 (0.0%) |
| 5 or more Children | 0 (0.0%) | 0 (0.0%) |
| Total | 2 (5.7%) | 0 (0.0%) |
Race in Kalihiwai
The most populous races in Kalihiwai are White / Caucasian (123 | 48.0%), Two or more Races (53 | 20.7%), and Some other Race (36 | 14.1%).
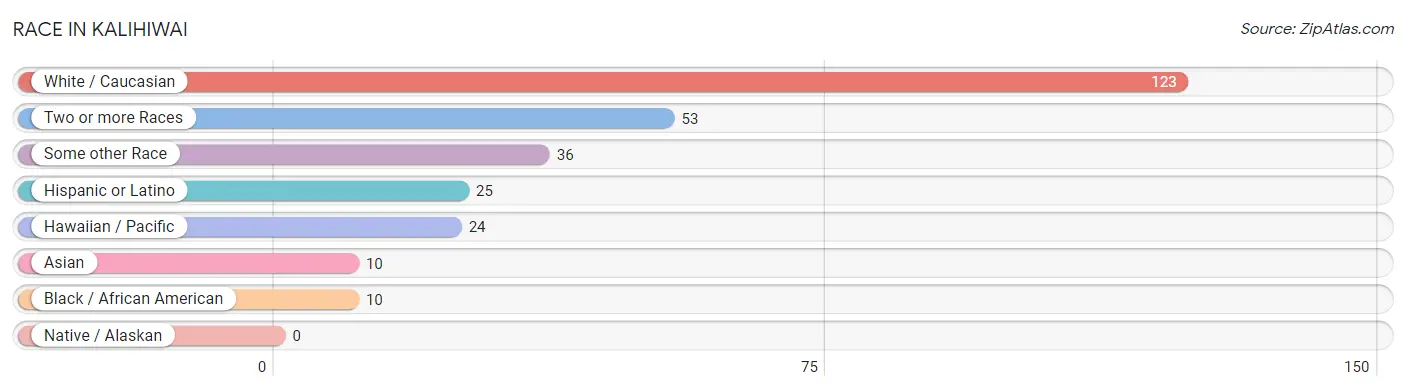
| Race | # Population | % Population |
| Asian | 10 | 3.9% |
| Black / African American | 10 | 3.9% |
| Hawaiian / Pacific | 24 | 9.4% |
| Hispanic or Latino | 25 | 9.8% |
| Native / Alaskan | 0 | 0.0% |
| White / Caucasian | 123 | 48.0% |
| Two or more Races | 53 | 20.7% |
| Some other Race | 36 | 14.1% |
| Total | 256 | 100.0% |
Ancestry in Kalihiwai
The most populous ancestries reported in Kalihiwai are Native Hawaiian (33 | 12.9%), Samoan (29 | 11.3%), English (27 | 10.5%), Bhutanese (23 | 9.0%), and Spaniard (20 | 7.8%), together accounting for 51.6% of all Kalihiwai residents.
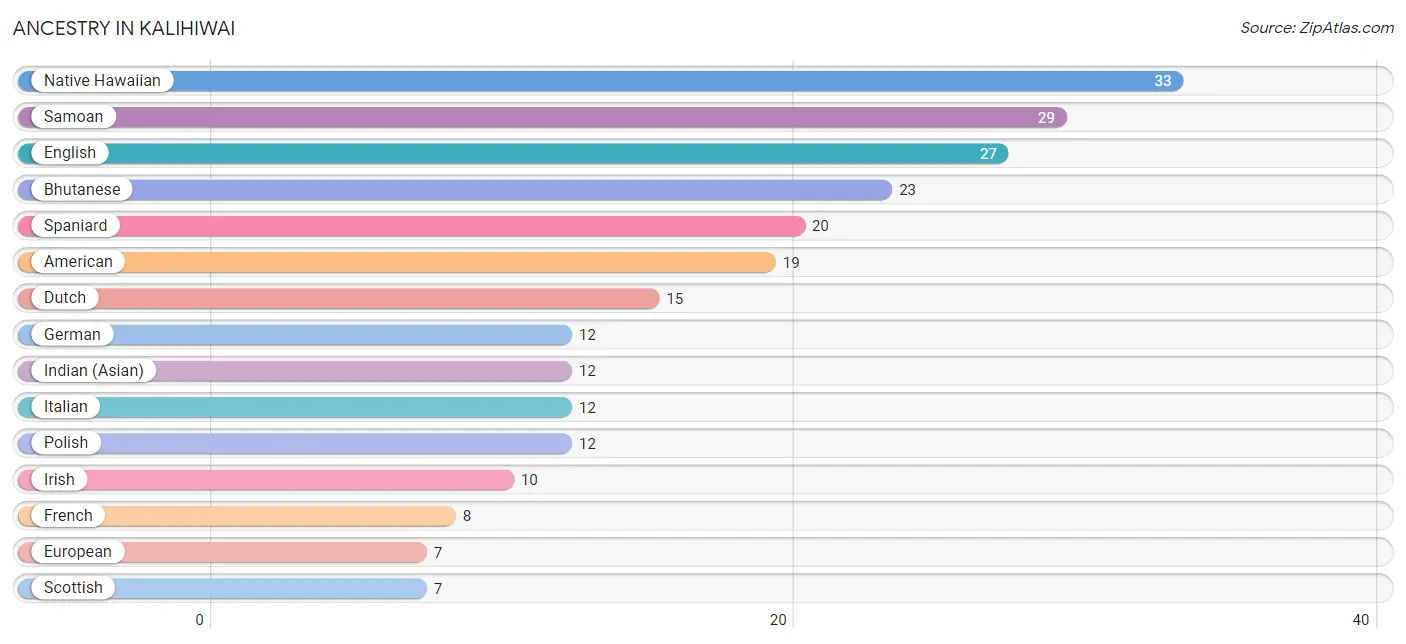
| Ancestry | # Population | % Population |
| American | 19 | 7.4% |
| Bhutanese | 23 | 9.0% |
| Comanche | 3 | 1.2% |
| Creek | 2 | 0.8% |
| Danish | 4 | 1.6% |
| Dutch | 15 | 5.9% |
| English | 27 | 10.5% |
| European | 7 | 2.7% |
| French | 8 | 3.1% |
| German | 12 | 4.7% |
| Indian (Asian) | 12 | 4.7% |
| Irish | 10 | 3.9% |
| Italian | 12 | 4.7% |
| Mexican | 3 | 1.2% |
| Native Hawaiian | 33 | 12.9% |
| Polish | 12 | 4.7% |
| Russian | 1 | 0.4% |
| Samoan | 29 | 11.3% |
| Scotch-Irish | 1 | 0.4% |
| Scottish | 7 | 2.7% |
| Spaniard | 20 | 7.8% |
| Spanish | 2 | 0.8% |
| Swedish | 3 | 1.2% |
| Yugoslavian | 5 | 1.9% | View All 24 Rows |
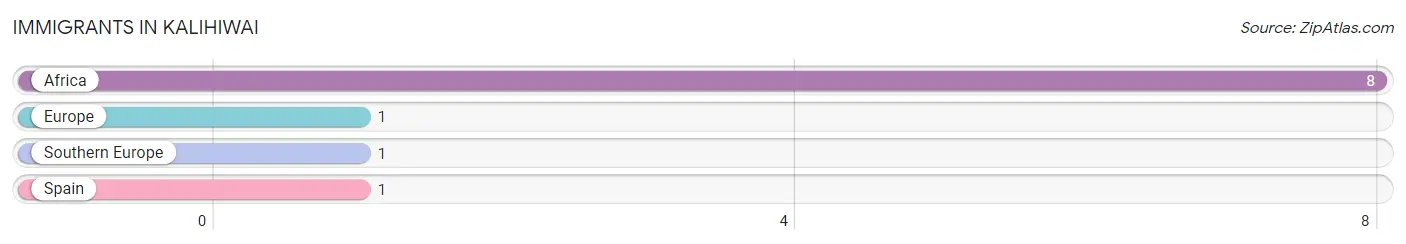
Immigrants in Kalihiwai
The most numerous immigrant groups reported in Kalihiwai came from Africa (8 | 3.1%), Europe (1 | 0.4%), Southern Europe (1 | 0.4%), and Spain (1 | 0.4%), together accounting for 4.3% of all Kalihiwai residents.
| Immigration Origin | # Population | % Population |
| Africa | 8 | 3.1% |
| Europe | 1 | 0.4% |
| Southern Europe | 1 | 0.4% |
| Spain | 1 | 0.4% | View All 4 Rows |
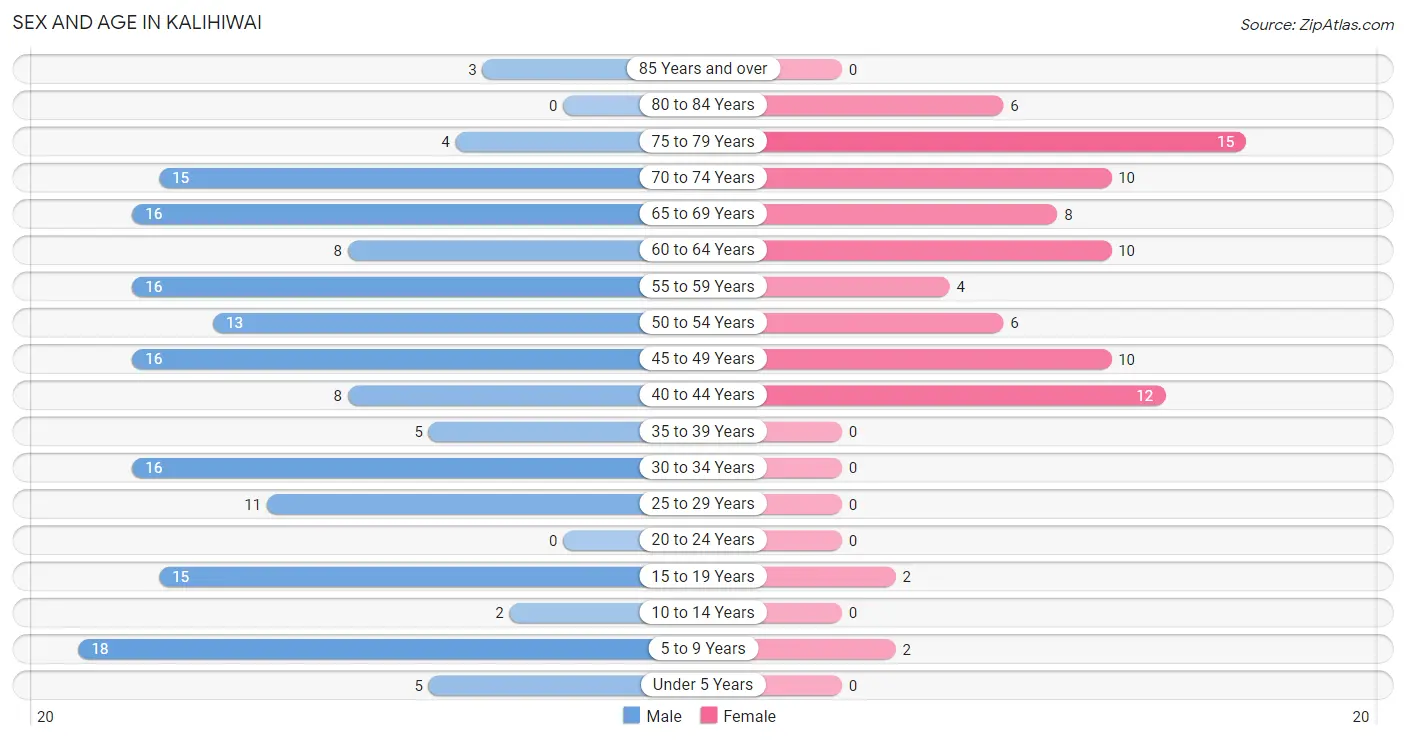
Sex and Age in Kalihiwai
Sex and Age in Kalihiwai
The most populous age groups in Kalihiwai are 5 to 9 Years (18 | 10.5%) for men and 75 to 79 Years (15 | 17.6%) for women.
| Age Bracket | Male | Female |
| Under 5 Years | 5 (2.9%) | 0 (0.0%) |
| 5 to 9 Years | 18 (10.5%) | 2 (2.4%) |
| 10 to 14 Years | 2 (1.2%) | 0 (0.0%) |
| 15 to 19 Years | 15 (8.8%) | 2 (2.4%) |
| 20 to 24 Years | 0 (0.0%) | 0 (0.0%) |
| 25 to 29 Years | 11 (6.4%) | 0 (0.0%) |
| 30 to 34 Years | 16 (9.4%) | 0 (0.0%) |
| 35 to 39 Years | 5 (2.9%) | 0 (0.0%) |
| 40 to 44 Years | 8 (4.7%) | 12 (14.1%) |
| 45 to 49 Years | 16 (9.4%) | 10 (11.8%) |
| 50 to 54 Years | 13 (7.6%) | 6 (7.1%) |
| 55 to 59 Years | 16 (9.4%) | 4 (4.7%) |
| 60 to 64 Years | 8 (4.7%) | 10 (11.8%) |
| 65 to 69 Years | 16 (9.4%) | 8 (9.4%) |
| 70 to 74 Years | 15 (8.8%) | 10 (11.8%) |
| 75 to 79 Years | 4 (2.3%) | 15 (17.6%) |
| 80 to 84 Years | 0 (0.0%) | 6 (7.1%) |
| 85 Years and over | 3 (1.8%) | 0 (0.0%) |
| Total | 171 (100.0%) | 85 (100.0%) |
Families and Households in Kalihiwai
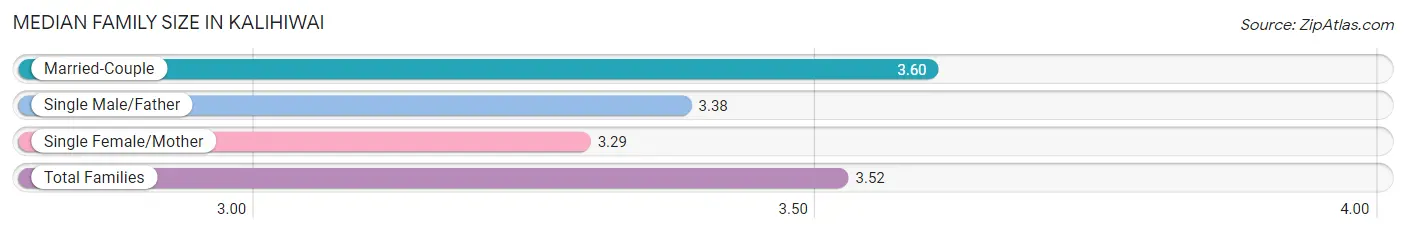
Median Family Size in Kalihiwai
The median family size in Kalihiwai is 3.52 persons per family, with married-couple families (35 | 70.0%) accounting for the largest median family size of 3.6 persons per family. On the other hand, single female/mother families (7 | 14.0%) represent the smallest median family size with 3.29 persons per family.
| Family Type | # Families | Family Size |
| Married-Couple | 35 (70.0%) | 3.60 |
| Single Male/Father | 8 (16.0%) | 3.38 |
| Single Female/Mother | 7 (14.0%) | 3.29 |
| Total Families | 50 (100.0%) | 3.52 |
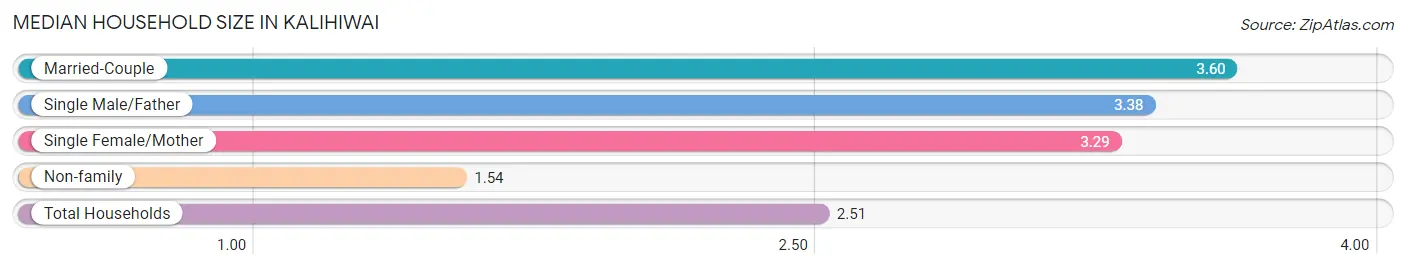
Median Household Size in Kalihiwai
The median household size in Kalihiwai is 2.51 persons per household, with married-couple households (35 | 34.3%) accounting for the largest median household size of 3.6 persons per household. non-family households (52 | 51.0%) represent the smallest median household size with 1.54 persons per household.
| Household Type | # Households | Household Size |
| Married-Couple | 35 (34.3%) | 3.60 |
| Single Male/Father | 8 (7.8%) | 3.38 |
| Single Female/Mother | 7 (6.9%) | 3.29 |
| Non-family | 52 (51.0%) | 1.54 |
| Total Households | 102 (100.0%) | 2.51 |
Household Size by Marriage Status in Kalihiwai
Out of a total of 102 households in Kalihiwai, 50 (49.0%) are family households, while 52 (51.0%) are nonfamily households. The most numerous type of family households are 2-person households, comprising 32, and the most common type of nonfamily households are 1-person households, comprising 38.
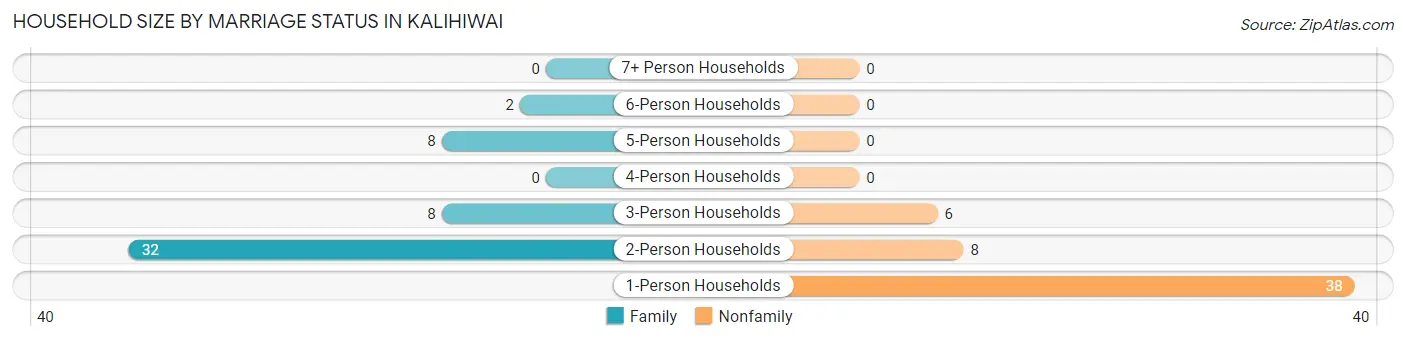
| Household Size | Family Households | Nonfamily Households |
| 1-Person Households | - | 38 (37.2%) |
| 2-Person Households | 32 (31.4%) | 8 (7.8%) |
| 3-Person Households | 8 (7.8%) | 6 (5.9%) |
| 4-Person Households | 0 (0.0%) | 0 (0.0%) |
| 5-Person Households | 8 (7.8%) | 0 (0.0%) |
| 6-Person Households | 2 (2.0%) | 0 (0.0%) |
| 7+ Person Households | 0 (0.0%) | 0 (0.0%) |
| Total | 50 (49.0%) | 52 (51.0%) |
Female Fertility in Kalihiwai
Fertility by Age in Kalihiwai
| Age Bracket | Women with Births | Births / 1,000 Women |
| 15 to 19 years | 0 (0.0%) | 0.0 |
| 20 to 34 years | 0 (0.0%) | 0.0 |
| 35 to 50 years | 0 (0.0%) | 0.0 |
| Total | 0 (0.0%) | 0.0 |
Fertility by Age by Marriage Status in Kalihiwai
| Age Bracket | Married | Unmarried |
| 15 to 19 years | 0 (0.0%) | 0 (0.0%) |
| 20 to 34 years | 0 (0.0%) | 0 (0.0%) |
| 35 to 50 years | 0 (0.0%) | 0 (0.0%) |
| Total | 0 (0.0%) | 0 (0.0%) |
Fertility by Education in Kalihiwai
| Educational Attainment | Women with Births | Births / 1,000 Women |
| Less than High School | 0 (0.0%) | 0.0 |
| High School Diploma | 0 (0.0%) | 0.0 |
| College or Associate's Degree | 0 (0.0%) | 0.0 |
| Bachelor's Degree | 0 (0.0%) | 0.0 |
| Graduate Degree | 0 (0.0%) | 0.0 |
| Total | 0 (0.0%) | 0.0 |
Fertility by Education by Marriage Status in Kalihiwai
| Educational Attainment | Married | Unmarried |
| Less than High School | 0 (0.0%) | 0 (0.0%) |
| High School Diploma | 0 (0.0%) | 0 (0.0%) |
| College or Associate's Degree | 0 (0.0%) | 0 (0.0%) |
| Bachelor's Degree | 0 (0.0%) | 0 (0.0%) |
| Graduate Degree | 0 (0.0%) | 0 (0.0%) |
| Total | 0 (0.0%) | 0 (0.0%) |
Employment Characteristics in Kalihiwai
Employment by Class of Employer in Kalihiwai
Among the 109 employed individuals in Kalihiwai, private company employees (47 | 43.1%), self-employed (not incorporated) (17 | 15.6%), and self-employed (incorporated) (15 | 13.8%) make up the most common classes of employment.
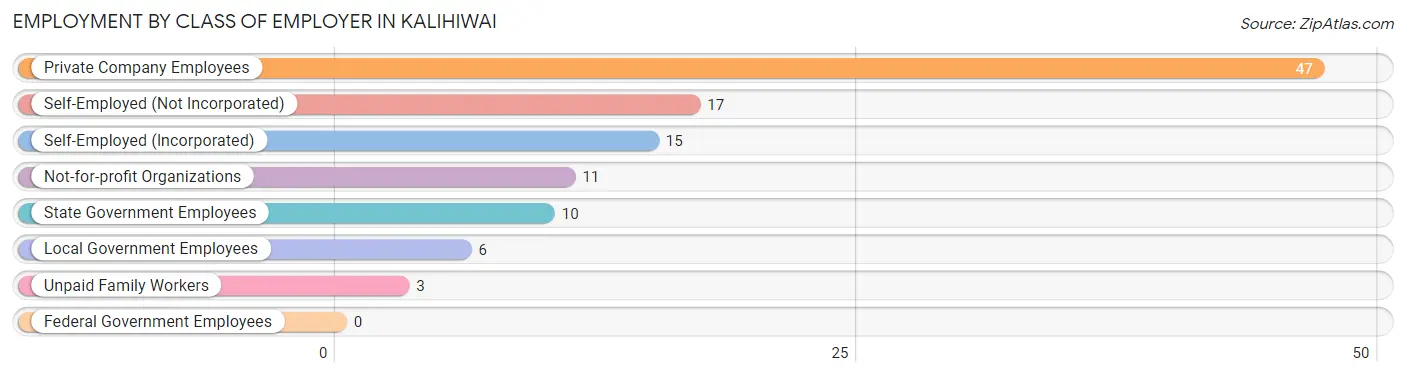
| Employer Class | # Employees | % Employees |
| Private Company Employees | 47 | 43.1% |
| Self-Employed (Incorporated) | 15 | 13.8% |
| Self-Employed (Not Incorporated) | 17 | 15.6% |
| Not-for-profit Organizations | 11 | 10.1% |
| Local Government Employees | 6 | 5.5% |
| State Government Employees | 10 | 9.2% |
| Federal Government Employees | 0 | 0.0% |
| Unpaid Family Workers | 3 | 2.8% |
| Total | 109 | 100.0% |
Employment Status by Age in Kalihiwai
According to the labor force statistics for Kalihiwai, out of the total population over 16 years of age (229), 54.1% or 124 individuals are in the labor force, with 8.1% or 10 of them unemployed. The age group with the highest labor force participation rate is 30 to 34 years, with 100.0% or 16 individuals in the labor force. Within the labor force, the 30 to 34 years age range has the highest percentage of unemployed individuals, with 50.0% or 8 of them being unemployed.
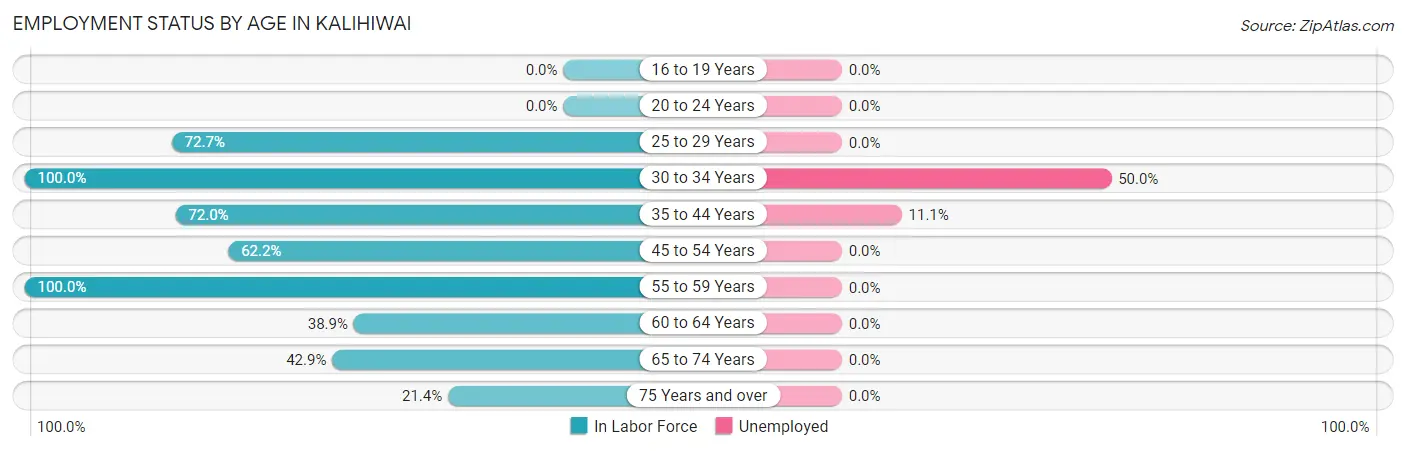
| Age Bracket | In Labor Force | Unemployed |
| 16 to 19 Years | 0 (0.0%) | 0 (0.0%) |
| 20 to 24 Years | 0 (0.0%) | 0 (0.0%) |
| 25 to 29 Years | 8 (72.7%) | 0 (0.0%) |
| 30 to 34 Years | 16 (100.0%) | 8 (50.0%) |
| 35 to 44 Years | 18 (72.0%) | 2 (11.1%) |
| 45 to 54 Years | 28 (62.2%) | 0 (0.0%) |
| 55 to 59 Years | 20 (100.0%) | 0 (0.0%) |
| 60 to 64 Years | 7 (38.9%) | 0 (0.0%) |
| 65 to 74 Years | 21 (42.9%) | 0 (0.0%) |
| 75 Years and over | 6 (21.4%) | 0 (0.0%) |
| Total | 124 (54.1%) | 10 (8.1%) |
Employment Status by Educational Attainment in Kalihiwai
According to labor force statistics for Kalihiwai, 71.9% of individuals (97) out of the total population between 25 and 64 years of age (135) are in the labor force, with 10.3% or 10 of them being unemployed. The group with the highest labor force participation rate are those with the educational attainment of college / associate degree, with 86.4% or 38 individuals in the labor force. Within the labor force, individuals with college / associate degree education have the highest percentage of unemployment, with 21.1% or 8 of them being unemployed.
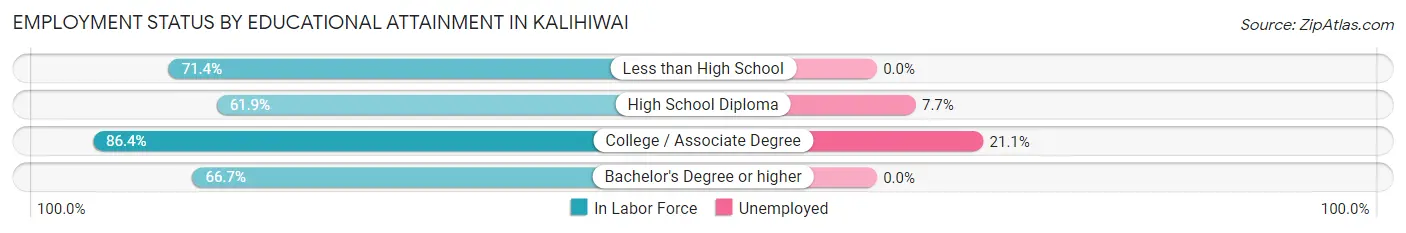
| Educational Attainment | In Labor Force | Unemployed |
| Less than High School | 5 (71.4%) | 0 (0.0%) |
| High School Diploma | 26 (61.9%) | 3 (7.7%) |
| College / Associate Degree | 38 (86.4%) | 9 (21.1%) |
| Bachelor's Degree or higher | 28 (66.7%) | 0 (0.0%) |
| Total | 97 (71.9%) | 14 (10.3%) |
Employment Occupations by Sex in Kalihiwai
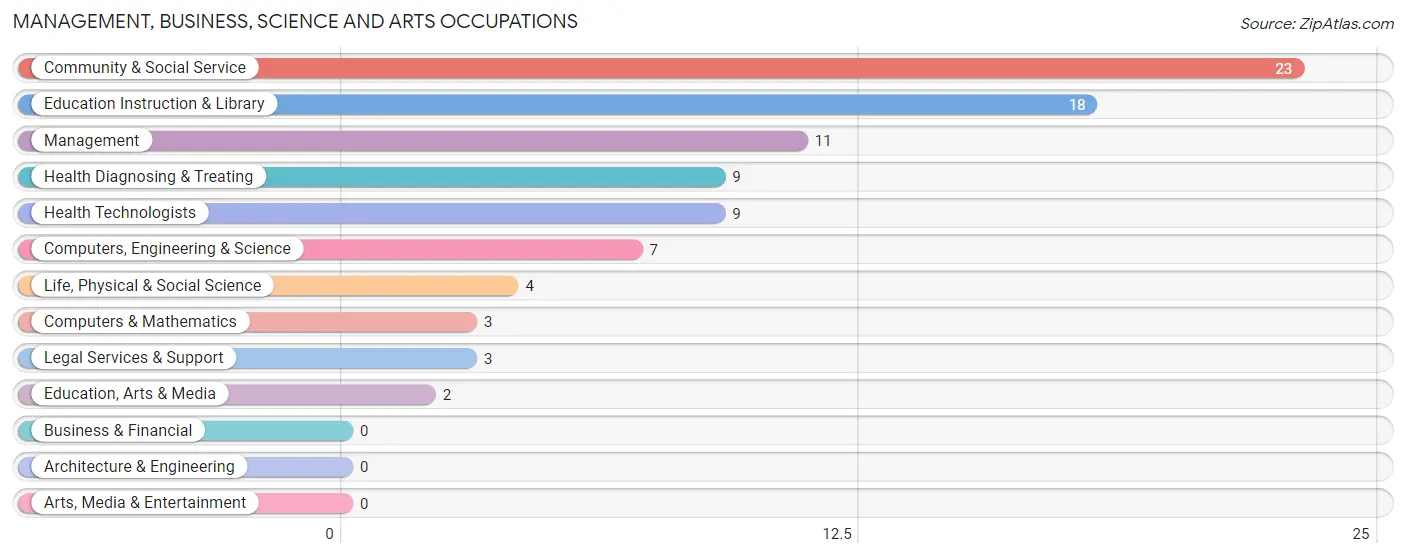
Management, Business, Science and Arts Occupations
The most common Management, Business, Science and Arts occupations in Kalihiwai are Community & Social Service (23 | 20.2%), Education Instruction & Library (18 | 15.8%), Management (11 | 9.7%), Health Diagnosing & Treating (9 | 7.9%), and Health Technologists (9 | 7.9%).
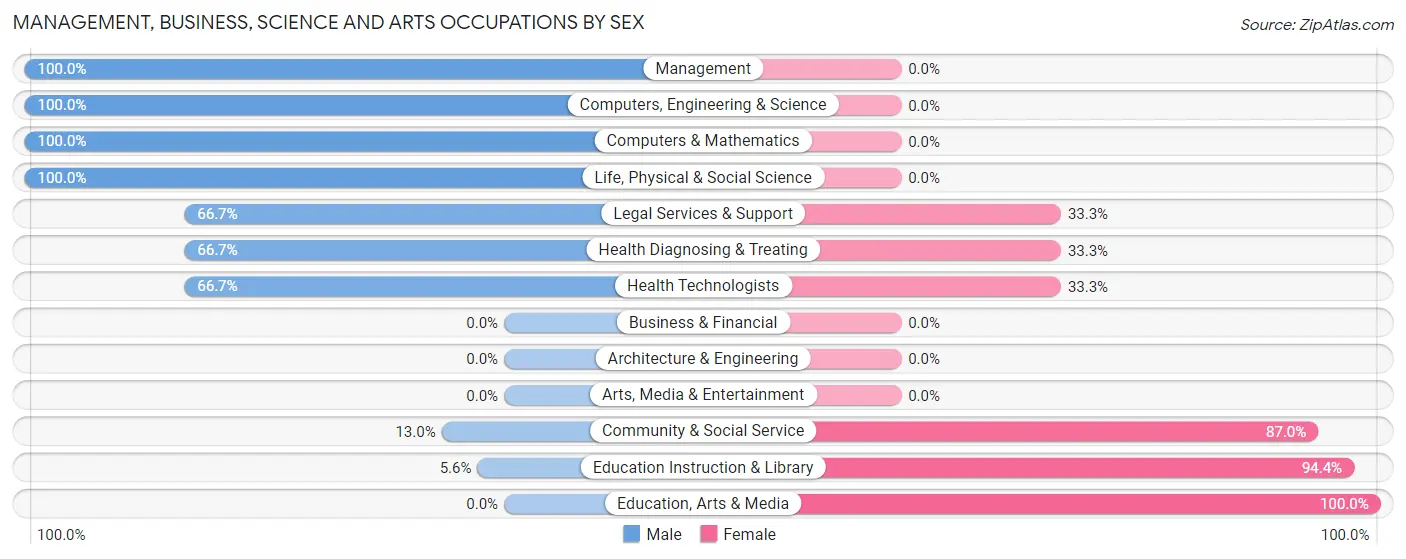
Management, Business, Science and Arts Occupations by Sex
Within the Management, Business, Science and Arts occupations in Kalihiwai, the most male-oriented occupations are Management (100.0%), Computers, Engineering & Science (100.0%), and Computers & Mathematics (100.0%), while the most female-oriented occupations are Education, Arts & Media (100.0%), Education Instruction & Library (94.4%), and Community & Social Service (87.0%).
| Occupation | Male | Female |
| Management | 11 (100.0%) | 0 (0.0%) |
| Business & Financial | 0 (0.0%) | 0 (0.0%) |
| Computers, Engineering & Science | 7 (100.0%) | 0 (0.0%) |
| Computers & Mathematics | 3 (100.0%) | 0 (0.0%) |
| Architecture & Engineering | 0 (0.0%) | 0 (0.0%) |
| Life, Physical & Social Science | 4 (100.0%) | 0 (0.0%) |
| Community & Social Service | 3 (13.0%) | 20 (87.0%) |
| Education, Arts & Media | 0 (0.0%) | 2 (100.0%) |
| Legal Services & Support | 2 (66.7%) | 1 (33.3%) |
| Education Instruction & Library | 1 (5.6%) | 17 (94.4%) |
| Arts, Media & Entertainment | 0 (0.0%) | 0 (0.0%) |
| Health Diagnosing & Treating | 6 (66.7%) | 3 (33.3%) |
| Health Technologists | 6 (66.7%) | 3 (33.3%) |
| Total (Category) | 27 (54.0%) | 23 (46.0%) |
| Total (Overall) | 72 (63.2%) | 42 (36.8%) |
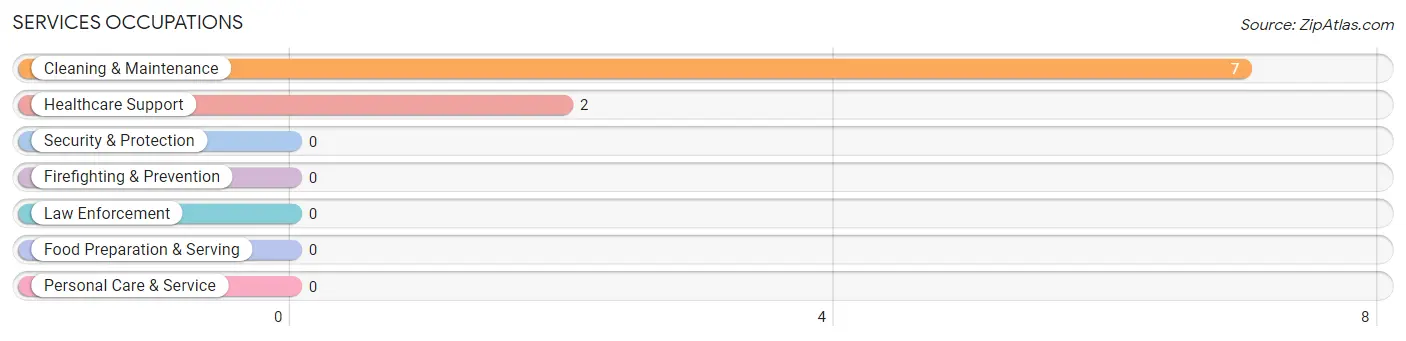
Services Occupations
The most common Services occupations in Kalihiwai are Cleaning & Maintenance (7 | 6.1%), and Healthcare Support (2 | 1.8%).
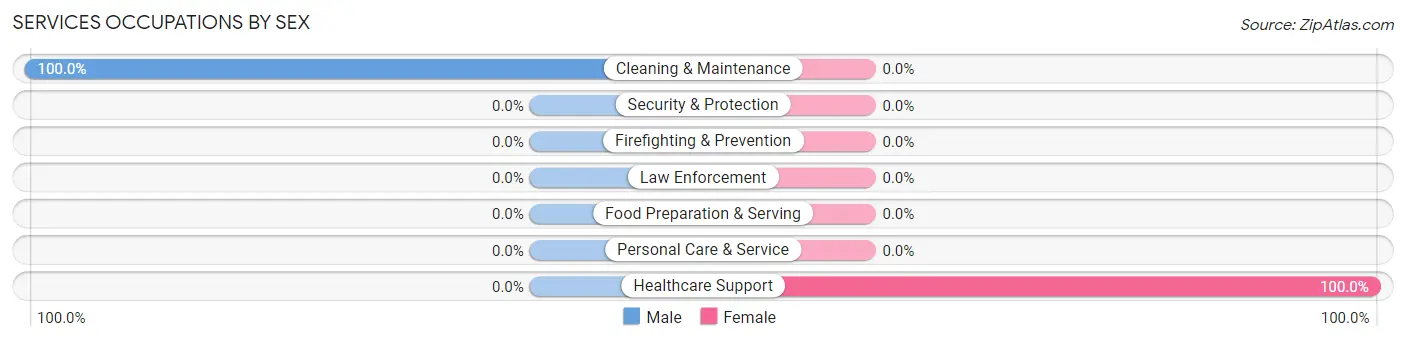
Services Occupations by Sex
| Occupation | Male | Female |
| Healthcare Support | 0 (0.0%) | 2 (100.0%) |
| Security & Protection | 0 (0.0%) | 0 (0.0%) |
| Firefighting & Prevention | 0 (0.0%) | 0 (0.0%) |
| Law Enforcement | 0 (0.0%) | 0 (0.0%) |
| Food Preparation & Serving | 0 (0.0%) | 0 (0.0%) |
| Cleaning & Maintenance | 7 (100.0%) | 0 (0.0%) |
| Personal Care & Service | 0 (0.0%) | 0 (0.0%) |
| Total (Category) | 7 (77.8%) | 2 (22.2%) |
| Total (Overall) | 72 (63.2%) | 42 (36.8%) |
Sales and Office Occupations
The most common Sales and Office occupations in Kalihiwai are Sales & Related (17 | 14.9%), and Office & Administration (5 | 4.4%).
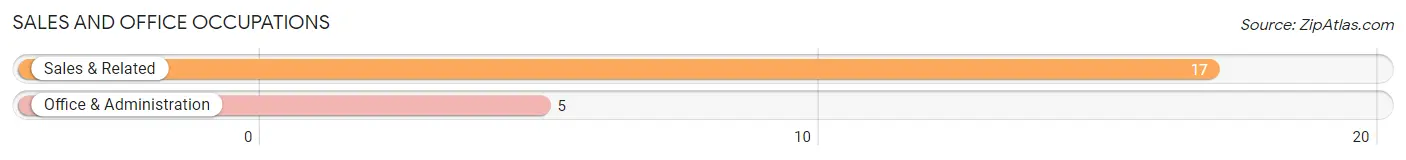
Sales and Office Occupations by Sex
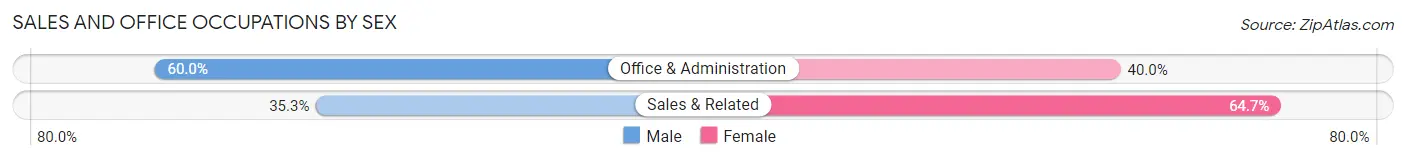
| Occupation | Male | Female |
| Sales & Related | 6 (35.3%) | 11 (64.7%) |
| Office & Administration | 3 (60.0%) | 2 (40.0%) |
| Total (Category) | 9 (40.9%) | 13 (59.1%) |
| Total (Overall) | 72 (63.2%) | 42 (36.8%) |
Natural Resources, Construction and Maintenance Occupations
The most common Natural Resources, Construction and Maintenance occupations in Kalihiwai are Farming, Fishing & Forestry (9 | 7.9%), and Construction & Extraction (5 | 4.4%).
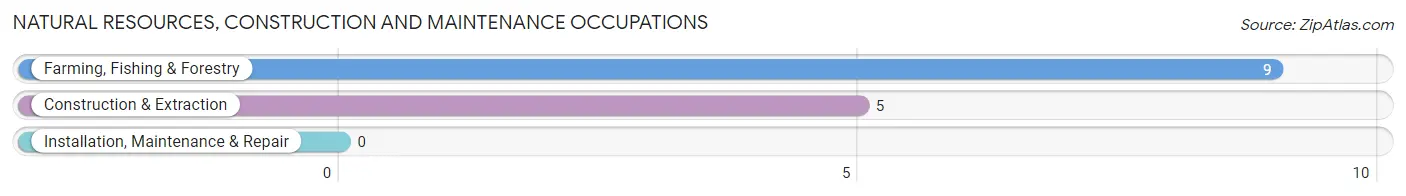
Natural Resources, Construction and Maintenance Occupations by Sex
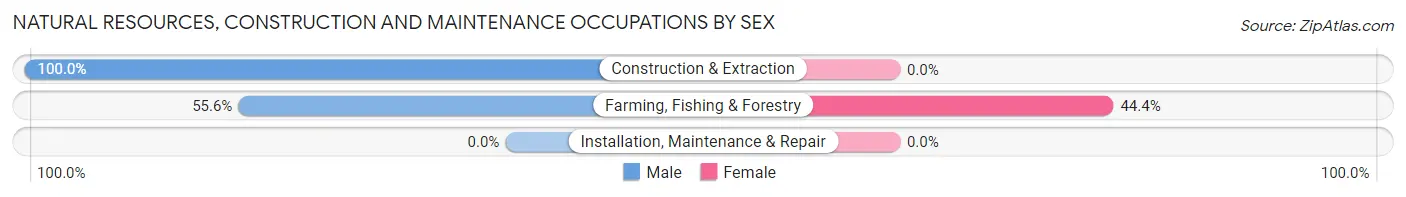
| Occupation | Male | Female |
| Farming, Fishing & Forestry | 5 (55.6%) | 4 (44.4%) |
| Construction & Extraction | 5 (100.0%) | 0 (0.0%) |
| Installation, Maintenance & Repair | 0 (0.0%) | 0 (0.0%) |
| Total (Category) | 10 (71.4%) | 4 (28.6%) |
| Total (Overall) | 72 (63.2%) | 42 (36.8%) |
Production, Transportation and Moving Occupations
The most common Production, Transportation and Moving occupations in Kalihiwai are Production (14 | 12.3%), and Material Moving (5 | 4.4%).
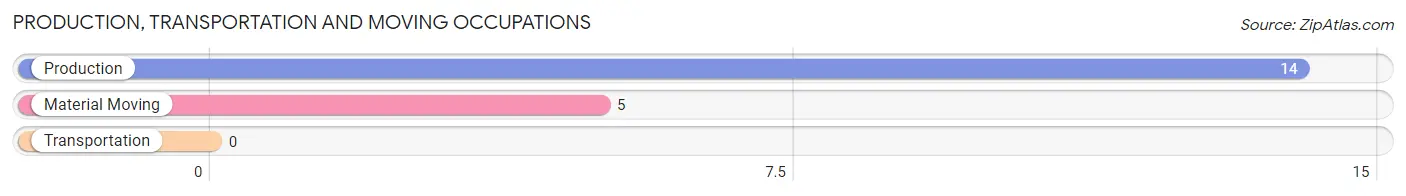
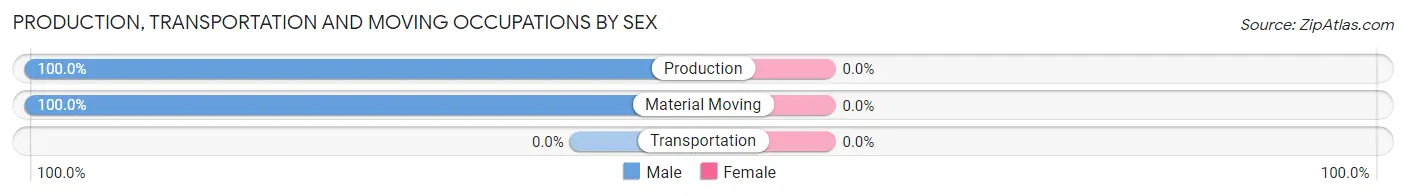
Production, Transportation and Moving Occupations by Sex
| Occupation | Male | Female |
| Production | 14 (100.0%) | 0 (0.0%) |
| Transportation | 0 (0.0%) | 0 (0.0%) |
| Material Moving | 5 (100.0%) | 0 (0.0%) |
| Total (Category) | 19 (100.0%) | 0 (0.0%) |
| Total (Overall) | 72 (63.2%) | 42 (36.8%) |
Employment Industries by Sex in Kalihiwai
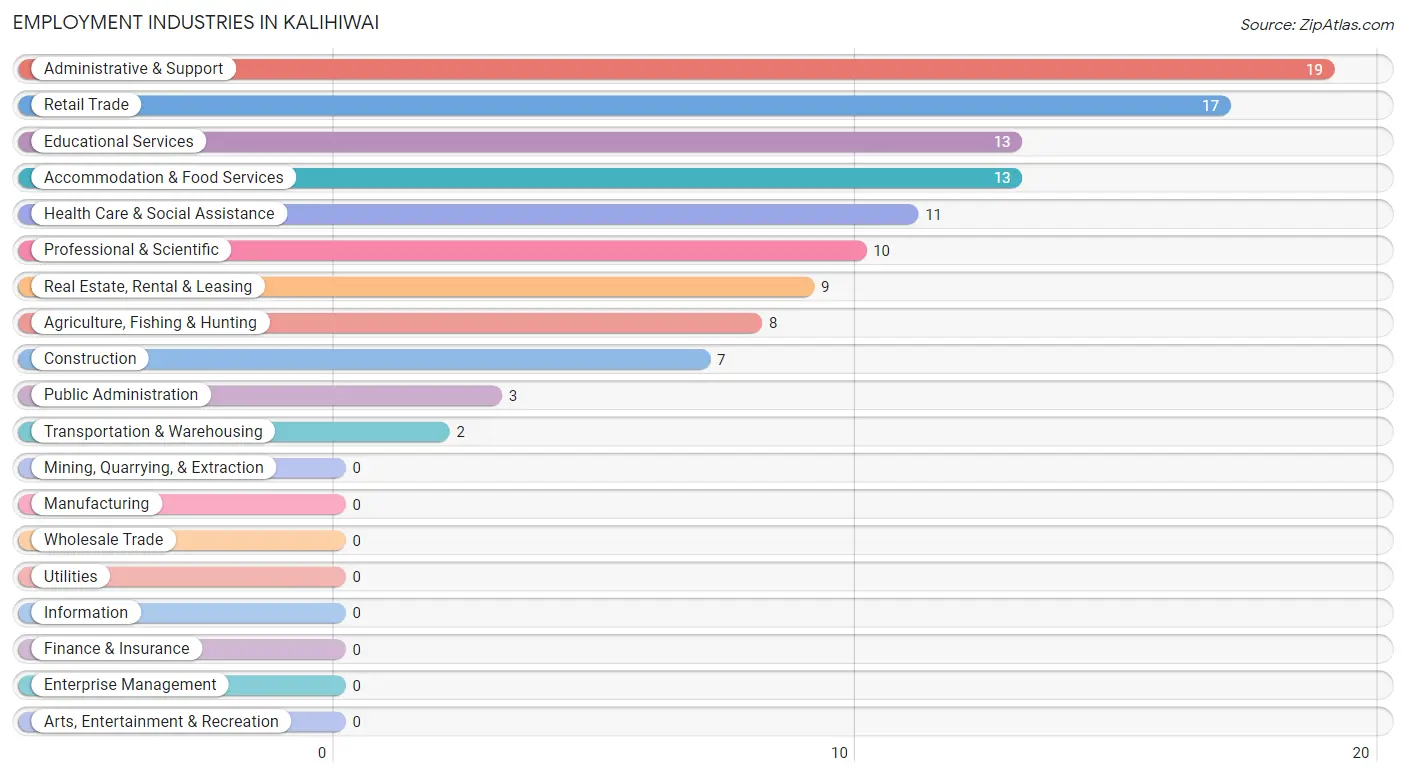
Employment Industries in Kalihiwai
The major employment industries in Kalihiwai include Administrative & Support (19 | 16.7%), Retail Trade (17 | 14.9%), Educational Services (13 | 11.4%), Accommodation & Food Services (13 | 11.4%), and Health Care & Social Assistance (11 | 9.7%).
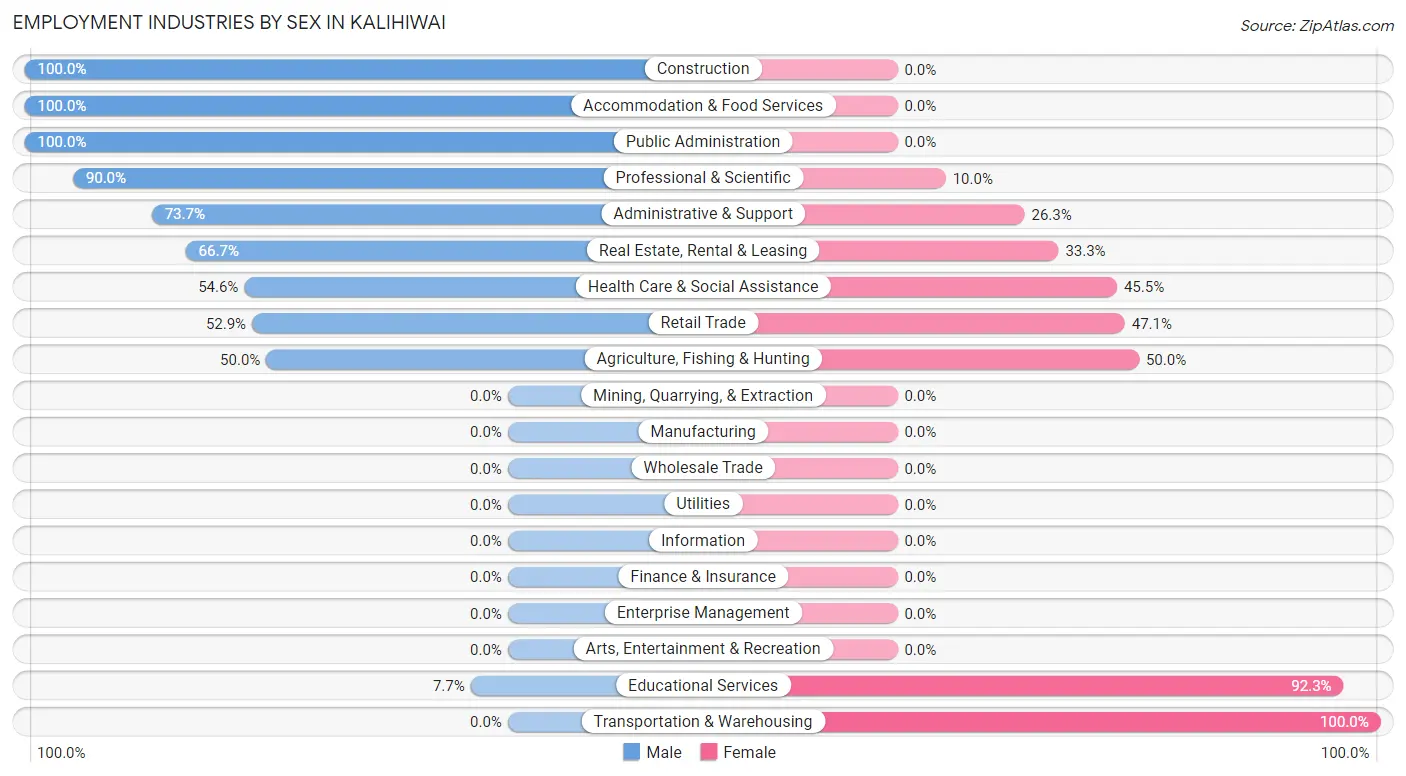
Employment Industries by Sex in Kalihiwai
The Kalihiwai industries that see more men than women are Construction (100.0%), Accommodation & Food Services (100.0%), and Public Administration (100.0%), whereas the industries that tend to have a higher number of women are Transportation & Warehousing (100.0%), Educational Services (92.3%), and Agriculture, Fishing & Hunting (50.0%).
| Industry | Male | Female |
| Agriculture, Fishing & Hunting | 4 (50.0%) | 4 (50.0%) |
| Mining, Quarrying, & Extraction | 0 (0.0%) | 0 (0.0%) |
| Construction | 7 (100.0%) | 0 (0.0%) |
| Manufacturing | 0 (0.0%) | 0 (0.0%) |
| Wholesale Trade | 0 (0.0%) | 0 (0.0%) |
| Retail Trade | 9 (52.9%) | 8 (47.1%) |
| Transportation & Warehousing | 0 (0.0%) | 2 (100.0%) |
| Utilities | 0 (0.0%) | 0 (0.0%) |
| Information | 0 (0.0%) | 0 (0.0%) |
| Finance & Insurance | 0 (0.0%) | 0 (0.0%) |
| Real Estate, Rental & Leasing | 6 (66.7%) | 3 (33.3%) |
| Professional & Scientific | 9 (90.0%) | 1 (10.0%) |
| Enterprise Management | 0 (0.0%) | 0 (0.0%) |
| Administrative & Support | 14 (73.7%) | 5 (26.3%) |
| Educational Services | 1 (7.7%) | 12 (92.3%) |
| Health Care & Social Assistance | 6 (54.5%) | 5 (45.5%) |
| Arts, Entertainment & Recreation | 0 (0.0%) | 0 (0.0%) |
| Accommodation & Food Services | 13 (100.0%) | 0 (0.0%) |
| Public Administration | 3 (100.0%) | 0 (0.0%) |
| Total | 72 (63.2%) | 42 (36.8%) |
Education in Kalihiwai
School Enrollment in Kalihiwai
The most common levels of schooling among the 42 students in Kalihiwai are high school (13 | 30.9%), elementary school (11 | 26.2%), and kindergarten (9 | 21.4%).
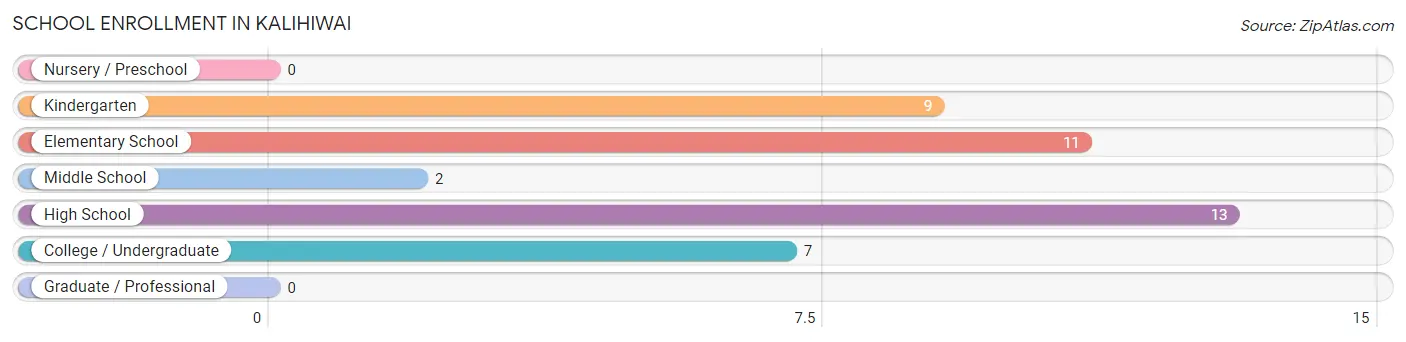
| School Level | # Students | % Students |
| Nursery / Preschool | 0 | 0.0% |
| Kindergarten | 9 | 21.4% |
| Elementary School | 11 | 26.2% |
| Middle School | 2 | 4.8% |
| High School | 13 | 30.9% |
| College / Undergraduate | 7 | 16.7% |
| Graduate / Professional | 0 | 0.0% |
| Total | 42 | 100.0% |
School Enrollment by Age by Funding Source in Kalihiwai
Out of a total of 42 students who are enrolled in schools in Kalihiwai, 18 (42.9%) attend a private institution, while the remaining 24 (57.1%) are enrolled in public schools. The age group of 5 to 9 year old has the highest likelihood of being enrolled in private schools, with 18 (90.0% in the age bracket) enrolled. Conversely, the age group of 10 to 14 year olds has the lowest likelihood of being enrolled in a private school, with 2 (100.0% in the age bracket) attending a public institution.
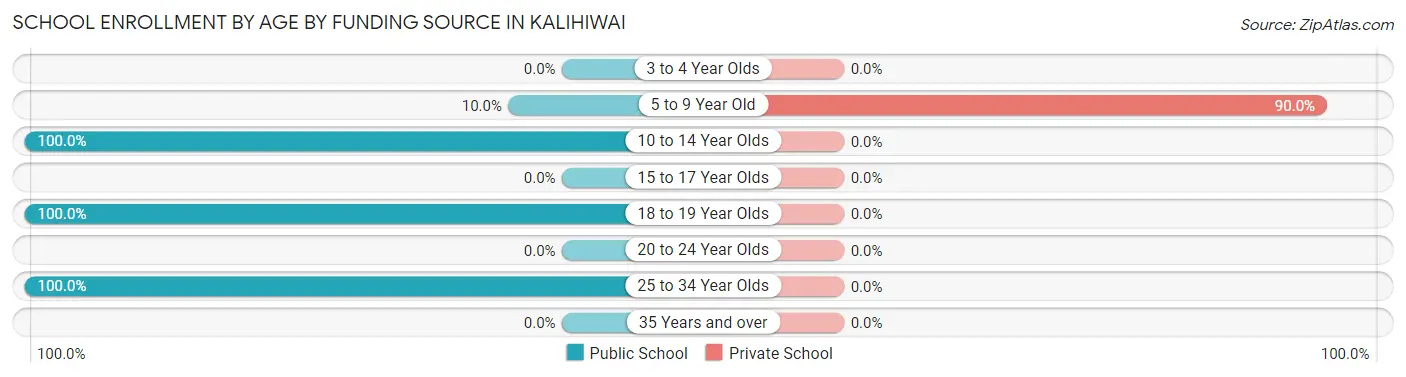
| Age Bracket | Public School | Private School |
| 3 to 4 Year Olds | 0 (0.0%) | 0 (0.0%) |
| 5 to 9 Year Old | 2 (10.0%) | 18 (90.0%) |
| 10 to 14 Year Olds | 2 (100.0%) | 0 (0.0%) |
| 15 to 17 Year Olds | 0 (0.0%) | 0 (0.0%) |
| 18 to 19 Year Olds | 17 (100.0%) | 0 (0.0%) |
| 20 to 24 Year Olds | 0 (0.0%) | 0 (0.0%) |
| 25 to 34 Year Olds | 3 (100.0%) | 0 (0.0%) |
| 35 Years and over | 0 (0.0%) | 0 (0.0%) |
| Total | 24 (57.1%) | 18 (42.9%) |
Educational Attainment by Field of Study in Kalihiwai
Social sciences (15 | 15.3%), science & technology (15 | 15.3%), psychology (12 | 12.2%), education (12 | 12.2%), and business (11 | 11.2%) are the most common fields of study among 98 individuals in Kalihiwai who have obtained a bachelor's degree or higher.
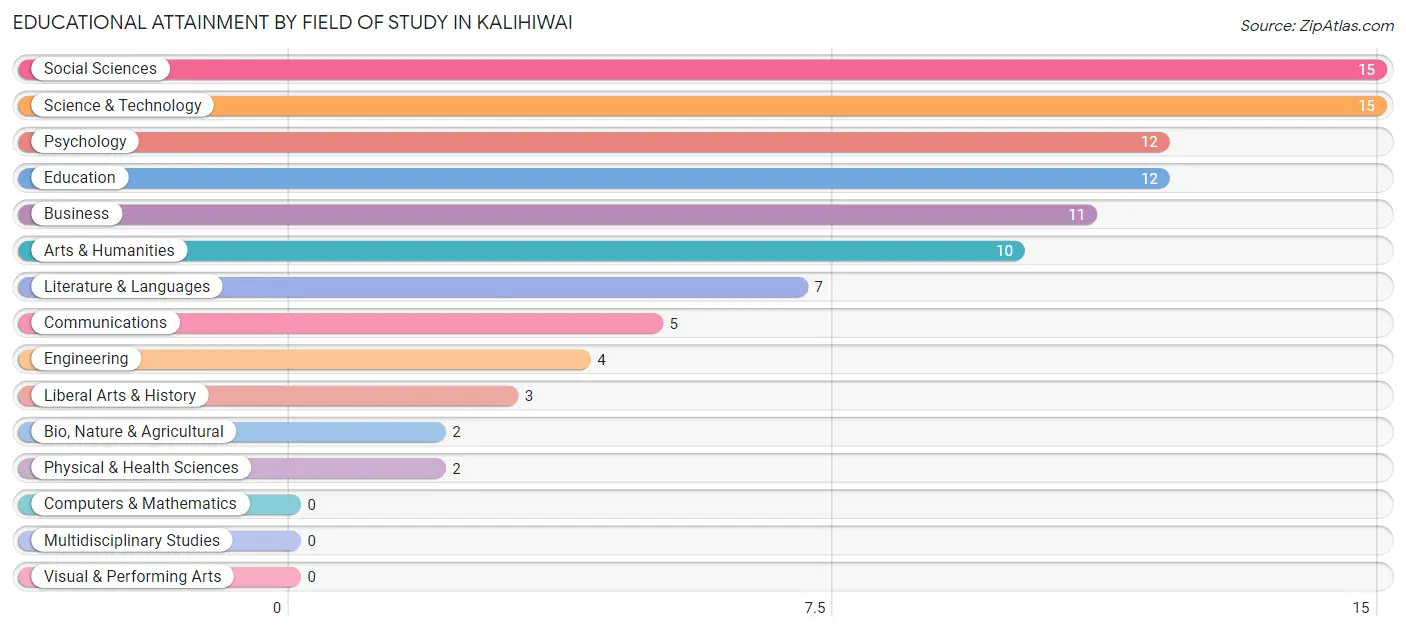
| Field of Study | # Graduates | % Graduates |
| Computers & Mathematics | 0 | 0.0% |
| Bio, Nature & Agricultural | 2 | 2.0% |
| Physical & Health Sciences | 2 | 2.0% |
| Psychology | 12 | 12.2% |
| Social Sciences | 15 | 15.3% |
| Engineering | 4 | 4.1% |
| Multidisciplinary Studies | 0 | 0.0% |
| Science & Technology | 15 | 15.3% |
| Business | 11 | 11.2% |
| Education | 12 | 12.2% |
| Literature & Languages | 7 | 7.1% |
| Liberal Arts & History | 3 | 3.1% |
| Visual & Performing Arts | 0 | 0.0% |
| Communications | 5 | 5.1% |
| Arts & Humanities | 10 | 10.2% |
| Total | 98 | 100.0% |
Transportation & Commute in Kalihiwai
Vehicle Availability by Sex in Kalihiwai
The most prevalent vehicle ownership categories in Kalihiwai are males with 2 vehicles (28, accounting for 41.8%) and females with 2 vehicles (19, making up 66.7%).
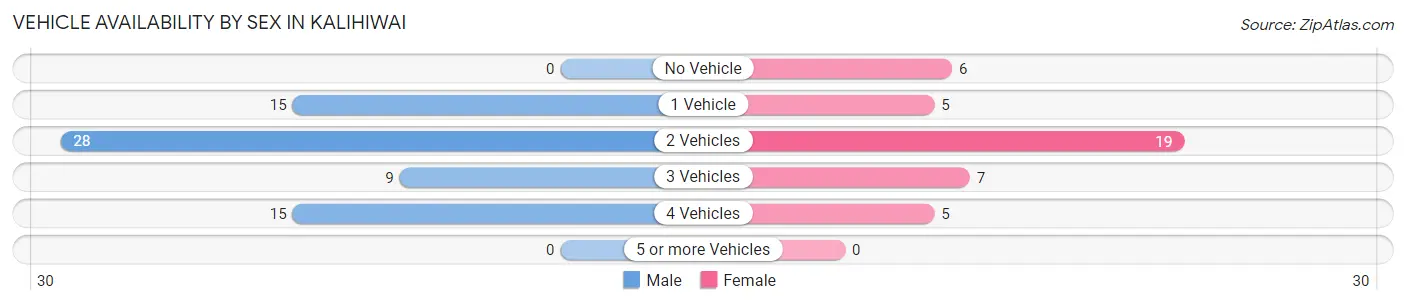
| Vehicles Available | Male | Female |
| No Vehicle | 0 (0.0%) | 6 (14.3%) |
| 1 Vehicle | 15 (22.4%) | 5 (11.9%) |
| 2 Vehicles | 28 (41.8%) | 19 (45.2%) |
| 3 Vehicles | 9 (13.4%) | 7 (16.7%) |
| 4 Vehicles | 15 (22.4%) | 5 (11.9%) |
| 5 or more Vehicles | 0 (0.0%) | 0 (0.0%) |
| Total | 67 (100.0%) | 42 (100.0%) |
Commute Time in Kalihiwai
The most frequently occuring commute durations in Kalihiwai are 10 to 14 minutes (19 commuters, 20.9%), 30 to 34 minutes (16 commuters, 17.6%), and less than 5 minutes (11 commuters, 12.1%).
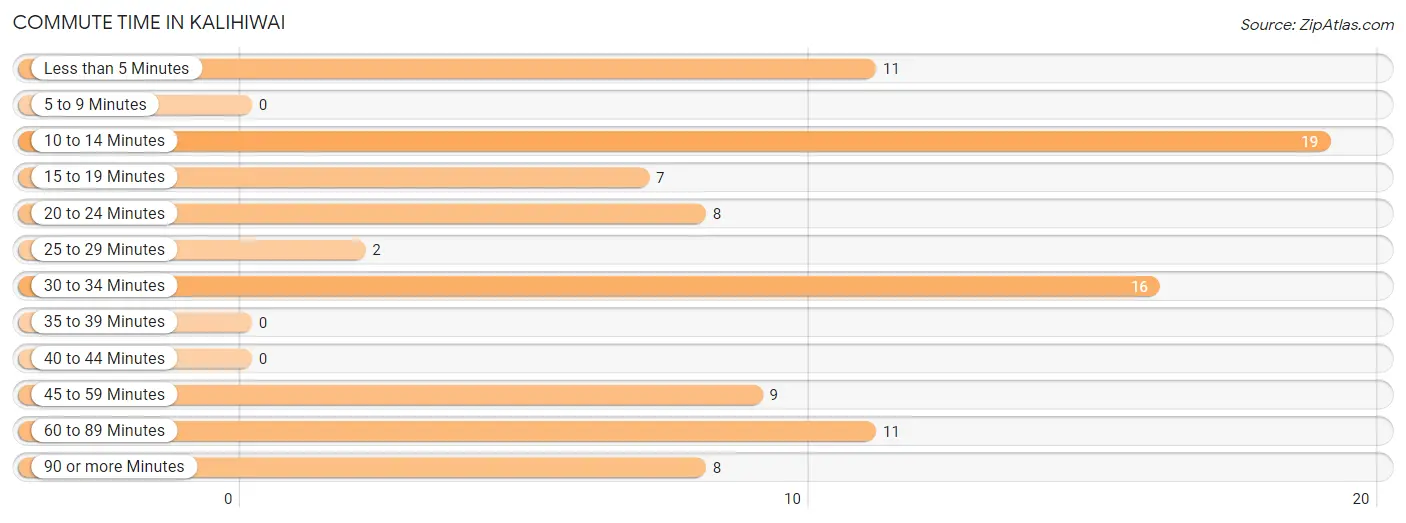
| Commute Time | # Commuters | % Commuters |
| Less than 5 Minutes | 11 | 12.1% |
| 5 to 9 Minutes | 0 | 0.0% |
| 10 to 14 Minutes | 19 | 20.9% |
| 15 to 19 Minutes | 7 | 7.7% |
| 20 to 24 Minutes | 8 | 8.8% |
| 25 to 29 Minutes | 2 | 2.2% |
| 30 to 34 Minutes | 16 | 17.6% |
| 35 to 39 Minutes | 0 | 0.0% |
| 40 to 44 Minutes | 0 | 0.0% |
| 45 to 59 Minutes | 9 | 9.9% |
| 60 to 89 Minutes | 11 | 12.1% |
| 90 or more Minutes | 8 | 8.8% |
Commute Time by Sex in Kalihiwai
The most common commute times in Kalihiwai are 10 to 14 minutes (13 commuters, 24.1%) for males and 60 to 89 minutes (11 commuters, 29.7%) for females.
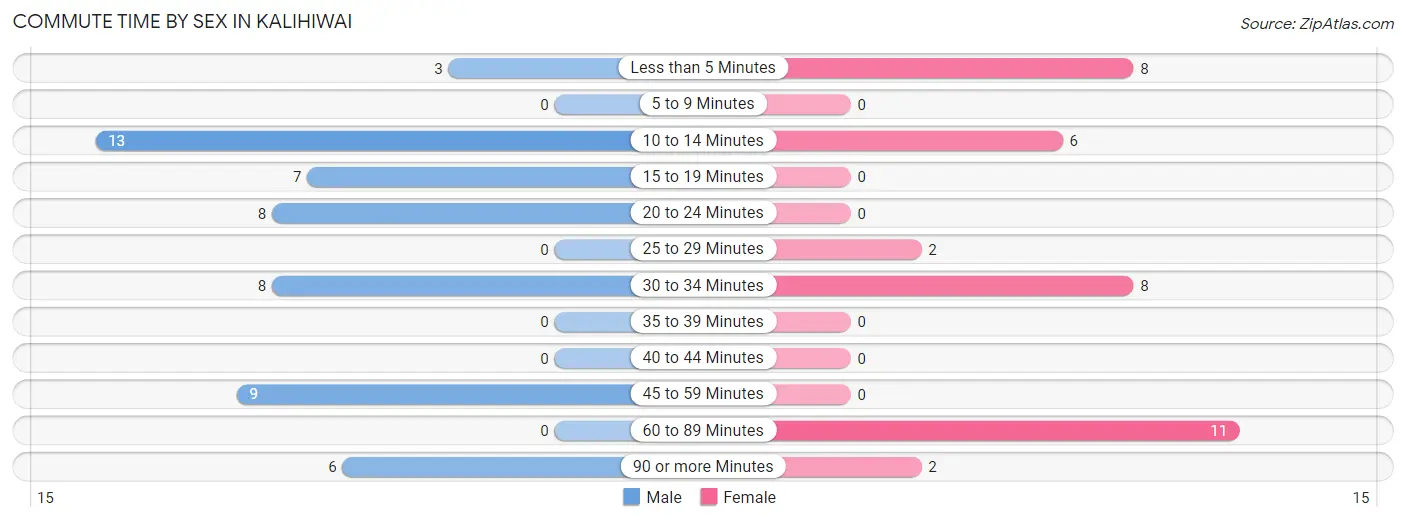
| Commute Time | Male | Female |
| Less than 5 Minutes | 3 (5.6%) | 8 (21.6%) |
| 5 to 9 Minutes | 0 (0.0%) | 0 (0.0%) |
| 10 to 14 Minutes | 13 (24.1%) | 6 (16.2%) |
| 15 to 19 Minutes | 7 (13.0%) | 0 (0.0%) |
| 20 to 24 Minutes | 8 (14.8%) | 0 (0.0%) |
| 25 to 29 Minutes | 0 (0.0%) | 2 (5.4%) |
| 30 to 34 Minutes | 8 (14.8%) | 8 (21.6%) |
| 35 to 39 Minutes | 0 (0.0%) | 0 (0.0%) |
| 40 to 44 Minutes | 0 (0.0%) | 0 (0.0%) |
| 45 to 59 Minutes | 9 (16.7%) | 0 (0.0%) |
| 60 to 89 Minutes | 0 (0.0%) | 11 (29.7%) |
| 90 or more Minutes | 6 (11.1%) | 2 (5.4%) |
Time of Departure to Work by Sex in Kalihiwai
The most frequent times of departure to work in Kalihiwai are 6:30 AM to 6:59 AM (13, 24.1%) for males and 12:00 PM to 3:59 PM (13, 35.1%) for females.
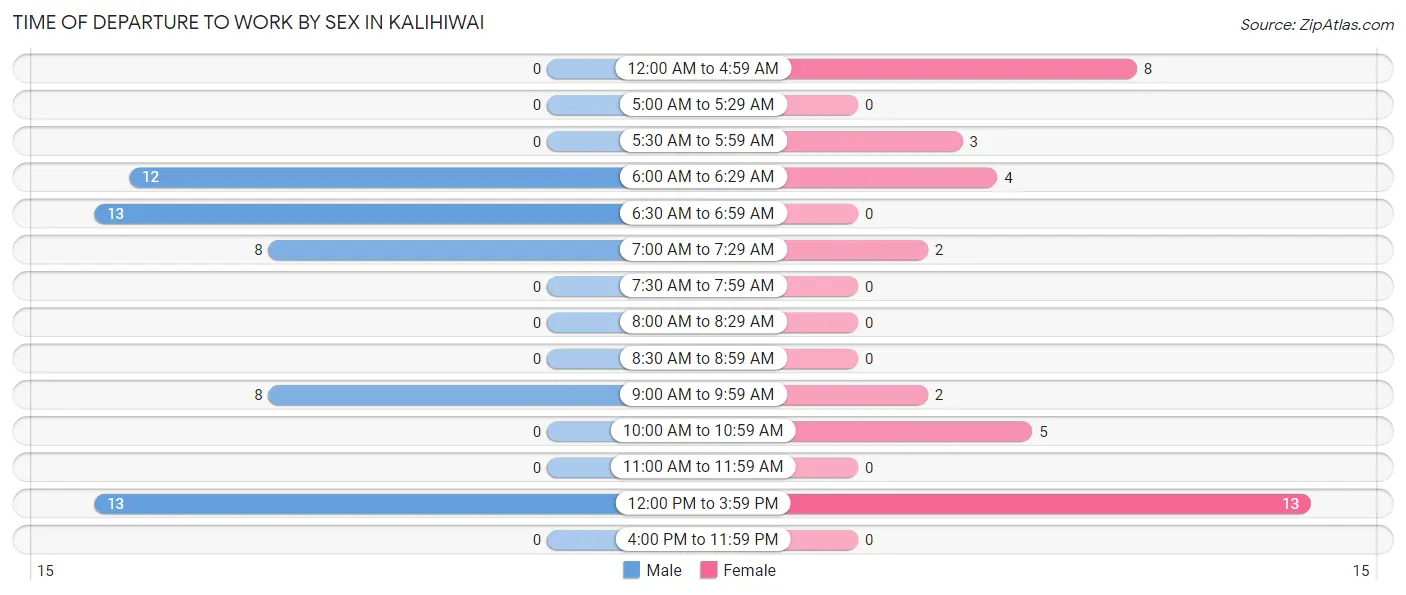
| Time of Departure | Male | Female |
| 12:00 AM to 4:59 AM | 0 (0.0%) | 8 (21.6%) |
| 5:00 AM to 5:29 AM | 0 (0.0%) | 0 (0.0%) |
| 5:30 AM to 5:59 AM | 0 (0.0%) | 3 (8.1%) |
| 6:00 AM to 6:29 AM | 12 (22.2%) | 4 (10.8%) |
| 6:30 AM to 6:59 AM | 13 (24.1%) | 0 (0.0%) |
| 7:00 AM to 7:29 AM | 8 (14.8%) | 2 (5.4%) |
| 7:30 AM to 7:59 AM | 0 (0.0%) | 0 (0.0%) |
| 8:00 AM to 8:29 AM | 0 (0.0%) | 0 (0.0%) |
| 8:30 AM to 8:59 AM | 0 (0.0%) | 0 (0.0%) |
| 9:00 AM to 9:59 AM | 8 (14.8%) | 2 (5.4%) |
| 10:00 AM to 10:59 AM | 0 (0.0%) | 5 (13.5%) |
| 11:00 AM to 11:59 AM | 0 (0.0%) | 0 (0.0%) |
| 12:00 PM to 3:59 PM | 13 (24.1%) | 13 (35.1%) |
| 4:00 PM to 11:59 PM | 0 (0.0%) | 0 (0.0%) |
| Total | 54 (100.0%) | 37 (100.0%) |
Housing Occupancy in Kalihiwai
Occupancy by Ownership in Kalihiwai
Of the total 102 dwellings in Kalihiwai, owner-occupied units account for 71 (69.6%), while renter-occupied units make up 31 (30.4%).
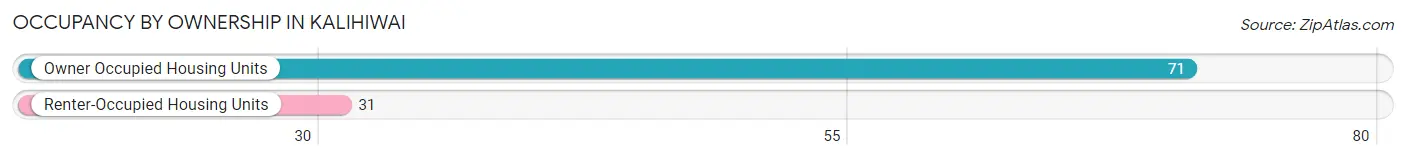
| Occupancy | # Housing Units | % Housing Units |
| Owner Occupied Housing Units | 71 | 69.6% |
| Renter-Occupied Housing Units | 31 | 30.4% |
| Total Occupied Housing Units | 102 | 100.0% |
Occupancy by Household Size in Kalihiwai
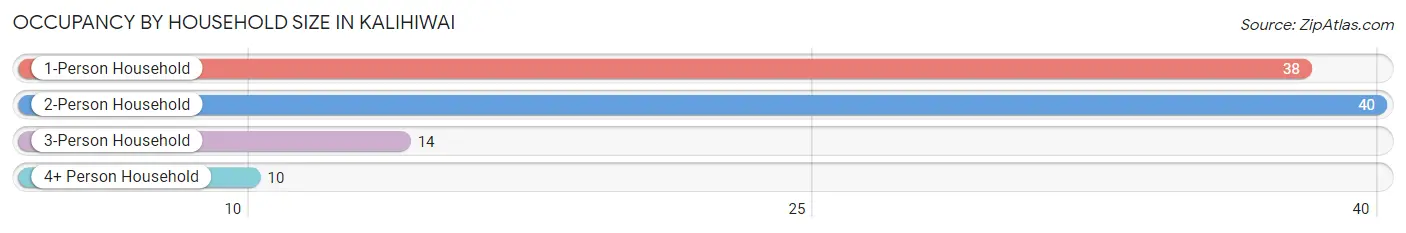
| Household Size | # Housing Units | % Housing Units |
| 1-Person Household | 38 | 37.2% |
| 2-Person Household | 40 | 39.2% |
| 3-Person Household | 14 | 13.7% |
| 4+ Person Household | 10 | 9.8% |
| Total Housing Units | 102 | 100.0% |
Occupancy by Ownership by Household Size in Kalihiwai
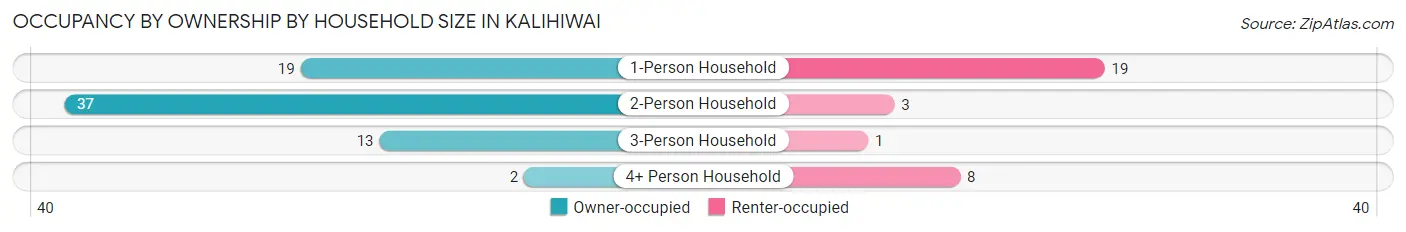
| Household Size | Owner-occupied | Renter-occupied |
| 1-Person Household | 19 (50.0%) | 19 (50.0%) |
| 2-Person Household | 37 (92.5%) | 3 (7.5%) |
| 3-Person Household | 13 (92.9%) | 1 (7.1%) |
| 4+ Person Household | 2 (20.0%) | 8 (80.0%) |
| Total Housing Units | 71 (69.6%) | 31 (30.4%) |
Occupancy by Educational Attainment in Kalihiwai
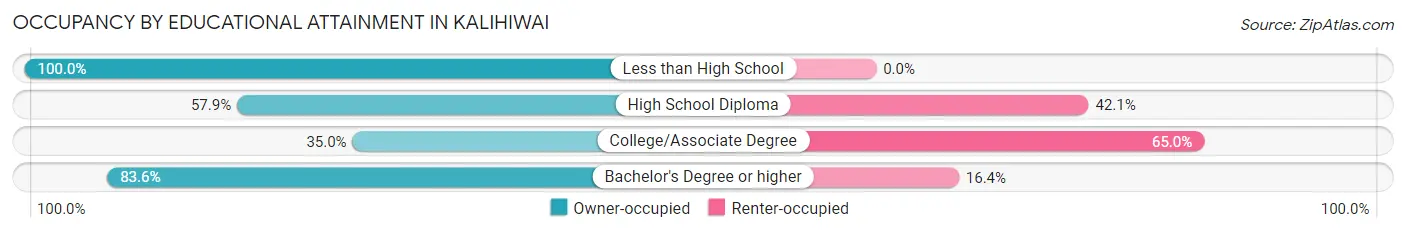
| Household Size | Owner-occupied | Renter-occupied |
| Less than High School | 2 (100.0%) | 0 (0.0%) |
| High School Diploma | 11 (57.9%) | 8 (42.1%) |
| College/Associate Degree | 7 (35.0%) | 13 (65.0%) |
| Bachelor's Degree or higher | 51 (83.6%) | 10 (16.4%) |
Occupancy by Age of Householder in Kalihiwai
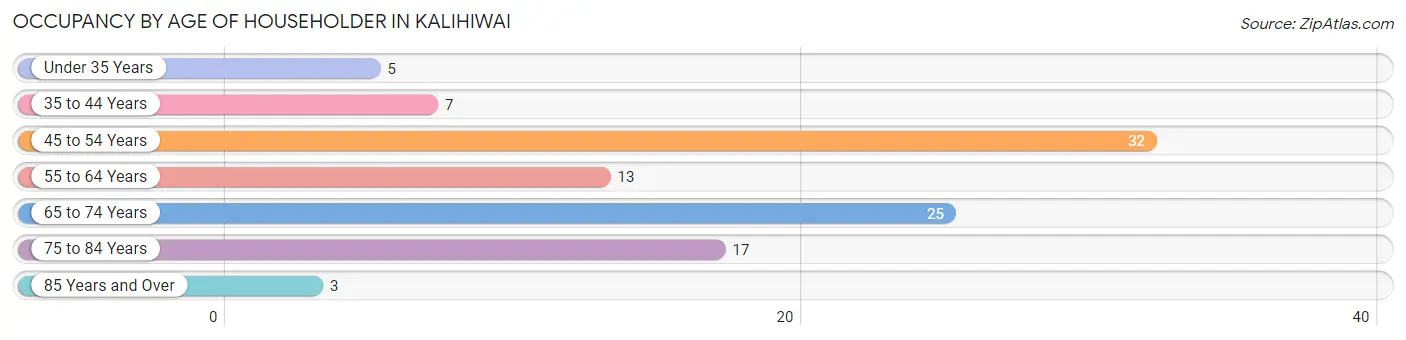
| Age Bracket | # Households | % Households |
| Under 35 Years | 5 | 4.9% |
| 35 to 44 Years | 7 | 6.9% |
| 45 to 54 Years | 32 | 31.4% |
| 55 to 64 Years | 13 | 12.8% |
| 65 to 74 Years | 25 | 24.5% |
| 75 to 84 Years | 17 | 16.7% |
| 85 Years and Over | 3 | 2.9% |
| Total | 102 | 100.0% |
Housing Finances in Kalihiwai
Median Income by Occupancy in Kalihiwai
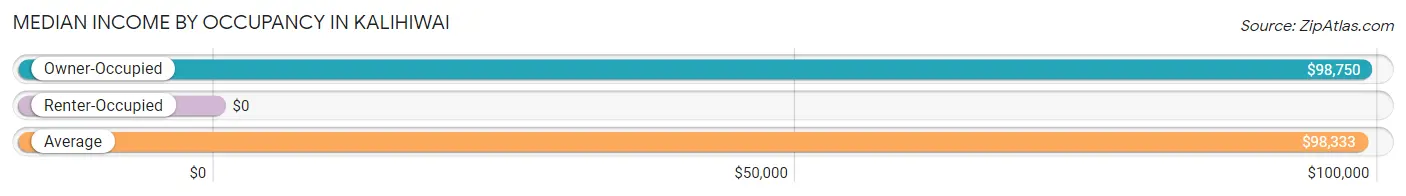
| Occupancy Type | # Households | Median Income |
| Owner-Occupied | 71 (69.6%) | $98,750 |
| Renter-Occupied | 31 (30.4%) | $0 |
| Average | 102 (100.0%) | $98,333 |
Occupancy by Householder Income Bracket in Kalihiwai
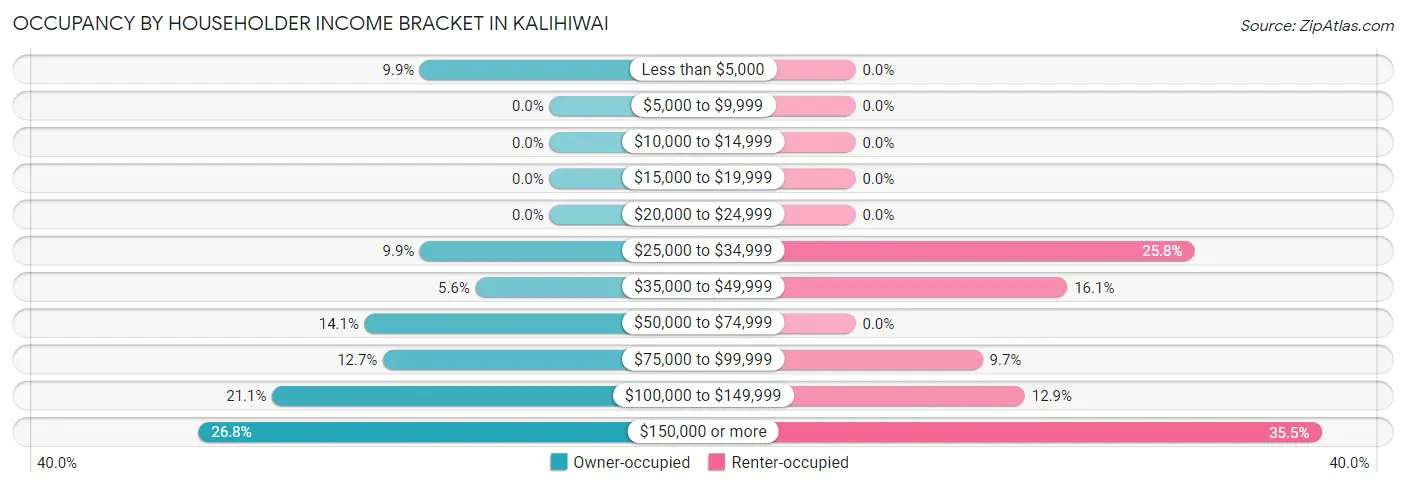
| Income Bracket | Owner-occupied | Renter-occupied |
| Less than $5,000 | 7 (9.9%) | 0 (0.0%) |
| $5,000 to $9,999 | 0 (0.0%) | 0 (0.0%) |
| $10,000 to $14,999 | 0 (0.0%) | 0 (0.0%) |
| $15,000 to $19,999 | 0 (0.0%) | 0 (0.0%) |
| $20,000 to $24,999 | 0 (0.0%) | 0 (0.0%) |
| $25,000 to $34,999 | 7 (9.9%) | 8 (25.8%) |
| $35,000 to $49,999 | 4 (5.6%) | 5 (16.1%) |
| $50,000 to $74,999 | 10 (14.1%) | 0 (0.0%) |
| $75,000 to $99,999 | 9 (12.7%) | 3 (9.7%) |
| $100,000 to $149,999 | 15 (21.1%) | 4 (12.9%) |
| $150,000 or more | 19 (26.8%) | 11 (35.5%) |
| Total | 71 (100.0%) | 31 (100.0%) |
Monthly Housing Cost Tiers in Kalihiwai
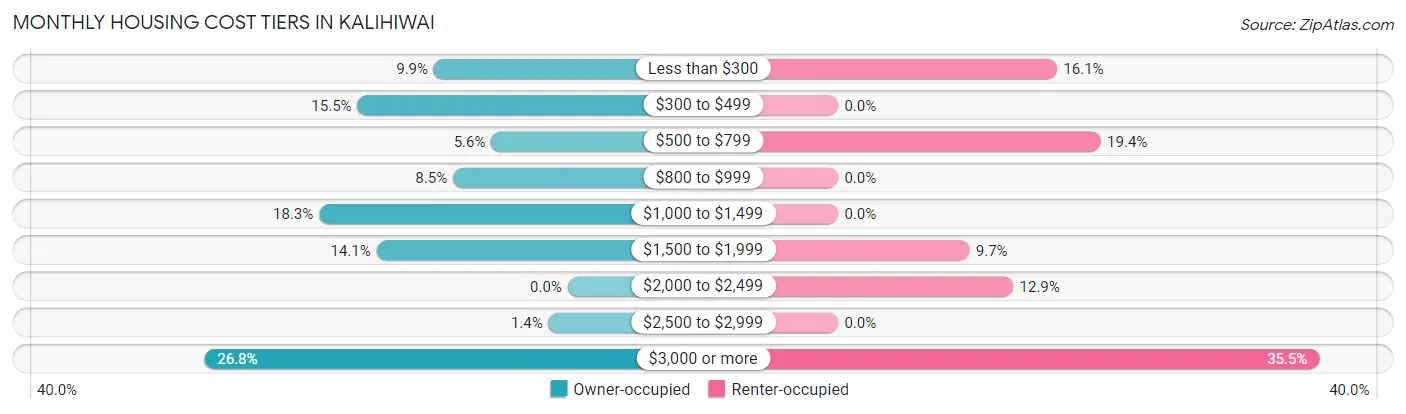
| Monthly Cost | Owner-occupied | Renter-occupied |
| Less than $300 | 7 (9.9%) | 5 (16.1%) |
| $300 to $499 | 11 (15.5%) | 0 (0.0%) |
| $500 to $799 | 4 (5.6%) | 6 (19.4%) |
| $800 to $999 | 6 (8.5%) | 0 (0.0%) |
| $1,000 to $1,499 | 13 (18.3%) | 0 (0.0%) |
| $1,500 to $1,999 | 10 (14.1%) | 3 (9.7%) |
| $2,000 to $2,499 | 0 (0.0%) | 4 (12.9%) |
| $2,500 to $2,999 | 1 (1.4%) | 0 (0.0%) |
| $3,000 or more | 19 (26.8%) | 11 (35.5%) |
| Total | 71 (100.0%) | 31 (100.0%) |
Physical Housing Characteristics in Kalihiwai
Housing Structures in Kalihiwai
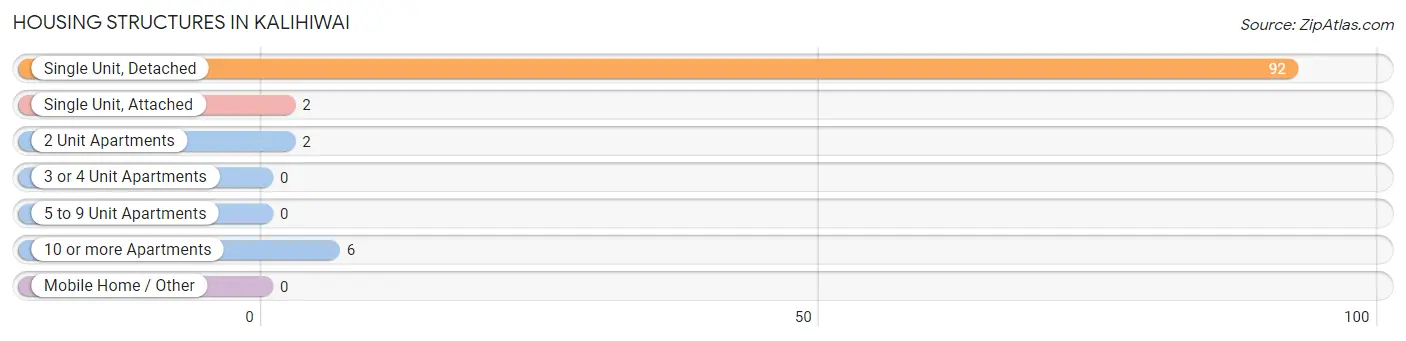
| Structure Type | # Housing Units | % Housing Units |
| Single Unit, Detached | 92 | 90.2% |
| Single Unit, Attached | 2 | 2.0% |
| 2 Unit Apartments | 2 | 2.0% |
| 3 or 4 Unit Apartments | 0 | 0.0% |
| 5 to 9 Unit Apartments | 0 | 0.0% |
| 10 or more Apartments | 6 | 5.9% |
| Mobile Home / Other | 0 | 0.0% |
| Total | 102 | 100.0% |
Housing Structures by Occupancy in Kalihiwai
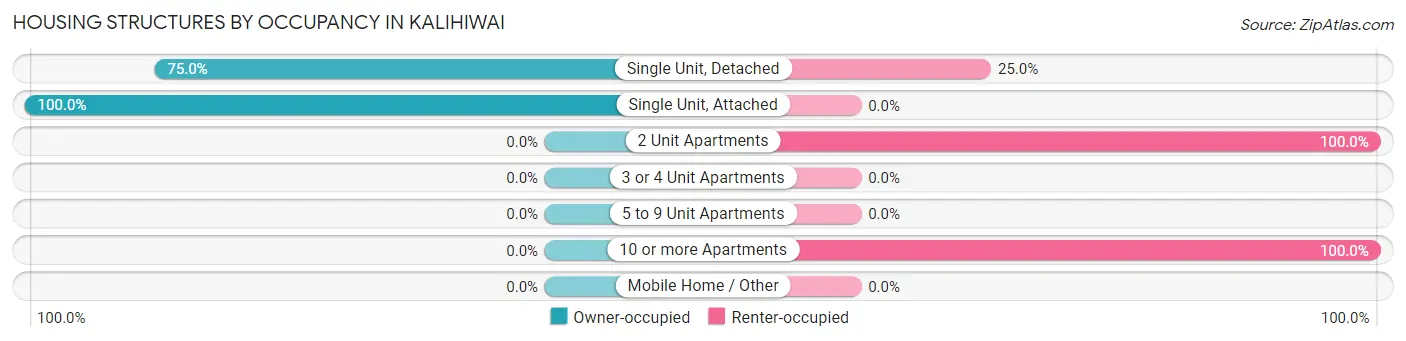
| Structure Type | Owner-occupied | Renter-occupied |
| Single Unit, Detached | 69 (75.0%) | 23 (25.0%) |
| Single Unit, Attached | 2 (100.0%) | 0 (0.0%) |
| 2 Unit Apartments | 0 (0.0%) | 2 (100.0%) |
| 3 or 4 Unit Apartments | 0 (0.0%) | 0 (0.0%) |
| 5 to 9 Unit Apartments | 0 (0.0%) | 0 (0.0%) |
| 10 or more Apartments | 0 (0.0%) | 6 (100.0%) |
| Mobile Home / Other | 0 (0.0%) | 0 (0.0%) |
| Total | 71 (69.6%) | 31 (30.4%) |
Housing Structures by Number of Rooms in Kalihiwai
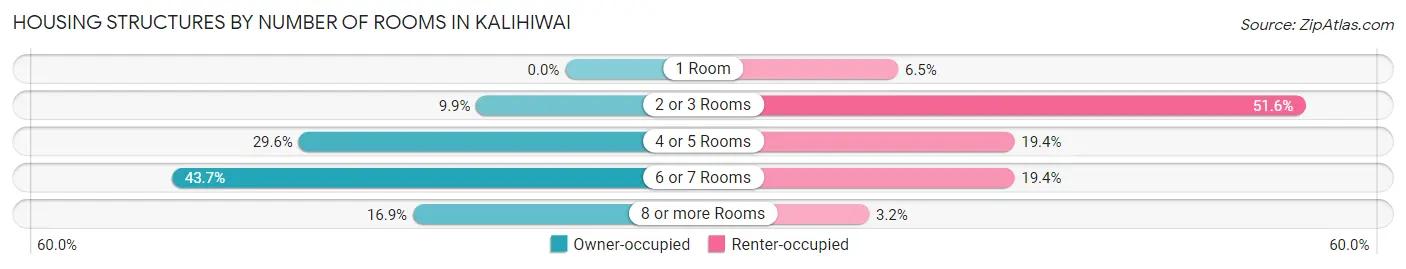
| Number of Rooms | Owner-occupied | Renter-occupied |
| 1 Room | 0 (0.0%) | 2 (6.5%) |
| 2 or 3 Rooms | 7 (9.9%) | 16 (51.6%) |
| 4 or 5 Rooms | 21 (29.6%) | 6 (19.4%) |
| 6 or 7 Rooms | 31 (43.7%) | 6 (19.4%) |
| 8 or more Rooms | 12 (16.9%) | 1 (3.2%) |
| Total | 71 (100.0%) | 31 (100.0%) |
Housing Structure by Heating Type in Kalihiwai
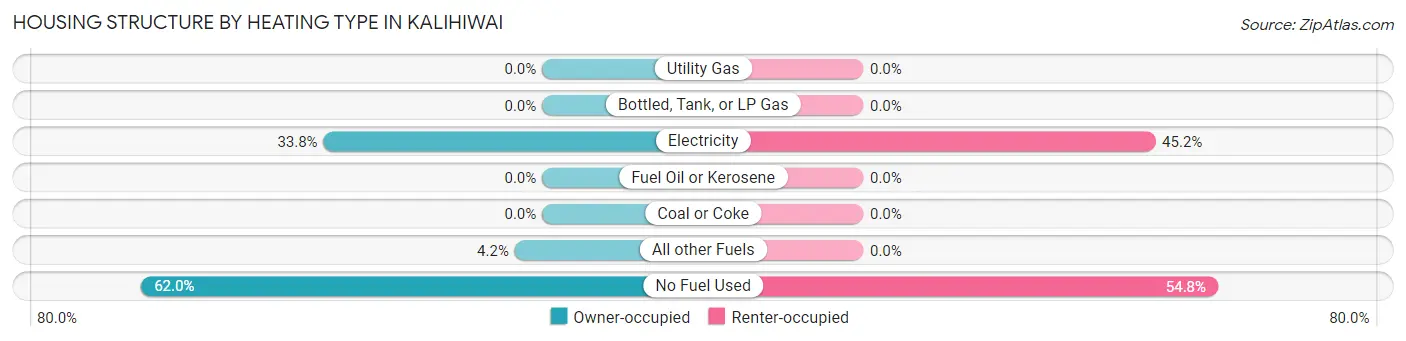
| Heating Type | Owner-occupied | Renter-occupied |
| Utility Gas | 0 (0.0%) | 0 (0.0%) |
| Bottled, Tank, or LP Gas | 0 (0.0%) | 0 (0.0%) |
| Electricity | 24 (33.8%) | 14 (45.2%) |
| Fuel Oil or Kerosene | 0 (0.0%) | 0 (0.0%) |
| Coal or Coke | 0 (0.0%) | 0 (0.0%) |
| All other Fuels | 3 (4.2%) | 0 (0.0%) |
| No Fuel Used | 44 (62.0%) | 17 (54.8%) |
| Total | 71 (100.0%) | 31 (100.0%) |
Household Vehicle Usage in Kalihiwai
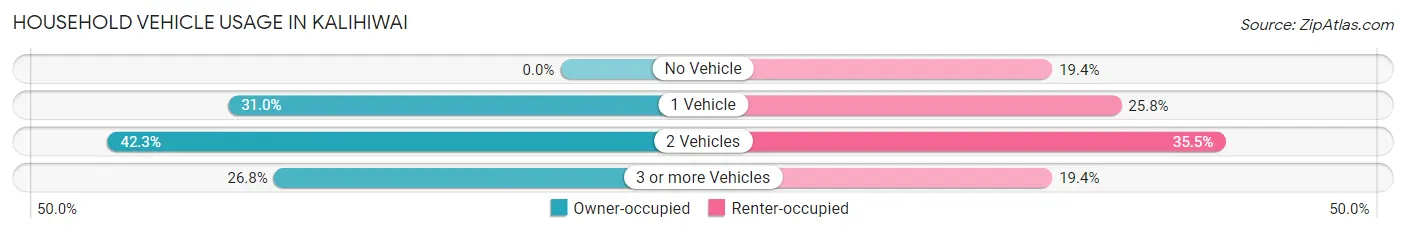
| Vehicles per Household | Owner-occupied | Renter-occupied |
| No Vehicle | 0 (0.0%) | 6 (19.4%) |
| 1 Vehicle | 22 (31.0%) | 8 (25.8%) |
| 2 Vehicles | 30 (42.2%) | 11 (35.5%) |
| 3 or more Vehicles | 19 (26.8%) | 6 (19.4%) |
| Total | 71 (100.0%) | 31 (100.0%) |
Real Estate & Mortgages in Kalihiwai
Real Estate and Mortgage Overview in Kalihiwai
| Characteristic | Without Mortgage | With Mortgage |
| Housing Units | 45 | 26 |
| Median Property Value | $1,656,300 | $0 |
| Median Household Income | $94,583 | $10 |
| Monthly Housing Costs | $808 | $19 |
| Real Estate Taxes | $2,967 | $0 |
Property Value by Mortgage Status in Kalihiwai
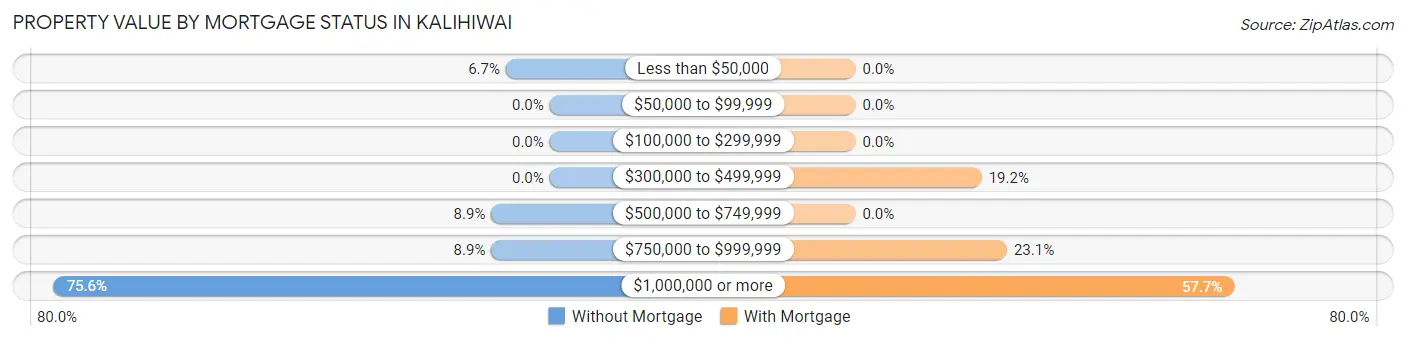
| Property Value | Without Mortgage | With Mortgage |
| Less than $50,000 | 3 (6.7%) | 0 (0.0%) |
| $50,000 to $99,999 | 0 (0.0%) | 0 (0.0%) |
| $100,000 to $299,999 | 0 (0.0%) | 0 (0.0%) |
| $300,000 to $499,999 | 0 (0.0%) | 5 (19.2%) |
| $500,000 to $749,999 | 4 (8.9%) | 0 (0.0%) |
| $750,000 to $999,999 | 4 (8.9%) | 6 (23.1%) |
| $1,000,000 or more | 34 (75.6%) | 15 (57.7%) |
| Total | 45 (100.0%) | 26 (100.0%) |
Household Income by Mortgage Status in Kalihiwai
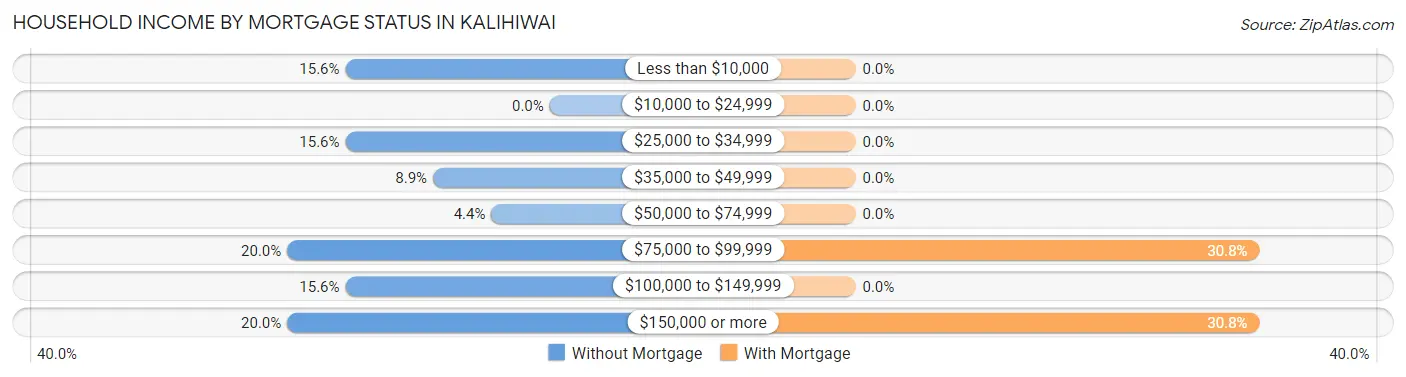
| Household Income | Without Mortgage | With Mortgage |
| Less than $10,000 | 7 (15.6%) | 0 (0.0%) |
| $10,000 to $24,999 | 0 (0.0%) | 0 (0.0%) |
| $25,000 to $34,999 | 7 (15.6%) | 0 (0.0%) |
| $35,000 to $49,999 | 4 (8.9%) | 0 (0.0%) |
| $50,000 to $74,999 | 2 (4.4%) | 0 (0.0%) |
| $75,000 to $99,999 | 9 (20.0%) | 8 (30.8%) |
| $100,000 to $149,999 | 7 (15.6%) | 0 (0.0%) |
| $150,000 or more | 9 (20.0%) | 8 (30.8%) |
| Total | 45 (100.0%) | 26 (100.0%) |
Property Value to Household Income Ratio in Kalihiwai
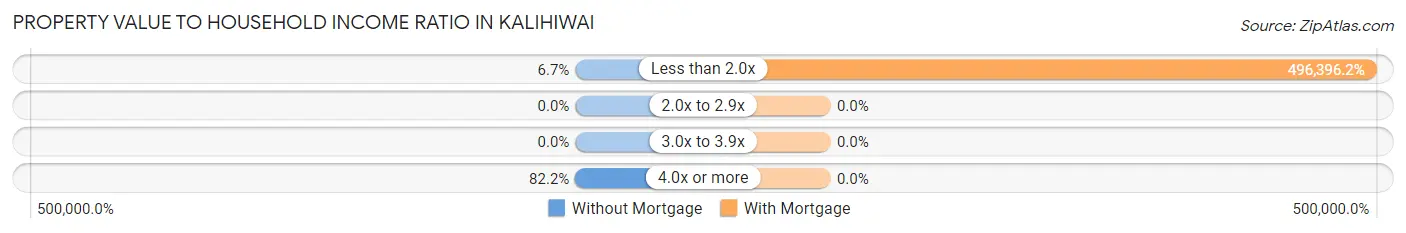
| Value-to-Income Ratio | Without Mortgage | With Mortgage |
| Less than 2.0x | 3 (6.7%) | 129,063 (496,396.2%) |
| 2.0x to 2.9x | 0 (0.0%) | 0 (0.0%) |
| 3.0x to 3.9x | 0 (0.0%) | 0 (0.0%) |
| 4.0x or more | 37 (82.2%) | 0 (0.0%) |
| Total | 45 (100.0%) | 26 (100.0%) |
Real Estate Taxes by Mortgage Status in Kalihiwai
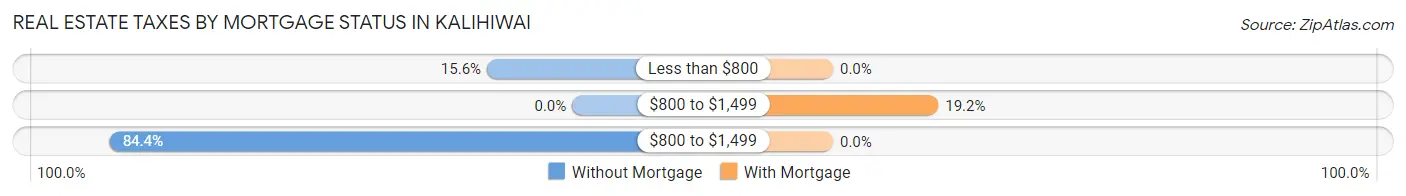
| Property Taxes | Without Mortgage | With Mortgage |
| Less than $800 | 7 (15.6%) | 0 (0.0%) |
| $800 to $1,499 | 0 (0.0%) | 5 (19.2%) |
| $800 to $1,499 | 38 (84.4%) | 0 (0.0%) |
| Total | 45 (100.0%) | 26 (100.0%) |
Health & Disability in Kalihiwai
Health Insurance Coverage by Age in Kalihiwai
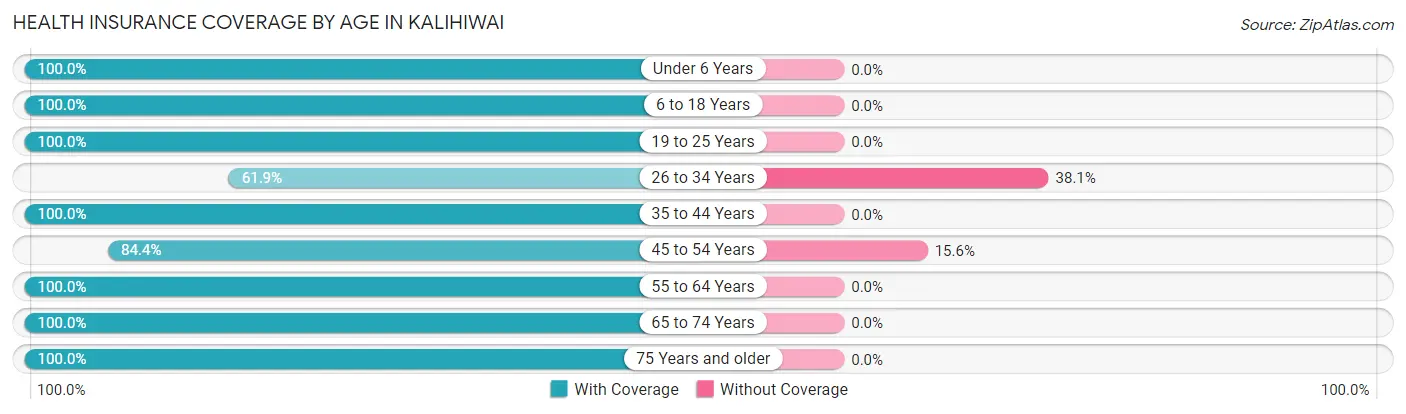
| Age Bracket | With Coverage | Without Coverage |
| Under 6 Years | 14 (100.0%) | 0 (0.0%) |
| 6 to 18 Years | 28 (100.0%) | 0 (0.0%) |
| 19 to 25 Years | 8 (100.0%) | 0 (0.0%) |
| 26 to 34 Years | 13 (61.9%) | 8 (38.1%) |
| 35 to 44 Years | 25 (100.0%) | 0 (0.0%) |
| 45 to 54 Years | 38 (84.4%) | 7 (15.6%) |
| 55 to 64 Years | 38 (100.0%) | 0 (0.0%) |
| 65 to 74 Years | 49 (100.0%) | 0 (0.0%) |
| 75 Years and older | 28 (100.0%) | 0 (0.0%) |
| Total | 241 (94.1%) | 15 (5.9%) |
Health Insurance Coverage by Citizenship Status in Kalihiwai
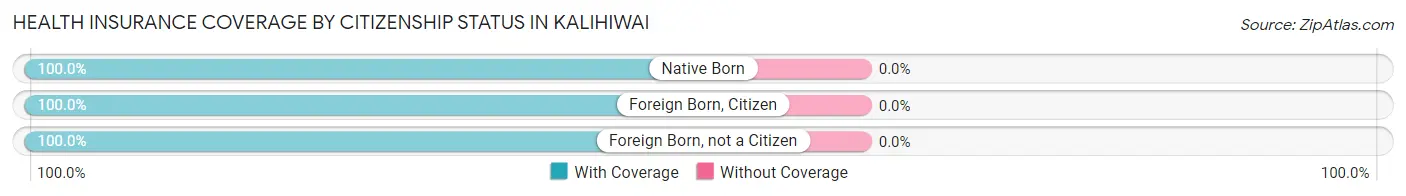
| Citizenship Status | With Coverage | Without Coverage |
| Native Born | 14 (100.0%) | 0 (0.0%) |
| Foreign Born, Citizen | 28 (100.0%) | 0 (0.0%) |
| Foreign Born, not a Citizen | 8 (100.0%) | 0 (0.0%) |
Health Insurance Coverage by Household Income in Kalihiwai
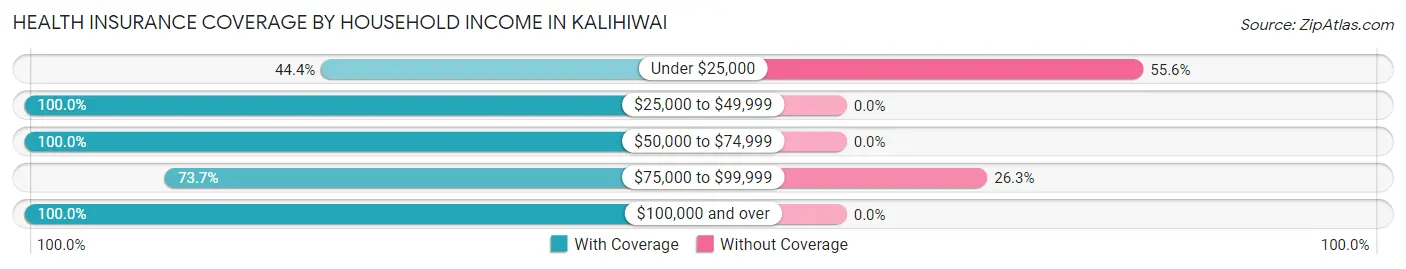
| Household Income | With Coverage | Without Coverage |
| Under $25,000 | 4 (44.4%) | 5 (55.6%) |
| $25,000 to $49,999 | 26 (100.0%) | 0 (0.0%) |
| $50,000 to $74,999 | 30 (100.0%) | 0 (0.0%) |
| $75,000 to $99,999 | 28 (73.7%) | 10 (26.3%) |
| $100,000 and over | 153 (100.0%) | 0 (0.0%) |
Public vs Private Health Insurance Coverage by Age in Kalihiwai
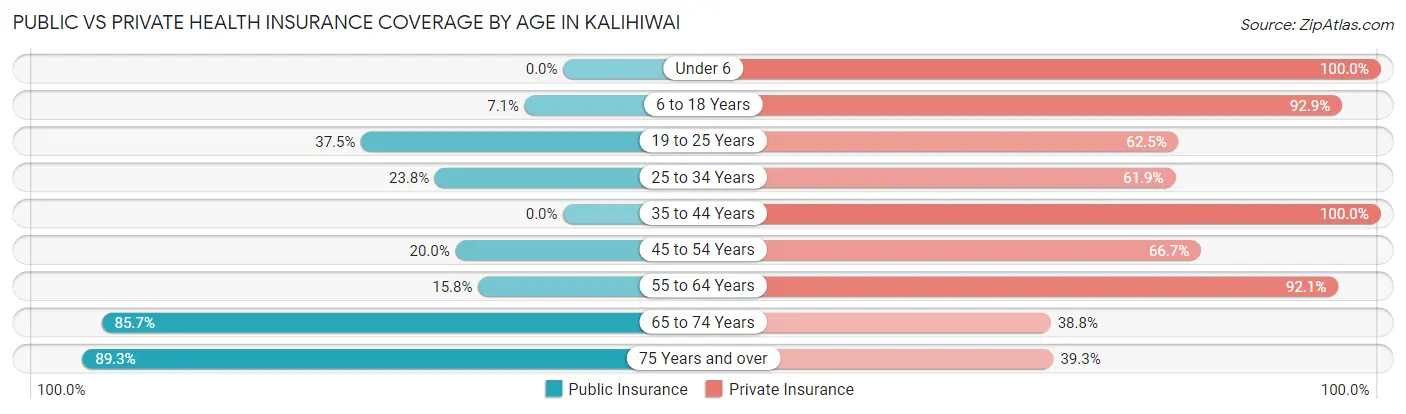
| Age Bracket | Public Insurance | Private Insurance |
| Under 6 | 0 (0.0%) | 14 (100.0%) |
| 6 to 18 Years | 2 (7.1%) | 26 (92.9%) |
| 19 to 25 Years | 3 (37.5%) | 5 (62.5%) |
| 25 to 34 Years | 5 (23.8%) | 13 (61.9%) |
| 35 to 44 Years | 0 (0.0%) | 25 (100.0%) |
| 45 to 54 Years | 9 (20.0%) | 30 (66.7%) |
| 55 to 64 Years | 6 (15.8%) | 35 (92.1%) |
| 65 to 74 Years | 42 (85.7%) | 19 (38.8%) |
| 75 Years and over | 25 (89.3%) | 11 (39.3%) |
| Total | 92 (35.9%) | 178 (69.5%) |
Disability Status by Sex by Age in Kalihiwai
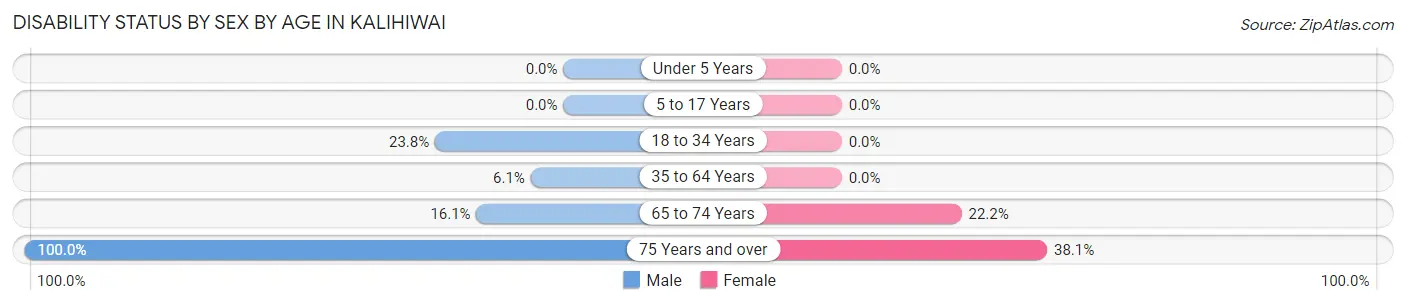
| Age Bracket | Male | Female |
| Under 5 Years | 0 (0.0%) | 0 (0.0%) |
| 5 to 17 Years | 0 (0.0%) | 0 (0.0%) |
| 18 to 34 Years | 10 (23.8%) | 0 (0.0%) |
| 35 to 64 Years | 4 (6.1%) | 0 (0.0%) |
| 65 to 74 Years | 5 (16.1%) | 4 (22.2%) |
| 75 Years and over | 7 (100.0%) | 8 (38.1%) |
Disability Class by Sex by Age in Kalihiwai
Disability Class: Hearing Difficulty
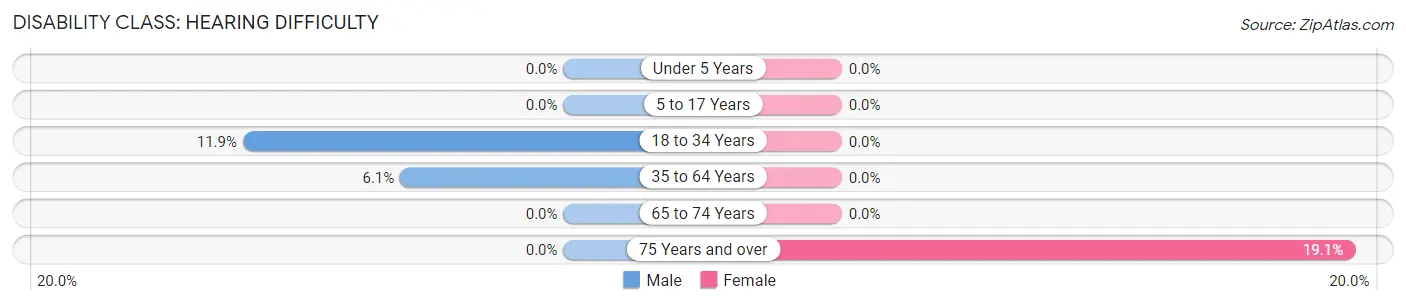
| Age Bracket | Male | Female |
| Under 5 Years | 0 (0.0%) | 0 (0.0%) |
| 5 to 17 Years | 0 (0.0%) | 0 (0.0%) |
| 18 to 34 Years | 5 (11.9%) | 0 (0.0%) |
| 35 to 64 Years | 4 (6.1%) | 0 (0.0%) |
| 65 to 74 Years | 0 (0.0%) | 0 (0.0%) |
| 75 Years and over | 0 (0.0%) | 4 (19.1%) |
Disability Class: Vision Difficulty
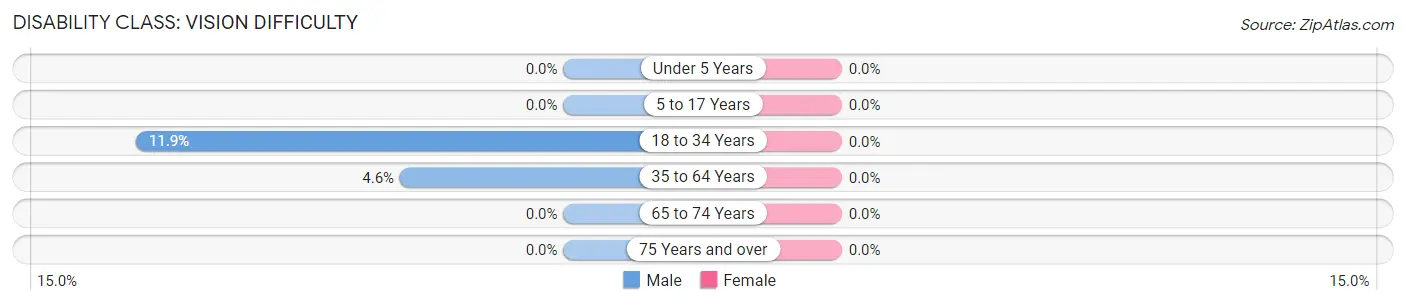
| Age Bracket | Male | Female |
| Under 5 Years | 0 (0.0%) | 0 (0.0%) |
| 5 to 17 Years | 0 (0.0%) | 0 (0.0%) |
| 18 to 34 Years | 5 (11.9%) | 0 (0.0%) |
| 35 to 64 Years | 3 (4.5%) | 0 (0.0%) |
| 65 to 74 Years | 0 (0.0%) | 0 (0.0%) |
| 75 Years and over | 0 (0.0%) | 0 (0.0%) |
Disability Class: Cognitive Difficulty
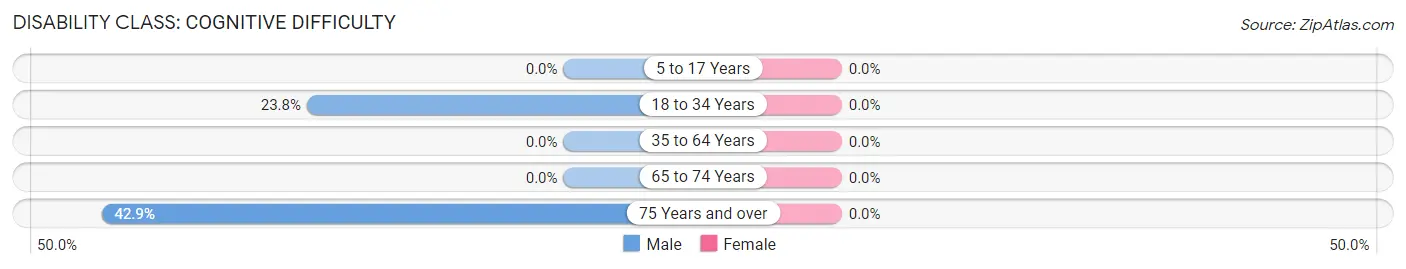
| Age Bracket | Male | Female |
| 5 to 17 Years | 0 (0.0%) | 0 (0.0%) |
| 18 to 34 Years | 10 (23.8%) | 0 (0.0%) |
| 35 to 64 Years | 0 (0.0%) | 0 (0.0%) |
| 65 to 74 Years | 0 (0.0%) | 0 (0.0%) |
| 75 Years and over | 3 (42.9%) | 0 (0.0%) |
Disability Class: Ambulatory Difficulty
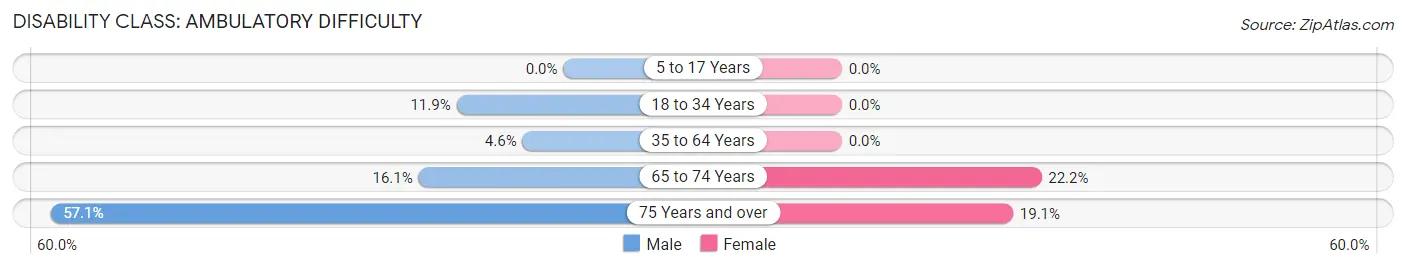
| Age Bracket | Male | Female |
| 5 to 17 Years | 0 (0.0%) | 0 (0.0%) |
| 18 to 34 Years | 5 (11.9%) | 0 (0.0%) |
| 35 to 64 Years | 3 (4.5%) | 0 (0.0%) |
| 65 to 74 Years | 5 (16.1%) | 4 (22.2%) |
| 75 Years and over | 4 (57.1%) | 4 (19.1%) |
Disability Class: Self-Care Difficulty
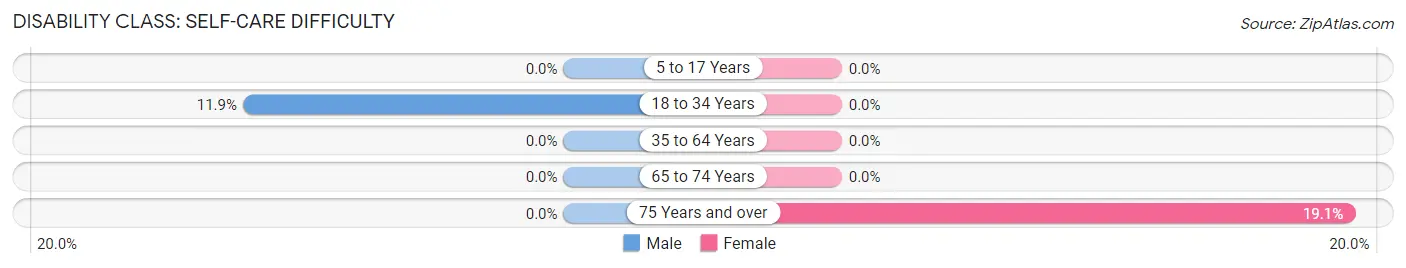
| Age Bracket | Male | Female |
| 5 to 17 Years | 0 (0.0%) | 0 (0.0%) |
| 18 to 34 Years | 5 (11.9%) | 0 (0.0%) |
| 35 to 64 Years | 0 (0.0%) | 0 (0.0%) |
| 65 to 74 Years | 0 (0.0%) | 0 (0.0%) |
| 75 Years and over | 0 (0.0%) | 4 (19.1%) |
Technology Access in Kalihiwai
Computing Device Access in Kalihiwai
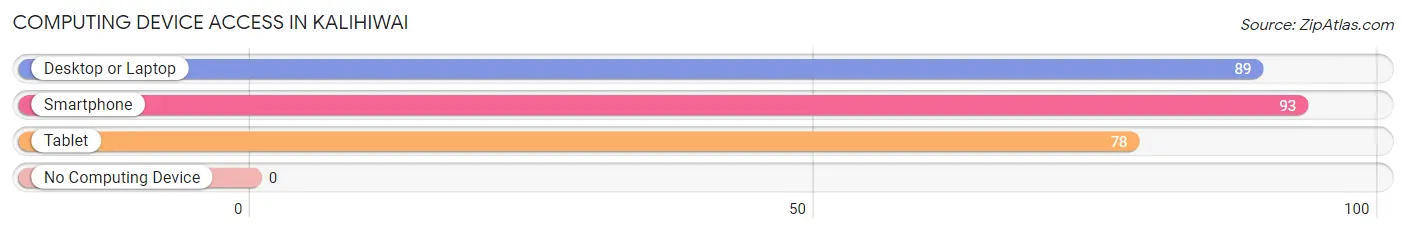
| Device Type | # Households | % Households |
| Desktop or Laptop | 89 | 87.3% |
| Smartphone | 93 | 91.2% |
| Tablet | 78 | 76.5% |
| No Computing Device | 0 | 0.0% |
| Total | 102 | 100.0% |
Internet Access in Kalihiwai
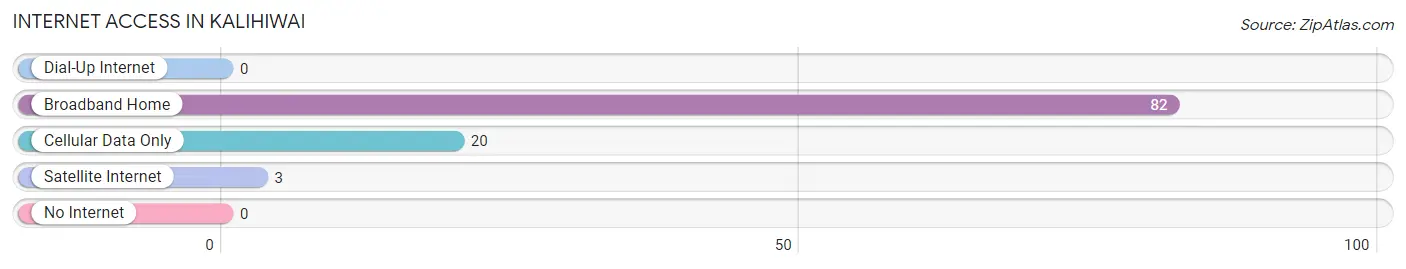
| Internet Type | # Households | % Households |
| Dial-Up Internet | 0 | 0.0% |
| Broadband Home | 82 | 80.4% |
| Cellular Data Only | 20 | 19.6% |
| Satellite Internet | 3 | 2.9% |
| No Internet | 0 | 0.0% |
| Total | 102 | 100.0% |
Kalihiwai Summary
Kalihiwai is a small unincorporated community located on the north shore of Kauai, Hawaii. It is situated between the towns of Kilauea and Princeville, and is part of the Kauai County. The population of Kalihiwai was estimated to be around 1,000 people in 2020.
History
Kalihiwai was originally settled by Native Hawaiians in the late 1700s. The area was used for fishing and farming, and the community was known for its abundance of taro and sweet potatoes. In the early 1800s, the area was also used for cattle ranching.
In the late 1800s, Kalihiwai was home to a sugar plantation. The plantation was owned by the Kalihiwai Plantation Company, which was founded in 1891. The plantation was one of the largest on Kauai, and employed hundreds of workers. The plantation was eventually sold to the Hawaiian Sugar Company in the early 1900s.
In the early 1900s, Kalihiwai was also home to a large Japanese community. The Japanese immigrants were mostly farmers and fishermen, and they established a thriving community in the area.
Geography
Kalihiwai is located on the north shore of Kauai, Hawaii. It is situated between the towns of Kilauea and Princeville, and is part of the Kauai County. The area is known for its lush tropical vegetation and stunning views of the Pacific Ocean.
The climate in Kalihiwai is tropical, with temperatures ranging from the mid-70s to the mid-80s throughout the year. The area receives an average of about 20 inches of rain per year.
Economy
The economy of Kalihiwai is largely based on tourism. The area is home to several resorts and hotels, as well as a variety of restaurants and shops. The area is also popular with surfers, and there are several surf schools in the area.
In addition to tourism, Kalihiwai is also home to a number of small businesses. These include a variety of retail stores, restaurants, and other services.
Demographics
The population of Kalihiwai was estimated to be around 1,000 people in 2020. The majority of the population is of Native Hawaiian descent, followed by Asian and Pacific Islander. The median household income in Kalihiwai is around $50,000, and the median age is around 40 years old.
Conclusion
Kalihiwai is a small unincorporated community located on the north shore of Kauai, Hawaii. It is known for its lush tropical vegetation and stunning views of the Pacific Ocean. The economy of Kalihiwai is largely based on tourism, and the population is mostly of Native Hawaiian descent. The median household income in Kalihiwai is around $50,000, and the median age is around 40 years old.
Common Questions
What is Per Capita Income in Kalihiwai?
Per Capita income in Kalihiwai is $57,591.
What is the Median Family Income in Kalihiwai?
Median Family Income in Kalihiwai is $119,167.
What is the Median Household income in Kalihiwai?
Median Household Income in Kalihiwai is $98,333.
What is Income or Wage Gap in Kalihiwai?
Income or Wage Gap in Kalihiwai is 55.5%.
Women in Kalihiwai earn 44.5 cents for every dollar earned by a man.
What is Inequality or Gini Index in Kalihiwai?
Inequality or Gini Index in Kalihiwai is 0.44.
What is the Total Population of Kalihiwai?
Total Population of Kalihiwai is 256.
What is the Total Male Population of Kalihiwai?
Total Male Population of Kalihiwai is 171.
What is the Total Female Population of Kalihiwai?
Total Female Population of Kalihiwai is 85.
What is the Ratio of Males per 100 Females in Kalihiwai?
There are 201.18 Males per 100 Females in Kalihiwai.
What is the Ratio of Females per 100 Males in Kalihiwai?
There are 49.71 Females per 100 Males in Kalihiwai.
What is the Median Population Age in Kalihiwai?
Median Population Age in Kalihiwai is 51.6 Years.
What is the Average Family Size in Kalihiwai
Average Family Size in Kalihiwai is 3.5 People.
What is the Average Household Size in Kalihiwai
Average Household Size in Kalihiwai is 2.5 People.
How Large is the Labor Force in Kalihiwai?
There are 124 People in the Labor Forcein in Kalihiwai.
What is the Percentage of People in the Labor Force in Kalihiwai?
54.1% of People are in the Labor Force in Kalihiwai.
What is the Unemployment Rate in Kalihiwai?
Unemployment Rate in Kalihiwai is 8.1%.