Pahoa, HI Map & Demographics
Pahoa Map
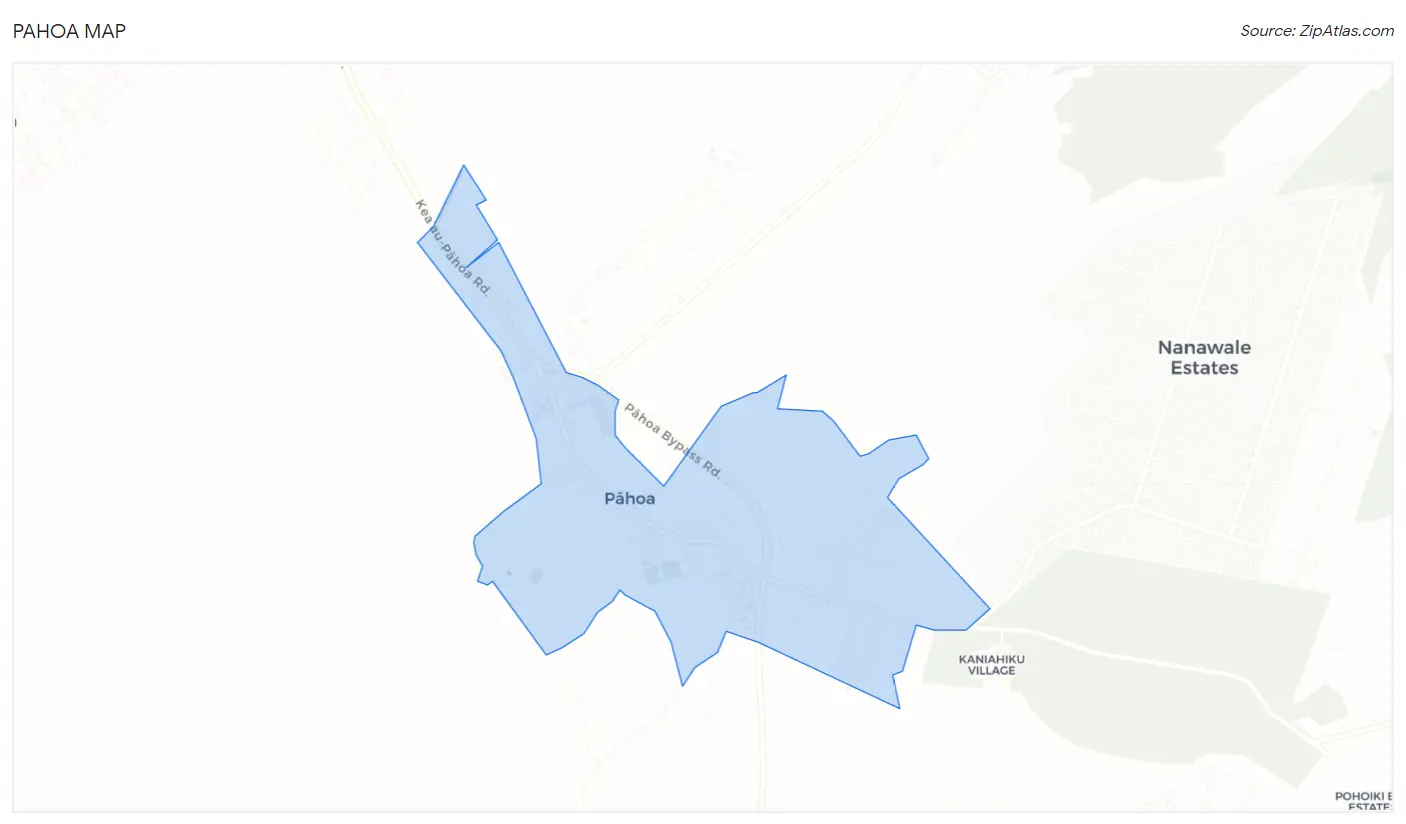
Pahoa Overview
$22,070
PER CAPITA INCOME
$53,031
AVG FAMILY INCOME
$54,486
AVG HOUSEHOLD INCOME
0.46
INEQUALITY / GINI INDEX
1,372
TOTAL POPULATION
693
MALE POPULATION
679
FEMALE POPULATION
102.06
MALES / 100 FEMALES
97.98
FEMALES / 100 MALES
47.4
MEDIAN AGE
3.0
AVG FAMILY SIZE
3.2
AVG HOUSEHOLD SIZE
591
LABOR FORCE [ PEOPLE ]
51.2%
PERCENT IN LABOR FORCE
8.6%
UNEMPLOYMENT RATE
Pahoa Zip Codes
Pahoa Area Codes
Income in Pahoa
Income Overview in Pahoa
Per Capita Income in Pahoa is $22,070, while median incomes of families and households are $53,031 and $54,486 respectively.
| Characteristic | Number | Measure |
| Per Capita Income | 1,372 | $22,070 |
| Median Family Income | 373 | $53,031 |
| Mean Family Income | 373 | $72,255 |
| Median Household Income | 424 | $54,486 |
| Mean Household Income | 424 | $72,664 |
| Income Deficit | 373 | $0 |
| Wage / Income Gap (%) | 1,372 | 0.00% |
| Wage / Income Gap ($) | 1,372 | 100.00¢ per $1 |
| Gini / Inequality Index | 1,372 | 0.46 |
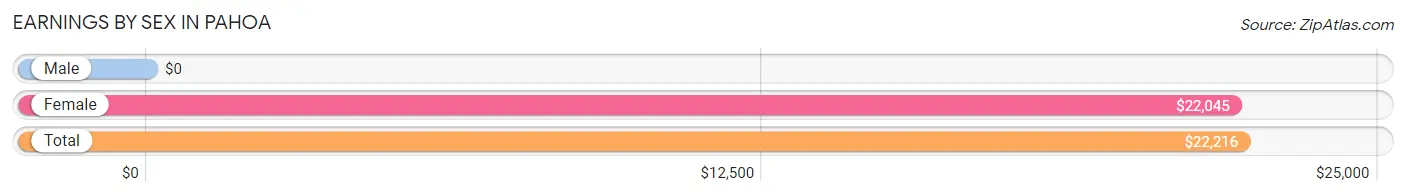
Earnings by Sex in Pahoa
| Sex | Number | Average Earnings |
| Male | 330 (53.6%) | $0 |
| Female | 286 (46.4%) | $22,045 |
| Total | 616 (100.0%) | $22,216 |
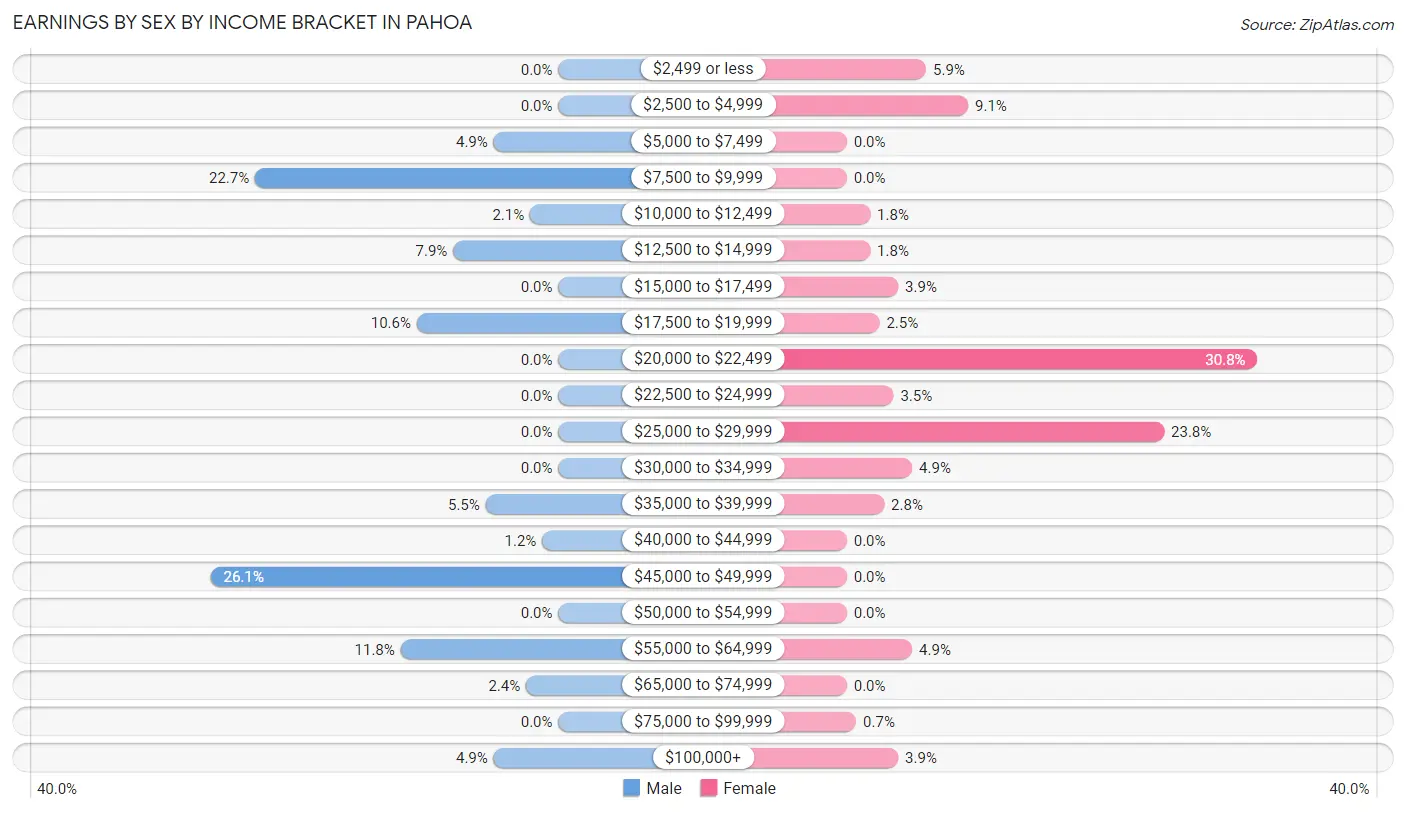
Earnings by Sex by Income Bracket in Pahoa
The most common earnings brackets in Pahoa are $45,000 to $49,999 for men (86 | 26.1%) and $20,000 to $22,499 for women (88 | 30.8%).
| Income | Male | Female |
| $2,499 or less | 0 (0.0%) | 17 (5.9%) |
| $2,500 to $4,999 | 0 (0.0%) | 26 (9.1%) |
| $5,000 to $7,499 | 16 (4.9%) | 0 (0.0%) |
| $7,500 to $9,999 | 75 (22.7%) | 0 (0.0%) |
| $10,000 to $12,499 | 7 (2.1%) | 5 (1.8%) |
| $12,500 to $14,999 | 26 (7.9%) | 5 (1.8%) |
| $15,000 to $17,499 | 0 (0.0%) | 11 (3.8%) |
| $17,500 to $19,999 | 35 (10.6%) | 7 (2.5%) |
| $20,000 to $22,499 | 0 (0.0%) | 88 (30.8%) |
| $22,500 to $24,999 | 0 (0.0%) | 10 (3.5%) |
| $25,000 to $29,999 | 0 (0.0%) | 68 (23.8%) |
| $30,000 to $34,999 | 0 (0.0%) | 14 (4.9%) |
| $35,000 to $39,999 | 18 (5.4%) | 8 (2.8%) |
| $40,000 to $44,999 | 4 (1.2%) | 0 (0.0%) |
| $45,000 to $49,999 | 86 (26.1%) | 0 (0.0%) |
| $50,000 to $54,999 | 0 (0.0%) | 0 (0.0%) |
| $55,000 to $64,999 | 39 (11.8%) | 14 (4.9%) |
| $65,000 to $74,999 | 8 (2.4%) | 0 (0.0%) |
| $75,000 to $99,999 | 0 (0.0%) | 2 (0.7%) |
| $100,000+ | 16 (4.9%) | 11 (3.8%) |
| Total | 330 (100.0%) | 286 (100.0%) |
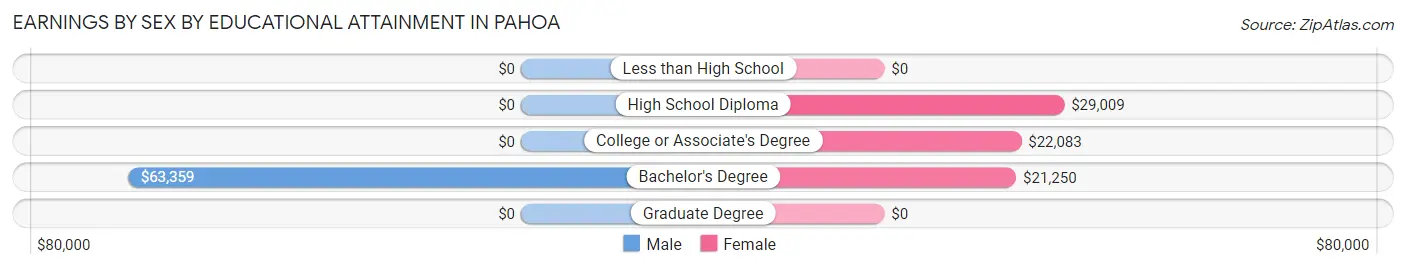
Earnings by Sex by Educational Attainment in Pahoa
Average earnings in Pahoa are $36,667 for men and $22,202 for women, a difference of 39.5%. Men with an educational attainment of bachelor's degree enjoy the highest average annual earnings of $63,359, while those with bachelor's degree education earn the least with $63,359. Women with an educational attainment of high school diploma earn the most with the average annual earnings of $29,009, while those with bachelor's degree education have the smallest earnings of $21,250.
| Educational Attainment | Male Income | Female Income |
| Less than High School | - | - |
| High School Diploma | - | - |
| College or Associate's Degree | - | - |
| Bachelor's Degree | $63,359 | $21,250 |
| Graduate Degree | - | - |
| Total | $36,667 | $22,202 |
Family Income in Pahoa
Family Income Brackets in Pahoa
According to the Pahoa family income data, there are 115 families falling into the $50,000 to $74,999 income range, which is the most common income bracket and makes up 30.8% of all families. Conversely, the $10,000 to $14,999 income bracket is the least frequent group with only 3 families (0.8%) belonging to this category.
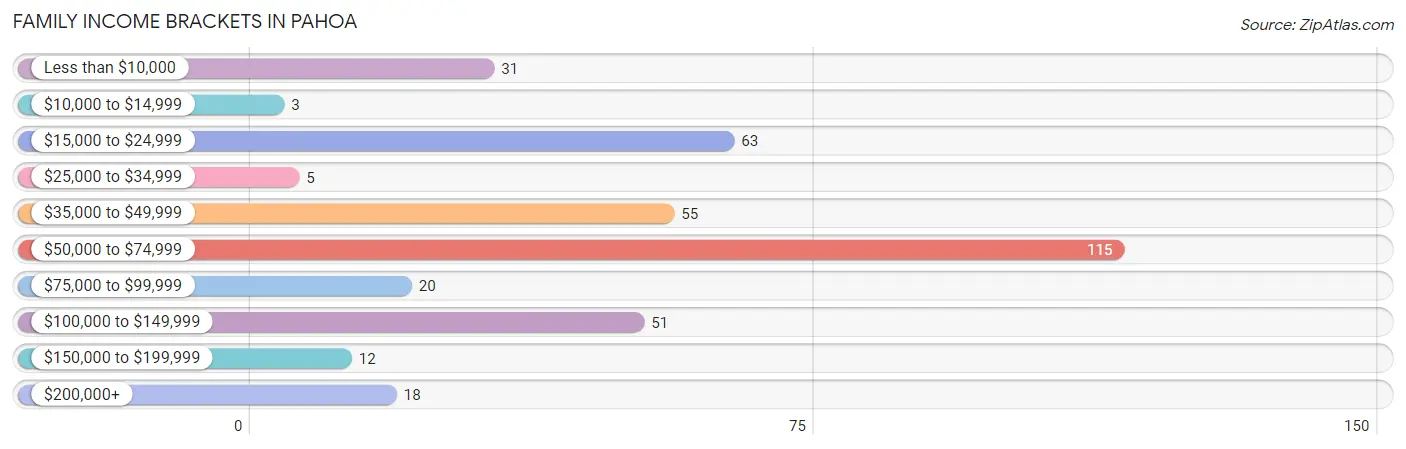
| Income Bracket | # Families | % Families |
| Less than $10,000 | 31 | 8.3% |
| $10,000 to $14,999 | 3 | 0.8% |
| $15,000 to $24,999 | 63 | 16.9% |
| $25,000 to $34,999 | 5 | 1.3% |
| $35,000 to $49,999 | 55 | 14.7% |
| $50,000 to $74,999 | 115 | 30.8% |
| $75,000 to $99,999 | 20 | 5.4% |
| $100,000 to $149,999 | 51 | 13.7% |
| $150,000 to $199,999 | 12 | 3.2% |
| $200,000+ | 18 | 4.8% |
Family Income by Famaliy Size in Pahoa
5-person families (68 | 18.2%) account for the highest median family income in Pahoa with $123,828 per family, while 2-person families (248 | 66.5%) have the highest median income of $24,953 per family member.
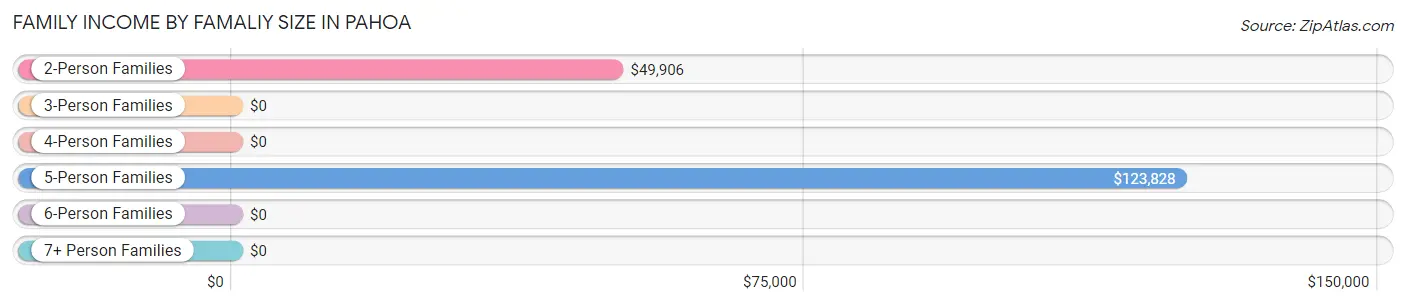
| Income Bracket | # Families | Median Income |
| 2-Person Families | 248 (66.5%) | $49,906 |
| 3-Person Families | 22 (5.9%) | $0 |
| 4-Person Families | 22 (5.9%) | $0 |
| 5-Person Families | 68 (18.2%) | $123,828 |
| 6-Person Families | 0 (0.0%) | $0 |
| 7+ Person Families | 13 (3.5%) | $0 |
| Total | 373 (100.0%) | $53,031 |
Family Income by Number of Earners in Pahoa
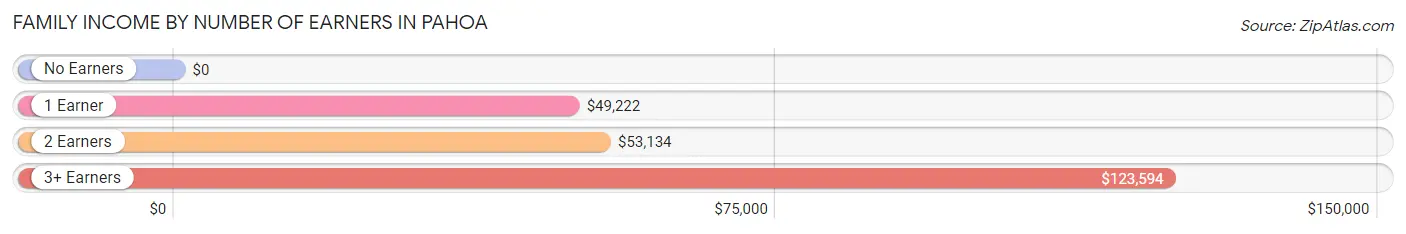
| Number of Earners | # Families | Median Income |
| No Earners | 55 (14.7%) | $0 |
| 1 Earner | 147 (39.4%) | $49,222 |
| 2 Earners | 117 (31.4%) | $53,134 |
| 3+ Earners | 54 (14.5%) | $123,594 |
| Total | 373 (100.0%) | $53,031 |
Household Income in Pahoa
Household Income Brackets in Pahoa
With 108 households falling in the category, the $50,000 to $74,999 income range is the most frequent in Pahoa, accounting for 25.5% of all households. In contrast, only 2 households (0.5%) fall into the $35,000 to $49,999 income bracket, making it the least populous group.
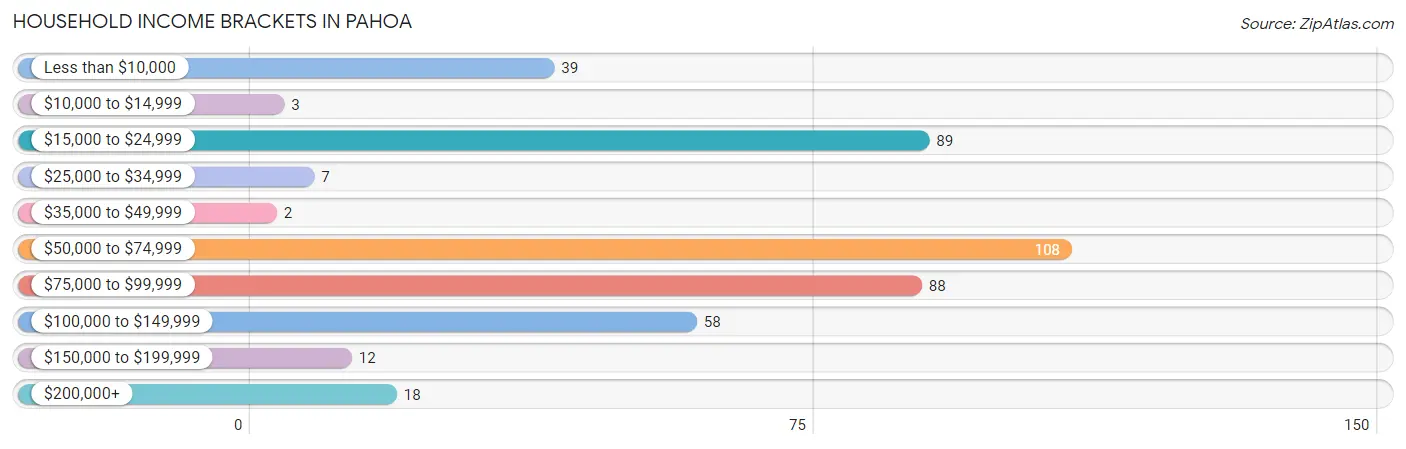
| Income Bracket | # Households | % Households |
| Less than $10,000 | 39 | 9.2% |
| $10,000 to $14,999 | 3 | 0.7% |
| $15,000 to $24,999 | 89 | 21.0% |
| $25,000 to $34,999 | 7 | 1.7% |
| $35,000 to $49,999 | 2 | 0.5% |
| $50,000 to $74,999 | 108 | 25.5% |
| $75,000 to $99,999 | 88 | 20.8% |
| $100,000 to $149,999 | 58 | 13.7% |
| $150,000 to $199,999 | 12 | 2.8% |
| $200,000+ | 18 | 4.2% |
Household Income by Householder Age in Pahoa
The median household income in Pahoa is $54,486, with the highest median household income of $75,566 found in the 45 to 64 years age bracket for the primary householder. A total of 212 households (50.0%) fall into this category.
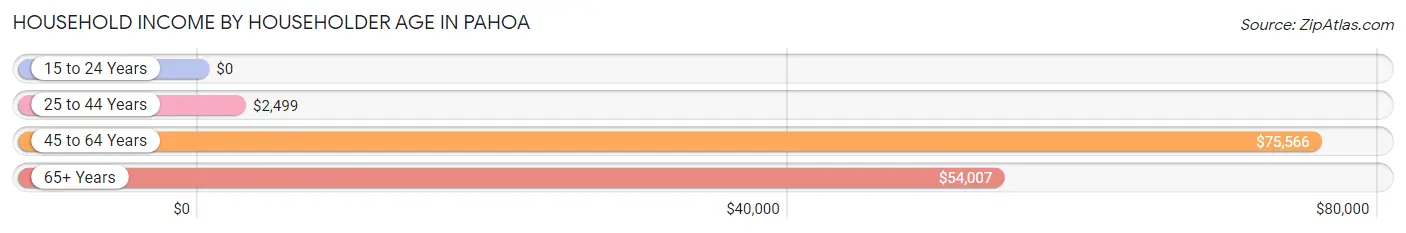
| Income Bracket | # Households | Median Income |
| 15 to 24 Years | 0 (0.0%) | $0 |
| 25 to 44 Years | 32 (7.5%) | $2,499 |
| 45 to 64 Years | 212 (50.0%) | $75,566 |
| 65+ Years | 180 (42.4%) | $54,007 |
| Total | 424 (100.0%) | $54,486 |
Poverty in Pahoa
Income Below Poverty by Sex and Age in Pahoa
With 16.9% poverty level for males and 26.8% for females among the residents of Pahoa, 35 to 44 year old males and under 5 year old females are the most vulnerable to poverty, with 16 males (51.6%) and 13 females (100.0%) in their respective age groups living below the poverty level.
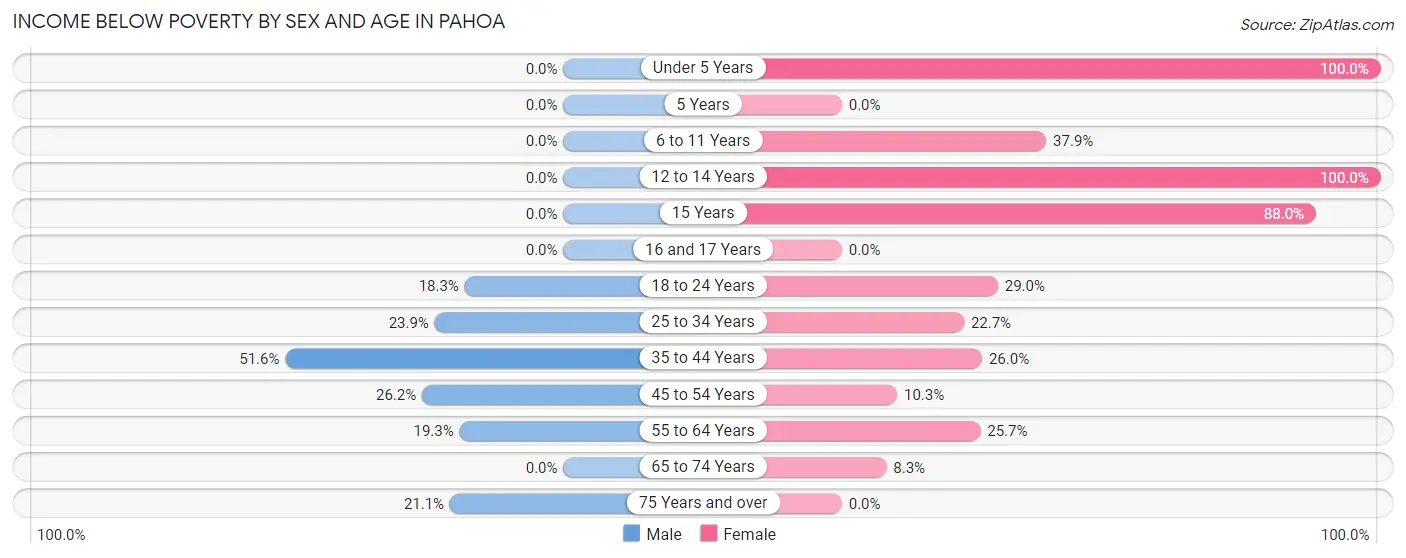
| Age Bracket | Male | Female |
| Under 5 Years | 0 (0.0%) | 13 (100.0%) |
| 5 Years | 0 (0.0%) | 0 (0.0%) |
| 6 to 11 Years | 0 (0.0%) | 11 (37.9%) |
| 12 to 14 Years | 0 (0.0%) | 24 (100.0%) |
| 15 Years | 0 (0.0%) | 44 (88.0%) |
| 16 and 17 Years | 0 (0.0%) | 0 (0.0%) |
| 18 to 24 Years | 13 (18.3%) | 11 (28.9%) |
| 25 to 34 Years | 16 (23.9%) | 17 (22.7%) |
| 35 to 44 Years | 16 (51.6%) | 32 (26.0%) |
| 45 to 54 Years | 16 (26.2%) | 8 (10.3%) |
| 55 to 64 Years | 37 (19.3%) | 9 (25.7%) |
| 65 to 74 Years | 0 (0.0%) | 11 (8.3%) |
| 75 Years and over | 12 (21.0%) | 0 (0.0%) |
| Total | 110 (16.9%) | 180 (26.8%) |
Income Above Poverty by Sex and Age in Pahoa
According to the poverty statistics in Pahoa, males aged under 5 years and females aged 16 and 17 years are the age groups that are most secure financially, with 100.0% of males and 100.0% of females in these age groups living above the poverty line.
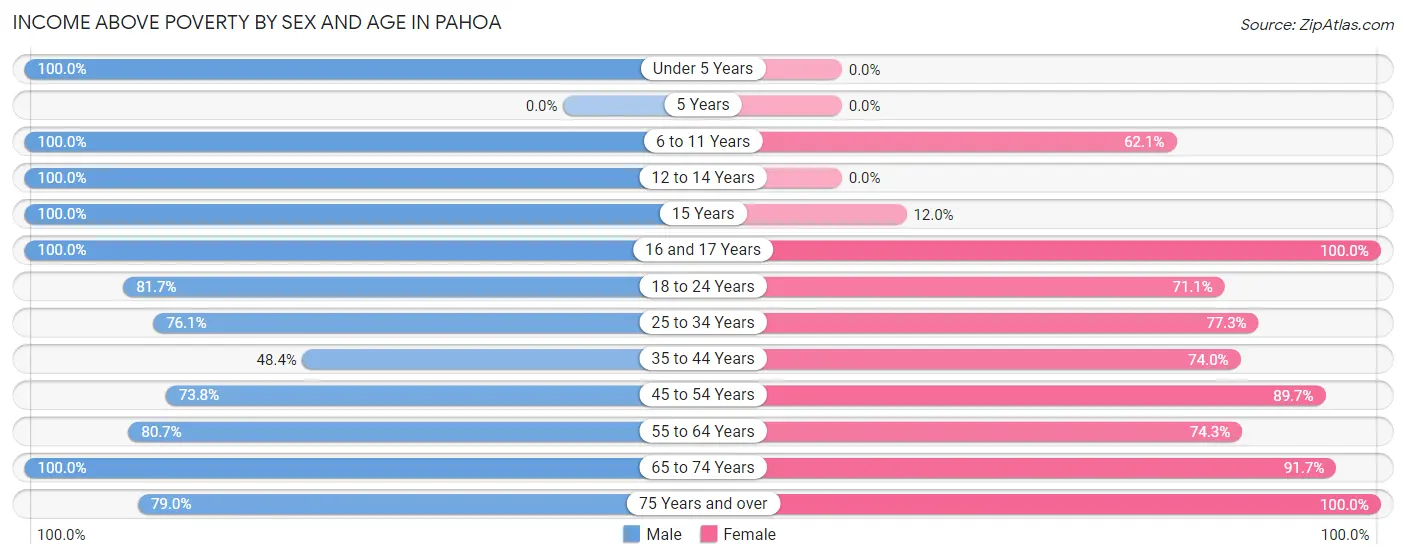
| Age Bracket | Male | Female |
| Under 5 Years | 17 (100.0%) | 0 (0.0%) |
| 5 Years | 0 (0.0%) | 0 (0.0%) |
| 6 to 11 Years | 11 (100.0%) | 18 (62.1%) |
| 12 to 14 Years | 12 (100.0%) | 0 (0.0%) |
| 15 Years | 12 (100.0%) | 6 (12.0%) |
| 16 and 17 Years | 4 (100.0%) | 31 (100.0%) |
| 18 to 24 Years | 58 (81.7%) | 27 (71.1%) |
| 25 to 34 Years | 51 (76.1%) | 58 (77.3%) |
| 35 to 44 Years | 15 (48.4%) | 91 (74.0%) |
| 45 to 54 Years | 45 (73.8%) | 70 (89.7%) |
| 55 to 64 Years | 155 (80.7%) | 26 (74.3%) |
| 65 to 74 Years | 115 (100.0%) | 122 (91.7%) |
| 75 Years and over | 45 (78.9%) | 43 (100.0%) |
| Total | 540 (83.1%) | 492 (73.2%) |
Income Below Poverty Among Married-Couple Families in Pahoa
The poverty statistics for married-couple families in Pahoa show that 5.6% or 11 of the total 198 families live below the poverty line. Families with no children have the highest poverty rate of 8.4%, comprising of 11 families. On the other hand, families with 1 or 2 children have the lowest poverty rate of 0.0%, which includes 0 families.
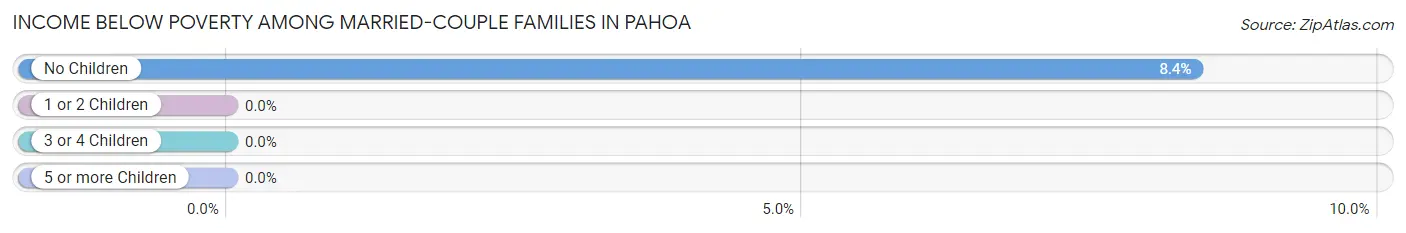
| Children | Above Poverty | Below Poverty |
| No Children | 120 (91.6%) | 11 (8.4%) |
| 1 or 2 Children | 67 (100.0%) | 0 (0.0%) |
| 3 or 4 Children | 0 (0.0%) | 0 (0.0%) |
| 5 or more Children | 0 (0.0%) | 0 (0.0%) |
| Total | 187 (94.4%) | 11 (5.6%) |
Income Below Poverty Among Single-Parent Households in Pahoa
According to the poverty data in Pahoa, 34.5% or 40 single-father households and 33.9% or 20 single-mother households are living below the poverty line. Among single-father households, those with 1 or 2 children have the highest poverty rate, with 14 households (100.0%) experiencing poverty. Likewise, among single-mother households, those with 3 or 4 children have the highest poverty rate, with 17 households (100.0%) falling below the poverty line.
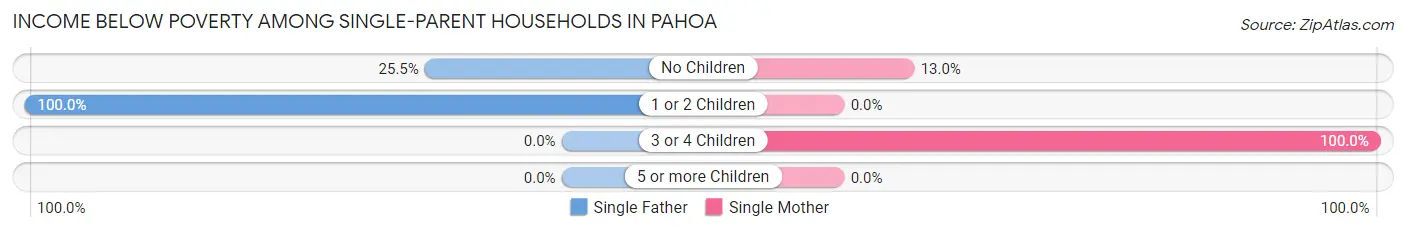
| Children | Single Father | Single Mother |
| No Children | 26 (25.5%) | 3 (13.0%) |
| 1 or 2 Children | 14 (100.0%) | 0 (0.0%) |
| 3 or 4 Children | 0 (0.0%) | 17 (100.0%) |
| 5 or more Children | 0 (0.0%) | 0 (0.0%) |
| Total | 40 (34.5%) | 20 (33.9%) |
Income Below Poverty Among Married-Couple vs Single-Parent Households in Pahoa
The poverty data for Pahoa shows that 11 of the married-couple family households (5.6%) and 60 of the single-parent households (34.3%) are living below the poverty level. Within the married-couple family households, those with no children have the highest poverty rate, with 11 households (8.4%) falling below the poverty line. Among the single-parent households, those with 3 or 4 children have the highest poverty rate, with 17 household (100.0%) living below poverty.
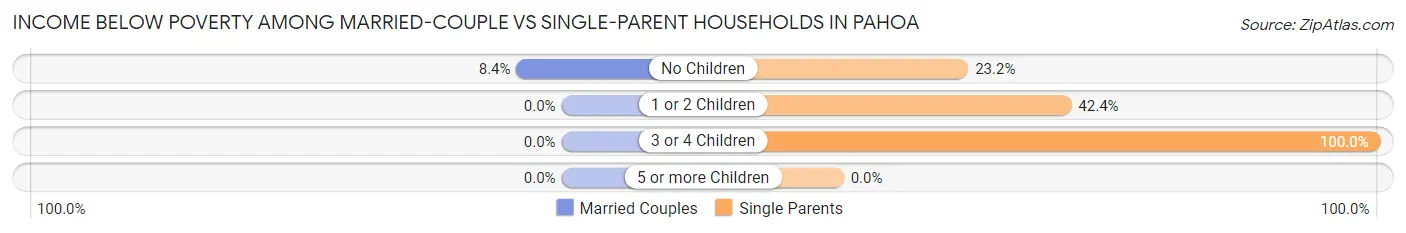
| Children | Married-Couple Families | Single-Parent Households |
| No Children | 11 (8.4%) | 29 (23.2%) |
| 1 or 2 Children | 0 (0.0%) | 14 (42.4%) |
| 3 or 4 Children | 0 (0.0%) | 17 (100.0%) |
| 5 or more Children | 0 (0.0%) | 0 (0.0%) |
| Total | 11 (5.6%) | 60 (34.3%) |
Race in Pahoa
The most populous races in Pahoa are Asian (620 | 45.2%), Two or more Races (299 | 21.8%), and White / Caucasian (272 | 19.8%).
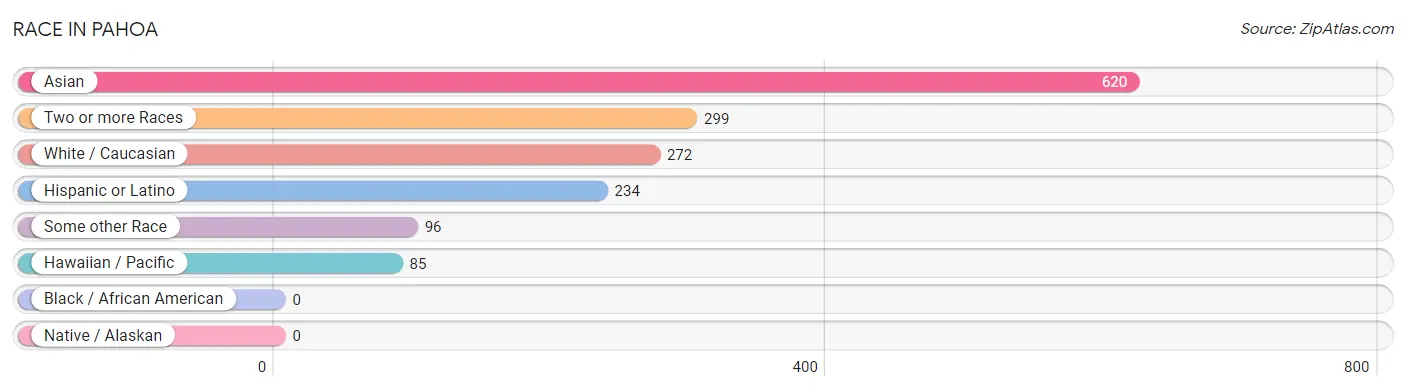
| Race | # Population | % Population |
| Asian | 620 | 45.2% |
| Black / African American | 0 | 0.0% |
| Hawaiian / Pacific | 85 | 6.2% |
| Hispanic or Latino | 234 | 17.1% |
| Native / Alaskan | 0 | 0.0% |
| White / Caucasian | 272 | 19.8% |
| Two or more Races | 299 | 21.8% |
| Some other Race | 96 | 7.0% |
| Total | 1,372 | 100.0% |
Ancestry in Pahoa
The most populous ancestries reported in Pahoa are Korean (645 | 47.0%), Native Hawaiian (371 | 27.0%), Bhutanese (112 | 8.2%), Spanish (87 | 6.3%), and Puerto Rican (71 | 5.2%), together accounting for 93.7% of all Pahoa residents.
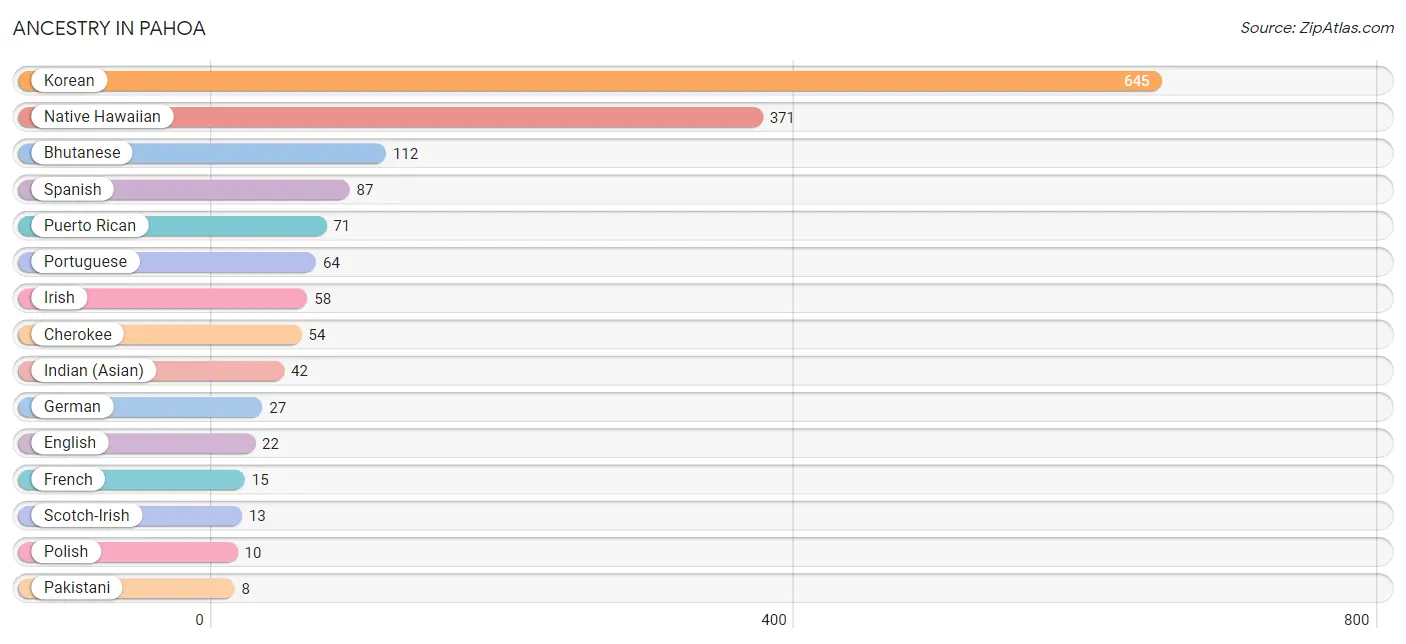
| Ancestry | # Population | % Population |
| Bhutanese | 112 | 8.2% |
| Blackfeet | 4 | 0.3% |
| Cherokee | 54 | 3.9% |
| Dutch | 5 | 0.4% |
| English | 22 | 1.6% |
| Finnish | 5 | 0.4% |
| French | 15 | 1.1% |
| German | 27 | 2.0% |
| Indian (Asian) | 42 | 3.1% |
| Irish | 58 | 4.2% |
| Italian | 7 | 0.5% |
| Korean | 645 | 47.0% |
| Native Hawaiian | 371 | 27.0% |
| Norwegian | 2 | 0.2% |
| Pakistani | 8 | 0.6% |
| Polish | 10 | 0.7% |
| Portuguese | 64 | 4.7% |
| Puerto Rican | 71 | 5.2% |
| Samoan | 7 | 0.5% |
| Scotch-Irish | 13 | 0.9% |
| Spanish | 87 | 6.3% | View All 21 Rows |
Immigrants in Pahoa
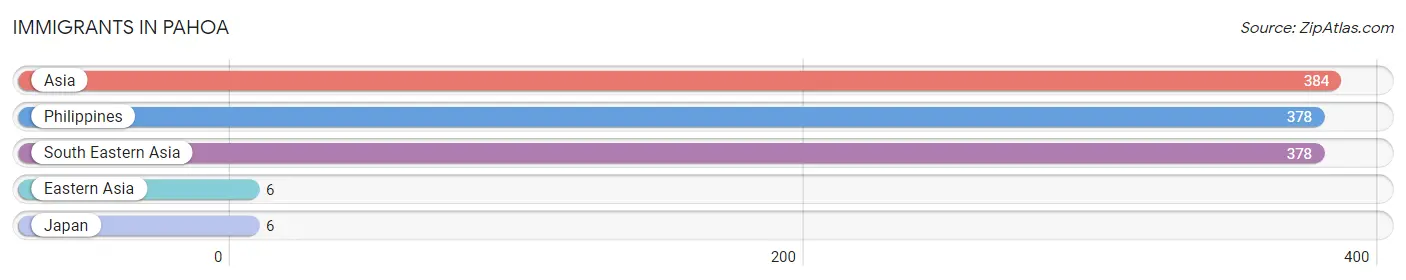
The most numerous immigrant groups reported in Pahoa came from Asia (384 | 28.0%), Philippines (378 | 27.6%), South Eastern Asia (378 | 27.6%), Eastern Asia (6 | 0.4%), and Japan (6 | 0.4%), together accounting for 84.0% of all Pahoa residents.
| Immigration Origin | # Population | % Population |
| Asia | 384 | 28.0% |
| Eastern Asia | 6 | 0.4% |
| Japan | 6 | 0.4% |
| Philippines | 378 | 27.6% |
| South Eastern Asia | 378 | 27.6% | View All 5 Rows |
Sex and Age in Pahoa
Sex and Age in Pahoa
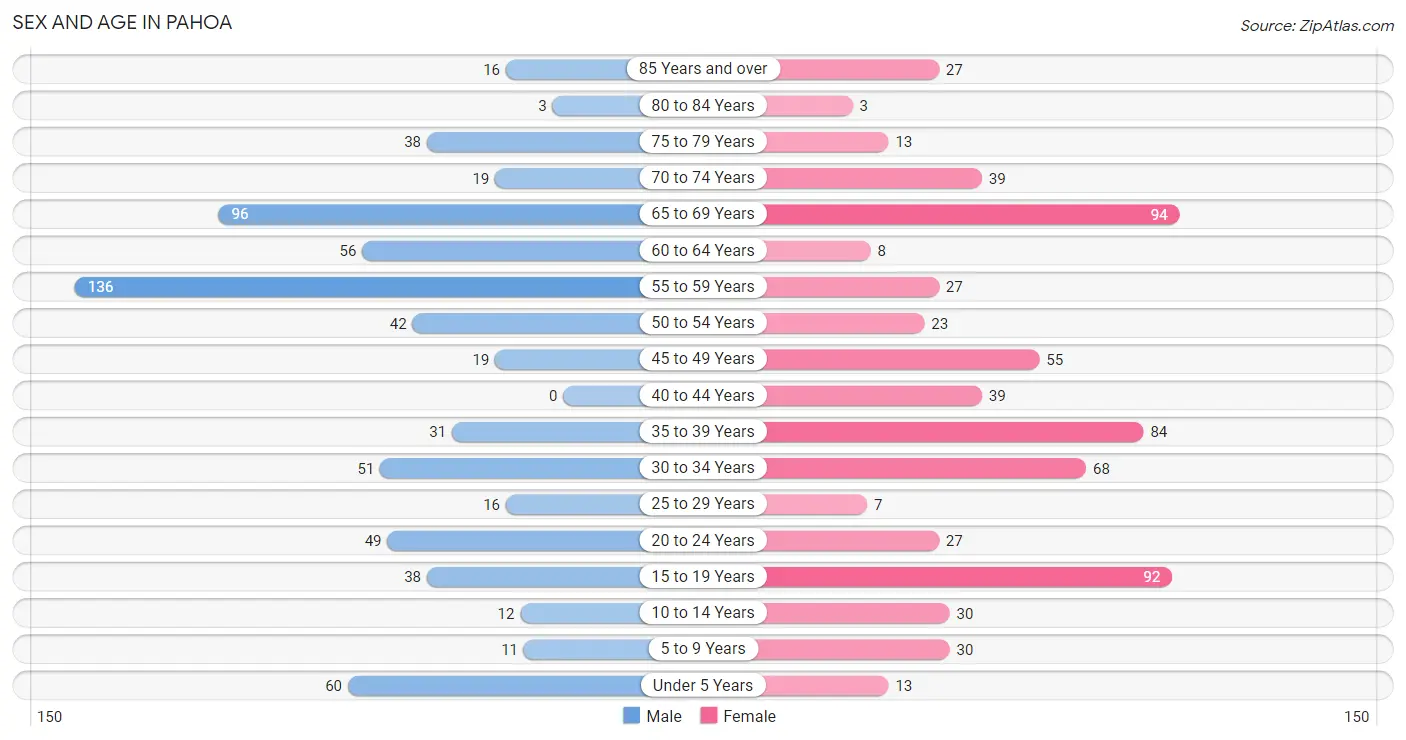
The most populous age groups in Pahoa are 55 to 59 Years (136 | 19.6%) for men and 65 to 69 Years (94 | 13.8%) for women.
| Age Bracket | Male | Female |
| Under 5 Years | 60 (8.7%) | 13 (1.9%) |
| 5 to 9 Years | 11 (1.6%) | 30 (4.4%) |
| 10 to 14 Years | 12 (1.7%) | 30 (4.4%) |
| 15 to 19 Years | 38 (5.5%) | 92 (13.6%) |
| 20 to 24 Years | 49 (7.1%) | 27 (4.0%) |
| 25 to 29 Years | 16 (2.3%) | 7 (1.0%) |
| 30 to 34 Years | 51 (7.4%) | 68 (10.0%) |
| 35 to 39 Years | 31 (4.5%) | 84 (12.4%) |
| 40 to 44 Years | 0 (0.0%) | 39 (5.7%) |
| 45 to 49 Years | 19 (2.7%) | 55 (8.1%) |
| 50 to 54 Years | 42 (6.1%) | 23 (3.4%) |
| 55 to 59 Years | 136 (19.6%) | 27 (4.0%) |
| 60 to 64 Years | 56 (8.1%) | 8 (1.2%) |
| 65 to 69 Years | 96 (13.9%) | 94 (13.8%) |
| 70 to 74 Years | 19 (2.7%) | 39 (5.7%) |
| 75 to 79 Years | 38 (5.5%) | 13 (1.9%) |
| 80 to 84 Years | 3 (0.4%) | 3 (0.4%) |
| 85 Years and over | 16 (2.3%) | 27 (4.0%) |
| Total | 693 (100.0%) | 679 (100.0%) |
Families and Households in Pahoa
Median Family Size in Pahoa
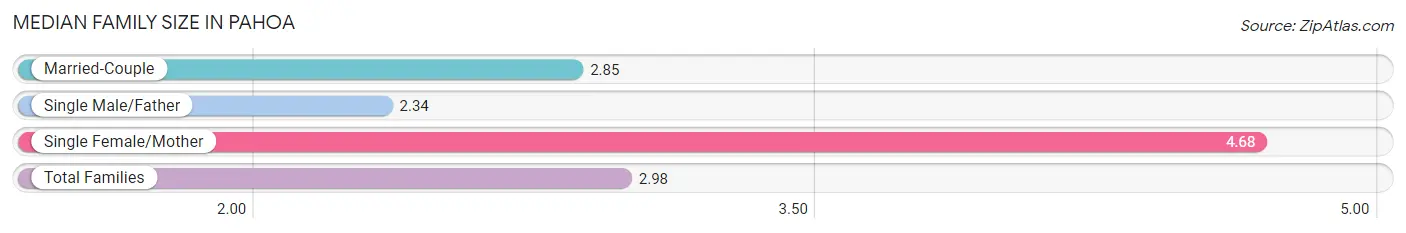
The median family size in Pahoa is 2.98 persons per family, with single female/mother families (59 | 15.8%) accounting for the largest median family size of 4.68 persons per family. On the other hand, single male/father families (116 | 31.1%) represent the smallest median family size with 2.34 persons per family.
| Family Type | # Families | Family Size |
| Married-Couple | 198 (53.1%) | 2.85 |
| Single Male/Father | 116 (31.1%) | 2.34 |
| Single Female/Mother | 59 (15.8%) | 4.68 |
| Total Families | 373 (100.0%) | 2.98 |
Median Household Size in Pahoa
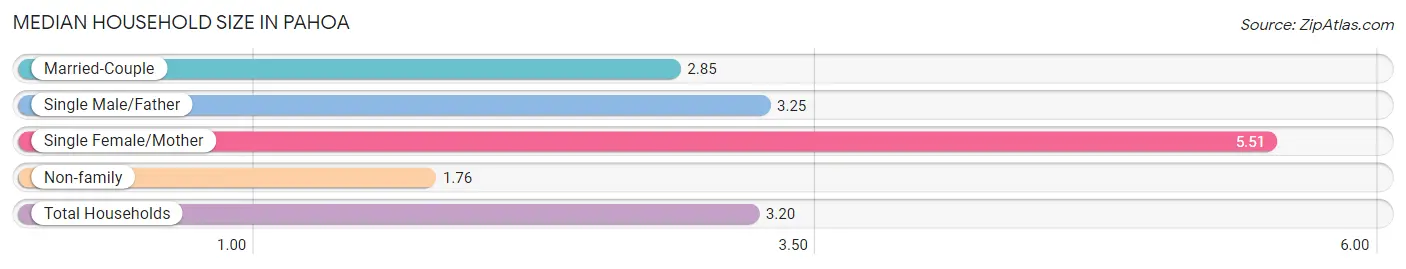
The median household size in Pahoa is 3.20 persons per household, with single female/mother households (59 | 13.9%) accounting for the largest median household size of 5.51 persons per household. non-family households (51 | 12.0%) represent the smallest median household size with 1.76 persons per household.
| Household Type | # Households | Household Size |
| Married-Couple | 198 (46.7%) | 2.85 |
| Single Male/Father | 116 (27.4%) | 3.25 |
| Single Female/Mother | 59 (13.9%) | 5.51 |
| Non-family | 51 (12.0%) | 1.76 |
| Total Households | 424 (100.0%) | 3.20 |
Household Size by Marriage Status in Pahoa
Out of a total of 424 households in Pahoa, 373 (88.0%) are family households, while 51 (12.0%) are nonfamily households. The most numerous type of family households are 2-person households, comprising 182, and the most common type of nonfamily households are 1-person households, comprising 44.
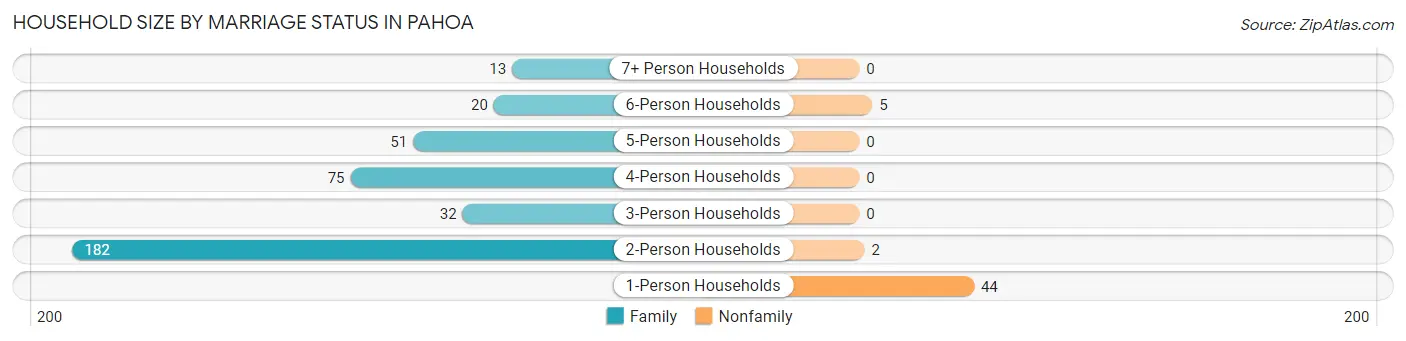
| Household Size | Family Households | Nonfamily Households |
| 1-Person Households | - | 44 (10.4%) |
| 2-Person Households | 182 (42.9%) | 2 (0.5%) |
| 3-Person Households | 32 (7.5%) | 0 (0.0%) |
| 4-Person Households | 75 (17.7%) | 0 (0.0%) |
| 5-Person Households | 51 (12.0%) | 0 (0.0%) |
| 6-Person Households | 20 (4.7%) | 5 (1.2%) |
| 7+ Person Households | 13 (3.1%) | 0 (0.0%) |
| Total | 373 (88.0%) | 51 (12.0%) |
Female Fertility in Pahoa
Fertility by Age in Pahoa
| Age Bracket | Women with Births | Births / 1,000 Women |
| 15 to 19 years | 0 (0.0%) | 0.0 |
| 20 to 34 years | 0 (0.0%) | 0.0 |
| 35 to 50 years | 0 (0.0%) | 0.0 |
| Total | 0 (0.0%) | 0.0 |
Fertility by Age by Marriage Status in Pahoa
| Age Bracket | Married | Unmarried |
| 15 to 19 years | 0 (0.0%) | 0 (0.0%) |
| 20 to 34 years | 0 (0.0%) | 0 (0.0%) |
| 35 to 50 years | 0 (0.0%) | 0 (0.0%) |
| Total | 0 (0.0%) | 0 (0.0%) |
Fertility by Education in Pahoa
| Educational Attainment | Women with Births | Births / 1,000 Women |
| Less than High School | 0 (0.0%) | 0.0 |
| High School Diploma | 0 (0.0%) | 0.0 |
| College or Associate's Degree | 0 (0.0%) | 0.0 |
| Bachelor's Degree | 0 (0.0%) | 0.0 |
| Graduate Degree | 0 (0.0%) | 0.0 |
| Total | 0 (0.0%) | 0.0 |
Fertility by Education by Marriage Status in Pahoa
| Educational Attainment | Married | Unmarried |
| Less than High School | 0 (0.0%) | 0 (0.0%) |
| High School Diploma | 0 (0.0%) | 0 (0.0%) |
| College or Associate's Degree | 0 (0.0%) | 0 (0.0%) |
| Bachelor's Degree | 0 (0.0%) | 0 (0.0%) |
| Graduate Degree | 0 (0.0%) | 0 (0.0%) |
| Total | 0 (0.0%) | 0 (0.0%) |
Employment Characteristics in Pahoa
Employment by Class of Employer in Pahoa
Among the 540 employed individuals in Pahoa, private company employees (357 | 66.1%), local government employees (73 | 13.5%), and state government employees (67 | 12.4%) make up the most common classes of employment.
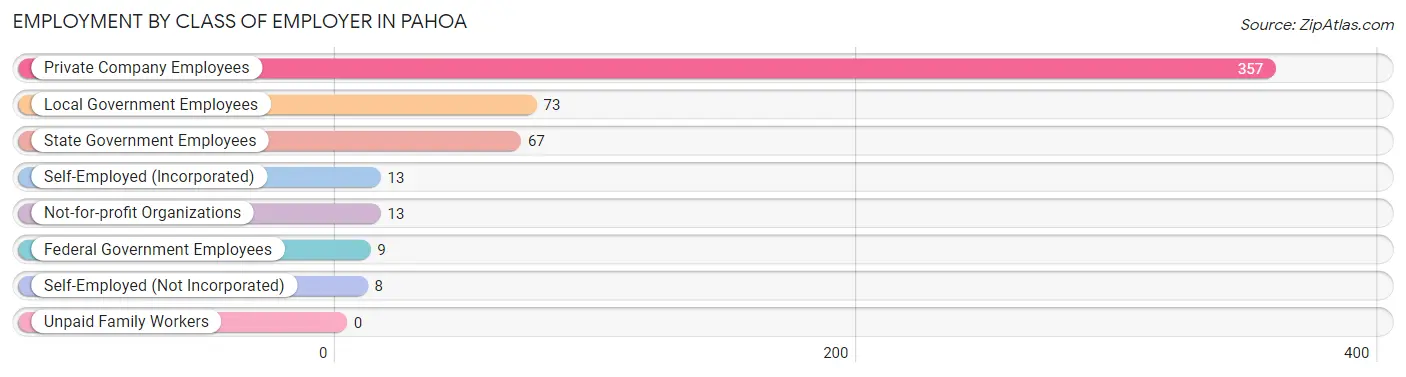
| Employer Class | # Employees | % Employees |
| Private Company Employees | 357 | 66.1% |
| Self-Employed (Incorporated) | 13 | 2.4% |
| Self-Employed (Not Incorporated) | 8 | 1.5% |
| Not-for-profit Organizations | 13 | 2.4% |
| Local Government Employees | 73 | 13.5% |
| State Government Employees | 67 | 12.4% |
| Federal Government Employees | 9 | 1.7% |
| Unpaid Family Workers | 0 | 0.0% |
| Total | 540 | 100.0% |
Employment Status by Age in Pahoa
According to the labor force statistics for Pahoa, out of the total population over 16 years of age (1,154), 51.2% or 591 individuals are in the labor force, with 8.6% or 51 of them unemployed. The age group with the highest labor force participation rate is 20 to 24 years, with 80.3% or 61 individuals in the labor force. Within the labor force, the 16 to 19 years age range has the highest percentage of unemployed individuals, with 100.0% or 11 of them being unemployed.
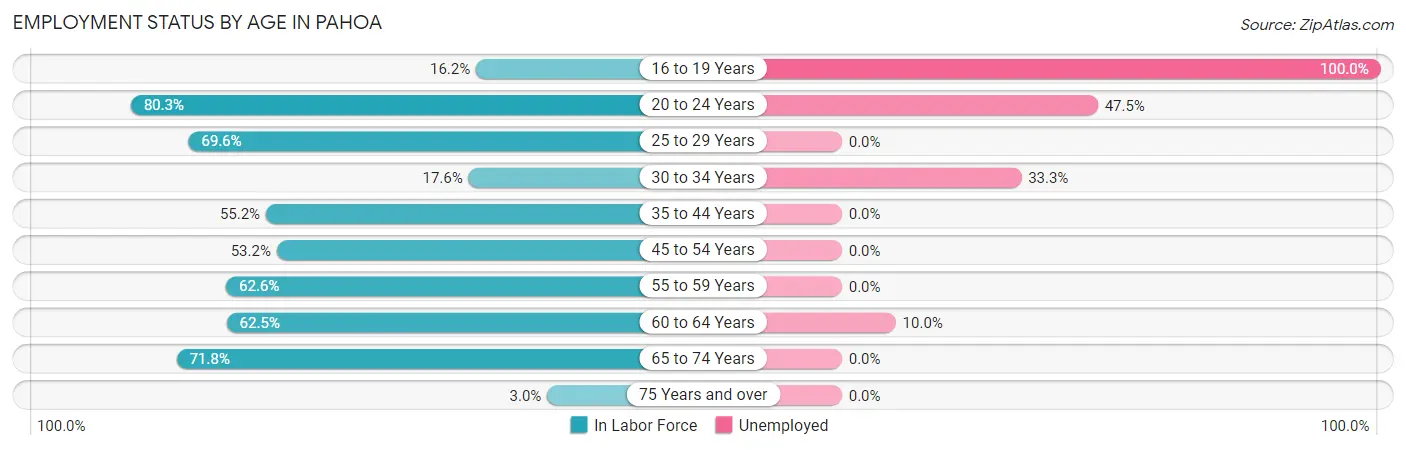
| Age Bracket | In Labor Force | Unemployed |
| 16 to 19 Years | 11 (16.2%) | 11 (100.0%) |
| 20 to 24 Years | 61 (80.3%) | 29 (47.5%) |
| 25 to 29 Years | 16 (69.6%) | 0 (0.0%) |
| 30 to 34 Years | 21 (17.6%) | 7 (33.3%) |
| 35 to 44 Years | 85 (55.2%) | 0 (0.0%) |
| 45 to 54 Years | 74 (53.2%) | 0 (0.0%) |
| 55 to 59 Years | 102 (62.6%) | 0 (0.0%) |
| 60 to 64 Years | 40 (62.5%) | 4 (10.0%) |
| 65 to 74 Years | 178 (71.8%) | 0 (0.0%) |
| 75 Years and over | 3 (3.0%) | 0 (0.0%) |
| Total | 591 (51.2%) | 51 (8.6%) |
Employment Status by Educational Attainment in Pahoa
According to labor force statistics for Pahoa, 51.1% of individuals (338) out of the total population between 25 and 64 years of age (662) are in the labor force, with 3.3% or 11 of them being unemployed. The group with the highest labor force participation rate are those with the educational attainment of college / associate degree, with 59.1% or 114 individuals in the labor force. Within the labor force, individuals with high school diploma education have the highest percentage of unemployment, with 6.6% or 11 of them being unemployed.
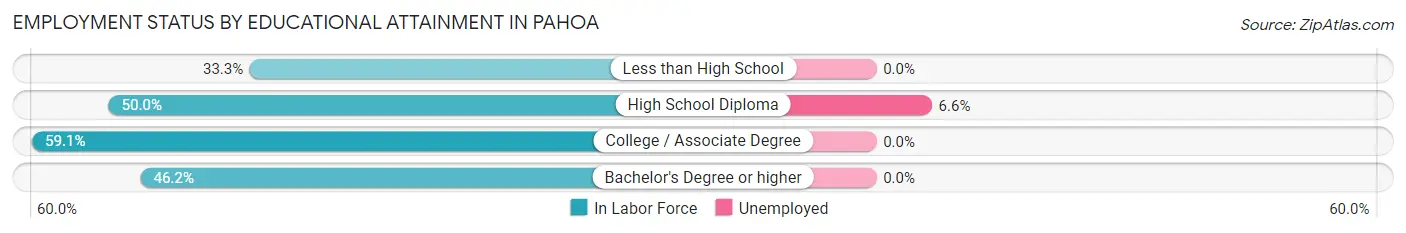
| Educational Attainment | In Labor Force | Unemployed |
| Less than High School | 14 (33.3%) | 0 (0.0%) |
| High School Diploma | 167 (50.0%) | 22 (6.6%) |
| College / Associate Degree | 114 (59.1%) | 0 (0.0%) |
| Bachelor's Degree or higher | 43 (46.2%) | 0 (0.0%) |
| Total | 338 (51.1%) | 22 (3.3%) |
Employment Occupations by Sex in Pahoa
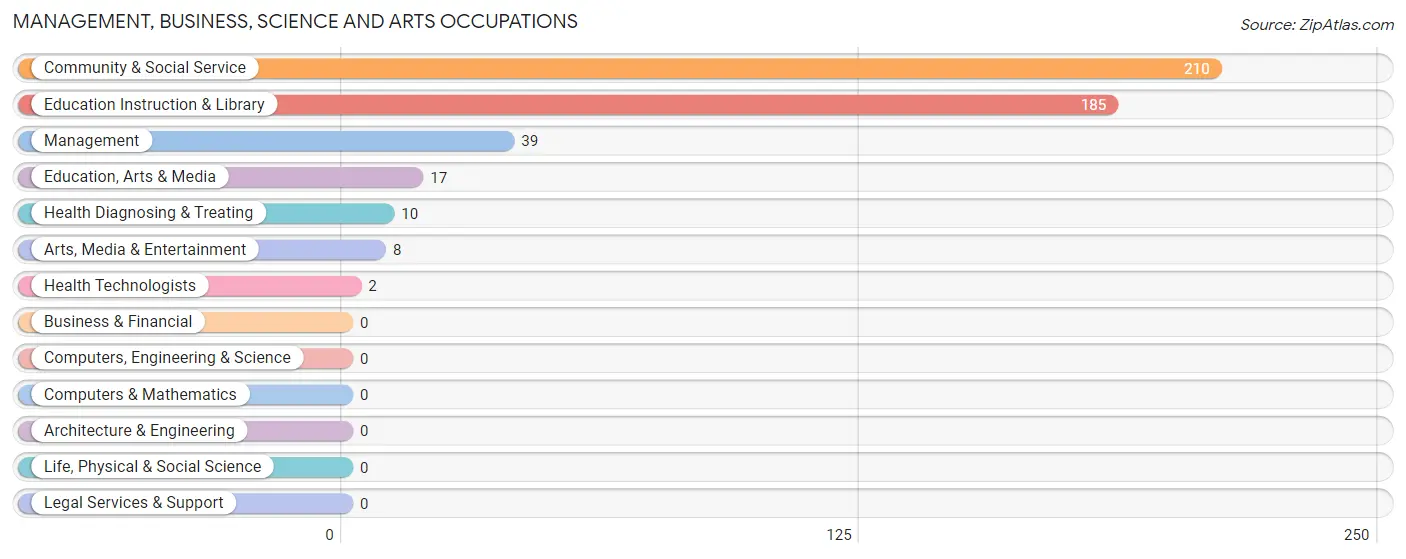
Management, Business, Science and Arts Occupations
The most common Management, Business, Science and Arts occupations in Pahoa are Community & Social Service (210 | 38.9%), Education Instruction & Library (185 | 34.3%), Management (39 | 7.2%), Education, Arts & Media (17 | 3.2%), and Health Diagnosing & Treating (10 | 1.8%).
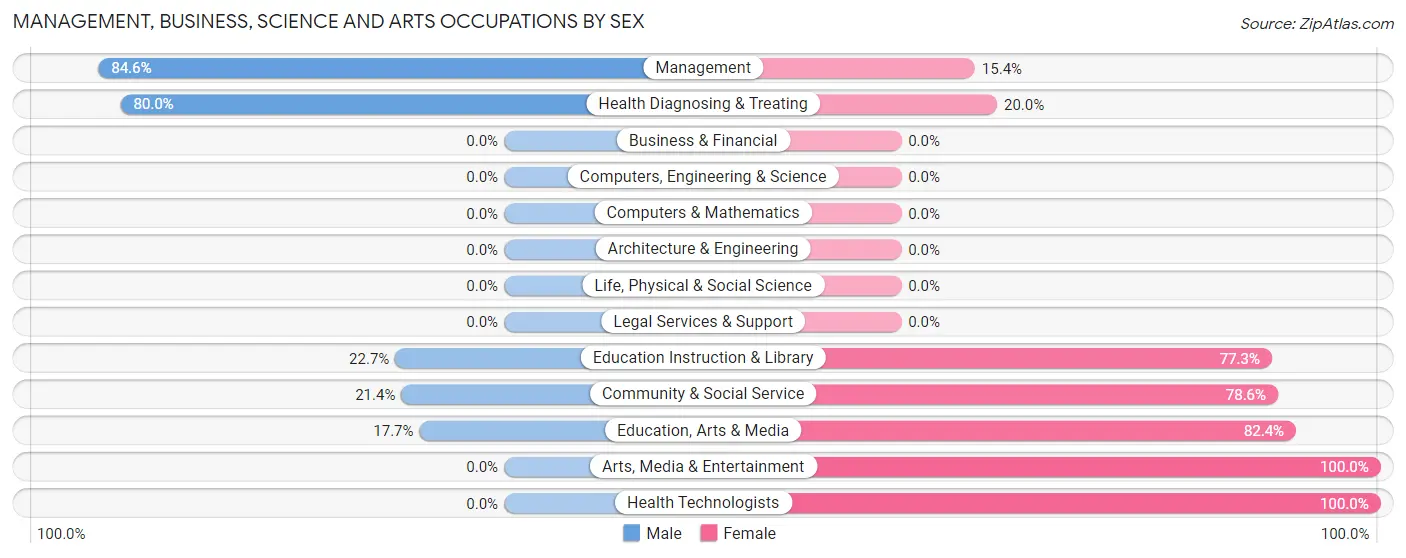
Management, Business, Science and Arts Occupations by Sex
Within the Management, Business, Science and Arts occupations in Pahoa, the most male-oriented occupations are Management (84.6%), Health Diagnosing & Treating (80.0%), and Education Instruction & Library (22.7%), while the most female-oriented occupations are Arts, Media & Entertainment (100.0%), Health Technologists (100.0%), and Education, Arts & Media (82.4%).
| Occupation | Male | Female |
| Management | 33 (84.6%) | 6 (15.4%) |
| Business & Financial | 0 (0.0%) | 0 (0.0%) |
| Computers, Engineering & Science | 0 (0.0%) | 0 (0.0%) |
| Computers & Mathematics | 0 (0.0%) | 0 (0.0%) |
| Architecture & Engineering | 0 (0.0%) | 0 (0.0%) |
| Life, Physical & Social Science | 0 (0.0%) | 0 (0.0%) |
| Community & Social Service | 45 (21.4%) | 165 (78.6%) |
| Education, Arts & Media | 3 (17.6%) | 14 (82.4%) |
| Legal Services & Support | 0 (0.0%) | 0 (0.0%) |
| Education Instruction & Library | 42 (22.7%) | 143 (77.3%) |
| Arts, Media & Entertainment | 0 (0.0%) | 8 (100.0%) |
| Health Diagnosing & Treating | 8 (80.0%) | 2 (20.0%) |
| Health Technologists | 0 (0.0%) | 2 (100.0%) |
| Total (Category) | 86 (33.2%) | 173 (66.8%) |
| Total (Overall) | 306 (56.7%) | 234 (43.3%) |
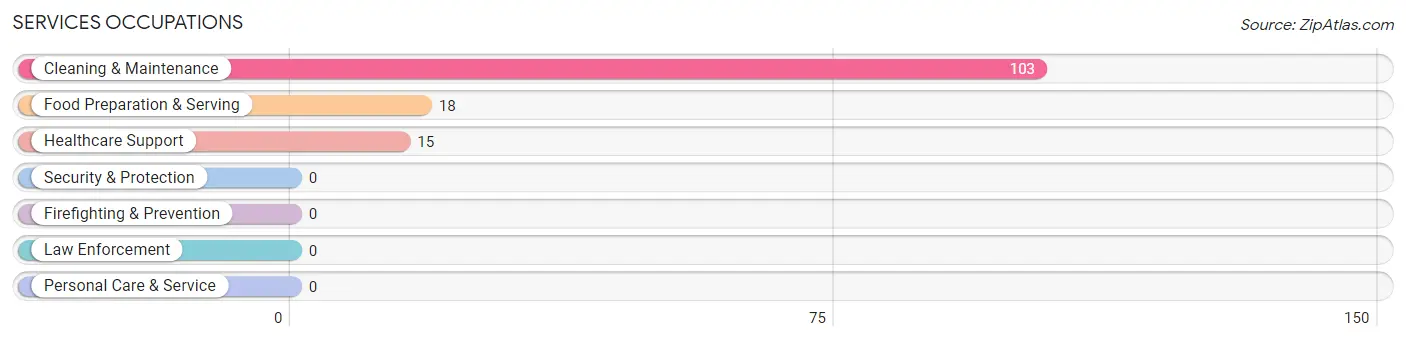
Services Occupations
The most common Services occupations in Pahoa are Cleaning & Maintenance (103 | 19.1%), Food Preparation & Serving (18 | 3.3%), and Healthcare Support (15 | 2.8%).
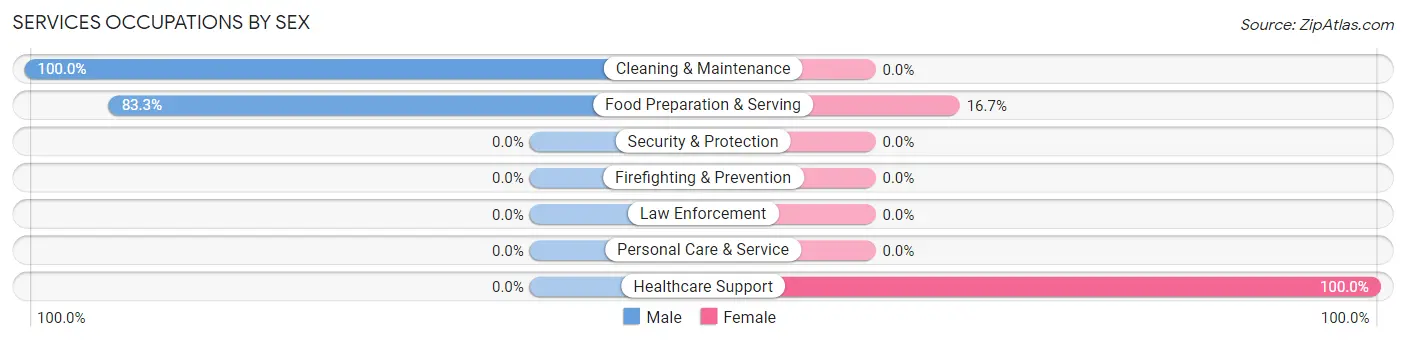
Services Occupations by Sex
Within the Services occupations in Pahoa, the most male-oriented occupations are Cleaning & Maintenance (100.0%), and Food Preparation & Serving (83.3%), while the most female-oriented occupations are Healthcare Support (100.0%), and Food Preparation & Serving (16.7%).
| Occupation | Male | Female |
| Healthcare Support | 0 (0.0%) | 15 (100.0%) |
| Security & Protection | 0 (0.0%) | 0 (0.0%) |
| Firefighting & Prevention | 0 (0.0%) | 0 (0.0%) |
| Law Enforcement | 0 (0.0%) | 0 (0.0%) |
| Food Preparation & Serving | 15 (83.3%) | 3 (16.7%) |
| Cleaning & Maintenance | 103 (100.0%) | 0 (0.0%) |
| Personal Care & Service | 0 (0.0%) | 0 (0.0%) |
| Total (Category) | 118 (86.8%) | 18 (13.2%) |
| Total (Overall) | 306 (56.7%) | 234 (43.3%) |
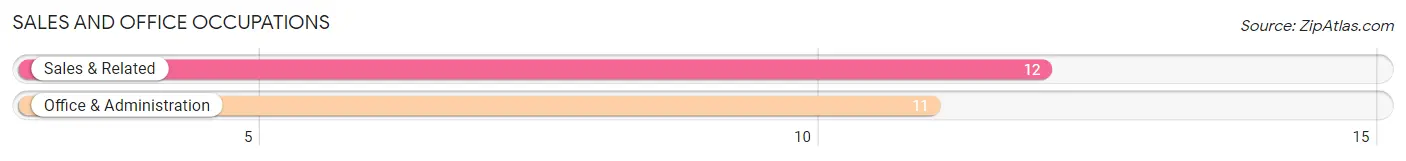
Sales and Office Occupations
The most common Sales and Office occupations in Pahoa are Sales & Related (12 | 2.2%), and Office & Administration (11 | 2.0%).
Sales and Office Occupations by Sex
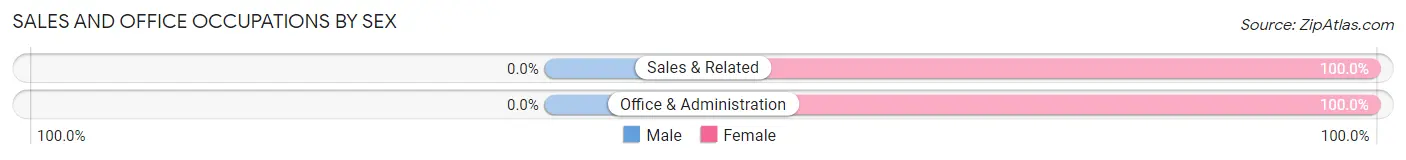
| Occupation | Male | Female |
| Sales & Related | 0 (0.0%) | 12 (100.0%) |
| Office & Administration | 0 (0.0%) | 11 (100.0%) |
| Total (Category) | 0 (0.0%) | 23 (100.0%) |
| Total (Overall) | 306 (56.7%) | 234 (43.3%) |
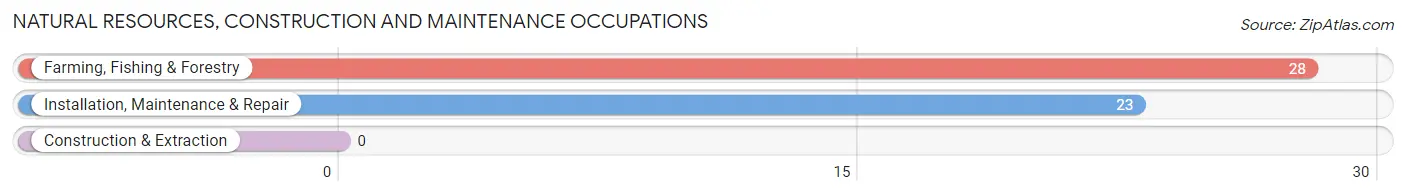
Natural Resources, Construction and Maintenance Occupations
The most common Natural Resources, Construction and Maintenance occupations in Pahoa are Farming, Fishing & Forestry (28 | 5.2%), and Installation, Maintenance & Repair (23 | 4.3%).
Natural Resources, Construction and Maintenance Occupations by Sex
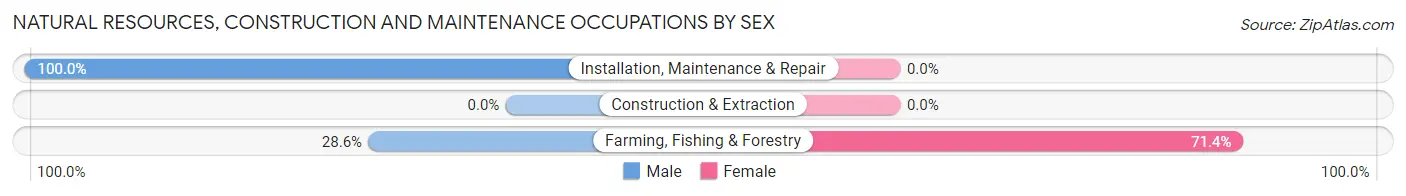
| Occupation | Male | Female |
| Farming, Fishing & Forestry | 8 (28.6%) | 20 (71.4%) |
| Construction & Extraction | 0 (0.0%) | 0 (0.0%) |
| Installation, Maintenance & Repair | 23 (100.0%) | 0 (0.0%) |
| Total (Category) | 31 (60.8%) | 20 (39.2%) |
| Total (Overall) | 306 (56.7%) | 234 (43.3%) |
Production, Transportation and Moving Occupations
The most common Production, Transportation and Moving occupations in Pahoa are , and Material Moving (71 | 13.2%).
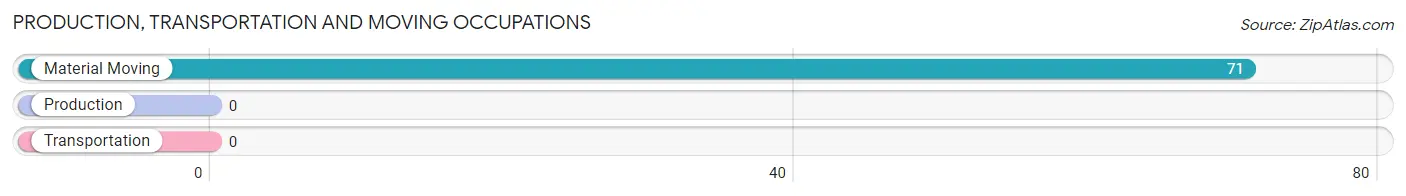
Production, Transportation and Moving Occupations by Sex
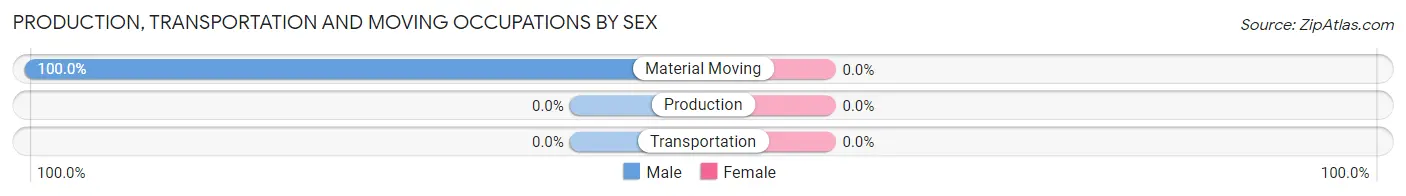
| Occupation | Male | Female |
| Production | 0 (0.0%) | 0 (0.0%) |
| Transportation | 0 (0.0%) | 0 (0.0%) |
| Material Moving | 71 (100.0%) | 0 (0.0%) |
| Total (Category) | 71 (100.0%) | 0 (0.0%) |
| Total (Overall) | 306 (56.7%) | 234 (43.3%) |
Employment Industries by Sex in Pahoa
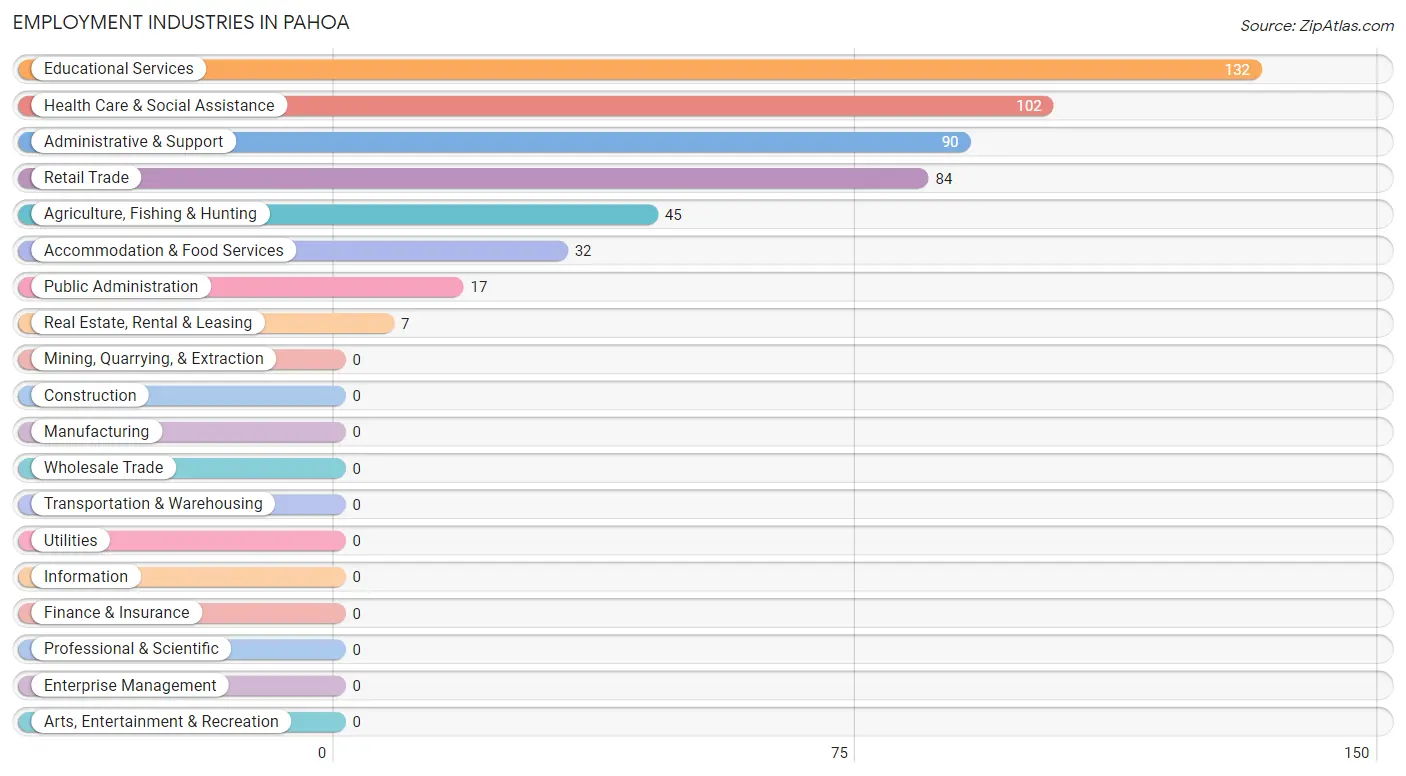
Employment Industries in Pahoa
The major employment industries in Pahoa include Educational Services (132 | 24.4%), Health Care & Social Assistance (102 | 18.9%), Administrative & Support (90 | 16.7%), Retail Trade (84 | 15.6%), and Agriculture, Fishing & Hunting (45 | 8.3%).
Employment Industries by Sex in Pahoa
The Pahoa industries that see more men than women are Real Estate, Rental & Leasing (100.0%), Administrative & Support (100.0%), and Public Administration (100.0%), whereas the industries that tend to have a higher number of women are Health Care & Social Assistance (92.2%), Educational Services (60.6%), and Agriculture, Fishing & Hunting (44.4%).
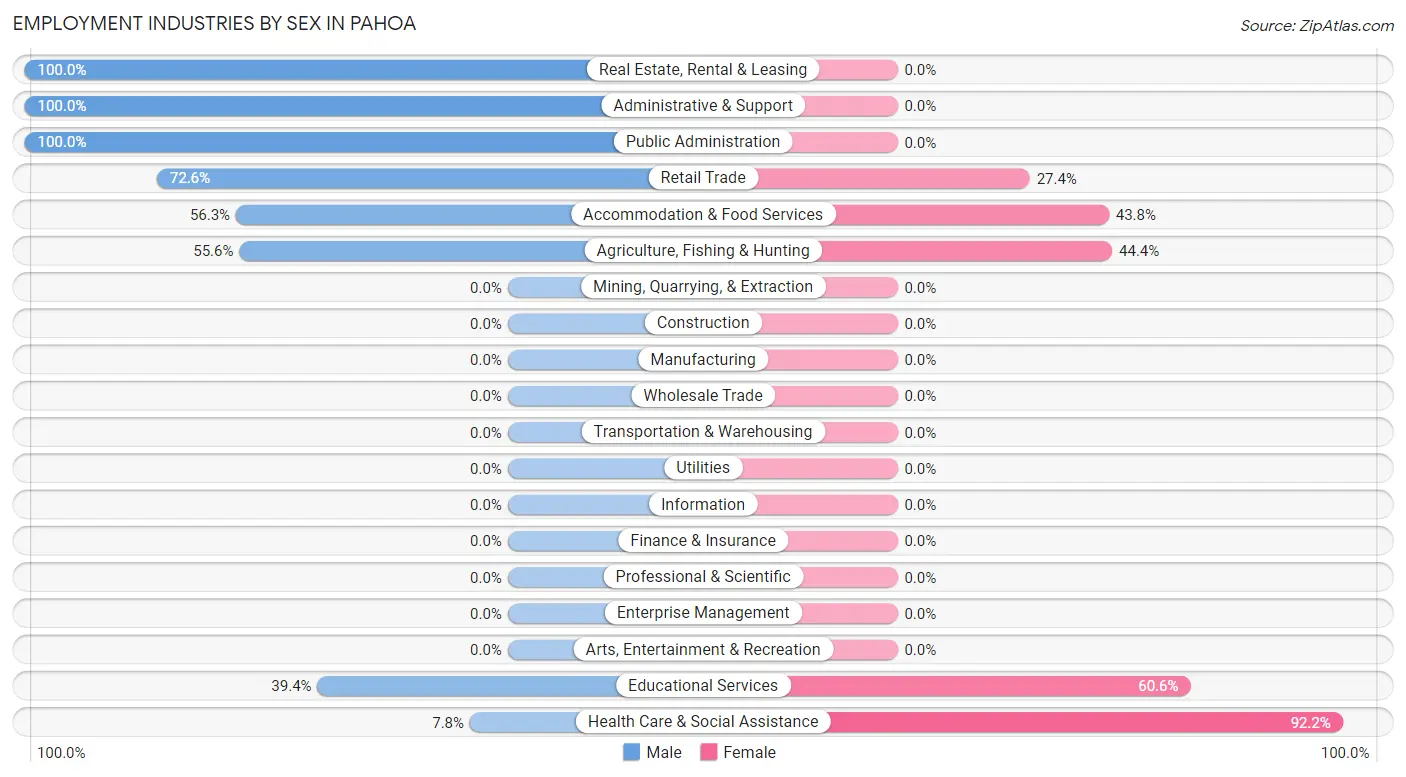
| Industry | Male | Female |
| Agriculture, Fishing & Hunting | 25 (55.6%) | 20 (44.4%) |
| Mining, Quarrying, & Extraction | 0 (0.0%) | 0 (0.0%) |
| Construction | 0 (0.0%) | 0 (0.0%) |
| Manufacturing | 0 (0.0%) | 0 (0.0%) |
| Wholesale Trade | 0 (0.0%) | 0 (0.0%) |
| Retail Trade | 61 (72.6%) | 23 (27.4%) |
| Transportation & Warehousing | 0 (0.0%) | 0 (0.0%) |
| Utilities | 0 (0.0%) | 0 (0.0%) |
| Information | 0 (0.0%) | 0 (0.0%) |
| Finance & Insurance | 0 (0.0%) | 0 (0.0%) |
| Real Estate, Rental & Leasing | 7 (100.0%) | 0 (0.0%) |
| Professional & Scientific | 0 (0.0%) | 0 (0.0%) |
| Enterprise Management | 0 (0.0%) | 0 (0.0%) |
| Administrative & Support | 90 (100.0%) | 0 (0.0%) |
| Educational Services | 52 (39.4%) | 80 (60.6%) |
| Health Care & Social Assistance | 8 (7.8%) | 94 (92.2%) |
| Arts, Entertainment & Recreation | 0 (0.0%) | 0 (0.0%) |
| Accommodation & Food Services | 18 (56.2%) | 14 (43.8%) |
| Public Administration | 17 (100.0%) | 0 (0.0%) |
| Total | 306 (56.7%) | 234 (43.3%) |
Education in Pahoa
School Enrollment in Pahoa
The most common levels of schooling among the 351 students in Pahoa are high school (147 | 41.9%), college / undergraduate (88 | 25.1%), and middle school (42 | 12.0%).
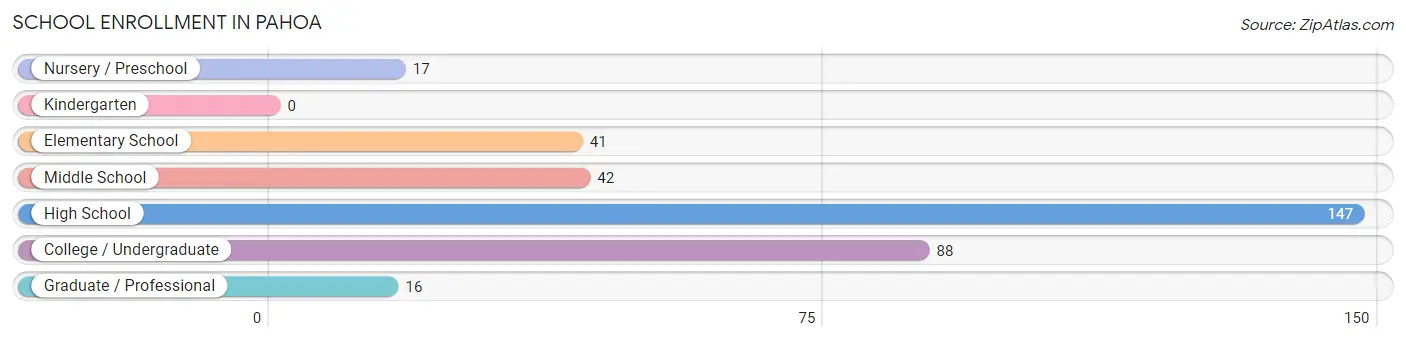
| School Level | # Students | % Students |
| Nursery / Preschool | 17 | 4.8% |
| Kindergarten | 0 | 0.0% |
| Elementary School | 41 | 11.7% |
| Middle School | 42 | 12.0% |
| High School | 147 | 41.9% |
| College / Undergraduate | 88 | 25.1% |
| Graduate / Professional | 16 | 4.6% |
| Total | 351 | 100.0% |
School Enrollment by Age by Funding Source in Pahoa
Out of a total of 351 students who are enrolled in schools in Pahoa, 73 (20.8%) attend a private institution, while the remaining 278 (79.2%) are enrolled in public schools. The age group of 5 to 9 year old has the highest likelihood of being enrolled in private schools, with 34 (82.9% in the age bracket) enrolled. Conversely, the age group of 3 to 4 year olds has the lowest likelihood of being enrolled in a private school, with 17 (100.0% in the age bracket) attending a public institution.
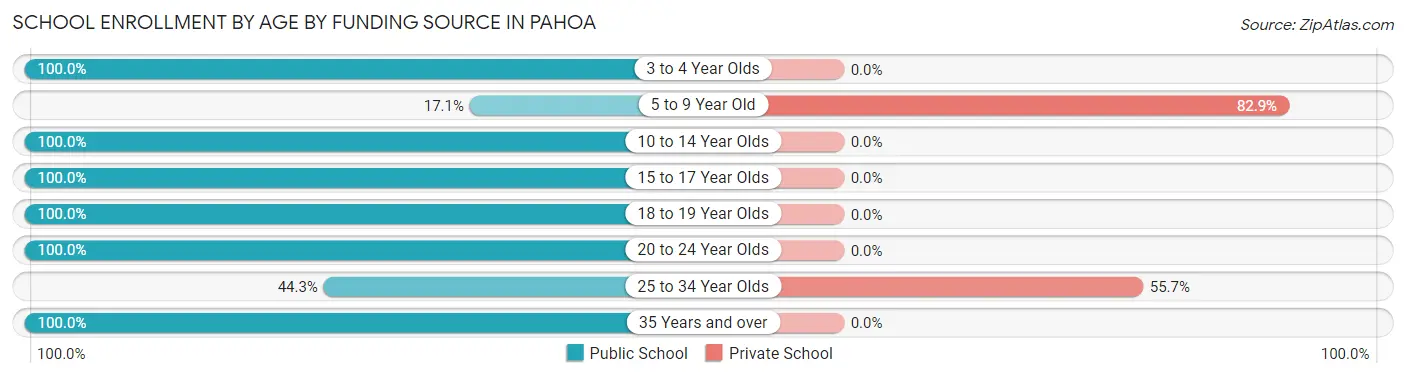
| Age Bracket | Public School | Private School |
| 3 to 4 Year Olds | 17 (100.0%) | 0 (0.0%) |
| 5 to 9 Year Old | 7 (17.1%) | 34 (82.9%) |
| 10 to 14 Year Olds | 42 (100.0%) | 0 (0.0%) |
| 15 to 17 Year Olds | 97 (100.0%) | 0 (0.0%) |
| 18 to 19 Year Olds | 11 (100.0%) | 0 (0.0%) |
| 20 to 24 Year Olds | 55 (100.0%) | 0 (0.0%) |
| 25 to 34 Year Olds | 31 (44.3%) | 39 (55.7%) |
| 35 Years and over | 18 (100.0%) | 0 (0.0%) |
| Total | 278 (79.2%) | 73 (20.8%) |
Educational Attainment by Field of Study in Pahoa
Business (104 | 39.1%), social sciences (53 | 19.9%), education (48 | 18.0%), liberal arts & history (28 | 10.5%), and physical & health sciences (16 | 6.0%) are the most common fields of study among 266 individuals in Pahoa who have obtained a bachelor's degree or higher.
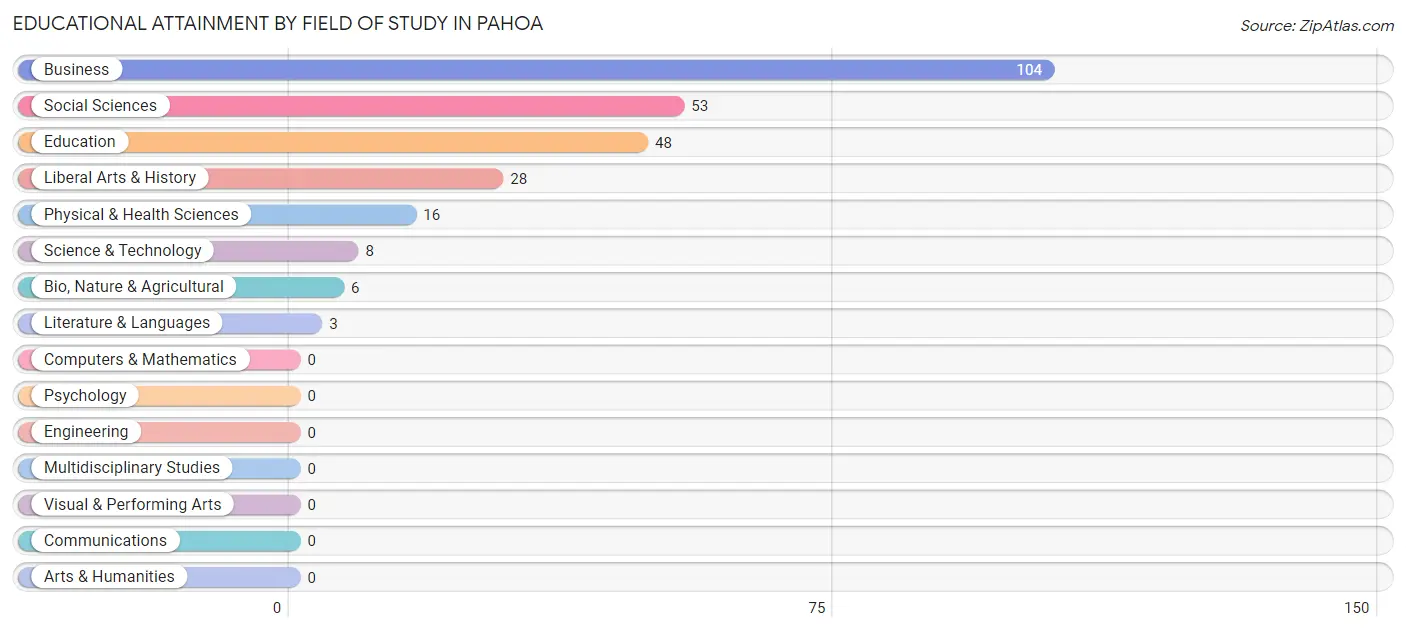
| Field of Study | # Graduates | % Graduates |
| Computers & Mathematics | 0 | 0.0% |
| Bio, Nature & Agricultural | 6 | 2.3% |
| Physical & Health Sciences | 16 | 6.0% |
| Psychology | 0 | 0.0% |
| Social Sciences | 53 | 19.9% |
| Engineering | 0 | 0.0% |
| Multidisciplinary Studies | 0 | 0.0% |
| Science & Technology | 8 | 3.0% |
| Business | 104 | 39.1% |
| Education | 48 | 18.0% |
| Literature & Languages | 3 | 1.1% |
| Liberal Arts & History | 28 | 10.5% |
| Visual & Performing Arts | 0 | 0.0% |
| Communications | 0 | 0.0% |
| Arts & Humanities | 0 | 0.0% |
| Total | 266 | 100.0% |
Transportation & Commute in Pahoa
Vehicle Availability by Sex in Pahoa
The most prevalent vehicle ownership categories in Pahoa are males with 2 vehicles (125, accounting for 40.8%) and females with 2 vehicles (86, making up 53.4%).
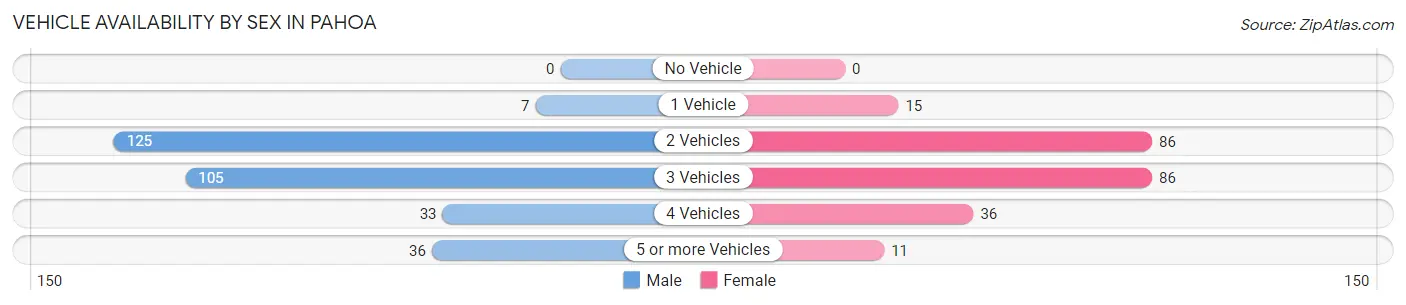
| Vehicles Available | Male | Female |
| No Vehicle | 0 (0.0%) | 0 (0.0%) |
| 1 Vehicle | 7 (2.3%) | 15 (6.4%) |
| 2 Vehicles | 125 (40.8%) | 86 (36.7%) |
| 3 Vehicles | 105 (34.3%) | 86 (36.7%) |
| 4 Vehicles | 33 (10.8%) | 36 (15.4%) |
| 5 or more Vehicles | 36 (11.8%) | 11 (4.7%) |
| Total | 306 (100.0%) | 234 (100.0%) |
Commute Time in Pahoa
The most frequently occuring commute durations in Pahoa are 45 to 59 minutes (94 commuters, 17.4%), 30 to 34 minutes (86 commuters, 15.9%), and 5 to 9 minutes (84 commuters, 15.6%).
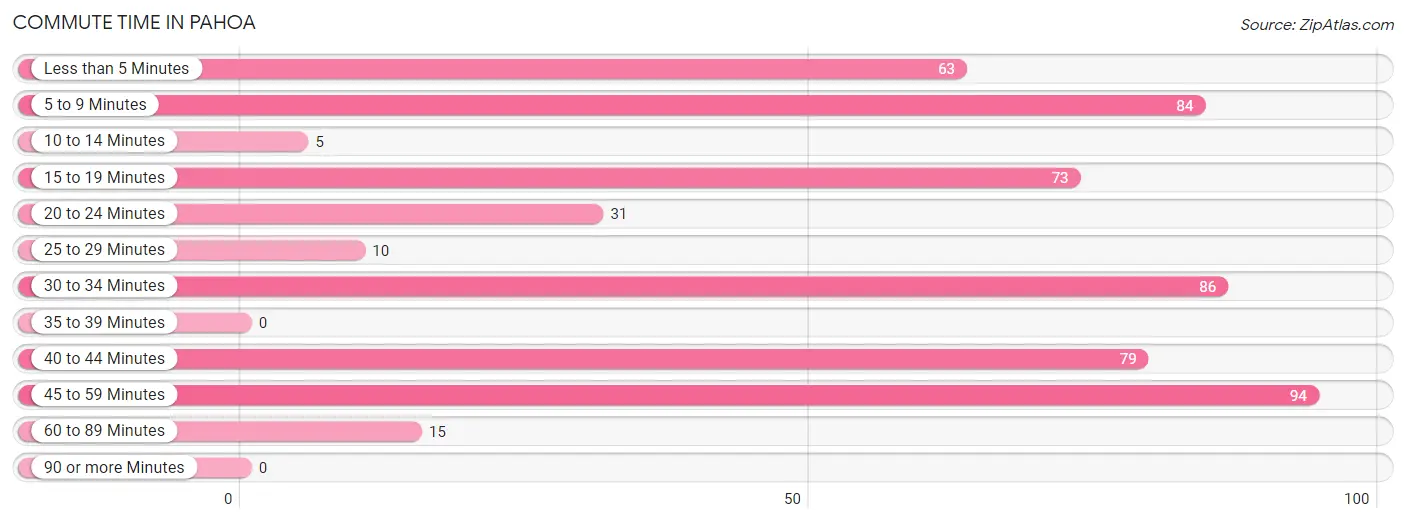
| Commute Time | # Commuters | % Commuters |
| Less than 5 Minutes | 63 | 11.7% |
| 5 to 9 Minutes | 84 | 15.6% |
| 10 to 14 Minutes | 5 | 0.9% |
| 15 to 19 Minutes | 73 | 13.5% |
| 20 to 24 Minutes | 31 | 5.7% |
| 25 to 29 Minutes | 10 | 1.8% |
| 30 to 34 Minutes | 86 | 15.9% |
| 35 to 39 Minutes | 0 | 0.0% |
| 40 to 44 Minutes | 79 | 14.6% |
| 45 to 59 Minutes | 94 | 17.4% |
| 60 to 89 Minutes | 15 | 2.8% |
| 90 or more Minutes | 0 | 0.0% |
Commute Time by Sex in Pahoa
The most common commute times in Pahoa are 40 to 44 minutes (79 commuters, 25.8%) for males and 15 to 19 minutes (73 commuters, 31.2%) for females.
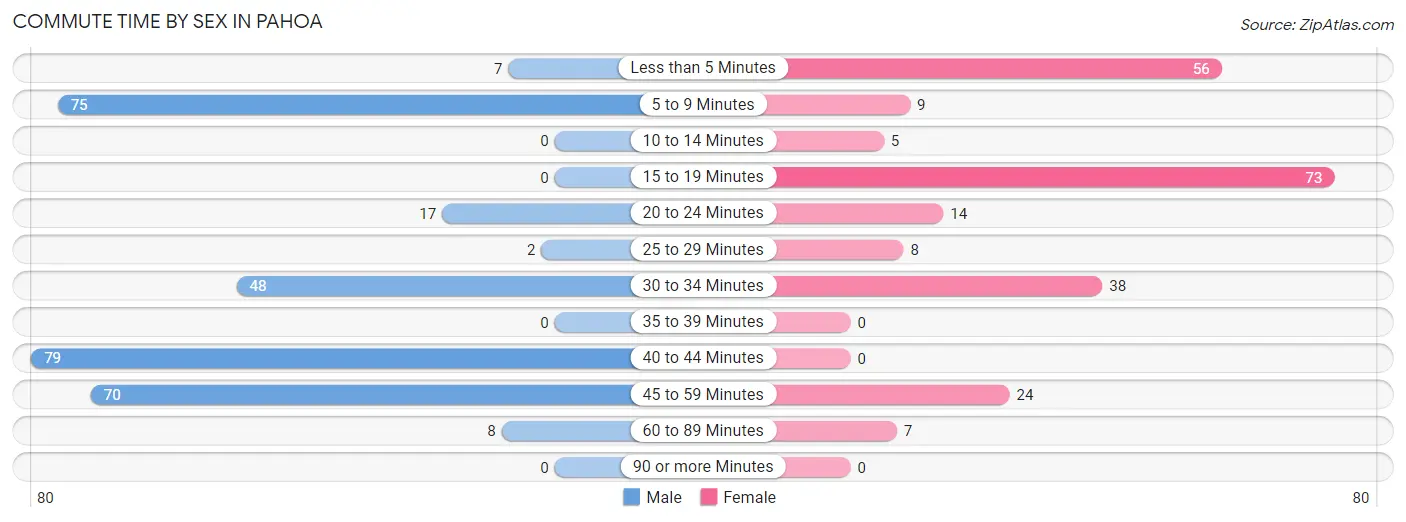
| Commute Time | Male | Female |
| Less than 5 Minutes | 7 (2.3%) | 56 (23.9%) |
| 5 to 9 Minutes | 75 (24.5%) | 9 (3.8%) |
| 10 to 14 Minutes | 0 (0.0%) | 5 (2.1%) |
| 15 to 19 Minutes | 0 (0.0%) | 73 (31.2%) |
| 20 to 24 Minutes | 17 (5.6%) | 14 (6.0%) |
| 25 to 29 Minutes | 2 (0.6%) | 8 (3.4%) |
| 30 to 34 Minutes | 48 (15.7%) | 38 (16.2%) |
| 35 to 39 Minutes | 0 (0.0%) | 0 (0.0%) |
| 40 to 44 Minutes | 79 (25.8%) | 0 (0.0%) |
| 45 to 59 Minutes | 70 (22.9%) | 24 (10.3%) |
| 60 to 89 Minutes | 8 (2.6%) | 7 (3.0%) |
| 90 or more Minutes | 0 (0.0%) | 0 (0.0%) |
Time of Departure to Work by Sex in Pahoa
The most frequent times of departure to work in Pahoa are 6:00 AM to 6:29 AM (176, 57.5%) for males and 7:00 AM to 7:29 AM (85, 36.3%) for females.
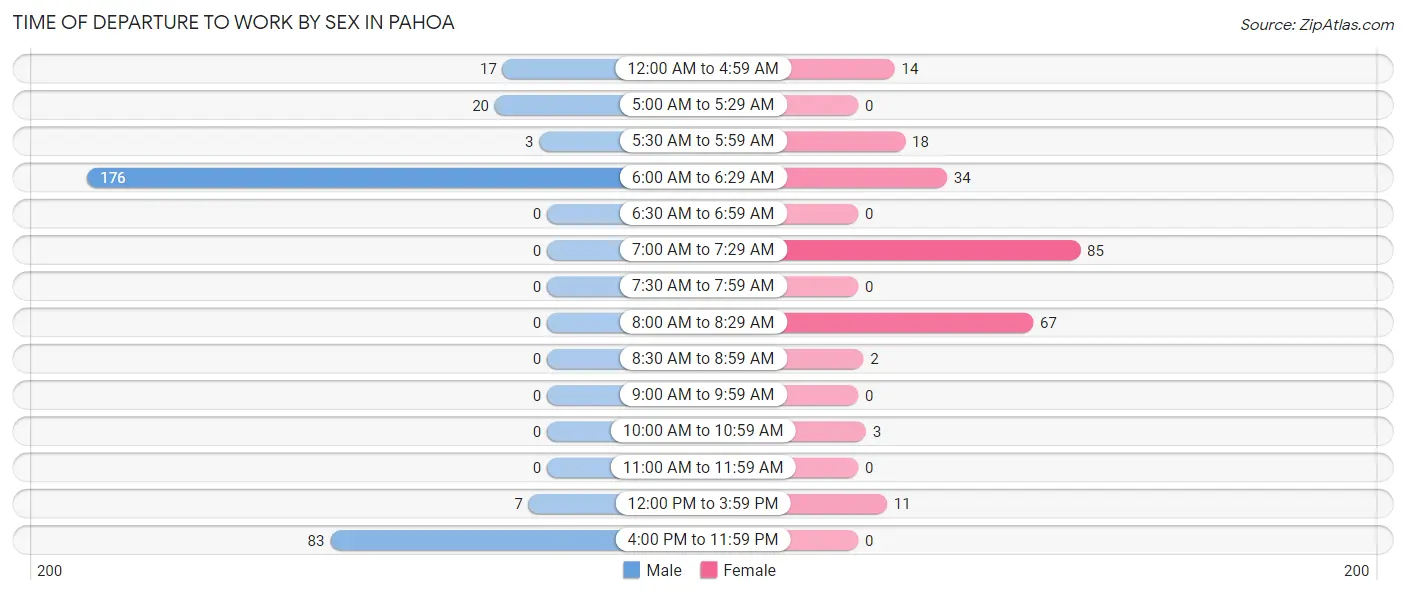
| Time of Departure | Male | Female |
| 12:00 AM to 4:59 AM | 17 (5.6%) | 14 (6.0%) |
| 5:00 AM to 5:29 AM | 20 (6.5%) | 0 (0.0%) |
| 5:30 AM to 5:59 AM | 3 (1.0%) | 18 (7.7%) |
| 6:00 AM to 6:29 AM | 176 (57.5%) | 34 (14.5%) |
| 6:30 AM to 6:59 AM | 0 (0.0%) | 0 (0.0%) |
| 7:00 AM to 7:29 AM | 0 (0.0%) | 85 (36.3%) |
| 7:30 AM to 7:59 AM | 0 (0.0%) | 0 (0.0%) |
| 8:00 AM to 8:29 AM | 0 (0.0%) | 67 (28.6%) |
| 8:30 AM to 8:59 AM | 0 (0.0%) | 2 (0.9%) |
| 9:00 AM to 9:59 AM | 0 (0.0%) | 0 (0.0%) |
| 10:00 AM to 10:59 AM | 0 (0.0%) | 3 (1.3%) |
| 11:00 AM to 11:59 AM | 0 (0.0%) | 0 (0.0%) |
| 12:00 PM to 3:59 PM | 7 (2.3%) | 11 (4.7%) |
| 4:00 PM to 11:59 PM | 83 (27.1%) | 0 (0.0%) |
| Total | 306 (100.0%) | 234 (100.0%) |
Housing Occupancy in Pahoa
Occupancy by Ownership in Pahoa
Of the total 424 dwellings in Pahoa, owner-occupied units account for 356 (84.0%), while renter-occupied units make up 68 (16.0%).
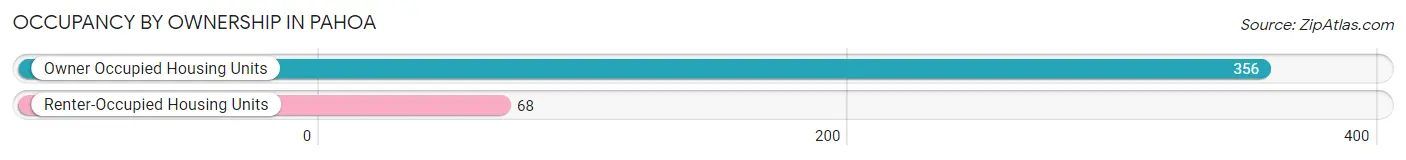
| Occupancy | # Housing Units | % Housing Units |
| Owner Occupied Housing Units | 356 | 84.0% |
| Renter-Occupied Housing Units | 68 | 16.0% |
| Total Occupied Housing Units | 424 | 100.0% |
Occupancy by Household Size in Pahoa
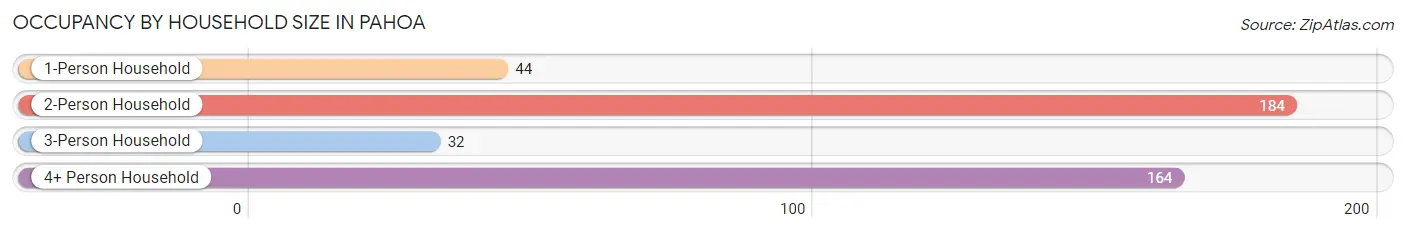
| Household Size | # Housing Units | % Housing Units |
| 1-Person Household | 44 | 10.4% |
| 2-Person Household | 184 | 43.4% |
| 3-Person Household | 32 | 7.5% |
| 4+ Person Household | 164 | 38.7% |
| Total Housing Units | 424 | 100.0% |
Occupancy by Ownership by Household Size in Pahoa
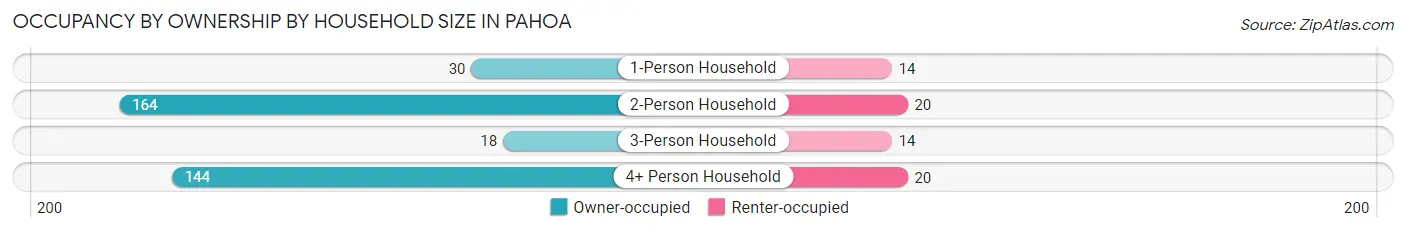
| Household Size | Owner-occupied | Renter-occupied |
| 1-Person Household | 30 (68.2%) | 14 (31.8%) |
| 2-Person Household | 164 (89.1%) | 20 (10.9%) |
| 3-Person Household | 18 (56.2%) | 14 (43.8%) |
| 4+ Person Household | 144 (87.8%) | 20 (12.2%) |
| Total Housing Units | 356 (84.0%) | 68 (16.0%) |
Occupancy by Educational Attainment in Pahoa
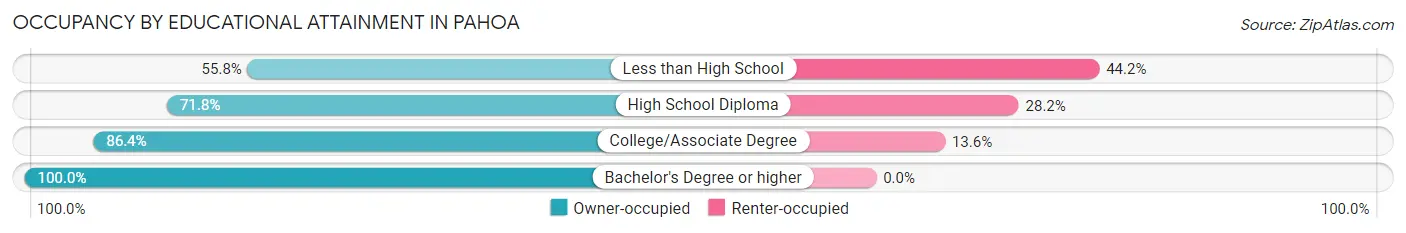
| Household Size | Owner-occupied | Renter-occupied |
| Less than High School | 29 (55.8%) | 23 (44.2%) |
| High School Diploma | 61 (71.8%) | 24 (28.2%) |
| College/Associate Degree | 133 (86.4%) | 21 (13.6%) |
| Bachelor's Degree or higher | 133 (100.0%) | 0 (0.0%) |
Occupancy by Age of Householder in Pahoa
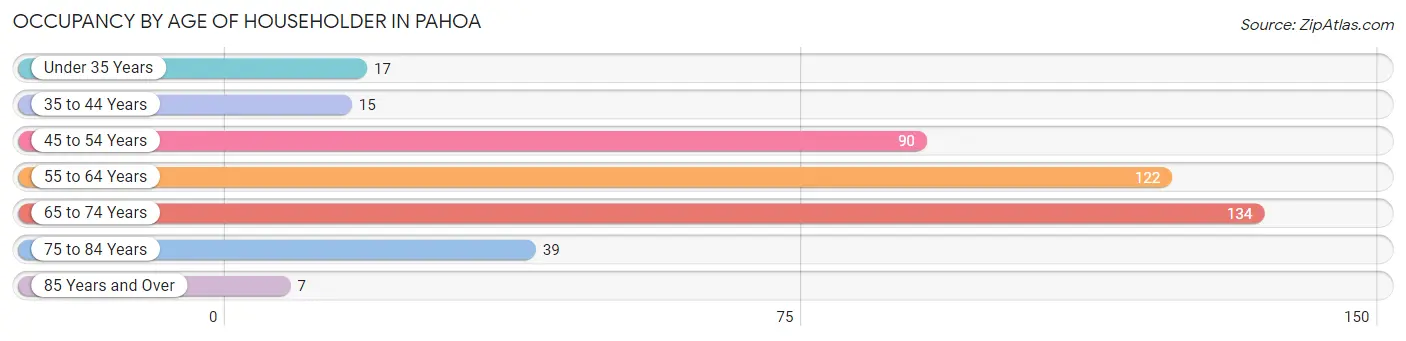
| Age Bracket | # Households | % Households |
| Under 35 Years | 17 | 4.0% |
| 35 to 44 Years | 15 | 3.5% |
| 45 to 54 Years | 90 | 21.2% |
| 55 to 64 Years | 122 | 28.8% |
| 65 to 74 Years | 134 | 31.6% |
| 75 to 84 Years | 39 | 9.2% |
| 85 Years and Over | 7 | 1.7% |
| Total | 424 | 100.0% |
Housing Finances in Pahoa
Median Income by Occupancy in Pahoa
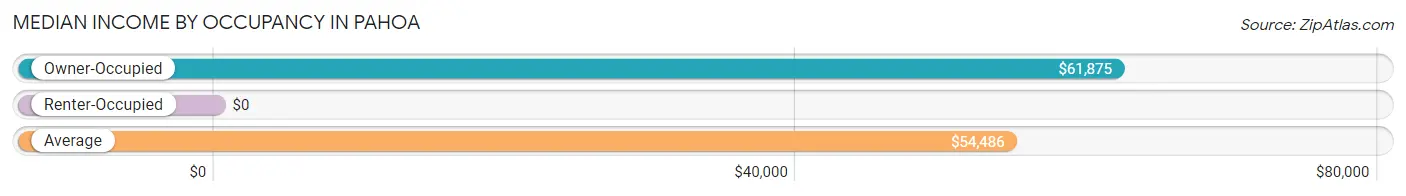
| Occupancy Type | # Households | Median Income |
| Owner-Occupied | 356 (84.0%) | $61,875 |
| Renter-Occupied | 68 (16.0%) | $0 |
| Average | 424 (100.0%) | $54,486 |
Occupancy by Householder Income Bracket in Pahoa
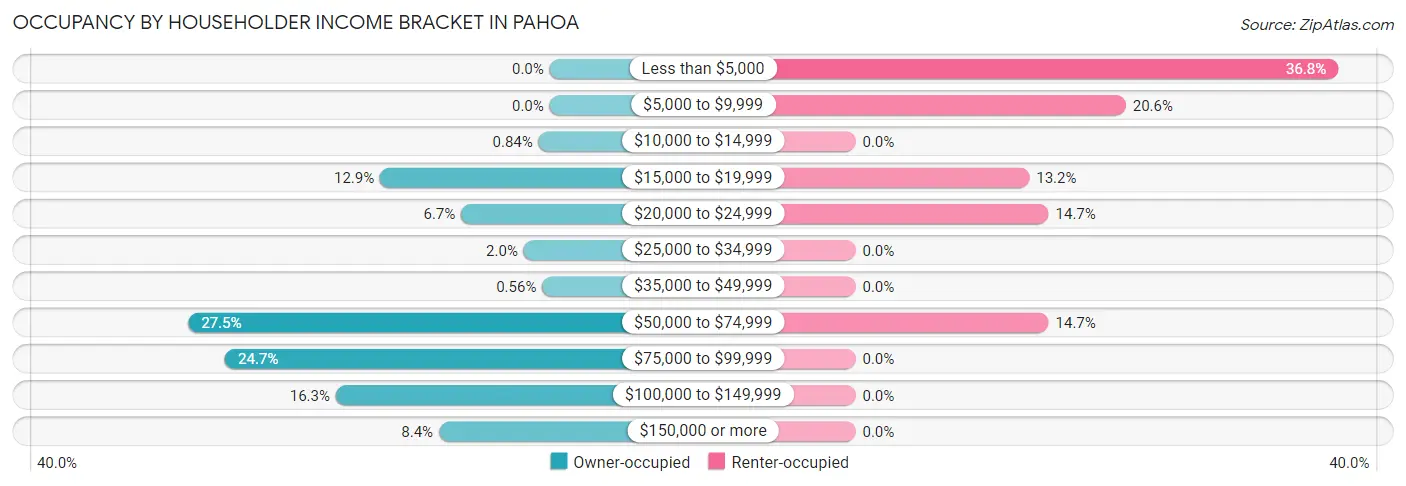
| Income Bracket | Owner-occupied | Renter-occupied |
| Less than $5,000 | 0 (0.0%) | 25 (36.8%) |
| $5,000 to $9,999 | 0 (0.0%) | 14 (20.6%) |
| $10,000 to $14,999 | 3 (0.8%) | 0 (0.0%) |
| $15,000 to $19,999 | 46 (12.9%) | 9 (13.2%) |
| $20,000 to $24,999 | 24 (6.7%) | 10 (14.7%) |
| $25,000 to $34,999 | 7 (2.0%) | 0 (0.0%) |
| $35,000 to $49,999 | 2 (0.6%) | 0 (0.0%) |
| $50,000 to $74,999 | 98 (27.5%) | 10 (14.7%) |
| $75,000 to $99,999 | 88 (24.7%) | 0 (0.0%) |
| $100,000 to $149,999 | 58 (16.3%) | 0 (0.0%) |
| $150,000 or more | 30 (8.4%) | 0 (0.0%) |
| Total | 356 (100.0%) | 68 (100.0%) |
Monthly Housing Cost Tiers in Pahoa
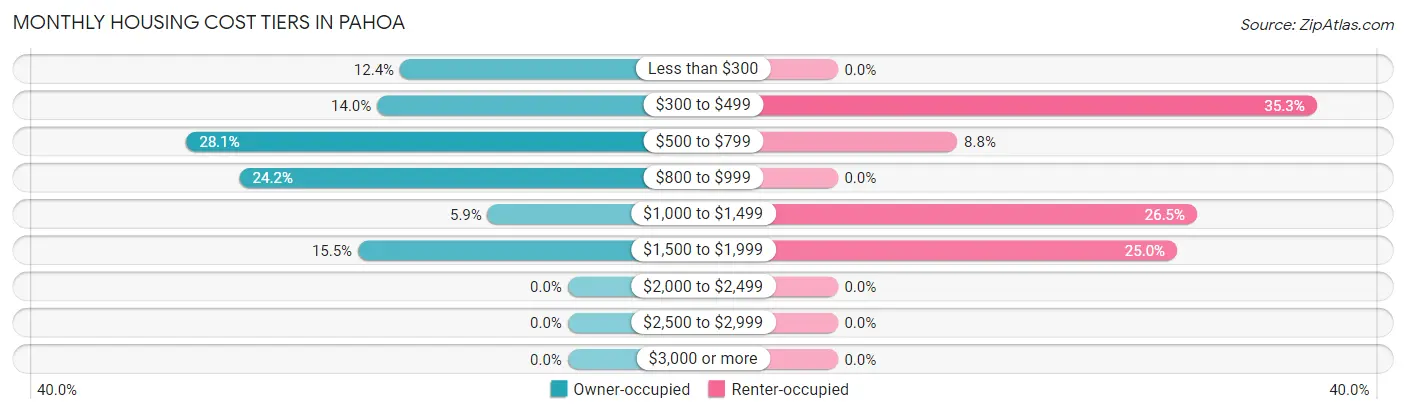
| Monthly Cost | Owner-occupied | Renter-occupied |
| Less than $300 | 44 (12.4%) | 0 (0.0%) |
| $300 to $499 | 50 (14.0%) | 24 (35.3%) |
| $500 to $799 | 100 (28.1%) | 6 (8.8%) |
| $800 to $999 | 86 (24.2%) | 0 (0.0%) |
| $1,000 to $1,499 | 21 (5.9%) | 18 (26.5%) |
| $1,500 to $1,999 | 55 (15.4%) | 17 (25.0%) |
| $2,000 to $2,499 | 0 (0.0%) | 0 (0.0%) |
| $2,500 to $2,999 | 0 (0.0%) | 0 (0.0%) |
| $3,000 or more | 0 (0.0%) | 0 (0.0%) |
| Total | 356 (100.0%) | 68 (100.0%) |
Physical Housing Characteristics in Pahoa
Housing Structures in Pahoa
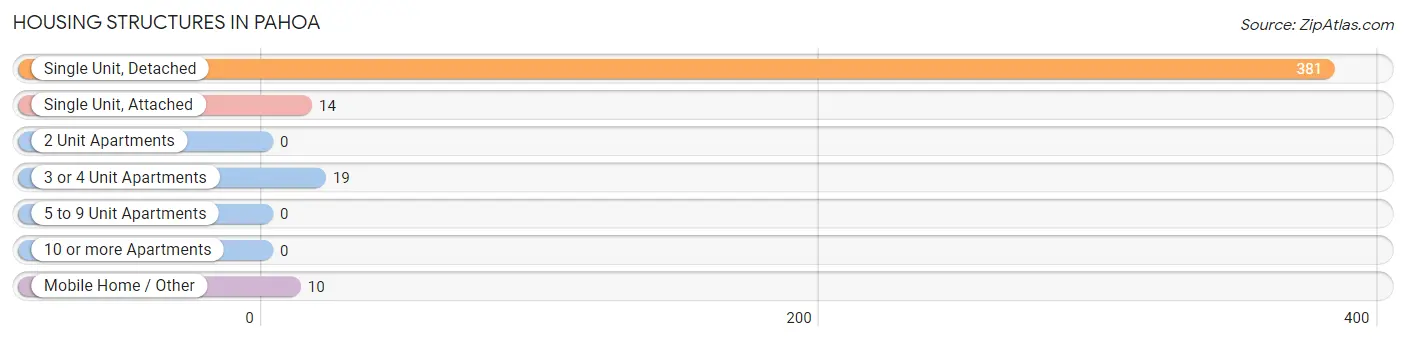
| Structure Type | # Housing Units | % Housing Units |
| Single Unit, Detached | 381 | 89.9% |
| Single Unit, Attached | 14 | 3.3% |
| 2 Unit Apartments | 0 | 0.0% |
| 3 or 4 Unit Apartments | 19 | 4.5% |
| 5 to 9 Unit Apartments | 0 | 0.0% |
| 10 or more Apartments | 0 | 0.0% |
| Mobile Home / Other | 10 | 2.4% |
| Total | 424 | 100.0% |
Housing Structures by Occupancy in Pahoa
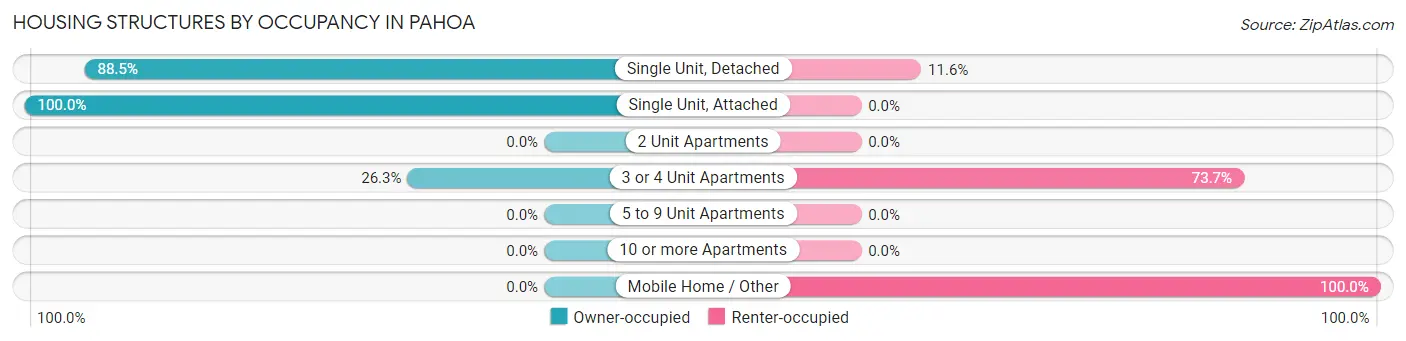
| Structure Type | Owner-occupied | Renter-occupied |
| Single Unit, Detached | 337 (88.4%) | 44 (11.6%) |
| Single Unit, Attached | 14 (100.0%) | 0 (0.0%) |
| 2 Unit Apartments | 0 (0.0%) | 0 (0.0%) |
| 3 or 4 Unit Apartments | 5 (26.3%) | 14 (73.7%) |
| 5 to 9 Unit Apartments | 0 (0.0%) | 0 (0.0%) |
| 10 or more Apartments | 0 (0.0%) | 0 (0.0%) |
| Mobile Home / Other | 0 (0.0%) | 10 (100.0%) |
| Total | 356 (84.0%) | 68 (16.0%) |
Housing Structures by Number of Rooms in Pahoa
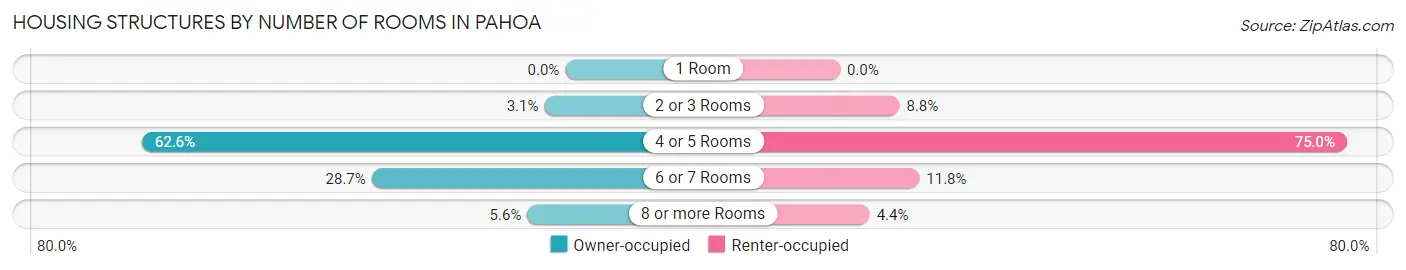
| Number of Rooms | Owner-occupied | Renter-occupied |
| 1 Room | 0 (0.0%) | 0 (0.0%) |
| 2 or 3 Rooms | 11 (3.1%) | 6 (8.8%) |
| 4 or 5 Rooms | 223 (62.6%) | 51 (75.0%) |
| 6 or 7 Rooms | 102 (28.6%) | 8 (11.8%) |
| 8 or more Rooms | 20 (5.6%) | 3 (4.4%) |
| Total | 356 (100.0%) | 68 (100.0%) |
Housing Structure by Heating Type in Pahoa
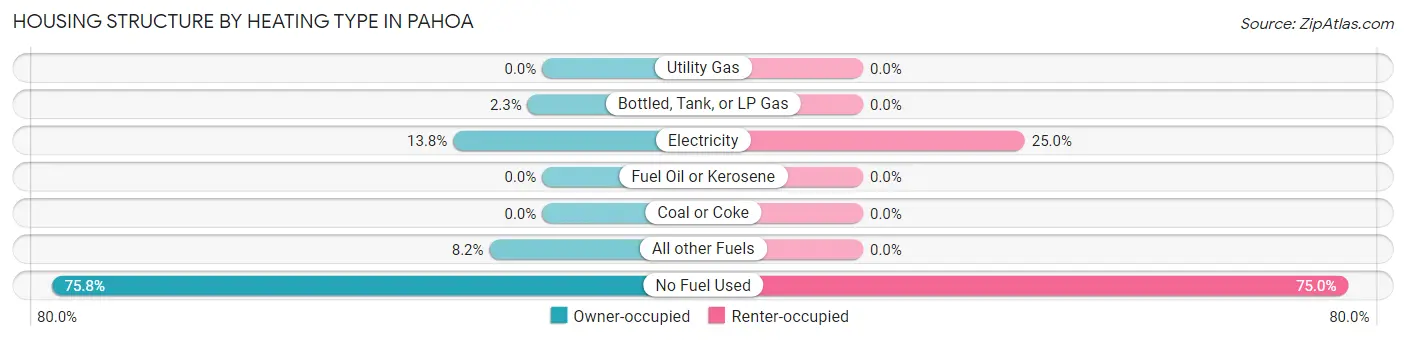
| Heating Type | Owner-occupied | Renter-occupied |
| Utility Gas | 0 (0.0%) | 0 (0.0%) |
| Bottled, Tank, or LP Gas | 8 (2.2%) | 0 (0.0%) |
| Electricity | 49 (13.8%) | 17 (25.0%) |
| Fuel Oil or Kerosene | 0 (0.0%) | 0 (0.0%) |
| Coal or Coke | 0 (0.0%) | 0 (0.0%) |
| All other Fuels | 29 (8.2%) | 0 (0.0%) |
| No Fuel Used | 270 (75.8%) | 51 (75.0%) |
| Total | 356 (100.0%) | 68 (100.0%) |
Household Vehicle Usage in Pahoa
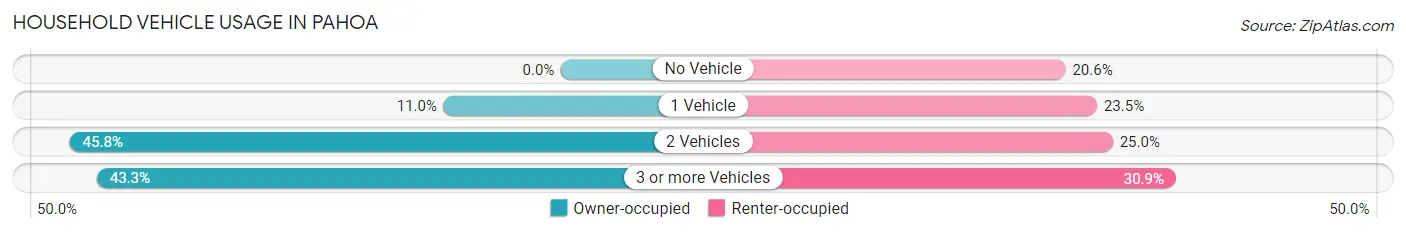
| Vehicles per Household | Owner-occupied | Renter-occupied |
| No Vehicle | 0 (0.0%) | 14 (20.6%) |
| 1 Vehicle | 39 (11.0%) | 16 (23.5%) |
| 2 Vehicles | 163 (45.8%) | 17 (25.0%) |
| 3 or more Vehicles | 154 (43.3%) | 21 (30.9%) |
| Total | 356 (100.0%) | 68 (100.0%) |
Real Estate & Mortgages in Pahoa
Real Estate and Mortgage Overview in Pahoa
| Characteristic | Without Mortgage | With Mortgage |
| Housing Units | 178 | 178 |
| Median Property Value | $386,500 | $0 |
| Median Household Income | $76,085 | $19 |
| Monthly Housing Costs | $650 | $0 |
| Real Estate Taxes | $1,229 | $26 |
Property Value by Mortgage Status in Pahoa
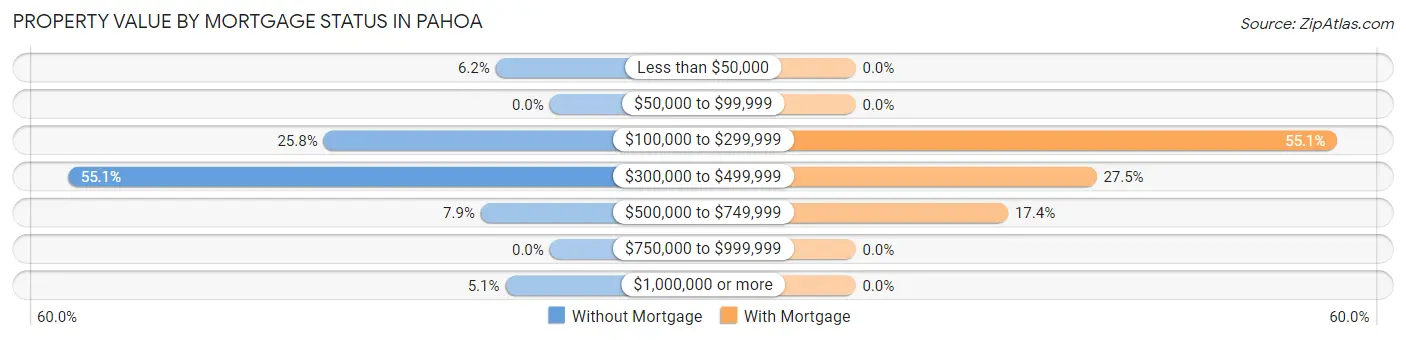
| Property Value | Without Mortgage | With Mortgage |
| Less than $50,000 | 11 (6.2%) | 0 (0.0%) |
| $50,000 to $99,999 | 0 (0.0%) | 0 (0.0%) |
| $100,000 to $299,999 | 46 (25.8%) | 98 (55.1%) |
| $300,000 to $499,999 | 98 (55.1%) | 49 (27.5%) |
| $500,000 to $749,999 | 14 (7.9%) | 31 (17.4%) |
| $750,000 to $999,999 | 0 (0.0%) | 0 (0.0%) |
| $1,000,000 or more | 9 (5.1%) | 0 (0.0%) |
| Total | 178 (100.0%) | 178 (100.0%) |
Household Income by Mortgage Status in Pahoa
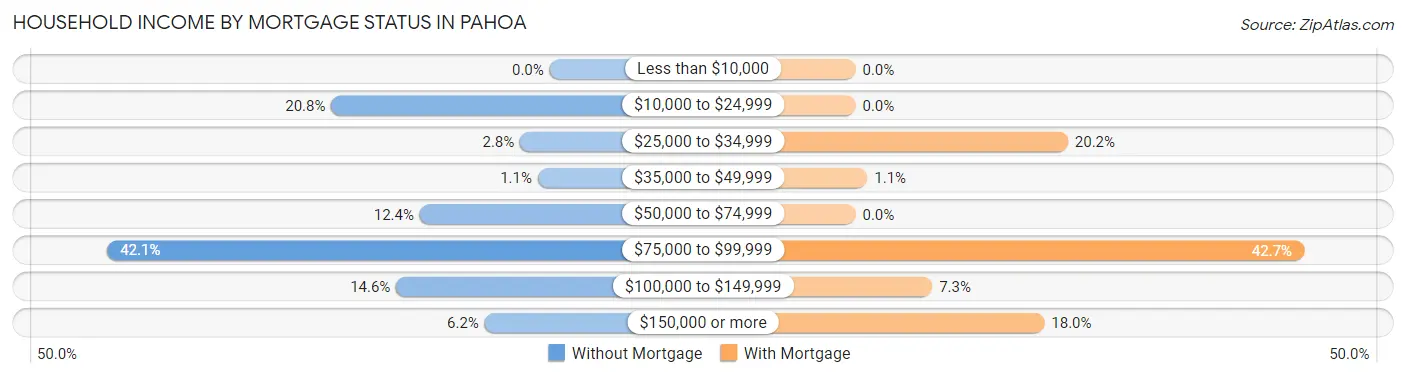
| Household Income | Without Mortgage | With Mortgage |
| Less than $10,000 | 0 (0.0%) | 0 (0.0%) |
| $10,000 to $24,999 | 37 (20.8%) | 0 (0.0%) |
| $25,000 to $34,999 | 5 (2.8%) | 36 (20.2%) |
| $35,000 to $49,999 | 2 (1.1%) | 2 (1.1%) |
| $50,000 to $74,999 | 22 (12.4%) | 0 (0.0%) |
| $75,000 to $99,999 | 75 (42.1%) | 76 (42.7%) |
| $100,000 to $149,999 | 26 (14.6%) | 13 (7.3%) |
| $150,000 or more | 11 (6.2%) | 32 (18.0%) |
| Total | 178 (100.0%) | 178 (100.0%) |
Property Value to Household Income Ratio in Pahoa
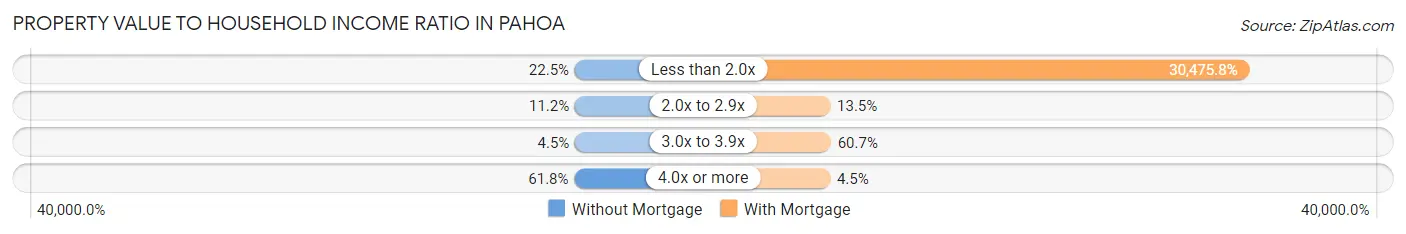
| Value-to-Income Ratio | Without Mortgage | With Mortgage |
| Less than 2.0x | 40 (22.5%) | 54,247 (30,475.8%) |
| 2.0x to 2.9x | 20 (11.2%) | 24 (13.5%) |
| 3.0x to 3.9x | 8 (4.5%) | 108 (60.7%) |
| 4.0x or more | 110 (61.8%) | 8 (4.5%) |
| Total | 178 (100.0%) | 178 (100.0%) |
Real Estate Taxes by Mortgage Status in Pahoa
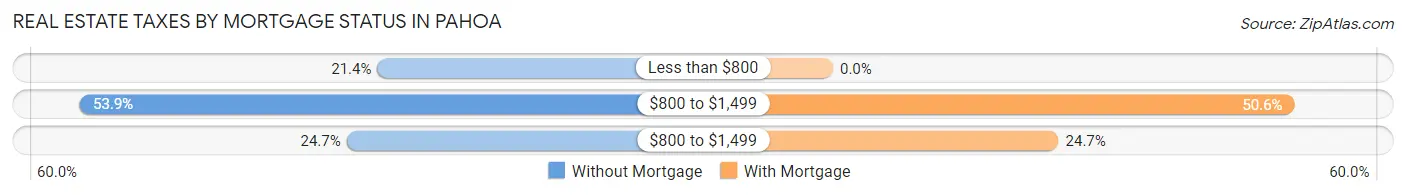
| Property Taxes | Without Mortgage | With Mortgage |
| Less than $800 | 38 (21.3%) | 0 (0.0%) |
| $800 to $1,499 | 96 (53.9%) | 90 (50.6%) |
| $800 to $1,499 | 44 (24.7%) | 44 (24.7%) |
| Total | 178 (100.0%) | 178 (100.0%) |
Health & Disability in Pahoa
Health Insurance Coverage by Age in Pahoa
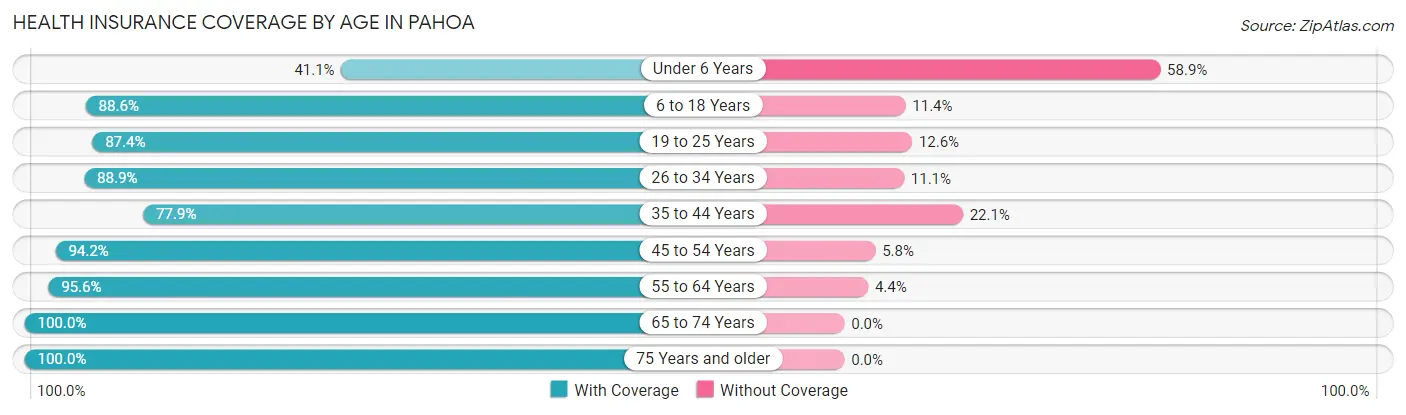
| Age Bracket | With Coverage | Without Coverage |
| Under 6 Years | 30 (41.1%) | 43 (58.9%) |
| 6 to 18 Years | 179 (88.6%) | 23 (11.4%) |
| 19 to 25 Years | 90 (87.4%) | 13 (12.6%) |
| 26 to 34 Years | 112 (88.9%) | 14 (11.1%) |
| 35 to 44 Years | 120 (77.9%) | 34 (22.1%) |
| 45 to 54 Years | 131 (94.2%) | 8 (5.8%) |
| 55 to 64 Years | 217 (95.6%) | 10 (4.4%) |
| 65 to 74 Years | 248 (100.0%) | 0 (0.0%) |
| 75 Years and older | 100 (100.0%) | 0 (0.0%) |
| Total | 1,227 (89.4%) | 145 (10.6%) |
Health Insurance Coverage by Citizenship Status in Pahoa
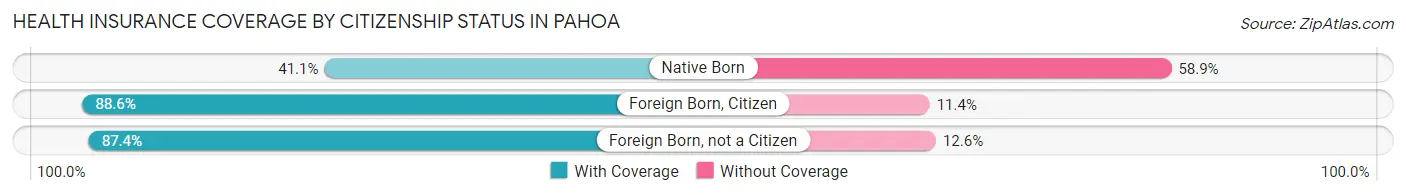
| Citizenship Status | With Coverage | Without Coverage |
| Native Born | 30 (41.1%) | 43 (58.9%) |
| Foreign Born, Citizen | 179 (88.6%) | 23 (11.4%) |
| Foreign Born, not a Citizen | 90 (87.4%) | 13 (12.6%) |
Health Insurance Coverage by Household Income in Pahoa
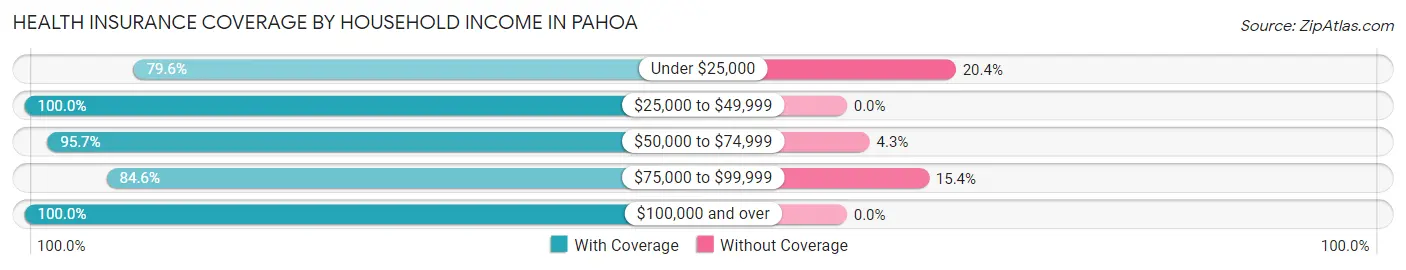
| Household Income | With Coverage | Without Coverage |
| Under $25,000 | 273 (79.6%) | 70 (20.4%) |
| $25,000 to $49,999 | 17 (100.0%) | 0 (0.0%) |
| $50,000 to $74,999 | 224 (95.7%) | 10 (4.3%) |
| $75,000 to $99,999 | 358 (84.6%) | 65 (15.4%) |
| $100,000 and over | 340 (100.0%) | 0 (0.0%) |
Public vs Private Health Insurance Coverage by Age in Pahoa
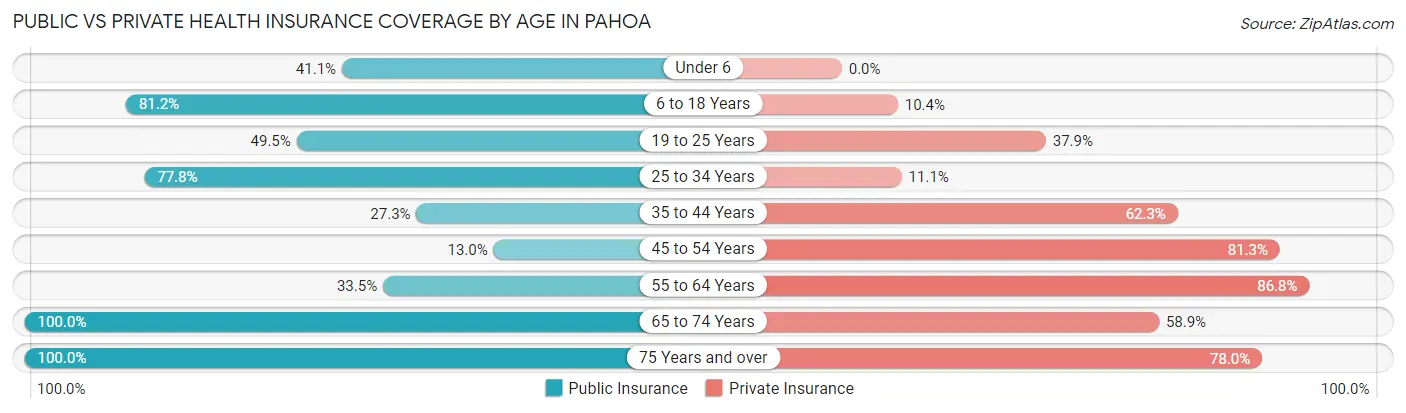
| Age Bracket | Public Insurance | Private Insurance |
| Under 6 | 30 (41.1%) | 0 (0.0%) |
| 6 to 18 Years | 164 (81.2%) | 21 (10.4%) |
| 19 to 25 Years | 51 (49.5%) | 39 (37.9%) |
| 25 to 34 Years | 98 (77.8%) | 14 (11.1%) |
| 35 to 44 Years | 42 (27.3%) | 96 (62.3%) |
| 45 to 54 Years | 18 (13.0%) | 113 (81.3%) |
| 55 to 64 Years | 76 (33.5%) | 197 (86.8%) |
| 65 to 74 Years | 248 (100.0%) | 146 (58.9%) |
| 75 Years and over | 100 (100.0%) | 78 (78.0%) |
| Total | 827 (60.3%) | 704 (51.3%) |
Disability Status by Sex by Age in Pahoa
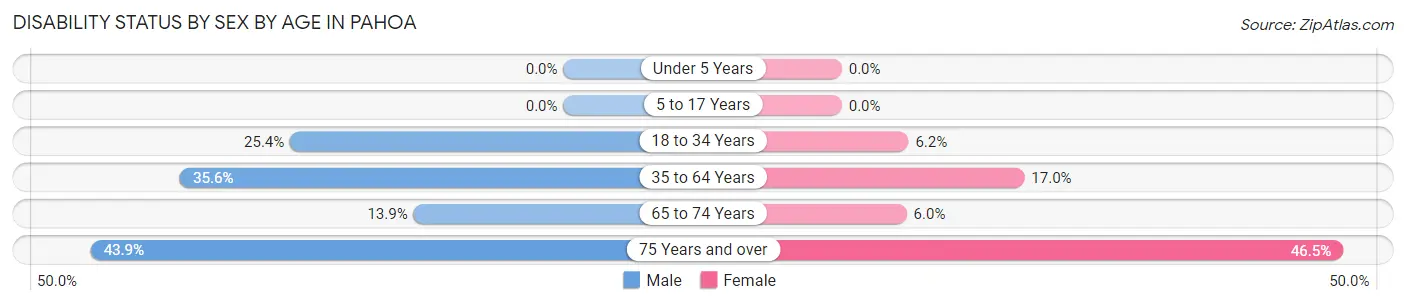
| Age Bracket | Male | Female |
| Under 5 Years | 0 (0.0%) | 0 (0.0%) |
| 5 to 17 Years | 0 (0.0%) | 0 (0.0%) |
| 18 to 34 Years | 35 (25.4%) | 7 (6.2%) |
| 35 to 64 Years | 101 (35.6%) | 40 (17.0%) |
| 65 to 74 Years | 16 (13.9%) | 8 (6.0%) |
| 75 Years and over | 25 (43.9%) | 20 (46.5%) |
Disability Class by Sex by Age in Pahoa
Disability Class: Hearing Difficulty
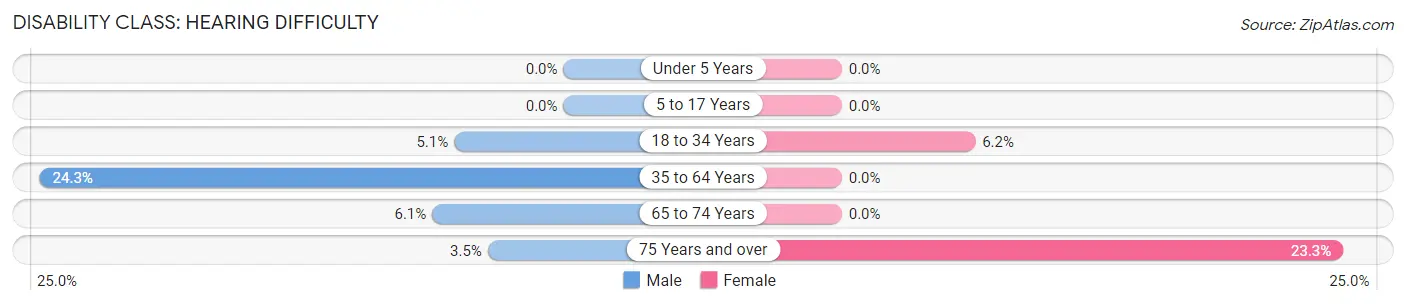
| Age Bracket | Male | Female |
| Under 5 Years | 0 (0.0%) | 0 (0.0%) |
| 5 to 17 Years | 0 (0.0%) | 0 (0.0%) |
| 18 to 34 Years | 7 (5.1%) | 7 (6.2%) |
| 35 to 64 Years | 69 (24.3%) | 0 (0.0%) |
| 65 to 74 Years | 7 (6.1%) | 0 (0.0%) |
| 75 Years and over | 2 (3.5%) | 10 (23.3%) |
Disability Class: Vision Difficulty
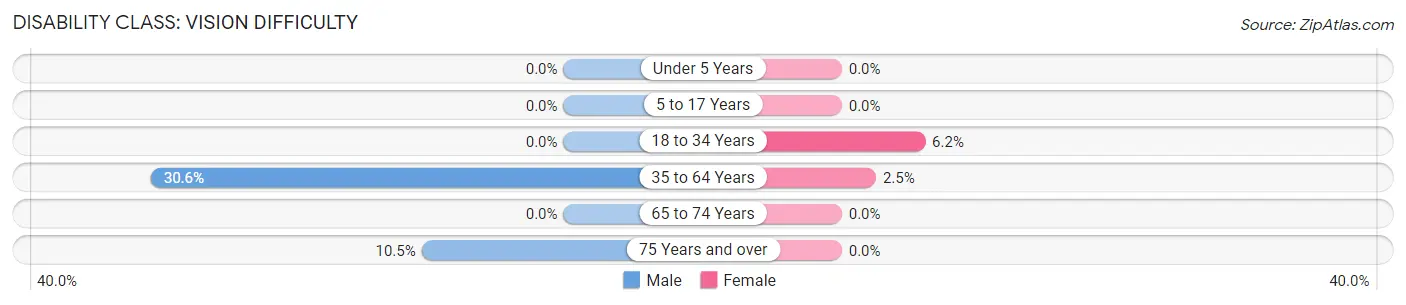
| Age Bracket | Male | Female |
| Under 5 Years | 0 (0.0%) | 0 (0.0%) |
| 5 to 17 Years | 0 (0.0%) | 0 (0.0%) |
| 18 to 34 Years | 0 (0.0%) | 7 (6.2%) |
| 35 to 64 Years | 87 (30.6%) | 6 (2.5%) |
| 65 to 74 Years | 0 (0.0%) | 0 (0.0%) |
| 75 Years and over | 6 (10.5%) | 0 (0.0%) |
Disability Class: Cognitive Difficulty
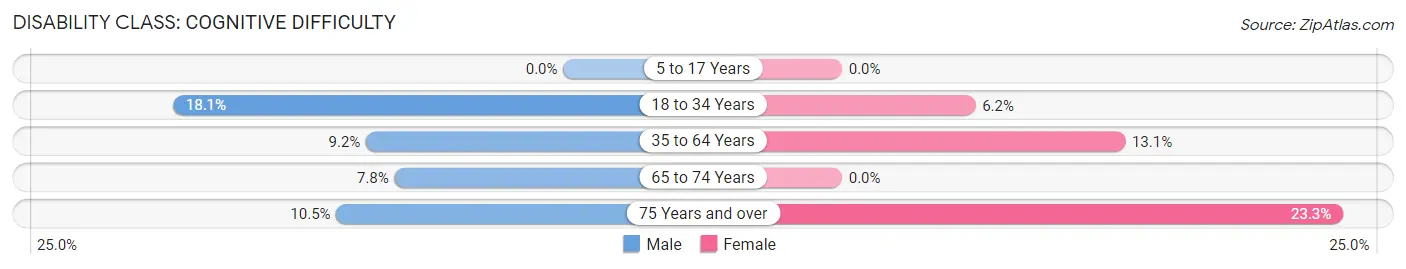
| Age Bracket | Male | Female |
| 5 to 17 Years | 0 (0.0%) | 0 (0.0%) |
| 18 to 34 Years | 25 (18.1%) | 7 (6.2%) |
| 35 to 64 Years | 26 (9.1%) | 31 (13.1%) |
| 65 to 74 Years | 9 (7.8%) | 0 (0.0%) |
| 75 Years and over | 6 (10.5%) | 10 (23.3%) |
Disability Class: Ambulatory Difficulty
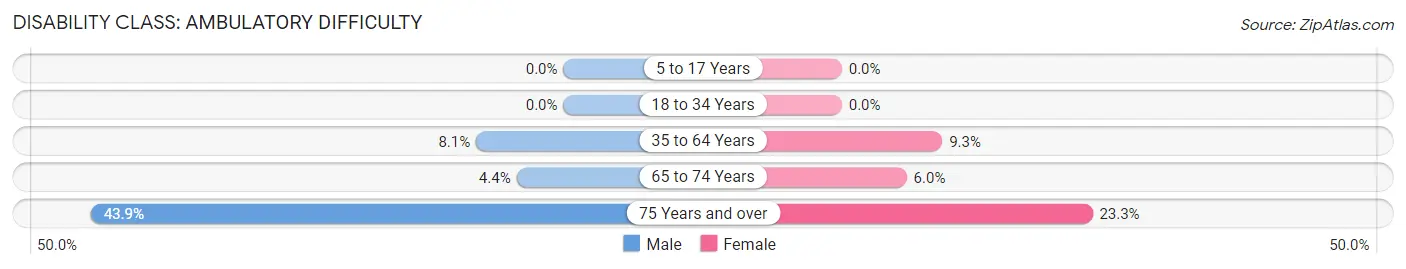
| Age Bracket | Male | Female |
| 5 to 17 Years | 0 (0.0%) | 0 (0.0%) |
| 18 to 34 Years | 0 (0.0%) | 0 (0.0%) |
| 35 to 64 Years | 23 (8.1%) | 22 (9.3%) |
| 65 to 74 Years | 5 (4.3%) | 8 (6.0%) |
| 75 Years and over | 25 (43.9%) | 10 (23.3%) |
Disability Class: Self-Care Difficulty
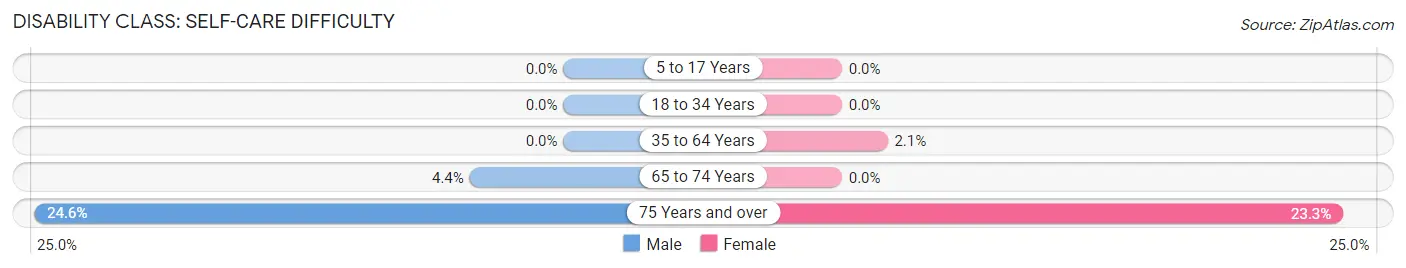
| Age Bracket | Male | Female |
| 5 to 17 Years | 0 (0.0%) | 0 (0.0%) |
| 18 to 34 Years | 0 (0.0%) | 0 (0.0%) |
| 35 to 64 Years | 0 (0.0%) | 5 (2.1%) |
| 65 to 74 Years | 5 (4.3%) | 0 (0.0%) |
| 75 Years and over | 14 (24.6%) | 10 (23.3%) |
Technology Access in Pahoa
Computing Device Access in Pahoa
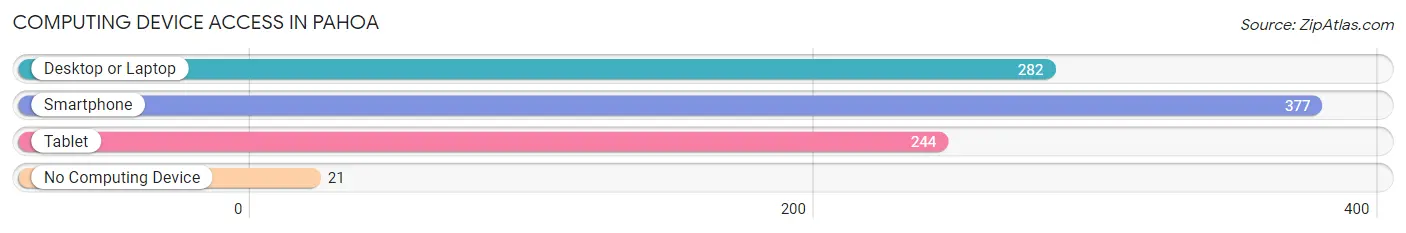
| Device Type | # Households | % Households |
| Desktop or Laptop | 282 | 66.5% |
| Smartphone | 377 | 88.9% |
| Tablet | 244 | 57.6% |
| No Computing Device | 21 | 5.0% |
| Total | 424 | 100.0% |
Internet Access in Pahoa
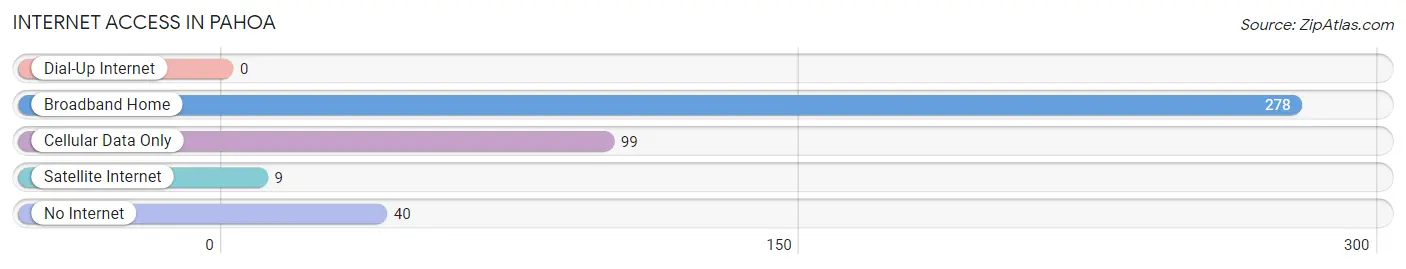
| Internet Type | # Households | % Households |
| Dial-Up Internet | 0 | 0.0% |
| Broadband Home | 278 | 65.6% |
| Cellular Data Only | 99 | 23.4% |
| Satellite Internet | 9 | 2.1% |
| No Internet | 40 | 9.4% |
| Total | 424 | 100.0% |
Pahoa Summary
Pahoa is a small town located on the Big Island of Hawaii. It is situated in the Puna District, which is the easternmost district of the island. The town is located on the eastern side of the island, near the town of Hilo. Pahoa is known for its laid-back atmosphere and its close proximity to the ocean.
History
Pahoa has a long and rich history. The area was first settled by Polynesian voyagers in the late 1700s. The first Europeans to visit the area were Captain James Cook and his crew in 1779. They named the area Pahoa, which means “long spear” in Hawaiian.
In the late 1800s, Pahoa became a popular destination for whalers and traders. The town was also a major port for the sugar industry, which was booming in Hawaii at the time. In the early 1900s, Pahoa became a popular tourist destination, and many of the buildings in the town were built during this period.
Geography
Pahoa is located on the eastern side of the Big Island of Hawaii. It is situated in the Puna District, which is the easternmost district of the island. The town is located near the town of Hilo, which is the largest city on the island.
The town is situated on the slopes of the Mauna Loa volcano, which is the largest active volcano in the world. The town is surrounded by lush tropical rainforest and is located near the Pacific Ocean.
Economy
The economy of Pahoa is largely based on tourism and agriculture. The town is a popular destination for tourists, who come to enjoy the laid-back atmosphere and the close proximity to the ocean.
Agriculture is also an important part of the economy. The town is home to many small farms, which produce a variety of fruits and vegetables. The town is also home to a number of small businesses, such as restaurants, shops, and art galleries.
Demographics
As of the 2010 census, the population of Pahoa was 1,956. The town is predominantly white, with a small percentage of Asian and Native Hawaiian residents. The median age of the population is 44.
The town has a high rate of poverty, with nearly one-third of the population living below the poverty line. The median household income is $41,000, which is lower than the national average.
Conclusion
Pahoa is a small town located on the Big Island of Hawaii. It is situated in the Puna District, which is the easternmost district of the island. The town is known for its laid-back atmosphere and its close proximity to the ocean. The economy of Pahoa is largely based on tourism and agriculture, and the town has a population of 1,956 as of the 2010 census. The town has a high rate of poverty, with nearly one-third of the population living below the poverty line.
Common Questions
What is Per Capita Income in Pahoa?
Per Capita income in Pahoa is $22,070.
What is the Median Family Income in Pahoa?
Median Family Income in Pahoa is $53,031.
What is the Median Household income in Pahoa?
Median Household Income in Pahoa is $54,486.
What is Inequality or Gini Index in Pahoa?
Inequality or Gini Index in Pahoa is 0.46.
What is the Total Population of Pahoa?
Total Population of Pahoa is 1,372.
What is the Total Male Population of Pahoa?
Total Male Population of Pahoa is 693.
What is the Total Female Population of Pahoa?
Total Female Population of Pahoa is 679.
What is the Ratio of Males per 100 Females in Pahoa?
There are 102.06 Males per 100 Females in Pahoa.
What is the Ratio of Females per 100 Males in Pahoa?
There are 97.98 Females per 100 Males in Pahoa.
What is the Median Population Age in Pahoa?
Median Population Age in Pahoa is 47.4 Years.
What is the Average Family Size in Pahoa
Average Family Size in Pahoa is 3.0 People.
What is the Average Household Size in Pahoa
Average Household Size in Pahoa is 3.2 People.
How Large is the Labor Force in Pahoa?
There are 591 People in the Labor Forcein in Pahoa.
What is the Percentage of People in the Labor Force in Pahoa?
51.2% of People are in the Labor Force in Pahoa.
What is the Unemployment Rate in Pahoa?
Unemployment Rate in Pahoa is 8.6%.