Hawaiian Acres, HI Map & Demographics
Hawaiian Acres Map
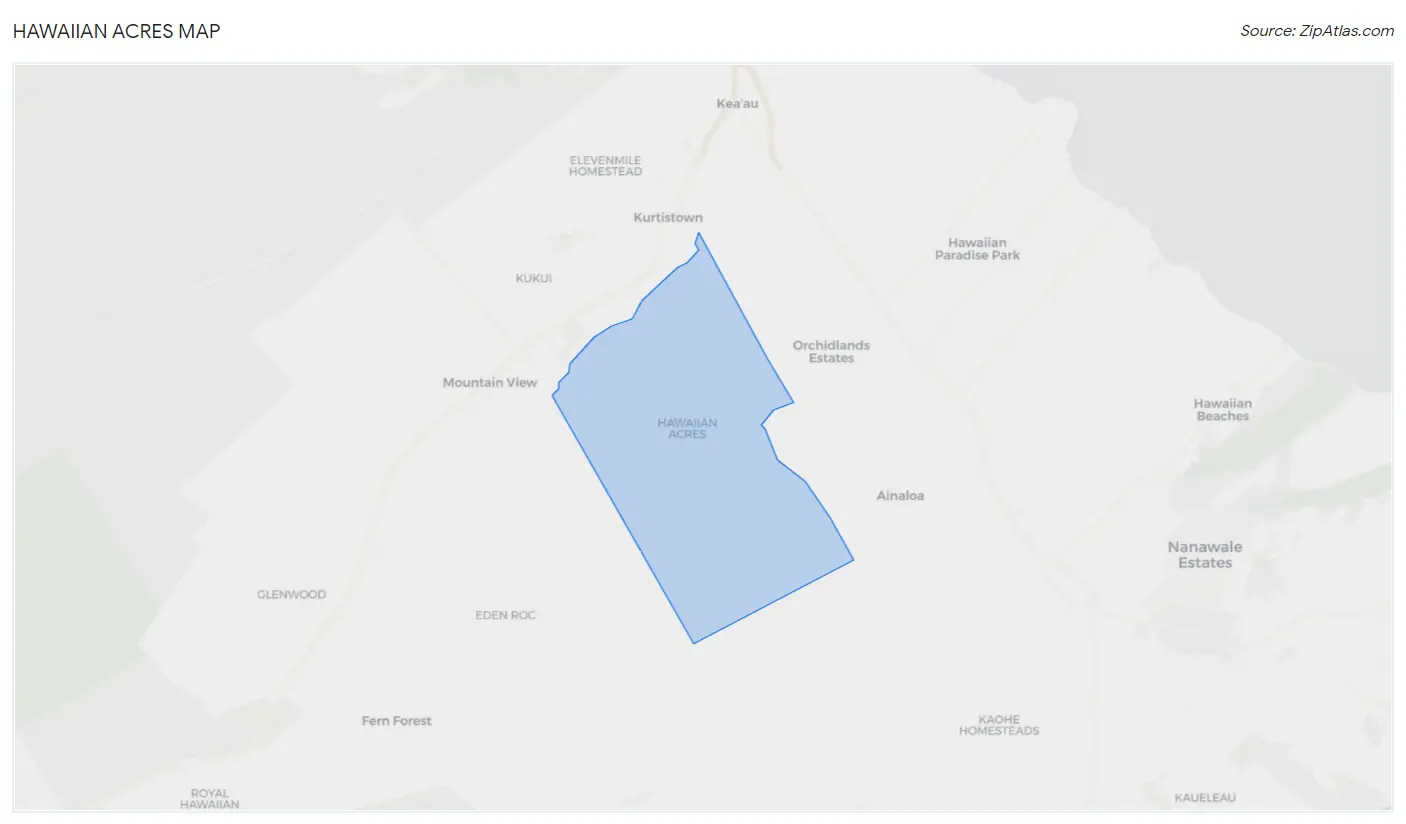
Hawaiian Acres Overview
$30,758
PER CAPITA INCOME
$97,328
AVG FAMILY INCOME
$74,851
AVG HOUSEHOLD INCOME
45.1%
WAGE / INCOME GAP [ % ]
54.9¢/ $1
WAGE / INCOME GAP [ $ ]
0.41
INEQUALITY / GINI INDEX
3,484
TOTAL POPULATION
1,664
MALE POPULATION
1,820
FEMALE POPULATION
91.43
MALES / 100 FEMALES
109.38
FEMALES / 100 MALES
47.9
MEDIAN AGE
3.7
AVG FAMILY SIZE
2.7
AVG HOUSEHOLD SIZE
1,643
LABOR FORCE [ PEOPLE ]
55.7%
PERCENT IN LABOR FORCE
5.4%
UNEMPLOYMENT RATE
Income in Hawaiian Acres
Income Overview in Hawaiian Acres
Per Capita Income in Hawaiian Acres is $30,758, while median incomes of families and households are $97,328 and $74,851 respectively.
| Characteristic | Number | Measure |
| Per Capita Income | 3,484 | $30,758 |
| Median Family Income | 751 | $97,328 |
| Mean Family Income | 751 | $95,242 |
| Median Household Income | 1,283 | $74,851 |
| Mean Household Income | 1,283 | $77,522 |
| Income Deficit | 751 | $0 |
| Wage / Income Gap (%) | 3,484 | 45.14% |
| Wage / Income Gap ($) | 3,484 | 54.86¢ per $1 |
| Gini / Inequality Index | 3,484 | 0.41 |
Earnings by Sex in Hawaiian Acres
Average Earnings in Hawaiian Acres are $41,771, $48,250 for men and $26,471 for women, a difference of 45.1%.
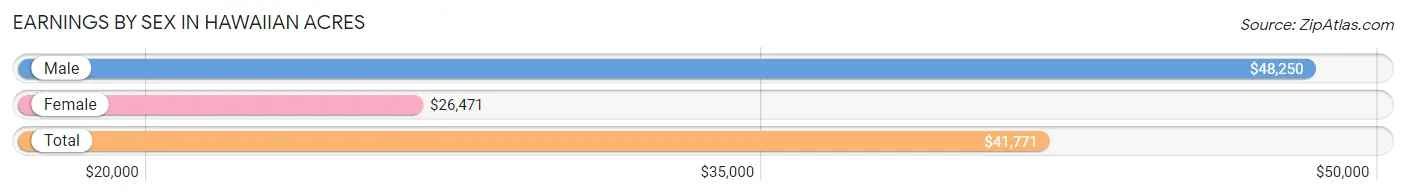
| Sex | Number | Average Earnings |
| Male | 850 (47.2%) | $48,250 |
| Female | 950 (52.8%) | $26,471 |
| Total | 1,800 (100.0%) | $41,771 |
Earnings by Sex by Income Bracket in Hawaiian Acres
The most common earnings brackets in Hawaiian Acres are $65,000 to $74,999 for men (119 | 14.0%) and $65,000 to $74,999 for women (149 | 15.7%).
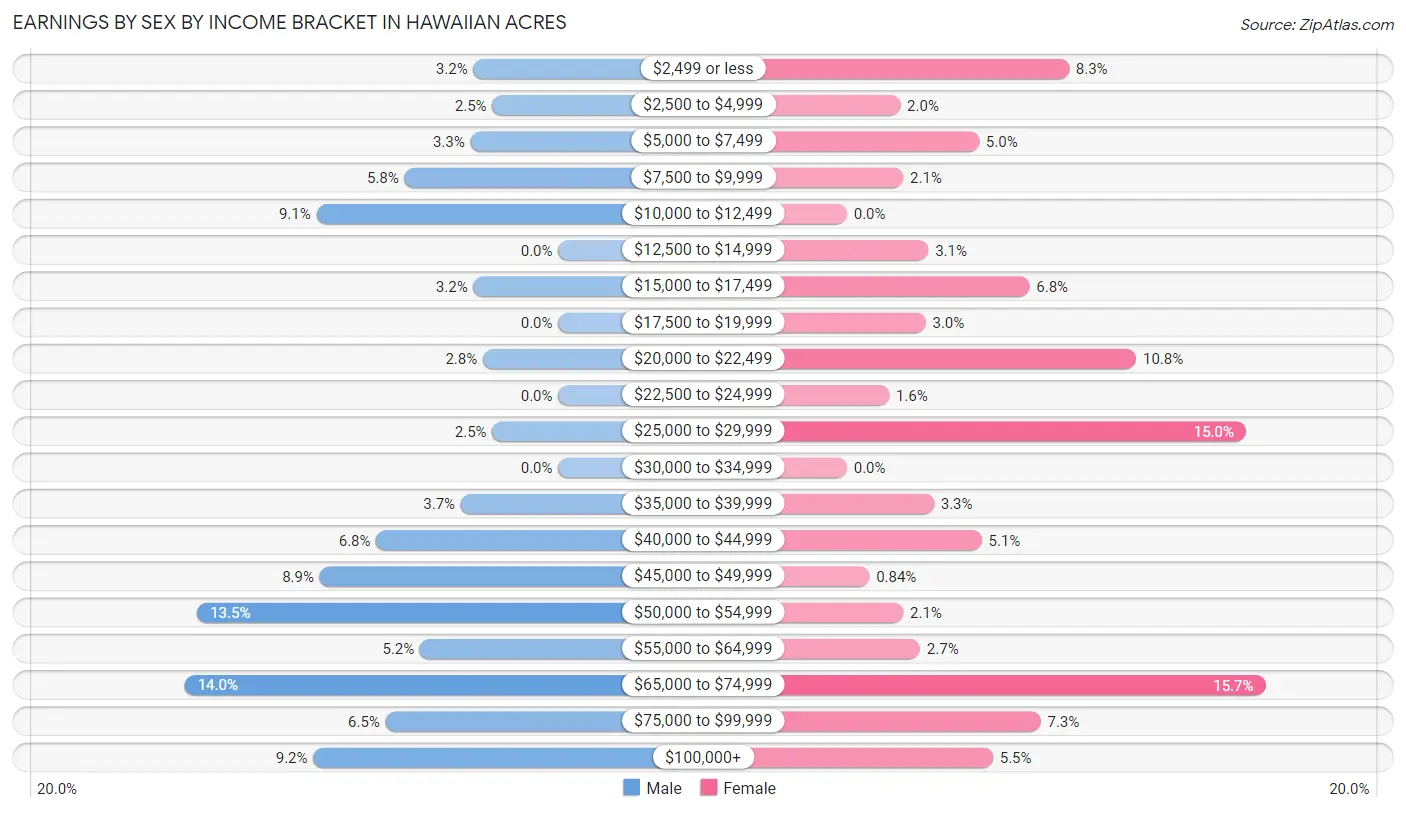
| Income | Male | Female |
| $2,499 or less | 27 (3.2%) | 79 (8.3%) |
| $2,500 to $4,999 | 21 (2.5%) | 19 (2.0%) |
| $5,000 to $7,499 | 28 (3.3%) | 47 (5.0%) |
| $7,500 to $9,999 | 49 (5.8%) | 20 (2.1%) |
| $10,000 to $12,499 | 77 (9.1%) | 0 (0.0%) |
| $12,500 to $14,999 | 0 (0.0%) | 29 (3.0%) |
| $15,000 to $17,499 | 27 (3.2%) | 65 (6.8%) |
| $17,500 to $19,999 | 0 (0.0%) | 28 (2.9%) |
| $20,000 to $22,499 | 24 (2.8%) | 103 (10.8%) |
| $22,500 to $24,999 | 0 (0.0%) | 15 (1.6%) |
| $25,000 to $29,999 | 21 (2.5%) | 142 (14.9%) |
| $30,000 to $34,999 | 0 (0.0%) | 0 (0.0%) |
| $35,000 to $39,999 | 31 (3.6%) | 31 (3.3%) |
| $40,000 to $44,999 | 58 (6.8%) | 48 (5.1%) |
| $45,000 to $49,999 | 76 (8.9%) | 8 (0.8%) |
| $50,000 to $54,999 | 115 (13.5%) | 20 (2.1%) |
| $55,000 to $64,999 | 44 (5.2%) | 26 (2.7%) |
| $65,000 to $74,999 | 119 (14.0%) | 149 (15.7%) |
| $75,000 to $99,999 | 55 (6.5%) | 69 (7.3%) |
| $100,000+ | 78 (9.2%) | 52 (5.5%) |
| Total | 850 (100.0%) | 950 (100.0%) |
Earnings by Sex by Educational Attainment in Hawaiian Acres
Average earnings in Hawaiian Acres are $52,946 for men and $37,935 for women, a difference of 28.3%. Men with an educational attainment of high school diploma enjoy the highest average annual earnings of $58,266, while those with college or associate's degree education earn the least with $45,580. Women with an educational attainment of bachelor's degree earn the most with the average annual earnings of $67,969, while those with high school diploma education have the smallest earnings of $20,243.
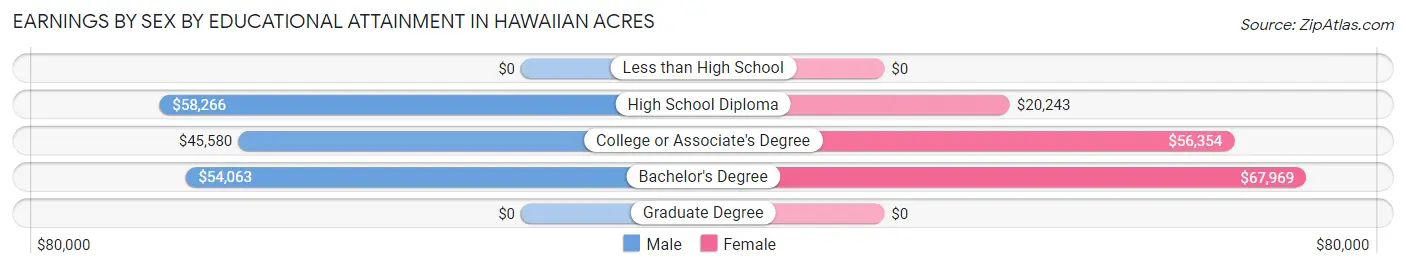
| Educational Attainment | Male Income | Female Income |
| Less than High School | - | - |
| High School Diploma | $58,266 | $20,243 |
| College or Associate's Degree | $45,580 | $56,354 |
| Bachelor's Degree | $54,063 | $67,969 |
| Graduate Degree | - | - |
| Total | $52,946 | $37,935 |
Family Income in Hawaiian Acres
Family Income Brackets in Hawaiian Acres
According to the Hawaiian Acres family income data, there are 314 families falling into the $100,000 to $149,999 income range, which is the most common income bracket and makes up 41.8% of all families.
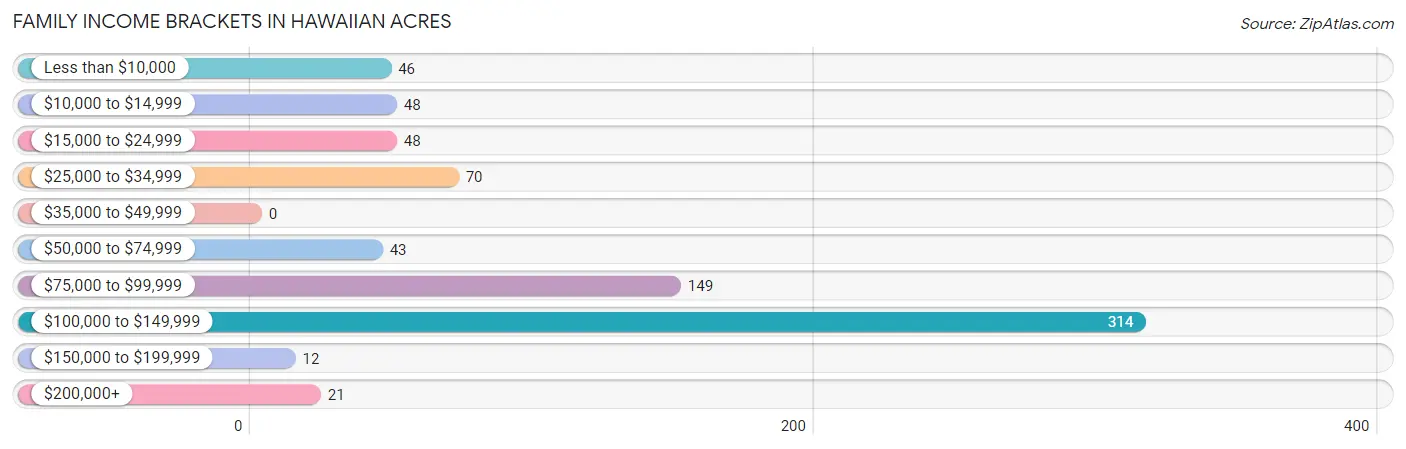
| Income Bracket | # Families | % Families |
| Less than $10,000 | 46 | 6.1% |
| $10,000 to $14,999 | 48 | 6.4% |
| $15,000 to $24,999 | 48 | 6.4% |
| $25,000 to $34,999 | 70 | 9.3% |
| $35,000 to $49,999 | 0 | 0.0% |
| $50,000 to $74,999 | 43 | 5.7% |
| $75,000 to $99,999 | 149 | 19.8% |
| $100,000 to $149,999 | 314 | 41.8% |
| $150,000 to $199,999 | 12 | 1.6% |
| $200,000+ | 21 | 2.8% |
Family Income by Famaliy Size in Hawaiian Acres
4-person families (281 | 37.4%) account for the highest median family income in Hawaiian Acres with $135,040 per family, while 3-person families (70 | 9.3%) have the highest median income of $38,750 per family member.
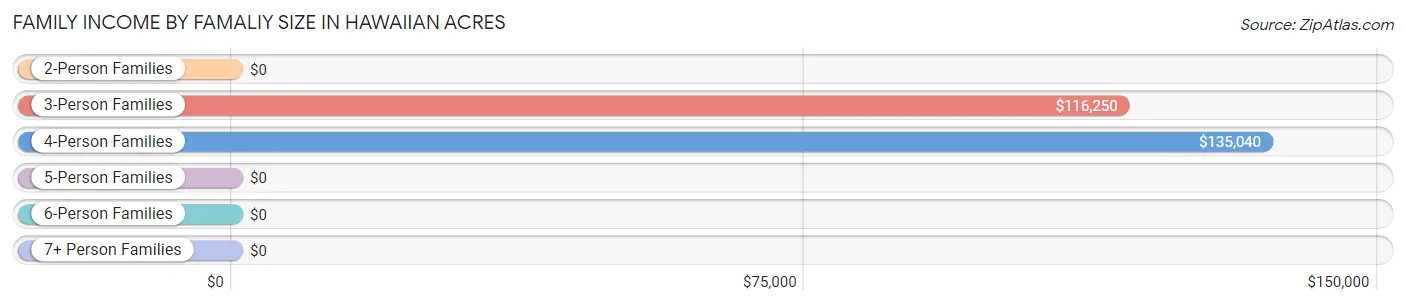
| Income Bracket | # Families | Median Income |
| 2-Person Families | 300 (40.0%) | $0 |
| 3-Person Families | 70 (9.3%) | $116,250 |
| 4-Person Families | 281 (37.4%) | $135,040 |
| 5-Person Families | 63 (8.4%) | $0 |
| 6-Person Families | 13 (1.7%) | $0 |
| 7+ Person Families | 24 (3.2%) | $0 |
| Total | 751 (100.0%) | $97,328 |
Family Income by Number of Earners in Hawaiian Acres
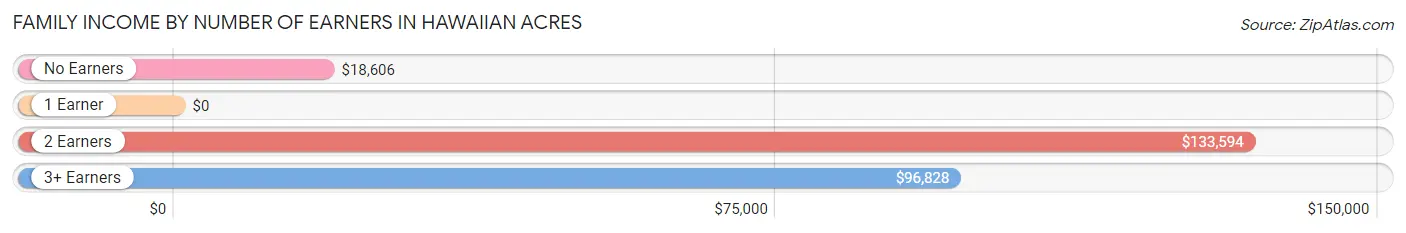
| Number of Earners | # Families | Median Income |
| No Earners | 109 (14.5%) | $18,606 |
| 1 Earner | 172 (22.9%) | $0 |
| 2 Earners | 297 (39.6%) | $133,594 |
| 3+ Earners | 173 (23.0%) | $96,828 |
| Total | 751 (100.0%) | $97,328 |
Household Income in Hawaiian Acres
Household Income Brackets in Hawaiian Acres
With 467 households falling in the category, the $100,000 to $149,999 income range is the most frequent in Hawaiian Acres, accounting for 36.4% of all households. In contrast, only 12 households (0.9%) fall into the $150,000 to $199,999 income bracket, making it the least populous group.
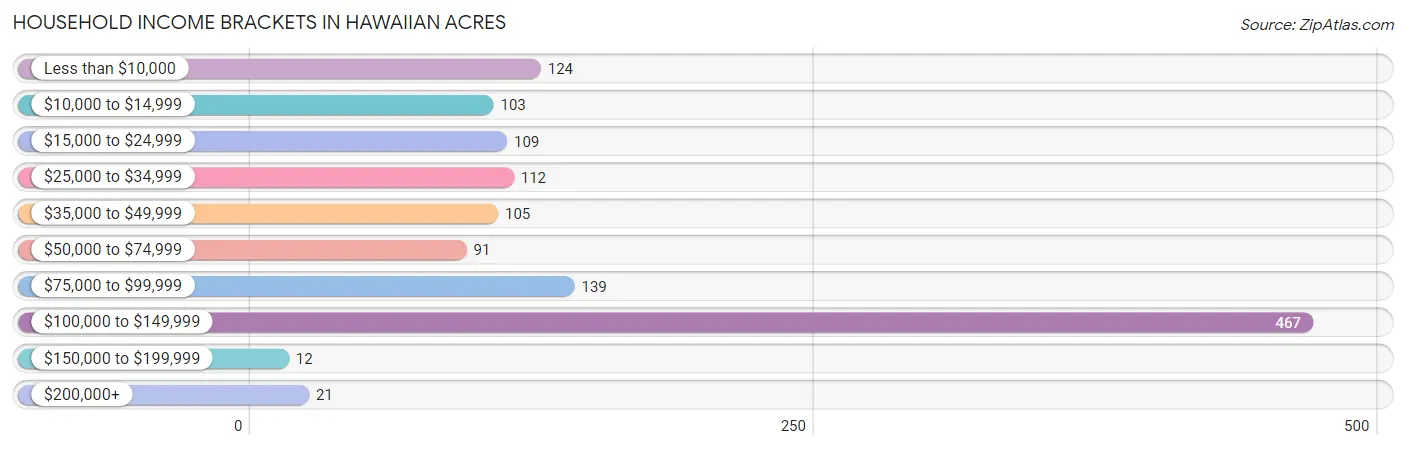
| Income Bracket | # Households | % Households |
| Less than $10,000 | 124 | 9.7% |
| $10,000 to $14,999 | 103 | 8.0% |
| $15,000 to $24,999 | 109 | 8.5% |
| $25,000 to $34,999 | 112 | 8.7% |
| $35,000 to $49,999 | 105 | 8.2% |
| $50,000 to $74,999 | 91 | 7.1% |
| $75,000 to $99,999 | 139 | 10.8% |
| $100,000 to $149,999 | 467 | 36.4% |
| $150,000 to $199,999 | 12 | 0.9% |
| $200,000+ | 21 | 1.6% |
Household Income by Householder Age in Hawaiian Acres
The median household income in Hawaiian Acres is $74,851, with the highest median household income of $99,348 found in the 25 to 44 years age bracket for the primary householder. A total of 74 households (5.8%) fall into this category.
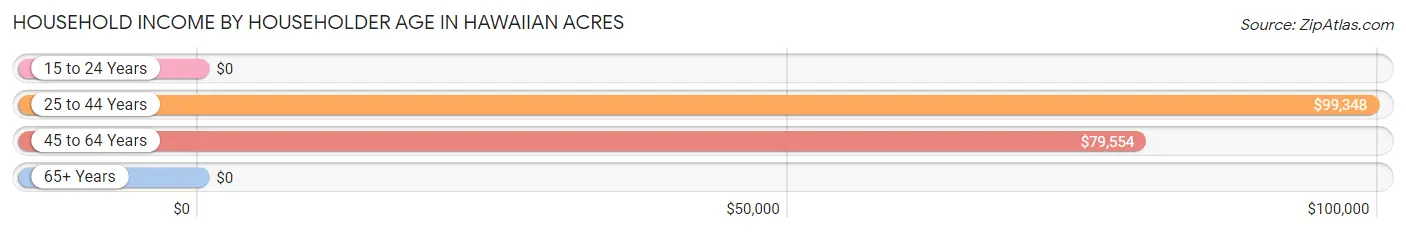
| Income Bracket | # Households | Median Income |
| 15 to 24 Years | 0 (0.0%) | $0 |
| 25 to 44 Years | 74 (5.8%) | $99,348 |
| 45 to 64 Years | 745 (58.1%) | $79,554 |
| 65+ Years | 464 (36.2%) | $0 |
| Total | 1,283 (100.0%) | $74,851 |
Poverty in Hawaiian Acres
Income Below Poverty by Sex and Age in Hawaiian Acres
With 19.5% poverty level for males and 13.6% for females among the residents of Hawaiian Acres, 12 to 14 year old males and 16 and 17 year old females are the most vulnerable to poverty, with 23 males (100.0%) and 24 females (47.1%) in their respective age groups living below the poverty level.
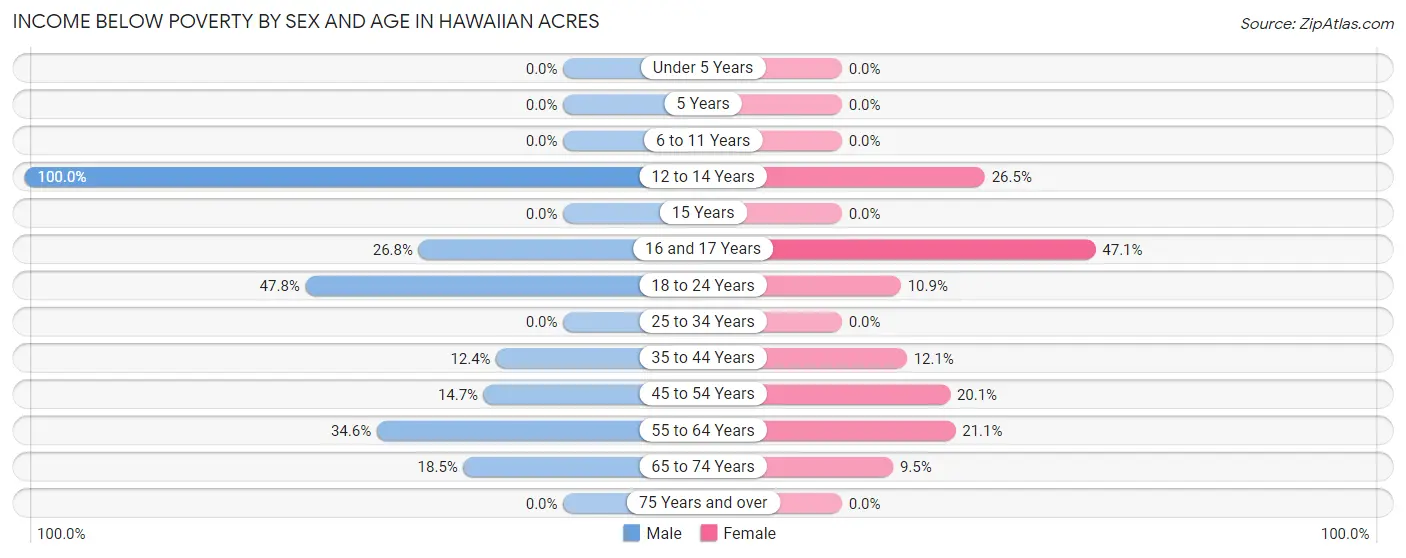
| Age Bracket | Male | Female |
| Under 5 Years | 0 (0.0%) | 0 (0.0%) |
| 5 Years | 0 (0.0%) | 0 (0.0%) |
| 6 to 11 Years | 0 (0.0%) | 0 (0.0%) |
| 12 to 14 Years | 23 (100.0%) | 26 (26.5%) |
| 15 Years | 0 (0.0%) | 0 (0.0%) |
| 16 and 17 Years | 22 (26.8%) | 24 (47.1%) |
| 18 to 24 Years | 44 (47.8%) | 28 (10.9%) |
| 25 to 34 Years | 0 (0.0%) | 0 (0.0%) |
| 35 to 44 Years | 20 (12.4%) | 20 (12.0%) |
| 45 to 54 Years | 46 (14.7%) | 55 (20.1%) |
| 55 to 64 Years | 101 (34.6%) | 71 (21.1%) |
| 65 to 74 Years | 69 (18.5%) | 23 (9.5%) |
| 75 Years and over | 0 (0.0%) | 0 (0.0%) |
| Total | 325 (19.5%) | 247 (13.6%) |
Income Above Poverty by Sex and Age in Hawaiian Acres
According to the poverty statistics in Hawaiian Acres, males aged 6 to 11 years and females aged 6 to 11 years are the age groups that are most secure financially, with 100.0% of males and 100.0% of females in these age groups living above the poverty line.
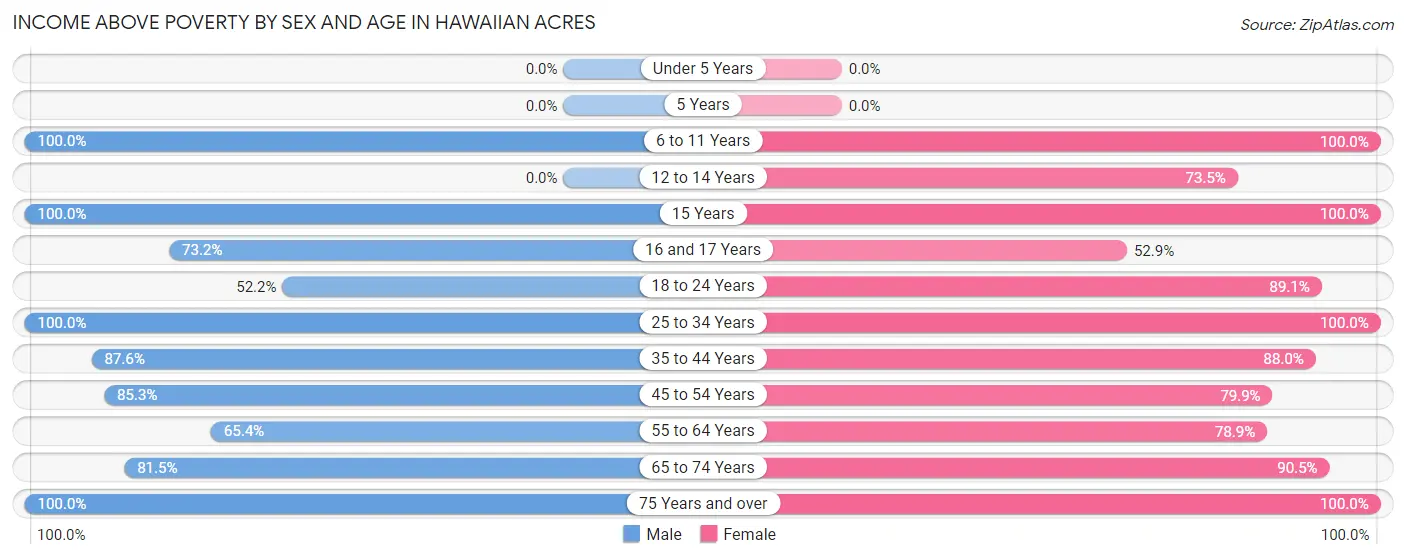
| Age Bracket | Male | Female |
| Under 5 Years | 0 (0.0%) | 0 (0.0%) |
| 5 Years | 0 (0.0%) | 0 (0.0%) |
| 6 to 11 Years | 94 (100.0%) | 220 (100.0%) |
| 12 to 14 Years | 0 (0.0%) | 72 (73.5%) |
| 15 Years | 89 (100.0%) | 11 (100.0%) |
| 16 and 17 Years | 60 (73.2%) | 27 (52.9%) |
| 18 to 24 Years | 48 (52.2%) | 228 (89.1%) |
| 25 to 34 Years | 87 (100.0%) | 67 (100.0%) |
| 35 to 44 Years | 141 (87.6%) | 146 (87.9%) |
| 45 to 54 Years | 266 (85.3%) | 219 (79.9%) |
| 55 to 64 Years | 191 (65.4%) | 266 (78.9%) |
| 65 to 74 Years | 304 (81.5%) | 219 (90.5%) |
| 75 Years and over | 59 (100.0%) | 98 (100.0%) |
| Total | 1,339 (80.5%) | 1,573 (86.4%) |
Income Below Poverty Among Married-Couple Families in Hawaiian Acres
The poverty statistics for married-couple families in Hawaiian Acres show that 11.6% or 69 of the total 594 families live below the poverty line. Families with 3 or 4 children have the highest poverty rate of 45.5%, comprising of 20 families. On the other hand, families with 1 or 2 children have the lowest poverty rate of 0.0%, which includes 0 families.
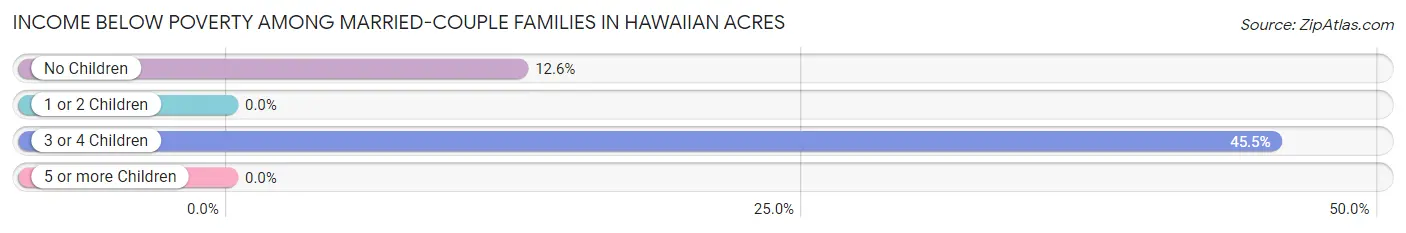
| Children | Above Poverty | Below Poverty |
| No Children | 339 (87.4%) | 49 (12.6%) |
| 1 or 2 Children | 162 (100.0%) | 0 (0.0%) |
| 3 or 4 Children | 24 (54.5%) | 20 (45.5%) |
| 5 or more Children | 0 (0.0%) | 0 (0.0%) |
| Total | 525 (88.4%) | 69 (11.6%) |
Income Below Poverty Among Single-Parent Households in Hawaiian Acres
According to the poverty data in Hawaiian Acres, 53.8% or 28 single-father households and 21.9% or 23 single-mother households are living below the poverty line. Among single-father households, those with no children have the highest poverty rate, with 28 households (53.8%) experiencing poverty. Likewise, among single-mother households, those with 1 or 2 children have the highest poverty rate, with 23 households (32.9%) falling below the poverty line.
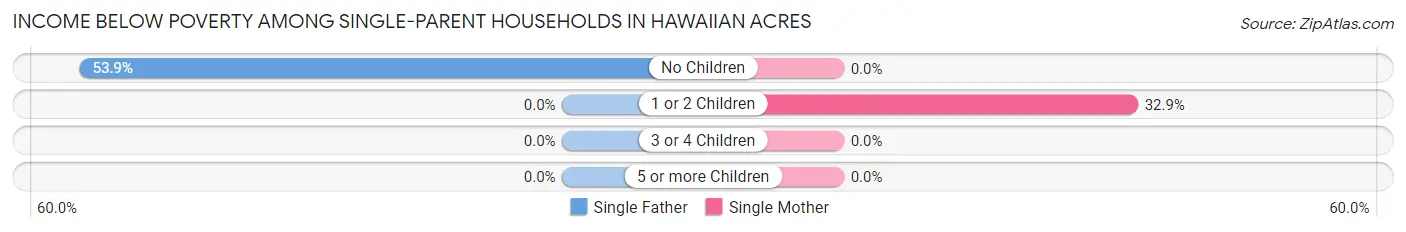
| Children | Single Father | Single Mother |
| No Children | 28 (53.8%) | 0 (0.0%) |
| 1 or 2 Children | 0 (0.0%) | 23 (32.9%) |
| 3 or 4 Children | 0 (0.0%) | 0 (0.0%) |
| 5 or more Children | 0 (0.0%) | 0 (0.0%) |
| Total | 28 (53.8%) | 23 (21.9%) |
Income Below Poverty Among Married-Couple vs Single-Parent Households in Hawaiian Acres
The poverty data for Hawaiian Acres shows that 69 of the married-couple family households (11.6%) and 51 of the single-parent households (32.5%) are living below the poverty level. Within the married-couple family households, those with 3 or 4 children have the highest poverty rate, with 20 households (45.5%) falling below the poverty line. Among the single-parent households, those with 1 or 2 children have the highest poverty rate, with 23 household (32.9%) living below poverty.
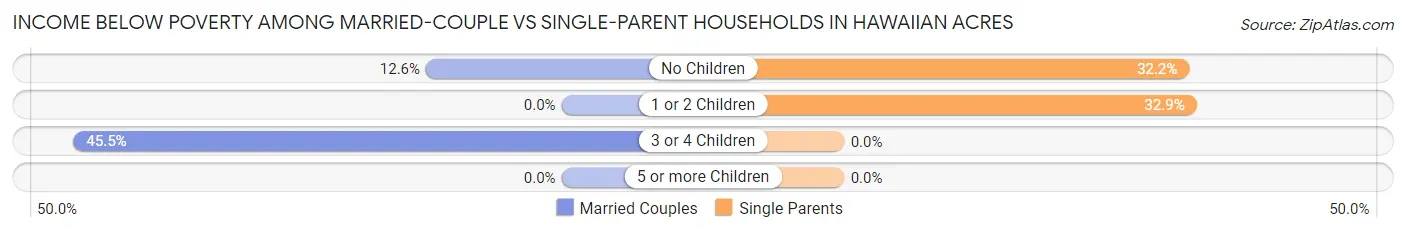
| Children | Married-Couple Families | Single-Parent Households |
| No Children | 49 (12.6%) | 28 (32.2%) |
| 1 or 2 Children | 0 (0.0%) | 23 (32.9%) |
| 3 or 4 Children | 20 (45.5%) | 0 (0.0%) |
| 5 or more Children | 0 (0.0%) | 0 (0.0%) |
| Total | 69 (11.6%) | 51 (32.5%) |
Race in Hawaiian Acres
The most populous races in Hawaiian Acres are White / Caucasian (1,649 | 47.3%), Hispanic or Latino (925 | 26.6%), and Two or more Races (922 | 26.5%).
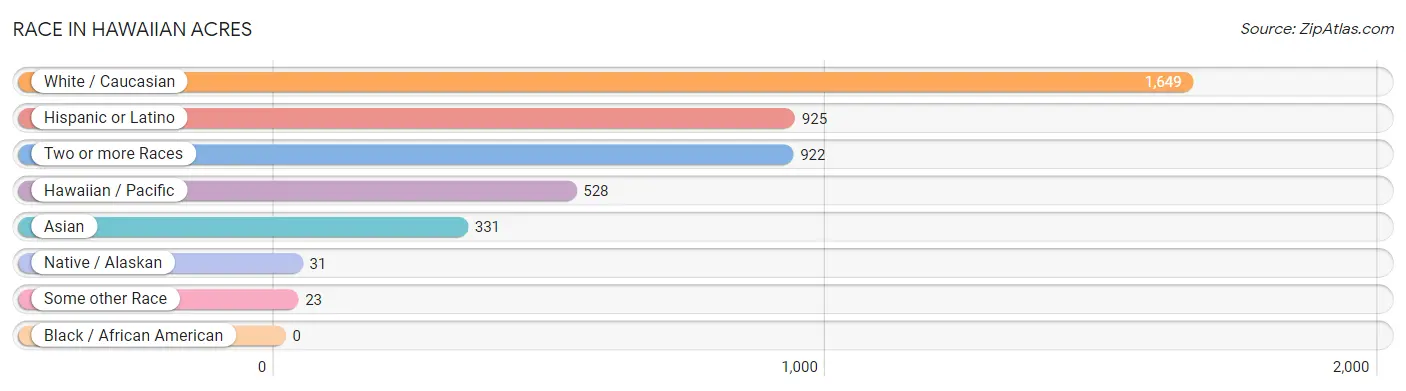
| Race | # Population | % Population |
| Asian | 331 | 9.5% |
| Black / African American | 0 | 0.0% |
| Hawaiian / Pacific | 528 | 15.1% |
| Hispanic or Latino | 925 | 26.6% |
| Native / Alaskan | 31 | 0.9% |
| White / Caucasian | 1,649 | 47.3% |
| Two or more Races | 922 | 26.5% |
| Some other Race | 23 | 0.7% |
| Total | 3,484 | 100.0% |
Ancestry in Hawaiian Acres
The most populous ancestries reported in Hawaiian Acres are Native Hawaiian (1,133 | 32.5%), German (560 | 16.1%), Bhutanese (410 | 11.8%), English (371 | 10.6%), and Puerto Rican (366 | 10.5%), together accounting for 81.5% of all Hawaiian Acres residents.
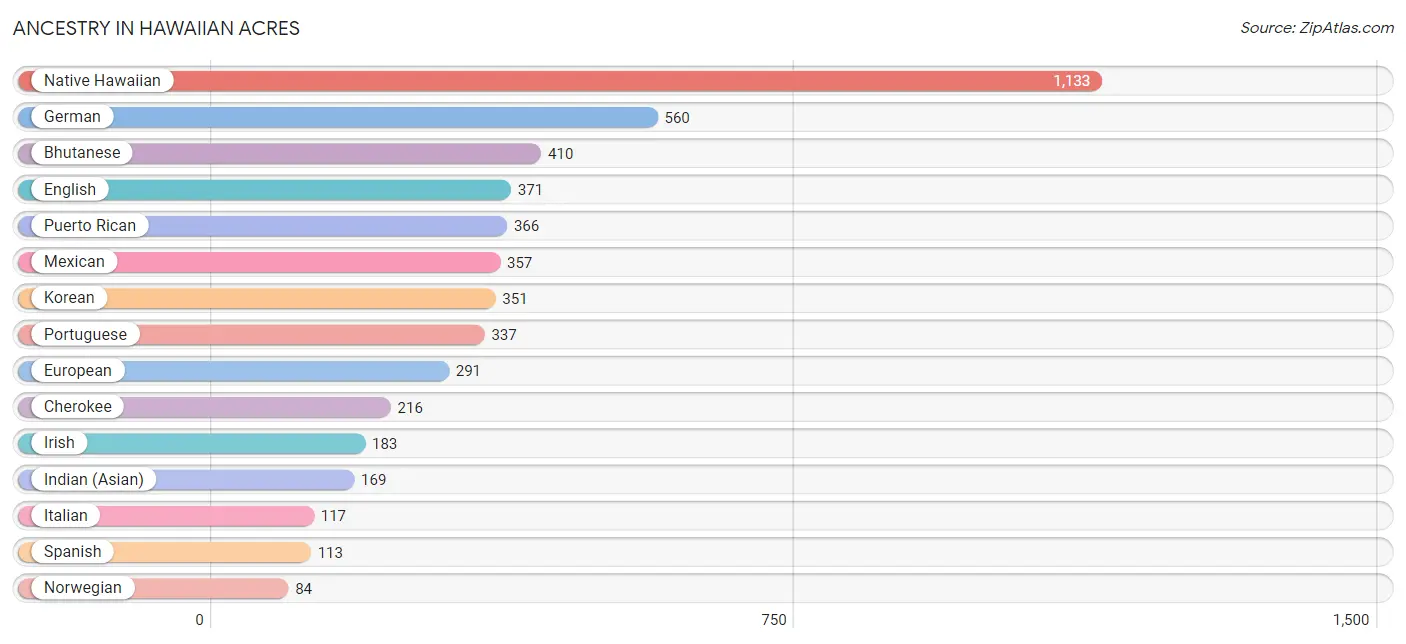
| Ancestry | # Population | % Population |
| Bhutanese | 410 | 11.8% |
| British | 40 | 1.1% |
| Burmese | 32 | 0.9% |
| Central American | 70 | 2.0% |
| Cherokee | 216 | 6.2% |
| Chickasaw | 7 | 0.2% |
| Chippewa | 10 | 0.3% |
| Czech | 75 | 2.1% |
| Danish | 13 | 0.4% |
| Dutch | 52 | 1.5% |
| English | 371 | 10.6% |
| European | 291 | 8.4% |
| Finnish | 23 | 0.7% |
| German | 560 | 16.1% |
| Greek | 19 | 0.5% |
| Indian (Asian) | 169 | 4.9% |
| Irish | 183 | 5.2% |
| Italian | 117 | 3.4% |
| Korean | 351 | 10.1% |
| Mexican | 357 | 10.2% |
| Native Hawaiian | 1,133 | 32.5% |
| Norwegian | 84 | 2.4% |
| Ottawa | 20 | 0.6% |
| Polish | 14 | 0.4% |
| Portuguese | 337 | 9.7% |
| Puerto Rican | 366 | 10.5% |
| Russian | 49 | 1.4% |
| Salvadoran | 70 | 2.0% |
| Scotch-Irish | 14 | 0.4% |
| Scottish | 79 | 2.3% |
| Spaniard | 19 | 0.5% |
| Spanish | 113 | 3.2% |
| Swedish | 46 | 1.3% |
| Welsh | 25 | 0.7% | View All 34 Rows |
Immigrants in Hawaiian Acres
The most numerous immigrant groups reported in Hawaiian Acres came from Africa (255 | 7.3%), South Africa (255 | 7.3%), Asia (202 | 5.8%), Philippines (166 | 4.8%), and South Eastern Asia (166 | 4.8%), together accounting for 30.0% of all Hawaiian Acres residents.
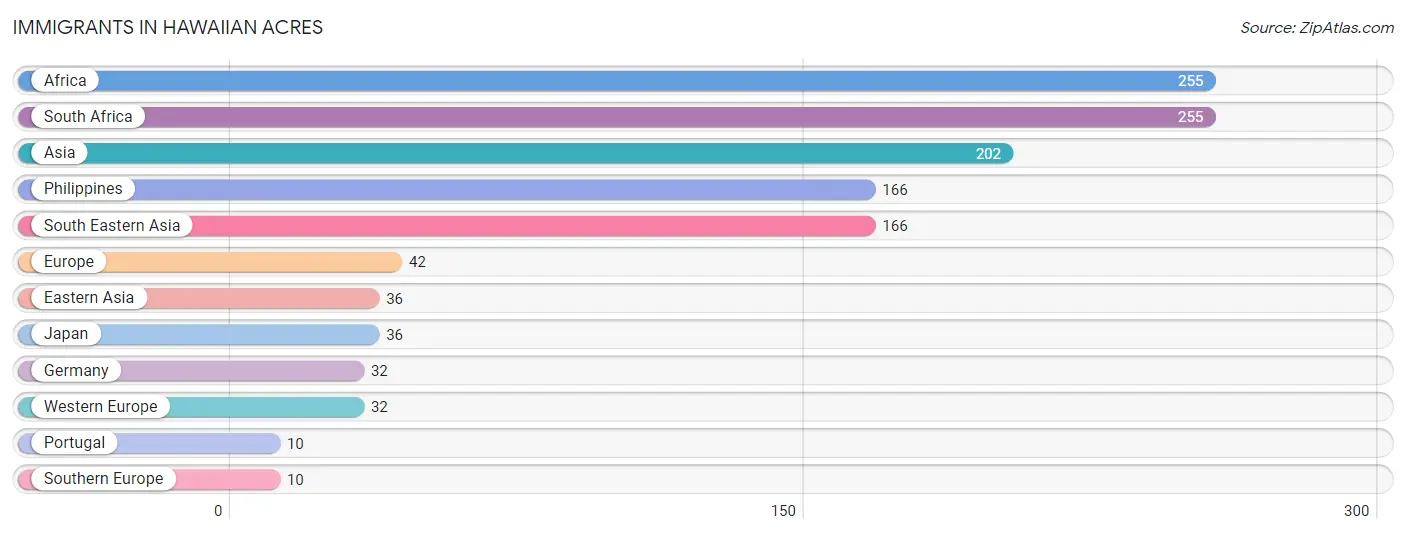
| Immigration Origin | # Population | % Population |
| Africa | 255 | 7.3% |
| Asia | 202 | 5.8% |
| Eastern Asia | 36 | 1.0% |
| Europe | 42 | 1.2% |
| Germany | 32 | 0.9% |
| Japan | 36 | 1.0% |
| Philippines | 166 | 4.8% |
| Portugal | 10 | 0.3% |
| South Africa | 255 | 7.3% |
| South Eastern Asia | 166 | 4.8% |
| Southern Europe | 10 | 0.3% |
| Western Europe | 32 | 0.9% | View All 12 Rows |
Sex and Age in Hawaiian Acres
Sex and Age in Hawaiian Acres
The most populous age groups in Hawaiian Acres are 65 to 69 Years (245 | 14.7%) for men and 5 to 9 Years (220 | 12.1%) for women.
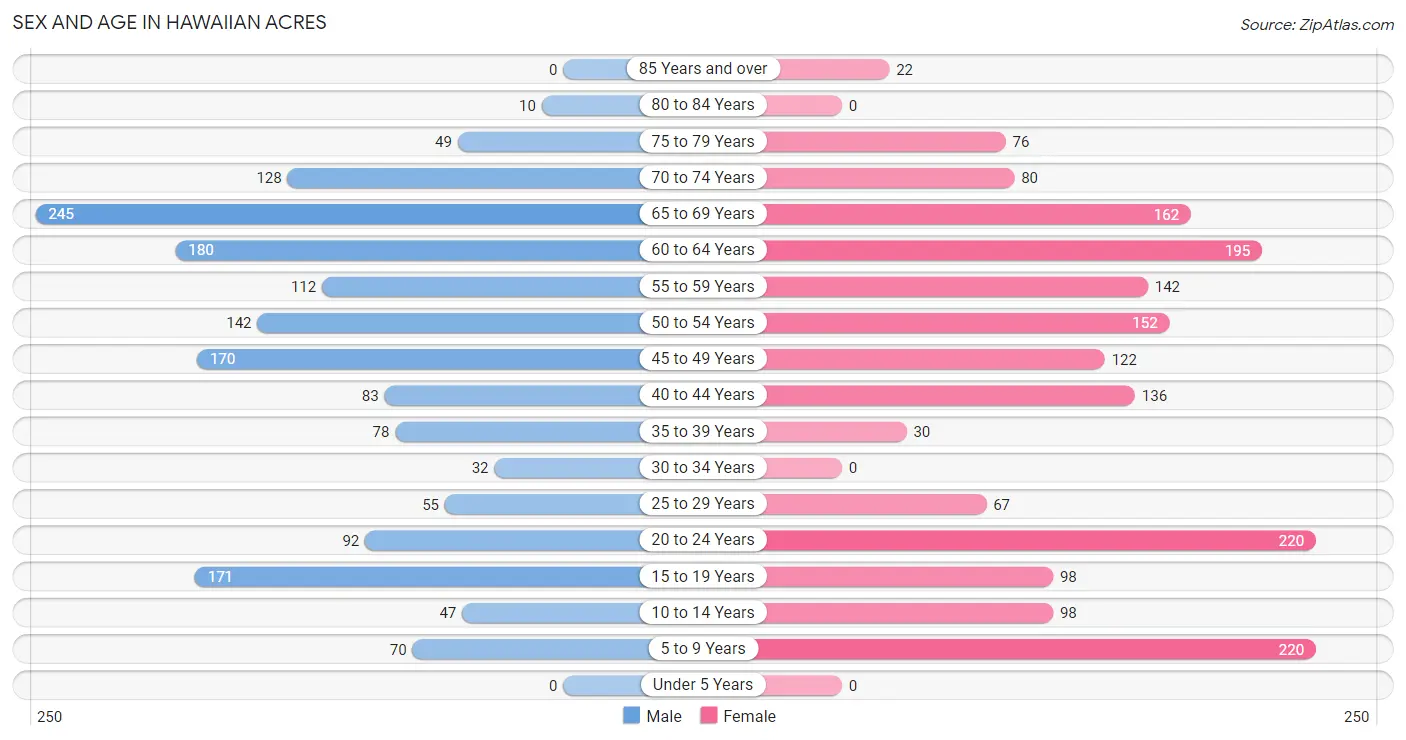
| Age Bracket | Male | Female |
| Under 5 Years | 0 (0.0%) | 0 (0.0%) |
| 5 to 9 Years | 70 (4.2%) | 220 (12.1%) |
| 10 to 14 Years | 47 (2.8%) | 98 (5.4%) |
| 15 to 19 Years | 171 (10.3%) | 98 (5.4%) |
| 20 to 24 Years | 92 (5.5%) | 220 (12.1%) |
| 25 to 29 Years | 55 (3.3%) | 67 (3.7%) |
| 30 to 34 Years | 32 (1.9%) | 0 (0.0%) |
| 35 to 39 Years | 78 (4.7%) | 30 (1.7%) |
| 40 to 44 Years | 83 (5.0%) | 136 (7.5%) |
| 45 to 49 Years | 170 (10.2%) | 122 (6.7%) |
| 50 to 54 Years | 142 (8.5%) | 152 (8.4%) |
| 55 to 59 Years | 112 (6.7%) | 142 (7.8%) |
| 60 to 64 Years | 180 (10.8%) | 195 (10.7%) |
| 65 to 69 Years | 245 (14.7%) | 162 (8.9%) |
| 70 to 74 Years | 128 (7.7%) | 80 (4.4%) |
| 75 to 79 Years | 49 (2.9%) | 76 (4.2%) |
| 80 to 84 Years | 10 (0.6%) | 0 (0.0%) |
| 85 Years and over | 0 (0.0%) | 22 (1.2%) |
| Total | 1,664 (100.0%) | 1,820 (100.0%) |
Families and Households in Hawaiian Acres
Median Family Size in Hawaiian Acres
The median family size in Hawaiian Acres is 3.67 persons per family, with married-couple families (594 | 79.1%) accounting for the largest median family size of 3.89 persons per family. On the other hand, single male/father families (52 | 6.9%) represent the smallest median family size with 2.52 persons per family.
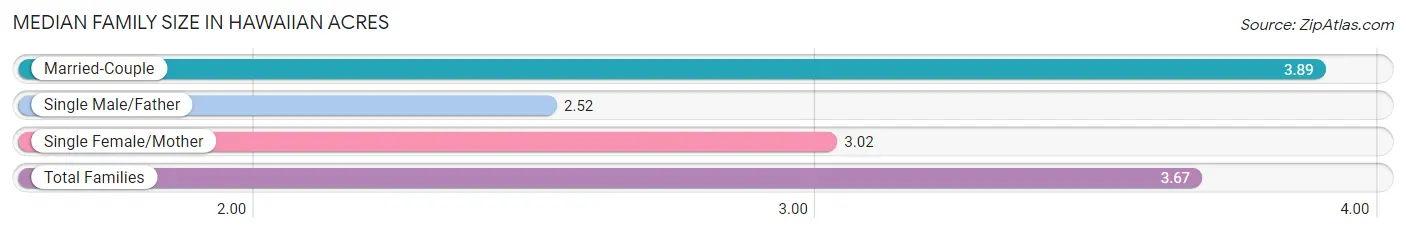
| Family Type | # Families | Family Size |
| Married-Couple | 594 (79.1%) | 3.89 |
| Single Male/Father | 52 (6.9%) | 2.52 |
| Single Female/Mother | 105 (14.0%) | 3.02 |
| Total Families | 751 (100.0%) | 3.67 |
Median Household Size in Hawaiian Acres
The median household size in Hawaiian Acres is 2.72 persons per household, with married-couple households (594 | 46.3%) accounting for the largest median household size of 3.89 persons per household. non-family households (532 | 41.5%) represent the smallest median household size with 1.27 persons per household.
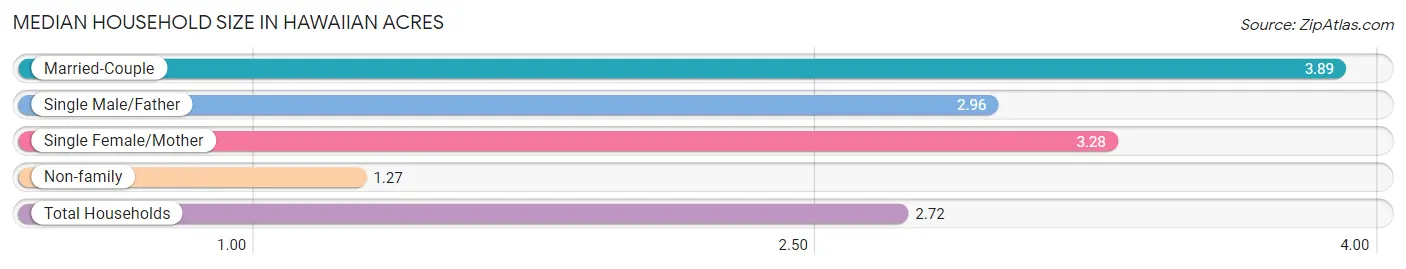
| Household Type | # Households | Household Size |
| Married-Couple | 594 (46.3%) | 3.89 |
| Single Male/Father | 52 (4.1%) | 2.96 |
| Single Female/Mother | 105 (8.2%) | 3.28 |
| Non-family | 532 (41.5%) | 1.27 |
| Total Households | 1,283 (100.0%) | 2.72 |
Household Size by Marriage Status in Hawaiian Acres
Out of a total of 1,283 households in Hawaiian Acres, 751 (58.5%) are family households, while 532 (41.5%) are nonfamily households. The most numerous type of family households are 4-person households, comprising 305, and the most common type of nonfamily households are 1-person households, comprising 463.
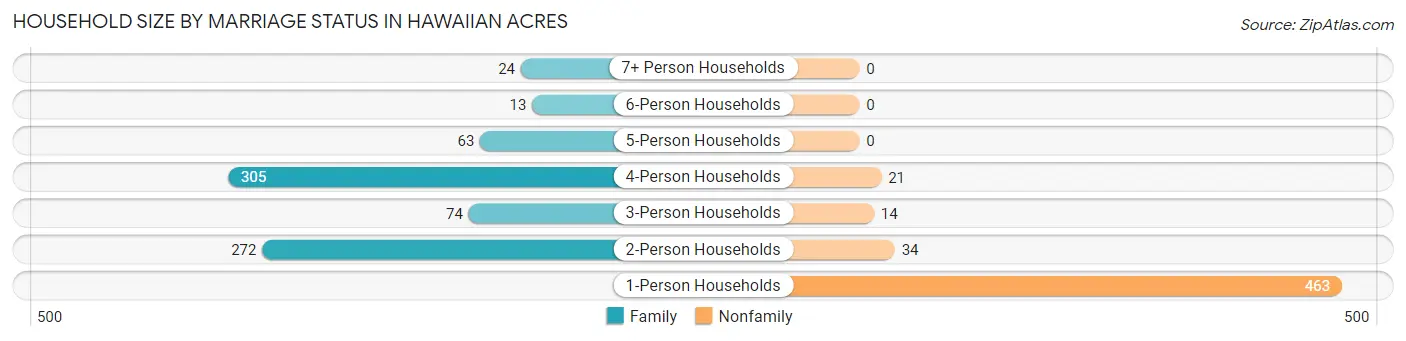
| Household Size | Family Households | Nonfamily Households |
| 1-Person Households | - | 463 (36.1%) |
| 2-Person Households | 272 (21.2%) | 34 (2.6%) |
| 3-Person Households | 74 (5.8%) | 14 (1.1%) |
| 4-Person Households | 305 (23.8%) | 21 (1.6%) |
| 5-Person Households | 63 (4.9%) | 0 (0.0%) |
| 6-Person Households | 13 (1.0%) | 0 (0.0%) |
| 7+ Person Households | 24 (1.9%) | 0 (0.0%) |
| Total | 751 (58.5%) | 532 (41.5%) |
Female Fertility in Hawaiian Acres
Fertility by Age in Hawaiian Acres
| Age Bracket | Women with Births | Births / 1,000 Women |
| 15 to 19 years | 0 (0.0%) | 0.0 |
| 20 to 34 years | 0 (0.0%) | 0.0 |
| 35 to 50 years | 0 (0.0%) | 0.0 |
| Total | 0 (0.0%) | 0.0 |
Fertility by Age by Marriage Status in Hawaiian Acres
| Age Bracket | Married | Unmarried |
| 15 to 19 years | 0 (0.0%) | 0 (0.0%) |
| 20 to 34 years | 0 (0.0%) | 0 (0.0%) |
| 35 to 50 years | 0 (0.0%) | 0 (0.0%) |
| Total | 0 (0.0%) | 0 (0.0%) |
Fertility by Education in Hawaiian Acres
| Educational Attainment | Women with Births | Births / 1,000 Women |
| Less than High School | 0 (0.0%) | 0.0 |
| High School Diploma | 0 (0.0%) | 0.0 |
| College or Associate's Degree | 0 (0.0%) | 0.0 |
| Bachelor's Degree | 0 (0.0%) | 0.0 |
| Graduate Degree | 0 (0.0%) | 0.0 |
| Total | 0 (0.0%) | 0.0 |
Fertility by Education by Marriage Status in Hawaiian Acres
| Educational Attainment | Married | Unmarried |
| Less than High School | 0 (0.0%) | 0 (0.0%) |
| High School Diploma | 0 (0.0%) | 0 (0.0%) |
| College or Associate's Degree | 0 (0.0%) | 0 (0.0%) |
| Bachelor's Degree | 0 (0.0%) | 0 (0.0%) |
| Graduate Degree | 0 (0.0%) | 0 (0.0%) |
| Total | 0 (0.0%) | 0 (0.0%) |
Employment Characteristics in Hawaiian Acres
Employment by Class of Employer in Hawaiian Acres
Among the 1,510 employed individuals in Hawaiian Acres, private company employees (838 | 55.5%), self-employed (not incorporated) (210 | 13.9%), and not-for-profit organizations (194 | 12.9%) make up the most common classes of employment.
| Employer Class | # Employees | % Employees |
| Private Company Employees | 838 | 55.5% |
| Self-Employed (Incorporated) | 20 | 1.3% |
| Self-Employed (Not Incorporated) | 210 | 13.9% |
| Not-for-profit Organizations | 194 | 12.9% |
| Local Government Employees | 62 | 4.1% |
| State Government Employees | 186 | 12.3% |
| Federal Government Employees | 0 | 0.0% |
| Unpaid Family Workers | 0 | 0.0% |
| Total | 1,510 | 100.0% |
Employment Status by Age in Hawaiian Acres
According to the labor force statistics for Hawaiian Acres, out of the total population over 16 years of age (2,949), 55.7% or 1,643 individuals are in the labor force, with 5.4% or 89 of them unemployed. The age group with the highest labor force participation rate is 30 to 34 years, with 100.0% or 32 individuals in the labor force. Within the labor force, the 60 to 64 years age range has the highest percentage of unemployed individuals, with 22.4% or 32 of them being unemployed.
| Age Bracket | In Labor Force | Unemployed |
| 16 to 19 Years | 0 (0.0%) | 0 (0.0%) |
| 20 to 24 Years | 210 (67.3%) | 28 (13.3%) |
| 25 to 29 Years | 98 (80.3%) | 0 (0.0%) |
| 30 to 34 Years | 32 (100.0%) | 0 (0.0%) |
| 35 to 44 Years | 252 (77.1%) | 0 (0.0%) |
| 45 to 54 Years | 484 (82.6%) | 16 (3.3%) |
| 55 to 59 Years | 118 (46.5%) | 0 (0.0%) |
| 60 to 64 Years | 143 (38.1%) | 32 (22.4%) |
| 65 to 74 Years | 306 (49.8%) | 13 (4.2%) |
| 75 Years and over | 0 (0.0%) | 0 (0.0%) |
| Total | 1,643 (55.7%) | 89 (5.4%) |
Employment Status by Educational Attainment in Hawaiian Acres
According to labor force statistics for Hawaiian Acres, 66.5% of individuals (1,128) out of the total population between 25 and 64 years of age (1,696) are in the labor force, with 4.3% or 49 of them being unemployed. The group with the highest labor force participation rate are those with the educational attainment of college / associate degree, with 73.7% or 477 individuals in the labor force. Within the labor force, individuals with college / associate degree education have the highest percentage of unemployment, with 10.1% or 48 of them being unemployed.
| Educational Attainment | In Labor Force | Unemployed |
| Less than High School | 0 (0.0%) | 0 (0.0%) |
| High School Diploma | 427 (60.1%) | 0 (0.0%) |
| College / Associate Degree | 477 (73.7%) | 65 (10.1%) |
| Bachelor's Degree or higher | 223 (72.6%) | 0 (0.0%) |
| Total | 1,128 (66.5%) | 73 (4.3%) |
Employment Occupations by Sex in Hawaiian Acres
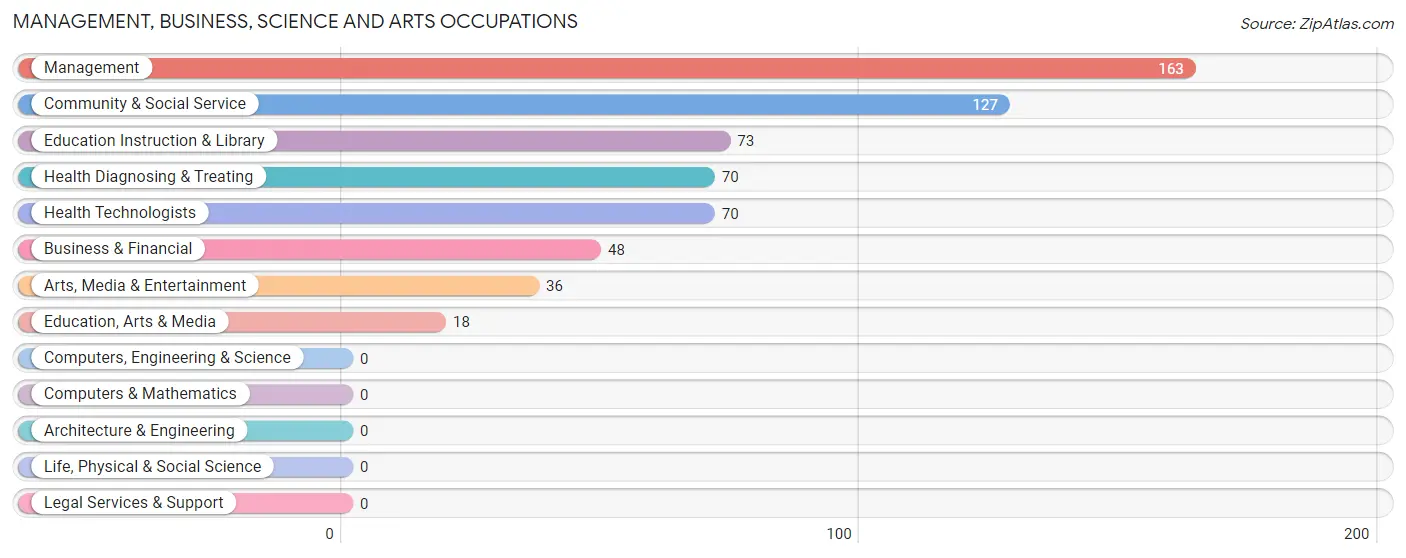
Management, Business, Science and Arts Occupations
The most common Management, Business, Science and Arts occupations in Hawaiian Acres are Management (163 | 10.5%), Community & Social Service (127 | 8.2%), Education Instruction & Library (73 | 4.7%), Health Diagnosing & Treating (70 | 4.5%), and Health Technologists (70 | 4.5%).
Management, Business, Science and Arts Occupations by Sex
Within the Management, Business, Science and Arts occupations in Hawaiian Acres, the most male-oriented occupations are Management (64.4%), Arts, Media & Entertainment (52.8%), and Community & Social Service (15.0%), while the most female-oriented occupations are Business & Financial (100.0%), Education, Arts & Media (100.0%), and Education Instruction & Library (100.0%).
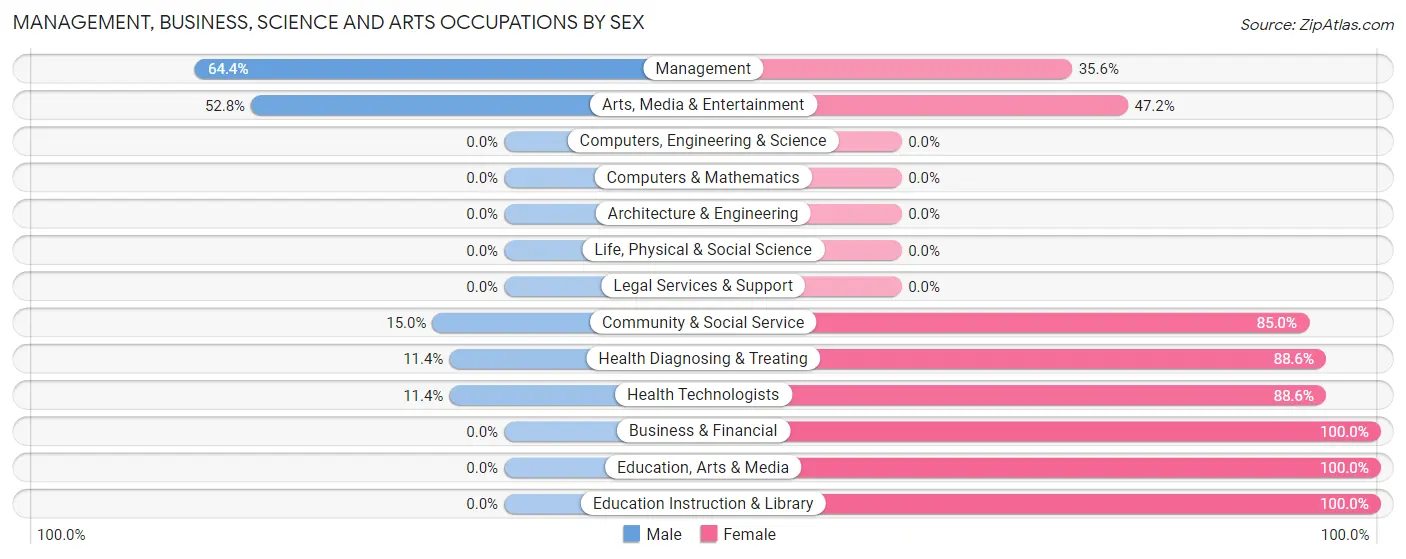
| Occupation | Male | Female |
| Management | 105 (64.4%) | 58 (35.6%) |
| Business & Financial | 0 (0.0%) | 48 (100.0%) |
| Computers, Engineering & Science | 0 (0.0%) | 0 (0.0%) |
| Computers & Mathematics | 0 (0.0%) | 0 (0.0%) |
| Architecture & Engineering | 0 (0.0%) | 0 (0.0%) |
| Life, Physical & Social Science | 0 (0.0%) | 0 (0.0%) |
| Community & Social Service | 19 (15.0%) | 108 (85.0%) |
| Education, Arts & Media | 0 (0.0%) | 18 (100.0%) |
| Legal Services & Support | 0 (0.0%) | 0 (0.0%) |
| Education Instruction & Library | 0 (0.0%) | 73 (100.0%) |
| Arts, Media & Entertainment | 19 (52.8%) | 17 (47.2%) |
| Health Diagnosing & Treating | 8 (11.4%) | 62 (88.6%) |
| Health Technologists | 8 (11.4%) | 62 (88.6%) |
| Total (Category) | 132 (32.4%) | 276 (67.6%) |
| Total (Overall) | 755 (48.6%) | 799 (51.4%) |
Services Occupations
The most common Services occupations in Hawaiian Acres are Cleaning & Maintenance (184 | 11.8%), Healthcare Support (47 | 3.0%), Personal Care & Service (42 | 2.7%), Security & Protection (10 | 0.6%), and Firefighting & Prevention (10 | 0.6%).
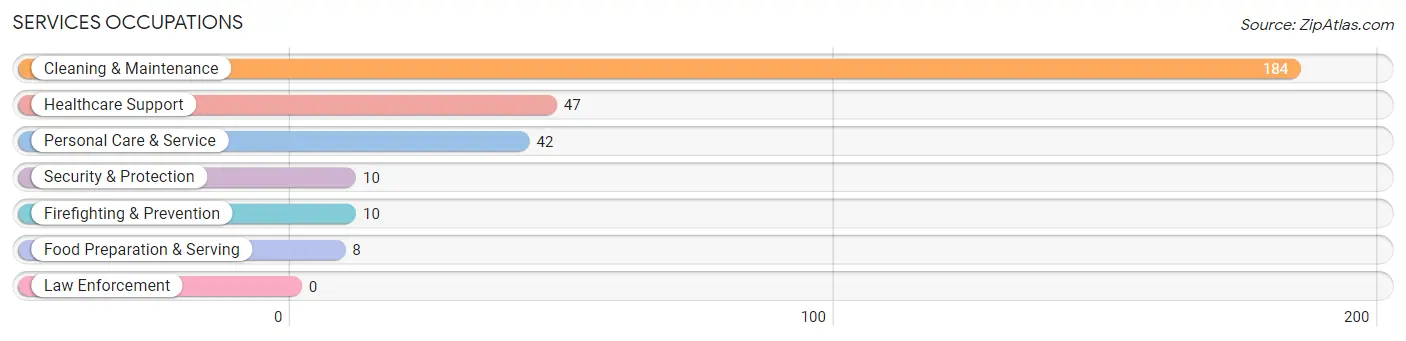
Services Occupations by Sex
Within the Services occupations in Hawaiian Acres, the most male-oriented occupations are Security & Protection (100.0%), Firefighting & Prevention (100.0%), and Personal Care & Service (100.0%), while the most female-oriented occupations are Healthcare Support (100.0%), Food Preparation & Serving (100.0%), and Cleaning & Maintenance (31.0%).
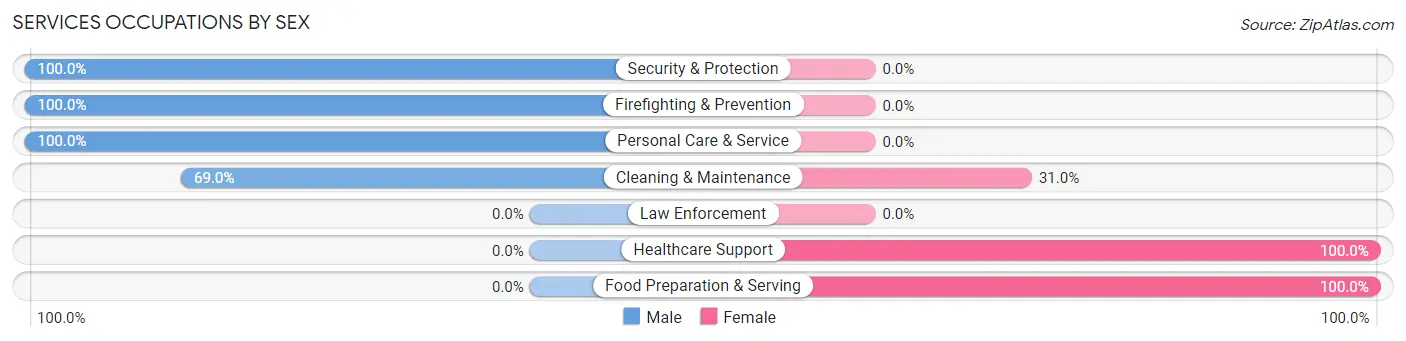
| Occupation | Male | Female |
| Healthcare Support | 0 (0.0%) | 47 (100.0%) |
| Security & Protection | 10 (100.0%) | 0 (0.0%) |
| Firefighting & Prevention | 10 (100.0%) | 0 (0.0%) |
| Law Enforcement | 0 (0.0%) | 0 (0.0%) |
| Food Preparation & Serving | 0 (0.0%) | 8 (100.0%) |
| Cleaning & Maintenance | 127 (69.0%) | 57 (31.0%) |
| Personal Care & Service | 42 (100.0%) | 0 (0.0%) |
| Total (Category) | 179 (61.5%) | 112 (38.5%) |
| Total (Overall) | 755 (48.6%) | 799 (51.4%) |
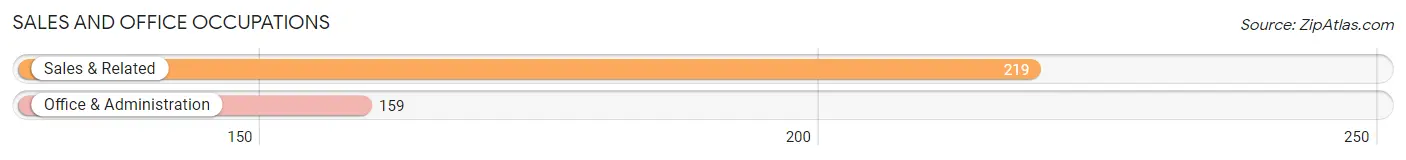
Sales and Office Occupations
The most common Sales and Office occupations in Hawaiian Acres are Sales & Related (219 | 14.1%), and Office & Administration (159 | 10.2%).
Sales and Office Occupations by Sex
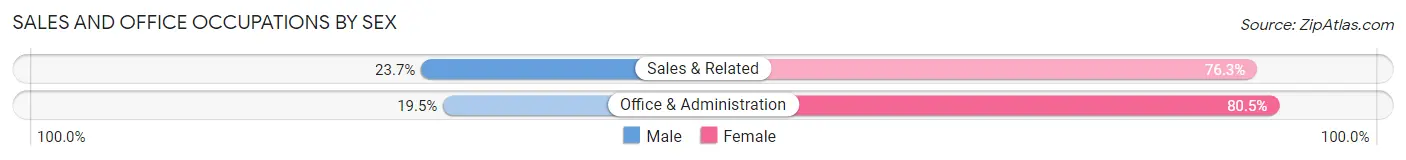
| Occupation | Male | Female |
| Sales & Related | 52 (23.7%) | 167 (76.3%) |
| Office & Administration | 31 (19.5%) | 128 (80.5%) |
| Total (Category) | 83 (22.0%) | 295 (78.0%) |
| Total (Overall) | 755 (48.6%) | 799 (51.4%) |
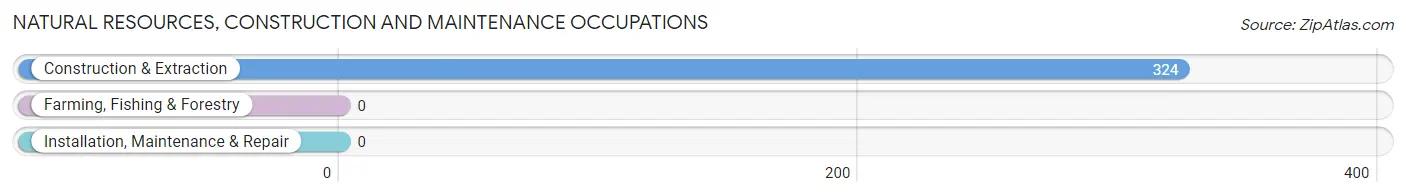
Natural Resources, Construction and Maintenance Occupations
The most common Natural Resources, Construction and Maintenance occupations in Hawaiian Acres are , and Construction & Extraction (324 | 20.8%).
Natural Resources, Construction and Maintenance Occupations by Sex
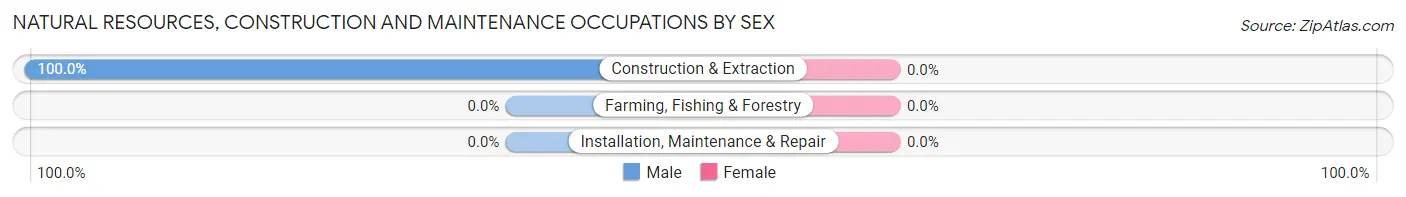
| Occupation | Male | Female |
| Farming, Fishing & Forestry | 0 (0.0%) | 0 (0.0%) |
| Construction & Extraction | 324 (100.0%) | 0 (0.0%) |
| Installation, Maintenance & Repair | 0 (0.0%) | 0 (0.0%) |
| Total (Category) | 324 (100.0%) | 0 (0.0%) |
| Total (Overall) | 755 (48.6%) | 799 (51.4%) |
Production, Transportation and Moving Occupations
The most common Production, Transportation and Moving occupations in Hawaiian Acres are , and Production (153 | 9.9%).
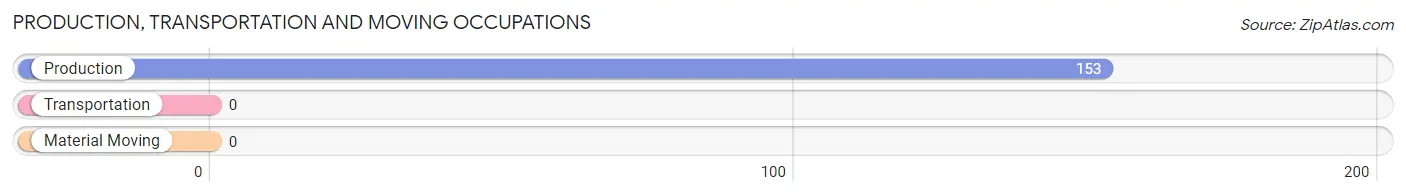
Production, Transportation and Moving Occupations by Sex
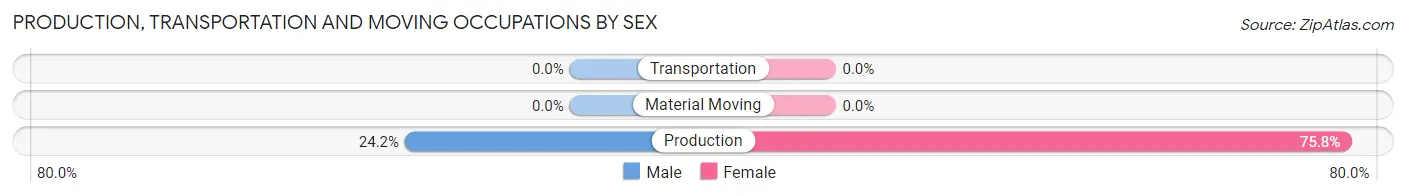
| Occupation | Male | Female |
| Production | 37 (24.2%) | 116 (75.8%) |
| Transportation | 0 (0.0%) | 0 (0.0%) |
| Material Moving | 0 (0.0%) | 0 (0.0%) |
| Total (Category) | 37 (24.2%) | 116 (75.8%) |
| Total (Overall) | 755 (48.6%) | 799 (51.4%) |
Employment Industries by Sex in Hawaiian Acres
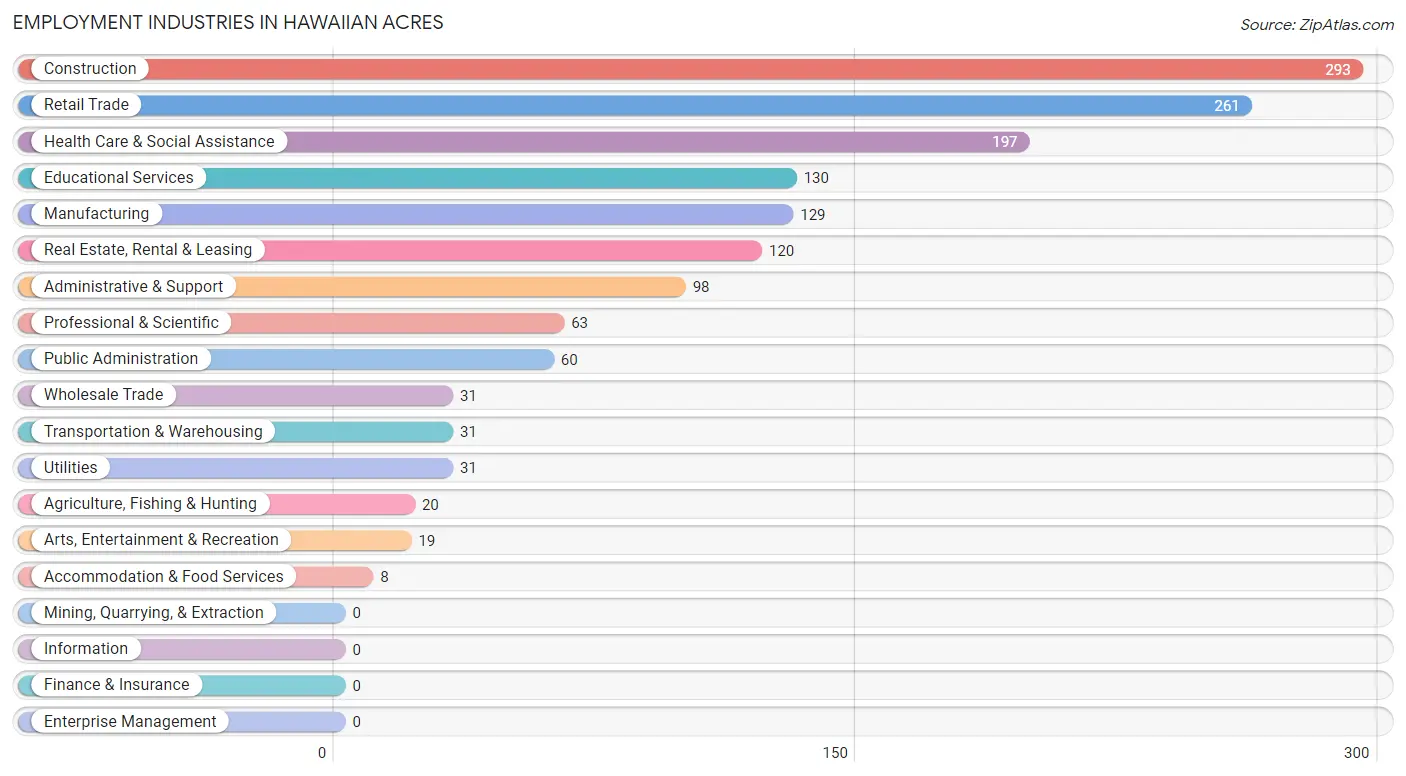
Employment Industries in Hawaiian Acres
The major employment industries in Hawaiian Acres include Construction (293 | 18.9%), Retail Trade (261 | 16.8%), Health Care & Social Assistance (197 | 12.7%), Educational Services (130 | 8.4%), and Manufacturing (129 | 8.3%).
Employment Industries by Sex in Hawaiian Acres
The Hawaiian Acres industries that see more men than women are Agriculture, Fishing & Hunting (100.0%), Construction (100.0%), and Wholesale Trade (100.0%), whereas the industries that tend to have a higher number of women are Professional & Scientific (100.0%), Educational Services (100.0%), and Accommodation & Food Services (100.0%).
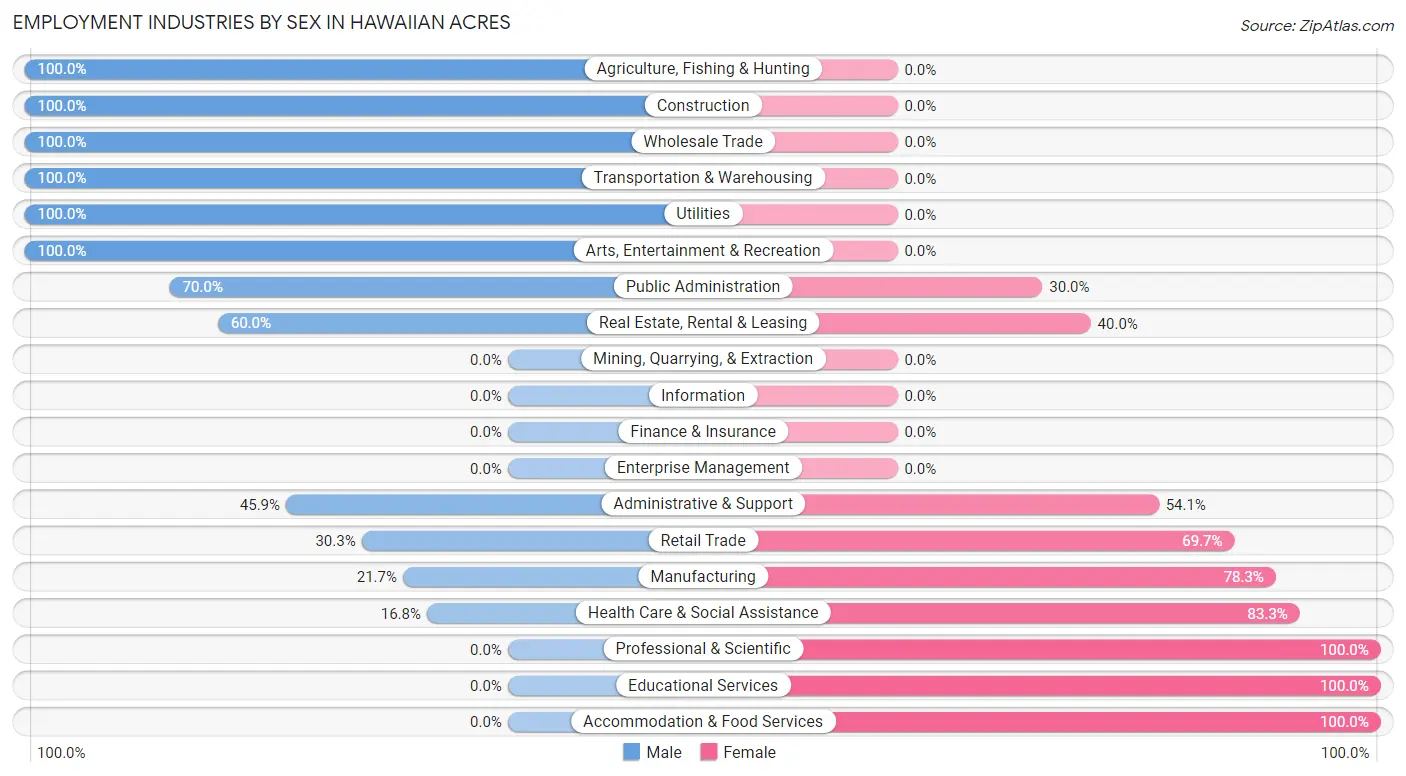
| Industry | Male | Female |
| Agriculture, Fishing & Hunting | 20 (100.0%) | 0 (0.0%) |
| Mining, Quarrying, & Extraction | 0 (0.0%) | 0 (0.0%) |
| Construction | 293 (100.0%) | 0 (0.0%) |
| Manufacturing | 28 (21.7%) | 101 (78.3%) |
| Wholesale Trade | 31 (100.0%) | 0 (0.0%) |
| Retail Trade | 79 (30.3%) | 182 (69.7%) |
| Transportation & Warehousing | 31 (100.0%) | 0 (0.0%) |
| Utilities | 31 (100.0%) | 0 (0.0%) |
| Information | 0 (0.0%) | 0 (0.0%) |
| Finance & Insurance | 0 (0.0%) | 0 (0.0%) |
| Real Estate, Rental & Leasing | 72 (60.0%) | 48 (40.0%) |
| Professional & Scientific | 0 (0.0%) | 63 (100.0%) |
| Enterprise Management | 0 (0.0%) | 0 (0.0%) |
| Administrative & Support | 45 (45.9%) | 53 (54.1%) |
| Educational Services | 0 (0.0%) | 130 (100.0%) |
| Health Care & Social Assistance | 33 (16.8%) | 164 (83.3%) |
| Arts, Entertainment & Recreation | 19 (100.0%) | 0 (0.0%) |
| Accommodation & Food Services | 0 (0.0%) | 8 (100.0%) |
| Public Administration | 42 (70.0%) | 18 (30.0%) |
| Total | 755 (48.6%) | 799 (51.4%) |
Education in Hawaiian Acres
School Enrollment in Hawaiian Acres
The most common levels of schooling among the 921 students in Hawaiian Acres are college / undergraduate (252 | 27.4%), elementary school (222 | 24.1%), and high school (211 | 22.9%).
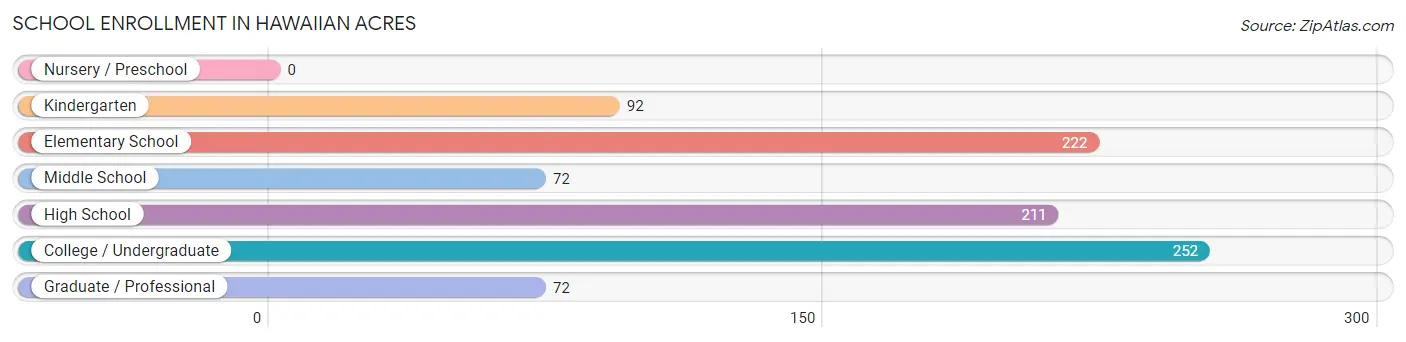
| School Level | # Students | % Students |
| Nursery / Preschool | 0 | 0.0% |
| Kindergarten | 92 | 10.0% |
| Elementary School | 222 | 24.1% |
| Middle School | 72 | 7.8% |
| High School | 211 | 22.9% |
| College / Undergraduate | 252 | 27.4% |
| Graduate / Professional | 72 | 7.8% |
| Total | 921 | 100.0% |
School Enrollment by Age by Funding Source in Hawaiian Acres
Out of a total of 921 students who are enrolled in schools in Hawaiian Acres, 145 (15.7%) attend a private institution, while the remaining 776 (84.3%) are enrolled in public schools. The age group of 15 to 17 year olds has the highest likelihood of being enrolled in private schools, with 51 (24.2% in the age bracket) enrolled. Conversely, the age group of 18 to 19 year olds has the lowest likelihood of being enrolled in a private school, with 36 (100.0% in the age bracket) attending a public institution.
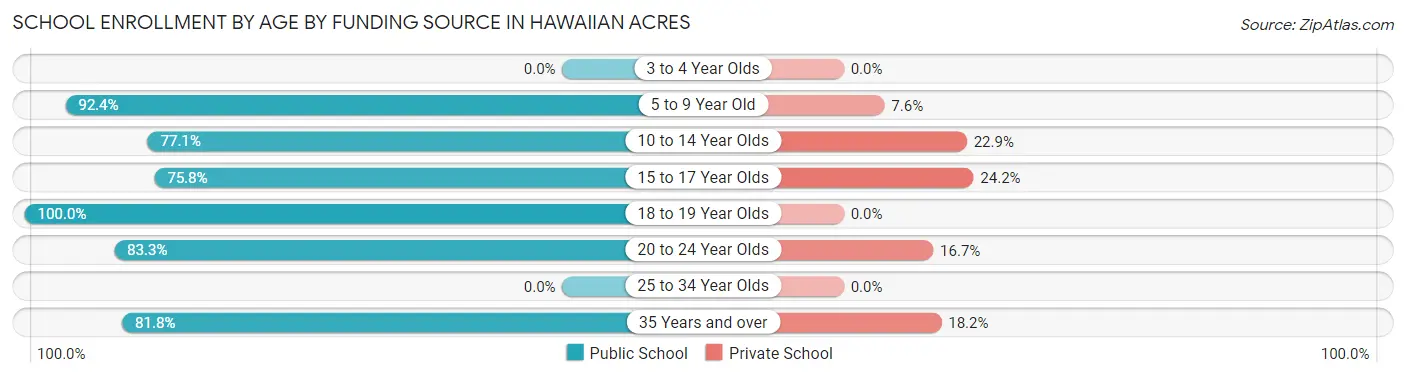
| Age Bracket | Public School | Private School |
| 3 to 4 Year Olds | 0 (0.0%) | 0 (0.0%) |
| 5 to 9 Year Old | 268 (92.4%) | 22 (7.6%) |
| 10 to 14 Year Olds | 74 (77.1%) | 22 (22.9%) |
| 15 to 17 Year Olds | 160 (75.8%) | 51 (24.2%) |
| 18 to 19 Year Olds | 36 (100.0%) | 0 (0.0%) |
| 20 to 24 Year Olds | 130 (83.3%) | 26 (16.7%) |
| 25 to 34 Year Olds | 0 (0.0%) | 0 (0.0%) |
| 35 Years and over | 108 (81.8%) | 24 (18.2%) |
| Total | 776 (84.3%) | 145 (15.7%) |
Educational Attainment by Field of Study in Hawaiian Acres
Bio, nature & agricultural (135 | 23.6%), arts & humanities (119 | 20.8%), psychology (104 | 18.2%), education (60 | 10.5%), and science & technology (51 | 8.9%) are the most common fields of study among 571 individuals in Hawaiian Acres who have obtained a bachelor's degree or higher.
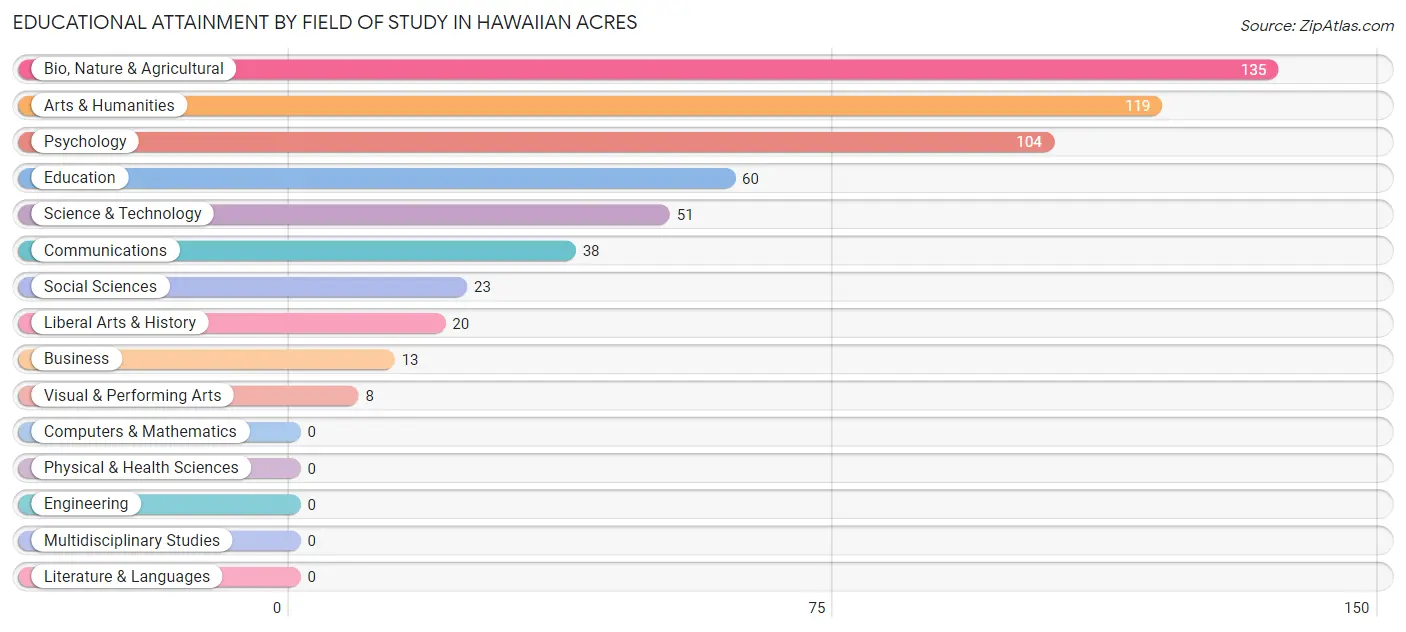
| Field of Study | # Graduates | % Graduates |
| Computers & Mathematics | 0 | 0.0% |
| Bio, Nature & Agricultural | 135 | 23.6% |
| Physical & Health Sciences | 0 | 0.0% |
| Psychology | 104 | 18.2% |
| Social Sciences | 23 | 4.0% |
| Engineering | 0 | 0.0% |
| Multidisciplinary Studies | 0 | 0.0% |
| Science & Technology | 51 | 8.9% |
| Business | 13 | 2.3% |
| Education | 60 | 10.5% |
| Literature & Languages | 0 | 0.0% |
| Liberal Arts & History | 20 | 3.5% |
| Visual & Performing Arts | 8 | 1.4% |
| Communications | 38 | 6.7% |
| Arts & Humanities | 119 | 20.8% |
| Total | 571 | 100.0% |
Transportation & Commute in Hawaiian Acres
Vehicle Availability by Sex in Hawaiian Acres
The most prevalent vehicle ownership categories in Hawaiian Acres are males with 3 vehicles (181, accounting for 24.8%) and females with 3 vehicles (146, making up 23.2%).
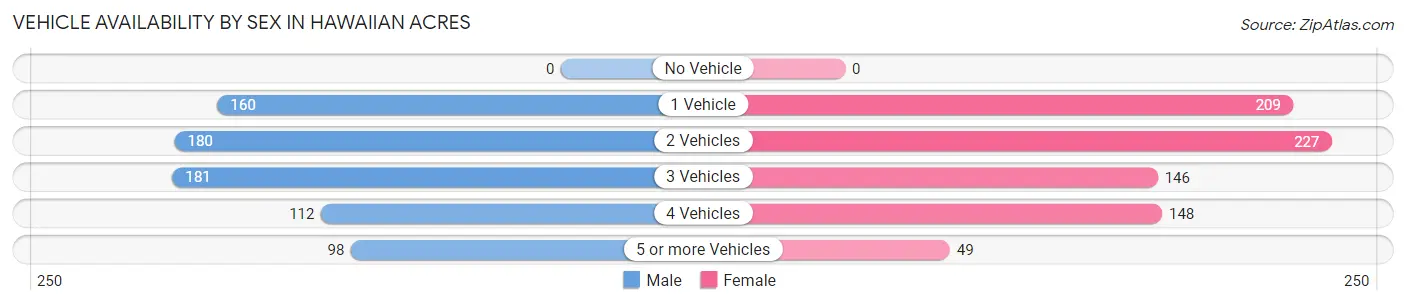
| Vehicles Available | Male | Female |
| No Vehicle | 0 (0.0%) | 0 (0.0%) |
| 1 Vehicle | 160 (21.9%) | 209 (26.8%) |
| 2 Vehicles | 180 (24.6%) | 227 (29.1%) |
| 3 Vehicles | 181 (24.8%) | 146 (18.7%) |
| 4 Vehicles | 112 (15.3%) | 148 (19.0%) |
| 5 or more Vehicles | 98 (13.4%) | 49 (6.3%) |
| Total | 731 (100.0%) | 779 (100.0%) |
Commute Time in Hawaiian Acres
The most frequently occuring commute durations in Hawaiian Acres are 30 to 34 minutes (486 commuters, 37.0%), 40 to 44 minutes (297 commuters, 22.6%), and 20 to 24 minutes (159 commuters, 12.1%).
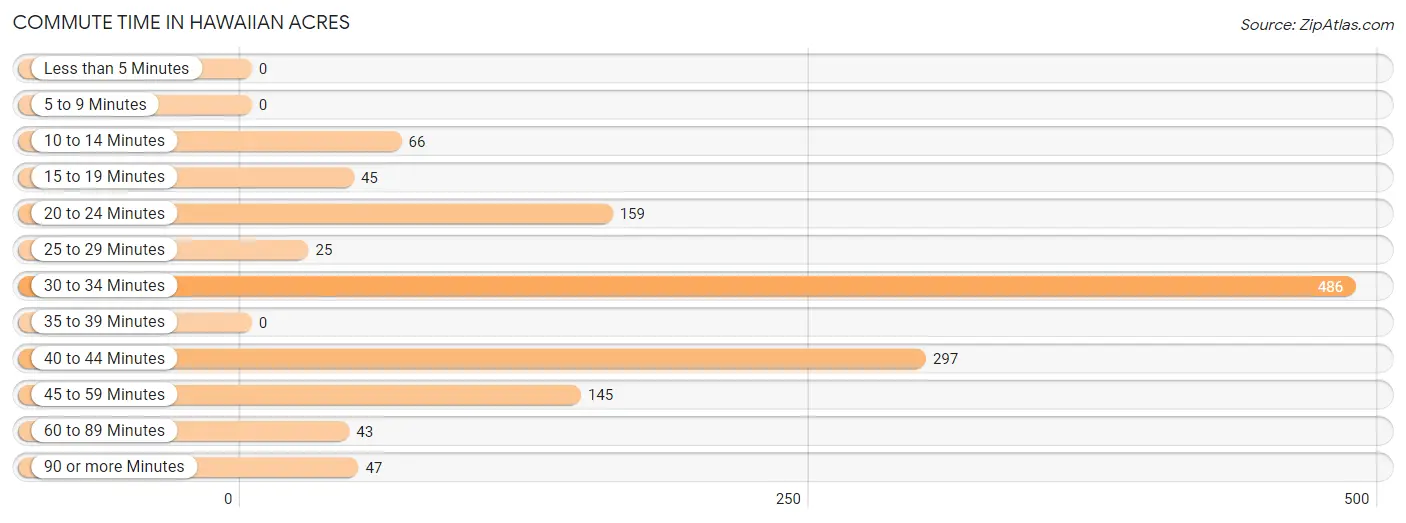
| Commute Time | # Commuters | % Commuters |
| Less than 5 Minutes | 0 | 0.0% |
| 5 to 9 Minutes | 0 | 0.0% |
| 10 to 14 Minutes | 66 | 5.0% |
| 15 to 19 Minutes | 45 | 3.4% |
| 20 to 24 Minutes | 159 | 12.1% |
| 25 to 29 Minutes | 25 | 1.9% |
| 30 to 34 Minutes | 486 | 37.0% |
| 35 to 39 Minutes | 0 | 0.0% |
| 40 to 44 Minutes | 297 | 22.6% |
| 45 to 59 Minutes | 145 | 11.0% |
| 60 to 89 Minutes | 43 | 3.3% |
| 90 or more Minutes | 47 | 3.6% |
Commute Time by Sex in Hawaiian Acres
The most common commute times in Hawaiian Acres are 30 to 34 minutes (179 commuters, 29.8%) for males and 30 to 34 minutes (307 commuters, 43.1%) for females.
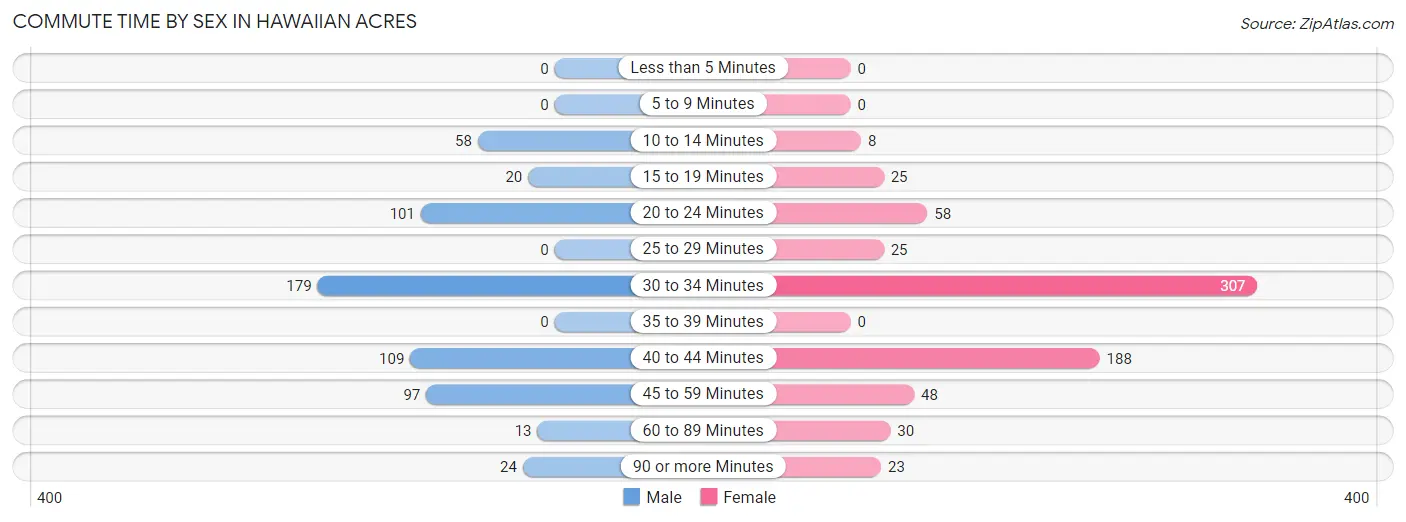
| Commute Time | Male | Female |
| Less than 5 Minutes | 0 (0.0%) | 0 (0.0%) |
| 5 to 9 Minutes | 0 (0.0%) | 0 (0.0%) |
| 10 to 14 Minutes | 58 (9.7%) | 8 (1.1%) |
| 15 to 19 Minutes | 20 (3.3%) | 25 (3.5%) |
| 20 to 24 Minutes | 101 (16.8%) | 58 (8.2%) |
| 25 to 29 Minutes | 0 (0.0%) | 25 (3.5%) |
| 30 to 34 Minutes | 179 (29.8%) | 307 (43.1%) |
| 35 to 39 Minutes | 0 (0.0%) | 0 (0.0%) |
| 40 to 44 Minutes | 109 (18.1%) | 188 (26.4%) |
| 45 to 59 Minutes | 97 (16.1%) | 48 (6.7%) |
| 60 to 89 Minutes | 13 (2.2%) | 30 (4.2%) |
| 90 or more Minutes | 24 (4.0%) | 23 (3.2%) |
Time of Departure to Work by Sex in Hawaiian Acres
The most frequent times of departure to work in Hawaiian Acres are 6:30 AM to 6:59 AM (242, 40.3%) for males and 6:30 AM to 6:59 AM (308, 43.3%) for females.
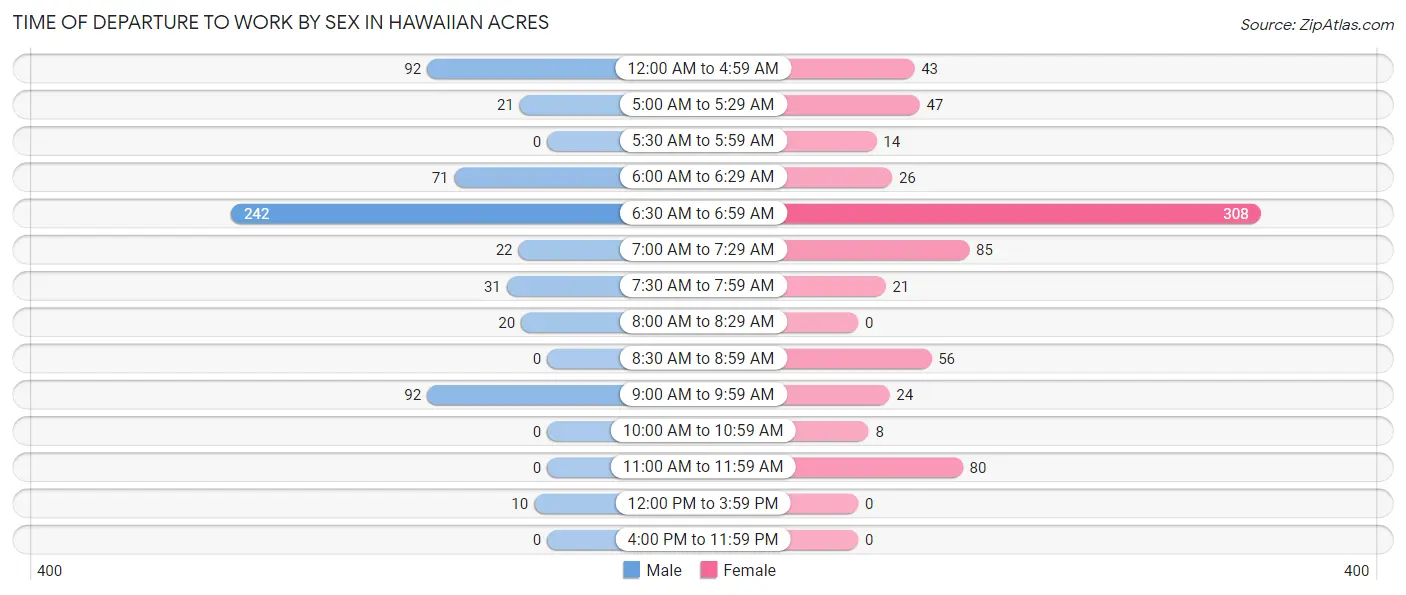
| Time of Departure | Male | Female |
| 12:00 AM to 4:59 AM | 92 (15.3%) | 43 (6.0%) |
| 5:00 AM to 5:29 AM | 21 (3.5%) | 47 (6.6%) |
| 5:30 AM to 5:59 AM | 0 (0.0%) | 14 (2.0%) |
| 6:00 AM to 6:29 AM | 71 (11.8%) | 26 (3.6%) |
| 6:30 AM to 6:59 AM | 242 (40.3%) | 308 (43.3%) |
| 7:00 AM to 7:29 AM | 22 (3.7%) | 85 (11.9%) |
| 7:30 AM to 7:59 AM | 31 (5.2%) | 21 (2.9%) |
| 8:00 AM to 8:29 AM | 20 (3.3%) | 0 (0.0%) |
| 8:30 AM to 8:59 AM | 0 (0.0%) | 56 (7.9%) |
| 9:00 AM to 9:59 AM | 92 (15.3%) | 24 (3.4%) |
| 10:00 AM to 10:59 AM | 0 (0.0%) | 8 (1.1%) |
| 11:00 AM to 11:59 AM | 0 (0.0%) | 80 (11.2%) |
| 12:00 PM to 3:59 PM | 10 (1.7%) | 0 (0.0%) |
| 4:00 PM to 11:59 PM | 0 (0.0%) | 0 (0.0%) |
| Total | 601 (100.0%) | 712 (100.0%) |
Housing Occupancy in Hawaiian Acres
Occupancy by Ownership in Hawaiian Acres
Of the total 1,283 dwellings in Hawaiian Acres, owner-occupied units account for 1,131 (88.1%), while renter-occupied units make up 152 (11.8%).
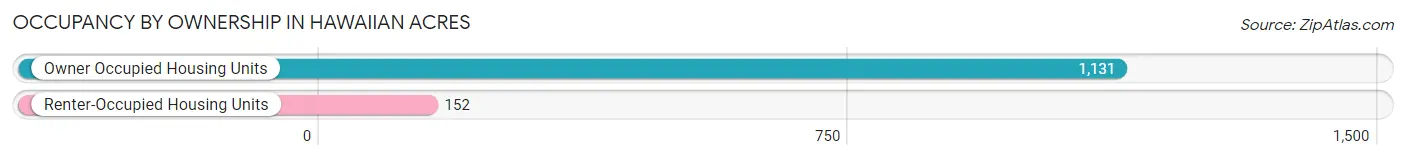
| Occupancy | # Housing Units | % Housing Units |
| Owner Occupied Housing Units | 1,131 | 88.1% |
| Renter-Occupied Housing Units | 152 | 11.8% |
| Total Occupied Housing Units | 1,283 | 100.0% |
Occupancy by Household Size in Hawaiian Acres
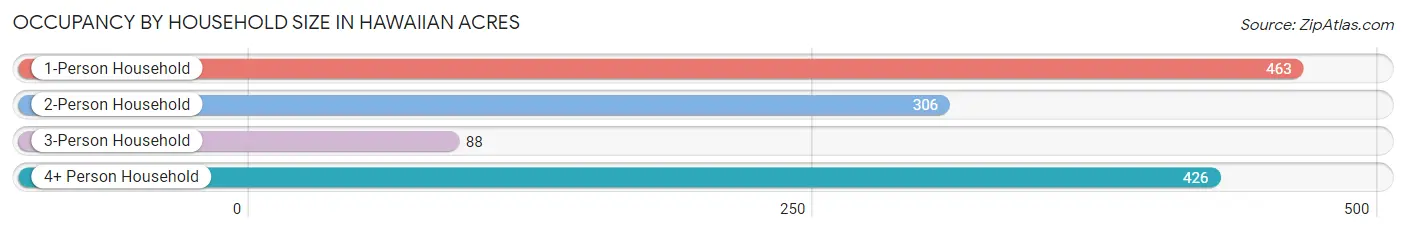
| Household Size | # Housing Units | % Housing Units |
| 1-Person Household | 463 | 36.1% |
| 2-Person Household | 306 | 23.8% |
| 3-Person Household | 88 | 6.9% |
| 4+ Person Household | 426 | 33.2% |
| Total Housing Units | 1,283 | 100.0% |
Occupancy by Ownership by Household Size in Hawaiian Acres
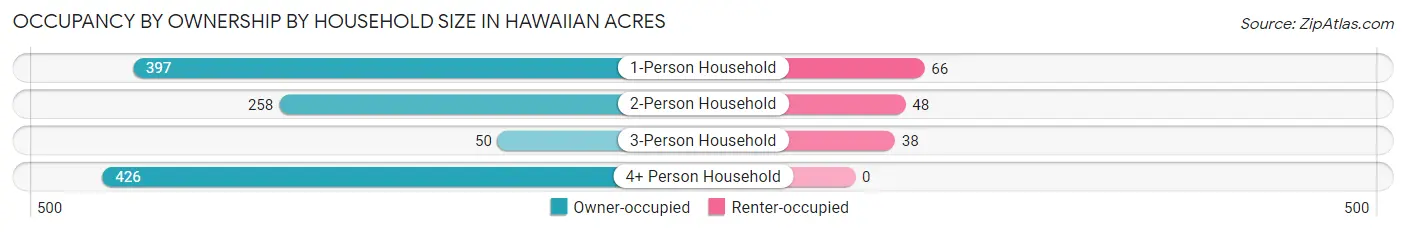
| Household Size | Owner-occupied | Renter-occupied |
| 1-Person Household | 397 (85.8%) | 66 (14.2%) |
| 2-Person Household | 258 (84.3%) | 48 (15.7%) |
| 3-Person Household | 50 (56.8%) | 38 (43.2%) |
| 4+ Person Household | 426 (100.0%) | 0 (0.0%) |
| Total Housing Units | 1,131 (88.1%) | 152 (11.8%) |
Occupancy by Educational Attainment in Hawaiian Acres
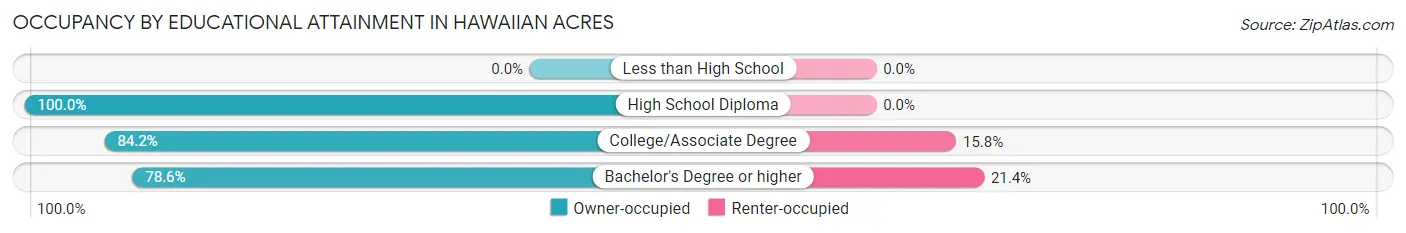
| Household Size | Owner-occupied | Renter-occupied |
| Less than High School | 0 (0.0%) | 0 (0.0%) |
| High School Diploma | 410 (100.0%) | 0 (0.0%) |
| College/Associate Degree | 526 (84.2%) | 99 (15.8%) |
| Bachelor's Degree or higher | 195 (78.6%) | 53 (21.4%) |
Occupancy by Age of Householder in Hawaiian Acres
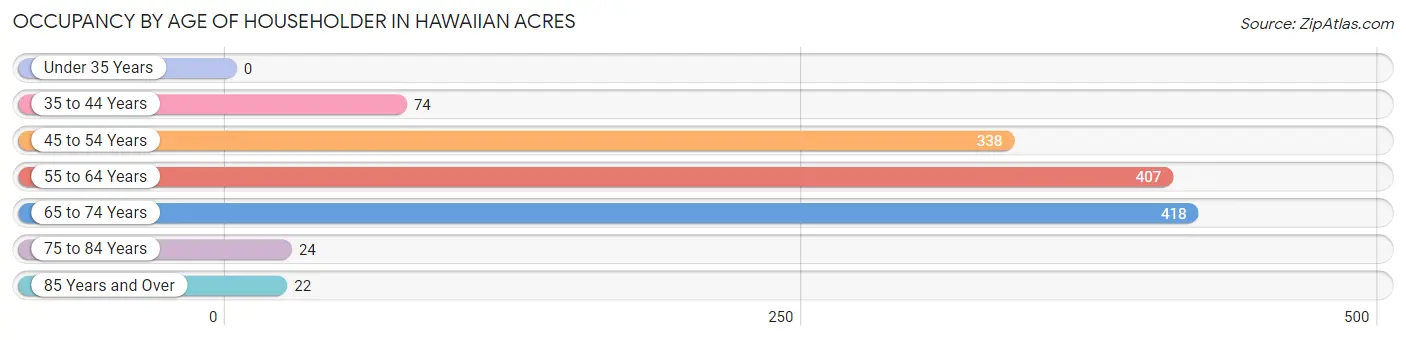
| Age Bracket | # Households | % Households |
| Under 35 Years | 0 | 0.0% |
| 35 to 44 Years | 74 | 5.8% |
| 45 to 54 Years | 338 | 26.3% |
| 55 to 64 Years | 407 | 31.7% |
| 65 to 74 Years | 418 | 32.6% |
| 75 to 84 Years | 24 | 1.9% |
| 85 Years and Over | 22 | 1.7% |
| Total | 1,283 | 100.0% |
Housing Finances in Hawaiian Acres
Median Income by Occupancy in Hawaiian Acres
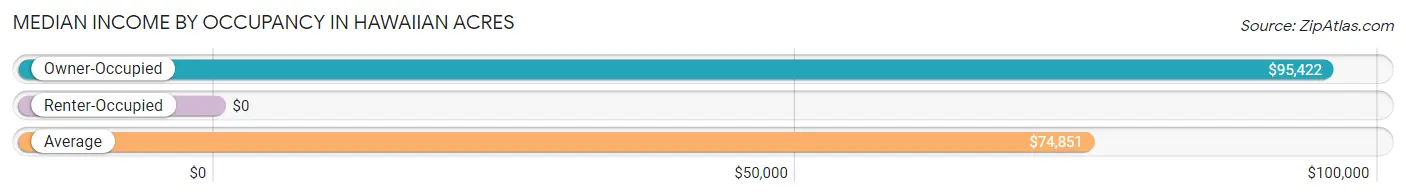
| Occupancy Type | # Households | Median Income |
| Owner-Occupied | 1,131 (88.1%) | $95,422 |
| Renter-Occupied | 152 (11.8%) | $0 |
| Average | 1,283 (100.0%) | $74,851 |
Occupancy by Householder Income Bracket in Hawaiian Acres
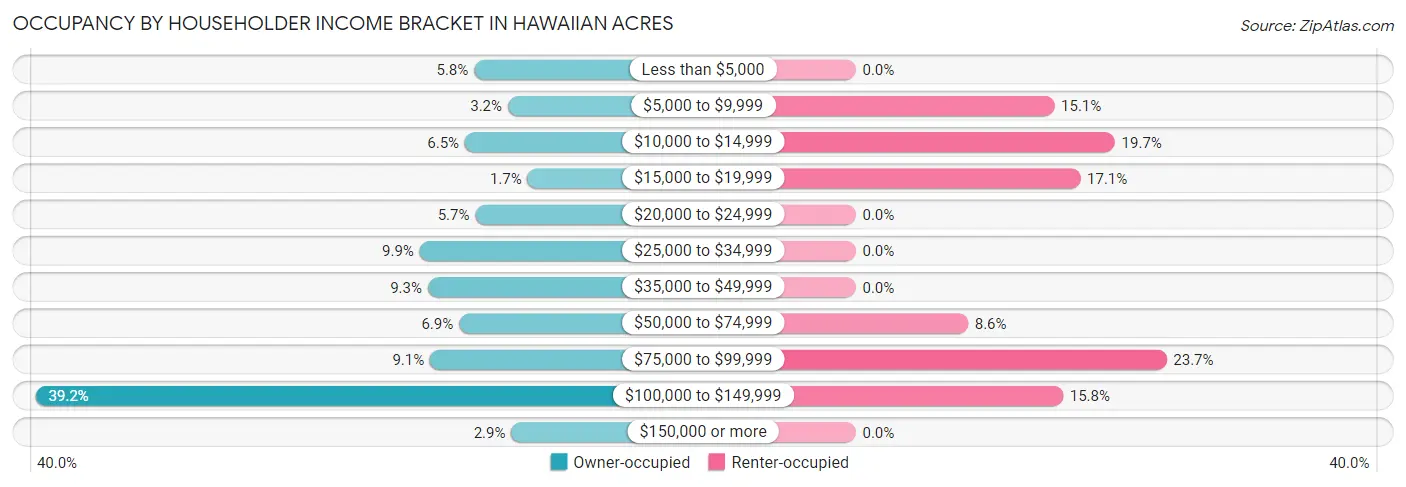
| Income Bracket | Owner-occupied | Renter-occupied |
| Less than $5,000 | 65 (5.8%) | 0 (0.0%) |
| $5,000 to $9,999 | 36 (3.2%) | 23 (15.1%) |
| $10,000 to $14,999 | 73 (6.5%) | 30 (19.7%) |
| $15,000 to $19,999 | 19 (1.7%) | 26 (17.1%) |
| $20,000 to $24,999 | 64 (5.7%) | 0 (0.0%) |
| $25,000 to $34,999 | 112 (9.9%) | 0 (0.0%) |
| $35,000 to $49,999 | 105 (9.3%) | 0 (0.0%) |
| $50,000 to $74,999 | 78 (6.9%) | 13 (8.6%) |
| $75,000 to $99,999 | 103 (9.1%) | 36 (23.7%) |
| $100,000 to $149,999 | 443 (39.2%) | 24 (15.8%) |
| $150,000 or more | 33 (2.9%) | 0 (0.0%) |
| Total | 1,131 (100.0%) | 152 (100.0%) |
Monthly Housing Cost Tiers in Hawaiian Acres
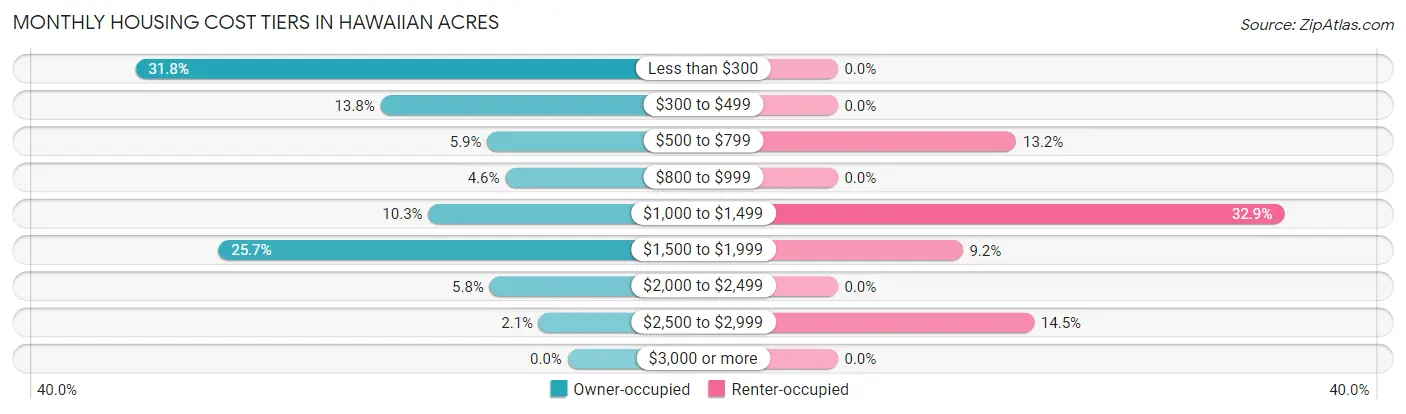
| Monthly Cost | Owner-occupied | Renter-occupied |
| Less than $300 | 360 (31.8%) | 0 (0.0%) |
| $300 to $499 | 156 (13.8%) | 0 (0.0%) |
| $500 to $799 | 67 (5.9%) | 20 (13.2%) |
| $800 to $999 | 52 (4.6%) | 0 (0.0%) |
| $1,000 to $1,499 | 116 (10.3%) | 50 (32.9%) |
| $1,500 to $1,999 | 291 (25.7%) | 14 (9.2%) |
| $2,000 to $2,499 | 65 (5.8%) | 0 (0.0%) |
| $2,500 to $2,999 | 24 (2.1%) | 22 (14.5%) |
| $3,000 or more | 0 (0.0%) | 0 (0.0%) |
| Total | 1,131 (100.0%) | 152 (100.0%) |
Physical Housing Characteristics in Hawaiian Acres
Housing Structures in Hawaiian Acres
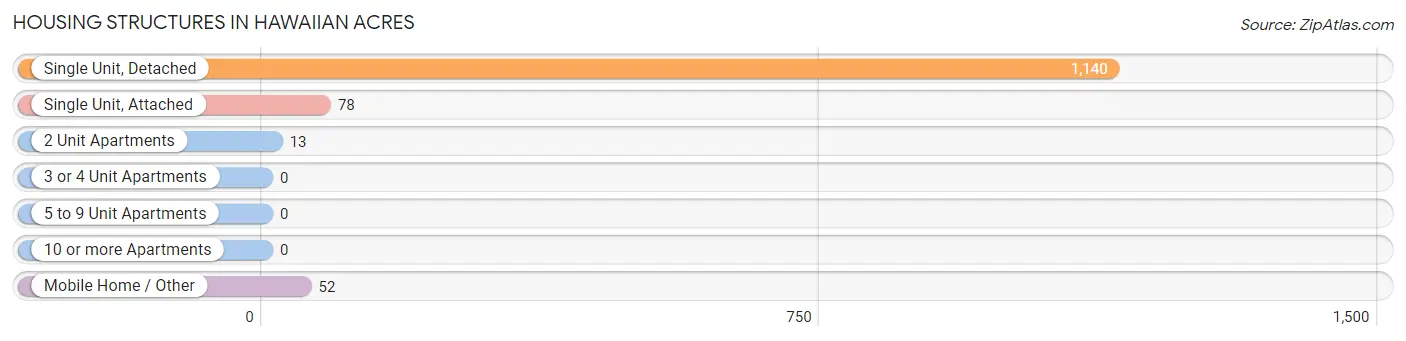
| Structure Type | # Housing Units | % Housing Units |
| Single Unit, Detached | 1,140 | 88.8% |
| Single Unit, Attached | 78 | 6.1% |
| 2 Unit Apartments | 13 | 1.0% |
| 3 or 4 Unit Apartments | 0 | 0.0% |
| 5 to 9 Unit Apartments | 0 | 0.0% |
| 10 or more Apartments | 0 | 0.0% |
| Mobile Home / Other | 52 | 4.1% |
| Total | 1,283 | 100.0% |
Housing Structures by Occupancy in Hawaiian Acres
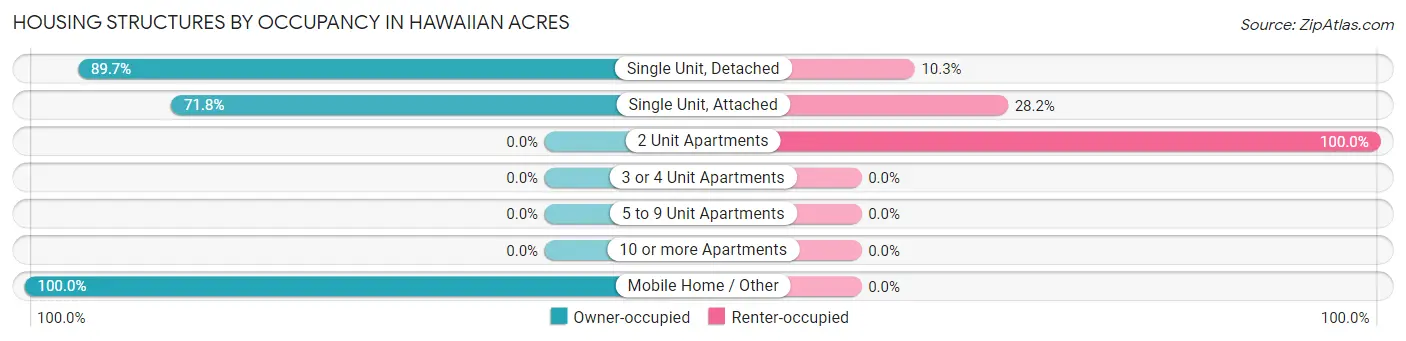
| Structure Type | Owner-occupied | Renter-occupied |
| Single Unit, Detached | 1,023 (89.7%) | 117 (10.3%) |
| Single Unit, Attached | 56 (71.8%) | 22 (28.2%) |
| 2 Unit Apartments | 0 (0.0%) | 13 (100.0%) |
| 3 or 4 Unit Apartments | 0 (0.0%) | 0 (0.0%) |
| 5 to 9 Unit Apartments | 0 (0.0%) | 0 (0.0%) |
| 10 or more Apartments | 0 (0.0%) | 0 (0.0%) |
| Mobile Home / Other | 52 (100.0%) | 0 (0.0%) |
| Total | 1,131 (88.1%) | 152 (11.8%) |
Housing Structures by Number of Rooms in Hawaiian Acres
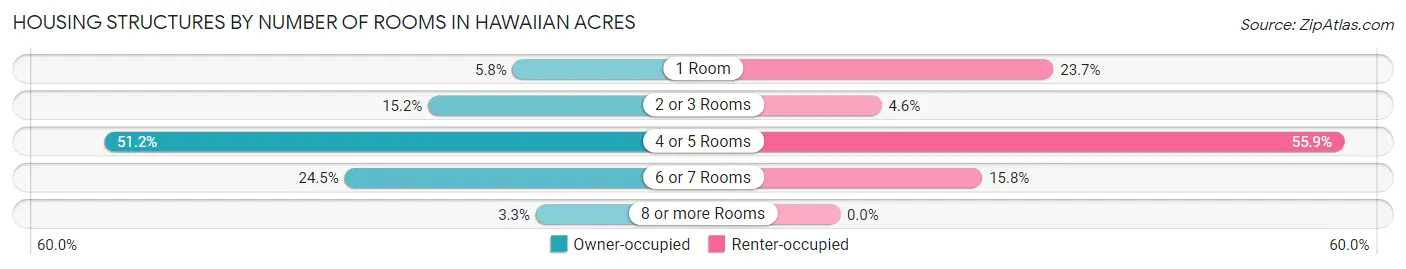
| Number of Rooms | Owner-occupied | Renter-occupied |
| 1 Room | 66 (5.8%) | 36 (23.7%) |
| 2 or 3 Rooms | 172 (15.2%) | 7 (4.6%) |
| 4 or 5 Rooms | 579 (51.2%) | 85 (55.9%) |
| 6 or 7 Rooms | 277 (24.5%) | 24 (15.8%) |
| 8 or more Rooms | 37 (3.3%) | 0 (0.0%) |
| Total | 1,131 (100.0%) | 152 (100.0%) |
Housing Structure by Heating Type in Hawaiian Acres
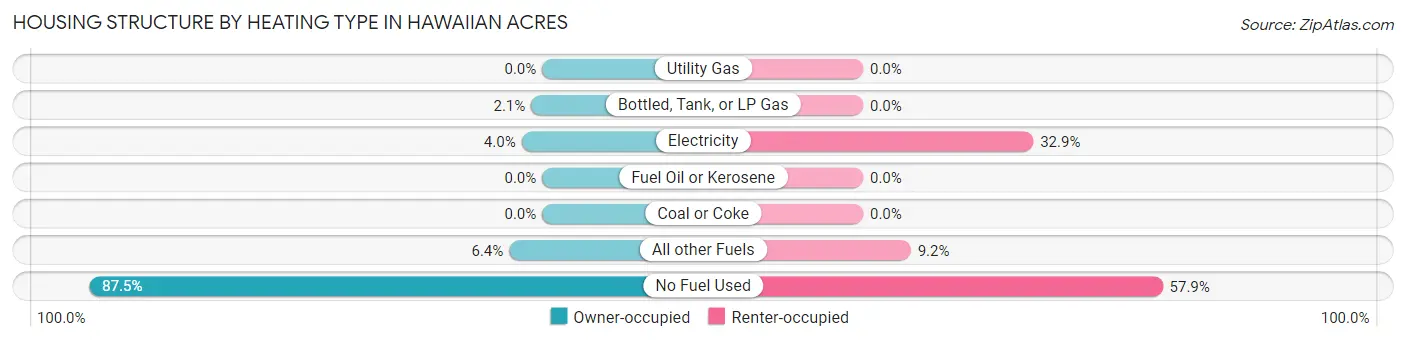
| Heating Type | Owner-occupied | Renter-occupied |
| Utility Gas | 0 (0.0%) | 0 (0.0%) |
| Bottled, Tank, or LP Gas | 24 (2.1%) | 0 (0.0%) |
| Electricity | 45 (4.0%) | 50 (32.9%) |
| Fuel Oil or Kerosene | 0 (0.0%) | 0 (0.0%) |
| Coal or Coke | 0 (0.0%) | 0 (0.0%) |
| All other Fuels | 72 (6.4%) | 14 (9.2%) |
| No Fuel Used | 990 (87.5%) | 88 (57.9%) |
| Total | 1,131 (100.0%) | 152 (100.0%) |
Household Vehicle Usage in Hawaiian Acres
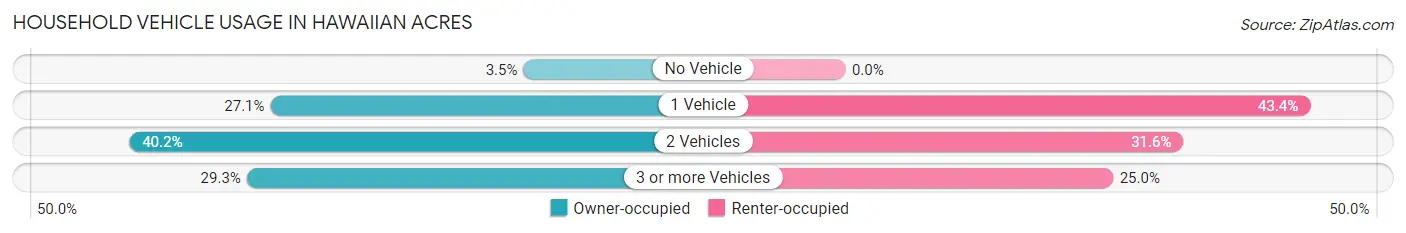
| Vehicles per Household | Owner-occupied | Renter-occupied |
| No Vehicle | 39 (3.5%) | 0 (0.0%) |
| 1 Vehicle | 306 (27.1%) | 66 (43.4%) |
| 2 Vehicles | 455 (40.2%) | 48 (31.6%) |
| 3 or more Vehicles | 331 (29.3%) | 38 (25.0%) |
| Total | 1,131 (100.0%) | 152 (100.0%) |
Real Estate & Mortgages in Hawaiian Acres
Real Estate and Mortgage Overview in Hawaiian Acres
| Characteristic | Without Mortgage | With Mortgage |
| Housing Units | 643 | 488 |
| Median Property Value | $211,600 | $380,500 |
| Median Household Income | $45,560 | $33 |
| Monthly Housing Costs | $256 | $0 |
| Real Estate Taxes | - | - |
Property Value by Mortgage Status in Hawaiian Acres
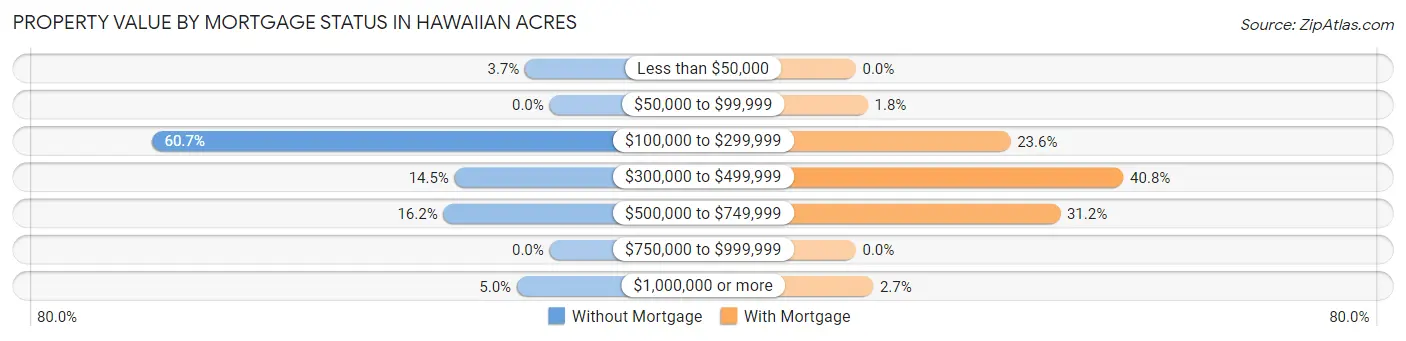
| Property Value | Without Mortgage | With Mortgage |
| Less than $50,000 | 24 (3.7%) | 0 (0.0%) |
| $50,000 to $99,999 | 0 (0.0%) | 9 (1.8%) |
| $100,000 to $299,999 | 390 (60.7%) | 115 (23.6%) |
| $300,000 to $499,999 | 93 (14.5%) | 199 (40.8%) |
| $500,000 to $749,999 | 104 (16.2%) | 152 (31.1%) |
| $750,000 to $999,999 | 0 (0.0%) | 0 (0.0%) |
| $1,000,000 or more | 32 (5.0%) | 13 (2.7%) |
| Total | 643 (100.0%) | 488 (100.0%) |
Household Income by Mortgage Status in Hawaiian Acres
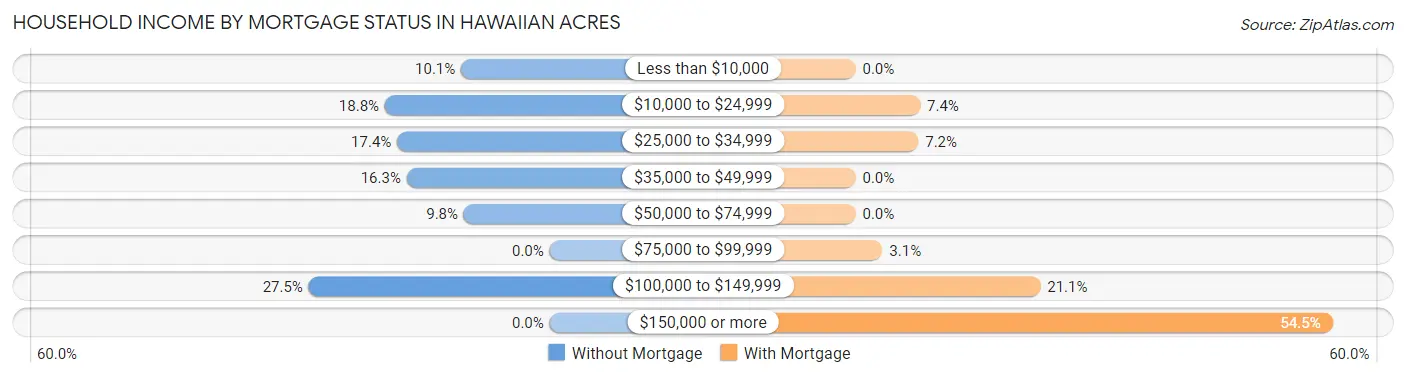
| Household Income | Without Mortgage | With Mortgage |
| Less than $10,000 | 65 (10.1%) | 0 (0.0%) |
| $10,000 to $24,999 | 121 (18.8%) | 36 (7.4%) |
| $25,000 to $34,999 | 112 (17.4%) | 35 (7.2%) |
| $35,000 to $49,999 | 105 (16.3%) | 0 (0.0%) |
| $50,000 to $74,999 | 63 (9.8%) | 0 (0.0%) |
| $75,000 to $99,999 | 0 (0.0%) | 15 (3.1%) |
| $100,000 to $149,999 | 177 (27.5%) | 103 (21.1%) |
| $150,000 or more | 0 (0.0%) | 266 (54.5%) |
| Total | 643 (100.0%) | 488 (100.0%) |
Property Value to Household Income Ratio in Hawaiian Acres
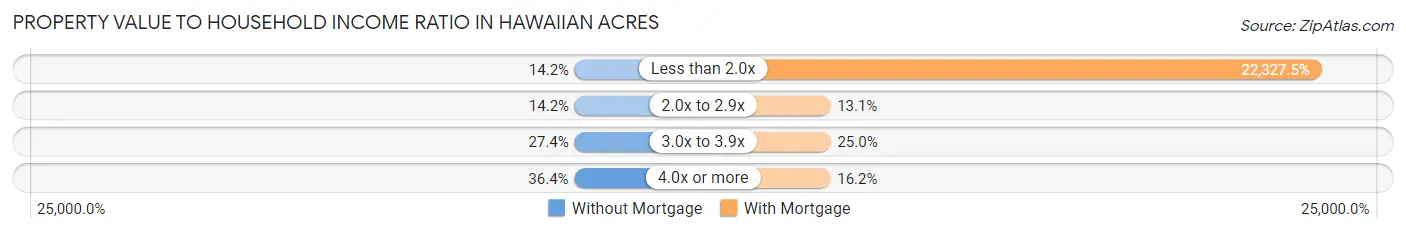
| Value-to-Income Ratio | Without Mortgage | With Mortgage |
| Less than 2.0x | 91 (14.1%) | 108,958 (22,327.5%) |
| 2.0x to 2.9x | 91 (14.1%) | 64 (13.1%) |
| 3.0x to 3.9x | 176 (27.4%) | 122 (25.0%) |
| 4.0x or more | 234 (36.4%) | 79 (16.2%) |
| Total | 643 (100.0%) | 488 (100.0%) |
Real Estate Taxes by Mortgage Status in Hawaiian Acres
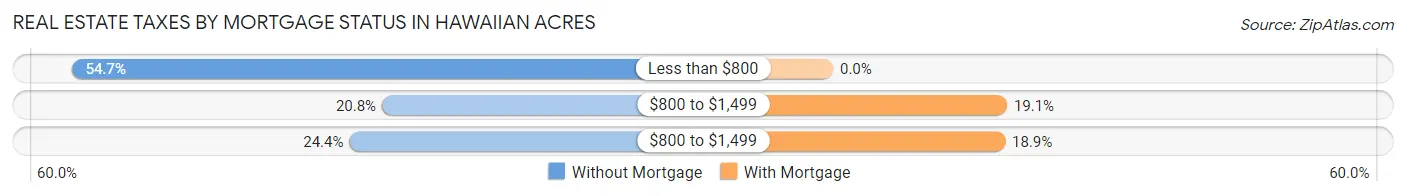
| Property Taxes | Without Mortgage | With Mortgage |
| Less than $800 | 352 (54.7%) | 0 (0.0%) |
| $800 to $1,499 | 134 (20.8%) | 93 (19.1%) |
| $800 to $1,499 | 157 (24.4%) | 92 (18.9%) |
| Total | 643 (100.0%) | 488 (100.0%) |
Health & Disability in Hawaiian Acres
Health Insurance Coverage by Age in Hawaiian Acres
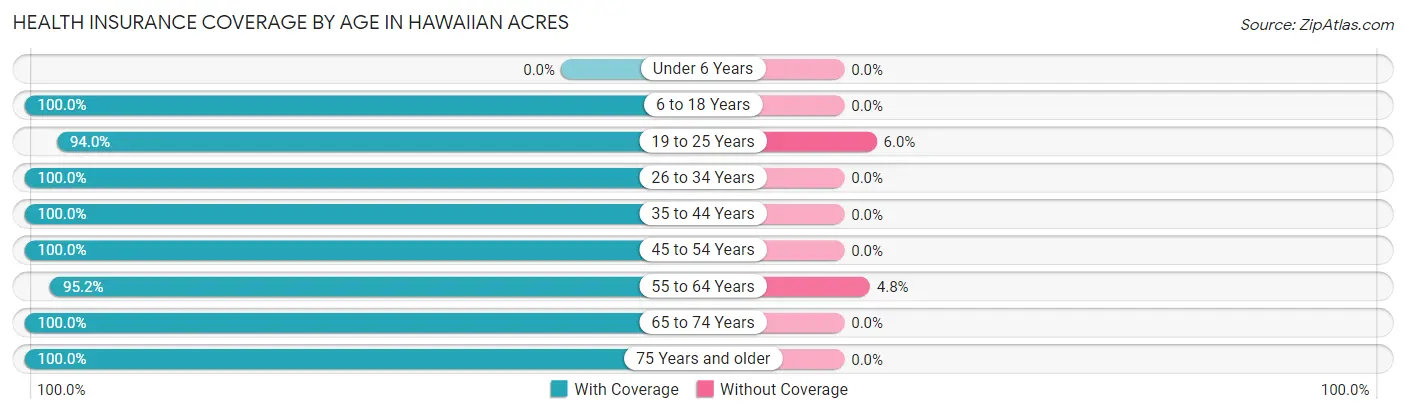
| Age Bracket | With Coverage | Without Coverage |
| Under 6 Years | 0 (0.0%) | 0 (0.0%) |
| 6 to 18 Years | 668 (100.0%) | 0 (0.0%) |
| 19 to 25 Years | 327 (94.0%) | 21 (6.0%) |
| 26 to 34 Years | 154 (100.0%) | 0 (0.0%) |
| 35 to 44 Years | 327 (100.0%) | 0 (0.0%) |
| 45 to 54 Years | 586 (100.0%) | 0 (0.0%) |
| 55 to 64 Years | 599 (95.2%) | 30 (4.8%) |
| 65 to 74 Years | 615 (100.0%) | 0 (0.0%) |
| 75 Years and older | 157 (100.0%) | 0 (0.0%) |
| Total | 3,433 (98.5%) | 51 (1.5%) |
Health Insurance Coverage by Citizenship Status in Hawaiian Acres
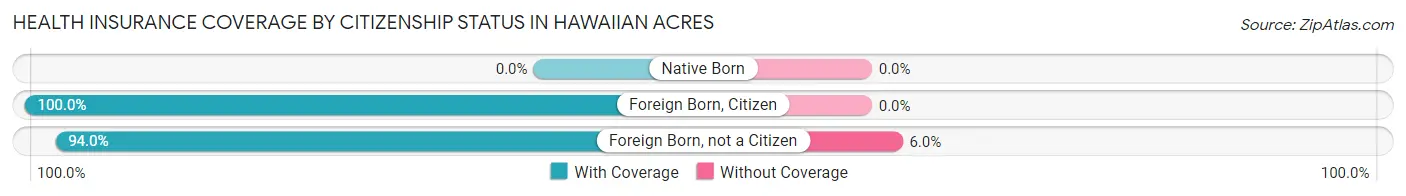
| Citizenship Status | With Coverage | Without Coverage |
| Native Born | 0 (0.0%) | 0 (0.0%) |
| Foreign Born, Citizen | 668 (100.0%) | 0 (0.0%) |
| Foreign Born, not a Citizen | 327 (94.0%) | 21 (6.0%) |
Health Insurance Coverage by Household Income in Hawaiian Acres
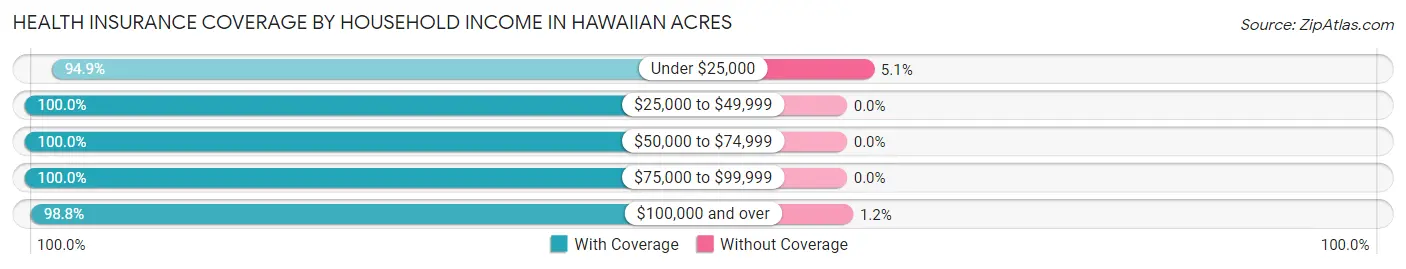
| Household Income | With Coverage | Without Coverage |
| Under $25,000 | 561 (94.9%) | 30 (5.1%) |
| $25,000 to $49,999 | 286 (100.0%) | 0 (0.0%) |
| $50,000 to $74,999 | 265 (100.0%) | 0 (0.0%) |
| $75,000 to $99,999 | 530 (100.0%) | 0 (0.0%) |
| $100,000 and over | 1,791 (98.8%) | 21 (1.2%) |
Public vs Private Health Insurance Coverage by Age in Hawaiian Acres
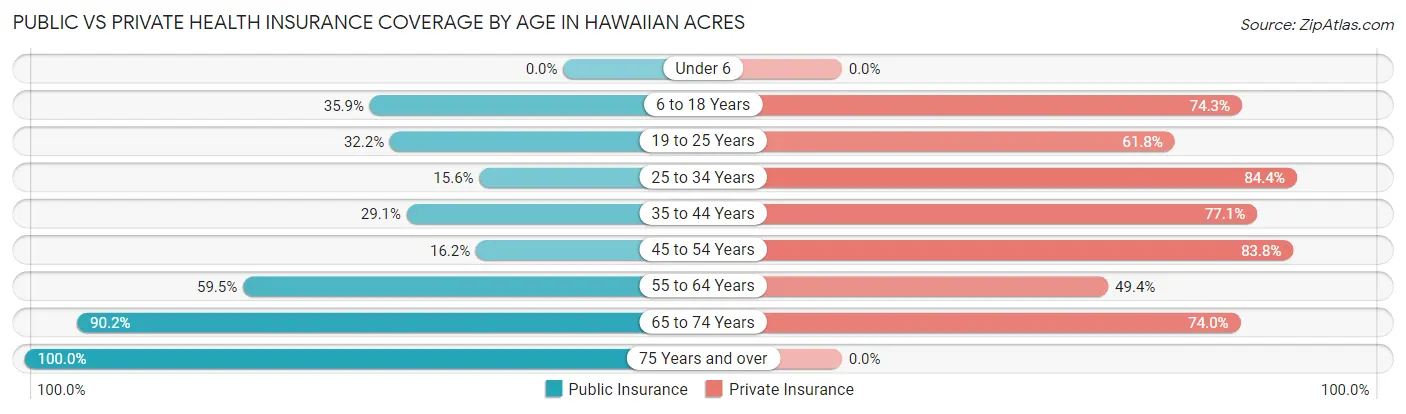
| Age Bracket | Public Insurance | Private Insurance |
| Under 6 | 0 (0.0%) | 0 (0.0%) |
| 6 to 18 Years | 240 (35.9%) | 496 (74.3%) |
| 19 to 25 Years | 112 (32.2%) | 215 (61.8%) |
| 25 to 34 Years | 24 (15.6%) | 130 (84.4%) |
| 35 to 44 Years | 95 (29.0%) | 252 (77.1%) |
| 45 to 54 Years | 95 (16.2%) | 491 (83.8%) |
| 55 to 64 Years | 374 (59.5%) | 311 (49.4%) |
| 65 to 74 Years | 555 (90.2%) | 455 (74.0%) |
| 75 Years and over | 157 (100.0%) | 0 (0.0%) |
| Total | 1,652 (47.4%) | 2,350 (67.4%) |
Disability Status by Sex by Age in Hawaiian Acres
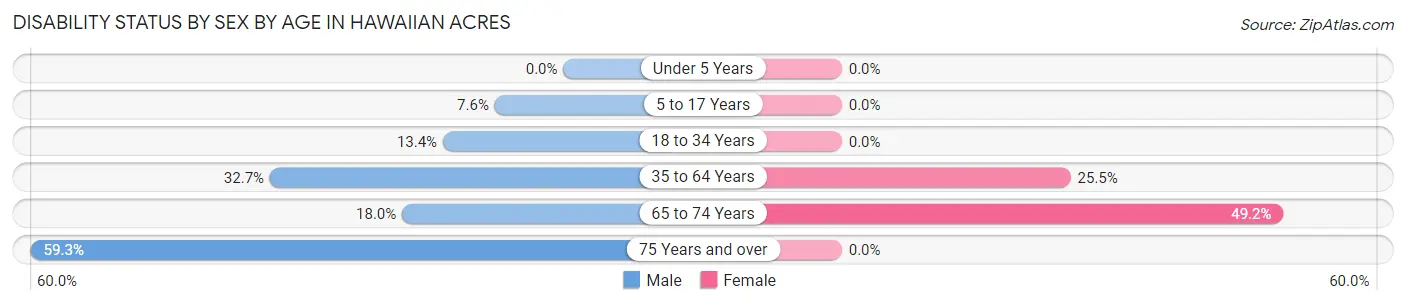
| Age Bracket | Male | Female |
| Under 5 Years | 0 (0.0%) | 0 (0.0%) |
| 5 to 17 Years | 22 (7.6%) | 0 (0.0%) |
| 18 to 34 Years | 24 (13.4%) | 0 (0.0%) |
| 35 to 64 Years | 250 (32.7%) | 198 (25.5%) |
| 65 to 74 Years | 67 (18.0%) | 119 (49.2%) |
| 75 Years and over | 35 (59.3%) | 0 (0.0%) |
Disability Class by Sex by Age in Hawaiian Acres
Disability Class: Hearing Difficulty
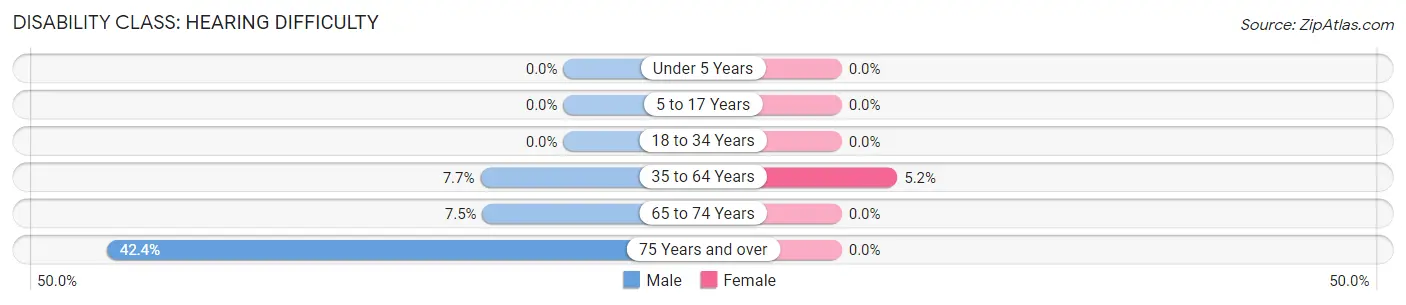
| Age Bracket | Male | Female |
| Under 5 Years | 0 (0.0%) | 0 (0.0%) |
| 5 to 17 Years | 0 (0.0%) | 0 (0.0%) |
| 18 to 34 Years | 0 (0.0%) | 0 (0.0%) |
| 35 to 64 Years | 59 (7.7%) | 40 (5.1%) |
| 65 to 74 Years | 28 (7.5%) | 0 (0.0%) |
| 75 Years and over | 25 (42.4%) | 0 (0.0%) |
Disability Class: Vision Difficulty
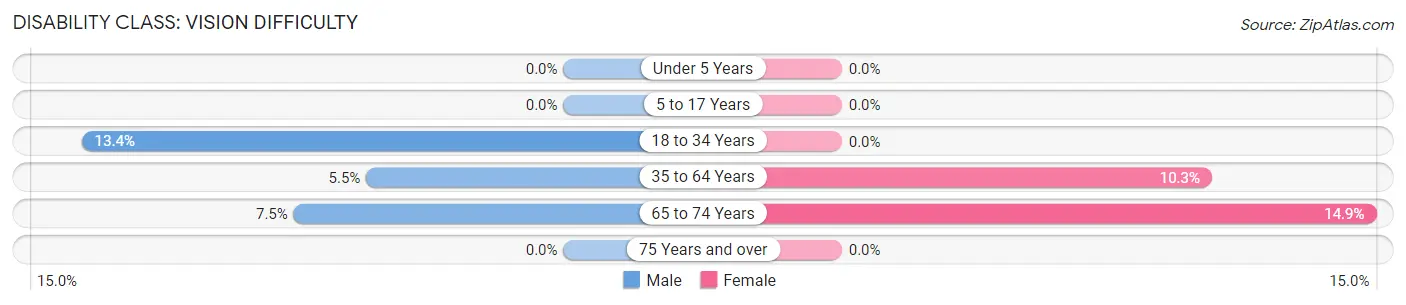
| Age Bracket | Male | Female |
| Under 5 Years | 0 (0.0%) | 0 (0.0%) |
| 5 to 17 Years | 0 (0.0%) | 0 (0.0%) |
| 18 to 34 Years | 24 (13.4%) | 0 (0.0%) |
| 35 to 64 Years | 42 (5.5%) | 80 (10.3%) |
| 65 to 74 Years | 28 (7.5%) | 36 (14.9%) |
| 75 Years and over | 0 (0.0%) | 0 (0.0%) |
Disability Class: Cognitive Difficulty
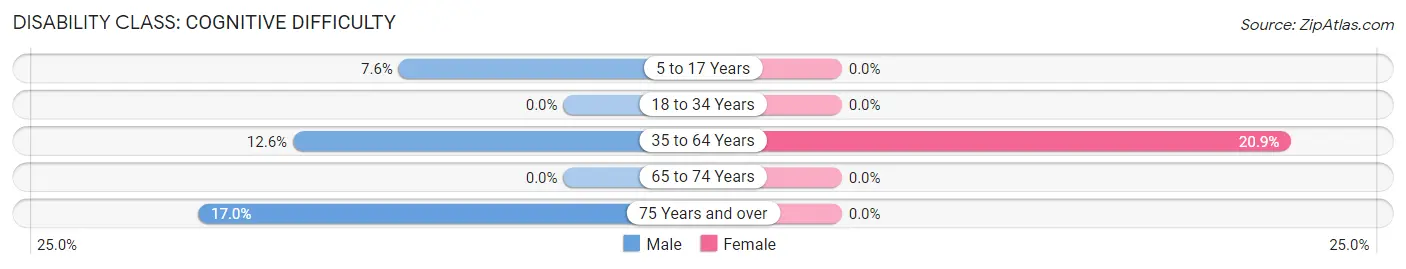
| Age Bracket | Male | Female |
| 5 to 17 Years | 22 (7.6%) | 0 (0.0%) |
| 18 to 34 Years | 0 (0.0%) | 0 (0.0%) |
| 35 to 64 Years | 96 (12.6%) | 162 (20.8%) |
| 65 to 74 Years | 0 (0.0%) | 0 (0.0%) |
| 75 Years and over | 10 (17.0%) | 0 (0.0%) |
Disability Class: Ambulatory Difficulty
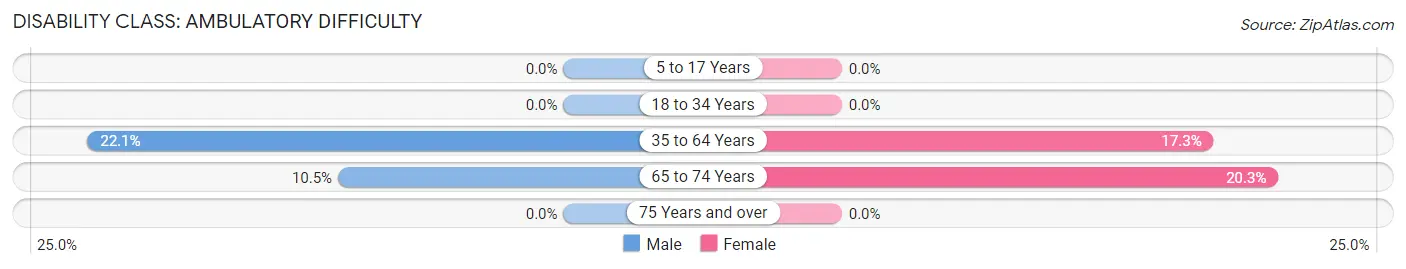
| Age Bracket | Male | Female |
| 5 to 17 Years | 0 (0.0%) | 0 (0.0%) |
| 18 to 34 Years | 0 (0.0%) | 0 (0.0%) |
| 35 to 64 Years | 169 (22.1%) | 134 (17.2%) |
| 65 to 74 Years | 39 (10.5%) | 49 (20.3%) |
| 75 Years and over | 0 (0.0%) | 0 (0.0%) |
Disability Class: Self-Care Difficulty
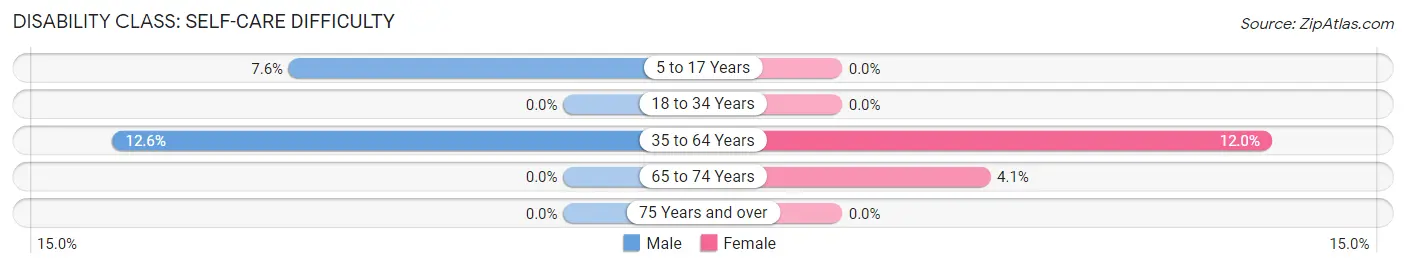
| Age Bracket | Male | Female |
| 5 to 17 Years | 22 (7.6%) | 0 (0.0%) |
| 18 to 34 Years | 0 (0.0%) | 0 (0.0%) |
| 35 to 64 Years | 96 (12.6%) | 93 (12.0%) |
| 65 to 74 Years | 0 (0.0%) | 10 (4.1%) |
| 75 Years and over | 0 (0.0%) | 0 (0.0%) |
Technology Access in Hawaiian Acres
Computing Device Access in Hawaiian Acres
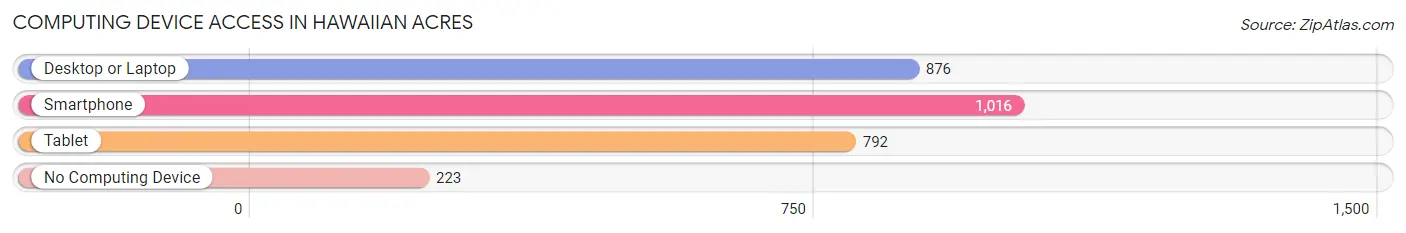
| Device Type | # Households | % Households |
| Desktop or Laptop | 876 | 68.3% |
| Smartphone | 1,016 | 79.2% |
| Tablet | 792 | 61.7% |
| No Computing Device | 223 | 17.4% |
| Total | 1,283 | 100.0% |
Internet Access in Hawaiian Acres
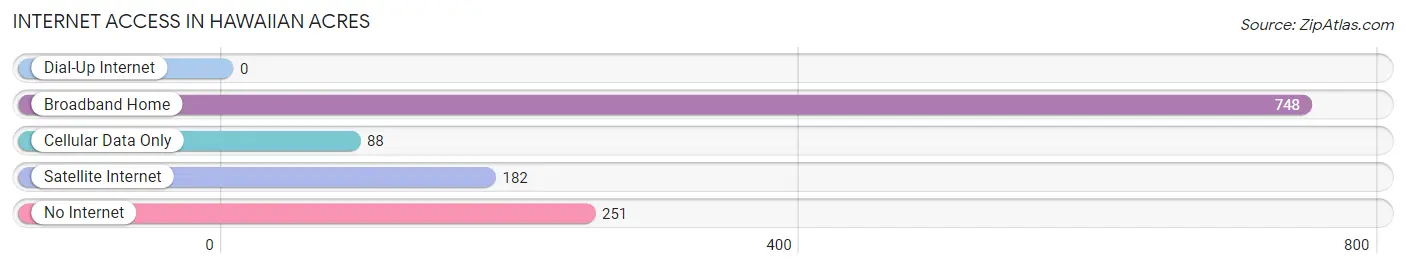
| Internet Type | # Households | % Households |
| Dial-Up Internet | 0 | 0.0% |
| Broadband Home | 748 | 58.3% |
| Cellular Data Only | 88 | 6.9% |
| Satellite Internet | 182 | 14.2% |
| No Internet | 251 | 19.6% |
| Total | 1,283 | 100.0% |
Hawaiian Acres Summary
Hawaiian Acres is a census-designated place (CDP) located in the Puna District of the Big Island of Hawaii. It is located in the southeastern part of the island, about 10 miles south of Hilo. The population of Hawaiian Acres was 2,845 at the 2010 census.
Geography
Hawaiian Acres is located at 19°33'25"N, 155°2'25"W (19.556944, -155.040278). It is situated at an elevation of 1,400 feet (427 m) above sea level. The total area of the CDP is 4.3 square miles (11.2 km2), of which 4.2 square miles (10.9 km2) is land and 0.1 square miles (0.3 km2) is water.
The terrain of Hawaiian Acres is mostly hilly, with some flat areas. The climate is tropical, with temperatures ranging from the mid-70s to the mid-80s Fahrenheit (21-30 Celsius). The area receives an average of about 60 inches (1,524 mm) of rain per year.
History
Hawaiian Acres was established in the early 1960s as a planned community. It was developed by the Hawaiian Acres Corporation, which was founded by a group of investors from the mainland United States. The development was intended to provide affordable housing for people who wanted to live in the Hawaiian Islands.
The first homes in Hawaiian Acres were built in 1962. The development was designed to be self-sufficient, with its own water and power systems. The community was also designed to be environmentally friendly, with a focus on preserving the natural beauty of the area.
Economy
The economy of Hawaiian Acres is largely based on tourism and agriculture. The area is home to several small farms, which produce a variety of fruits and vegetables. The area is also popular with tourists, who come to enjoy the tropical climate and the beautiful scenery.
Demographics
As of the 2010 census, there were 2,845 people, 1,093 households, and 790 families residing in Hawaiian Acres. The population density was 668.3 people per square mile (258.3/km2). The racial makeup of the CDP was 57.2% White, 0.7% African American, 0.3% Native American, 11.2% Asian, 0.2% Pacific Islander, 25.2% from other races, and 5.2% from two or more races. Hispanic or Latino of any race were 33.2% of the population.
The median income for a household in Hawaiian Acres was $41,944, and the median income for a family was $50,000. The per capita income for the CDP was $20,945. About 11.2% of families and 14.2% of the population were below the poverty line, including 18.2% of those under age 18 and 8.2% of those age 65 or over.
Conclusion
Hawaiian Acres is a small, rural community located on the Big Island of Hawaii. It was established in the early 1960s as a planned community, and has since become a popular destination for tourists and a center for agriculture. The population of Hawaiian Acres is diverse, with a mix of different racial and ethnic backgrounds. The economy of the area is largely based on tourism and agriculture, and the median income for a household is slightly below the national average.
Common Questions
What is Per Capita Income in Hawaiian Acres?
Per Capita income in Hawaiian Acres is $30,758.
What is the Median Family Income in Hawaiian Acres?
Median Family Income in Hawaiian Acres is $97,328.
What is the Median Household income in Hawaiian Acres?
Median Household Income in Hawaiian Acres is $74,851.
What is Income or Wage Gap in Hawaiian Acres?
Income or Wage Gap in Hawaiian Acres is 45.1%.
Women in Hawaiian Acres earn 54.9 cents for every dollar earned by a man.
What is Inequality or Gini Index in Hawaiian Acres?
Inequality or Gini Index in Hawaiian Acres is 0.41.
What is the Total Population of Hawaiian Acres?
Total Population of Hawaiian Acres is 3,484.
What is the Total Male Population of Hawaiian Acres?
Total Male Population of Hawaiian Acres is 1,664.
What is the Total Female Population of Hawaiian Acres?
Total Female Population of Hawaiian Acres is 1,820.
What is the Ratio of Males per 100 Females in Hawaiian Acres?
There are 91.43 Males per 100 Females in Hawaiian Acres.
What is the Ratio of Females per 100 Males in Hawaiian Acres?
There are 109.38 Females per 100 Males in Hawaiian Acres.
What is the Median Population Age in Hawaiian Acres?
Median Population Age in Hawaiian Acres is 47.9 Years.
What is the Average Family Size in Hawaiian Acres
Average Family Size in Hawaiian Acres is 3.7 People.
What is the Average Household Size in Hawaiian Acres
Average Household Size in Hawaiian Acres is 2.7 People.
How Large is the Labor Force in Hawaiian Acres?
There are 1,643 People in the Labor Forcein in Hawaiian Acres.
What is the Percentage of People in the Labor Force in Hawaiian Acres?
55.7% of People are in the Labor Force in Hawaiian Acres.
What is the Unemployment Rate in Hawaiian Acres?
Unemployment Rate in Hawaiian Acres is 5.4%.