Haena, HI Map & Demographics
Haena Map
Haena Overview
$40,440
PER CAPITA INCOME
$108,906
AVG HOUSEHOLD INCOME
58.9%
WAGE / INCOME GAP [ % ]
41.1¢/ $1
WAGE / INCOME GAP [ $ ]
0.42
INEQUALITY / GINI INDEX
501
TOTAL POPULATION
255
MALE POPULATION
246
FEMALE POPULATION
103.66
MALES / 100 FEMALES
96.47
FEMALES / 100 MALES
42.1
MEDIAN AGE
3.2
AVG FAMILY SIZE
3.0
AVG HOUSEHOLD SIZE
176
LABOR FORCE [ PEOPLE ]
52.2%
PERCENT IN LABOR FORCE
6.3%
UNEMPLOYMENT RATE
Income in Haena
Income Overview in Haena
| Characteristic | Number | Measure |
| Per Capita Income | 501 | $40,440 |
| Median Family Income | 138 | $0 |
| Mean Family Income | 138 | $113,049 |
| Median Household Income | 165 | $108,906 |
| Mean Household Income | 165 | $118,072 |
| Income Deficit | 138 | $0 |
| Wage / Income Gap (%) | 501 | 58.87% |
| Wage / Income Gap ($) | 501 | 41.13¢ per $1 |
| Gini / Inequality Index | 501 | 0.42 |
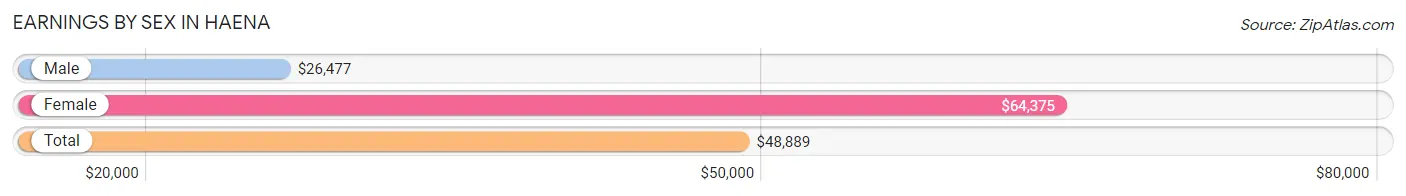
Earnings by Sex in Haena
Average Earnings in Haena are $48,889, $26,477 for men and $64,375 for women, a difference of 58.9%.
| Sex | Number | Average Earnings |
| Male | 55 (28.9%) | $26,477 |
| Female | 135 (71.1%) | $64,375 |
| Total | 190 (100.0%) | $48,889 |
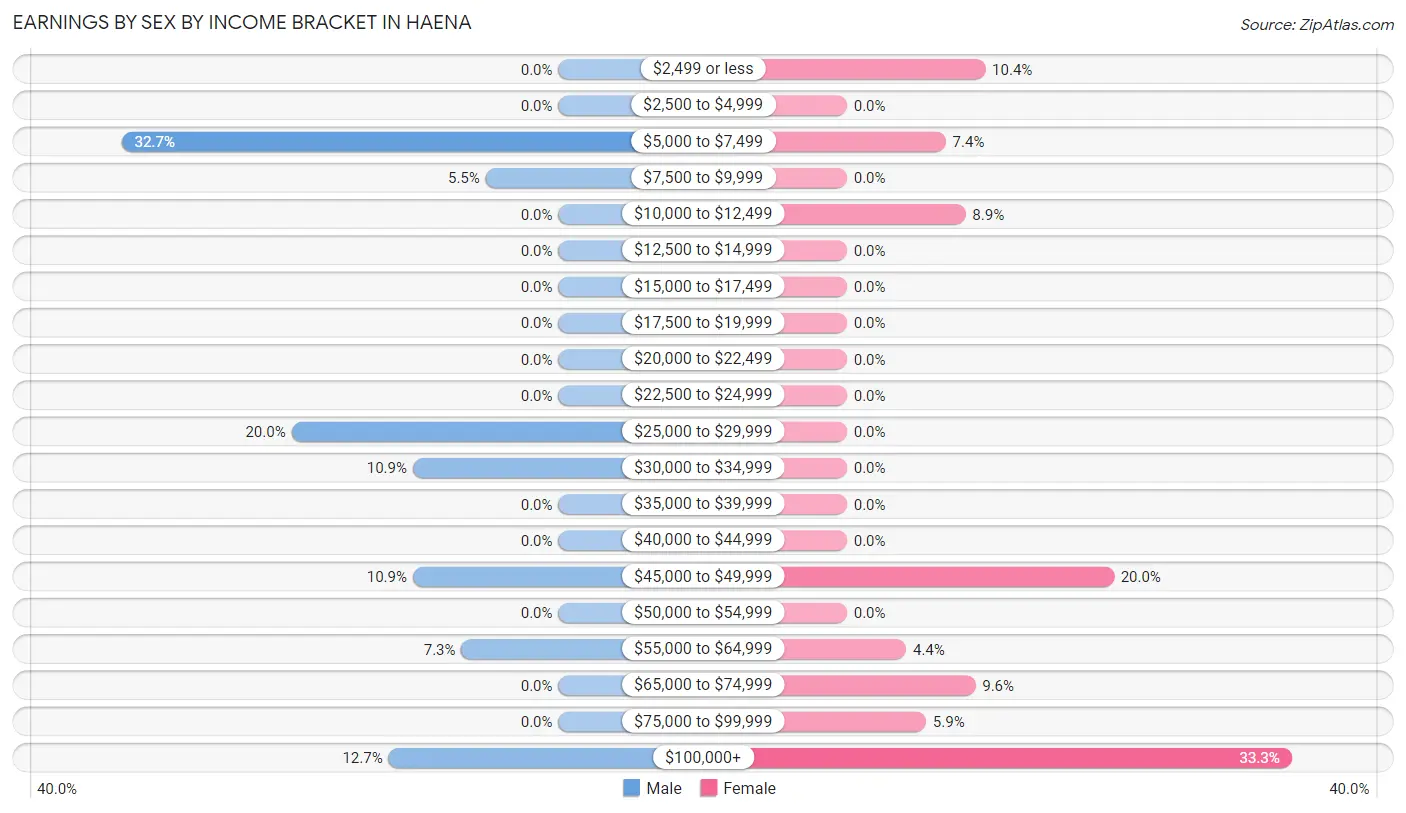
Earnings by Sex by Income Bracket in Haena
The most common earnings brackets in Haena are $5,000 to $7,499 for men (18 | 32.7%) and $100,000+ for women (45 | 33.3%).
| Income | Male | Female |
| $2,499 or less | 0 (0.0%) | 14 (10.4%) |
| $2,500 to $4,999 | 0 (0.0%) | 0 (0.0%) |
| $5,000 to $7,499 | 18 (32.7%) | 10 (7.4%) |
| $7,500 to $9,999 | 3 (5.4%) | 0 (0.0%) |
| $10,000 to $12,499 | 0 (0.0%) | 12 (8.9%) |
| $12,500 to $14,999 | 0 (0.0%) | 0 (0.0%) |
| $15,000 to $17,499 | 0 (0.0%) | 0 (0.0%) |
| $17,500 to $19,999 | 0 (0.0%) | 0 (0.0%) |
| $20,000 to $22,499 | 0 (0.0%) | 0 (0.0%) |
| $22,500 to $24,999 | 0 (0.0%) | 0 (0.0%) |
| $25,000 to $29,999 | 11 (20.0%) | 0 (0.0%) |
| $30,000 to $34,999 | 6 (10.9%) | 0 (0.0%) |
| $35,000 to $39,999 | 0 (0.0%) | 0 (0.0%) |
| $40,000 to $44,999 | 0 (0.0%) | 0 (0.0%) |
| $45,000 to $49,999 | 6 (10.9%) | 27 (20.0%) |
| $50,000 to $54,999 | 0 (0.0%) | 0 (0.0%) |
| $55,000 to $64,999 | 4 (7.3%) | 6 (4.4%) |
| $65,000 to $74,999 | 0 (0.0%) | 13 (9.6%) |
| $75,000 to $99,999 | 0 (0.0%) | 8 (5.9%) |
| $100,000+ | 7 (12.7%) | 45 (33.3%) |
| Total | 55 (100.0%) | 135 (100.0%) |
Earnings by Sex by Educational Attainment in Haena
| Educational Attainment | Male Income | Female Income |
| Less than High School | - | - |
| High School Diploma | - | - |
| College or Associate's Degree | - | - |
| Bachelor's Degree | - | - |
| Graduate Degree | - | - |
| Total | $32,708 | $70,673 |
Family Income in Haena
Family Income Brackets in Haena
According to the Haena family income data, there are 34 families falling into the $35,000 to $49,999 income range, which is the most common income bracket and makes up 24.6% of all families.
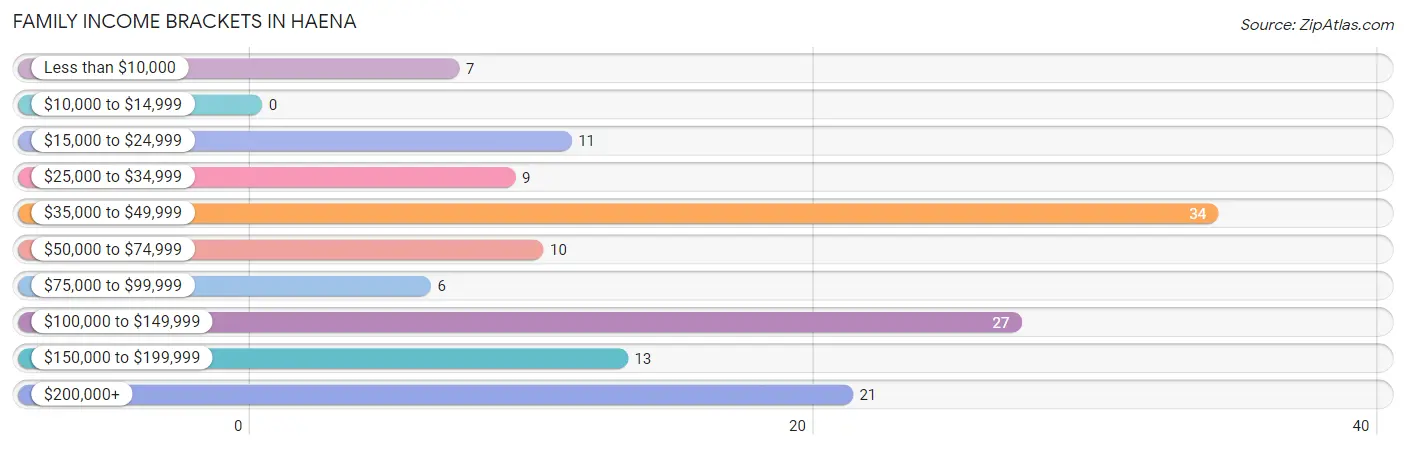
| Income Bracket | # Families | % Families |
| Less than $10,000 | 7 | 5.1% |
| $10,000 to $14,999 | 0 | 0.0% |
| $15,000 to $24,999 | 11 | 8.0% |
| $25,000 to $34,999 | 9 | 6.5% |
| $35,000 to $49,999 | 34 | 24.6% |
| $50,000 to $74,999 | 10 | 7.2% |
| $75,000 to $99,999 | 6 | 4.3% |
| $100,000 to $149,999 | 27 | 19.6% |
| $150,000 to $199,999 | 13 | 9.4% |
| $200,000+ | 21 | 15.2% |
Family Income by Famaliy Size in Haena
2-person families (46 | 33.3%) account for the highest median family income in Haena with $90,833 per family, while 2-person families (46 | 33.3%) have the highest median income of $45,416 per family member.
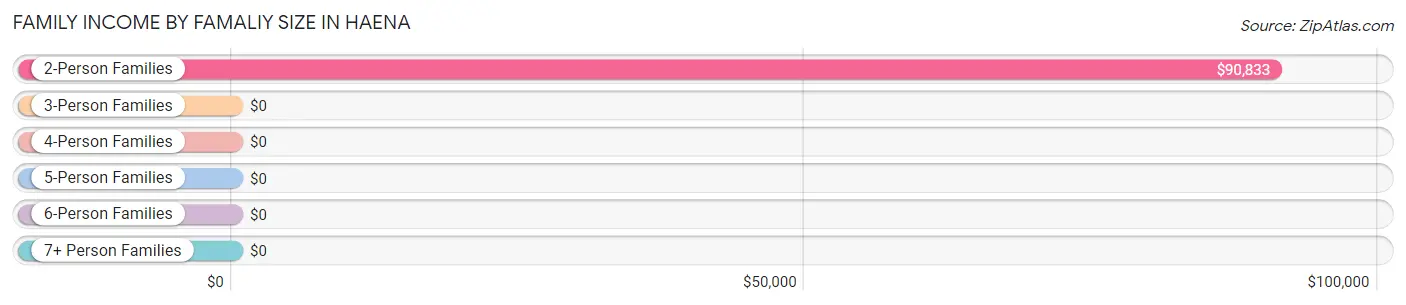
| Income Bracket | # Families | Median Income |
| 2-Person Families | 46 (33.3%) | $90,833 |
| 3-Person Families | 20 (14.5%) | $0 |
| 4-Person Families | 57 (41.3%) | $0 |
| 5-Person Families | 8 (5.8%) | $0 |
| 6-Person Families | 7 (5.1%) | $0 |
| 7+ Person Families | 0 (0.0%) | $0 |
| Total | 138 (100.0%) | $0 |
Family Income by Number of Earners in Haena
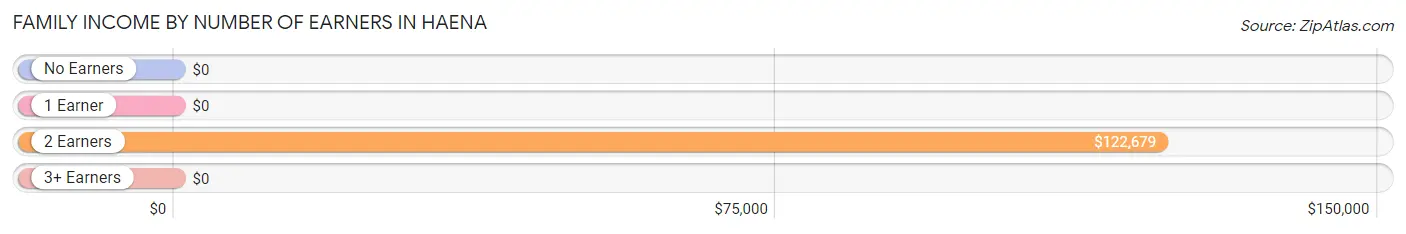
| Number of Earners | # Families | Median Income |
| No Earners | 36 (26.1%) | $0 |
| 1 Earner | 63 (45.7%) | $0 |
| 2 Earners | 39 (28.3%) | $122,679 |
| 3+ Earners | 0 (0.0%) | $0 |
| Total | 138 (100.0%) | $0 |
Household Income in Haena
Household Income Brackets in Haena
With 42 households falling in the category, the $100,000 to $149,999 income range is the most frequent in Haena, accounting for 25.5% of all households.
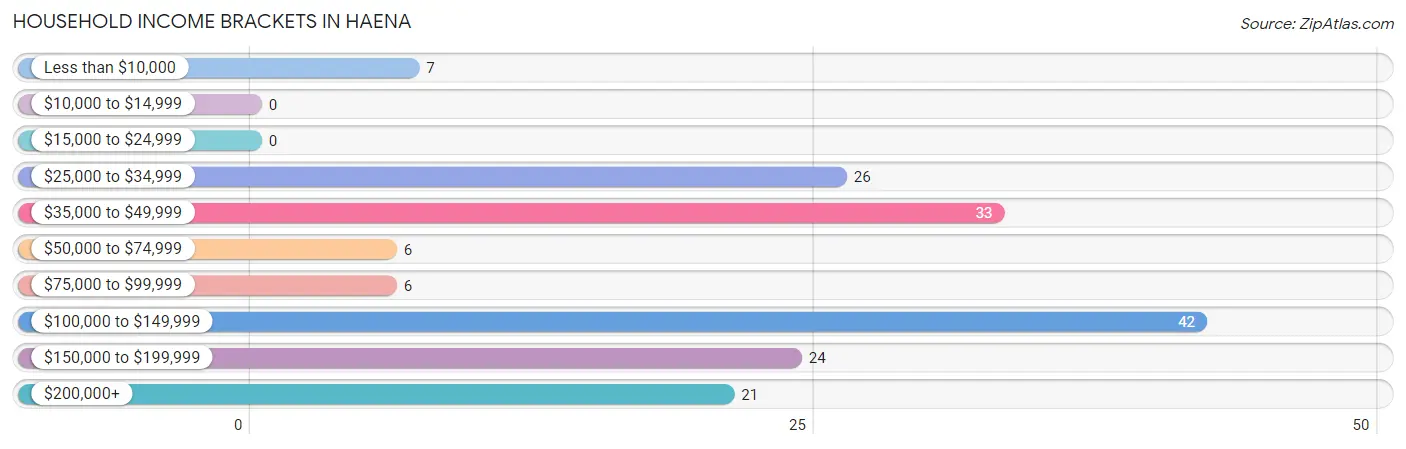
| Income Bracket | # Households | % Households |
| Less than $10,000 | 7 | 4.2% |
| $10,000 to $14,999 | 0 | 0.0% |
| $15,000 to $24,999 | 0 | 0.0% |
| $25,000 to $34,999 | 26 | 15.8% |
| $35,000 to $49,999 | 33 | 20.0% |
| $50,000 to $74,999 | 6 | 3.6% |
| $75,000 to $99,999 | 6 | 3.6% |
| $100,000 to $149,999 | 42 | 25.5% |
| $150,000 to $199,999 | 24 | 14.5% |
| $200,000+ | 21 | 12.7% |
Household Income by Householder Age in Haena
The median household income in Haena is $108,906, with the highest median household income of $112,708 found in the 65+ years age bracket for the primary householder. A total of 59 households (35.8%) fall into this category.
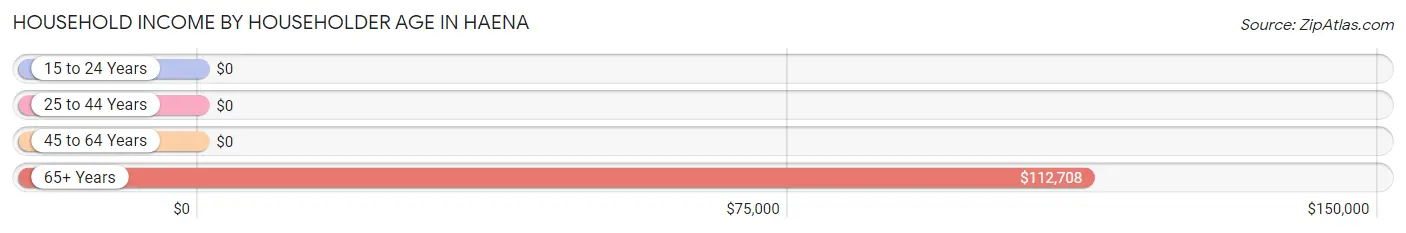
| Income Bracket | # Households | Median Income |
| 15 to 24 Years | 0 (0.0%) | $0 |
| 25 to 44 Years | 30 (18.2%) | $0 |
| 45 to 64 Years | 76 (46.1%) | $0 |
| 65+ Years | 59 (35.8%) | $112,708 |
| Total | 165 (100.0%) | $108,906 |
Poverty in Haena
Income Below Poverty by Sex and Age in Haena
With 20.0% poverty level for males and 16.3% for females among the residents of Haena, 16 and 17 year old males and 65 to 74 year old females are the most vulnerable to poverty, with 14 males (100.0%) and 21 females (60.0%) in their respective age groups living below the poverty level.
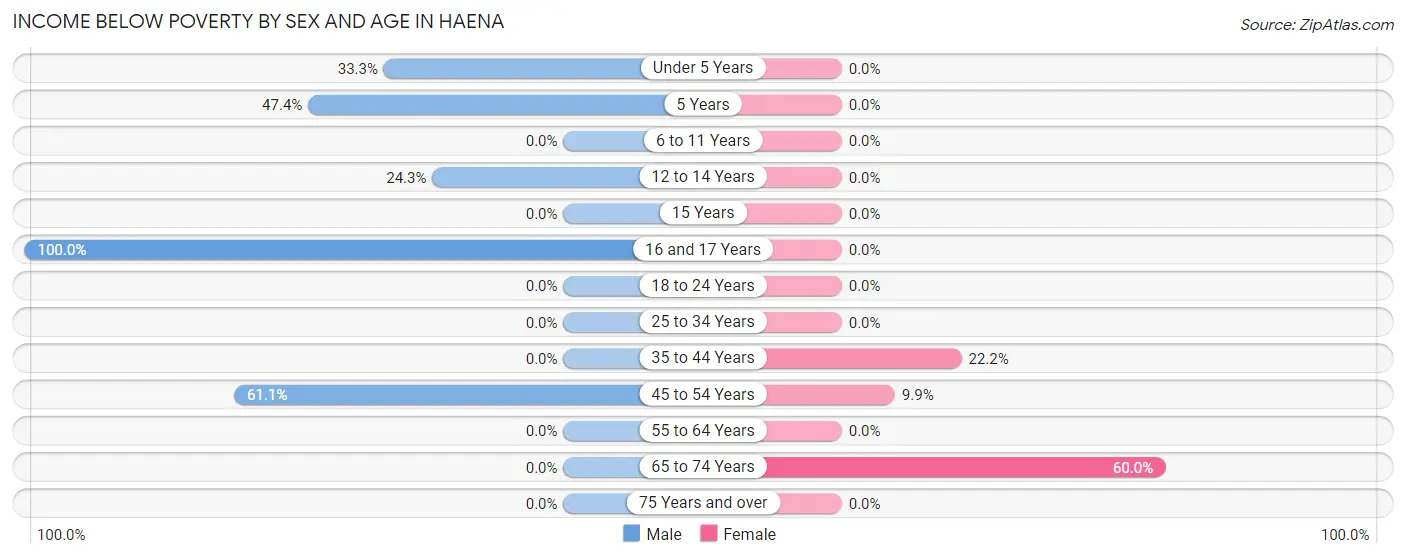
| Age Bracket | Male | Female |
| Under 5 Years | 8 (33.3%) | 0 (0.0%) |
| 5 Years | 9 (47.4%) | 0 (0.0%) |
| 6 to 11 Years | 0 (0.0%) | 0 (0.0%) |
| 12 to 14 Years | 9 (24.3%) | 0 (0.0%) |
| 15 Years | 0 (0.0%) | 0 (0.0%) |
| 16 and 17 Years | 14 (100.0%) | 0 (0.0%) |
| 18 to 24 Years | 0 (0.0%) | 0 (0.0%) |
| 25 to 34 Years | 0 (0.0%) | 0 (0.0%) |
| 35 to 44 Years | 0 (0.0%) | 12 (22.2%) |
| 45 to 54 Years | 11 (61.1%) | 7 (9.9%) |
| 55 to 64 Years | 0 (0.0%) | 0 (0.0%) |
| 65 to 74 Years | 0 (0.0%) | 21 (60.0%) |
| 75 Years and over | 0 (0.0%) | 0 (0.0%) |
| Total | 51 (20.0%) | 40 (16.3%) |
Income Above Poverty by Sex and Age in Haena
According to the poverty statistics in Haena, males aged 6 to 11 years and females aged 6 to 11 years are the age groups that are most secure financially, with 100.0% of males and 100.0% of females in these age groups living above the poverty line.
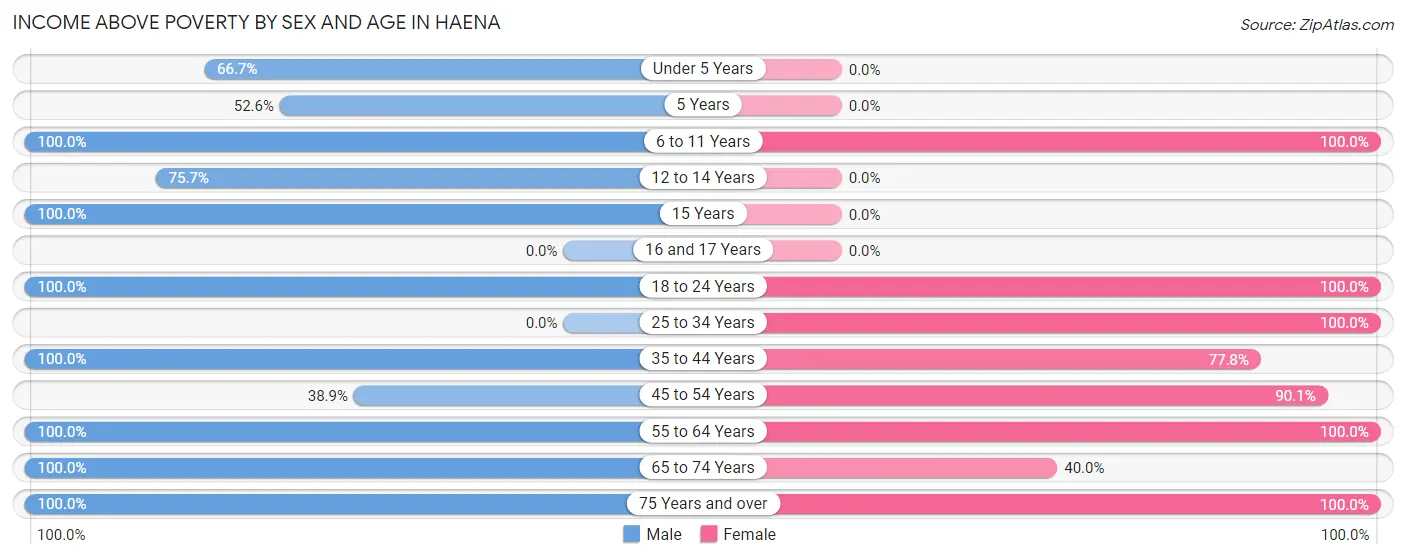
| Age Bracket | Male | Female |
| Under 5 Years | 16 (66.7%) | 0 (0.0%) |
| 5 Years | 10 (52.6%) | 0 (0.0%) |
| 6 to 11 Years | 54 (100.0%) | 14 (100.0%) |
| 12 to 14 Years | 28 (75.7%) | 0 (0.0%) |
| 15 Years | 16 (100.0%) | 0 (0.0%) |
| 16 and 17 Years | 0 (0.0%) | 0 (0.0%) |
| 18 to 24 Years | 3 (100.0%) | 10 (100.0%) |
| 25 to 34 Years | 0 (0.0%) | 12 (100.0%) |
| 35 to 44 Years | 11 (100.0%) | 42 (77.8%) |
| 45 to 54 Years | 7 (38.9%) | 64 (90.1%) |
| 55 to 64 Years | 17 (100.0%) | 19 (100.0%) |
| 65 to 74 Years | 30 (100.0%) | 14 (40.0%) |
| 75 Years and over | 12 (100.0%) | 31 (100.0%) |
| Total | 204 (80.0%) | 206 (83.7%) |
Income Below Poverty Among Married-Couple Families in Haena
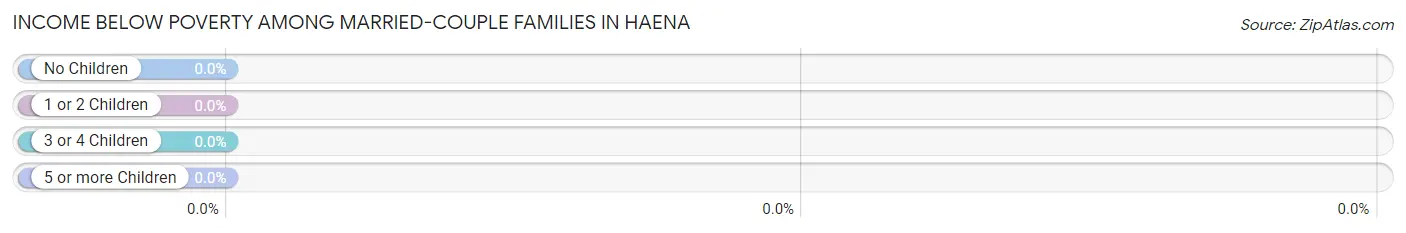
| Children | Above Poverty | Below Poverty |
| No Children | 37 (100.0%) | 0 (0.0%) |
| 1 or 2 Children | 37 (100.0%) | 0 (0.0%) |
| 3 or 4 Children | 0 (0.0%) | 0 (0.0%) |
| 5 or more Children | 0 (0.0%) | 0 (0.0%) |
| Total | 74 (100.0%) | 0 (0.0%) |
Income Below Poverty Among Single-Parent Households in Haena
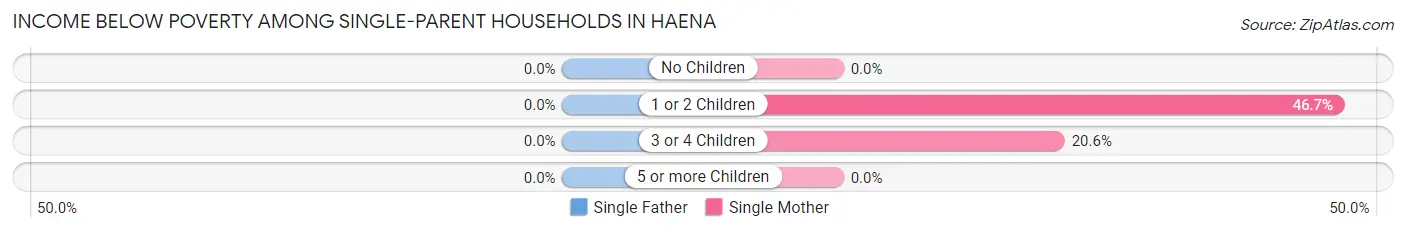
| Children | Single Father | Single Mother |
| No Children | 0 (0.0%) | 0 (0.0%) |
| 1 or 2 Children | 0 (0.0%) | 7 (46.7%) |
| 3 or 4 Children | 0 (0.0%) | 7 (20.6%) |
| 5 or more Children | 0 (0.0%) | 0 (0.0%) |
| Total | 0 (0.0%) | 14 (23.3%) |
Income Below Poverty Among Married-Couple vs Single-Parent Households in Haena
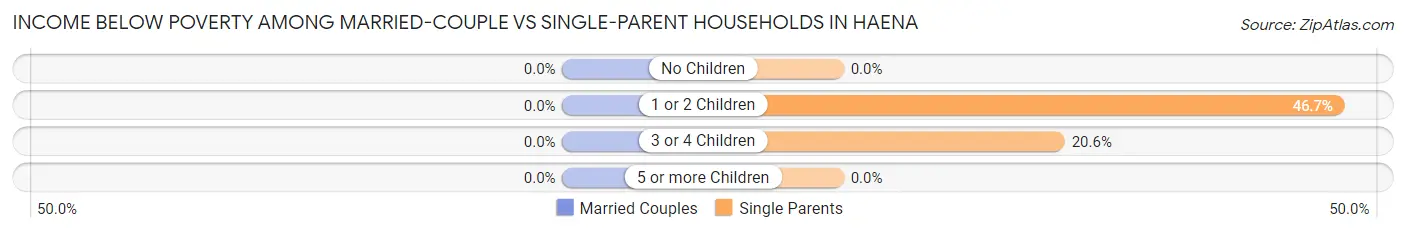
| Children | Married-Couple Families | Single-Parent Households |
| No Children | 0 (0.0%) | 0 (0.0%) |
| 1 or 2 Children | 0 (0.0%) | 7 (46.7%) |
| 3 or 4 Children | 0 (0.0%) | 7 (20.6%) |
| 5 or more Children | 0 (0.0%) | 0 (0.0%) |
| Total | 0 (0.0%) | 14 (21.9%) |
Race in Haena
The most populous races in Haena are White / Caucasian (320 | 63.9%), Two or more Races (171 | 34.1%), and Asian (10 | 2.0%).
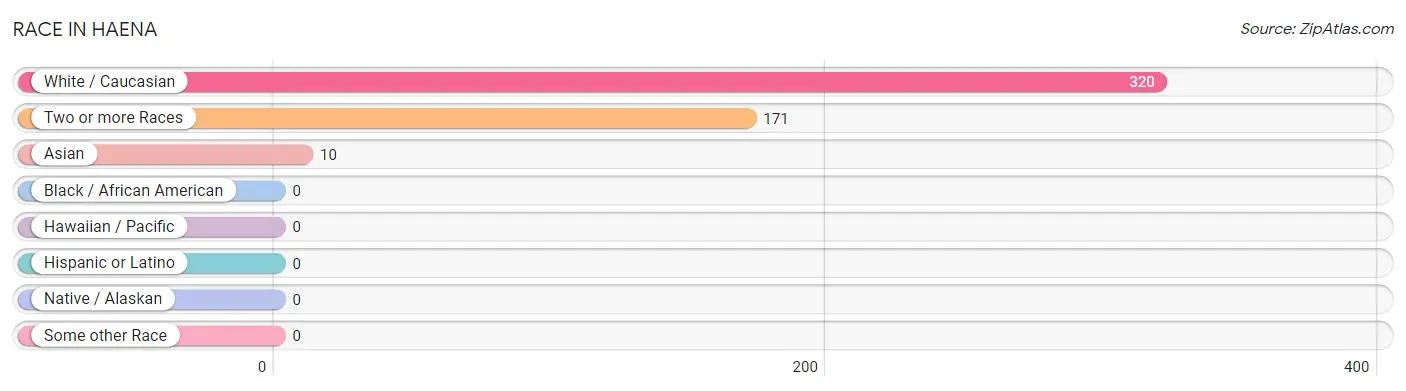
| Race | # Population | % Population |
| Asian | 10 | 2.0% |
| Black / African American | 0 | 0.0% |
| Hawaiian / Pacific | 0 | 0.0% |
| Hispanic or Latino | 0 | 0.0% |
| Native / Alaskan | 0 | 0.0% |
| White / Caucasian | 320 | 63.9% |
| Two or more Races | 171 | 34.1% |
| Some other Race | 0 | 0.0% |
| Total | 501 | 100.0% |
Ancestry in Haena
The most populous ancestries reported in Haena are Native Hawaiian (105 | 21.0%), Sioux (98 | 19.6%), Scottish (77 | 15.4%), English (76 | 15.2%), and Bhutanese (49 | 9.8%), together accounting for 80.8% of all Haena residents.
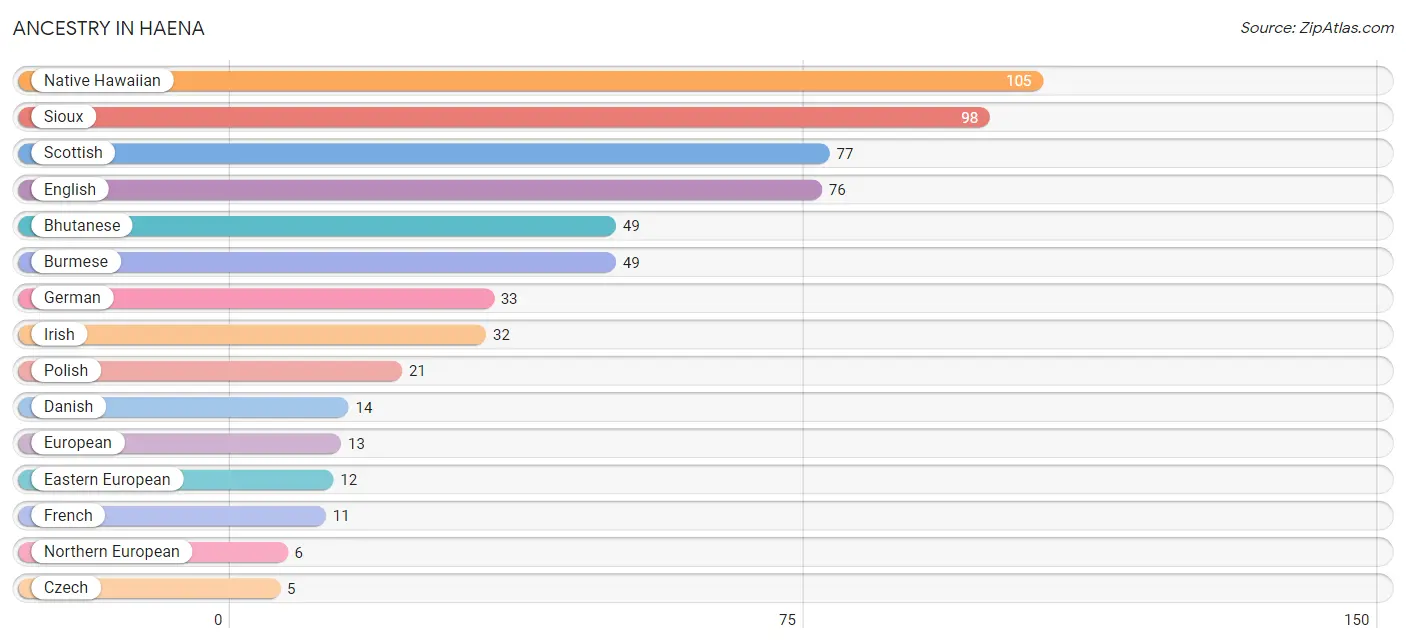
| Ancestry | # Population | % Population |
| Bhutanese | 49 | 9.8% |
| Burmese | 49 | 9.8% |
| Cherokee | 4 | 0.8% |
| Czech | 5 | 1.0% |
| Danish | 14 | 2.8% |
| Eastern European | 12 | 2.4% |
| English | 76 | 15.2% |
| European | 13 | 2.6% |
| French | 11 | 2.2% |
| German | 33 | 6.6% |
| Irish | 32 | 6.4% |
| Native Hawaiian | 105 | 21.0% |
| Northern European | 6 | 1.2% |
| Polish | 21 | 4.2% |
| Scottish | 77 | 15.4% |
| Sioux | 98 | 19.6% |
| Sri Lankan | 2 | 0.4% |
| Welsh | 4 | 0.8% | View All 18 Rows |
Immigrants in Haena
The most numerous immigrant groups reported in Haena came from Europe (21 | 4.2%), Northern Europe (21 | 4.2%), Asia (2 | 0.4%), South Eastern Asia (2 | 0.4%), and Vietnam (2 | 0.4%), together accounting for 9.6% of all Haena residents.
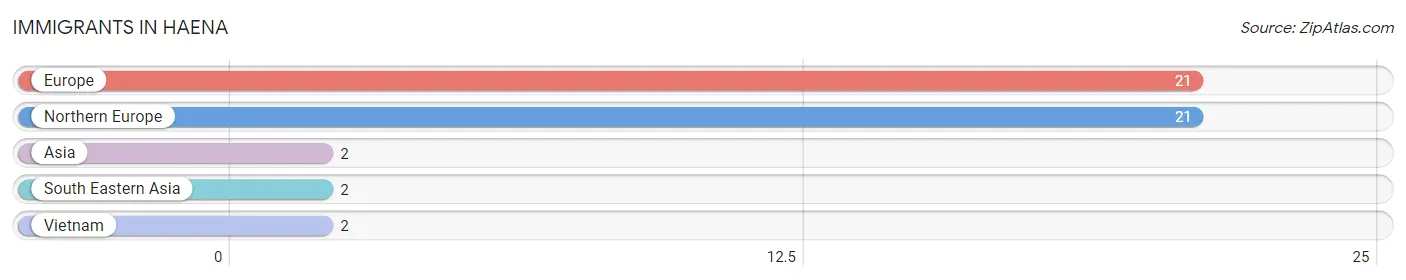
| Immigration Origin | # Population | % Population |
| Asia | 2 | 0.4% |
| Europe | 21 | 4.2% |
| Northern Europe | 21 | 4.2% |
| South Eastern Asia | 2 | 0.4% |
| Vietnam | 2 | 0.4% | View All 5 Rows |
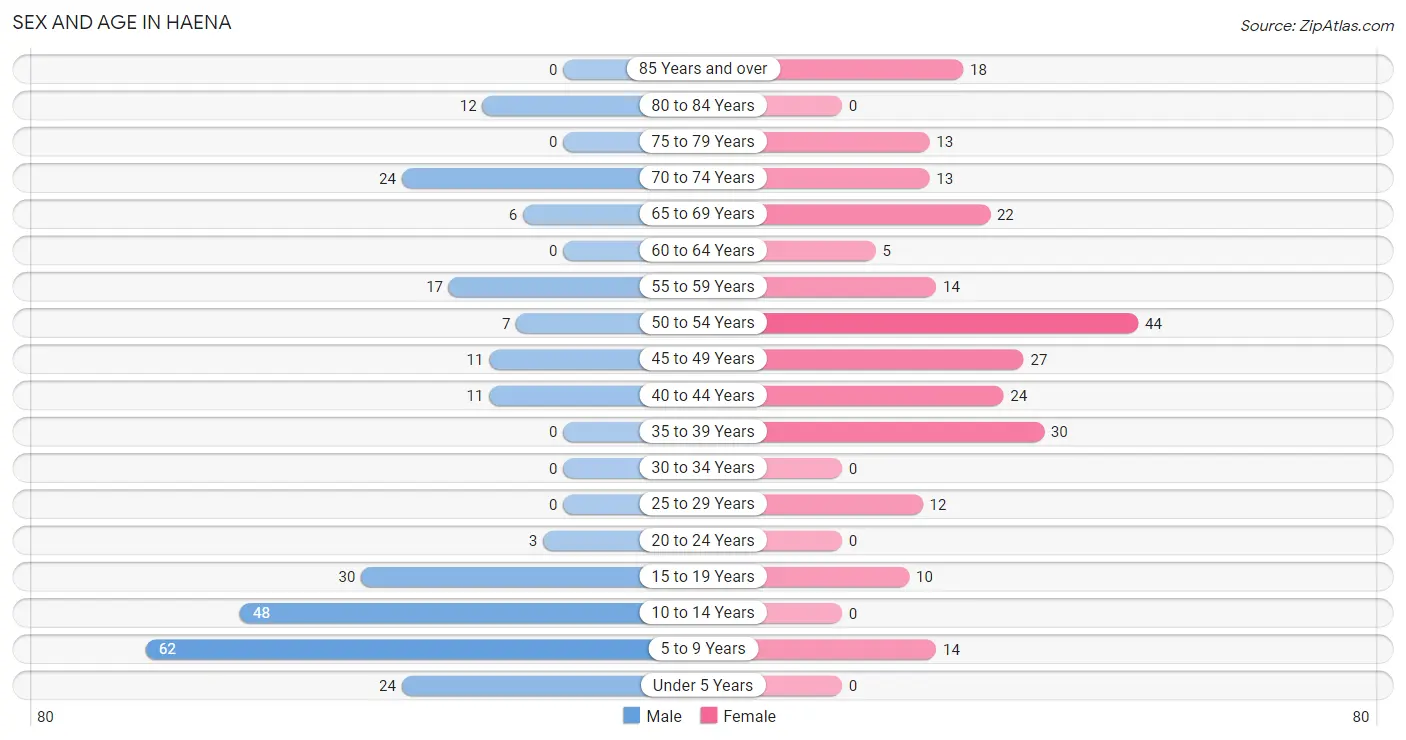
Sex and Age in Haena
Sex and Age in Haena
The most populous age groups in Haena are 5 to 9 Years (62 | 24.3%) for men and 50 to 54 Years (44 | 17.9%) for women.
| Age Bracket | Male | Female |
| Under 5 Years | 24 (9.4%) | 0 (0.0%) |
| 5 to 9 Years | 62 (24.3%) | 14 (5.7%) |
| 10 to 14 Years | 48 (18.8%) | 0 (0.0%) |
| 15 to 19 Years | 30 (11.8%) | 10 (4.1%) |
| 20 to 24 Years | 3 (1.2%) | 0 (0.0%) |
| 25 to 29 Years | 0 (0.0%) | 12 (4.9%) |
| 30 to 34 Years | 0 (0.0%) | 0 (0.0%) |
| 35 to 39 Years | 0 (0.0%) | 30 (12.2%) |
| 40 to 44 Years | 11 (4.3%) | 24 (9.8%) |
| 45 to 49 Years | 11 (4.3%) | 27 (11.0%) |
| 50 to 54 Years | 7 (2.8%) | 44 (17.9%) |
| 55 to 59 Years | 17 (6.7%) | 14 (5.7%) |
| 60 to 64 Years | 0 (0.0%) | 5 (2.0%) |
| 65 to 69 Years | 6 (2.4%) | 22 (8.9%) |
| 70 to 74 Years | 24 (9.4%) | 13 (5.3%) |
| 75 to 79 Years | 0 (0.0%) | 13 (5.3%) |
| 80 to 84 Years | 12 (4.7%) | 0 (0.0%) |
| 85 Years and over | 0 (0.0%) | 18 (7.3%) |
| Total | 255 (100.0%) | 246 (100.0%) |
Families and Households in Haena
Median Family Size in Haena
The median family size in Haena is 3.22 persons per family, with single female/mother families (60 | 43.5%) accounting for the largest median family size of 4.15 persons per family. On the other hand, single male/father families (4 | 2.9%) represent the smallest median family size with 1.75 persons per family.
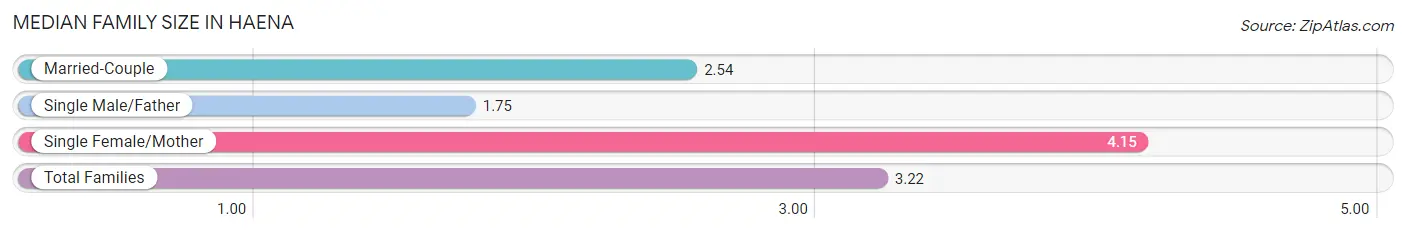
| Family Type | # Families | Family Size |
| Married-Couple | 74 (53.6%) | 2.54 |
| Single Male/Father | 4 (2.9%) | 1.75 |
| Single Female/Mother | 60 (43.5%) | 4.15 |
| Total Families | 138 (100.0%) | 3.22 |
Median Household Size in Haena
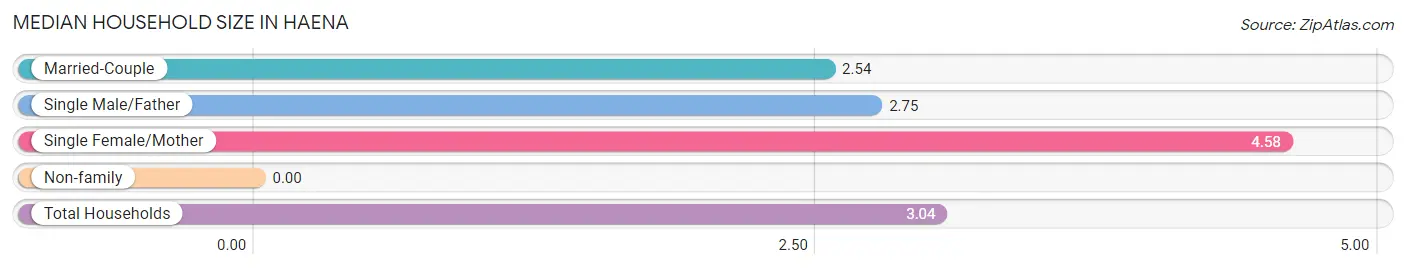
| Household Type | # Households | Household Size |
| Married-Couple | 74 (44.9%) | 2.54 |
| Single Male/Father | 4 (2.4%) | 2.75 |
| Single Female/Mother | 60 (36.4%) | 4.58 |
| Non-family | 27 (16.4%) | - |
| Total Households | 165 (100.0%) | 3.04 |
Household Size by Marriage Status in Haena
Out of a total of 165 households in Haena, 138 (83.6%) are family households, while 27 (16.4%) are nonfamily households. The most numerous type of family households are 4-person households, comprising 57, and the most common type of nonfamily households are 1-person households, comprising 27.
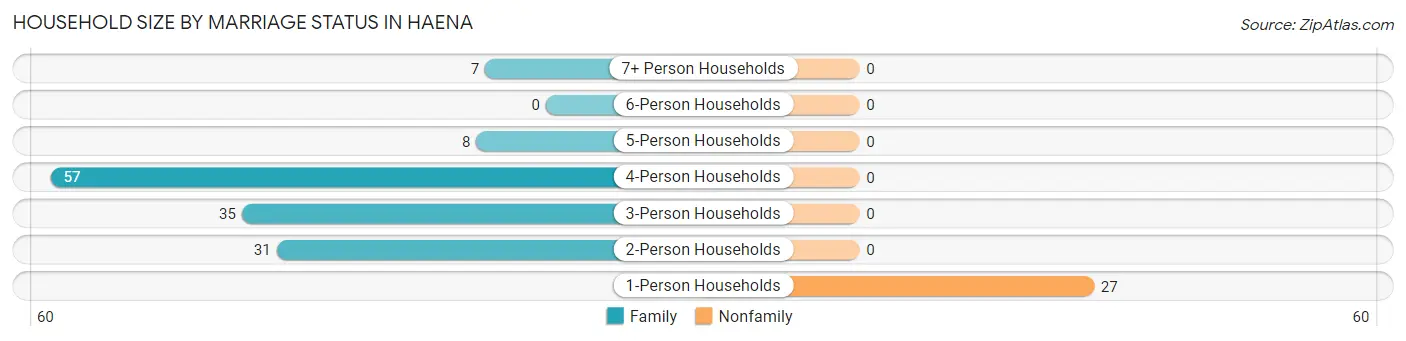
| Household Size | Family Households | Nonfamily Households |
| 1-Person Households | - | 27 (16.4%) |
| 2-Person Households | 31 (18.8%) | 0 (0.0%) |
| 3-Person Households | 35 (21.2%) | 0 (0.0%) |
| 4-Person Households | 57 (34.5%) | 0 (0.0%) |
| 5-Person Households | 8 (4.9%) | 0 (0.0%) |
| 6-Person Households | 0 (0.0%) | 0 (0.0%) |
| 7+ Person Households | 7 (4.2%) | 0 (0.0%) |
| Total | 138 (83.6%) | 27 (16.4%) |
Female Fertility in Haena
Fertility by Age in Haena
Average fertility rate in Haena is 81.0 births per 1,000 women. Women in the age bracket of 35 to 50 years have the highest fertility rate with 101.0 births per 1,000 women. Women in the age bracket of 35 to 50 years acount for 100.0% of all women with births.
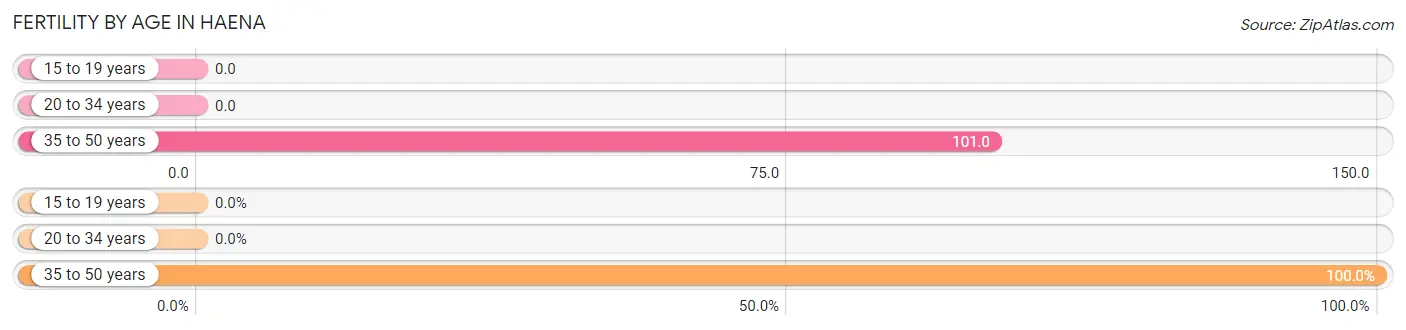
| Age Bracket | Women with Births | Births / 1,000 Women |
| 15 to 19 years | 0 (0.0%) | 0.0 |
| 20 to 34 years | 0 (0.0%) | 0.0 |
| 35 to 50 years | 9 (100.0%) | 101.0 |
| Total | 9 (100.0%) | 81.0 |
Fertility by Age by Marriage Status in Haena
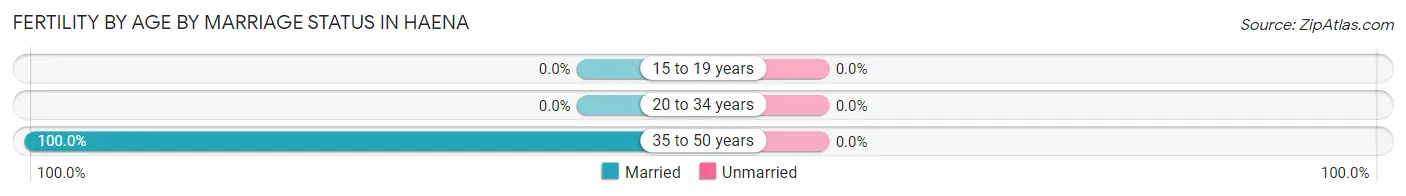
| Age Bracket | Married | Unmarried |
| 15 to 19 years | 0 (0.0%) | 0 (0.0%) |
| 20 to 34 years | 0 (0.0%) | 0 (0.0%) |
| 35 to 50 years | 9 (100.0%) | 0 (0.0%) |
| Total | 9 (100.0%) | 0 (0.0%) |
Fertility by Education in Haena
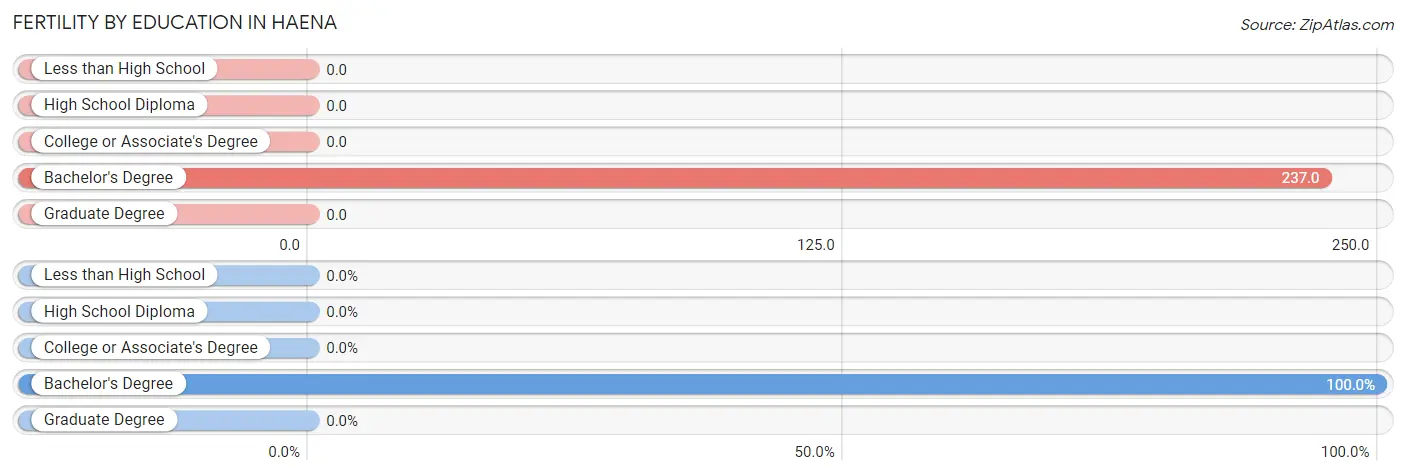
| Educational Attainment | Women with Births | Births / 1,000 Women |
| Less than High School | 0 (0.0%) | 0.0 |
| High School Diploma | 0 (0.0%) | 0.0 |
| College or Associate's Degree | 0 (0.0%) | 0.0 |
| Bachelor's Degree | 9 (100.0%) | 237.0 |
| Graduate Degree | 0 (0.0%) | 0.0 |
| Total | 9 (100.0%) | 81.0 |
Fertility by Education by Marriage Status in Haena
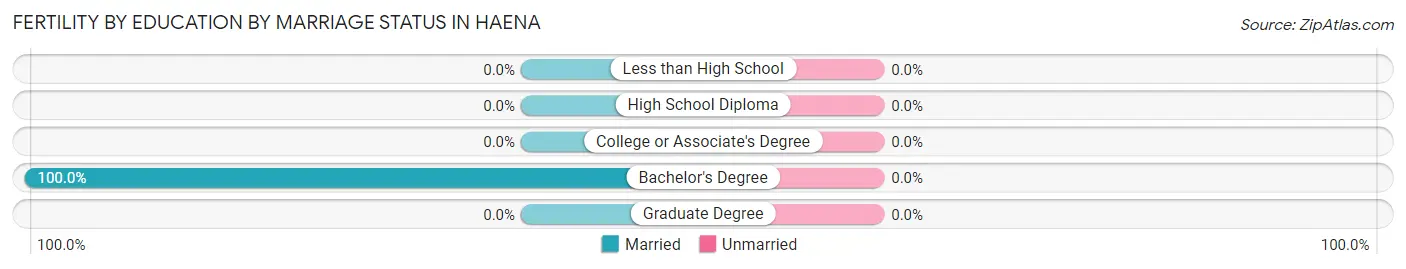
| Educational Attainment | Married | Unmarried |
| Less than High School | 0 (0.0%) | 0 (0.0%) |
| High School Diploma | 0 (0.0%) | 0 (0.0%) |
| College or Associate's Degree | 0 (0.0%) | 0 (0.0%) |
| Bachelor's Degree | 9 (100.0%) | 0 (0.0%) |
| Graduate Degree | 0 (0.0%) | 0 (0.0%) |
| Total | 9 (100.0%) | 0 (0.0%) |
Employment Characteristics in Haena
Employment by Class of Employer in Haena
Among the 153 employed individuals in Haena, private company employees (67 | 43.8%), self-employed (not incorporated) (67 | 43.8%), and self-employed (incorporated) (13 | 8.5%) make up the most common classes of employment.
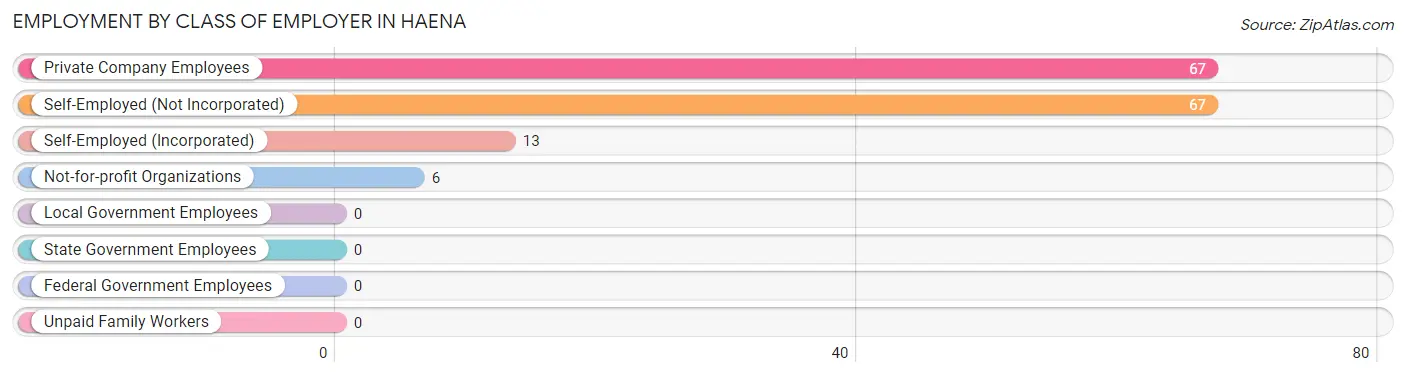
| Employer Class | # Employees | % Employees |
| Private Company Employees | 67 | 43.8% |
| Self-Employed (Incorporated) | 13 | 8.5% |
| Self-Employed (Not Incorporated) | 67 | 43.8% |
| Not-for-profit Organizations | 6 | 3.9% |
| Local Government Employees | 0 | 0.0% |
| State Government Employees | 0 | 0.0% |
| Federal Government Employees | 0 | 0.0% |
| Unpaid Family Workers | 0 | 0.0% |
| Total | 153 | 100.0% |
Employment Status by Age in Haena
According to the labor force statistics for Haena, out of the total population over 16 years of age (337), 52.2% or 176 individuals are in the labor force, with 6.3% or 11 of them unemployed. The age group with the highest labor force participation rate is 20 to 24 years, with 100.0% or 3 individuals in the labor force. Within the labor force, the 45 to 54 years age range has the highest percentage of unemployed individuals, with 13.4% or 11 of them being unemployed.
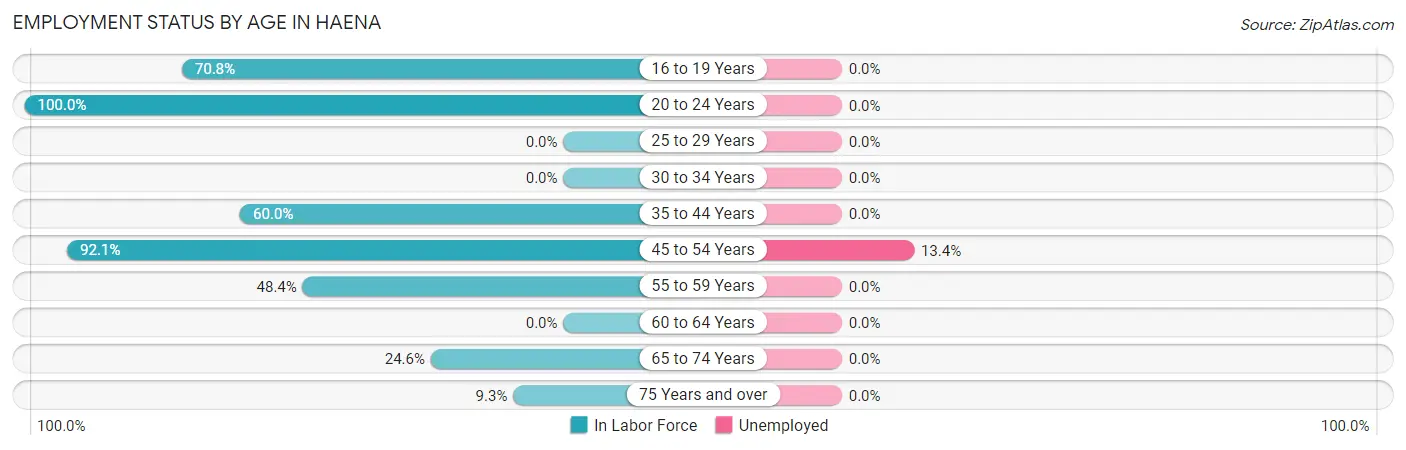
| Age Bracket | In Labor Force | Unemployed |
| 16 to 19 Years | 17 (70.8%) | 0 (0.0%) |
| 20 to 24 Years | 3 (100.0%) | 0 (0.0%) |
| 25 to 29 Years | 0 (0.0%) | 0 (0.0%) |
| 30 to 34 Years | 0 (0.0%) | 0 (0.0%) |
| 35 to 44 Years | 39 (60.0%) | 0 (0.0%) |
| 45 to 54 Years | 82 (92.1%) | 11 (13.4%) |
| 55 to 59 Years | 15 (48.4%) | 0 (0.0%) |
| 60 to 64 Years | 0 (0.0%) | 0 (0.0%) |
| 65 to 74 Years | 16 (24.6%) | 0 (0.0%) |
| 75 Years and over | 4 (9.3%) | 0 (0.0%) |
| Total | 176 (52.2%) | 11 (6.3%) |
Employment Status by Educational Attainment in Haena
According to labor force statistics for Haena, 67.3% of individuals (136) out of the total population between 25 and 64 years of age (202) are in the labor force, with 8.1% or 11 of them being unemployed. The group with the highest labor force participation rate are those with the educational attainment of high school diploma, with 100.0% or 38 individuals in the labor force. Within the labor force, individuals with high school diploma education have the highest percentage of unemployment, with 28.9% or 11 of them being unemployed.
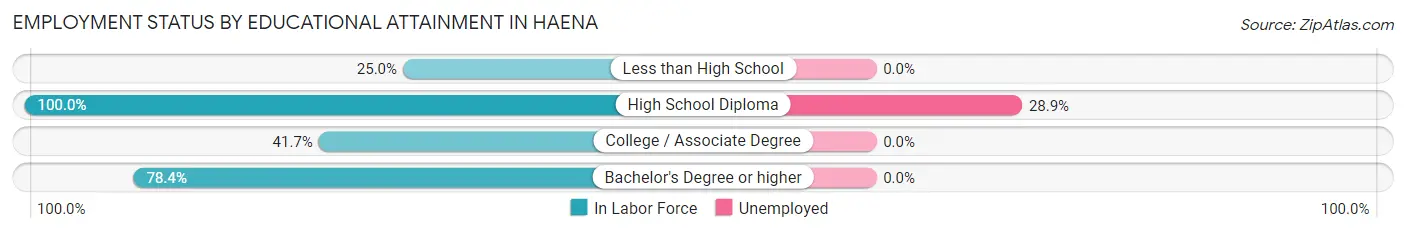
| Educational Attainment | In Labor Force | Unemployed |
| Less than High School | 4 (25.0%) | 0 (0.0%) |
| High School Diploma | 38 (100.0%) | 11 (28.9%) |
| College / Associate Degree | 25 (41.7%) | 0 (0.0%) |
| Bachelor's Degree or higher | 69 (78.4%) | 0 (0.0%) |
| Total | 136 (67.3%) | 16 (8.1%) |
Employment Occupations by Sex in Haena
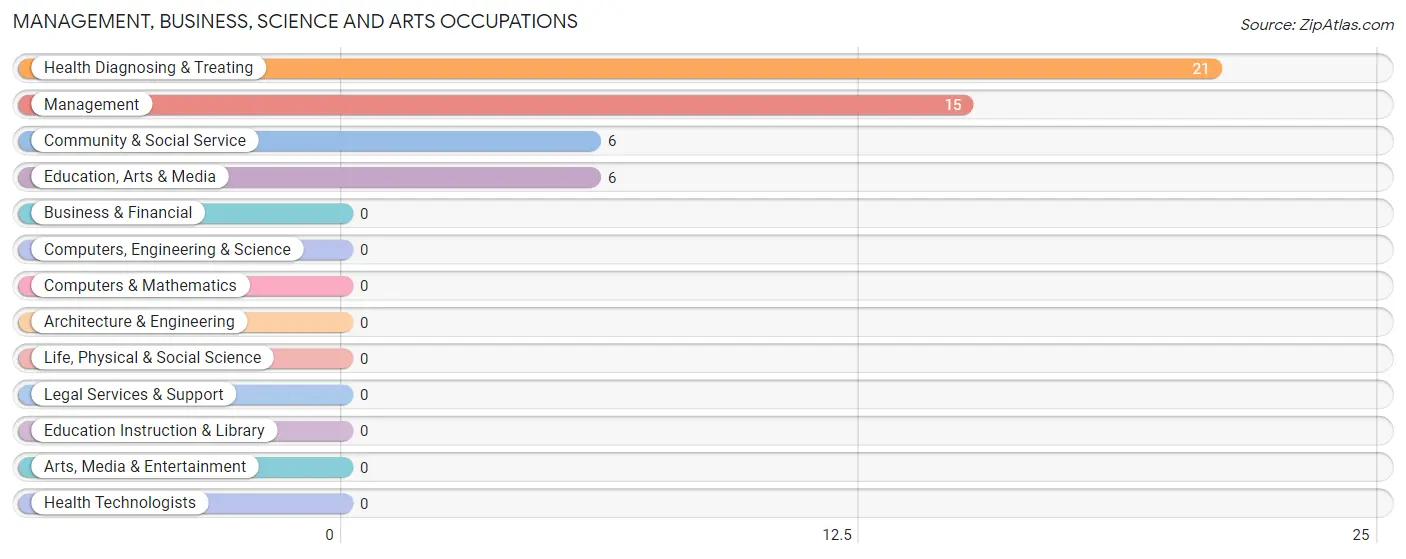
Management, Business, Science and Arts Occupations
The most common Management, Business, Science and Arts occupations in Haena are Health Diagnosing & Treating (21 | 12.7%), Management (15 | 9.1%), Community & Social Service (6 | 3.6%), and Education, Arts & Media (6 | 3.6%).
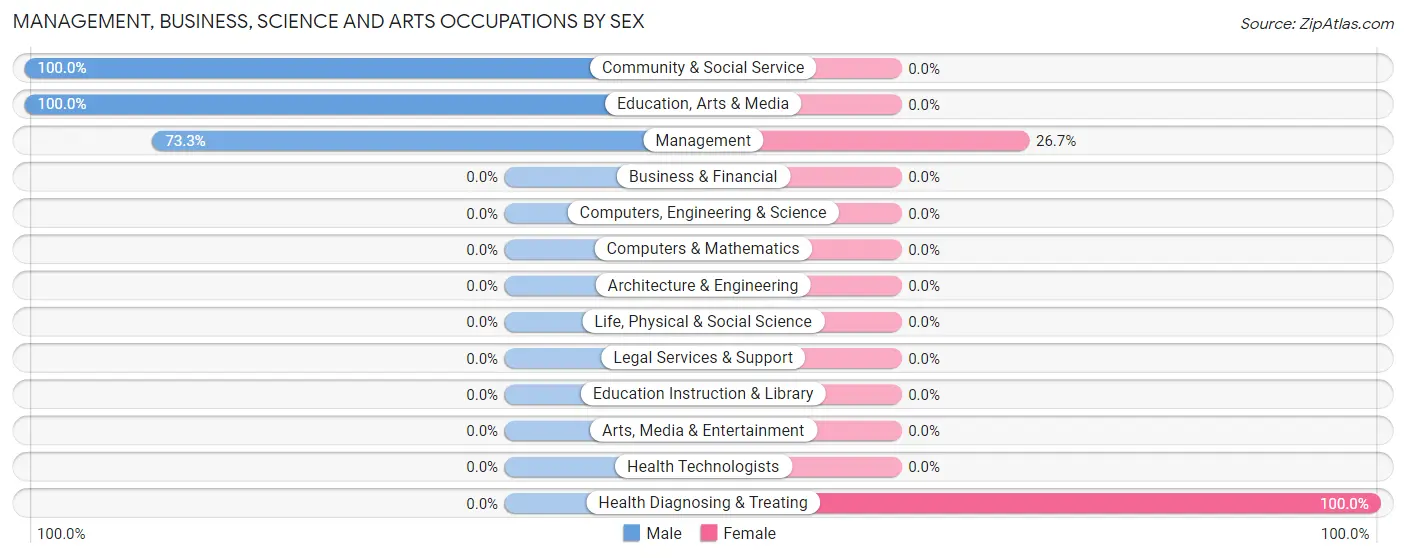
Management, Business, Science and Arts Occupations by Sex
Within the Management, Business, Science and Arts occupations in Haena, the most male-oriented occupations are Community & Social Service (100.0%), Education, Arts & Media (100.0%), and Management (73.3%), while the most female-oriented occupations are Health Diagnosing & Treating (100.0%), and Management (26.7%).
| Occupation | Male | Female |
| Management | 11 (73.3%) | 4 (26.7%) |
| Business & Financial | 0 (0.0%) | 0 (0.0%) |
| Computers, Engineering & Science | 0 (0.0%) | 0 (0.0%) |
| Computers & Mathematics | 0 (0.0%) | 0 (0.0%) |
| Architecture & Engineering | 0 (0.0%) | 0 (0.0%) |
| Life, Physical & Social Science | 0 (0.0%) | 0 (0.0%) |
| Community & Social Service | 6 (100.0%) | 0 (0.0%) |
| Education, Arts & Media | 6 (100.0%) | 0 (0.0%) |
| Legal Services & Support | 0 (0.0%) | 0 (0.0%) |
| Education Instruction & Library | 0 (0.0%) | 0 (0.0%) |
| Arts, Media & Entertainment | 0 (0.0%) | 0 (0.0%) |
| Health Diagnosing & Treating | 0 (0.0%) | 21 (100.0%) |
| Health Technologists | 0 (0.0%) | 0 (0.0%) |
| Total (Category) | 17 (40.5%) | 25 (59.5%) |
| Total (Overall) | 44 (26.7%) | 121 (73.3%) |
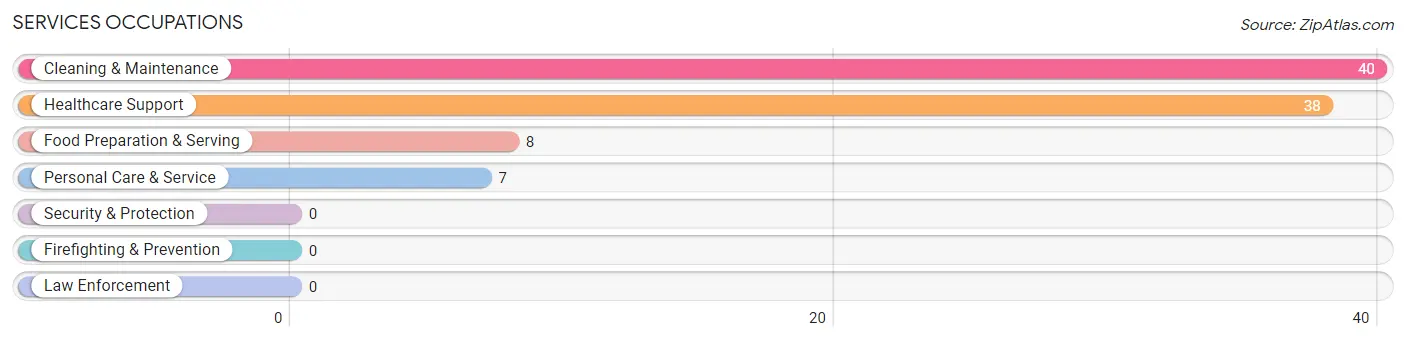
Services Occupations
The most common Services occupations in Haena are Cleaning & Maintenance (40 | 24.2%), Healthcare Support (38 | 23.0%), Food Preparation & Serving (8 | 4.9%), and Personal Care & Service (7 | 4.2%).
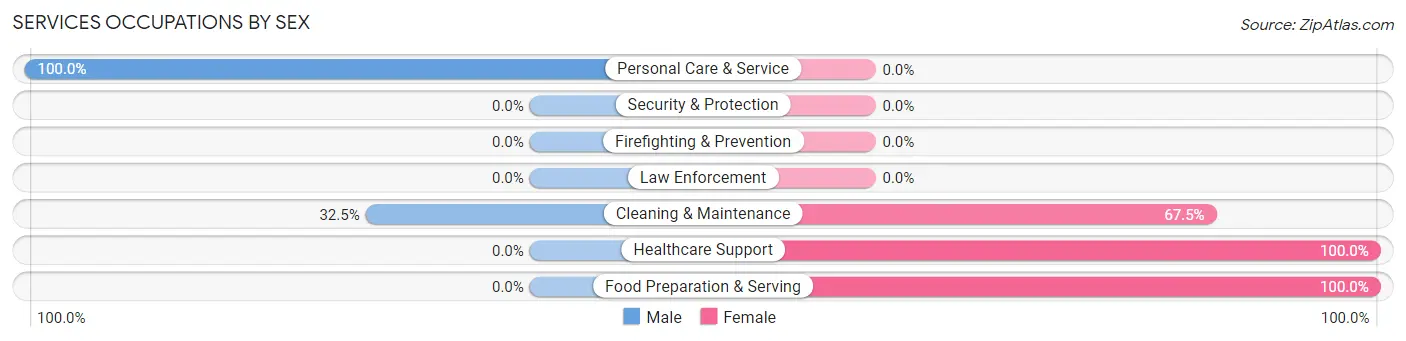
Services Occupations by Sex
Within the Services occupations in Haena, the most male-oriented occupations are Personal Care & Service (100.0%), and Cleaning & Maintenance (32.5%), while the most female-oriented occupations are Healthcare Support (100.0%), Food Preparation & Serving (100.0%), and Cleaning & Maintenance (67.5%).
| Occupation | Male | Female |
| Healthcare Support | 0 (0.0%) | 38 (100.0%) |
| Security & Protection | 0 (0.0%) | 0 (0.0%) |
| Firefighting & Prevention | 0 (0.0%) | 0 (0.0%) |
| Law Enforcement | 0 (0.0%) | 0 (0.0%) |
| Food Preparation & Serving | 0 (0.0%) | 8 (100.0%) |
| Cleaning & Maintenance | 13 (32.5%) | 27 (67.5%) |
| Personal Care & Service | 7 (100.0%) | 0 (0.0%) |
| Total (Category) | 20 (21.5%) | 73 (78.5%) |
| Total (Overall) | 44 (26.7%) | 121 (73.3%) |
Sales and Office Occupations
The most common Sales and Office occupations in Haena are Sales & Related (13 | 7.9%), and Office & Administration (13 | 7.9%).
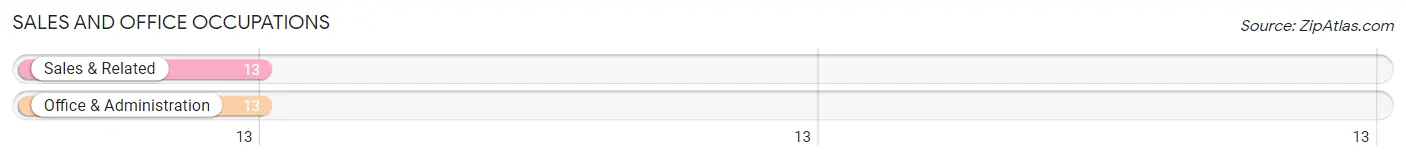
Sales and Office Occupations by Sex
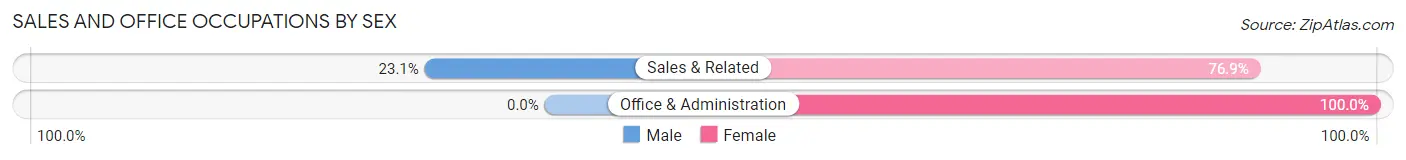
| Occupation | Male | Female |
| Sales & Related | 3 (23.1%) | 10 (76.9%) |
| Office & Administration | 0 (0.0%) | 13 (100.0%) |
| Total (Category) | 3 (11.5%) | 23 (88.5%) |
| Total (Overall) | 44 (26.7%) | 121 (73.3%) |
Natural Resources, Construction and Maintenance Occupations
The most common Natural Resources, Construction and Maintenance occupations in Haena are , and Construction & Extraction (4 | 2.4%).
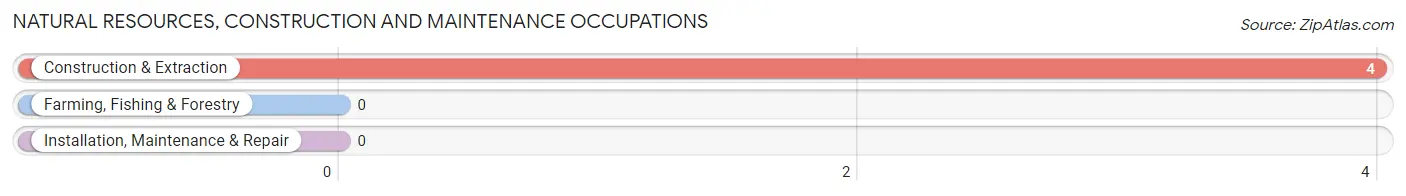
Natural Resources, Construction and Maintenance Occupations by Sex
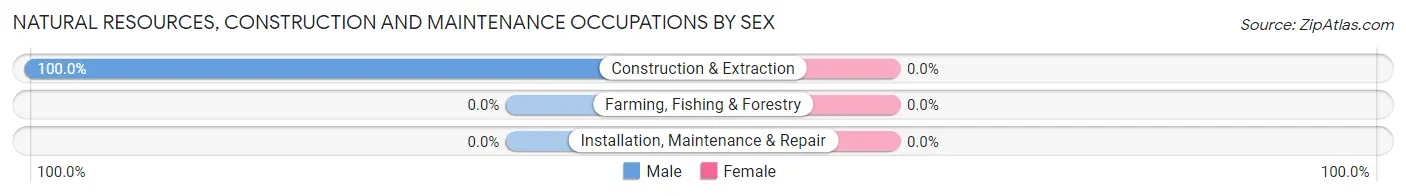
| Occupation | Male | Female |
| Farming, Fishing & Forestry | 0 (0.0%) | 0 (0.0%) |
| Construction & Extraction | 4 (100.0%) | 0 (0.0%) |
| Installation, Maintenance & Repair | 0 (0.0%) | 0 (0.0%) |
| Total (Category) | 4 (100.0%) | 0 (0.0%) |
| Total (Overall) | 44 (26.7%) | 121 (73.3%) |
Production, Transportation and Moving Occupations
Production, Transportation and Moving Occupations by Sex
| Occupation | Male | Female |
| Production | 0 (0.0%) | 0 (0.0%) |
| Transportation | 0 (0.0%) | 0 (0.0%) |
| Material Moving | 0 (0.0%) | 0 (0.0%) |
| Total (Category) | 0 (0.0%) | 0 (0.0%) |
| Total (Overall) | 44 (26.7%) | 121 (73.3%) |
Employment Industries by Sex in Haena
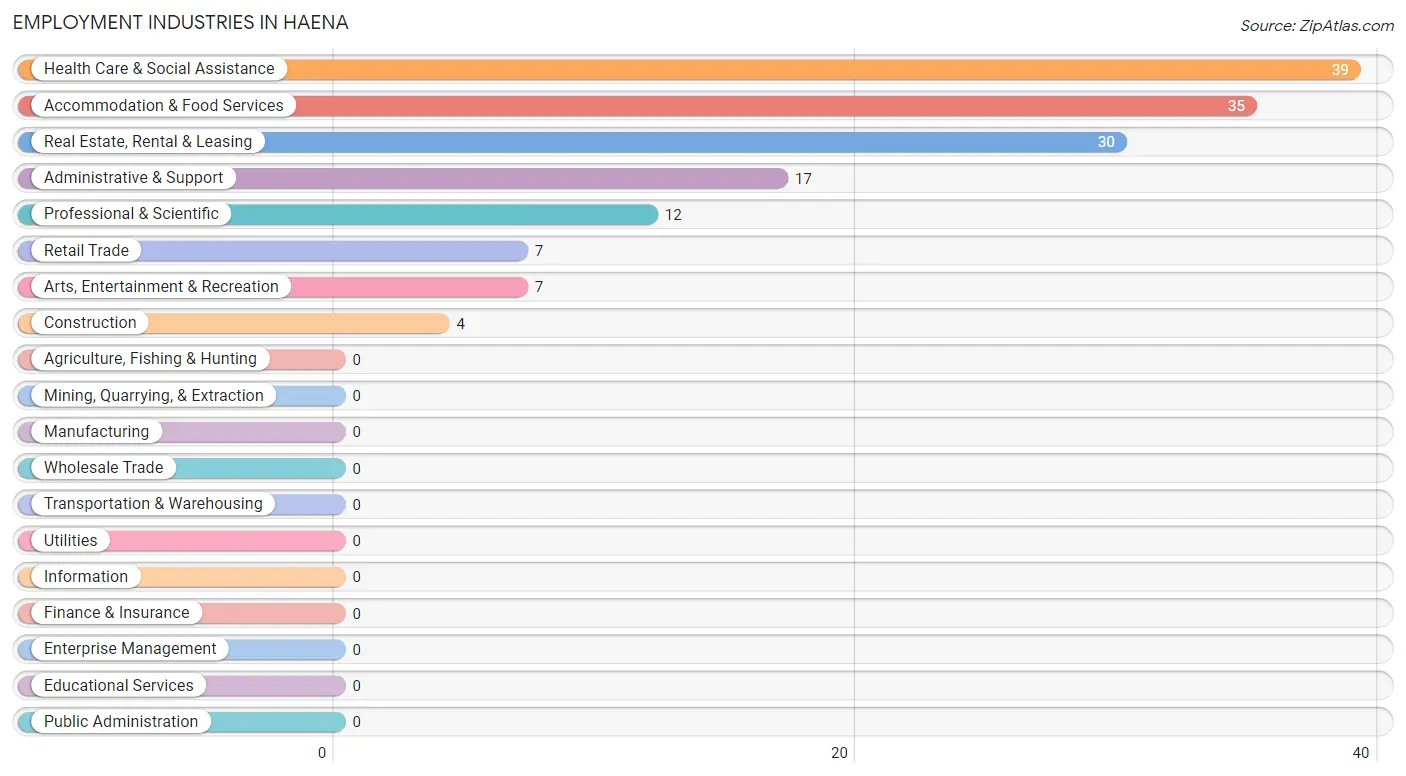
Employment Industries in Haena
The major employment industries in Haena include Health Care & Social Assistance (39 | 23.6%), Accommodation & Food Services (35 | 21.2%), Real Estate, Rental & Leasing (30 | 18.2%), Administrative & Support (17 | 10.3%), and Professional & Scientific (12 | 7.3%).
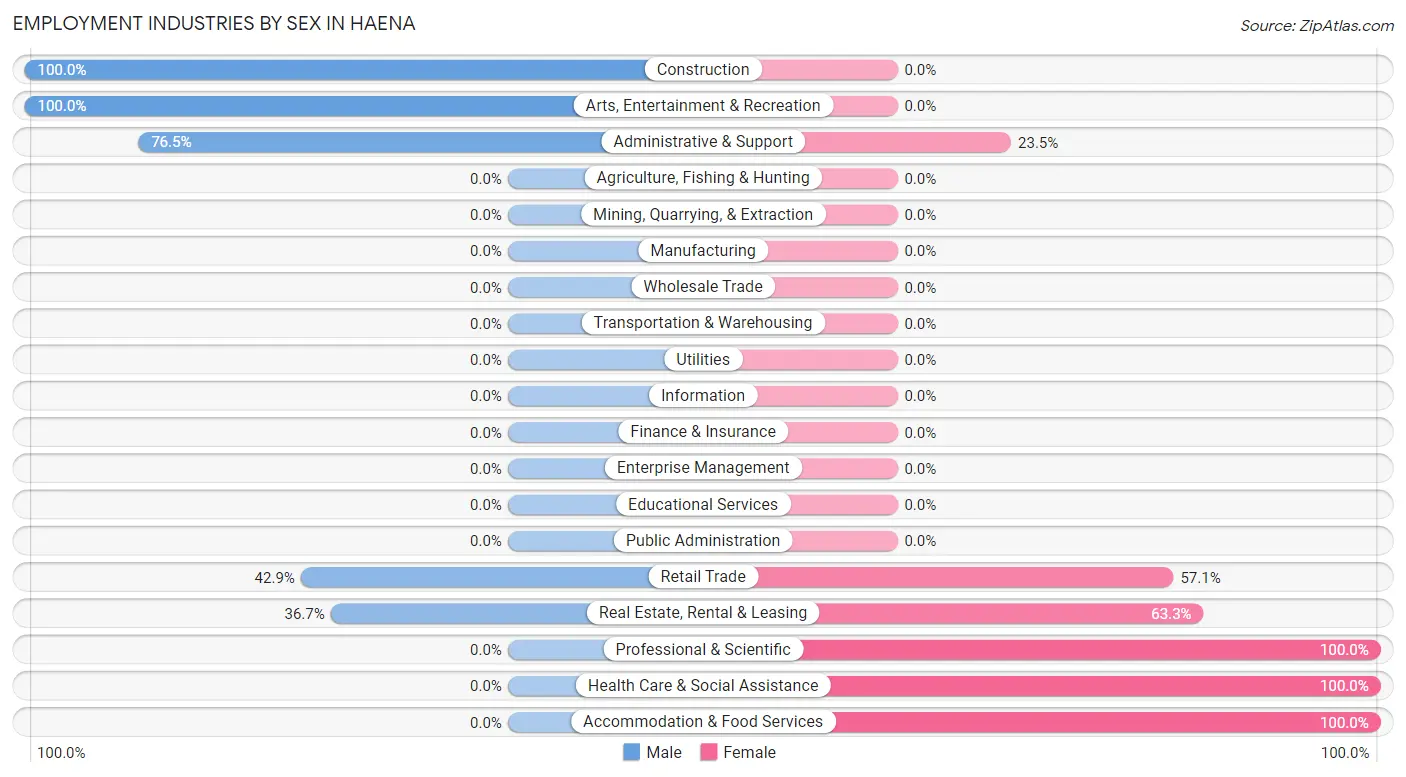
Employment Industries by Sex in Haena
The Haena industries that see more men than women are Construction (100.0%), Arts, Entertainment & Recreation (100.0%), and Administrative & Support (76.5%), whereas the industries that tend to have a higher number of women are Professional & Scientific (100.0%), Health Care & Social Assistance (100.0%), and Accommodation & Food Services (100.0%).
| Industry | Male | Female |
| Agriculture, Fishing & Hunting | 0 (0.0%) | 0 (0.0%) |
| Mining, Quarrying, & Extraction | 0 (0.0%) | 0 (0.0%) |
| Construction | 4 (100.0%) | 0 (0.0%) |
| Manufacturing | 0 (0.0%) | 0 (0.0%) |
| Wholesale Trade | 0 (0.0%) | 0 (0.0%) |
| Retail Trade | 3 (42.9%) | 4 (57.1%) |
| Transportation & Warehousing | 0 (0.0%) | 0 (0.0%) |
| Utilities | 0 (0.0%) | 0 (0.0%) |
| Information | 0 (0.0%) | 0 (0.0%) |
| Finance & Insurance | 0 (0.0%) | 0 (0.0%) |
| Real Estate, Rental & Leasing | 11 (36.7%) | 19 (63.3%) |
| Professional & Scientific | 0 (0.0%) | 12 (100.0%) |
| Enterprise Management | 0 (0.0%) | 0 (0.0%) |
| Administrative & Support | 13 (76.5%) | 4 (23.5%) |
| Educational Services | 0 (0.0%) | 0 (0.0%) |
| Health Care & Social Assistance | 0 (0.0%) | 39 (100.0%) |
| Arts, Entertainment & Recreation | 7 (100.0%) | 0 (0.0%) |
| Accommodation & Food Services | 0 (0.0%) | 35 (100.0%) |
| Public Administration | 0 (0.0%) | 0 (0.0%) |
| Total | 44 (26.7%) | 121 (73.3%) |
Education in Haena
School Enrollment in Haena
The most common levels of schooling among the 200 students in Haena are high school (61 | 30.5%), kindergarten (47 | 23.5%), and elementary school (40 | 20.0%).
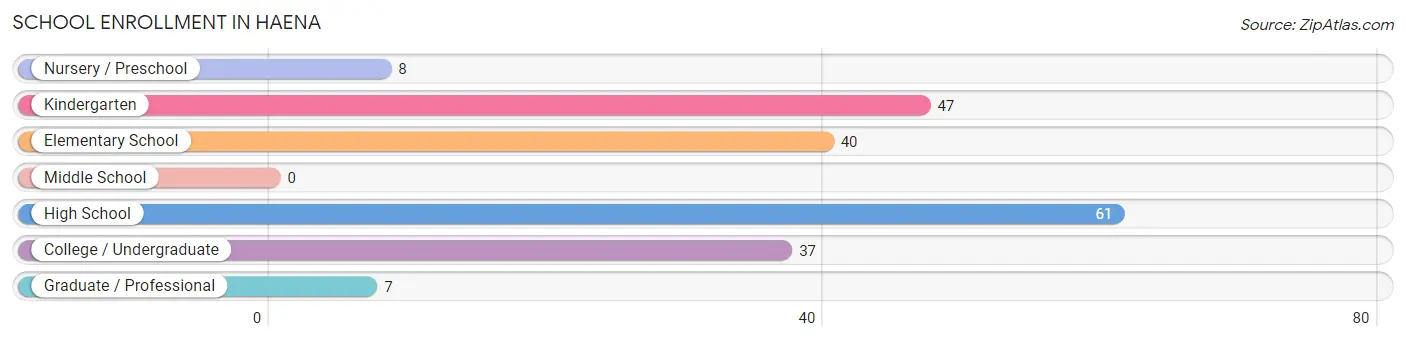
| School Level | # Students | % Students |
| Nursery / Preschool | 8 | 4.0% |
| Kindergarten | 47 | 23.5% |
| Elementary School | 40 | 20.0% |
| Middle School | 0 | 0.0% |
| High School | 61 | 30.5% |
| College / Undergraduate | 37 | 18.5% |
| Graduate / Professional | 7 | 3.5% |
| Total | 200 | 100.0% |
School Enrollment by Age by Funding Source in Haena
Out of a total of 200 students who are enrolled in schools in Haena, 50 (25.0%) attend a private institution, while the remaining 150 (75.0%) are enrolled in public schools. The age group of 10 to 14 year olds has the highest likelihood of being enrolled in private schools, with 28 (71.8% in the age bracket) enrolled. Conversely, the age group of 3 to 4 year olds has the lowest likelihood of being enrolled in a private school, with 8 (100.0% in the age bracket) attending a public institution.
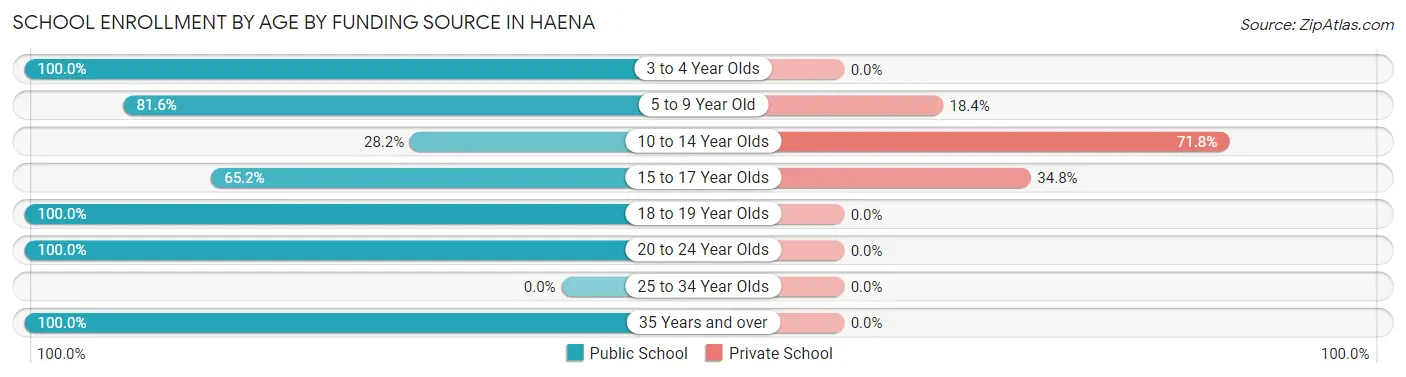
| Age Bracket | Public School | Private School |
| 3 to 4 Year Olds | 8 (100.0%) | 0 (0.0%) |
| 5 to 9 Year Old | 62 (81.6%) | 14 (18.4%) |
| 10 to 14 Year Olds | 11 (28.2%) | 28 (71.8%) |
| 15 to 17 Year Olds | 15 (65.2%) | 8 (34.8%) |
| 18 to 19 Year Olds | 10 (100.0%) | 0 (0.0%) |
| 20 to 24 Year Olds | 3 (100.0%) | 0 (0.0%) |
| 25 to 34 Year Olds | 0 (0.0%) | 0 (0.0%) |
| 35 Years and over | 41 (100.0%) | 0 (0.0%) |
| Total | 150 (75.0%) | 50 (25.0%) |
Educational Attainment by Field of Study in Haena
Communications (26 | 21.0%), social sciences (21 | 16.9%), visual & performing arts (21 | 16.9%), business (20 | 16.1%), and liberal arts & history (9 | 7.3%) are the most common fields of study among 124 individuals in Haena who have obtained a bachelor's degree or higher.
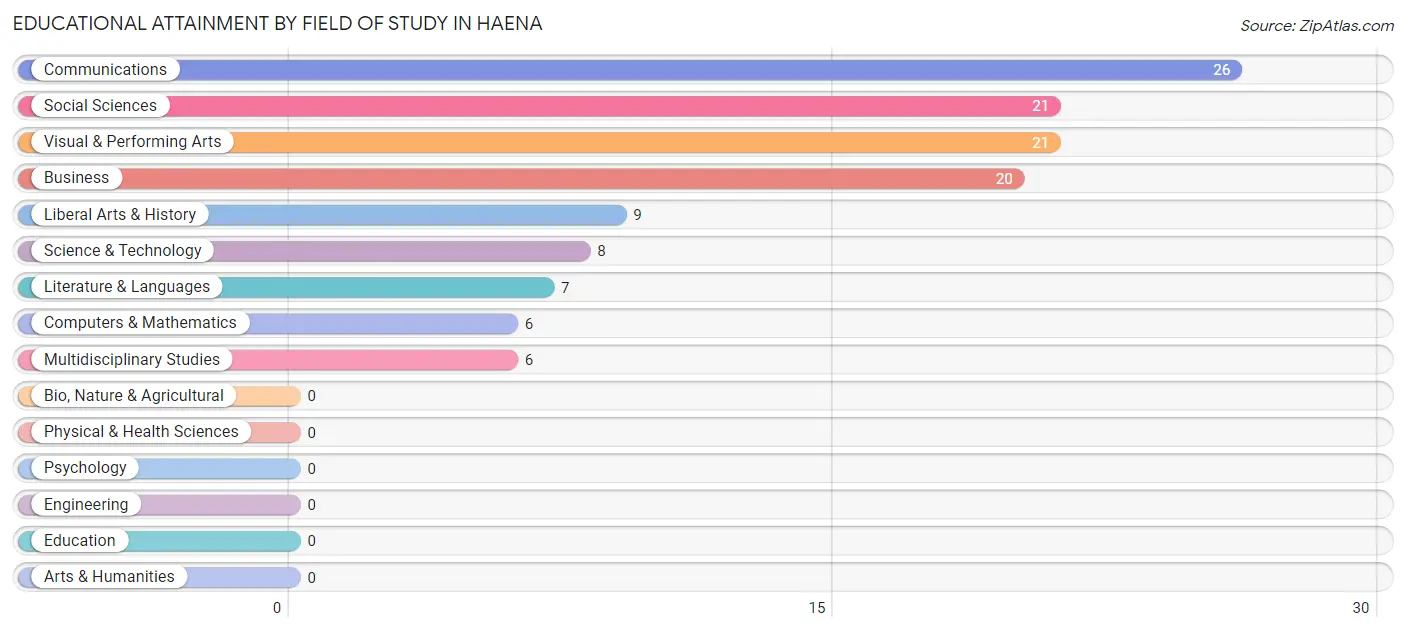
| Field of Study | # Graduates | % Graduates |
| Computers & Mathematics | 6 | 4.8% |
| Bio, Nature & Agricultural | 0 | 0.0% |
| Physical & Health Sciences | 0 | 0.0% |
| Psychology | 0 | 0.0% |
| Social Sciences | 21 | 16.9% |
| Engineering | 0 | 0.0% |
| Multidisciplinary Studies | 6 | 4.8% |
| Science & Technology | 8 | 6.5% |
| Business | 20 | 16.1% |
| Education | 0 | 0.0% |
| Literature & Languages | 7 | 5.7% |
| Liberal Arts & History | 9 | 7.3% |
| Visual & Performing Arts | 21 | 16.9% |
| Communications | 26 | 21.0% |
| Arts & Humanities | 0 | 0.0% |
| Total | 124 | 100.0% |
Transportation & Commute in Haena
Vehicle Availability by Sex in Haena
The most prevalent vehicle ownership categories in Haena are males with 2 vehicles (17, accounting for 38.6%) and females with 2 vehicles (41, making up 15.6%).
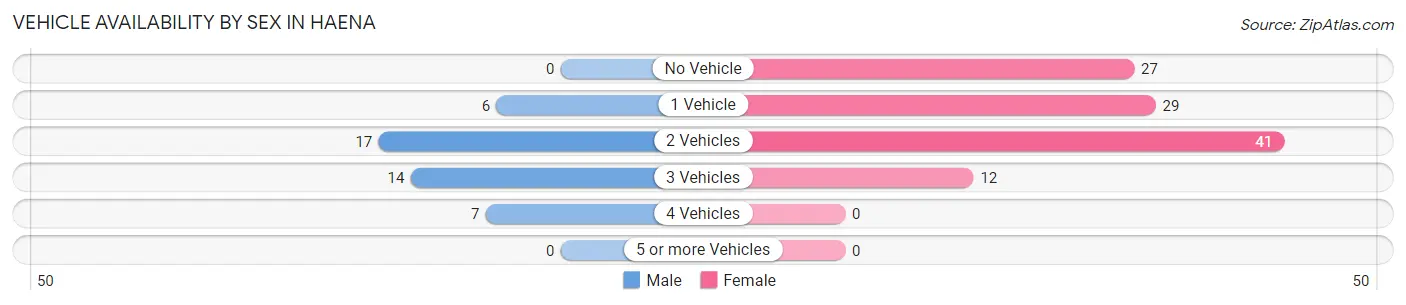
| Vehicles Available | Male | Female |
| No Vehicle | 0 (0.0%) | 27 (24.8%) |
| 1 Vehicle | 6 (13.6%) | 29 (26.6%) |
| 2 Vehicles | 17 (38.6%) | 41 (37.6%) |
| 3 Vehicles | 14 (31.8%) | 12 (11.0%) |
| 4 Vehicles | 7 (15.9%) | 0 (0.0%) |
| 5 or more Vehicles | 0 (0.0%) | 0 (0.0%) |
| Total | 44 (100.0%) | 109 (100.0%) |
Commute Time in Haena
The most frequently occuring commute durations in Haena are 5 to 9 minutes (33 commuters, 29.7%), 15 to 19 minutes (24 commuters, 21.6%), and 60 to 89 minutes (21 commuters, 18.9%).
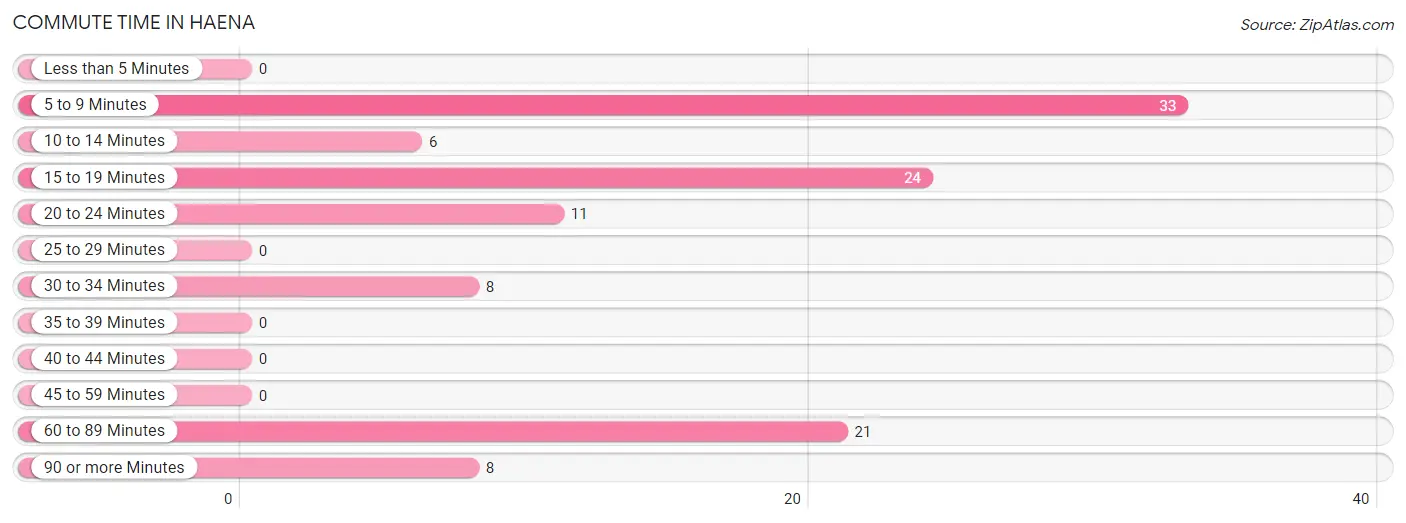
| Commute Time | # Commuters | % Commuters |
| Less than 5 Minutes | 0 | 0.0% |
| 5 to 9 Minutes | 33 | 29.7% |
| 10 to 14 Minutes | 6 | 5.4% |
| 15 to 19 Minutes | 24 | 21.6% |
| 20 to 24 Minutes | 11 | 9.9% |
| 25 to 29 Minutes | 0 | 0.0% |
| 30 to 34 Minutes | 8 | 7.2% |
| 35 to 39 Minutes | 0 | 0.0% |
| 40 to 44 Minutes | 0 | 0.0% |
| 45 to 59 Minutes | 0 | 0.0% |
| 60 to 89 Minutes | 21 | 18.9% |
| 90 or more Minutes | 8 | 7.2% |
Commute Time by Sex in Haena
The most common commute times in Haena are 15 to 19 minutes (20 commuters, 60.6%) for males and 5 to 9 minutes (27 commuters, 34.6%) for females.
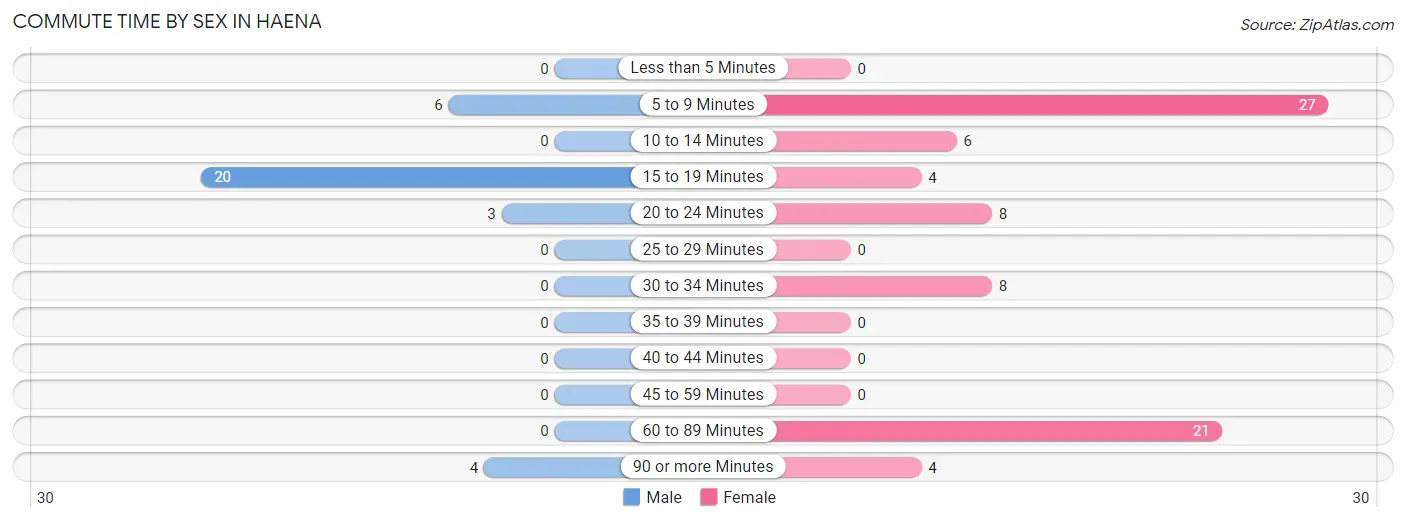
| Commute Time | Male | Female |
| Less than 5 Minutes | 0 (0.0%) | 0 (0.0%) |
| 5 to 9 Minutes | 6 (18.2%) | 27 (34.6%) |
| 10 to 14 Minutes | 0 (0.0%) | 6 (7.7%) |
| 15 to 19 Minutes | 20 (60.6%) | 4 (5.1%) |
| 20 to 24 Minutes | 3 (9.1%) | 8 (10.3%) |
| 25 to 29 Minutes | 0 (0.0%) | 0 (0.0%) |
| 30 to 34 Minutes | 0 (0.0%) | 8 (10.3%) |
| 35 to 39 Minutes | 0 (0.0%) | 0 (0.0%) |
| 40 to 44 Minutes | 0 (0.0%) | 0 (0.0%) |
| 45 to 59 Minutes | 0 (0.0%) | 0 (0.0%) |
| 60 to 89 Minutes | 0 (0.0%) | 21 (26.9%) |
| 90 or more Minutes | 4 (12.1%) | 4 (5.1%) |
Time of Departure to Work by Sex in Haena
The most frequent times of departure to work in Haena are 8:00 AM to 8:29 AM (20, 60.6%) for males and 6:30 AM to 6:59 AM (33, 42.3%) for females.
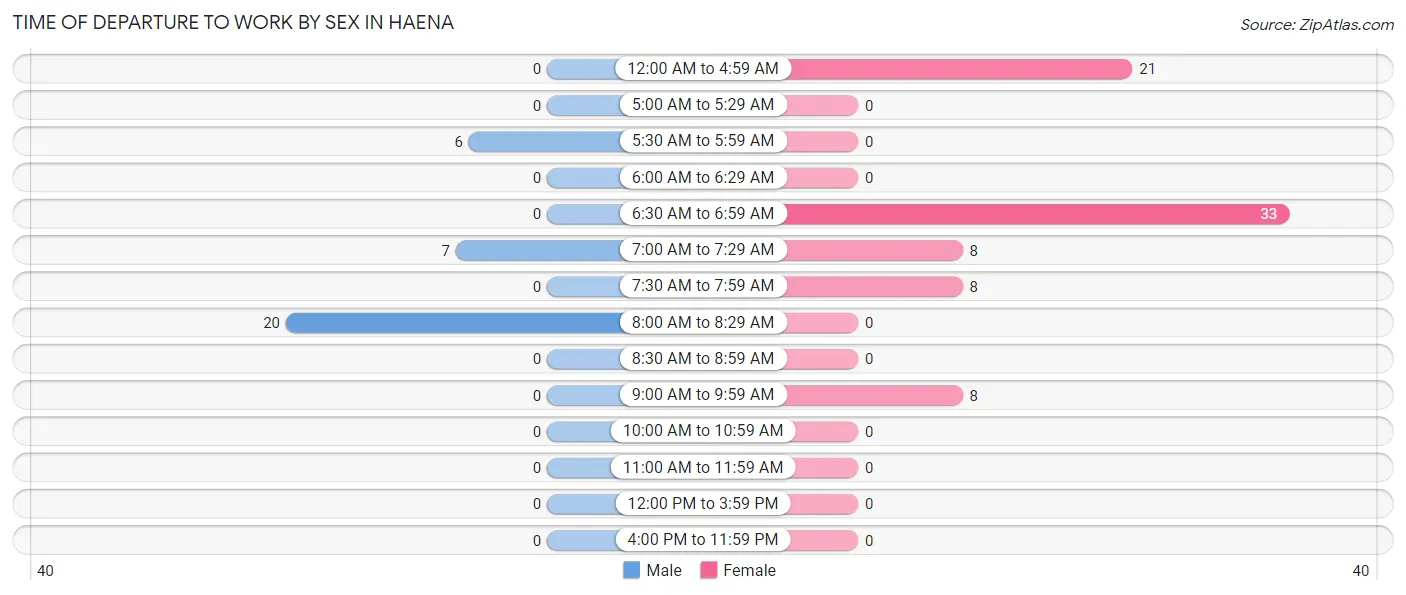
| Time of Departure | Male | Female |
| 12:00 AM to 4:59 AM | 0 (0.0%) | 21 (26.9%) |
| 5:00 AM to 5:29 AM | 0 (0.0%) | 0 (0.0%) |
| 5:30 AM to 5:59 AM | 6 (18.2%) | 0 (0.0%) |
| 6:00 AM to 6:29 AM | 0 (0.0%) | 0 (0.0%) |
| 6:30 AM to 6:59 AM | 0 (0.0%) | 33 (42.3%) |
| 7:00 AM to 7:29 AM | 7 (21.2%) | 8 (10.3%) |
| 7:30 AM to 7:59 AM | 0 (0.0%) | 8 (10.3%) |
| 8:00 AM to 8:29 AM | 20 (60.6%) | 0 (0.0%) |
| 8:30 AM to 8:59 AM | 0 (0.0%) | 0 (0.0%) |
| 9:00 AM to 9:59 AM | 0 (0.0%) | 8 (10.3%) |
| 10:00 AM to 10:59 AM | 0 (0.0%) | 0 (0.0%) |
| 11:00 AM to 11:59 AM | 0 (0.0%) | 0 (0.0%) |
| 12:00 PM to 3:59 PM | 0 (0.0%) | 0 (0.0%) |
| 4:00 PM to 11:59 PM | 0 (0.0%) | 0 (0.0%) |
| Total | 33 (100.0%) | 78 (100.0%) |
Housing Occupancy in Haena
Occupancy by Ownership in Haena
Of the total 165 dwellings in Haena, owner-occupied units account for 117 (70.9%), while renter-occupied units make up 48 (29.1%).
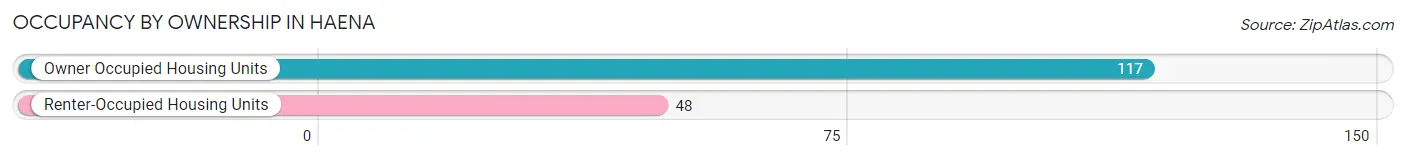
| Occupancy | # Housing Units | % Housing Units |
| Owner Occupied Housing Units | 117 | 70.9% |
| Renter-Occupied Housing Units | 48 | 29.1% |
| Total Occupied Housing Units | 165 | 100.0% |
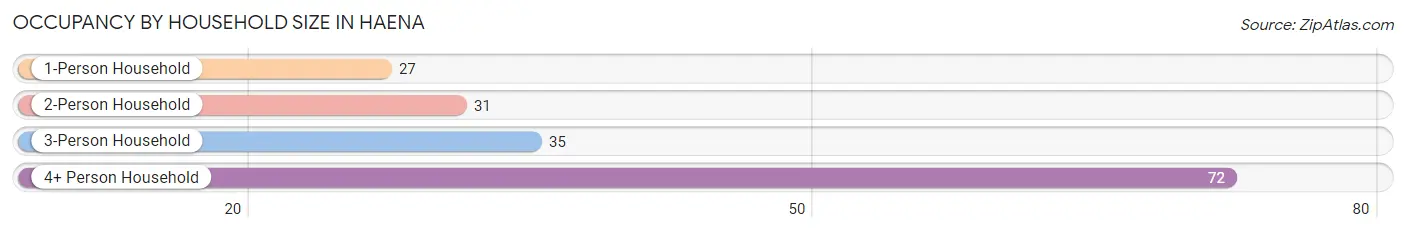
Occupancy by Household Size in Haena
| Household Size | # Housing Units | % Housing Units |
| 1-Person Household | 27 | 16.4% |
| 2-Person Household | 31 | 18.8% |
| 3-Person Household | 35 | 21.2% |
| 4+ Person Household | 72 | 43.6% |
| Total Housing Units | 165 | 100.0% |
Occupancy by Ownership by Household Size in Haena
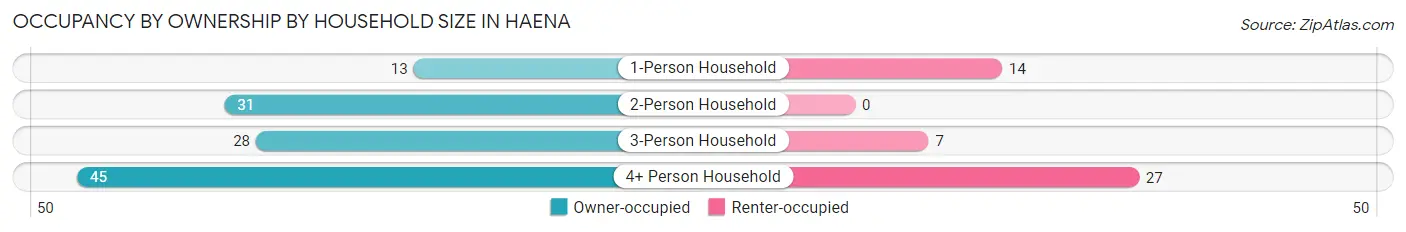
| Household Size | Owner-occupied | Renter-occupied |
| 1-Person Household | 13 (48.1%) | 14 (51.8%) |
| 2-Person Household | 31 (100.0%) | 0 (0.0%) |
| 3-Person Household | 28 (80.0%) | 7 (20.0%) |
| 4+ Person Household | 45 (62.5%) | 27 (37.5%) |
| Total Housing Units | 117 (70.9%) | 48 (29.1%) |
Occupancy by Educational Attainment in Haena
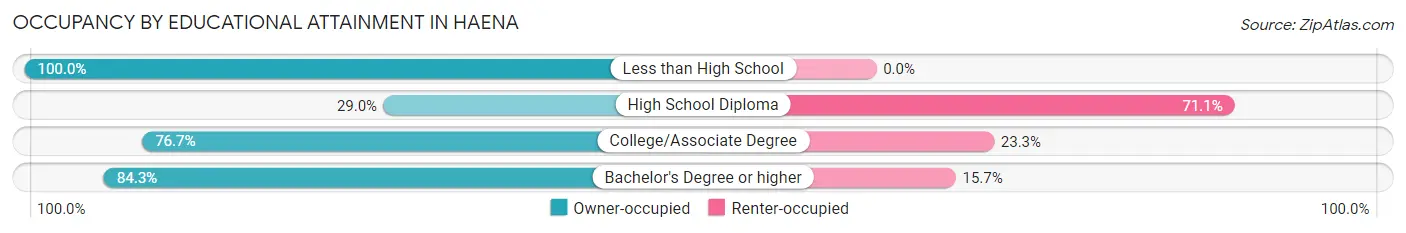
| Household Size | Owner-occupied | Renter-occupied |
| Less than High School | 8 (100.0%) | 0 (0.0%) |
| High School Diploma | 11 (28.9%) | 27 (71.1%) |
| College/Associate Degree | 23 (76.7%) | 7 (23.3%) |
| Bachelor's Degree or higher | 75 (84.3%) | 14 (15.7%) |
Occupancy by Age of Householder in Haena
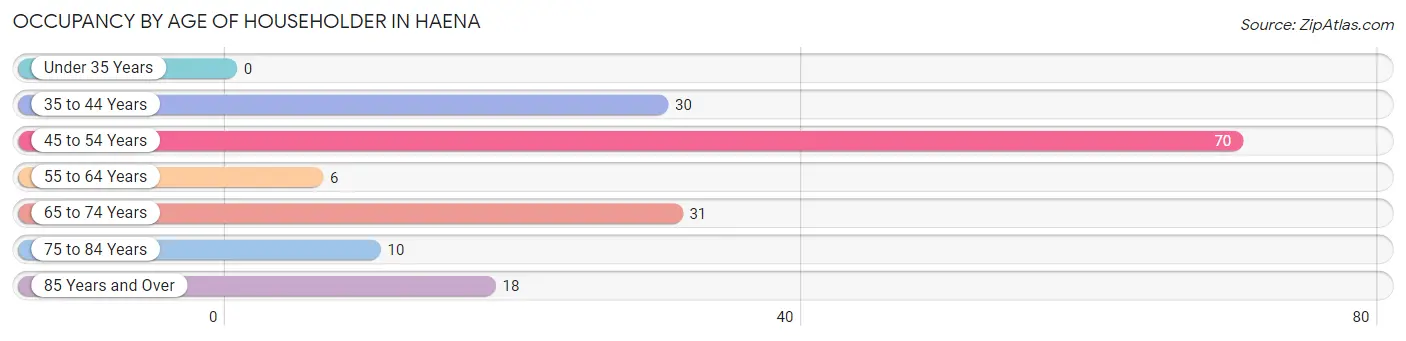
| Age Bracket | # Households | % Households |
| Under 35 Years | 0 | 0.0% |
| 35 to 44 Years | 30 | 18.2% |
| 45 to 54 Years | 70 | 42.4% |
| 55 to 64 Years | 6 | 3.6% |
| 65 to 74 Years | 31 | 18.8% |
| 75 to 84 Years | 10 | 6.1% |
| 85 Years and Over | 18 | 10.9% |
| Total | 165 | 100.0% |
Housing Finances in Haena
Median Income by Occupancy in Haena
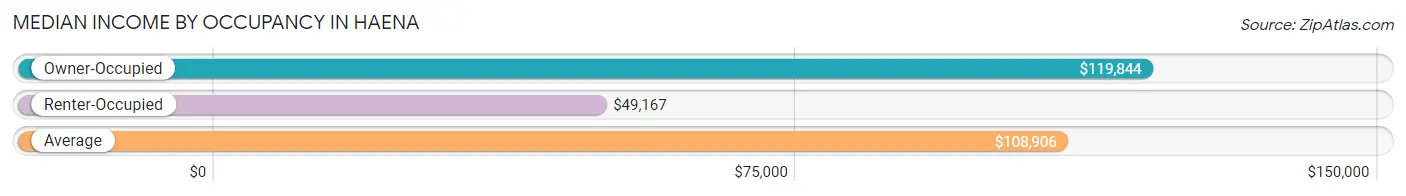
| Occupancy Type | # Households | Median Income |
| Owner-Occupied | 117 (70.9%) | $119,844 |
| Renter-Occupied | 48 (29.1%) | $49,167 |
| Average | 165 (100.0%) | $108,906 |
Occupancy by Householder Income Bracket in Haena
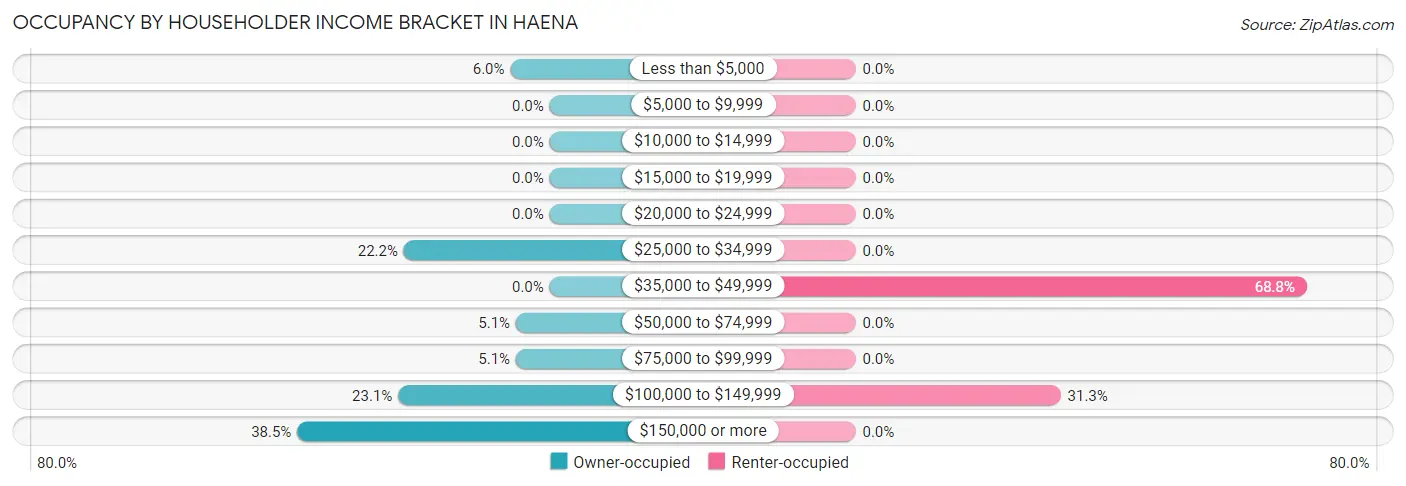
| Income Bracket | Owner-occupied | Renter-occupied |
| Less than $5,000 | 7 (6.0%) | 0 (0.0%) |
| $5,000 to $9,999 | 0 (0.0%) | 0 (0.0%) |
| $10,000 to $14,999 | 0 (0.0%) | 0 (0.0%) |
| $15,000 to $19,999 | 0 (0.0%) | 0 (0.0%) |
| $20,000 to $24,999 | 0 (0.0%) | 0 (0.0%) |
| $25,000 to $34,999 | 26 (22.2%) | 0 (0.0%) |
| $35,000 to $49,999 | 0 (0.0%) | 33 (68.8%) |
| $50,000 to $74,999 | 6 (5.1%) | 0 (0.0%) |
| $75,000 to $99,999 | 6 (5.1%) | 0 (0.0%) |
| $100,000 to $149,999 | 27 (23.1%) | 15 (31.2%) |
| $150,000 or more | 45 (38.5%) | 0 (0.0%) |
| Total | 117 (100.0%) | 48 (100.0%) |
Monthly Housing Cost Tiers in Haena
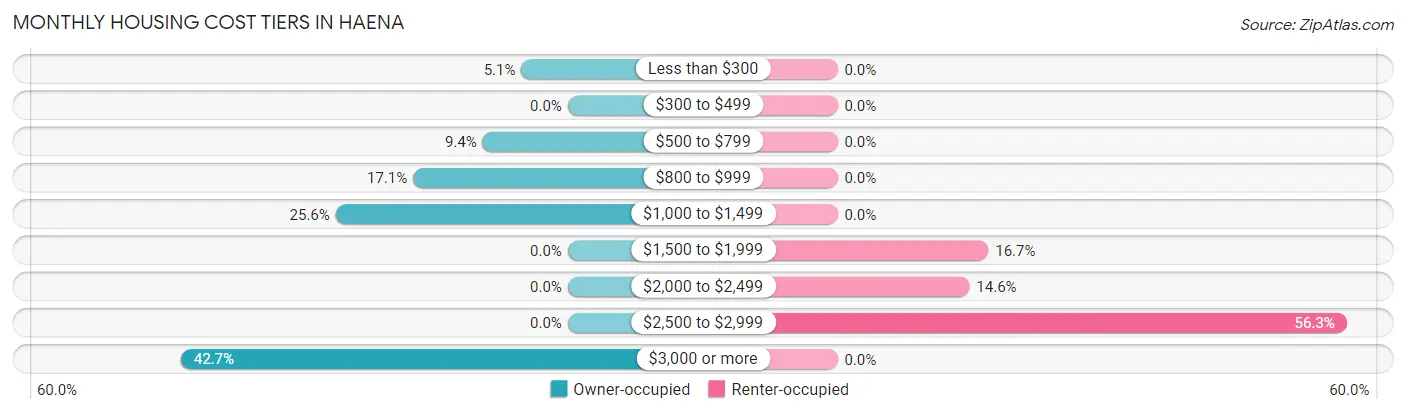
| Monthly Cost | Owner-occupied | Renter-occupied |
| Less than $300 | 6 (5.1%) | 0 (0.0%) |
| $300 to $499 | 0 (0.0%) | 0 (0.0%) |
| $500 to $799 | 11 (9.4%) | 0 (0.0%) |
| $800 to $999 | 20 (17.1%) | 0 (0.0%) |
| $1,000 to $1,499 | 30 (25.6%) | 0 (0.0%) |
| $1,500 to $1,999 | 0 (0.0%) | 8 (16.7%) |
| $2,000 to $2,499 | 0 (0.0%) | 7 (14.6%) |
| $2,500 to $2,999 | 0 (0.0%) | 27 (56.2%) |
| $3,000 or more | 50 (42.7%) | 0 (0.0%) |
| Total | 117 (100.0%) | 48 (100.0%) |
Physical Housing Characteristics in Haena
Housing Structures in Haena
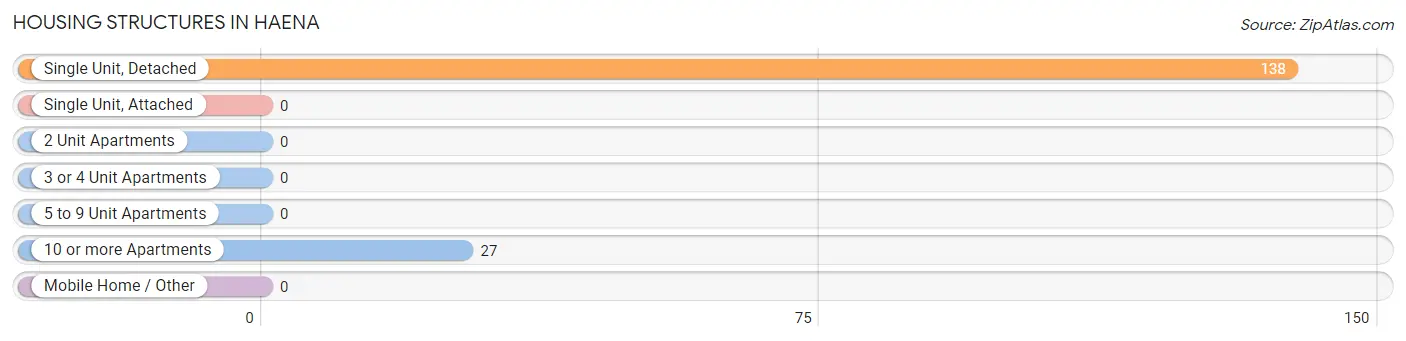
| Structure Type | # Housing Units | % Housing Units |
| Single Unit, Detached | 138 | 83.6% |
| Single Unit, Attached | 0 | 0.0% |
| 2 Unit Apartments | 0 | 0.0% |
| 3 or 4 Unit Apartments | 0 | 0.0% |
| 5 to 9 Unit Apartments | 0 | 0.0% |
| 10 or more Apartments | 27 | 16.4% |
| Mobile Home / Other | 0 | 0.0% |
| Total | 165 | 100.0% |
Housing Structures by Occupancy in Haena
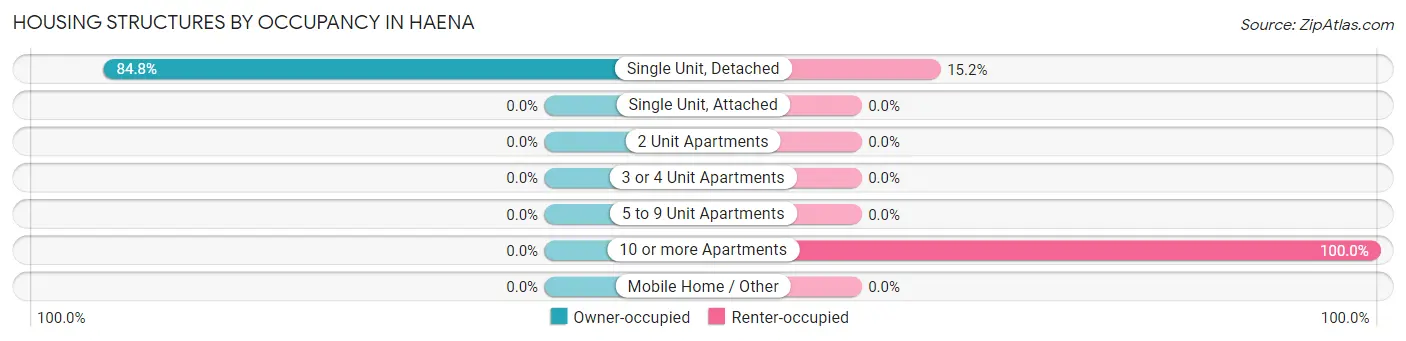
| Structure Type | Owner-occupied | Renter-occupied |
| Single Unit, Detached | 117 (84.8%) | 21 (15.2%) |
| Single Unit, Attached | 0 (0.0%) | 0 (0.0%) |
| 2 Unit Apartments | 0 (0.0%) | 0 (0.0%) |
| 3 or 4 Unit Apartments | 0 (0.0%) | 0 (0.0%) |
| 5 to 9 Unit Apartments | 0 (0.0%) | 0 (0.0%) |
| 10 or more Apartments | 0 (0.0%) | 27 (100.0%) |
| Mobile Home / Other | 0 (0.0%) | 0 (0.0%) |
| Total | 117 (70.9%) | 48 (29.1%) |
Housing Structures by Number of Rooms in Haena
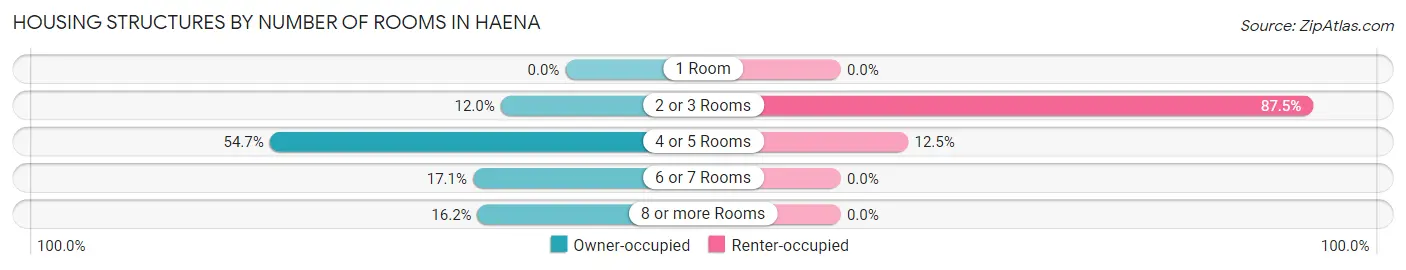
| Number of Rooms | Owner-occupied | Renter-occupied |
| 1 Room | 0 (0.0%) | 0 (0.0%) |
| 2 or 3 Rooms | 14 (12.0%) | 42 (87.5%) |
| 4 or 5 Rooms | 64 (54.7%) | 6 (12.5%) |
| 6 or 7 Rooms | 20 (17.1%) | 0 (0.0%) |
| 8 or more Rooms | 19 (16.2%) | 0 (0.0%) |
| Total | 117 (100.0%) | 48 (100.0%) |
Housing Structure by Heating Type in Haena
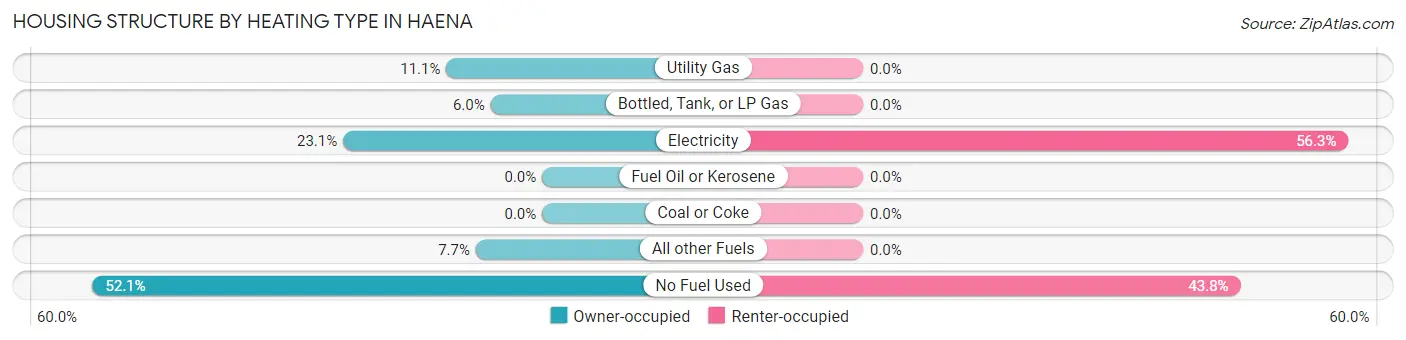
| Heating Type | Owner-occupied | Renter-occupied |
| Utility Gas | 13 (11.1%) | 0 (0.0%) |
| Bottled, Tank, or LP Gas | 7 (6.0%) | 0 (0.0%) |
| Electricity | 27 (23.1%) | 27 (56.2%) |
| Fuel Oil or Kerosene | 0 (0.0%) | 0 (0.0%) |
| Coal or Coke | 0 (0.0%) | 0 (0.0%) |
| All other Fuels | 9 (7.7%) | 0 (0.0%) |
| No Fuel Used | 61 (52.1%) | 21 (43.8%) |
| Total | 117 (100.0%) | 48 (100.0%) |
Household Vehicle Usage in Haena
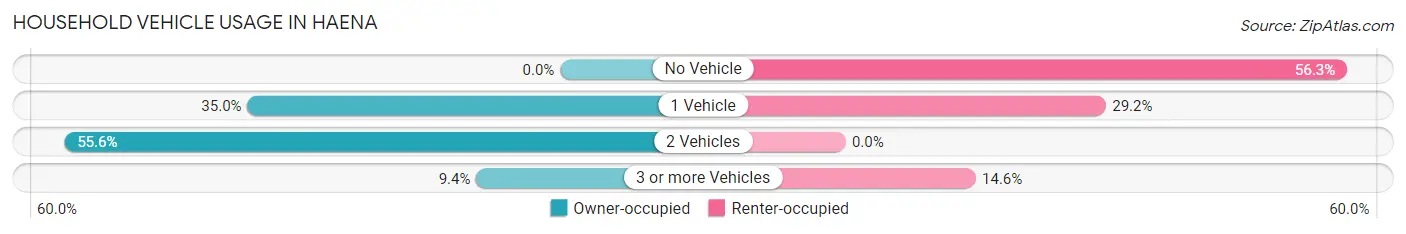
| Vehicles per Household | Owner-occupied | Renter-occupied |
| No Vehicle | 0 (0.0%) | 27 (56.2%) |
| 1 Vehicle | 41 (35.0%) | 14 (29.2%) |
| 2 Vehicles | 65 (55.6%) | 0 (0.0%) |
| 3 or more Vehicles | 11 (9.4%) | 7 (14.6%) |
| Total | 117 (100.0%) | 48 (100.0%) |
Real Estate & Mortgages in Haena
Real Estate and Mortgage Overview in Haena
| Characteristic | Without Mortgage | With Mortgage |
| Housing Units | 67 | 50 |
| Median Property Value | $1,146,400 | $1,625,000 |
| Median Household Income | - | - |
| Monthly Housing Costs | $975 | $50 |
| Real Estate Taxes | $3,833 | $0 |
Property Value by Mortgage Status in Haena
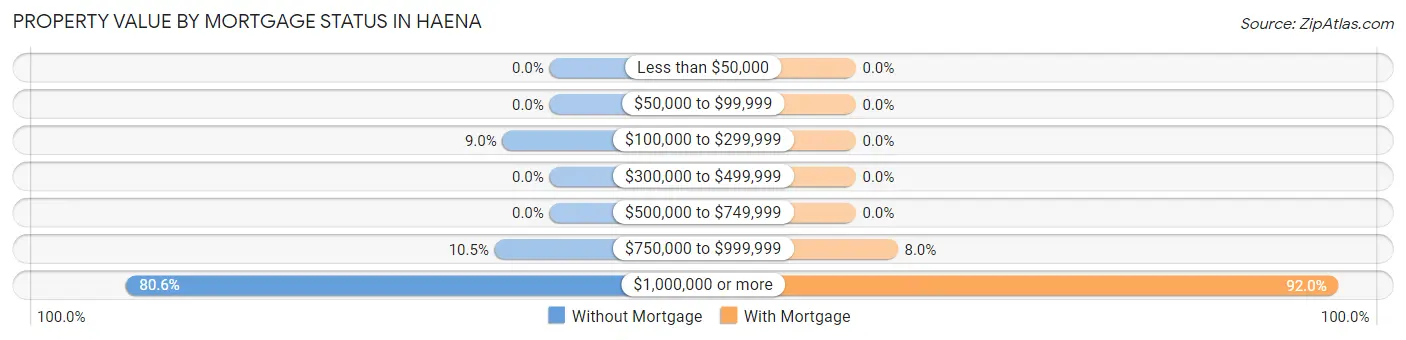
| Property Value | Without Mortgage | With Mortgage |
| Less than $50,000 | 0 (0.0%) | 0 (0.0%) |
| $50,000 to $99,999 | 0 (0.0%) | 0 (0.0%) |
| $100,000 to $299,999 | 6 (9.0%) | 0 (0.0%) |
| $300,000 to $499,999 | 0 (0.0%) | 0 (0.0%) |
| $500,000 to $749,999 | 0 (0.0%) | 0 (0.0%) |
| $750,000 to $999,999 | 7 (10.4%) | 4 (8.0%) |
| $1,000,000 or more | 54 (80.6%) | 46 (92.0%) |
| Total | 67 (100.0%) | 50 (100.0%) |
Household Income by Mortgage Status in Haena
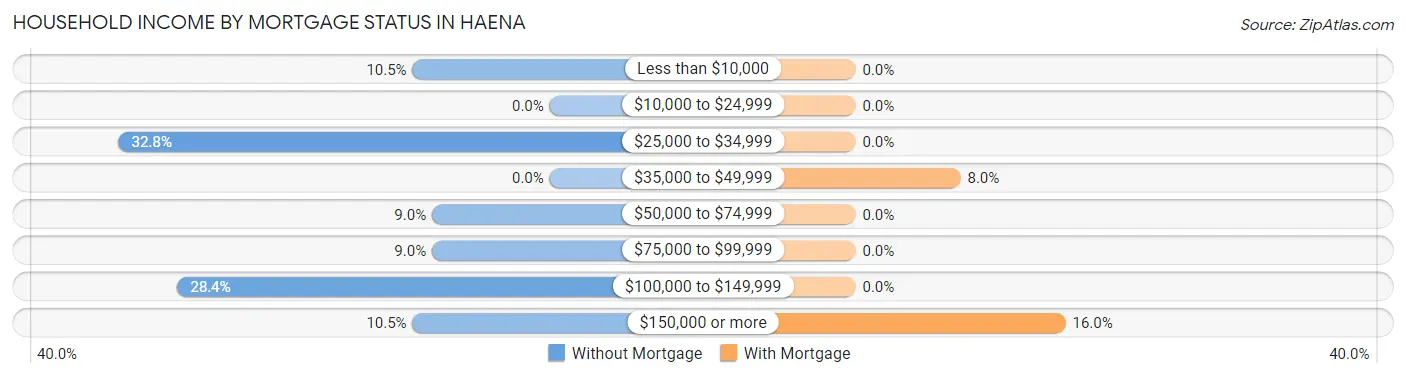
| Household Income | Without Mortgage | With Mortgage |
| Less than $10,000 | 7 (10.4%) | 0 (0.0%) |
| $10,000 to $24,999 | 0 (0.0%) | 0 (0.0%) |
| $25,000 to $34,999 | 22 (32.8%) | 0 (0.0%) |
| $35,000 to $49,999 | 0 (0.0%) | 4 (8.0%) |
| $50,000 to $74,999 | 6 (9.0%) | 0 (0.0%) |
| $75,000 to $99,999 | 6 (9.0%) | 0 (0.0%) |
| $100,000 to $149,999 | 19 (28.4%) | 0 (0.0%) |
| $150,000 or more | 7 (10.4%) | 8 (16.0%) |
| Total | 67 (100.0%) | 50 (100.0%) |
Property Value to Household Income Ratio in Haena
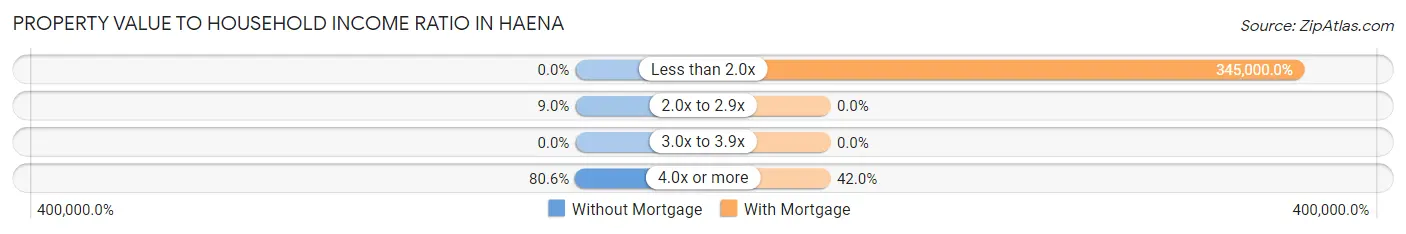
| Value-to-Income Ratio | Without Mortgage | With Mortgage |
| Less than 2.0x | 0 (0.0%) | 172,500 (345,000.0%) |
| 2.0x to 2.9x | 6 (9.0%) | 0 (0.0%) |
| 3.0x to 3.9x | 0 (0.0%) | 0 (0.0%) |
| 4.0x or more | 54 (80.6%) | 21 (42.0%) |
| Total | 67 (100.0%) | 50 (100.0%) |
Real Estate Taxes by Mortgage Status in Haena
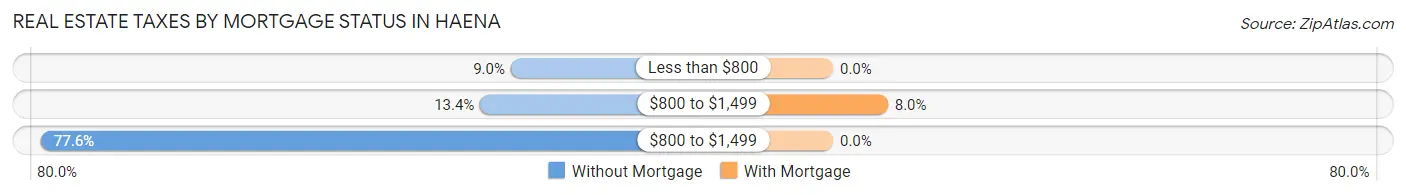
| Property Taxes | Without Mortgage | With Mortgage |
| Less than $800 | 6 (9.0%) | 0 (0.0%) |
| $800 to $1,499 | 9 (13.4%) | 4 (8.0%) |
| $800 to $1,499 | 52 (77.6%) | 0 (0.0%) |
| Total | 67 (100.0%) | 50 (100.0%) |
Health & Disability in Haena
Health Insurance Coverage by Age in Haena
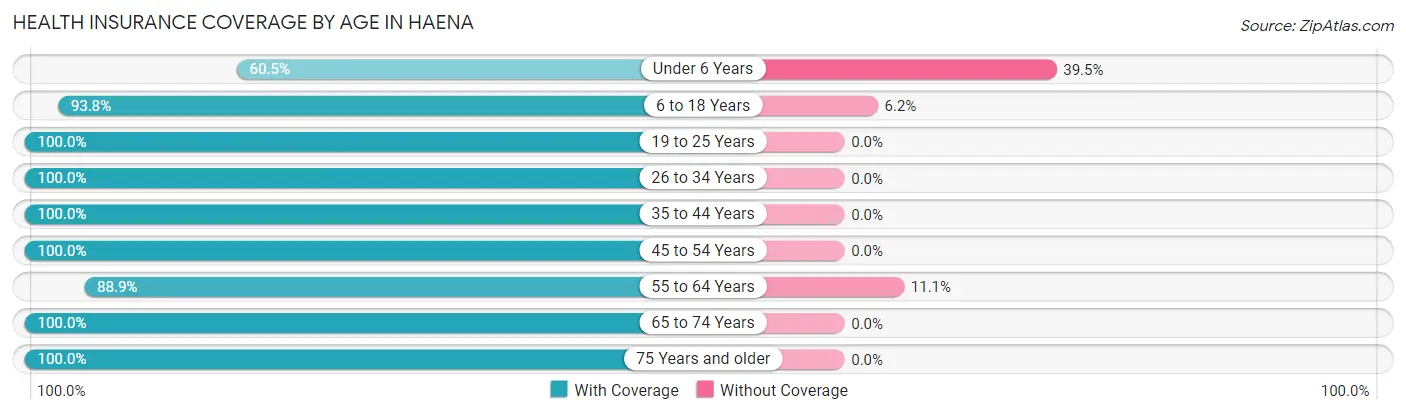
| Age Bracket | With Coverage | Without Coverage |
| Under 6 Years | 26 (60.5%) | 17 (39.5%) |
| 6 to 18 Years | 136 (93.8%) | 9 (6.2%) |
| 19 to 25 Years | 3 (100.0%) | 0 (0.0%) |
| 26 to 34 Years | 12 (100.0%) | 0 (0.0%) |
| 35 to 44 Years | 65 (100.0%) | 0 (0.0%) |
| 45 to 54 Years | 89 (100.0%) | 0 (0.0%) |
| 55 to 64 Years | 32 (88.9%) | 4 (11.1%) |
| 65 to 74 Years | 65 (100.0%) | 0 (0.0%) |
| 75 Years and older | 43 (100.0%) | 0 (0.0%) |
| Total | 471 (94.0%) | 30 (6.0%) |
Health Insurance Coverage by Citizenship Status in Haena
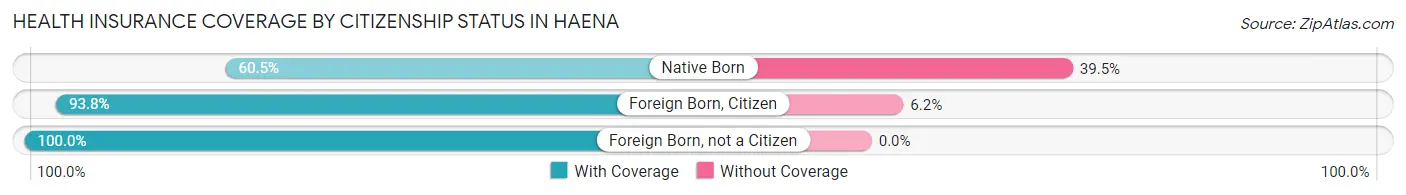
| Citizenship Status | With Coverage | Without Coverage |
| Native Born | 26 (60.5%) | 17 (39.5%) |
| Foreign Born, Citizen | 136 (93.8%) | 9 (6.2%) |
| Foreign Born, not a Citizen | 3 (100.0%) | 0 (0.0%) |
Health Insurance Coverage by Household Income in Haena
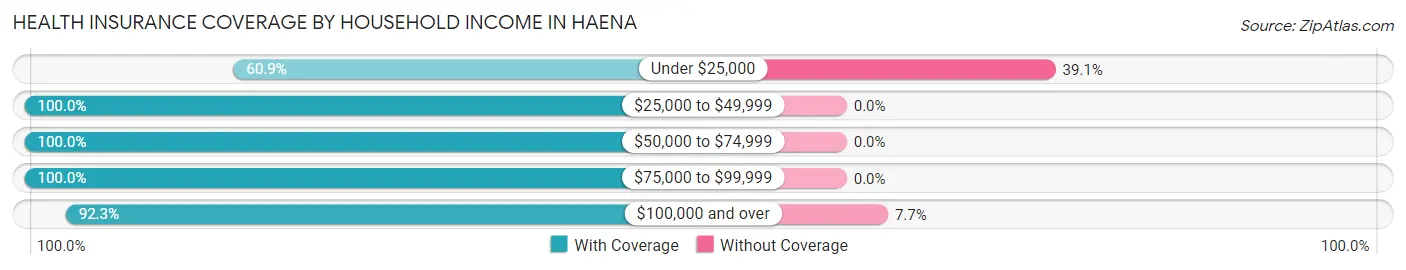
| Household Income | With Coverage | Without Coverage |
| Under $25,000 | 14 (60.9%) | 9 (39.1%) |
| $25,000 to $49,999 | 183 (100.0%) | 0 (0.0%) |
| $50,000 to $74,999 | 11 (100.0%) | 0 (0.0%) |
| $75,000 to $99,999 | 12 (100.0%) | 0 (0.0%) |
| $100,000 and over | 251 (92.3%) | 21 (7.7%) |
Public vs Private Health Insurance Coverage by Age in Haena
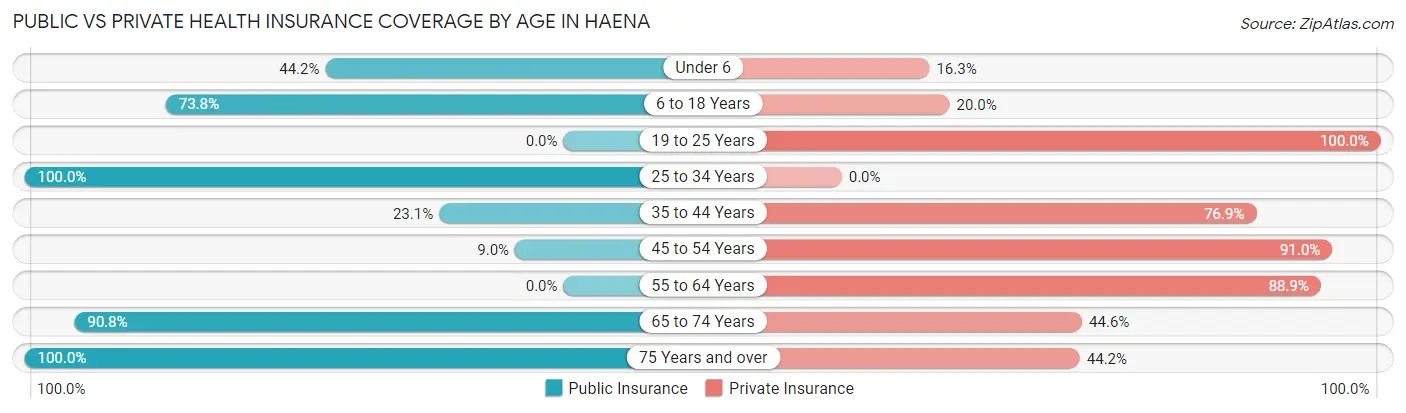
| Age Bracket | Public Insurance | Private Insurance |
| Under 6 | 19 (44.2%) | 7 (16.3%) |
| 6 to 18 Years | 107 (73.8%) | 29 (20.0%) |
| 19 to 25 Years | 0 (0.0%) | 3 (100.0%) |
| 25 to 34 Years | 12 (100.0%) | 0 (0.0%) |
| 35 to 44 Years | 15 (23.1%) | 50 (76.9%) |
| 45 to 54 Years | 8 (9.0%) | 81 (91.0%) |
| 55 to 64 Years | 0 (0.0%) | 32 (88.9%) |
| 65 to 74 Years | 59 (90.8%) | 29 (44.6%) |
| 75 Years and over | 43 (100.0%) | 19 (44.2%) |
| Total | 263 (52.5%) | 250 (49.9%) |
Disability Status by Sex by Age in Haena
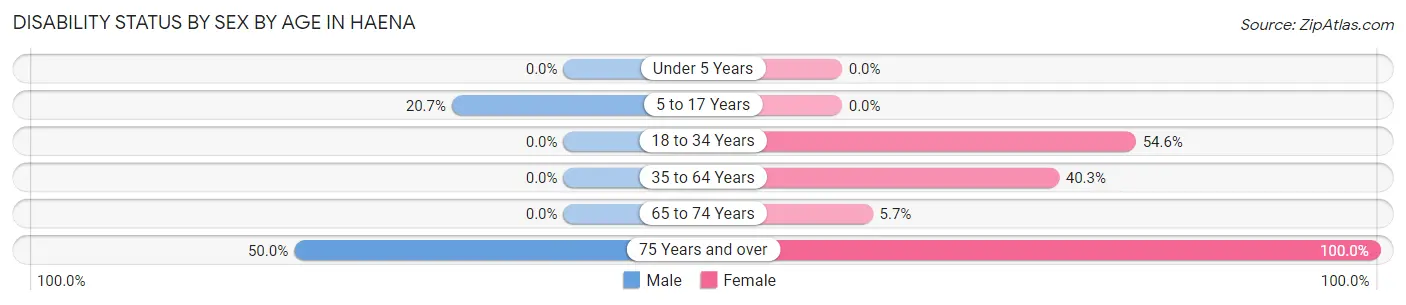
| Age Bracket | Male | Female |
| Under 5 Years | 0 (0.0%) | 0 (0.0%) |
| 5 to 17 Years | 29 (20.7%) | 0 (0.0%) |
| 18 to 34 Years | 0 (0.0%) | 12 (54.5%) |
| 35 to 64 Years | 0 (0.0%) | 58 (40.3%) |
| 65 to 74 Years | 0 (0.0%) | 2 (5.7%) |
| 75 Years and over | 6 (50.0%) | 31 (100.0%) |
Disability Class by Sex by Age in Haena
Disability Class: Hearing Difficulty
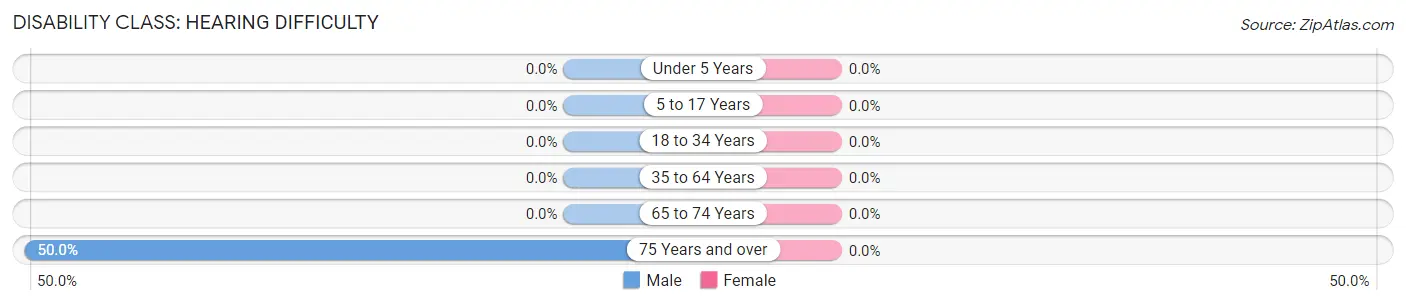
| Age Bracket | Male | Female |
| Under 5 Years | 0 (0.0%) | 0 (0.0%) |
| 5 to 17 Years | 0 (0.0%) | 0 (0.0%) |
| 18 to 34 Years | 0 (0.0%) | 0 (0.0%) |
| 35 to 64 Years | 0 (0.0%) | 0 (0.0%) |
| 65 to 74 Years | 0 (0.0%) | 0 (0.0%) |
| 75 Years and over | 6 (50.0%) | 0 (0.0%) |
Disability Class: Vision Difficulty
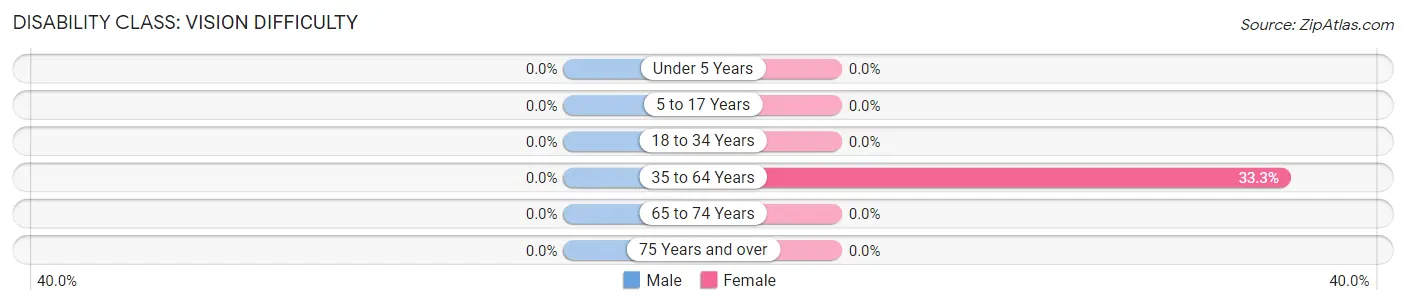
| Age Bracket | Male | Female |
| Under 5 Years | 0 (0.0%) | 0 (0.0%) |
| 5 to 17 Years | 0 (0.0%) | 0 (0.0%) |
| 18 to 34 Years | 0 (0.0%) | 0 (0.0%) |
| 35 to 64 Years | 0 (0.0%) | 48 (33.3%) |
| 65 to 74 Years | 0 (0.0%) | 0 (0.0%) |
| 75 Years and over | 0 (0.0%) | 0 (0.0%) |
Disability Class: Cognitive Difficulty
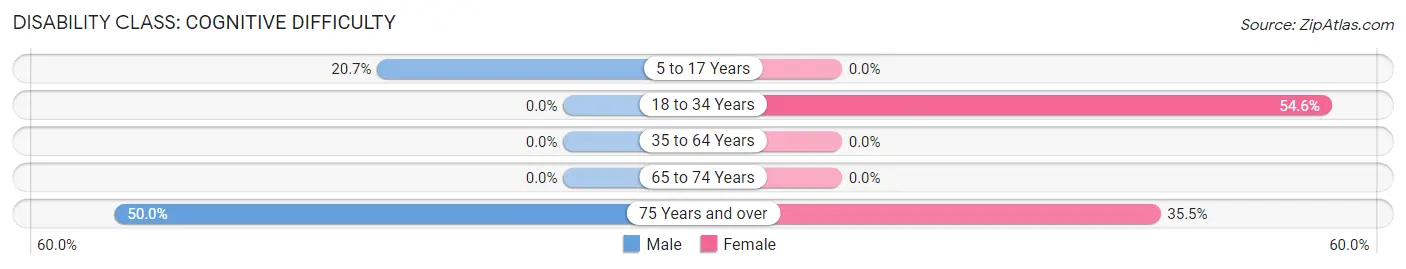
| Age Bracket | Male | Female |
| 5 to 17 Years | 29 (20.7%) | 0 (0.0%) |
| 18 to 34 Years | 0 (0.0%) | 12 (54.5%) |
| 35 to 64 Years | 0 (0.0%) | 0 (0.0%) |
| 65 to 74 Years | 0 (0.0%) | 0 (0.0%) |
| 75 Years and over | 6 (50.0%) | 11 (35.5%) |
Disability Class: Ambulatory Difficulty
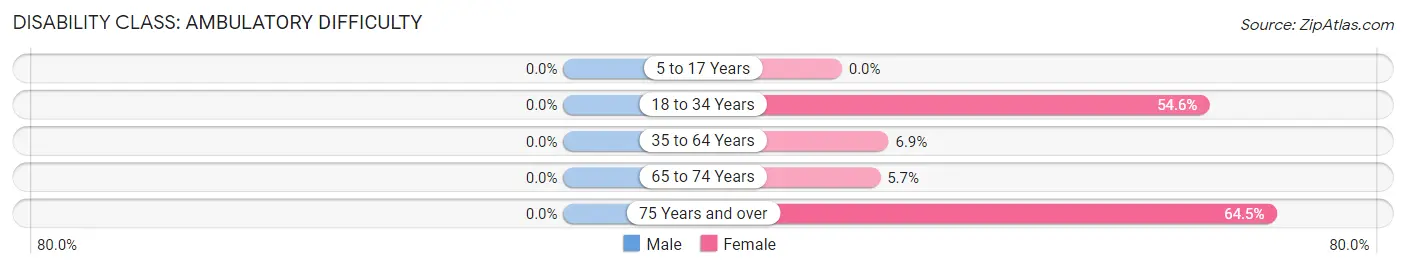
| Age Bracket | Male | Female |
| 5 to 17 Years | 0 (0.0%) | 0 (0.0%) |
| 18 to 34 Years | 0 (0.0%) | 12 (54.5%) |
| 35 to 64 Years | 0 (0.0%) | 10 (6.9%) |
| 65 to 74 Years | 0 (0.0%) | 2 (5.7%) |
| 75 Years and over | 0 (0.0%) | 20 (64.5%) |
Disability Class: Self-Care Difficulty
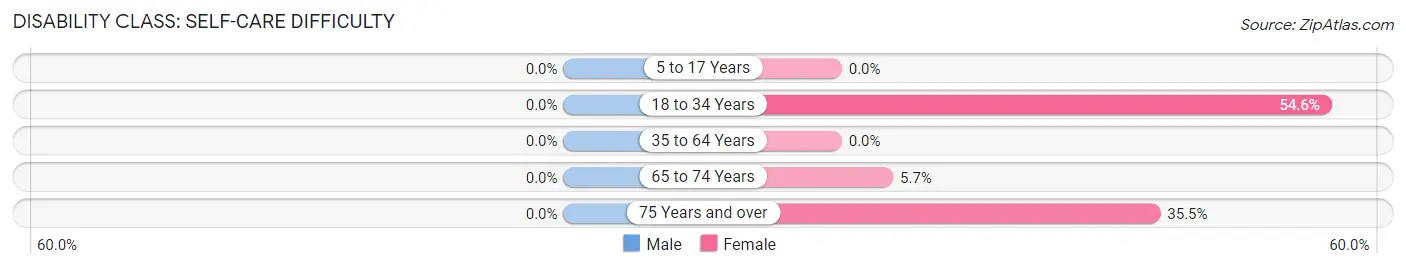
| Age Bracket | Male | Female |
| 5 to 17 Years | 0 (0.0%) | 0 (0.0%) |
| 18 to 34 Years | 0 (0.0%) | 12 (54.5%) |
| 35 to 64 Years | 0 (0.0%) | 0 (0.0%) |
| 65 to 74 Years | 0 (0.0%) | 2 (5.7%) |
| 75 Years and over | 0 (0.0%) | 11 (35.5%) |
Technology Access in Haena
Computing Device Access in Haena
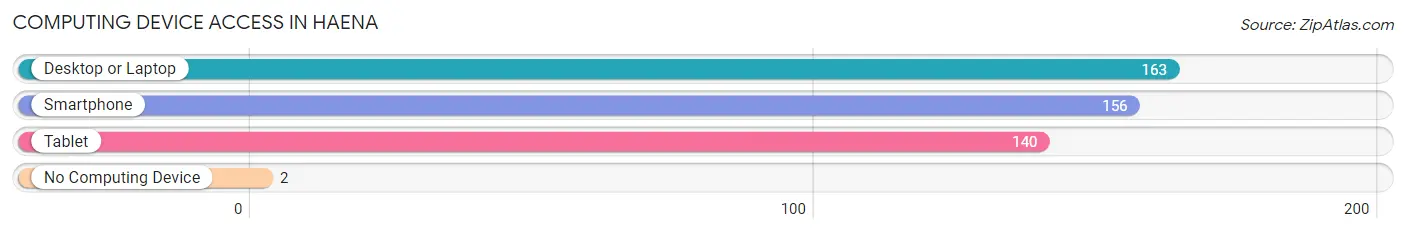
| Device Type | # Households | % Households |
| Desktop or Laptop | 163 | 98.8% |
| Smartphone | 156 | 94.6% |
| Tablet | 140 | 84.9% |
| No Computing Device | 2 | 1.2% |
| Total | 165 | 100.0% |
Internet Access in Haena
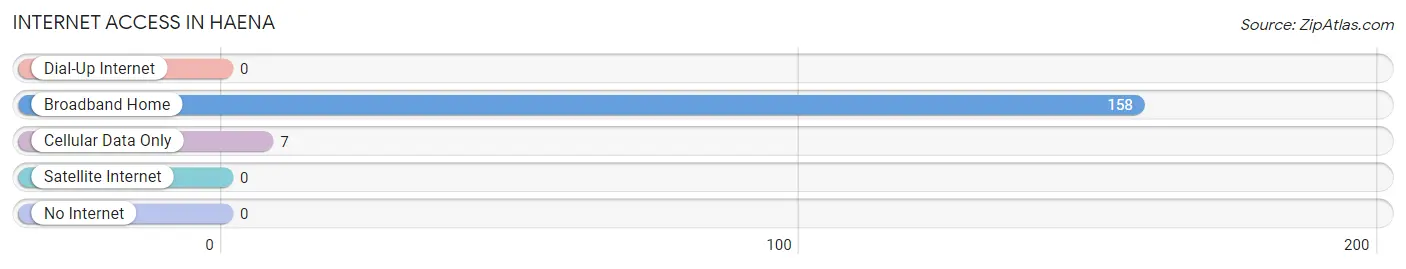
| Internet Type | # Households | % Households |
| Dial-Up Internet | 0 | 0.0% |
| Broadband Home | 158 | 95.8% |
| Cellular Data Only | 7 | 4.2% |
| Satellite Internet | 0 | 0.0% |
| No Internet | 0 | 0.0% |
| Total | 165 | 100.0% |
Haena Summary
Haena is a small unincorporated community located on the north shore of Kauai, Hawaii. It is located on the east side of the island, just north of the town of Hanalei. The population of Haena is estimated to be around 500 people.
Geography
Haena is located on the north shore of Kauai, Hawaii. It is situated on the east side of the island, just north of the town of Hanalei. The area is known for its beautiful beaches, lush tropical forests, and stunning mountain views. The area is also home to the Na Pali Coast State Park, which is a popular destination for hikers and nature lovers. The area is also known for its strong surf, which makes it a popular spot for surfing and other water sports.
Economy
The economy of Haena is largely based on tourism. The area is home to several resorts and hotels, as well as a variety of restaurants and shops. The area is also home to several tour companies, which offer a variety of activities such as kayaking, snorkeling, and hiking. The area is also home to several art galleries, which feature local artwork.
Demographics
The population of Haena is estimated to be around 500 people. The majority of the population is of Native Hawaiian descent. The median age of the population is around 40 years old. The median household income is around $50,000.
The area is home to several churches, including the Church of Jesus Christ of Latter-day Saints, the Catholic Church, and the United Church of Christ. The area is also home to several schools, including the Haena Elementary School and the Haena High School.
Conclusion
Haena is a small unincorporated community located on the north shore of Kauai, Hawaii. It is known for its beautiful beaches, lush tropical forests, and stunning mountain views. The area is also home to several resorts and hotels, as well as a variety of restaurants and shops. The population of Haena is estimated to be around 500 people, with the majority of the population being of Native Hawaiian descent. The area is home to several churches, schools, and art galleries, and is a popular destination for tourists and nature lovers alike.
Common Questions
What is Per Capita Income in Haena?
Per Capita income in Haena is $40,440.
What is the Median Household income in Haena?
Median Household Income in Haena is $108,906.
What is Income or Wage Gap in Haena?
Income or Wage Gap in Haena is 58.9%.
Women in Haena earn 41.1 cents for every dollar earned by a man.
What is Inequality or Gini Index in Haena?
Inequality or Gini Index in Haena is 0.42.
What is the Total Population of Haena?
Total Population of Haena is 501.
What is the Total Male Population of Haena?
Total Male Population of Haena is 255.
What is the Total Female Population of Haena?
Total Female Population of Haena is 246.
What is the Ratio of Males per 100 Females in Haena?
There are 103.66 Males per 100 Females in Haena.
What is the Ratio of Females per 100 Males in Haena?
There are 96.47 Females per 100 Males in Haena.
What is the Median Population Age in Haena?
Median Population Age in Haena is 42.1 Years.
What is the Average Family Size in Haena
Average Family Size in Haena is 3.2 People.
What is the Average Household Size in Haena
Average Household Size in Haena is 3.0 People.
How Large is the Labor Force in Haena?
There are 176 People in the Labor Forcein in Haena.
What is the Percentage of People in the Labor Force in Haena?
52.2% of People are in the Labor Force in Haena.
What is the Unemployment Rate in Haena?
Unemployment Rate in Haena is 6.3%.